the dimensions of institutional trust
TRANSCRIPT

The Dimensions of Institutional Trust:How Distinct is Public Confidence in the Media?
Timothy E. Cook, Williams CollegePaul Gronke, Reed College
April, 2001
Paper prepared for delivery at the annual meeting of the Midwest Political ScienceAssociation, Chicago, April 2001. Earlier versions of this work were presented at the 2000annual meetings of the International Society for Political Psychology and the AmericanPolitical Science Association. We would like to thank John Rattliff for research support, andthe faculty and students of Louisiana State University, Reed College, University ofWisconsin-Madison, and Williams College for comments on earlier portions of this work.This work was supported in part by the Arts and Sciences Research Council of DukeUniversity and the Elizabeth H. Ducey Fund of Reed College. This paper is available inelectronic form at http://www.reed.edu/~gronkep/papers.html.

All rights reserved.

COOK/GRONKE, THE DIMENSIONS OF INSTITUTIONAL TRUST
The Dimensions of Institutional Trust: How Distinct Is PublicConfidence in the Media?
Timothy E. Cook, Williams CollegePaul Gronke, Reed College
Introduction
One of the most dramatic shifts in public opinion over the past four decades hasbeen the decline in popular confidence in political institutions. In particular, many politicalscientists have charted the extraordinary collapse of “trust in government” from the 1950sand early 1960s to today. Starting with the classic debates of Miller and Citrin (Miller 1974;Citrin 1974), scholarship since the mid 1970s has illustrated the general decline in trust ingovernment (e.g. Lipset and Schneider 1987; Craig 1996; Miller and Borelli 1991). Someefforts have been made to understanding the causes of the decline at the aggregate (Chanleyet al. 2000) and individual levels (Mansbridge 1997, Pew Center 1998). More commonly,trust in government is used as an independent variable in other analyses, most popularly, inanalyses of civic trust and social capital. It has become commonplace in the study ofAmerican politics to bemoan the decline in social capital (Putnam 1995a; 1995b; Brehm andRahn 1997). Declines in social trust have been accompanied by a long decline in faith andconfidence in governmental institutions (Hibbing and Theiss-Morse 1995). Fewer Americansjoin the institutions that bind society together and express low levels of trust in the publicinstitutions and procedures that are thought to be essential for a healthy democracy.Declining levels of participation in democratic political activities have been caused in part bydeclines in political efficacy (a sense that an individual can make a difference in politics),trust in others (fostered by social involvement), and trust in government.
The decline in political trust is seemingly undeniable. What it means and why ithappens is somewhat less clear. In particular, the rapidly growing interest in faith, trust, andconfidence in government raises the question whether recent declines in civic engagement,confidence in institutions, and requisite accumulations of social capital constitute a crisis inAmerican democracy. We hope to challenge, or at least modify, this developingconventional wisdom.
Most important for our point is that the literature, with a few notable exceptions(Lipset and Schneider 1987; Hibbing and Theiss-Morse 1995), largely relies on attitudestowards undifferentiated constructs (“government,” “democracy”) or fails to discriminateamong different institutions other than comparing levels or grouping “public” and “private”institutions separately. We find this to be a surprising oversight, given political science’shistorical attention to the different institutions in American political and social life, whetherof the “old” or “neo” variety. Yet while the trend lines of evaluations of political institutionsare consistently downward in the United States, and indeed in most western democracies(e.g., see the essays in the collections by Nye, Zelikow and King, 1997; Norris, 1999a; Pharrand Putnam, 2000), there is considerable variation: from one institution to the next, in theabsolute levels accorded, the trajectories of confidence over time, and the factors that

Cook/Gronke, Dimensions of Institutional Trust 2
encourage citizens to express more or less confidence in each institution.
The overall trend-line has received the bulk of attention. Yet we simply cannotunderstand the questions raised by the students of “critical citizens” or “disaffecteddemocracies” unless we figure out the extent to which some institutions have beenexempted or at least cushioned from the overall decline. For instance, in the United States,the military has lost little confidence in comparison to the strong decline in confidence in theexecutive branch, Congress, or the press. Whether this support of the military reflectssimply “easy issues” where the most socially desirable answer is easily given, or a deeper andmore discriminating understanding of particular institutions for different reasons, has yet tobe determined (Gronke 1999; Gronke and Feaver 2001).1 Furthermore, it is clear thatconfidence in the leaders of the press has gone consistently down in the General SocialSurvey from 1973 to 1998, with several statistically significant drops and no statisticallysignificant increases between survey years (Cook, Gronke and Rattliff 2000). Yet, as wenoted in previous work, the meaning of this decline is not altogether clear. It could reflectchanges specific to the news media, such as the rise of television, the shift to a differentform of journalism (more negative, more interpretive, less political), or political attacks onthe news. It could also reflect a more generalized decline in confidence that would fit thedownward trajectory of trust in government. At the very least, to chart the decline inconfidence in a single institution requires us to ask “compared to what?”
This question leads to a subsidiary concern, one which forms the centerpiece of thispaper. We are primarily interested here in gauging and explaining the precipitous decline inpublic confidence in the press. But to do so, we need to extricate the contribution made bythe hypothesized decline in public confidence in all institutions from the particularconsiderations that citizens might have of the news media. Yet “compared to what” is adeceptively simple question with a difficult answer, because we simply have little informationabout the dimensionality of confidence in institutions. One cannot explore changes inconfidence in any one institution in isolation. But given that we do not know, as some havesuggested, whether we can find an overall tendency for individuals to be more or lessconfident in all institutions, or whether individuals distinguish between groups of institutions(e.g., institutions of order and opposition; private and public institutions), there is no way asof yet to do so in the absence of new work, which is what we report here.
Consequently, we address these questions in the following order:
a) Are there single or multiple dimensions of confidence in institutions? Howconsistent are those dimensions over time?
b) To what extent is confidence in the press an integral part of moreencompassing dimensions of confidence in institutions, or does it standmore apart?
c) Once we have identified the underlying dimensionality of confidence ininstitutions, can we explain changes over time in the public's attitudesto the media?
1 For instance, Gronke (2001) suggests that the confidence in the military is "brittle." Mass civilian and elite civiliantrust in military leadership, endorsement of military symbols and values, and respect for the sacrifices of militarypersonnel are far lower than the apparent high level of confidence shows.

Cook/Gronke, Dimensions of Institutional Trust 3
Charting the Decline
The data we use here is from the General Social Survey (GSS) of the NationalOpinion Research Center at the University of Chicago. From 1973 to 1998 inclusive,2 theGSS has asked a series of questions, following the instructions:
“I am going to name some institutions in this country. As far as the peoplerunning these institutions are concerned, would you say you have a great dealof confidence, only some confidence, or hardly any confidence at all inthem?”
The institutions listed for all of the years studied were: major companies; organized religion;education; executive branch of the federal government; organized labor; press; medicine;TV; U.S. Supreme Court; scientific community; Congress; and the military.
This question wording is not ideal. For one thing, it tends to fuzz over anydifferences between the institutions, in terms of a set of practices that transcend individualstherein, and the leaders of those institutions. Nor can we say that “confidence” exhausts allthe possibilities of understanding how Americans react to their set of political and socialinstitutions, as Hibbing and Theiss-Morse's (1995) outstanding study of attitudes toCongress, the presidency and the Supreme Court attests. After all, to get the full picture ofAmericans' attitudes towards institutions, we would need measures of emotional (e.g.,anxiety, enthusiasm, disgust) as well as cognitive response; we would need indications notjust in the confidence in leaders of institutions but of the approval of the day-to-dayperformance on one end and the support for the institutional set-up regardless of the peoplein power; and perceptions of and attitudes toward the institution's mission and procedures.
Nevertheless, the confidence series of GSS makes a good starting point. Even thosewho argue that the question is “narrow and flawed” end up charting its results over time(compare Hibbing and Theiss-Morse 1995, p. 22 and Figure 2.1). The focus on particularinstitutions is, at least, an improvement over another oft-used time series, the trust andefficacy questions in the National Election Studies that merely refers to an undifferentiated“government.” Moreover, Lipset and Schneider (1987, 89-93), moreover, report thatchanging the question wording in a split-half sample to refer strictly to the institution, not toits leaders, made little difference, so we can proceed with relative caution that the measuredoes tell us something about Americans' regard to the institution.
[Figures One and Two Here]
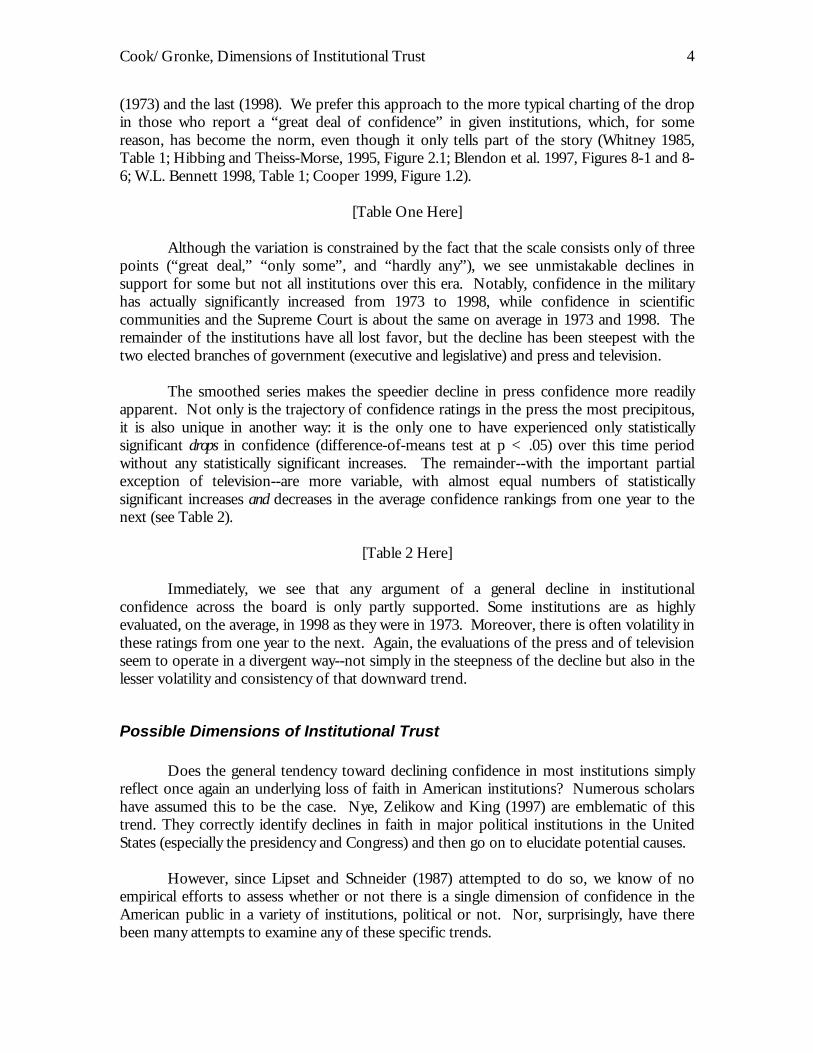
We begin by examining the mean rankings in the GSS for confidence in the twelveinstitutions. For ease of reporting, we present two figures. Figure 1 compares confidence inthe press and in television with each of the three branches of government. We have alsoincluded in this chart a “smoothed” version of the press, executive branch, andcongressional series. Figure 2 shows confidence in the press and in television alongside socialinstitutions. Table 1 presents the comparison of the means for the first year of our epoch 2 Specific years comprise 1973, 1974, 1975, 1976, 1977, 1978, 1980, 1982, 1984, 1986, 1987, 1988, 1990, 1991, 1993,1994, 1996 and 1998.
Cook/Gronke, Dimensions of Institutional Trust 4
(1973) and the last (1998). We prefer this approach to the more typical charting of the dropin those who report a “great deal of confidence” in given institutions, which, for somereason, has become the norm, even though it only tells part of the story (Whitney 1985,Table 1; Hibbing and Theiss-Morse, 1995, Figure 2.1; Blendon et al. 1997, Figures 8-1 and 8-6; W.L. Bennett 1998, Table 1; Cooper 1999, Figure 1.2).
[Table One Here]
Although the variation is constrained by the fact that the scale consists only of threepoints (“great deal,” “only some”, and “hardly any”), we see unmistakable declines insupport for some but not all institutions over this era. Notably, confidence in the militaryhas actually significantly increased from 1973 to 1998, while confidence in scientificcommunities and the Supreme Court is about the same on average in 1973 and 1998. Theremainder of the institutions have all lost favor, but the decline has been steepest with thetwo elected branches of government (executive and legislative) and press and television.
The smoothed series makes the speedier decline in press confidence more readilyapparent. Not only is the trajectory of confidence ratings in the press the most precipitous,it is also unique in another way: it is the only one to have experienced only statisticallysignificant drops in confidence (difference-of-means test at p < .05) over this time periodwithout any statistically significant increases. The remainder--with the important partialexception of television--are more variable, with almost equal numbers of statisticallysignificant increases and decreases in the average confidence rankings from one year to thenext (see Table 2).
[Table 2 Here]
Immediately, we see that any argument of a general decline in institutionalconfidence across the board is only partly supported. Some institutions are as highlyevaluated, on the average, in 1998 as they were in 1973. Moreover, there is often volatility inthese ratings from one year to the next. Again, the evaluations of the press and of televisionseem to operate in a divergent way--not simply in the steepness of the decline but also in thelesser volatility and consistency of that downward trend.
Possible Dimensions of Institutional Trust
Does the general tendency toward declining confidence in most institutions simplyreflect once again an underlying loss of faith in American institutions? Numerous scholarshave assumed this to be the case. Nye, Zelikow and King (1997) are emblematic of thistrend. They correctly identify declines in faith in major political institutions in the UnitedStates (especially the presidency and Congress) and then go on to elucidate potential causes.
However, since Lipset and Schneider (1987) attempted to do so, we know of noempirical efforts to assess whether or not there is a single dimension of confidence in theAmerican public in a variety of institutions, political or not. Nor, surprisingly, have therebeen many attempts to examine any of these specific trends.

Cook/Gronke, Dimensions of Institutional Trust 5
Lipset and Schneider's (1987) analysis is especially intriguing for us. At some points,they report that confidence toward the press seemed to follow a distinct logic fromconfidence toward other institutions. Nonetheless, one of their key conclusions is that ageneral confidence trend can be identified across institutions. A recent exploration (S.Bennett, Rhine, Flickinger, and L. Bennett 1999, p. 12) has also “raised an intriguingquestion: Is there an underlying dimension for trust in major societal institutions, where themedia as the fourth estate have become comparable to government institutions in thepublic's eye?” Bennett et al. take Lipset and Schneider (1987) as their starting point. But lessfavorably for our purposes, how Lipset and Schneider went about doing that leaves almostas much unanswered as they addressed.
In chapter 2, “The Generality of the Trends,” Lipset and Schneider conducted afactor analysis (though they do not tell us what kind) on the aggregate data series ofconfidence in institutions from GSS and Harris from 1966 to 1980. In effect, their effortshere are to discern an underlying structure to the overall levels of confidence in variousinstitutions. Their analysis revealed that “a single factor accounts for 66 percent of thevariation in confidence from survey to survey for the leaders of all ten institutions. ('Thepress' showed the weakest correspondence with other institutions. Faith in the presscorrelated .43 with the general confidence trend, while the other nine factor loadings rangedbetween .69 and .93)” (p. 47). However, in a footnote (p. 47 n. 4), they point out that theresults are considerably weaker if one excludes the Harris surveys from 1966 and 1967. Withthe 1966 and 1967 surveys excluded, they find a second factor defined positively by theexecutive branch and Congress and negatively by the press.
In chapter 4, “The Correlates of Confidence in Institutions,” Lipset and Schneiderlook at individual-level data. Here, they examined the correlation matrix for confidence inleaders of institutions on the pooled GSS from 1973 through 1977 and found that allcorrelations were positive, and that the average intercorrelation was .21. Note here that theoft-cited negative relationship between confidence in the press and confidence in electedofficials (president and Congress) occurred only at the aggregate, not the individual cross-sectional level. Emboldened by the possibility of a “general index of confidence ininstitutions, reflecting the fact that people who express high confidence in the leaders of anyone institution tend to be favorable toward leaders of all institutions” (p. 98), Lipset andSchneider conducted a principal components factor analysis and came up with a single factorthat accounted for 28% of the variance in the responses, which all of the confidencequestions loaded on at a level of .43 or higher, indicating “some common content to thesequestions” (p. 99; emphasis in original). However, in a footnote (p. 99, n. 3), they indicatedthat “additional factors were extracted [again, without not saying how] in order to determinewhether there might be more than one `general confidence' factor.” Only one additionalfactor with an eigenvalue greater than 1.0 emerged, defined by confidence in the press and intelevision. Thus, again, “both analyses suggest a distinct pattern for the media as opposed toother institutions” (p. 99, n. 3; emphasis in original). However, enigmatically, they then said,“The media factor was felt to be insufficiently general, however, to justify the inclusion of asecond factor” (p. 99, n. 3).
Whether Lipset and Schneider's conclusions about the unidimensionality ofconfidence in institutions can be supported by even their data is thus an open question.

Cook/Gronke, Dimensions of Institutional Trust 6
They shift rather rapidly instead to assuming a single dimension and then trying to findexplanations thereof. However, by doing so, they naturally incline themselves more topsychological and economic explanations of an overarching public mood toward institutions,rather than assume a potentially more discerning citizenry, weighing and assessing theirexperiences with and observations of these various institutions on a case-by-case basis.
The best work on confidence in institutions since Lipset and Schneider has beenderived from cross-national surveys, either in advanced industrial democracies, or in WesternEurope. Yet, these most recent investigations have tended to assume dimensionality. Forinstance, Newton and Norris (2000), examined the cross-national World Values Survey(WVS) administered in seventeen advanced industrial democracies. Institutional confidencewas measured for ten institutions: the police, the legal system, armed forces,parliament/Congress, the civil service, the education system, the church, major companies,the press and trade unions. Newton and Norris suggest that these “can be divided intopublic-sector institutions, understood as those most closely associated with the corefunctions of the state... and other institutions in the private and nonprofit sectors” (2000, pp.54-55). They then create two scales based on the first five and second five, respectively, ofthese ten institutions. While Newton and Norris do point out that “these scales provedsuitable for analysis because the separate items were highly intercorrelated, producing scaleswith a normal and nonskewed distribution with high reliability” (2000, p. 57 n. 3), asmeasured by the Cronbach's alpha for the respective scales, they do not report whether onewould have received similar results with a single scale, and indeed whether these two scalesare at all correlated.
Attempts to posit dimensionality of confidence rankings, following the WVS, havebeen contradictory, vague or ambivalent. Listhaug and Wiberg (1995) note that one canproceed to set up indices of confidence in institutions either “pragmatically or empirically.”A pragmatic approach means specifying a priori which institutions are and are notgovernmental and compiling separate scales, à la Newton and Norris. Yet Listhaug andWiberg note that factor analysis (using varimax rotation) produces a “prevalent tendency forwhat we can term `the institutions of order' -- the armed forces, the legal system, the police,and, somewhat less distinctly, the church -- to load on the second factor in a two-factorsolution.” (1995, p. 306) But instead of reporting, let alone using, the factor loadings,however, they merely note “This underlines the need to make a distinction within stateinstitutions.” (1995, p. 306).
Listhaug and Wiberg (1995) refer to Listhaug's (1984) earlier factor analysis of theNorwegian sample. Yet Listhaug's 1984 results undermine their later efforts, given that henotes there that one cannot find two uncorrelated factors. Instead, most variables loadingrelatively well on both extracted factors in a varimax rotation. For Norway at least, Listhaug(1984, p. 116) noted “The results do not support the expectations of a state/non-statedimension or a private vs. public factor.”
Listhaug's results for Norway found reinforcement in other EEC countries as well.Döring's (1992) series of obliquely rotated factor analyses found that in all countries studiedexcept France, there were two positively correlated (r > .27) factors with eigenvalues above1.0, one best defined by confidence in trade unions and in the press, and the other byconfidence in the armed forces, in the police and in the church. Other measures of

Cook/Gronke, Dimensions of Institutional Trust 7
institutional confidence tended to load moderately on both dimensions. The main variationfrom one country to the next was in which of the two factors--respectively what Döring(1992, p. 136) called “opposition” and “established order”--explained more of the variance.While there was no country where trade unions and the press on one hand, and the churchand armed forces on the other, were both on the same factor, confidence ratings in the otherinstitutions (parliament, civil service, education system, legal system and major companies)loaded neither so consistently across countries nor so clearly on one or another factor.
We thus have tantalizing indications that confidence in the press follows a differentpattern from that accorded to other institutions, both in the United States and in othercountries. The public/private split that some seem to assume does not appear to be justifiedby factor analyses. Instead, the dominant finding appears to be different, thoughintercorrelated, dimensions of confidence in civil society and in institutions of law and order,with confidence in political institutions not clearly loading on either factor. Yet given all ofthis -- the ambiguity in the kinds of factor analysis Lipset and Schneider used and the flexiblecriteria they applied for deciding when to include and exclude the examination of factors, thepresumption of dimensionality without evidence exemplified by Newton and Norris or byListhaug and Wiberg, and the unclear place of political institutions in this analysis fromListhaug and from Döring -- we need to ask: can we indeed come up with a robust scale ofgeneralized confidence in institutions separate from indications thereof toward the media?And is there evidence that we can think of confidence in the media as being distinct fromconfidence in other institutions?
Methods
We proceed in two ways. First, we conduct exploratory factor analyses on the twelveitems of confidence in institutions for each of the twenty years from the GSS that westudied. Given Lipset and Schneider's (1987) and S. Bennett et al.'s (1999) findings ofpositive intercorrelations between the various confidence measures, we follow Döring's(1992) approach and report an oblique rotation, which allows for intercorrelation of factors.Since this makes for an uncommonly abundant number of findings, we focus on severalsimpler questions: 1) the number of factors with an eigenvalue of 1.0 or greater; 2) theintercorrelation of those factors; and 3) any consistent patterns whereby different institutionsload onto different factors.
Second, we conducted confirmatory factor analyses, as follows. We compared threedifferent models with the null hypothesis of unidimensionality. One model, derived fromNewton and Norris (2000) establishes that there are two factors, one defined as “public,” theother as “private.” Another, based on Döring (1992), suggests three factors, one defined as“established order,” the second as “opposition, and the third as “political institutions.” Athird, suggested by Lipset and Schneider (1987) suggests two factors, one for the press andtelevision, and the other for all other institutions. Confirmatory factor analysis allows us totest the fit of each of these less constrained models relative to the more constrained, one-factor solution (see Hayduk 1987). This method is described in more detail below.

Cook/Gronke, Dimensions of Institutional Trust 8
Exploratory Factor Analyses
Table 3 reports the factor loadings for the twenty years of the twelve institutionalconfidence measures. For ease of our overview, we report only the structure matrix, whichreports the correlation of the measure with the underlying factor.3
[Table Three Here]
The first thing to note is that we found no year with a single-factor solution. Theseexploratory analyses do not support Lipset and Schneider's (1987) contention, and thespeculation by S. Bennett et al. (1999), that a single factor solution best represents themanifest variables. Each of the years produced at least a two-factor solution, usually three-factor, and sometimes four-factor solutions where each factor had an eigenvalue of 1.0 ormore. In short, we see evidence that the structure of public confidence in institutions ismore complex than often assumed. To be sure, these factors are often positively correlated.But this does not occur in all cases; there are some factors that are uncorrelated (suggestingorthogonality).
Most interesting for our conclusion, confidence measures on the press and ontelevision are rarely found on the same factors with confidence measures for politicalinstitutions. In several years (1976, 1978, 1980, 1986, 1987, 1988, 1994), confidence ratingsin the press and television were both highly correlated with an underlying factor but with noothers reaching our cutoff point of .5. The most typical measures to load on the same factorwith “press” and “TV” were confidence in labor unions (again, using a cutoff point of afactor loading of .5, labor unions load on the press-TV factor in 1974, 1982, 1984, 1990,1991, 1996 and 1998) and education (in 1993, 1996, and 1998). This pattern reinforcesLipset and Schneider's finding that confidence in the press follows a different logic fromconfidence in other institutions. In more recent years, there are inklings of Döring's “civilsociety” or liberal-oppositional dimension with the interconnections of confidence in thenews media and confidence in labor unions and leaders of education.
Confirmatory Factor Analyses
With the exploratory factor analyses in hand, we felt confident moving to the nextstage in our analysis: testing among the various alternative attitudinal structures. As wenoted above, there are at five different ways that we might believe the mass public organizestheir attitudes about political institutions. Some were tested using U.S. data (the same dataset we analyze here, but we examine a longer time period), others using European data sets.We are most concerned with confirming our suspicion that “confidence in the media,”manifested in confidence in the leaders of press and TV, stand apart from evaluations ofother political and social institutions.
The five alternative models that we test here are:
3 Pattern and structure matrices are identical for orthogonally rotated factor analysis. The pattern matrix showsweighted path coefficients.

Cook/Gronke, Dimensions of Institutional Trust 9
1. The first null model: no dimensionality at all2. A more realistic null model: a single dimension of institutional confidence3. The Lipset and Schneider two-factor structure, with confidence in the press and
TV being the manifest indicators for media confidence, and all other manifestindicators loading on the “generalized confidence” measure
4. The Newton/Norris “public vs. private” dimensions, where confidence in theexecutive branch, Congress, the Supreme Court, and the military constitute thepublic dimension, all other manifest indicators load on the private dimension.
5. The Döring three factor structure: established order (business, religion, medicine,science, and the military), political institutions (congress, the executive branch,and the supreme court), and opposition (labor unions, educational leaders, press,and TV).
These models are compared via a standard log-likelihood test. Following theguidelines provided in Hayduk (1987, Ch. 6), we provide the chi-square statistic for eachalternative model. Nested models can be assessed via the difference in the chi-square, whichis also distributed as a chi-square. For example, in the upper left hand portion of Table 4,the difference in chi-square between the naïve, non-dimensional model (chi-square=3111.757 with 66 degrees of freedom) and the unidimensional model (chi-square=397.028 with 53 degrees of freedom) is itself distributed as a chi-square, with a valueof 2714.729 (3111.757-397.028) and a degrees of freedom of 13 (66-53). Not surprisingly,this is a highly significant chi-square, indicating that the one-dimensional model fits the datafar better than one which assumes no dimensionality (essentially no intercorrelation at all)between these measures.
Far more interesting is the comparisons between the unidimensional model and themultidimensional alternatives. One proviso is necessary: all of these models are nested (lessconstrained alternatives) within the unidimensional model, but they are not nested withineach other. This means that you cannot compare directly, for example, “Döring” to “two-factor.” The Döring model should provide a smaller chi-square by definition, because itrelaxes more parameters. This is analogous to adding variables to a regression—bydefinition, your unadjusted R-square will increase. Thus, the comparisons here arenecessarily a matter of taste, a preference for parsimony over goodness of fit, as much theyare a matter of statistics. Primarily, we examined these confirmatory factor analysis results todetermine whether, in general, across most years, a) does the Lipset-Schneider two factorsolution provide a superior fit to the Newton-Norris two factor solution, and b) does theincreased goodness of fit of the three factor solution seem worthwhile given the increasedcomplexity of this model.
[Table Four Here]
With these caveats in mind, we take a mixed message away from Table 4. In the lateryears of the GSS series, it is clear that the two-factor model is the preferable specification.In every year from 1984 onward, the “media / all others” model provides a superior fit tothe data than does the Newton-Norris “public/private” model. In earlier years, however,the verdict is still decidedly out. From 1977-1982, for example, Newton-Norris fits the databetter. This may be a result of a Democrat taking over the White House and aligning up

Cook/Gronke, Dimensions of Institutional Trust 10
institutions (ideologically). This was gradually broken up during the Reagan presidency.Furthermore, our confidence in interpreting the changes from year to year is undermined bythe obvious differences in the way that these dimensions could be defined. One may ask why“labor unions are grouped into the “opposition” dimension, although this more likelyreflects a European perspective on this institution; or whether we should incorporate someof the insights from the exploratory analysis into the confirmatory models (e.g. the apparentrelationship between evaluations of the press and TV and what might be deemed“expertise”, the educational and scientific establishment, in later years). Finally, given thevariation that we have already observed in these data over time (Cook, Gronke, and Rattliff2000), is it very likely that any dimensionality in these measures is influenced by real-worldevents in ways that we cannot identify. The inability, given current technology, to provide acritical statistical test between the models, raises an additional concern.
Nonetheless, we are heartened by the results from the last ten surveys. A twodimensional models fits well during this period. Further inspection of the data, both visually(Figures 1 and 2), via exploratory factor analysis (Table 3), and via other scaling technologies(reliability analysis) all point in the same direction. It is not a gross simplification of publicattitudes to suggest that there are at least two dimensions in institutional confidence. Onecomprises the “media”, at least as reflected in these series of items (TV and the press). Thesecond comprises “other” institutions, some social and some political, but all of which aresubject to a generalized tendency on the part of the respondent to express confidence (or not).
We therefore proceed in the rest of the paper to employ two additive measures, onelabelled “confidence in the media” and the second “confidence in other institutions.” Bothwere created by recoding the three-point confidence measure to the –1,0,1 range. The itemswere summed and then divided by the number of items. This results in a scale which runsfrom one—a “great deal” on confidence in the leaders all of the institutions comprising thescale—to negative one—“hardly any” confidence in the leaders of all the institutionscomprising the scale. In Figure 3, we plot both of these measures. The trends that weobserved early on in the paper remain apparent.
[Figure Three Here]
Who Expresses Confidence in the Media?
Having given an overview of the decline in both confidence in the media and inother institutions, we can now ask: who is most likely to express confidence, combiningtogether the measures for both “press” and “TV”, which, as we have seen, are highlycorrelated. To do so, we pooled the cross-sections from the GSS for 1973 through 1998,and proceeded to run a least-squares dummy variable (LSDV) regression on the confidencein media. This method is necessary because there are linear trends in these data over timethat need to be captured by the dummy variables for the year of the survey (the excludedyear is 1973). However, there is little likelihood of autocorrelation in these data given thatthey are independent cross-sections. LSDV is the appropriate specification in thesecircumstances (Stimson 1985). This basically allows us to control for secular Zeitgeisteffects and to see the effects of the predictor variables in pushing confidence in the press

Cook/Gronke, Dimensions of Institutional Trust 11
higher or lower than would be expected on the average for that particular year. However,we do not report on the dummy variables for the year of survey in the tables below butreserve them as controls.
At this point, we have generated a fairly limited regression equation, drawing uponpredictor variables that have been suggested by other studies of confidence in institutionsand trust in government (inter alia, Lipset and Schneider 1987; Craig 1993; Hibbing andTheiss-Morse 1995; King 1997; Norris 1999b; Dalton 2000; Newton and Norris 2000). Wehypothesize that confidence in the media is a product of a small set of demographic andattitudinal variables. The demographic variables are education, age, race (1=black), income,and gender (1=female). These demographic variables, of course, are presumably related tolevels of confidence in institutions, in part because they capture dominant cleavages inAmerican society; presumably, those who are more disadvantaged are going to be lessfavorably disposed to a whole variety of institutions. However, cross-national investigationssuggest that age, being female, education and low SES (all other things being equal) havepositive and statistically significant associations with confidence in institutions (Norris1999b; Newton and Norris 2000). Trust in government works in somewhat different ways,which suggests other possibilities, with education, being nonwhite, income being positivelyassociated, and age negatively associated (King 1997). However, the differences betweensocial groups are modest at best (see also Orren 1997 for trust in government).
Is there any reason for us to assume that these groups would treat the mediadissimilarly? Educated people, for example, might be more favorable to the media than toother institutions, given that they are the beneficiaries of the “knowledge gap”, wherebymore educated consumers of the news are better able to understand and use it to learn aboutpolitics. Likewise, high-income individuals are the target of a profit-minded media who mayserve the empowered segments of society; in fact, that then means that higher-incomeindividuals, whites and men should be more trusting of the press than of other institutions.Older respondents not only tend to be more committed to existing social arrangements butare also heavier consumers of the news.
Other attitudes might also be linked to confidence. Lipset and Schneider (1987)emphasize the importance of interpersonal trust, but more recent inquiries have suggestedonly weak connections (for a good overview, see Newton 1999). Satisfaction with one's lifesituation, including but not limited to one's economic situation, may also be at work (Lipsetand Schneider, 1987; McAllister 1999; Newton and Norris 2000).
The literature tends to conclude that confidence in institutions, like trust ingovernment, is most influenced by political variables, rather than demographic or social-psychological variables. We include partisan affiliation (the traditional seven-point scalegoing from strong Democrat to strong Republican), ideology (also a seven-point scale goingfrom liberal to conservative) and strength of partisanship. Partisan affiliation is importanthere, if Democrats tend to be more in factor of the underdogs that the news media areconventionally said to defend. Left-right self-placement is the strongest predictor ofconfidence in a variety of institutions in cross-national inquiries (Newton and Norris 2000).Strength of partisanship is suggested by Lipset and Schneider (1987); since it presumablyreflects a commitment to at least one longstanding American institution which will be linkedto other institutions as well (see also Weisberg 1981; King 1997).

Cook/Gronke, Dimensions of Institutional Trust 12
With the media, however, we might expect Republicans and conservatives to be lesstrusting than is the case with other institutions, given the ways in which their leaders have,since at least Richard Nixon and Spiro Agnew, made a case for the bias of the “liberalmedia.” Liberals and Democrats, on the other hand, may have reacted negatively to whatthey could have easily perceived as jingoistic coverage during the Reagan and Bushadministrations and hostile commentary of Carter and Clinton, which they could easily chalkup to an equally strong conservative bias. However, liberals generally tend to see lessconservative bias than conservatives see liberal bias (e.g., Dautrich and Hartley 1999, Table5.3). This likewise means that strong partisans (both Republicans and Democrats) should becomparatively distrusting of the media, as neither sees the media as serving their partisaninterests.
[Table Five Here]
Our analysis is reported in Table 5, which presents the pooled equation forconfidence in the media over the 27 year period in the left hand panel, and a parallel analysisfor confidence in other institutions on the right. We will spend most of our time discussingthe media model.
Not surprisingly, the most powerful predictor of confidence in the media is therespondent’s level of confidence in all other institutions. Inclusion of this variable does notchange the impact of most of the other political and demographic indicators. Most of theother relationships are not affected by the inclusion of this variable. In particular, thepolitical variables (party and ideology) are virtually unchanged in terms of the sizes of thecoefficients. Some earlier predictors, such as race and age, are reduced when generalizedconfidence is included (Cook, Gronke, and Rattliff 2000).
The demographic variables, over and above the impact of confidence in the media,provide an intriguing pattern. Age, income, and education all consistently predict confidencein the media at p < .005 (the most appropriate level given the large sample size), butnegatively. It appears that for the heaviest consumers of the news (the more educated, thebetter-off, older respondents), we have clear evidence that familiarity with the news productbreeds a lack of confidence (if not contempt) with the media as an institution. Race worksin the opposite direction, with Blacks more likely to express confidence in the leaders of thepress and TV, undermining any claims that African Americans view the media as aninstitution somehow working contrary to their interests. Thus, confidence I the media isnegatively related to high social status across the board, which, as we shall see, is not the casewith confidence in other institutions.
The political variables, as expected, are more powerful predictors of confidence in themedia, although their inclusion only slightly reduces the significance of education, age, andincome.4 In particular, we find that party identification and political views, in and ofthemselves, are strong predictors of confidence, confirming that conservatives and Republicansare substantially less confident in the media throughout the time period. Of the institutional 4 All the demographic variables except for gender retain their predictive strength once we add the variables thataccount for institutional attachments and life satisfaction (Cook, Gronke, and Rattliff 2000).

Cook/Gronke, Dimensions of Institutional Trust 13
attachments and life situations, only attending religious services affects significantly confidencein the media, with the religious substantially less confident.
We see from the dummy variables for individual years considerable Zeitgeist effects.Controlling for the other predictor variables, we see that 1974, 1975, 1976 and 1980 aresignificantly higher than average in confidence in the media, and 1994, 1996 and 1998 aresignificantly lower than average. In short, we see that confidence in the news media iscertainly strongly influenced by a variety of demographic, political and institutional variables,but is also powerfully affected by a secular decline over and above their effects.
In order to see what effects are unique to the media, we report a parallel equationwith the same predictors, using generalized confidence in other institutions as a dependentvariable, and with confidence in the media now as an independent variable. The contrasts areimpressive. First of all, measures of institutional attachment (strength of party affiliation,attending religious services) and of life satisfaction (personal economic situation) are thestrongest predictors of generalized confidence in other institutions besides the media. Moststrikingly, the more religious express more confidence in most institutions, but deviate awayfrom that tendency dramatically with the media. Demographic variables, particularly race andto a lesser extent gender, are also strong predictors of generalized confidence. In particular,African-Americans and women are less inclined to voice confidence in other institutionsbeside the media, but again African-Americans tend to exempt the media more from theircritique. Political variables are influential at a somewhat lower level, with the scale offavoring government spending and partisanship both significantly predicting confidence innon-media institutions. Yet while going from strong Democrat to strong Republicanincreases confidence in most institutions, a similar progression pushes respondents awayfrom confidence in the media. In other words, Republicans, more religiously observantAmericans, white people, and (to a lesser extent) conservatives and the more educated are,all other things being equal, inclined to express confidence in most institutions, as would beexpected. But these same groups deviate from their usual levels of confidence when it comesto the media. The only time when a variable boosts confidence both in non-mediainstitutions and in the media is with the scale of government spending, which may representa unique confluence of favorability toward governmental institutions as well associal/economic liberalism.
We also examined these results year by year (not reported here–results available fromthe authors). Perhaps surprisingly, the predictors of confidence in the media did not changedramatically over time. Replicating these equations for each year never showed predictorsthat were statistically significant in one direction in one year and statistically significant in theother direction in another year. To be sure, the exact independent variables that predictedstatistically significantly from year to year were often quite different. However, we foundalmost no consistent shift over time from one set of variables to another. Instead, thoseindependent variables that were most influential on confidence in the news media in thepooled analysis tended to be those -- generalized confidence, education, conservatism -- thatwere found most frequently and regularly in the equations for individual years.
In sum, we do find evidence that confidence in the media is closely related toconfidence in other institutions. However, confidence in the media is often driven apartfrom confidence in other institutions. A number of variables--institutional attachments,

Cook/Gronke, Dimensions of Institutional Trust 14
political considerations, and race--push confidence in the media substantially lower thanwhat we would have expected from the high levels of confidence that those groups expressin other institutions. Thus, having illustrated the gap between confidence in the media andconfidence in other institutions, we now have an explanation. Over the time period,Republicans, the more religiously inclined, whites, conservatives and the more educatedtended to be more sympathetic to existing American institutions, but the reverse actuallyhappened to be true for the media.
Can all of this help us understand not merely the predictors of confidence in themedia but why confidence in the media has fallen more precipitously than generalizedconfidence in a variety of political and social institutions? To be sure, there are substantialZeitgeist effects, with dummy variables for specific years often showing highly statisticallysignificant coefficients. Yet, even if we conclude that the impact of the other predictorvariables has been constant over time, any changes in the distribution of those variables overtime will have important repercussions. Most notably, we should point out how the changesover time in party identification (going from Democratic dominance to parity between thetwo major parties) and in ideology (with the electorate becoming, on the average, moreconservative) have worked to shrink the pool of those who would be more inclined toexpress confidence in the press, over and above the decline in generalized confidence. Eventhe rising education levels and increasing income of the American people tend to workagainst confidence in the press. Only the decline in attendance of religious services wouldwork in favor of increased confidence in the media, and this influence is outweighed by thecontrary shifts in education, income, partisanship, and ideology.
However, we might wonder if the greater enthusiasm that liberals and Democratsshowed for the media from 1972 through 1992 reflects the fact that, with the exception ofthe 4 Cater years, these groups were the opposition to those in the While House. We mightspeculate that confidence in the press collapsed so dramatically after 1992 because those inpower (Democrats and to a lesser extent, liberals) would be pushed away from their usualfavorability to the adversarial media. Examine Figures 7 and 8, which show the meanconfidence differential, disaggregated by partisan and ideological groups. These figuresillustrate the slow but inexorable decline in confidence in the media among all groups. Mostnotable to us is the sudden convergence of these data in 1998, where all groups give far lessconfidence than previous years and at virtually the same level, both among partisan andideological groupings.
Whether these results turn out to be a short-term response to the Lewinsky scandalin 1998, whether they would be altered if the Republicans take back the White House in2000, or whether they are harbingers of further difficulties for the press, this helps usunderstand why it is that journalists nowadays have such a visceral sense of the media beinghated. We know that reporters tend disproportionately to say that they are Democratsand/or liberals (Weaver and Wilhoit 1996). Put tersely (and perhaps unfairly), reporters canno longer rely upon their traditional friends to support them. There is no core group to givethe press "high confidence." Prior to 1998, conservatives and Republicans were far morelikely to withhold confidence in the press than liberals and Democrats; as of 1998, such wasno longer the case.

Cook/Gronke, Dimensions of Institutional Trust 15
Conclusions
What have we learned? We would point to several conclusions:
• There is strong evidence that the confidence expressed by the public towards theleaders of the press has shifted substantially, both on the average, and with anear-disappearance of the number of people who report “a great deal” and ahuge upswing by 1998 in the proportions who say “hardly any” confidence.5
• Confidence in the media is only partly connected with that accorded to otherinstitutions. In particular, from 1973 to 1998, confidence in the press (not TV)started out at a higher level than other institutions and ended up at a lower level.Factor results indicate that there is a two dimensional structure to institutionalconfidence, suggesting that these different trajectories show that the media isbeing conceptualized differently than the bulk of other institutions.
• While confidence in the media is strongly predicted by a measure of generalizedconfidence in other institutions, it is not a mere extension of how citizens judgeinstitutions in general, as education, age, income, partisanship, ideology andstrength of partisanship have independent effects upon confidence in the pressover and above the impact of generalized confidence. Put otherwise, highereducation, increased age, higher income, moving from Democrat to Republican,moving from liberal to conservative and the strength of partisanship all pushtoward lower ratings for the media than what we would have predicted on thebasis of generalized confidence alone. This reminds us of one of the centralriddles that we have to note: those groups that express confidence in mostpolitical and social institutions are often included not to do the same for themedia; and, as the impact of education, age and income shows, the news media --particularly newspapers -- often finds their most regular and devoted readers andviewers to be among their staunchest critics.
• What seems to provoke the decline in the confidence in the news media is partlysecular, but also partly due to other changes in the public whereby the Americanpublic during this time period become more educated, more conservative, moreRepublican, more identifying with the president's party -- all of which would leadto decreasing confidence in the media-- whereas the only shift that would favorthe media is the decrease in attending religious services. In sum, there has been ashrinkage in the number of habitual friends of the media and an increase in thenumber of those less trusting of them.
• As of 1998, however, many of the key distinctions between Americans inconfidence toward the press collapsed. In particular, the gaps betweenDemocrats and Republicans and between liberals and conservatives all butdisappeared in 1998. The former is not unprecedented and reflects the tendencyfor Republicans and Democrats to seemingly pay close attention to which party
5 Although the GSS data show a steeper decline, we find similar results over time for the Harris surveys for thesame time period as well, giving further reinforcement to the notion that Americans' confidence in the newsmedia did indeed shift to a much more negative assessment from the early 70s to the late 90s.

Cook/Gronke, Dimensions of Institutional Trust 16
occupies the White House when it comes to having confidence in the press.However, the disappearance of the liberal-conservative distinction in 1998 isnew, and it will bear watching to see if this is a one-time-only short-term result(presumably) of the Lewinsky affair or if this indicates a beginning of a newtrend.
REFERENCES
Bennett, Stephen Earl, Staci L. Rhine, Richard L. Flickinger, and Linda L.M. Bennett. 1999.“Video malaise” revisited: public trust in the media and government. HarvardInternational Journal of Press/Politics 4, 4: 8-23.
Bennett, W. Lance. 1998. The uncivic culture: communication, lifestyle, and the rise oflifestyle politics. PS: Political Science and Politics 31: 741-762.
Blendon, Robert J., John M. Benson, Richard Morin, Drew E. Altman, Mollyann Brodie,Mario Brossard and Matt James. 1997. Changing attitudes in America. In Joseph S.Nye, Jr., Philip D. Zelikow and David C. King, eds., Why People Don't TrustGovernment, pp. 205-215. Cambridge, MA: Harvard University Press.
Chanley, Virginia A., Thomas Rudolph, and Wendy Rahn. 2000. “The Origins andConsequences of Public Trust in Government.” Public Opinion Quarterly 64: 239-256.
Citrin, Jack. 1974. “Comment: The Political Relevance of Trust in Government.” AmericanPolitical Science Review 68:973-88.
Cook, Timothy E. 1998. Governing with the News. Chicago: University of Chicago Press.
Cook, Timothy E., Paul Gronke, and John Rattliff. 2000. “Disdaining the Media?Changing Public Attitudes Towards the Press.” Paper presented at the annualmeeting of the American Political Science Association, Washington D.C. Earlierversion presented at the annual meeting of the International Society for PoliticalSociety, Seattle, WA.
Cooper, Joseph. 1999. The puzzle of distrust. In Joseph Cooper, ed., Congress and the Declineof Public Trust, pp. 1-26. Boulder, CO: Westview Press.
Craig, Stephen C. 1993. The Malevolent Leaders: Popular Discontent in America. Boulder, CO:Westview Press.
Craig, Stephen C. (ed). 1996. Broken Contract: Changing Relationships Between Americans andTheir Government. Boulder, CO: Westview Press.
Dalton, Russell J. 2000. Value change and democracy. In Susan J. Pharr and Robert D.Putnam, eds., Disaffected Democracies: What's Troubling the Trilateral Countries?, pp. 252-269. Princeton, NJ: Princeton University Press.

Cook/Gronke, Dimensions of Institutional Trust 17
Dautrich, Kenneth and Thomas Hartley. 1999. How the News Media Fail American Voters:Causes, Consequences, and Remedies. New York: Columbia University Press.
Döring, Herbert. 1992. Higher education and confidence in institutions: a secondaryanalysis of the “European Values Survey,” 1981-83. West European Politics 15: 126-146.
Gronke, Paul. 1999. The nature of hte elite gap: military and civilian beliefs about foreignpolicy in the Clinton administration. Paper presented at the Triangle Institution forSecurity Studies' conference, “Bridging the Gap: Assuring Military EffectivenessWhen Military Culture Diverges from Civilian Society,” Durham, NC, July.
---. 2000. Presidential approval: a review essay. Paper presented at the annual conference ofthe American Political Science Association, Washington DC.
Gronke, Paul, and Peter D. Feaver. 2001. “The foundations of institutional trust:reexamining public confidence in the U.S. military from a civil-military perspective.”In Peter Feaver and Richard Kohn (eds), Soldier and Civilians: The Gap Between theMilitary and American Society and What It Means for National Security. Cambridge, MA:MIT Press.
Hayduk, Leslie A. 1987. Structural Equation Modeling with LISREL. Baltimore, MD: JohnsHopkins University Press.
Hibbing, John, and Elizabeth Theiss-Morse. 1995. Congress as Public Enemy. New York:Cambridge University Press.
King, David C. 1997. The polarization of American parties and mistrust of government. InJoseph S. Nye, Jr., Philip D. Zelikow and David C. King, eds., Why People Don't TrustGovernment, pp. 155-178. Cambridge, MA: Harvard University Press.
Lipset, Seymour Martin, and William Schneider. 1987. The Confidence Gap. rev. ed.Baltimore: Johns Hopkins University Press.
Listhaug, Ola. 1984. Confidence in institutions: findings from the Norwegian Values Study.Acta Sociologica 27: 111-122.
--- and Matti Wiberg. 1995. Confidence in political and private institutions. In Hans-DieterKlingemann and Dieter Fuchs, eds., Citizens and the State, pp. 298-322. New York:Oxford University Press.
Mansbridge, Jane. 1997. “Social and Cultural Causes of Dissatisfaction with U.S.Government.” In Nye, Zelikow, and King (eds) Why Americans Don’t TrustGovernment. Cambridge, MA: Harvard University Press.
McAllister, Ian. 1999. The economic performance of governments. In Pippa Norris, ed.,Critical Citizens: Global Support for Democratic Governance, pp. 188-203. New York:

Cook/Gronke, Dimensions of Institutional Trust 18
Oxford University Press.
Miller, Arthur E. and Stephen A. Borelli. 1991. “Confidence in Government during the1980s.” American Politics Quarterly 19:150-16x.
Newton, Kenneth. 1999. Social and political trust in established democracies. In PippaNorris, ed., Critical Citizens: Global Support for Democratic Governance, pp. 169-187. NewYork: Oxford University Press.
Newton, Kenneth and Pippa Norris. 2000. Confidence in public institutions: faith, culture,or performance? In Susan J. Pharr and Robert D. Putnam, eds., DisaffectedDemocracies: What's Troubling the Trilateral Countries?, pp. 52-73. Princeton, NJ:Princeton University Press.
Norris, Pippa, ed. 1999a. Critical Citizens: Global Support for Democratic Governance. New York:Oxford University Press.
---. 1999b. Institutional explanations for political support. In Pippa Norris, ed., CriticalCitizens: Global Support for Democratic Governance, pp. 217-235. New York: OxfordUniversity Press.
Nye, Joseph S., Jr., Philip D. Zelikow and David C. King, eds. 1997. Why People Don't TrustGovernment, pp. 205-215. Cambridge, MA: Harvard University Press.
Orren, Gary. 1997. Fall from grace: the public's loss of faith in government. In Joseph S.Nye, Jr., Philip D. Zelikow and David C. King, eds., Why People Don't TrustGovernment, pp. 77-107. Cambridge, MA: Harvard University Press.
Pew Center on the Politics and the Press. 1998. Deconstructing Trust: How Americans ViewGovernment. Washington, DC: Pew Research Center for the People and the Press.
Pharr, Susan J., and Robert D. Putnam, eds. 2000. Disaffected Democracies: What's Troubling theTrilateral Countries? Princeton, NJ: Princeton University Press.
Stimson, James A. 1985. Regression in space and time: a statistical essay. American Journal ofPolitical Science 29: 914-947.
Tuchman, Gaye. 1972. Objectivity as strategic ritual: an examination of newsmen's notionsof objectivity. American Journal of Sociology 77: 660-679.
Weaver, David H. and G. Cleveland Wilhoit. 1996. The American Journalist in the 1990s.Mahwah, NJ: Lawrence Erlbaum Associates.
Weisberg, Herbert. 1981. A multidimensional conceptualization of party identification.Political Behavior 2: 33-60.
Whitney, D. Charles. 1985. The media and the people -- Americans' experience with thenews media: a fifty-year review. Gannett Center Working Paper.

Figure 1: Confidence in the Press and TV vs. Govt Institutions (with smoothed trendlines)
1.5
1.7
1.9
2.1
2.3
2.5
2.7
1973
1974
1975
1976
1977
1978
1980
1982
1983
1984
1986
1987
1988
1989
1990
1991
1993
1994
1996
1998
GSS Year of Survey
Ave
rage
Con
fiden
ce
PressExec BranchTelevisionSupreme CtCongressMilitaryPoly. (Press)Poly. (Congress)Poly. (Exec Branch)

Figure 2: Confidence in the Press and TV vs. Social Institutions
1.5
1.7
1.9
2.1
2.3
2.5
2.7
1973 1974 1975 1976 1977 1978 1980 1982 1983 1984 1986 1987 1988 1989 1990 1991 1993 1994 1996 1998GSS Year of Survey
Aver
age
Con
fiden
ce
PressCompaniesReligionEducation
UnionsMedicineTelevisionScience
Figure Three: Media Confidence vs. Confidence in Other Institutionsgss year for this respondent
Confidence in the Media Confidence in Other Institutions
1970 1980 1990 2000-.4
-.2
0
.2


1973 1998 T-test(difference of means)
Medicine 2.488 2.393 -5.879Scientific community 2.336 2.345 0.386Education 2.292 2.104 -8.546Major companies 2.198 2.141 -2.561Organized religion 2.196 2.084 -4.645Supreme Court 2.166 2.18 0.882Military 2.161 2.244 3.527Executive branch 2.112 1.78 -14.085Congress 2.089 1.799 -13.364Press 2.085 1.661 -19.451Television 1.967 1.708 -11.614Organized labor 1.894 1.784 -4.009
Table 1.
Mean ratings of confidence in institutions, 1973 and 1998. (Presented
in declining order of mean for 1973)
Declines IncreasesMedicine 6 5Scientific community 4 4Education 5 5Major companies 7 6Organized religion 5 6Supreme Court 4 5Military 4 5Executive branch 7 8Congress 5 4Press 5 0Television 5 2Organized labor 4 3
Significant
Number of significant increases andsignificant decreases (p < .05) in averageconfidence rankings between successive
survey years.
Table 2

1973.000 (ll test) 1974.000 (ll test) 1975.000 (ll test) 1976.000 (ll test) 1977.000 (ll test) 1978.000 (ll test)Null Model (66 d.f.) 3111.757 2667.993 2134.252 1736.909 3056.541 2544.421One Factor (53 d.f.) 397.028 2714.729 434.401 2233.593 332.964 1801.288 239.579 1497.330 246.613 2809.928 272.238 2272.183Two Factor (52 d.f.) 328.130 68.898 344.390 90.011 300.410 32.554 191.192 48.386 222.333 24.280 247.915 24.323Newton Norris (52 d.f.) 339.342 57.686 336.752 97.648 299.199 33.766 232.462 7.117 211.194 35.419 201.960 70.278Doring (50 d.f.) 328.581 68.447 303.074 131.327 301.015 31.950 208.241 31.337 252.100 -5.487 178.057 94.182
1980.000 (ll test) 1982.000 (ll test) 1984.000 (ll test) 1986.000 (ll test) 1987.000 (ll test) 1988.000 (ll test)Null Model (66 d.f.) 2388.963 3381.419 1774.033 2529.438 2829.398 1619.822One Factor (53 d.f.) 242.032 2146.931 459.363 2922.056 225.906 1548.127 347.535 2181.903 355.911 2473.487 330.898 1288.924Two Factor (52 d.f.) 221.774 20.258 387.498 71.865 191.952 33.954 294.479 53.056 321.057 34.854 274.193 56.706Newton Norris (52 d.f.) 210.817 31.216 350.524 108.839 200.028 25.877 314.838 32.697 331.979 23.932 287.542 43.357Doring (50 d.f.) 193.360 48.672 331.588 127.775 156.255 69.650 277.960 69.575 351.828 4.082 248.849 82.049
1990.000 (ll test) 1991.000 (ll test) 1993.000 (ll test) 1994.000 (ll test) 1996.000 (ll test) 1998.000 (ll test)Null Model (66 d.f.) 1526.223 1852.674 1897.444 3369.181 3330.906 3195.670One Factor (53 d.f.) 186.635 1339.588 231.605 1621.068 255.435 1642.009 442.523 2926.657 380.416 2950.490 472.845 2722.826Two Factor (52 d.f.) 153.629 33.006 192.523 39.082 229.569 25.867 378.880 63.643 295.099 85.317 401.510 71.335Newton Norris (52 d.f.) 184.954 1.681 199.976 31.630 252.478 2.957 402.062 40.462 314.880 65.537 405.335 67.510Doring (50 d.f.) 178.772 7.863 170.221 61.384 230.268 25.167 351.675 90.848 254.682 125.734 328.625 144.220
Table 4: Confirmatory Factor Analysis Results, Comparing Three Alternative Dimensional Models
Cell entries contain the chi-square statistic for the particular model and year. The ll test column contains the difference in chi-square between the less constrained models and the one-factor solution. See text for more details.

COOK/GRONKE, THE DIMENSIONS OF INSTITUTIONAL TRUST
Dep Variable:Coefficient Std. Err. t-score Coefficient Std. Err. t-score
Confidence in Other Institutions / Confidence in the Media 0.614 0.012 52.387 0.271 0.005 52.387Conservatism -0.021 0.003 -6.438 0.006 0.002 2.682Strength of Party ID 0.001 0.004 0.122 0.036 0.003 12.469Party ID -0.019 0.002 -8.335 0.009 0.001 6.063Favor Government Spending 0.009 0.003 3.344 0.017 0.002 9.259Frequency of Church Attendance -0.023 0.002 -14.261 0.019 0.001 17.995Personal Economic Situation -0.013 0.011 -1.182 0.083 0.007 11.624DemographicsEducation -0.015 0.001 -9.778 0.002 0.001 2.423Age -0.001 0.000 -2.960 0.000 0.000 1.184Black 0.049 0.013 3.760 -0.081 0.009 -9.346Income -0.008 0.002 -5.127 -0.002 0.001 -1.683Female -0.002 0.008 -0.226 -0.021 0.005 -3.961Year Dummiesdummy74 0.118 0.021 5.715 0.068 0.014 4.943dummy75 0.129 0.021 6.207 -0.020 0.014 -1.437dummy76 0.107 0.021 5.094 0.024 0.014 1.703dummy77 0.036 0.020 1.757 0.111 0.013 8.272dummy78 0.028 0.020 1.357 0.003 0.013 0.225dummy80 0.093 0.021 4.547 -0.013 0.014 -0.940dummy82 0.030 0.019 1.529 0.041 0.013 3.175dummy84 -0.002 0.028 -0.073 0.048 0.019 2.600dummy86 0.022 0.025 0.911 0.019 0.016 1.175dummy87 -0.017 0.027 -0.647 0.068 0.018 3.849dummy88 0.037 0.029 1.291 0.042 0.019 2.185dummy90 0.036 0.030 1.182 0.004 0.020 0.189dummy91 -0.049 0.028 -1.726 0.072 0.019 3.842dummy93 -0.076 0.028 -2.716 -0.029 0.019 -1.541dummy94 -0.122 0.022 -5.478 0.027 0.015 1.789dummy96 -0.154 0.023 -6.577 0.019 0.016 1.220dummy98 -0.202 0.023 -8.635 0.057 0.016 3.627Constant 0.142 0.036 3.921 -0.183 0.024 -7.625DiagnosticsN of CasesAdjusted R-squaredRoot MSE
Confidence in Press and TV Confidence in Other Institutions
Table 5: Pooled Regression of Confidence Measures
138110.2410.467
138110.2260.310