the diffusion of internet technology in the workplace
TRANSCRIPT

The Diffusion of Internet Technology in the Workplace
Tips on Using this Document
Welcome to the PDF version of The Diffusion of Internet Technology in theWorkplace. If you're familiar with using PDF documents, you'll want toskip this page. If you're not familiar with PDF documents, here are a fewpointers to help you get around.
• Bookmarks: There are bookmarks along the left-hand side of thescreen for the major sections of the document. Clicking on thebookmark for a section will take you to that section. To return to thepage you started from, click on your PDF browser's "previous view"button (usually a button with a left-facing double arrowhead icon onit near the top of the browser window).
If you don't want to see the bookmarks or if they seem to be taking uptoo much room, you can either click on the bar between thebookmarks and the document and drag it to the left or click on yourPDF browser's "display only the page" button (usually a button with apage icon on it near the upper left-hand portion of the browserwindow).
• Links: You'll occasionally notice blue text in the document. This eitherindicates a link to another location within this document or a link toanother location on the internet. Clicking on the link enables you tojump to the location described in the blue text. All of the entries in thetable of contents and the lists of tables and figures are linked, as arereferences in the text to tables, figures, chapters, and appendixes. Inaddition, several of the entries in the References section that includeURLs (references to the location of information on the internet) arelinked.
After following links within the document, you can return to the pageyou started from, by clicking on your PDF browser's "previous view"button (usually a button with a left-facing double arrowhead icon onit near the top of the browser window). If you follow a link to alocation on the internet, you can return to this document either byclicking your internet browser's "Back" button or, if your PDF browseris separate from your internet browser, you can simply re-select yourPDF browser.
Happy browsing!

The Diffusion of Internet Technologyin the Workplace
James W. PearceAugust 1998

ii
Abstract
The twentieth century has been shaped by sweeping changes in
communication technology. The latest development to radically transform
the communication landscape has been the widespread adoption of
internet technology and its integration into the international
communication infrastructure. Despite the changes it has brought
about, as well as those it portends, relatively few studies have sought to
identify the factors that influence the diffusion of internet technology —
either in society in general or in an organizational setting.
This study begins to consider two sets of factors that may influence the
diffusion of internet technology. First, it examines the importance of
organizational heterogeneity, a key concept of critical mass theory, to the
diffusion of internet technology within organizations. It then probes the
nature of the relationship between interpersonal and organizational
factors in terms of how they affect the diffusion of internet technology
through organizations.
Data for the study was generated by a survey which was administered to
employees at six Department of Energy facilities operated by Lockheed
Martin Corporation's Energy and Environment Sector. The survey was

iii
made available in three formats: on the Worldwide Web, as an e-mail
message, and in a traditional paper format. Overall, 9040 survey
solicitations were distributed, and 2711 usable responses were received,
yielding a 30% response rate. The data gathered in this study was
analyzed using descriptive analyses, as well as t-tests and multiple
regression analyses of the study’s hypotheses.
This study is a small step in the direction of understanding the processes
and identifying factors that influence the diffusion of internet technology
in the workplace. Its findings include support for the following
assertions:
1) Higher levels of organizational heterogeneity catalyze the diffusion
process by positively influencing factors associated with internet
technology in the following areas: level of use, attitudes,
organizational support, and perceived managerial support.
2) Critical mass theory provides a set of organizational environment
variables within which traditional, individual/interpersonal diffusion
of innovation variables operate under greater or lesser constraints.
This relationship can be described by two generalizations:
iv
• High-heterogeneity organizations tend to create an environment
within which organizational factors enable the diffusion reaction to
proceed unimpeded—possibly reaching critical mass.
• Low-heterogeneity organizations tend to create an environment
within which organizational factors moderate the diffusion
reaction, either slowing or stopping its progress toward critical
mass.
3) Rather than defining divergent views of the diffusion process, critical
mass theory and traditional diffusion of innovation theory seem to
provide complementary explanations of different aspects of the
process by which interactive innovations diffuse through
organizations.

v
Table of Contents
Chapter Page
Chapter I: Introduction...........................................................................1Overview of Internet Technology ....................................................1Objectives of the Study .................................................................4Theoretic Perspective.....................................................................7
Diffusion of Innovation .............................................................7Technology Clusters ...............................................................12Assimilation Gaps ..................................................................15The New Media.......................................................................19Critical Mass Theory...............................................................21Other Studies of the Diffusion of Internet Technology .............28
Summary....................................................................................33
Chapter II: Design and Methodology .....................................................34Pretest Survey Sample and Administration..................................34Pretest Survey Instrument ..........................................................36Pretest Data Gathering................................................................42Validation with Established Scales ..............................................43Reliability of Indexes ...................................................................45Final Survey Sample ...................................................................54Final Survey Administration........................................................58Final Survey Instrument .............................................................63Final Survey Data Gathering.......................................................68Summary....................................................................................69
Chapter III: Analysis and Results..........................................................71Reliability of Indexes ...................................................................71Preliminary Analyses...................................................................79Tests of the Hypotheses...............................................................89
Organizational Heterogeneity..................................................89Heterogeneity and the Iterative Nature of InternetTechnology .............................................................................96Discussion of Hypotheses.......................................................98
Hypothesis 1...............................................................100Hypothesis 2...............................................................105Hypothesis 3...............................................................106Hypothesis 4...............................................................108Hypothesis 5...............................................................111Hypothesis 6...............................................................113
vi
Hypothesis 7...............................................................117
Chapter IV: Discussion and Conclusions ............................................121Theoretical Implications ............................................................122
Effects of Organizational Heterogeneity.................................122Relationship Between Organizational andIndividual/Interpersonal Factors ..........................................123Evidence of an Assimilation Gap...........................................124Importance of Management Support .....................................127
Limitations and Directions for Future Research ........................128External Validity ..................................................................128Pretest Sample .....................................................................129Management Support for Completing the Survey ..................130Definition of Organizational Heterogeneity ............................131Self-Selection .......................................................................131Self-Reporting ......................................................................132Multiple Survey Formats ......................................................133
Summary..................................................................................133
References..........................................................................................137
Appendixes.........................................................................................146
Appendix A: Pretest Survey Instruments.............................................147Web Survey Instrument ............................................................148E-Mail Survey Instrument .........................................................158Paper Survey Instrument ..........................................................168
Appendix B: Abdul-Gader and Kozar's Computer Alienation Scale ......178
Appendix C: Final Survey Instruments ...............................................181Web Survey Instrument ............................................................182E-Mail Survey Instrument .........................................................190Paper Survey Instrument ..........................................................198
Appendix D: E-Mail and Paper Reminder Notices ................................203E-Mail Reminder Notice.............................................................204Paper Reminder Notice..............................................................212
Appendix E: Notes on Automated Processing of Web and E-mailSurvey Responses ..............................................................................213
E-Mail Survey Instrument .........................................................213Notes on Active and Inactive E-mail Addresses ..........................213

vii
Notes on Processing E-Mail Responses ......................................214Notes on Processing Web-Based Responses...............................216Notes on Preventing Multiple Responses....................................217E-mail Input Processing Scripts ................................................220Web Input Processing Script .....................................................222
Vita .............................................................................................

viii
List of Tables
Table Page
2.1 Analysis of between-groups variance of pretest survey indexscores on web, e-mail, and paper survey instruments .................40
2.2 Mean index scores on web, e-mail, and paper pretest surveyinstruments ................................................................................41
2.3 Corrected item-total correlations, means and standarddeviations for Individual Adoption, Internet Attitude,Organizational Support, and Internet Use indexes.......................48
2.4 Inter-item correlations for the Individual Adoption,Internet Attitude, Organizational Support, and InternetUse indexes ................................................................................50
2.5 Eigenvalues resulting from principal components factoranalyses of Individual Adoption, Internet Attitude,Organizational Support, and Internet Use indexes.......................54
2.6 Population breakdown by facility.................................................55
2.7 Pretest and final survey schedule ................................................62
2.8 Analysis of between-groups variance of final survey indexscores on web, e-mail and paper survey instruments ..................66
2.9 Mean index scores on web, e-mail and paper final surveyinstruments ................................................................................67
3.1 Corrected item-total correlations, means, and standarddeviations for Individual Adoption, Internet Attitude,Organizational Support, and Internet Use indexes.......................74
3.2 Inter-item correlations for the Individual Adoption, InternetAttitude, Organization Support, and Internet Use indexes ...........76
ix
3.3 Eigenvalues resulting from principal components factoranalyses of Individual Adoption, Internet Attitude,Organizational Support, and Internet Use indexes.......................80
3.4 Mean Internet Use Index scores by educational background........81
3.5 Mean Internet Use Index scores by age........................................82
3.6 Contingency coefficients for demographic crosstab ......................84
3.7 Facility heterogeneity by occupation crosstab..............................84
3.8 Chi-square tests for facility heterogeneity by occupationcrosstab......................................................................................85
3.9 Symmetric measures for facility heterogeneity by occupationcrosstab......................................................................................85
3.10 Facility heterogeneity by computer operating system crosstab .....88
3.11 Chi-square tests for facility heterogeneity by computeroperating system crosstab...........................................................88
3.12 Symmetric measures for facility heterogeneity by computeroperating system crosstab...........................................................88
3.13 Low-heterogeneity and high-heterogeneity facilities .....................95
3.14 Mean Internet Use Index scores by facility.................................101
3.15 Planned comparison of mean Internet Use between high-and low-heterogeneity facilities .................................................101
3.16 Limited planned comparison of mean Internet Use betweenhigh- and low-heterogeneity facilities ........................................103
3.17 Planned comparison of mean depth of internet use betweenhigh- and low-heterogeneity facilities ........................................104
3.18 Limited planned comparison of mean depth of internet usebetween high- and low-heterogeneity facilities ...........................104
3.19 Mean Internet Attitude Index scores by facility ..........................106

x
3.20 Planned comparison of mean Internet Attitude Index scoresbetween high- and low-heterogeneity facilities ...........................107
3.21 Limited planned comparison of mean Internet Attitudescores between high- and low-heterogeneity facilities ................107
3.22 Mean Organization Support Index scores by facility...................109
3.23 Planned comparison of mean Organization Support scoresbetween high- and low-heterogeneity facilities ...........................109
3.24 Limited planned comparison of mean Organization Supportscores between high- and low-heterogeneity facilities ................110
3.25 Planned comparison of mean Internet Use betweenmanagers from high- and low-heterogeneity facilities ................110
3.26 Limited planned comparison of mean Internet Use betweenmanagers from high- and low-heterogeneity facilities ................111
3.27 Mean perceived management support for internet technology....112
3.28 Planned comparison of perceived management support forinternet technology between high- and low-heterogeneityfacilities ....................................................................................112
3.29 Limited planned comparison of perceived management supportfor internet technology between high- and low-heterogeneityfacilities ....................................................................................114
3.30 Beta coefficients generated by a regression analysis ofInternet Use on Organizational Support and IndividualAdoption at high and low-heterogeneity facilities .......................116
3.31 Beta coefficients generated by a regression analysis ofInternet Use on Organizational Support and IndividualAdoption at selected high and low-heterogeneity facilities..........116
3.32 Beta coefficients generated by a regression analysis ofInternet Attitude on Organizational Support and IndividualAdoption at high and low-heterogeneity facilities .......................119
xi
3.33 Beta coefficients generated by a regression analysis ofInternet Attitude on Organizational Support and IndividualAdoption at selected high and low-heterogeneity facilities..........119

xii
List of Figures
Figure Page
1.1 The assimilation gap between technology acquisition anddeployment .................................................................................16
1
Chapter I
Introduction
Overview of Internet Technology
The twentieth century has been shaped by sweeping changes in
communication technology. Successive waves of innovation—telephone,
radio, television, satellite communication, digital networks, and others—
have radically altered the way we communicate with each other. The
latest development to radically transform the communication landscape
has been the widespread adoption of internet technology and its
integration into the international communication infrastructure.
Although nationwide digital communication networks have existed in the
United States since the establishment of ARPANET by the Department of
Defense in 1969 (Zakon, 1998), the frenetic growth that characterizes the
internet as it is known today was catalyzed by two relatively recent
events. The first was the release in 1991 of Worldwide Web (web) server
software by CERN (The European Laboratory for Particle Physics). This
software was developed to mediate among a number of information
formats, thereby enabling computers to easily share information over
digital networks. The second critical event was the 1993 release of

2
Mosaic internet browser software by the National Center for
Supercomputing Applications (NCSA) at the University of Illinois, which
provided a simple means for computer users to access information on the
web. Adding to the popularity of this software was the fact that it was
distributed free of charge and was made available for most popular
personal computing platforms. The effect of these two events was to (a)
provide a single means (a browser) of accessing a number of existing
information transfer protocols (such as Telnet, FTP, Gopher), as well as
the newly established HTTP, or Hypertext Transfer Protocol), (b) establish
a common language (Hypertext Markup Language, or HTML) to be used
for sharing information on the web, and (c) enable almost anyone using a
networked personal computer to access the web.
By simplifying access to the internet, these developments triggered the
rapid adoption of internet technology in general and web and e-mail
technologies in particular. This trend of adoption began in the
"networked" community (primarily in government-related and
educational institutions that already possessed the communications
infrastructure to support internet technology) and rapidly spread to other
segments of society as access to internet connections over standard
telephone lines became more widely available. The number of people

3
currently using internet technology in some form is the subject of some
debate; however a credible estimate is provided by a December 1997
CommerceNet/Nielsen Media Research Survey, which suggests that more
than 58 million people in the United States and Canada currently use
the internet for purposes ranging from e-mail to electronic commerce
(CommerceNet/Nielsen Media Research, 1997).
Regardless of the precise number of internet users, it is clear that the
impact of this new communication technology on society is potentially
quite large. In fact, in a number of business organizations, it is already
being felt. This is evident in the preface to the CommerceNet/Nielsen
Media Research Surveys, which states that "The Internet revolution is
sweeping the globe with such swiftness that companies are desperately
trying to understand what is occurring.... Countless organizations are
exploring how they can best use the Internet, in particular the World-
Wide Web (WWW), for business applications, such as marketing, supply
chain management, public relations, customer support, product sales,
and electronic data interchange" (CommerceNet/Nielsen Media Research,
1997).

4
Because of their more robust communication infrastructure, many
businesses and academic institutions have been able to take greater
advantage of the capabilities of internet technology than the general
public. As a result, not only are these organizations making extensive
use of publicly available internet information resources, but rather than
relying on traditional internal digital communication systems, which are
often composed of disparate computer systems, they are increasingly
looking to internet technology to provide a common interface with the
information systems that make up their "intranets" (internal
communication systems based on internet technology). The extent to
which internet technology has permeated internal business
communication is reflected in the results of a March 1998 survey by RHI
Consulting, which reported that 66% of corporate chief information
officers either have an "intranet" in place or plan to have one in place
within the next three years (RHI Consulting, 1998).
Objectives of the Study
Traditional diffusion of innovation research, at least as it is articulated by
Rogers and his supporters, have placed much of the responsibility for
accepting or rejecting innovations in the hands of the individual or the
individual in the context of interpersonal channels (Rogers, 1995).
5
Clearly, Rogers and others do not discount the role played by the
organizations within which individual adoption decisions are made, but
the primary focus of traditional diffusion research has been on the
individual in the context of individual/interpersonal relationships.
Critical mass theorists, such as Markus, on the other hand, place more
responsibility for the acceptance or rejection of new media innovations on
the group or organization with which the individual is associated
(Markus, 1987). This is due, at least in part, to the interactive nature of
the innovations critical mass theorists concern themselves with. The
concept of critical mass was originally developed to integrate theories of
collective action, such as the "bandwagon effect" and the "tragedy of the
commons." The concept helps to define the conditions under which
certain reciprocal behaviors (the use of an interactive medium such as
internet technology, for example) become self-sustaining. In other words,
critical mass is the number, or proportion, of adoptees necessary to
sustain the adoption process until universal access to the interactive
medium is ensured. While the concept of critical mass is applicable to a
wide range of social phenomena, it has been applied to the fields of
communication and organization science primarily to explain the
diffusion of interactive communication innovations through organizations
and communities.

6
One of the objectives of this study is to begin to determine the nature of
the relationship between individual/interpersonal and organizational
factors in terms of how they affect the diffusion of internet technology
through organizations. The results of this analysis should help to clarify
the applicability of both traditional diffusion of innovation ideas and
critical mass theory to internet technology in particular and, perhaps, to
interactive media in general.
Another aim of this study is to consider the effect of organizational
heterogeneity on the diffusion of internet technology within
organizations. Several of the propositions Markus offers regarding critical
mass theory depend heavily on assumptions about the role of
heterogeneity in the diffusion process. Markus' initial contention that
heterogeneity of resources and interests among the members of the
community will increase the likelihood of universal access to interactive
media, such as the internet, addresses the issue of heterogeneity
directly. However, Markus also suggests that conditions favorable to
other propositions—i.e., that having high-interest and high-resource
individuals among the early users of an interactive medium is highly
favorable to the achievement of universal access in the community, and
that interventions that increase the overall level of interests and

7
resources within the community will increase the likelihood of universal
access—are more likely to occur in a heterogeneous environment.
It is also important to note that, because internet technology is evolving
at such a rapid pace, the importance of early adopters, and hence
heterogeneity, may be magnified by the fact that the adoption process is,
for practical purposes, ongoing. The resulting progression of new
applications of internet technology, if they are to be generally accepted,
must each first be adopted by individuals with the requisite resources
and interest—circumstances Markus contends would be most likely to
occur in a heterogeneous environment.
Theoretic Perspective
Diffusion of Innovation
In Rogers' definitive work on the subject, Diffusion of Innovations, he
distills hundreds of diffusion studies scattered across over a dozens of
disciplines, settling finally on what he calls "middle-range analysis," a
compromise level of theoretical complexity somewhere between "empirical
data and grand theory" (Rogers, 1995).
The importance of diffusion research, apart from the obvious importance
of theory building to understanding how things happen, is that

8
understanding the process of innovation promises to give practitioners of
innovation—"change agents" in Rogers' lexicon—the tools they need to
bring about social change in a more efficient manner, or to evaluate the
possible consequences of change before the process of innovation has
begun.
Rogers goes to great pains to demonstrate that diffusion of innovation
research is a stream bearing the mingled waters of many springs,
including communication, sociology, education, and marketing.
Anthropology is the oldest of these merged diffusion traditions, and
possesses a relatively long tradition of emphasizing the social
consequences of the adoption of innovations, dating back at least to the
1930s. Communications and marketing are the two most recent
additions, both tracing their diffusion roots back only to the early 1960s
in agricultural and consumer studies, respectively (Rogers, 1995).
Diffusion of innovation is characterized by three stages: (1) invention, the
development of a new idea, (2) diffusion, the communication of the idea
through the social system, and (3) consequences, the changes that go
along with the adoption or rejection of the new ideas. The recognition of
the need for innovation can arise from within a social system or from
9
without, as can the impetus for pursuing or enacting change. The source
of the innovation, as well as the impetus for its adoption or rejection,
plays a major role in the success of the innovation, the channels it is
communicated through, and its rate of adoption. Borrowing liberally from
several other general communication models, Rogers' diffusion model
considers the "innovation, which is communicated through certain
channels, over time, among the members of a social system." These
elements are described briefly below.
Innovation - Diffusion theory suggests an innovation, is an idea, object,
or way of doing things that is perceived to be new. Innovations, such as
internet technology, it is further suggested, are accepted or rejected on
the basis of the following characteristics (Rogers, 1995):
• Relative advantage - the degree to which an innovation is perceived as
better than the idea it supercedes
• Compatibility - the degree to which an innovation is perceived as
being consistent with existing values, past experiences and needs of
potential adopters
• Complexity - the degree to which an innovation is perceived as
difficult to understand and use

10
• Trialability - the degree to which an innovation may be experimented
with on a limited basis
• Observability - the degree to which an innovation or the results of an
innovation are visible to others
Communication Through Channels - A channel is simply a means of
communicating with another individual. Rogers suggests that certain
types of channels are better than others for certain purposes. For
example, media channels are effective in communicating knowledge of an
innovation, while interpersonal channels are effective in influencing
decisions to adopt or reject innovations. Rogers also notes that, when
they have a choice, people prefer to communicate through familiar
channels, that is, with people like themselves. This sameness may
include similarities in location, work, interests, values, and beliefs, which
result in more efficient communication. In the case of internet technology
in an organizational setting, this propensity suggests that technology
would be more likely to diffuse throughout the organization if it were
adopted by a wide, representative range of individuals and disseminated
through their peers, rather than being introduced at a single point or a
set of homogeneous points.

11
Time - Based on studies of diffusion processes conducted across a wide
range of disciplines, Rogers breaks the diffusion process into five main
steps: knowledge, persuasion, adoption, implementation, and
confirmation. These steps suggest that merely introducing an innovation
into an organization—or even ensuring that it is adopted and applied—
isn't enough to guarantee that the innovation will be adopted over the
long term. Only a positive decision for the adopted technology in the
"confirmation" stage ensures that the technology will become integral to
the adopting group or organization.
Social System - The structure of a social system can speed or impede the
diffusion of innovations in the system. Rogers identifies five key
characteristics of social systems with respect to diffusion research: social
structure, system norms, opinion leaders and change agents, types of
innovation decisions, and the consequences of innovation. In an
organizational setting, these characteristics suggest that people, power,
infrastructure, intra-organizational relationships, and politics can all
influence the decision to adopt a new technology.
While Rogers' traditional approach to diffusion of innovation research is
the dominant approach in the field of communications, there are

12
derivative concepts that not only augment traditional diffusion theory,
but provide the opportunity for additional insights into the factors that
affect the diffusion of innovations through organizations.
Technology Clusters
Rogers and others suggest that technologies are sometimes adopted as
part of a cluster or package consisting of several technologies, rather
than individually. The most frequently cited example of this behavior is
Silverman and Bailey's 1961 study of a cluster of innovations adopted by
Mississippi corn farmers to increase crop yields: the use of fertilizer,
hybrid seed, and thicker planting (Silverman and Bailey, 1961).
According to Rogers, this concept arises from the way in which
innovations are viewed by their users. "Innovations," says Rogers, "are
not viewed singularly by individuals. They may be perceived as an
interrelated bundle of new ideas. The adoption of one new idea may
trigger the adoption of several others. A technology cluster consists of
one or more distinguishable elements of technology that are perceived as
being related" (Rogers, 1995).
Internet technology can be viewed as a cluster of technologies on at least
two levels. First, internet browser software is, in a sense, a bundle of

13
information interfaces. A contemporary browser enables the internet user
to access information developed specifically for the web, as well as that
developed for web precursors, such as Gopher, FTP, Telnet, and others.
In addition, the use of an internet browser is very often accompanied by
the use of electronic mail. This is reflected in the results of the previously
cited December 1997 CommerceNet/Nielsen Media Research Survey,
which estimated that there were 59 million electronic mail users in the
United States and Canada—80% of whom used the web as well
(CommerceNet/Nielsen Media Research, 1997).
The magnitude of the of the technology cluster associated with adopting
internet technology will vary from organization to organization,
depending on the technology in place at the time of its adoption. As Nord
and Tucker note in Implementing Routine and Radical Innovation, "Routine
innovation is the introduction of something that while new to the
organization is very similar to something the organization has done
before. A radical innovation, in addition to being new to the organization,
is very different from what the organization has done previously, and is
therefore apt to require significant changes in the behavior of employees
and often the structure of the organization itself" (Nord and Tucker,
1987). In the case of internet technology, an organization accustomed to
14
using networked information systems and personal computers might
consider the transition to using internet technology fairly routine,
requiring the adoption of a fairly small cluster of new technologies. On
the other hand an organization unaccustomed to any computer use
would consider the same transition to be a radical departure from
business as usual, requiring the adoption of an entire digital information
infrastructure, as well as internet-related software tools.
Another impact of internet technology being a cluster of technologies,
rather than a single innovation is that, while a single innovation may be
implemented or not, a cluster of technologies provides considerably more
latitude in terms of implementation. For example, an individual could
adopt the use of internet technology, but choose only to use it's e-mail
capabilities. One effect of users having the option of partially
implementing a cluster of technologies is that measurements of internet
use should take into account both quantitative factors, such as hours of
use per week, as well as qualitative factors, such as the sophistication of
the tasks the technology is used for.
15
Assimilation Gaps
Another concept closely related to traditional diffusion of innovation
research is the "assimilation gap." The term, "assimilation gap" refers to
the time differential, or lag, between the acquisition of a technology and
its actual use or deployment. This gap may be visualized by thinking of
the S-shaped (or sigmoid) curve that is often used to illustrate the
diffusion of an innovation over time. Fichman and Kemerer note that
similar S-shaped curves may be constructed to illustrate both the
acquisition of an innovation over time and the deployment of an
innovation over time (see Figure 1.1) (Fichman and Kemerer, 1995). Near
the origin of the time (horizontal) axis, these curves may be fairly close
together because some early acquirers are likely to be early deployers.
Rogers provides support for this supposition by asserting that the
"salient value for innovators [individuals who first adopt a technology] is
venturesomeness, due to a desire for the rash, the daring, and the risky"
(Rogers, 1995). Late adopters, or "laggards," as Rogers refers to them,
have a relatively long decision process with "adoption and use lagging far
being awareness/knowledge of a new idea" (Rogers, 1995). If all acquirers
deployed the innovation in about the same time frame, the two curves
would be separated by a constant distance. However, if deployment is

17
Acquisition
Level of Adoption
Deployment
Time
Figure 1.1 The assimilation gap between technology acquisition anddeployment (adapted from Fichman and Kemerer, 1995)
delayed or non-existent among some significant fraction of later
acquirers, the curves become more widely separated over time. This
increased distance is the assimilation gap.
An illustration of this effect is provided in Liker, Fleischer, and Arnsdorf's
1992 study of the acquisition and deployment of computer-aided design,
or CAD, software. The authors interviewed CAD users and managers
from six companies known to be heavy CAD users regarding the extent to
which they took advantage of the capabilities of their CAD systems
(Liker, Fleischer, and Arnsdorf, 1992). In general they found that
organizations tended to "simply replaced old tools with new ones—'move

17
out the drawing boards and give the drafters a CAD system'," rather
than taking advantage of the "high-level" features of the software. High-
level features included capabilities, such as using three-dimensional
modeling techniques to help to ensure that parts fit well with one
another later on in the design process. The authors concluded that
individuals in charge of deploying CAD in these organizations were
unable to "see the big picture" of how CAD could fit into their design
processes. Instead they took "the path of least resistance" by replacing
traditional tasks with their CAD equivalents and failing to take advantage
of CAD's higher-level features.
In light of these findings, Fichman and Kemerer emphasize that simply
looking at the acquisitions curve (or, presumably, any other nominal
measure of adoption) can present "an illusory picture of the diffusion
process—leading to potentially erroneous judgments...about the
robustness of the diffusion process already observed, and the
technology's future prospects" (Fichman and Kemerer, 1995). This
caution may be particularly appropriate for studies of the diffusion of
clustered technologies, such as internet technology. When a cluster of
technologies is adopted, it is possible to gain a marginal benefit, at least
in the short term, by implementing those components of the cluster

18
requiring the smallest investment of time, training, and money. For
example, a user of internet technology may find that receiving e-mail is
useful and requires little effort, but is unwilling, or is not afforded the
necessary resources, to apply to use some of the higher-level capabilities
of internet technology, such as using the browser interface to query on-
line databases, conducting internet or intranet searches, etc. The
possibility of partial implementation suggests that nominal measures of
internet technology use, such as the amount of time spent using internet
technology, can mask the actual extent to which the technology is
deployed in an organization—five hours a week reading e-mail does not
represent the same level of technology deployment as five hours a week
querying on-line databases.
In the case of rapidly evolving innovations, such as internet technology,
which have nearly constant implementation cycles, the gap between
early, complete implementers and late, partial implementers has the
potential to widen over time, making the technologically rich
progressively richer and the poor poorer.
19
The New Media
Internet technology is a vehicle for several examples of the so-called "new
media," such as the web and e-mail, among others. Rogers identifies the
following three qualities of the new media that distinguish them from
their predecessors: interactivity, de-massification, and asynchroneity
(Rogers, 1986). De-massification refers to the opportunity for users of a
medium play a larger role in determining the content they receive. For
example, rather than viewing all of the material on a particular web site,
web users can use a search engine to locate resources related to a
particular subject at that site or at hundreds or even thousands of
different sites. This enables them to bypass the constraints of content
providers and interact directly with the information they're interested in.
Rogers notes that there are parallels to this phenomenon in traditional
media: "a certain degree of the control of mass communication systems
moves from the message producer to the media consumer. The reader of
The Sunday New York Times also has a type of control in choosing to
read certain news items and ignore the rest." (Rogers, 1986). However,
the practical extent of the control exercised by the internet user is far
greater, enabling the user to read not only the news items of interest in
the Sunday Times, but also related items in on-line publications around
the world.

20
Asynchroneity refers to the ability to send a message and not have to
wait for the receiving party to respond. For example, writing a letter and
mailing it is a form of asynchronous communication, as is sending e-mail
or leaving a message on an answering machine. Since the time of Rogers'
characterization of new media as asynchronous; however, the
synchronous communication capabilities of internet technology-based
new media have become considerably more developed, comprising
"internet telephone" services, chat rooms, and interactive video
applications, among others.
The quality of the new media that is most important for the purposes of
this study is interactivity. Rogers defines interactivity as "the extent to
which participants in a communication process have control over, and
can exchange roles in, their mutual discourse" (Rogers, 1986).
Interactivity allows information to be sought out and exchanged, rather
than merely received. As noted by Markus, interactive media also have
characteristics that are not shared by many other media, or many other
innovations of any sort: "First, widespread usage creates universal
access, a public good that individuals cannot be prevented from enjoying,
even if they have not contributed to it. Second, use of interactive media

21
entails reciprocal interdependence, in which early users are influenced
by later users as well as vice versa."
Several of these distinctive characteristics of the new media also play
important roles in critical mass theory, which is described below.
Critical Mass Theory
Another perspective on interactive media is provided by proponents of
critical mass theory. Rather than challenging the assertions of traditional
diffusion researchers, critical mass theorists consider situations in which
individual adoption decisions may be less important in determining the
probability and extent of diffusion than factors more closely related to in
the individual's social system or organization.
Critical mass theory was developed by sociologists Oliver, Marwell, and
Teixeira in 1985 to integrate theories of collective action regarding
"phenomena variously labeled 'snob and bandwagon effects,' 'the free
rider problem,' and 'the tragedy of the commons,' by economists and
sociologists" (Markus, 1987). Generally speaking, the concept of critical
mass helps to define the conditions under which certain reciprocal
behaviors, such as the use of interactive media, become self-sustaining.
22
Specifically, critical mass theory has also been applied to the field of
communications to explain the diffusion of interactive communication
technologies through businesses, organizations, and other social groups.
A number of these studies have addressed the use of electronic mail and
telephone messaging services (for example, Markus, 1987, 1994; Allen,
1988). However, to date few, if any, have focused on the diffusion of
internet technology in an organization or a group of organizations. The
rarity of such studies may be due, in part, to the relatively recent
increase in the use of internet technology and the difficulty of locating
and sampling a sufficiently large and well-defined population of internet
users for study.
There is a broad consensus among all types of diffusion researchers that
an individual most often considers adopting an innovation because it
provides the individual with some sort of net benefit. However, the
benefit derived from the adoption of an interactive technology, is largely
dependent not on the individual's efforts, but on how others respond to
those efforts. A single electronic mail user in an organization, to cite an
extreme example, will accrue no benefit from his or her adoption of the
innovation until others adopt the innovation as well, allowing reciprocal
interaction to occur. In addition, electronic mail users will not receive all

23
of the benefits of the innovation until a very large fraction of the entire
organization has also adopted the innovation.
According to Markus, "the individual considering the adoption of an
interactive medium is very likely to choose not to use it unless a sizeable
number of his or her communication partners are already using it." This
"sizeable number" is what sociologists Oliver, Marwell, and Teixeira, as
well as Markus and others have referred to as "critical mass." In nuclear
physics, critical mass is the amount of nuclear material necessary to
sustain a nuclear reaction. In the diffusion of interactive technologies,
critical mass is the number, or proportion, of adoptees necessary to
sustain the adoption process until universal access to the interactive
medium is ensured.
The difference between this type of interaction and Rogers' collective- and
authority-type decisions is that there is no formalized conversation,
negotiation, or decision-making process among the user, the community,
and/or the authorities (Rogers, 1995). The interactions themselves, or
rather the extent and frequency of these interactions, are what drive the
use of the medium toward either universal access or abandonment.
24
To reach critical mass, however, a sizeable number of individuals must
commit to using the technology with no certainty of obtaining a benefit
for themselves. Oliver, et al., note that this is more likely to happen if "A
positive correlation between interests and resources" exists because "it
increases the probability of there being a few highly interested and highly
resourceful people who are willing and able to provide the good for
everyone" (Oliver et al., 1985). Markus adds that "heterogeneity
[variation] in interests and resources is believed to affect the probability,
extent, and likelihood of collective action" because it provides some
individuals with a greater likelihood of benefiting, and therefore with
more incentive to act, than others.
As noted above, the rapid evolution of internet technology magnifies the
importance of early adopters, and hence that of heterogeneity. Morris
and Ogan also recognized the dynamic nature of interactive media in
their 1996 study of the internet as a mass medium, contending that, in
order for participation in an interactive medium like the internet to be
maintained, a shared pool of data must be established and renewed by
individuals with the interest or resources to contribute new information.
"If no one contributes, the data base cannot exist. It requires a critical

25
mass of participants to carry the free riders in the system, thus
supplying this public good to all members..." (Morris and Ogan, 1996).
Markus offers five propositions to (a) describe the conditions which may
sustain the diffusion reaction until critical mass is reached and (b) guide
empirical investigations of the phenomenon:
1) There are only two stable states of interactive medium usage in a
community: all or nothing. Either usage will spread to all members of
the community or no one will use the medium either because no one
started using it or because usage fell off in the absence of reciprocity.
2) Factors that reduce the number of resource units each adopter must
contribute to maintain communication discipline for an interactive
medium will increase the likelihood of universal access in the
community.
3) Heterogeneity of resources and interests among the members of the
community will increase the likelihood of universal access.

26
4) Having high-interest and high-resource individuals among the early
users of an interactive medium is highly favorable to the achievement
of universal access in the community.
5) Interventions that increase the overall level of interests and resources
within the community will increase the likelihood of universal access
(Markus, 1987).
These five propositions emphasize the key roles resource availability and
organizational heterogeneity play in the adoption of interactive
technologies—and how the two factors are related. Markus identifies two
types of resources: an individual willingness to reciprocate—to use the
technology—and operational resources, such as hardware and software
in this instance, and the knowledge or training necessary to use the
technology.
In recent years, several studies of computer-related technologies and
information technologies have found that the availability of resources,
particularly operational resources, is tied to managers' attitudes toward
the technology the resources are supporting. For example, in his 1994
study of white-collar computerization, Long writes: "If top management

27
favours WCC [white-collar computerization], it is more likely to happen
than if it does not. There are two main reasons. First, top management is
in a position to determine the organizational resources that will be
devoted to the innovation. Second, top management serve as opinion
leaders, to whom many employees at lower organizational levels will look
for guidance when deciding whether to adopt the new innovation" (Long,
1994).
This conclusion is echoed by Rogers, who notes that the composition of
the community of adopters of interactive technology can influence the
level at which critical mass is attained: "a small number of highly
influential individuals who adopt a new idea may represent a stronger
critical mass than a very large number of individual adopters who have
little influence" (Rogers, 1995). This highly influential group may also be
in a position to "provide resources for the adoption of an interactive
technology and thus lower individuals' perceived cost of adopting"
(Rogers, 1995).
In Babcock, Bush, and Zhiyong's 1995 study of executive use of
information technology, the authors note both that "[all executives
studied] reported a considerable degree of involvement in decision

28
making concerning information technology acquisition" and that
"organizations that enjoy a higher level of information technology use
tend to have managers who have positive attitudes toward information
technology" (Babcock, Bush, and Zhiyong, 1995). Similarly, in their 1995
study of technology investment decisions, Abdul-Gader and Kozar found
that "if two managers equally think that (1) computers are needed in
their departments and (2) computers are within their departments'
budgets, the manager who is confident that computers will not challenge
his/her control is more likely to purchase than the one who perceives
threats from computers" (Abdul-Gader and Kozar, 1995).
Markus also contends that organizational heterogeneity is intimately tied
to resource availability, in that having heterogeneity of interests and
resources in an organization improves the chances that high-interest
and/or high-resource individuals will become interested in a given
interactive medium, thus improving the likelihood that others will adopt
the new technology and that critical mass will be reached.
Other Studies of the Diffusion of Internet Technology
Over the last twenty years, a number of studies have explored the
diffusion of the use of computers, various forms of information
29
technology, and internet precursors, such as BITNET and electronic
messaging systems.
In a study of the evolution of BITNET, an inter-university electronic
communication system established in 1981, Gurbaxani found that the
rate of adoption closely resembled the S-shaped curved characteristic of
critical mass and other diffusion of innovation studies. In Gurbaxani's
estimation, critical mass for BITNET was reached shortly after the
University of California's Berkeley campus was added to the system, after
which the number of connections added to the system doubled every six
months (Gurbaxani, 1990). Rogers suggests that the addition of a highly
respected institution like the University of California at Berkeley (which
presumably had a large number of professional and social relationships
with other universities) triggered the cascade of adoption that followed by
increasing the reciprocal interdependence of the system (Rogers, 1995).
As the popularity of electronic messaging grew, it spawned enhanced
versions of the technology. Among these was computer conferencing—a
technology that enabled messages to be exchanged among individuals
and/or groups and also provided a record of these exchanges that could
be accessed at a later date. In a 1984 study of influences on the adoption

30
of computer conferencing, Rice found that the factors that influenced
people to use computer conferencing included the number of people
already on the system, the individual's anticipated level of use, the
priority of tasks to be performed on the system, access to the system, a
perceived need to communicate, and the existence of an advocate for the
group.
With the advent of videotext and similar newsreading services in the
early 1980s, electronic messaging began taking on some of the
characteristics of a broadcast medium. In their 1984 overview of rival
theories of newsreading, Dozier and Rice considered the impact of
innovation and user characteristics on the diffusion of videotext and
teletext, as well as obstacles to its diffusion. They found that user
acceptance of electronic news services depended to a great extent on the
user's purpose for reading the news (business or pleasure). They also
noted that design of the news service influenced whether it was
embraced by purposive or pleasure-seeking reader. Finally, they
determined that concern over costs (for access and hardware),
uncertainty about infrastructure (the availability of cable connections),
and incompatible standards across electronic text systems all had the
potential to slow the use of videotext.

31
By the mid-1990s, momentum in the area of online communication had
clearly shifted to the internetand to the web in particular. One of the
earliest and most comprehensive attempts to examine internet use was
the series of World Wide Web User Surveys conducted by the Georgia
Institute of Technology's Graphics, Visualization, & Usability (GVU)
Center. To date, nine GVU studies have been conducted, collecting data
on general demographics, technology demographics, web and internet
usage, and internet commerce, among other areas. According to GVU,
the point of the studies is to "characterize WWW users as well as
demonstrate the Web as a powerful surveying medium.... This interface
also enables users to complete our survey at their own convenience, and
answer questions in a low-overhead fashion" (Graphics, Visualization, &
Usability Center, 1998). It should be noted that, while the GVU surveys
provide some direction for conducting survey research on the internet,
they don't directly address issues related to the diffusion of internet
technology. Also, while the GVU studies have done a great deal to
promote internet-based survey research, one of the greatest strengths of
their surveys, convenience, is also one of their biggest liabilities. Rather
than devising a method of conducting a systematic survey of internet
users, GVU researchers opted to make the survey widely accessible on
the internet (in order to ensure the most representative sample possible

32
under the circumstances). They then employed a number of correction
techniques to ameliorate the effects of this non-probabilistic sampling
method. GVU researchers, Pitkow and Kehoe, acknowledge that these
methods reduce their ability to generalize from the surveys' results to the
entire internet user population. They also suggest that, until a set of
validation and correction metrics for this sort of non-probabilistic
research is more widely accepted, a conservative interpretation of the
data is called for (Pitkow and Kehoe, 1996).
In 1996, LaRose and Hoag reported on one of the few studies to consider
internet use from a diffusion of innovation perspective. In their phone
survey of 233 businesses on the role of innovation clusters (innovations
that are adopted as a package, or cluster) in promoting internet use
within organizations, the authors found that internet use was more
closely related to the previous adoption of certain infrastructure-related
innovation clusters (such as large area networks, wide area networks,
microcomputers, and computer workstations) than it was to measures of
innovation attributes, and various organizational factors, such as size,
the existence of a "champion" for the technology, and management
support (LaRose and Hoag, 1996). The LaRose and Hoag study did not
consider what factors, beyond those associated with innovation clusters,

33
influenced the diffusion of internet use within the organizations studied,
nor did they consider the effect of management support for internet use
on the acquisition of the infrastructure necessary to support this
technology.
Summary
Studies of the process of the diffusion of technological innovation over
the last 70 years have focused on innovations ranging from steel axes to
internet technology and have demonstrated that an innovation's ultimate
acceptance or rejection and the extent of its impact on a social group is
heavily influenced by the manner in which it is introduced and applied.
The study described in the chapters that follow will consider the ongoing
diffusion of internet technologies at six U. S. Department of Energy
(DOE) facilities operated by Lockheed Martin Corporation's Energy and
Environment Sector and will attempt to determine how the
individual/interpersonal factors frequently cited by traditional diffusion
of innovation researchers and the organizational factors cited by critical
mass theorists expedite or inhibit this process.
34
Chapter II
Design and Methodology
This study consists of a pretest survey and a final survey. The pretest
was used primarily as a test bed for the survey instrument and the data-
gathering procedures. Both surveys are described in detail below.
Pretest Survey Sample and Administration
A pretest survey was conducted between July 9, 1997 and July 18, 1997
to validate and focus the final survey instrument, as well as to serve as a
dry run for the web, e-mail, and paper versions of the survey instrument
(particularly the programming that enabled data to be collected from the
web and e-mail instruments automatically). Requests to participate in
the survey were sent to all 129 members of the Computing, Information
and Networking Division at Oak Ridge National Laboratory in Oak Ridge,
Tennessee. Using an alphabetical list of division members, and
alternating among the three survey formats, (web, e-mail, and paper), 43
potential respondents were sent e-mail messages directing them to a
web-based survey; 43 were sent e-mail surveys, and 43 were sent paper
surveys. All members of the pretest group had access to e-mail and the

35
internet. Seven days after the initial solicitation, a reminder message
was sent to individuals who had originally received e-mail solicitations
for either the web-based or e-mail survey; a reminder survey was sent to
those who had initially received paper surveys.
The 129 pretest survey solicitations generated 55 responses (22 web, 17
e-mail, 16 paper)a response rate of 42.7%. The demographic make-up
of the respondents was relatively diverse. Occupations included
administrative (7.3%), clerical (3.6%), computer-related (36.4%),
managers (3.6%), professionals (21.8%), and other (7.3%). Twenty
percent of the respondents chose not to respond to the "occupation" item.
Respondents included 24 females, 15 males, five individuals who
preferred not to indicate their gender, and 12 who did not provide a
response to the "gender" item. Ages of respondents ranged from the
20−29 bracket to the 50−59 bracket, with the largest number being
concentrated in the 30−39 bracket. Overall, the pretest survey
respondents were somewhat younger and somewhat more likely to be
female than final survey respondents.

36
Pretest Survey Instrument
The pretest survey instrument consists of six sections: five specialized
indexes (described below), and a demographic information section. The
individual items that make up all of the indexes except the Internet Use
Index employ five-point Likert-type scales, ranging from "strongly agree"
to "strongly disagree." The Internet Use index employs a multiple-choice
format with responses graduated in order of amount or sophistication of
use. Respondents' scores for each of the indexes were determined by
calculating the mean score for each set of items. The web, e-mail and
paper versions of the pretest survey instrument are reproduced in
Appendix A.
The first section of the pretest survey is the Individual Adoption Index. It
includes two items for each of Rogers' five "characteristics of
innovations": relative advantage, compatibility, complexity, trialability,
and observability (Rogers, 1995). The Individual Adoption Index is
designed to measure the extent to which internet use in the workplace is
influenced by the individual/interpersonal factors frequently cited by
traditional diffusion of innovation researchers.

37
The second section of the pretest survey is the Internet Attitude Index. It
is made up of 18 items based on Abdul-Gader and Kozar's Computer
Alienation Scale (Abdul-Gader and Kozar, 1995); however, it focuses on
respondent's attitudes toward internet technology, rather than
computers in general. Three items from the Computer Alienation Scale
didn't translate particularly well into the "internet attitude" construct, so
those items aren't reflected in the Internet Attitude Index.
The third section of the survey pretest is Abdul-Gader and Kozar's 21-
item Computer Alienation Scale (Abdul-Gader and Kozar, 1995).
Originally designed to examine "decision makers' attitudes and internal
beliefs, especially the construct of alienation, with regard to the broader
context of information technology investment decisions" (Abdul-Gader
and Kozar, 1995), the Computer Alienation Scale was included in the
pretest to provide a means of documenting that the constructs of
"computer alienation" and "internet attitude" are relatively closely
correlated, thereby providing a degree of validation for the Internet
Attitude section of the survey.
The fourth section of the pretest survey is the Organizational Support
Index. It is made up of 10 items based on the five propositions offered by

38
Markus with respect to the probability and extent of the diffusion of
interactive media usage within communities (see Chapter I) (Markus,
1987). Two index items address each of Markus' propositions. The
Organizational Support Index is designed to measure the extent to which
internet use in the workplace is influenced by the organizational factors
frequently cited by critical mass theorists.
The fifth section of the pretest survey is the Internet Use Index. This
index includes six items which measure aspects of individual internet
use, including measures of frequency, duration, and the type and
sophistication of tasks. These items are fairly generic measures of
internet use and are not based on any other instrument in particular.
However, they have aspects in common with a number of internet use
surveys.
The sixth and final section of the pretest survey is made up of eight
demographic items and two short-answer questions. Demographic
questions were kept to a minimum in order not to cause respondents
undue concern about the anonymity of their responses. The demographic
information solicited in this section includes: facility, occupation, field of
formal education, gender, age, computer operating system, primary

39
internet browser, and sources of information about new internet
resources. The two short-answer questions are "What would it take to
make internet technology more useful in your everyday work?" and "Are
there any other comments you'd like to pass along concerning internet
technology?" The primary purpose of these short-answer questions is to
provide feedback to the organizations participating in the study.
The three versions of the pretest survey instrument (web, e-mail, and
paper) are made as similar as is practical, given the limitations of their
respective media. All of the survey instruments are reproduced in
Appendix A. The wording and order of the questions is identical in all
versions, and the instructions are very similar, with the exception of
media-specific variations. For example, on the paper version of the
survey, participants are asked to "place an 'X' in the circle"; on the web
version, they are asked to "click one of the small, round buttons"; and on
the e-mail version, they are asked to "enter your answer on the same line
as the answer pointer."
An ANOVA was conducted to compare the pretest scores of the five
indexes across the three media (web, e-mail, and paper). The results of
this comparison are shown in Table 2.1. The results suggest that there
40
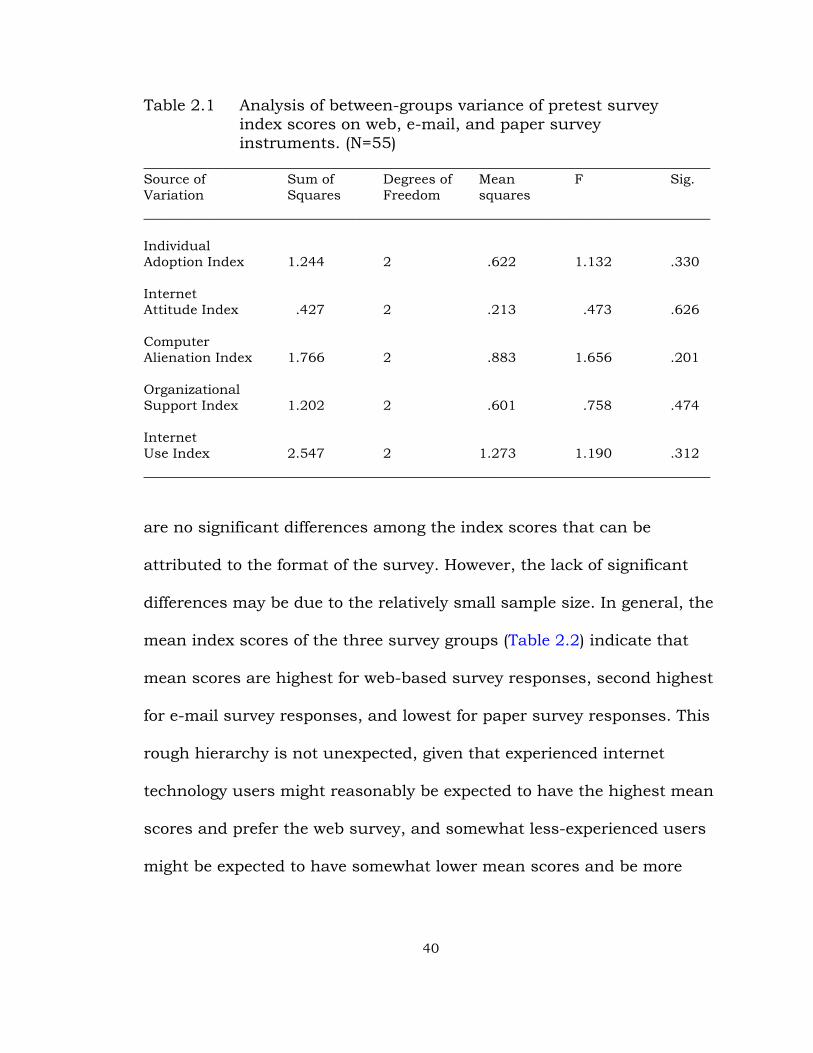
Table 2.1 Analysis of between-groups variance of pretest surveyindex scores on web, e-mail, and paper surveyinstruments. (N=55)
_______________________________________________________________________Source of Sum of Degrees of Mean F Sig.Variation Squares Freedom squares_______________________________________________________________________
Individual Adoption Index 1.244 2 .622 1.132 .330
InternetAttitude Index .427 2 .213 .473 .626
ComputerAlienation Index 1.766 2 .883 1.656 .201
OrganizationalSupport Index 1.202 2 .601 .758 .474
InternetUse Index 2.547 2 1.273 1.190 .312_______________________________________________________________________
are no significant differences among the index scores that can be
attributed to the format of the survey. However, the lack of significant
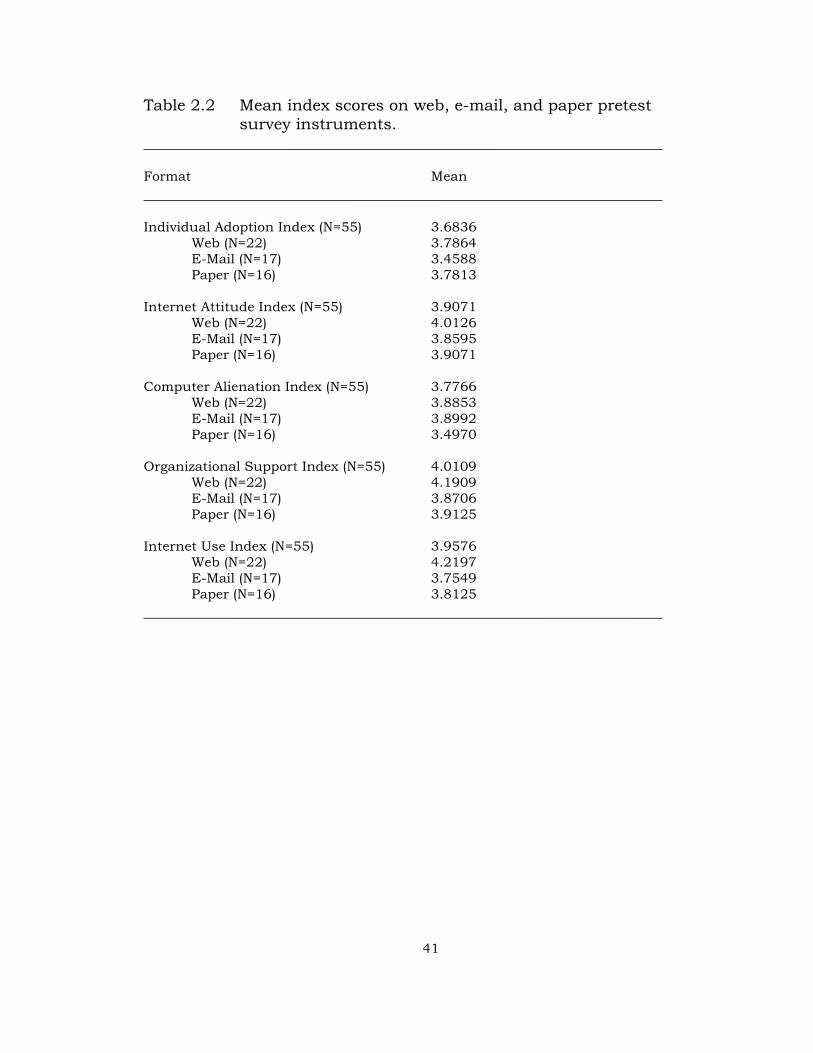
differences may be due to the relatively small sample size. In general, the
mean index scores of the three survey groups (Table 2.2) indicate that
mean scores are highest for web-based survey responses, second highest
for e-mail survey responses, and lowest for paper survey responses. This
rough hierarchy is not unexpected, given that experienced internet
technology users might reasonably be expected to have the highest mean
scores and prefer the web survey, and somewhat less-experienced users
might be expected to have somewhat lower mean scores and be more
41
Table 2.2 Mean index scores on web, e-mail, and paper pretestsurvey instruments.
_________________________________________________________________
Format Mean_________________________________________________________________
Individual Adoption Index (N=55) 3.6836Web (N=22) 3.7864E-Mail (N=17) 3.4588Paper (N=16) 3.7813
Internet Attitude Index (N=55) 3.9071Web (N=22) 4.0126E-Mail (N=17) 3.8595Paper (N=16) 3.9071
Computer Alienation Index (N=55) 3.7766Web (N=22) 3.8853E-Mail (N=17) 3.8992Paper (N=16) 3.4970
Organizational Support Index (N=55) 4.0109Web (N=22) 4.1909E-Mail (N=17) 3.8706Paper (N=16) 3.9125
Internet Use Index (N=55) 3.9576Web (N=22) 4.2197E-Mail (N=17) 3.7549Paper (N=16) 3.8125
_________________________________________________________________

42
comfortable with the e-mail survey. The paper survey was sent only to
individuals without active e-mail addresses, so it might reasonably be
assumed that this group would be the least experienced users of internet
technology and, therefore, have the lowest mean scores.
Pretest Data Gathering
The web and e-mail survey instruments are designed to pass responses
to several computer programs, which parse the responses and compile
them into a data matrix. The pretest provided an opportunity to test
these computer programs. During the pretest, both the web and e-mail
response parsing went fairly smoothly, although a few problems occurred
in recording comments from the e-mail version of the survey instrument.
All paper responses were entered into a data matrix manually by a single
coder.
All the surveys received in the pretest were either blank or filled out more
or less completely. If the survey was blank it was discarded. All other
survey results were tabulated. If a respondent provided multiple
responses to a single item on e-mail or paper surveys (this was
impossible to do on the web version of the survey), the item was coded as
a zero (no response). If the respondent provided an illegible or

43
unintelligible response on an e-mail or paper survey (this was impossible
to do on the web version of the survey), the item was coded as a zero (no
response).
Validation with Established Scales
Because the widespread use of internet technology is a relatively new
phenomenon, little research has been conducted on factors that
influence the use of internet technology in the workplace. There have,
however, been several studies that have concerned themselves with
internet use in general, the most prominent being the ongoing series of
surveys conducted by the Graphics, Visualization, & Usability (GVU)
Center of the Georgia Institute of Technology. While the GVU studies
have garnered considerable attention, they are (a) based on self-selected
samples and (b) don't employ scales or indices in their analysis. No other
study of internet use was found to have employed an index or scale that
could be used to validate the results of any part of the current study.
Despite the lack of appropriately similar studies of internet use, an
adequate model for constructing a scale to measure individuals' attitudes
toward internet technology was found in Abdul-Gader and Kozar's 1995
study of the impact of computer alienation on information technology
investment decisions. This Computer Alienation Scale was designed by

44
the authors to examine "decision makers' attitudes and internal beliefs,
especially the construct of alienation, with regard to the broader context
of information technology investment decisions" (Abdul-Gader and Kozar,
1995). The Computer Alienation Scale was based on a number of
previously developed alienation scales, including scales measuring
computer alienation (Ray and Minch, 1990) and computer anxiety
(Simonson, et al., 1987). The Computer Alienation Scale is reproduced in
Appendix B.
Abdul-Gader and Kozar note that Howard and Smith (1986) consider
"technological alienation" to be a manifestation of computer anxiety. This
suggests that there may be a relationship between the attitude people
have toward computers and the attitude they have toward internet
technology. At present, using internet technology requires a great deal of
interaction with computers. While the software interfaces currently
available to internet users are considerably more accommodating to
users than those available in 1986 (the year of Howard and Smith's
study), it is reasonable to assume that the prospect of using a computer
to access the internet remains somewhat daunting to many individuals.

45
As mentioned above, three items from Abdul-Gader and Kozar's
Computer Alienation Scale didn't translate particularly well into the
"internet attitude" construct, so those items aren't reflected in the
Internet Attitude Index. These items were:
• Computers dehumanize society by treating everyone as a number.
• I clearly understand what input computers want.
• I sometimes get nervous just thinking about computers.
The remaining items were reworded to fit the construct of "internet
attitude."
Correlation analysis of the pretest results yielded a Pearson's correlation
coefficient of .72 (p<.01) between the Internet Attitude Index and the
Computer Alienation Scale, indicating that the two instruments are fairly
highly correlated.
Reliability of Indexes
After the pretest data were collected, the Individual Adoption, Internet
Attitude, Organizational Support, and Internet Use indexes were tested
for internal consistency by calculating an alpha coefficient, or Cronbach's
reliability index, for each. No reliability statistics were calculated for the

46
Computer Alienation Scale because it was included in the pretest only as
a test of validity for the Internet Attitude Index. Results of that test are
discussed below. Alpha coefficients for the remaining four indexes are as
follows: Individual Adoption (.8348), Internet Attitude (.8997),
Organizational Support (.9041), and Internet Use (.9066). The minimum
alpha score for an index to be considered internally consistent is
accepted to be .70 (Nunnally, 1978). This level of consistency indicates
that each item is contributing to the measurement of the quality or
construct in question. All four indexes exceed this standard.
Corrected item-total correlations were also obtained. On the basis of the
corrected item-total scores, three items having relatively weak
correlations were eliminated from the Individual Adoption Index, and
nine items having relatively weak correlations or requesting seemingly
redundant information were removed from the Internet Attitude Index.
Alpha coefficients were re-calculated for these two indexes, yielding the
following results: Individual Adoption (.8441), Internet Attitude (.9433).
These deletions helped both to focus the indexes by increasing their
internal consistency and to reduce the total number of questions in a
fairly lengthy survey.

47
After the deletions were made, item-total correlations were again
calculated as an additional check on the reliability of the indexes. These
correlation scores consider both individual items and entire indexes in
terms of the variance they explain. Items with high item-total correlations
increase the variance explained by the index. Nunnally suggests that
each item should have an item-total correlation of at least .20 to be
included in the index and that the index should have a mean item-total
correlation of at least .40 (Nunnally, 1978). All item-total correlations
exceed Nunnally's recommended standards.
The mean item-total correlations for the four indexes are as follows:
Individual Adoption Index (.6089), Internet Attitude (.7866),
Organizational Support (.6659), and Internet Use (.7483). Item-total
correlations and mean values for individual items in the four indexes are
illustrated in Table 2.3, below.
Inter-item correlations were also calculated for the four indexes (see
Table 2.4). Three asterisks (***) following an item description, below,
indicates that the item was phrased and coded negatively. For the
Individual Adoption Index, all correlations were positive, ranging from

48
Table 2.3 Corrected item-total correlations, means and standarddeviations for Individual Adoption, Internet Attitude,Organizational Support, and Internet Use indexes (N=55)
________________________________________________________________________
Item Corrected StandardNumber* Item-Total Mean** Deviation
Correlation________________________________________________________________________
Individual Adoption
S1_1 .7440 4.4000 1.0470S1_2*** .5125 4.4909 .9976 S1_3 .6029 4.4545 1.1518S1_5 .7230 3.7091 1.1168S1_6*** .6634 3.8182 1.1237S1_7 .4873 2.8545 1.3933S1_8*** .5229 3.2364 1.2905
Coefficient alpha = .8441*Non-consecutive item numbers result from items being removed in reliability testing.Item numbering reflects the section and question number of items in the pretestsurvey; for example, item "S1_1" indicates "section 1, question 1." For a listing of allitems, see Appendix A.**On a 5-point Likert scale ranging from "strongly agree" to "strongly disagree."***Item was phrased and coded negatively.
Internet Attitude
S2_9 .6246 4.1273 .9439S2_11 .8155 4.0727 1.1031S2_12 .8018 3.9636 1.1216 S2_13*** .6965 4.3091 1.0341S2_14 .8489 4.0545 1.1290S2_15*** .6950 4.2182 1.2276S2_16 .6216 4.3091 .9598S2_17*** .7050 4.5818 1.0127S2_18*** .6442 3.8909 1.3426
Coefficient alpha = .9433*Non-consecutive item numbers result from items being removed in reliability testing.Item numbering reflects the section and question number of items in the pretestsurvey; for example, item "S1_1" indicates "section 1, question 1." For a listing of allitems, see Appendix A.**On a 5-point Likert scale ranging from "strongly agree" to "strongly disagree."***Item was phrased and coded negatively.

49
Table 2.3 (Continued)________________________________________________________________________
Item Corrected StandardNumber* Item-Total Mean** Deviation
Correlation________________________________________________________________________
Organizational Support
S4_1 .6323 4.5455 .8348S4_2*** .6543 4.3818 1.2396S4_3 .6978 3.6909 1.1844S4_4*** .6128 3.6727 1.2331S4_5 .7264 4.2545 1.2052S4_6*** .6163 3.9818 1.3539S4_7 .6916 3.9636 1.2760S4_8*** .7032 3.9455 1.2970S4_9 .7926 4.2000 1.1122S4_10*** .5319 3.4727 1.2889
Coefficient alpha = .9041*Non-consecutive item numbers result from items being removed in reliability testing.Item numbering reflects the section and question number of items in the pretestsurvey; for example, item "S1_1" indicates "section 1, question 1." For a listing of allitems, see Appendix A.**On a 5-point Likert scale ranging from "strongly agree" to "strongly disagree."***Item was phrased and coded negatively.
Internet Use
S5_1 .7678 3.7091 1.0831S5_2 .7352 3.6182 1.1625S5_3 .7697 3.9091 1.3645S5_4 .6021 3.6909 1.2892S5_5 .8220 4.5091 1.1686S5_6 .7931 4.3091 1.4385
Coefficient alpha = .9066*Non-consecutive item numbers result from items being removed in reliability testing.Item numbering reflects the section and question number of items in the pretestsurvey; for example, item "S1_1" indicates "section 1, question 1." For a listing of allitems, see Appendix A.**On a 5-point Likert scale ranging from "strongly agree" to "strongly disagree."________________________________________________________________________
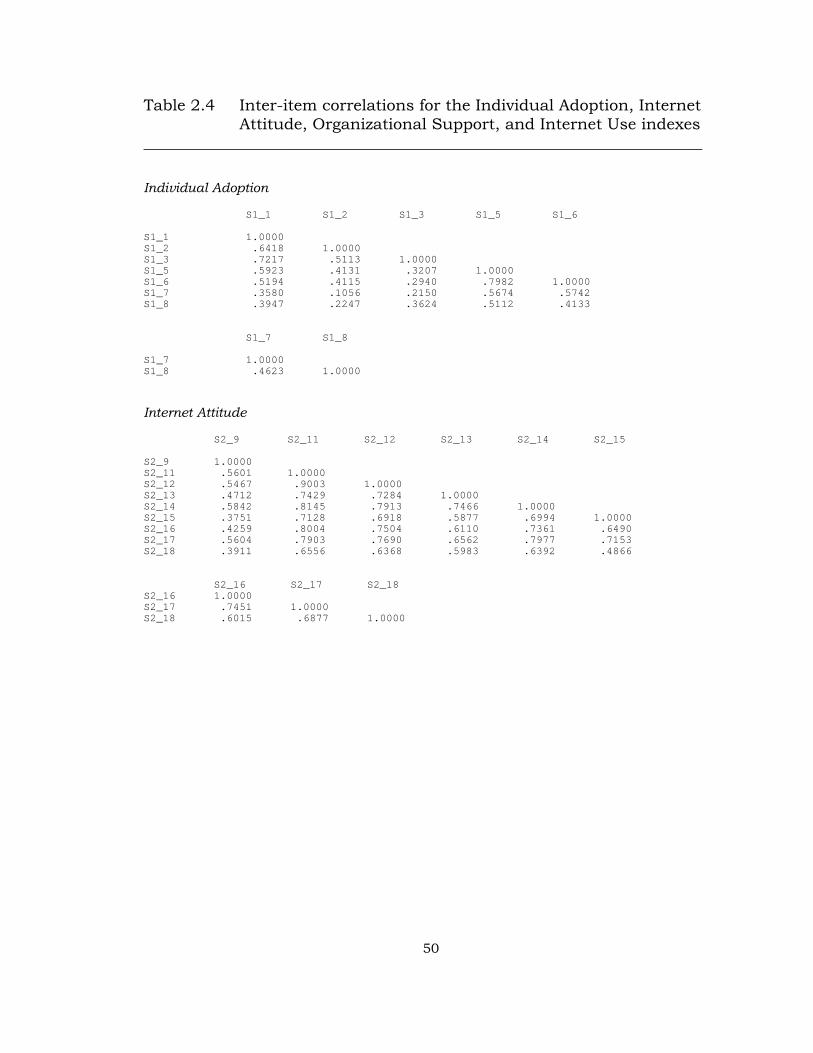
50
Table 2.4 Inter-item correlations for the Individual Adoption, InternetAttitude, Organizational Support, and Internet Use indexes
______________________________________________________________________
Individual Adoption
S1_1 S1_2 S1_3 S1_5 S1_6
S1_1 1.0000S1_2 .6418 1.0000S1_3 .7217 .5113 1.0000S1_5 .5923 .4131 .3207 1.0000S1_6 .5194 .4115 .2940 .7982 1.0000S1_7 .3580 .1056 .2150 .5674 .5742S1_8 .3947 .2247 .3624 .5112 .4133
S1_7 S1_8
S1_7 1.0000S1_8 .4623 1.0000
Internet Attitude
S2_9 S2_11 S2_12 S2_13 S2_14 S2_15
S2_9 1.0000S2_11 .5601 1.0000S2_12 .5467 .9003 1.0000S2_13 .4712 .7429 .7284 1.0000S2_14 .5842 .8145 .7913 .7466 1.0000S2_15 .3751 .7128 .6918 .5877 .6994 1.0000S2_16 .4259 .8004 .7504 .6110 .7361 .6490S2_17 .5604 .7903 .7690 .6562 .7977 .7153S2_18 .3911 .6556 .6368 .5983 .6392 .4866
S2_16 S2_17 S2_18S2_16 1.0000S2_17 .7451 1.0000S2_18 .6015 .6877 1.0000

51
Table 2.4 (Continued)______________________________________________________________________
Organizational Support
S4_1 S4_2 S4_3 S4_4
S4_1 1.0000S4_2 .5645 1.0000S4_3 .3610 .4981 1.0000S4_4 .3025 .5073 .6015 1.0000S4_5 .6877 .6527 .5491 .3935S4_6 .5005 .4566 .4006 .3402S4_7 .4362 .4421 .6296 .5808S4_8 .4898 .4739 .4469 .4518S4_9 .5584 .5480 .6945 .5077S4_10 .3411 .2790 .4372 .4021
S4_5 S4_6 S4_7 S4_8 S4_9 S4_10
S4_5 1.0000S4_6 .5817 1.0000S4_7 .5239 .5784 1.0000S4_8 .5422 .4845 .5359 1.0000S4_9 .6659 .4821 .5141 .6367 1.0000 .3411S4_10 .2787 .3340 .3372 .6028 .6046 1.0000
Internet Use
S5_1 S5_2 S5_3 S5_4 S5_54 S5_6
S5_1 1.0000S5_2 .6896 1.0000S5_3 .6709 .6314 1.0000S5_4 .5047 .4758 .4575 1.0000S5_5 .7337 .7319 .6334 .5981 1.0000S5_6 .6174 .5812 .7976 .5617 .7088 1.0000
______________________________________________________________________

52
.1056 (opportunities to experiment with internet technology−knowledge
of how to use internet technology and job security) to .7982 (find internet
technology confusing***–using internet technology is easy). The mean
inter-item correlation was .4482. For the Internet Attitude Index, all
correlations were positive, ranging from .3751 (trust of people in charge
of internet technology–using internet technology is more trouble than it's
worth***) to .9003 (get along well with people in charge of internet
technology–people in charge of internet technology are friendly and
helpful). The mean inter-item correlation was .6571. For the
Organizational Support Index, all correlations were positive, ranging from
.2787 (many groups at my site are interested in internet technology–
management at my site doesn't invest enough money in internet
technology***) to .6945 (have the skills/training needed to use internet
technology–management at my site supports the use of internet
technology). The mean inter-item correlation was .4942. For the Internet
Use Index, all correlations were positive, ranging from .4575 (likelihood of
using internet technology if not required to–how internet technology is
used at work) to .7976 (likelihood of using internet technology if not
required to–web-browsing habits used at work). The average inter-item
correlation was .6263.

53
The results of the inter-item correlation calculations for the four indexes
provide added support for the assertion that all remaining items in the
indexes should be retained.
In addition to alpha testing, a principal components factor analysis was
conducted on each of the indexes. Factor analysis, while not as definitive
as alpha testing, can provide additional assurance of an index's internal
consistency if one factor identified in the analysis is dominant over the
others.
The initial, unrotated analysis indicated that one factor accounted for the
majority of the variance in each of the indexes. For the Internet Attitude
and Internet Use indexes, a single, dominant eigenvalue was produced.
For the Individual Adoption and Organizational Support indexes, two
eigenvalues, were produced, with one dominating and the other having
an eigenvalue of slightly more than 1. Eigenvalues and variance figures
for each analysis are included in Table 2.5. The results of the factor
analyses are consistent with the preceding analyses in supporting the
reliability of the four indexes.

54
Table 2.5 Eigenvalues resulting from principal componentsfactor analyses of Individual Adoption, InternetAttitude, Organizational Support, and Internet Useindexes
_______________________________________________________________
Index Eigenvalues Percentage ofVarianceAccounted for
_______________________________________________________________
Individual Adoption 3.739 53.4191.276 18.223
Internet Attitude 6.325 70.279
Organizational Support 5.484 54.8371.036 10.365
Internet Use 4.149 69.152_______________________________________________________________
Final Survey Sample
The survey population for this study was the employees at six U.S.
Department of Energy facilities in California, Idaho, New Mexico, and
Tennessee—a total survey population of 26,697 (based on employee
rosters received from the facilities). A survey population breakdown is
shown in Table 2.6. These facilities were chosen for the survey because
they had certain inherent similaritiesi.e., they were all facilities
administered for DOE by the Energy and Environment Sector of the

55
Table 2.6 Population breakdown by facility______________________________________________
Facility* Population______________________________________________
INEEL 5694ETTP 2616Y-12 Plant 5094ORNL 5084SNL-Albuquerque 7169SNL-Livermore 1040______________________________________________*INEEL = Idaho National Engineering and Environmental Laboratory, Idaho Falls,IdahoETTP = East Tennessee Technology Park, Oak Ridge, TennesseeY-12 Plant = Oak Ridge Y-12 Plant, Oak Ridge, TennesseeORNL = Oak Ridge National Laboratory, Oak Ridge, TennesseeSNL-Albuquerque = Sandia National Laboratories, Albuquerque, New MexicoSNL-Livermore = Sandia National Laboratories, Livermore, California
Lockheed Martin Corporation, suggesting certain general similarities in
the types of issues they address and the types of people they employ. In
addition, the facilities were thought to have certain inherent
differencesin mission, funding, management, and geographical
location. The similarities suggested that comparisons among the facilities
in terms of how they adopt and implement internet technology would be
unlikely to be overshadowed by more basic differences. The differences
among the facilities suggested that there might be considerable variation
in how they adopt and implement internet technology.
At the time the survey was conducted, all of these facilities were
administered for DOE by . Lockheed Martin Corporation's Energy and

56
Environment Sector. Employee rosters were requested and received from
each facility. Each roster included employee names, work addresses, and
e-mail addresses (if available). A single roster was received for the two
Sandia (SNL) facilities (Albuquerque and Livermore) and was
subsequently divided by facility.
Given that paper-based surveys sometimes yield response rates as low as
20% and that anecdotal evidence suggests web surveys often experience
somewhat lower response rates, it was assumed that a best-case
scenario would yield a response rate of about 20% for this survey. The
response rate for the pretest (42.7%) wasn't considered to be a reliable
predictor for the final survey because of the relatively small size of the
pretest population.
In order for the survey to provide useful and significant results overall, as
well as for individual facilities, relatively high sampling rates were
thought to be necessary to solicit a sufficiently high number of responses
for all desired levels of analysis. In the light of the expected response
rates, it was determined that sampling 1600 employees from five of the
six facilities would be necessary. The sixth facility, SNL-Livermore, only
had about 1040 employees on their roster, so all of the employees on the

57
roster were included in the sample. Samples were generated by importing
employee rosters into Microsoft Excel (a spreadsheet software package)
and using Excel to generate a specific number of randomly selected
cases. Given the sample sizes, the expected response rate of about 20%
at each facility would then yield about 300 responses per facility—
enough data to enable moderately strong relationships found in facility-
level analyses to reach statistical significance.
Overall, 9040 survey solicitations were sent out. Of these solicitations,
7643, or 84.5%, were e-mail messages, and 1397, or 15.5%, were paper.
A total of 2711 usable responses were received—a 30% response rate. Of
these responses, 68.4% replied using the web-based instrument, 25.6%
replied by e-mail, and 6% replied to the paper survey. It should be noted
that the percentage of total responses accounted for by paper surveys
(6%) is considerably lower than the percentage of total paper solicitations
(15.5%). While this result suggests that the respondents to the survey do
not represent a precise cross-section of the survey population, this
discrepancy was not unexpected and may be an indication that a large
number of the paper solicitations were directed to a portion of the
population which has yet to adopt internet technology—and, therefore,
had no interest in completing the survey.

58
Response rates broke down by facility as follows: INEEL (1600
solicitations, 547 responses, 34.2% response rate—web 63.6%, e-mail
18.5%, paper 17.9%); ETTP (1600 solicitations, 453 responses, 28.3%
response rate—web 83.4%, e-mail 15.7%, paper .9%); Y-12 Plant (1600
solicitations, 384 responses, 24.0% response rate—web 79.9%, e-mail
14.6%, paper 5.5%); ORNL (1600 solicitations, 503 responses, 31.4%
response rate—web 79.1%, e-mail 15.3%, paper 5.6%); SNL-Albuquerque
(1600 solicitations, 521 responses, 32.6% response rate—web 51.8%, e-
mail 46.3%, paper 1.9%); SNL-Livermore (1040 solicitations, 288
responses, 27.7% response rate—web 49.0%, e-mail 50.3%, paper .7%);
15 responses didn't list a facility affiliation.
Final Survey Administration
The final survey was conducted between August 22, 1997 and October
22, 1997. Using samples drawn from the facility rosters, employees were
contacted in one of two ways. Employees having active e-mail addresses
received survey solicitations by e-mail. A reproduction of the e-mail
message and survey is included in Appendix C. (See Appendix E for more
information on e-mail−related concerns). Employees receiving e-mail
solicitations were asked to either respond to the e-mail survey, which
was appended to the solicitation, or to use their internet browser to
59
complete and submit a web version of the survey instrument. A
reproduction of the web version of the survey instrument is included in
Appendix C. The return address on the e-mail solicitation was "spoofed"
(not the address of the sender), causing responses to be mailed directly
to a computer address which parsed the e-mail responses into a data
matrix. The web version of the survey form submitted responses to
another computer address for similar processing. A separate e-mail
address was provided to report problems with the survey instruments
and other survey-related concerns. Details of the automated processing
of e-mail and web-based survey responses are included in Appendix E.
Employees without e-mail addresses were mailed paper surveys and pre-
addressed return envelopes. Return envelopes distributed at the three
Oak Ridge facilities (ETTP, Y-12 Plant, and ORNL) were handled by the
internal Lockheed Martin mail system and required no postage. Surveys
mailed to the other three facilities contained postage-paid return
envelopes. A reproduction of the paper survey is included in Appendix C.
A mailing address and an e-mail address were provided to report
problems with the paper survey instrument and other survey-related
problems.

60
All three versions of the survey instrument (web, e-mail, and paper)
included a statement indicating that the survey was sponsored by
Lockheed Martin's Energy and Environment Sector Internet Working
Group and encouraging employees to participate in this survey. It could
be argued that this influence may have skewed the results of the survey
by causing particularly compliant employees to be over-represented;
however, it was assumed that this potential risk was very small when
compared with the potential increase in response rates.
Two follow-up messages, similar to the first, were sent to each potential
respondent at approximately seven and 10 days after the initial
solicitation. Employees who initially received e-mail messages received
follow-up e-mail messages with a copy of the survey appended to the
reminder. The reminders also included references to the web version of
the survey. Employees who initially received paper surveys received
postcards encouraging them to respond to the initial solicitation. The
cost of mailing paper surveys out with reminder cards was prohibitive, so
replacement surveys were mailed out only by request. The postcards
included a mailing address and an e-mail address to request replacement
paper surveys. See Appendix D for reproductions of e-mail and paper
reminders.

61
The survey and reminder schedule is shown in Table 2.7. Electronic
mailings were sent and received on the dates noted. Mailings to the SNL-
Albuquerque and SNL-Livermore facilities were delayed about four weeks
due to various administrative difficulties, including obtaining an
employee roster that separated employees with active e-mail accounts
from those without them. See Appendix E for other e-mail−related
concerns.
The dates listed in Table 2.7 are approximate for paper mailings, due to
the processing time required for mail to pass through organizational
mailrooms. Originating and receiving mailrooms were alerted to the
survey in advance, so processing time was kept to a minimum. The three
Oak Ridge facilities (ETTP, Y-12 Plant, and ORNL) share an internal mail
system, so surveys and reminders were distributed internally without
being handled by the U.S. Mail or commercial mail carriers. Packages of
surveys and reminders were shipped to mailrooms at the INEEL and SNL
facilities, and the facility mailrooms distributed these items internally.
Web and e-mail responses from all facilities were generally received
within 14 days of the initial solicitations. Paper responses were generally
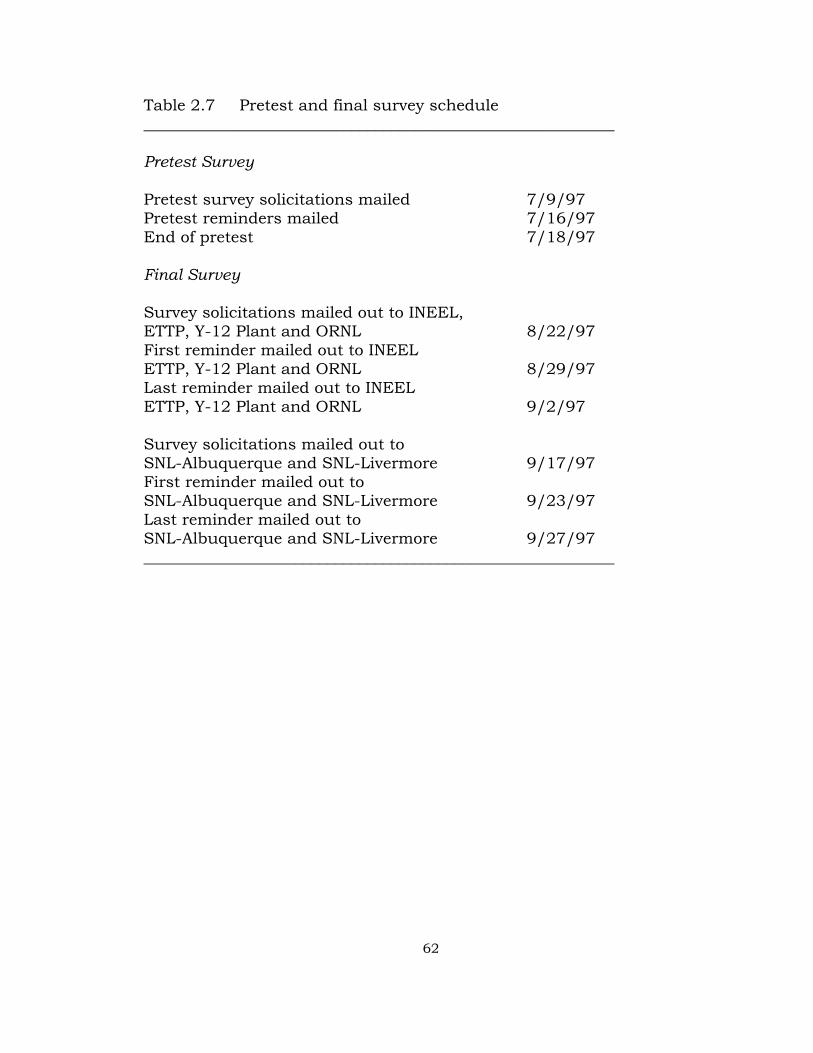
62
Table 2.7 Pretest and final survey schedule___________________________________________________________
Pretest Survey
Pretest survey solicitations mailed 7/9/97Pretest reminders mailed 7/16/97End of pretest 7/18/97
Final Survey
Survey solicitations mailed out to INEEL,ETTP, Y-12 Plant and ORNL 8/22/97First reminder mailed out to INEELETTP, Y-12 Plant and ORNL 8/29/97Last reminder mailed out to INEELETTP, Y-12 Plant and ORNL 9/2/97
Survey solicitations mailed out toSNL-Albuquerque and SNL-Livermore 9/17/97First reminder mailed out toSNL-Albuquerque and SNL-Livermore 9/23/97Last reminder mailed out toSNL-Albuquerque and SNL-Livermore 9/27/97___________________________________________________________

63
received over a slightly longer period. The last response was received on
October 22, 1997.
Final Survey Instrument
The final survey instrument is similar, in most respects, to the pretest
instrument described above. The final survey consists of five sections (the
Computer Alienation Scale included in the pretest was not included in
the final survey): four specialized indexes (described below), and a
demographic information section. Individual items in all of the indexes
except the Internet Use Index employ five-point Likert-type scales,
ranging from "strongly agree" to "strongly disagree." The Internet Use
index employs a multiple-choice format with responses graduated in
order of amount or sophistication of use. Respondents' scores for each of
the indexes were determined by calculating a mean score for each set of
items. The web, e-mail and paper versions of the final survey instrument
are reproduced in Appendix C of this study.
The first section is the Individual Adoption Index. It includes seven items
based on Rogers' "characteristics of innovations" (Rogers, 1995). The
Individual Adoption Index is designed to measure the extent to which
internet use in the workplace is influenced by the
64
individual/interpersonal factors frequently cited by traditional diffusion
of innovation researchers. The second section of the survey is the
Internet Attitude Index. It is made up of nine items based on Abdul-
Gader and Kozar's Computer Alienation Scale (Abdul-Gader and Kozar,
1995). The third section of the survey is the Organizational Support
Index. It is made up of 10 items based on the five propositions offered by
Markus with respect to the probability and extent of the diffusion of
interactive media usage within communities (Markus, 1987). The
Organizational Support Index is designed to measure the extent to which
internet use in the workplace is influenced by the organizational factors
frequently cited by critical mass theorists. The fourth section of the
survey is the Internet Use Index. This index includes six items that
measure aspects of individual internet use. The fifth and final section of
the survey is made up of eight demographic items and two short-answer
questions. The primary purpose of the short-answer questions is to
provide additional feedback to the organizations participating in the
study.
The three versions of the survey instrument (web, e-mail, and paper) are
as similar as is practical, given the limitations of their respective media.
The wording and order of the questions is identical from medium to

65
medium. Instructions are very similar, with the exception of media-
specific variations. For example, on the paper version of the survey,
respondents are asked to "circle one of the numbers"; on the web version,
they are asked to "click one of the small, round buttons"; and on the e-
mail version, they are asked to "enter your answer on the same line as
the answer pointer." Each version of the final survey instrument is
illustrated in Appendix C.
After the data from the final survey were collected, an ANOVA was
conducted to compare the scores of the four indexes across the three
survey media (web, e-mail and paper). The results of this comparison are
shown in Table 2.8. The results suggest that there were significant
differences among the index scores that are associated with the format of
the survey. As was the case with the pretest, the mean index scores of
the three survey groups (Table 2.9) illustrate a hierarchy of mean index
scores: the highest for web-based survey responses, the second highest
for e-mail survey responses and the lowest for paper survey responses.
However, as mentioned in the discussion of the pretest, these differences
are assumed to be primarily an artifact of the level of experience
respondents in each group had with internet technology.

66
Table 2.8 Analysis of between-groups variance of final surveyindex scores on web, e-mail and paper surveyinstruments. (N=2711)
______________________________________________________________________Source of Sum of Degrees of Mean F Sig.Variation Squares Freedom squares______________________________________________________________________
Individual Adoption Index 116.019 2 58.010 121.843 .000
InternetAttitude Index 51.353 2 25.676 72.439 .000
OrganizationalSupport Index 31.294 2 15.647 45.763 .000
InternetUse Index 276.275 2 138.137 295.436 .000______________________________________________________________________

67
Table 2.9 Mean index scores on web, e-mail and paper finalsurvey instruments.
_________________________________________________________________
Format Mean_________________________________________________________________
Individual Adoption Index (N=2711) 3.9149Web (N=1853) 4.0328E-Mail (N=695) 3.7576Paper (N=163) 3.2454
Internet Attitude Index (N=2711) 3.9542Web (N=1853) 4.0246E-Mail (N=695) 3.8799Paper (N=163) 3.4693
Organizational Support Index (N=2711) 3.7665Web (N=1853) 3.8012E-Mail (N=695) 3.7731Paper (N=163) 3.3444
Internet Use Index (N=2711) 3.4455Web (N=1853) 3.5792E-Mail (N=695) 3.3736Paper (N=163) 2.2331
_________________________________________________________________
68
Final Survey Data Gathering
The web and e-mail survey instruments are designed to pass responses
to several computer programs, which parse the responses and compile
them into a data matrix. Responses to the web-based instrument parsed
well without exception. However, in the course of the survey, it became
obvious that the parsing of the e-mail survey responses was being
hampered by responses that were not entered correctly. Initially, these
problems were handled by editing the incorrectly parsed responses out of
the data matrix and setting the offending e-mail message aside for
manual processing. However, it eventually became clear that a large
percentage of the e-mail responses had problems of this sort to one
extent or another, so it was determined that processing all e-mail
responses by hand would be the best way to proceed to ensure the
integrity of the data. As a result, all e-mail responses were entered into a
data matrix manually by a single coder.
Details of the automated processing of e-mail and web-based survey
responses are included in Appendix E. All paper responses were also
entered into a data matrix manually by a single coder.
69
A small number of surveys (of all types—web, e-mail, and paper) were
filled out incompletely or not at all. Blank surveys were discarded. If the
respondent filled out the demographics section and some fraction of the
rest of the survey, the response was tabulated. If the respondent filled
out only the demographic section, the response was tabulated. If the
respondent filled out an entire section (an index) of the survey and
nothing else, the response was tabulated. If the respondent filled out only
two or three items of the entire survey (as happened on a handful of
occasions), the survey was discarded. If the respondent provided multiple
responses to a single item on e-mail or paper surveys (this was
impossible to do on the web version of the survey), the item was coded as
a zero (no response). If the respondent provided an illegible or
unintelligible response on an e-mail or paper survey (this was impossible
to do on the web version of the survey), the item was coded as a zero (no
response).
Summary
A survey dealing with issues related to the use of internet technologies in
the workplace was presented to a random sample of employees at six
Department of Energy facilities in California, Idaho, New Mexico, and
Tennessee, which were operated for DOE by Lockheed Martin
70
Corporation's Energy and Environment Sector. To ensure universal
access for potential respondents, the survey was made available as a
web-based form, as an e-mail message, and in paper format. The survey
was composed of four indexes: Individual Adoption, Internet Attitude,
Organizational Support, and Internet Use, as well as a set of
demographic questions and two short-answer items.
The Individual Adoption Index was designed to measure the extent to
which internet use in the workplace is influenced by the
individual/interpersonal factors frequently cited by traditional diffusion
of innovation researchers. The Internet Attitude Index was intended to
measure the comfort level of respondents with respect to internet
technology. The aim of the Organizational Support Index was to measure
the extent to which internet use in the workplace is influenced by
organizational factors frequently cited by critical mass theorists. Finally,
the Internet Use Index attempted to gauge the extent to which
individuals employ internet technology in the workplace by measuring
aspects of internet use, including frequency, duration, sophistication,
and motivation. The data gathered by these indexes is considered in
detail in Chapter III.
71
Chapter III
Analysis and Results
The data gathered in the final survey were analyzed in several stages.
First, reliability tests were performed on the indexes; then a descriptive
analysis was performed to look for trends associated with the
relationship between demographic variables and mean Internet Use
Index scores. Finally, multiple regression analyses and t-tests were used
to test the various hypotheses.
Reliability of Indexes
After the final data was collected, indexes were tested again for internal
consistency by calculating an alpha coefficient, or Cronbach's reliability
index, for each. Alpha coefficients for the four indexes are as follows:
Individual Adoption (.7079), Internet Attitude (.8369), Organizational
Support (.7776), and Internet Use (.8121). The minimum alpha score for
an index to be considered internally consistent is accepted to be .70
(Nunnally, 1978). This level of consistency indicates that each item is
contributing to the measurement of the quality or construct in question.
All four indexes exceed this standard.
72
After the alpha coefficients were calculated, item-total correlations were
calculated as an additional check on the reliability of the indexes. These
correlation scores consider both individual items and entire indexes in
terms of the variance they explained. Items with high item-total
correlations increase the variance explained by the index. Nunnally
suggests that each item should have an item-total correlation of at least
.20 to be included in the index and that the index should have a mean
item-total correlation of at least .40 (Nunnally, 1978).
On the basis of the item-total correlations, three items having relatively
weak correlations were eliminated from the Individual Adoption index,
one item having relatively weak correlations were eliminated from the
Internet Attitude index, and four items having relatively weak
correlations were eliminated from the Organizational Support index.
Alpha coefficients were re-calculated for these three indexes, yielding the
following results: Individual Adoption (.7463), Internet Attitude (.8271),
Organizational Support (.7548). The effect of these deletions was to focus
the indexes by increasing their internal consistency.
The mean item-total correlations were then re-calculated for the four
indexes; they are as follows: Individual Adoption index (.5438), Internet

73
Attitude (.5534), Organizational Support (.5015), and Internet Use
(.5831). All item-total correlations exceed Nunnally's recommended
standards. Item-total correlations and mean values for individual items
in the four indexes are illustrated in Table 3.1, below.
Inter-item correlations were also calculated for the indexes (see Table
3.2). Three asterisks (***) following an item description, below, indicates
that the item was phrased and coded negatively. For the Individual
Adoption index, all correlations were positive, ranging from .2257 (find
internet technology confusing***–internet technology fits in with the way
my organization works) to .6544 (find internet technology confusing***–
using internet technology is easy). The mean inter-item correlation was
.4269. For the Internet Attitude index, all correlations were positive,
ranging from .2059 (trust people in charge of internet technology–
employer values internet technology too highly***) to .7867 (get along well
with people in charge of internet technology–people in charge of internet
technology are friendly and helpful). The mean inter-item correlation was
.3691. For the Organizational Support index, all correlations were
positive, ranging from .2620 (few people I work with use internet
technology***–several people at my site have promoted the use of internet
technology for years) to .4876 (more and more people at my site are using
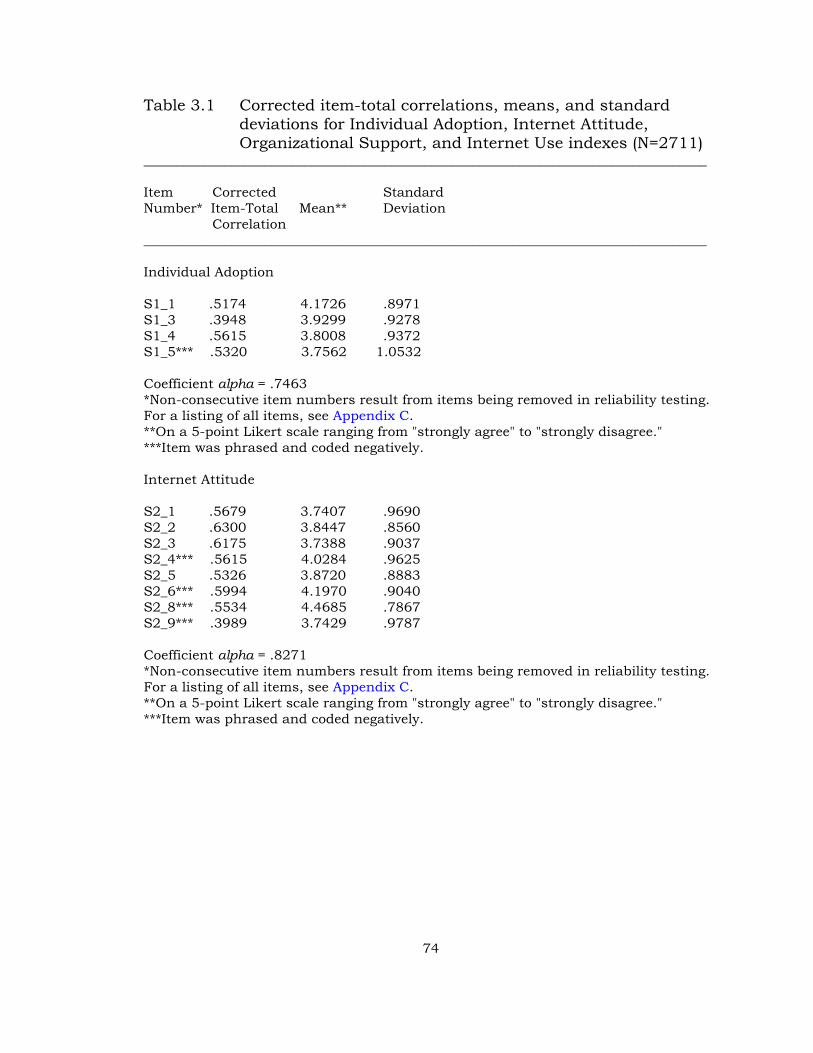
74
Table 3.1 Corrected item-total correlations, means, and standarddeviations for Individual Adoption, Internet Attitude,Organizational Support, and Internet Use indexes (N=2711)
____________________________________________________________________________________
Item Corrected StandardNumber* Item-Total Mean** Deviation
Correlation____________________________________________________________________________________
Individual Adoption
S1_1 .5174 4.1726 .8971S1_3 .3948 3.9299 .9278S1_4 .5615 3.8008 .9372S1_5*** .5320 3.7562 1.0532
Coefficient alpha = .7463*Non-consecutive item numbers result from items being removed in reliability testing.For a listing of all items, see Appendix C.**On a 5-point Likert scale ranging from "strongly agree" to "strongly disagree."***Item was phrased and coded negatively.
Internet Attitude
S2_1 .5679 3.7407 .9690S2_2 .6300 3.8447 .8560S2_3 .6175 3.7388 .9037S2_4*** .5615 4.0284 .9625S2_5 .5326 3.8720 .8883S2_6*** .5994 4.1970 .9040S2_8*** .5534 4.4685 .7867S2_9*** .3989 3.7429 .9787
Coefficient alpha = .8271*Non-consecutive item numbers result from items being removed in reliability testing.For a listing of all items, see Appendix C.**On a 5-point Likert scale ranging from "strongly agree" to "strongly disagree."***Item was phrased and coded negatively.

75
Table 3.1 (Continued)____________________________________________________________________________________
Item Corrected StandardNumber* Item-Total Mean** Deviation
Correlation____________________________________________________________________________________
Organizational Support
S3_1 .4669 4.2261 .7311S3_2*** .4824 3.9871 1.0133S3_5 .4749 3.9698 .7914S3_6*** .4853 3.6503 .9443S3_7 .4496 3.4884 .9745S3_9 .5975 3.8425 .9075
Coefficient alpha = .7548*Non-consecutive item numbers result from items being removed in reliability testing.For a listing of all items, see Appendix C.**On a 5-point Likert scale ranging from "strongly agree" to "strongly disagree."***Item was phrased and coded negatively.
Internet Use
S4_1 .4945 3.1523 .8435S4_2 .5403 2.5994 .7672S4_3 .5914 3.7794 1.0259S4_4 .5413 3.2612 .9417S4_5 .6717 3.9812 1.2564S4_6 .6564 3.8997 1.3437
Coefficient alpha = .8121*Non-consecutive item numbers result from items being removed in reliability testing.For a listing of all items, see Appendix C.**On a 5-point Likert scale ranging from "strongly agree" to "strongly disagree."____________________________________________________________________________________
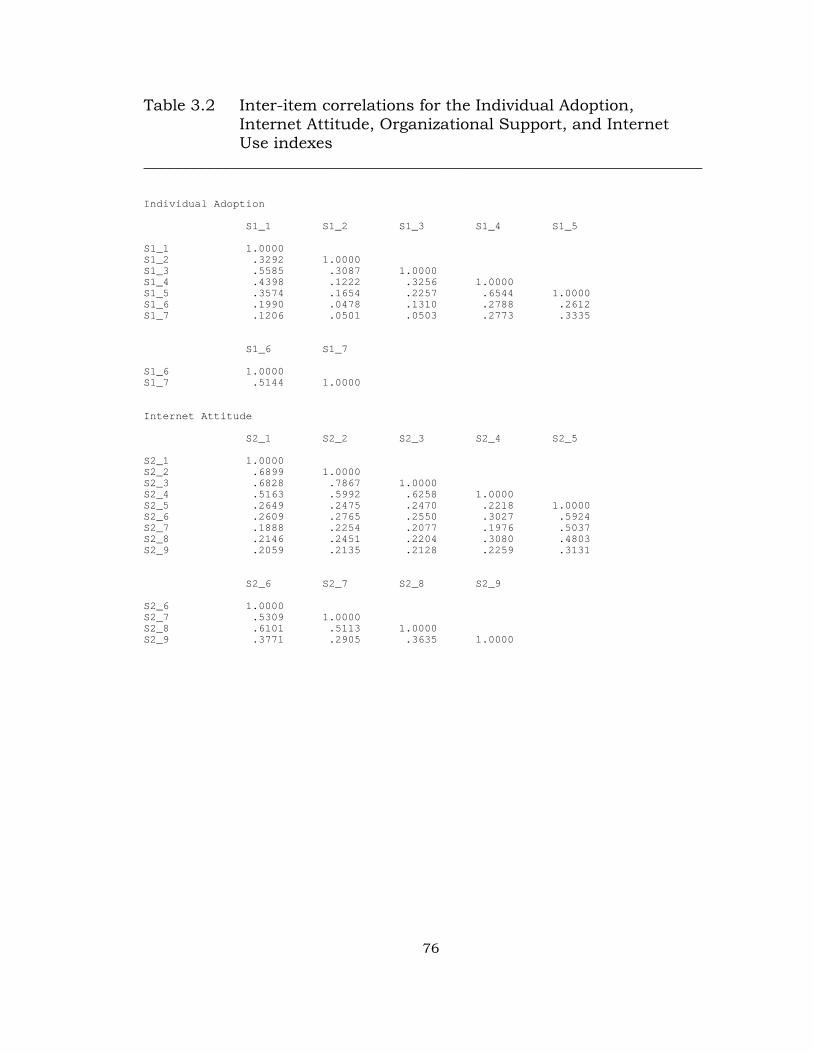
76
Table 3.2 Inter-item correlations for the Individual Adoption,Internet Attitude, Organizational Support, and InternetUse indexes
______________________________________________________________________
Individual Adoption
S1_1 S1_2 S1_3 S1_4 S1_5
S1_1 1.0000S1_2 .3292 1.0000S1_3 .5585 .3087 1.0000S1_4 .4398 .1222 .3256 1.0000S1_5 .3574 .1654 .2257 .6544 1.0000S1_6 .1990 .0478 .1310 .2788 .2612S1_7 .1206 .0501 .0503 .2773 .3335
S1_6 S1_7
S1_6 1.0000S1_7 .5144 1.0000
Internet Attitude
S2_1 S2_2 S2_3 S2_4 S2_5
S2_1 1.0000S2_2 .6899 1.0000S2_3 .6828 .7867 1.0000S2_4 .5163 .5992 .6258 1.0000S2_5 .2649 .2475 .2470 .2218 1.0000S2_6 .2609 .2765 .2550 .3027 .5924S2_7 .1888 .2254 .2077 .1976 .5037S2_8 .2146 .2451 .2204 .3080 .4803S2_9 .2059 .2135 .2128 .2259 .3131
S2_6 S2_7 S2_8 S2_9
S2_6 1.0000S2_7 .5309 1.0000S2_8 .6101 .5113 1.0000S2_9 .3771 .2905 .3635 1.0000
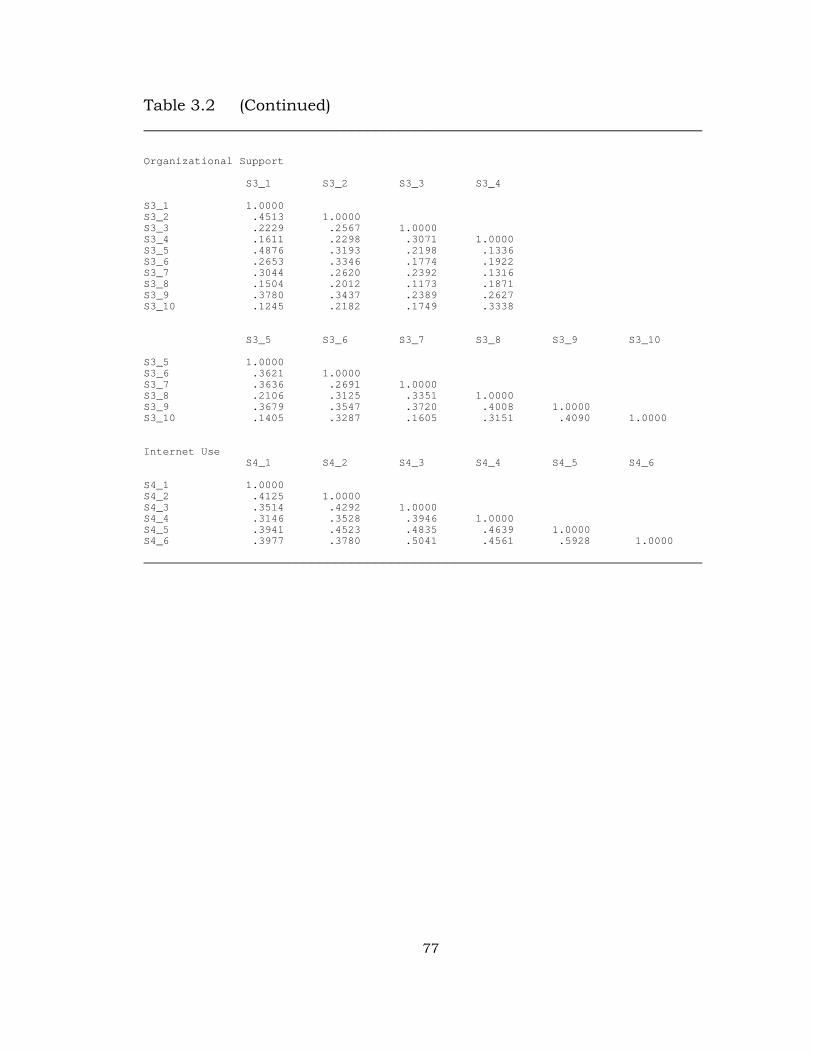
77
Table 3.2 (Continued)______________________________________________________________________
Organizational Support
S3_1 S3_2 S3_3 S3_4
S3_1 1.0000S3_2 .4513 1.0000S3_3 .2229 .2567 1.0000S3_4 .1611 .2298 .3071 1.0000S3_5 .4876 .3193 .2198 .1336S3_6 .2653 .3346 .1774 .1922S3_7 .3044 .2620 .2392 .1316S3_8 .1504 .2012 .1173 .1871S3_9 .3780 .3437 .2389 .2627S3_10 .1245 .2182 .1749 .3338
S3_5 S3_6 S3_7 S3_8 S3_9 S3_10
S3_5 1.0000S3_6 .3621 1.0000S3_7 .3636 .2691 1.0000S3_8 .2106 .3125 .3351 1.0000S3_9 .3679 .3547 .3720 .4008 1.0000S3_10 .1405 .3287 .1605 .3151 .4090 1.0000
Internet Use S4_1 S4_2 S4_3 S4_4 S4_5 S4_6
S4_1 1.0000S4_2 .4125 1.0000S4_3 .3514 .4292 1.0000S4_4 .3146 .3528 .3946 1.0000S4_5 .3941 .4523 .4835 .4639 1.0000S4_6 .3977 .3780 .5041 .4561 .5928 1.0000
______________________________________________________________________

78
internet technology–many different groups at my site are interested in
internet technology). The mean inter-item correlation was .3490. For the
Internet Use index, all correlations were positive, ranging from .3146
(how long have you used internet technology–how internet technology is
used at work) to .5928 (combination of work-related tasks internet
technology is used for–web-browsing habits at work). The average inter-
item correlation was .4252. The results of the inter-item correlation
calculations for the four indexes suggest that all items remaining in the
indexes should be retained.
In addition to alpha testing, a principal components factor analysis was
conducted on each of the indexes. Factor analysis, while not as definitive
as alpha testing, can provide additional assurance of an index's internal
consistency if one factor identified in the analysis is dominant over the
others.
In the case of each index, the initial, unrotated analysis indicated that
one factor was dominant in terms of the percentage of variance
accounted for. For the Individual Adoption index, Organizational Support
index, and Internet Use index, a single, dominant eigenvalue (greater
than 1.0) was produced. For the Internet Attitude index, two eigenvalues,

79
were produced, with one dominating and the other having a considerably
smaller value. Eigenvalues and variance figures for each analysis are
included in Table 3.3. The results of the factor analyses are consistent
with the preceding analyses in supporting the reliability of the four
indexes.
Preliminary Analyses
Initially, descriptive analyses were performed on the data in order to
discover any trends or confounds that would be of importance in the
subsequent phase of hypothesis testing. These analyses considered the
range of values for each demographic variable and the mean Internet Use
Index score associated with each value.
One of the first analyses was suggested by Babcock, Bush, and Lan's
1995 investigation of the use of information technology (a concept
arguably similar to internet technology) by executives in the public
sector. The authors suggest that (a) "educational background is related to
executives' personal use of information technology" and (b) "personal use
of information technology is negatively correlated with age" (Babcock,
Bush, and Lan, 1995). Babcock, et al. also found that managers having
computer science and business degrees were considerably more likely to

80
Table 3.3 Eigenvalues resulting from principal components factoranalyses of Individual Adoption, Internet Attitude,Organizational Support, and Internet Use indexes
____________________________________________________________________Index Eigenvalues Percentage of
Variance Accounted for____________________________________________________________________
Individual Adoption 2.289 57.218
Internet Attitude 3.696 46.2011.661 20.758
Organizational Support 2.754 45.896
Internet Use 3.140 52.328____________________________________________________________________
use information technology than those with backgrounds in the natural
sciences or the humanities. To test the applicability of this assertion to
internet technology, the mean Internet Use Index scores of individuals
who identified themselves as managers were broken down by educational
background. The results of this process, reported in Table 3.4, indicate
that the relationship found by Babcock, et al., with regard to educational
background and information technology is not mirrored in the current
study by the relationship between educational background and the use
of internet technology. Mean Internet Use Index scores for respondents
having backgrounds in computer science and mathematics, business,
natural sciences, and the humanities are all fairly similar, with

81
Table 3.4 Mean Internet Use Index scores by educationalbackground (all facilities)
______________________________________________________________________N Mean
______________________________________________________________________
Business (i.e., Management, 511 3.5127 Economics, Marketing)Computer Science or 316 3.6777 MathematicsCrafts (i.e., Electrician, 118 2.7881 Pipefitter)Humanities (i.e., English, 93 3.5287 Philosophy, Art)Natural Sciences (i.e., 661 3.5091 Chemistry, Biology, Physics)Public Management (i.e., 21 3.3254 Public Administration)Other 941 3.3909______________________________________________________________________
humanities graduates having a higher mean score than those with
business degrees. In fact, business graduates had lower mean scores
than two of the other three groups. It is not clear whether this outcome is
due to differences between the survey populations of the two studies or
between the concepts of information technology and internet technology.
Babcock, et al., also suggest a negative relationship between the use of
information technology and age—that is, older individuals are less likely
to use information technology than younger individuals. As illustrated by
Table 3.5, a similar relationship between the use of internet technology
and age doesn't seem to be present in the data gathered for this study.
Mean Internet Use Index scores tend to fluctuate somewhat with age, not

82
Table 3.5 Mean Internet Use Index scores by age (all facilities)____________________________________________________________________________
N Mean____________________________________________________________________________
Less than 20 6 3.111120-29 146 3.434930-39 1880 3.559540-49 332 3.145650-59 266 3.156660-69 43 3.108570-79 2 4.333380 or over 0 n/aprefer not to say 26 3.0897____________________________________________________________________________
displaying a definite trend one way or the other. If anything, they tend to
increase with age through the 30-39 age range and then decrease. Again,
it is not clear whether this outcome is due to differences between the
survey populations or between the concepts of information technology
and internet technology.
In addition to looking for the demographic trends suggested by Babcock,
et al., demographic differences between high- and low- "organizational
heterogeneity" facilities were investigated by generating crosstabs for
each relationship. The concept of "organizational heterogeneity" is
involved in several of this study's hypotheses and is explained in detail in
the Organizational Heterogeneity section, below. However, briefly, each
facility's organizational heterogeneity was determined to be either high or
low, depending on the diversity of its funding sources. By this measure,
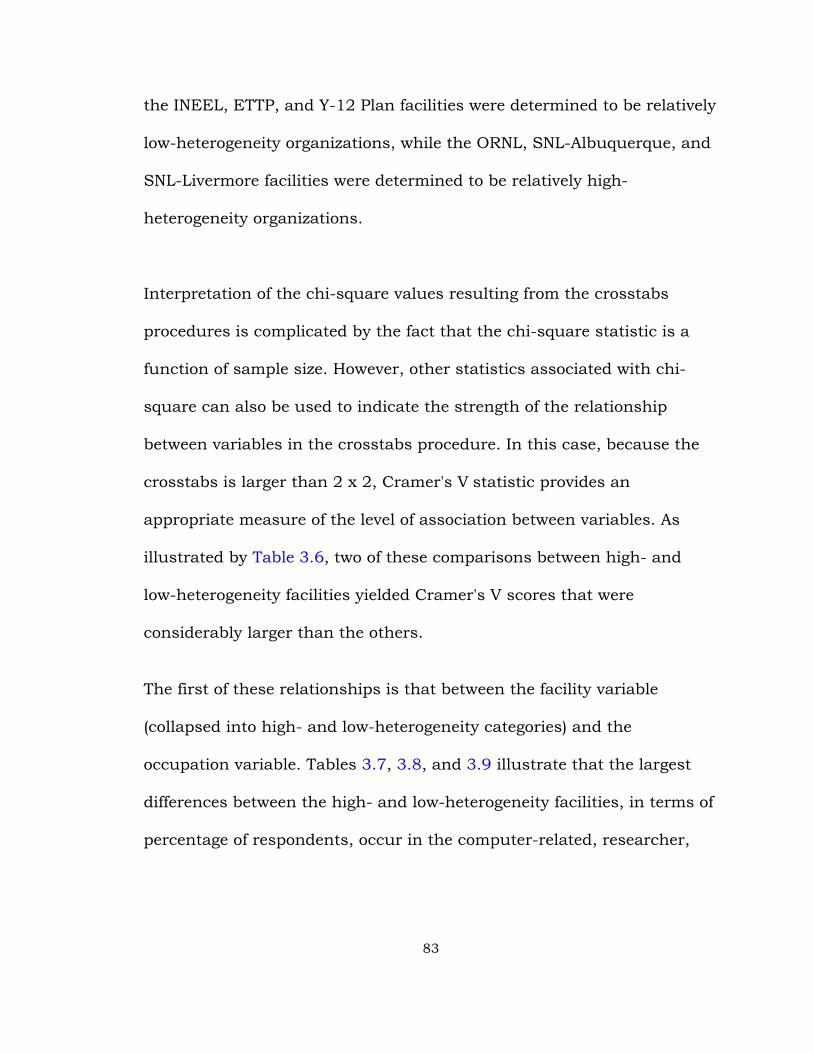
83
the INEEL, ETTP, and Y-12 Plan facilities were determined to be relatively
low-heterogeneity organizations, while the ORNL, SNL-Albuquerque, and
SNL-Livermore facilities were determined to be relatively high-
heterogeneity organizations.
Interpretation of the chi-square values resulting from the crosstabs
procedures is complicated by the fact that the chi-square statistic is a
function of sample size. However, other statistics associated with chi-
square can also be used to indicate the strength of the relationship
between variables in the crosstabs procedure. In this case, because the
crosstabs is larger than 2 x 2, Cramer's V statistic provides an
appropriate measure of the level of association between variables. As
illustrated by Table 3.6, two of these comparisons between high- and
low-heterogeneity facilities yielded Cramer's V scores that were
considerably larger than the others.
The first of these relationships is that between the facility variable
(collapsed into high- and low-heterogeneity categories) and the
occupation variable. Tables 3.7, 3.8, and 3.9 illustrate that the largest
differences between the high- and low-heterogeneity facilities, in terms of
percentage of respondents, occur in the computer-related, researcher,

84
Table 3.6 Contingency coefficients for demographic crosstabs___________________________________________________________________________
Comparison Cramer's V
___________________________________________________________________________
Facility by occupation .296*Facility by field of education .115*Facility by gender .039Facility by age .141*Facility by computer operating system .301*Facility by browser .104*Facility by source of news .170*
about internet resources___________________________________________________________________________*p<.001
Table 3.7 Facility heterogeneity by occupation crosstab____________________________________________________________________________________Facility Occupation*Heterogeneity
NR AD CL CR CP MA RS TN PR OT
____________________________________________________________________________________
Low 7% 11.5% 4.8% 14.2% 3.2% 11.3% 2.7% 8.2% 37.2% 6.4%
High .5% 12.4% 6.3% 8.6% 2.2% 9.7% 19.2% 11.0% 26.2% 4.0%
____________________________________________________________________________________*NR=No Response, AD=Administrative, CL=Clerical, CR=Computer-Related, CP=Craftsperson, MA=Manager,RS=Researcher, TN=Technician, PR=Professional, OT=Other

85
Table 3.8 Chi-square tests for facility heterogeneity byoccupation crosstab
___________________________________________________________________
Value df Asymp. Sig. (2-sided)
___________________________________________________________________
PearsonChi-Square 236.156 9 .000
Likelihood Ratio 256.178 9 .000
Linear by LinearAssociation 2.350 1 .125
N of Valid Cases 2696___________________________________________________________________
Table 3.9 Symmetric measures for facilityheterogeneity by occupation crosstab
___________________________________________________________________
Value Approx. Sig.___________________________________________________________________
Nominal by Nominal Cramer's V .296 .000
N of Valid Cases 2696___________________________________________________________________

86
and professional categories. If these differences involved categories
having greatly divergent mean Internet Use Index scores, then one might
consider this disparity to be a factor which could potentially confound
the conclusions drawn from subsequent hypothesis testing. However, the
strength of the relationship between the facility and occupation variables
is low to moderate at best (Cramer's V = .296) and the differences in
mean Internet Use Index scores tend not to favor either high- or low-
heterogeneity facilities. Low-heterogeneity facilities have a greater
percentage of computer-related respondents, who have a mean Internet
Use Index score of 3.7314 (well above the overall mean of 3.4455); high
heterogeneity facilities have a greater percentage of researchers, who
have a mean Internet Use Index score of 3.6684 (also well above the
overall mean); and low-heterogeneity facilities have a greater percentage
of professionals, who have a mean Internet Use Index score of 3.5125
(somewhat above the overall mean). These factors suggest that, while
there are differences in the number of people in various occupational
categories at high- and low-heterogeneity facilities (presumably reflecting
differences in the type of work done at each of the facilities), these
occupational differences are not accompanied by striking differences in
internet technology use and will not, therefore, have a substantive effect
on the validity of the survey.

87
The second source of demographic differences between the high- and
low-heterogeneity facilities involves the computer operating system
variable. Tables 3.10, 3.11, and 3.12 illustrate that there are
considerable differences between the high- and low-heterogeneity
facilities in terms of their use of computer operating systems. In broad
terms, the low-heterogeneity facilities are dominated by the Windows
'95/NT operating system (82.2%), while the high heterogeneity facilities
report a more diverse selection of operating systems, including Windows
'95/NT (62.9%), Macintosh (23.0%) and Unix (7.5%). However, in terms
of basic functionality, virtually identical software products that support
the use of internet technology are available at little or no cost for all of
the operating systems included under the computer operating systems
variable. This indicates that having or not having access to a particular
computer operating system should have a negligible effect on an
individual's use of internet technology. In addition, the percentage of
respondents who indicated that they didn't use a computer is similar at
both high- (1.4%) and low-heterogeneity (1.7%) facilities. These factors,
combined with the fact that the strength of the relationship between the
facility and operating system variables is low to moderate at best
(Cramer's V = .301), suggest that differences in operating system use at
high- and low-heterogeneity facilities will have no substantive effect on

88
Table 3.10 Facility heterogeneity by computer operating system crosstab_____________________________________________________________________________________
Facility Operating SystemHeterogeneity
None PC-DOS Win3.1 Win'95/NT Mac Unix Other Not Sure_________________________________________________________________________________________________________
Low 1.7% .4% 5.1% 82.2% 6.4% 1.4% 1.3% .9%High 1.4% .3% 4.3% 62.9% 23.0% 7.5% .2% .1%
_____________________________________________________________________________________
Table 3.11 Chi-square tests for facility heterogeneity bycomputer operating system crosstab
___________________________________________________________________
Value df Asymp. Sig. (2-sided)
___________________________________________________________________
PearsonChi-Square 244.332 8 .000
Likelihood Ratio 259.723 8 .000
Linear by LinearAssociation 56.921 1 .000
N of Valid Cases 2696___________________________________________________________________
Table 3.12 Symmetric measures for facility heterogeneity bycomputer operating system crosstab
________________________________________________________________________
Value Approx. Sig.________________________________________________________________________
Nominal by Nominal Cramer's V .301 .000
N of Valid Cases 2711________________________________________________________________________

89
the validity of the survey. The differences in operating system use,
however, may themselves be artifacts of variations in organizational
heterogeneity.
Tests of the Hypotheses
Several of the hypotheses described below involve the concept of
"organizational heterogeneity." Therefore a means of determining the
extent to which facilities participating in the study exhibit relatively
greater or lesser organizational heterogeneity is needed. To provide this
definition, organizational heterogeneity is discussed briefly below; then
the tests of each of the study's hypotheses are discussed.
Organizational Heterogeneity
Critical mass theory addresses the question of how reciprocal
technologies, such as the use of internet technology, begin and are
sustained. In particular, critical mass theory stresses the importance of
organizational features, such as the heterogeneity of the group or
organization. In The Critical Mass in Collective Action, the originators of
critical mass theory, Marwell and Oliver, stress the importance of this
concept, claiming that: "Everything we do in this book turns on an
understanding of the significance of group heterogeneity and how it
90
interacts with the determinants of collective action" (Marwell and Oliver,
1993).
Specifically, critical mass theory holds that a positive relationship, on the
part of individuals, between interest in a particular behavior and the
resources necessary to engage in, or promote, that behavior is a key
factor in starting and sustaining collective action. In addition, group or
organizational heterogeneity (in terms of interest and resources)
facilitates this relationship by increasing the likelihood that some
members will stand to gain more from the change than others, thus
increasing their interest, and the chance that some of the interested
members will possess and be willing to commit the resources necessary
to achieve the change. In other words, organizations exhibiting greater
heterogeneity are more likely to adopt interactive technologies. So the
question becomes, what constitutes a more or less heterogeneous
organization? A number of recent studies of organizational
differentiation, or heterogeneity, have concentrated on two primary
characteristics—structural complexity and the degree of task
specialization of organizational units.

91
Most research in this area has focused on the relationship between these
characteristics, rather than on their effects on the differentiation, or
heterogeneity, of an organization. For example, the relationship between
structural complexity and the degree of task specialization has been
demonstrated by a number of studies, including Udy (1965), Pugh et al.
(1968), and Khandwalla (1977). Citing these studies, among others,
Mintzberg (1979) sums up their conclusions as follows: "The larger the
organization, the more elaborate its structure, that is, the more
specialized its tasks, the more differentiated its units, and the more
developed its administrative component" (Mintzberg, 1979). However,
when Koene, Boone, and Soeters' examined the influence of
organizational structure on the diversity of organizational culture—that
is, employees' attitudes, values, and perceptions—the authors noted that
the degree of "cultural differentiation," or heterogeneity, of an
organization "apparently reflects the degree of structural differentiation
in larger organizations" (Koene, Boone, and Soeters, 1997). The authors
go on to suggest that cultural differentiation, or heterogeneity, is a result
of differences in the tasks of the various organizational units: "the more
specialized tasks are, the more differentiated are [the organization's]
units and the more developed its administrative component" (Koene,
Boone, and Soeters, 1997).

92
It is important to note that, unlike earlier researchers, Koene, Boone, and
Soeters draw a distinction between structural differentiation (differences
in tasks among organizational units) and the sheer number of
organizational units. The results of Koene, Boone, and Soeters' study
suggests that the level of task specialization within an organization will
have an effect on the cultural differentiation, or heterogeneity, of that
organization. So it follows that, to assess the level of heterogeneity at the
six facilities involved in this study, one might reasonably consider their
respective levels of task specialization.
Four of the facilities participating in this survey (INEEL, ORNL and the
two SNL facilities) are considered by DOE to be multiprogram research
and development laboratories. However, this is only a rough measure of
task specialization, indicating that each facility receives substantial
funding from more than one DOE Program Office (each of which
concentrates on a specific set of energy-related activities). The other two
facilities, the Y-12 Plant (historically a nuclear weapons production
facility; now involved in dismantling weapon components, highly
enriched uranium storage, and collaborative manufacturing efforts with
private industry) and ETTP (formerly a uranium enrichment facility, now
involved in reindustrialization, waste management, and environmental

93
restoration), are not national laboratories and, therefore, do not have
single-program laboratory or multiprogram laboratory designations.
A more precise and objective measure of a facility's level of task
specialization than the DOE "multiprogram laboratory" designation is the
diversity of the facility's funding sources. All of these facilities are funded
primarily through DOE program offices, each of which oversees a
different set of energy-related activities. This funding is sometimes
supplemented by other governmental entities, such as the U.S.
Department of Defense.
This study makes the assumption that, in broad terms, the more sources
of funding an organization has, the more differentiated the set of tasks it
will perform and the more differentiated the organizational structures it
will develop to implement these tasks, report progress back to the
funding sources, document results, etc. This assumption is in line with
Koene, Boone, and Soeters' contention that "the more specialized tasks
are, the more differentiated are [the organization's] units" (Koene, Boone,
and Soeters, 1997). It is this cultural differentiation, or heterogeneity,
that Marcus argues is the key to increasing the likelihood that, in a given

94
organization, an individual will have sufficient resources and interest to
adopt an innovation and begin the diffusion process (Markus, 1987).
Major funding sources for the various facilities are broken down in Table
3.13. The figures include all principal program activities which accounted
for 5% or more of each facility's budget. The breakdown illustrates that
the Y-12 Plant, ETTP, and INEEL facilities receive two-thirds or more of
their funding from a single DOE program office; whereas, ORNL and the
SNL facilities in Albuquerque and Livermore depend on a broader cross-
section of funding sources (funding sources for the two SNL facilities are
combined—separate figures were not available). The relatively diverse
funding of these latter organizations suggests that they exhibit a greater
degree of task specialization. This, in turn, suggests that their level of
cultural differentiation, or heterogeneity, will be greater than that of the
Y-12 Plant, ETTP, and INEEL organizations.
As noted above, organizational heterogeneity is considered by critical
mass theorists to be a key factor in determining the outcome of the
diffusion of interactive technologies, such as internet technology, within
in organizations. Therefore, the hypotheses offered below make

95
Table 3.13 Low-heterogeneity and high-heterogeneity facilities____________________________________________________________________________________
Facility Funding Source____________________________________________________________________________________
Low-Heterogeneity Facilities
Y-12 Plant* 100% DOE Defense Programs
ETTP** 100% DOE Environmental Management
INEEL*** 67% DOE Energy Management 9% DOE Nuclear Energy 9% Other Federal and Non-federal
High-Heterogeneity Facilities
ORNL**** 33% DOE Energy Research19% Work for Others (Including Nuclear
Regulatory Commission)18% DOE Environmental Management14% DOE Energy Efficiency and
Renewable Energy6% Other DOE
SNL (Albuquerque andLivermore Facilities)***** 47% DOE Defense Programs
17% U.S. Department of Defense10% DOE Environmental Management 7% DOE Nonproliferation and National
Security 6% Other Non-DOE
____________________________________________________________________________________*1997 funding figures (U.S. Department of Energy, Oak Ridge Operations, DOE Facts:Y-12 Plant, 1998)**1997 funding figures (U.S. Department of Energy, Oak Ridge Operations, DOE Facts:East Tennessee Technology Park, 1998)***1995 funding figures (U.S. Department of Energy, Office of Energy Research, DOELaboratory Fact Sheets: Idaho National Engineering Laboratory, 1998)****1995 funding figures (U.S. Department of Energy, Office of Energy Research, DOELaboratory Fact Sheets: Oak Ridge National Laboratory, 1998)*****1995 funding figures (U.S. Department of Energy, Office of Energy Research, DOELaboratory Fact Sheets: Sandia National Laboratories, 1998)
96
several assumptions based on differences in organizational heterogeneity
between the two groups of facilities.
Heterogeneity and the Iterative Nature of Internet Technology
A characteristic of many interactive technologies that sets them apart
from non-interactive technologies is the speed with which they evolve. In
the case of traditional technological innovations, like the television for
instance, the initial innovation was followed by a long period of timea
technological plateauduring which the innovation was adequate for the
task it was designed for. For example, a television manufactured in 1940
can still be used to receive broadcast VHF frequencies (channels 2-13)
today.
In the case of internet technology; however, the innovation's rate of
evolution has, for practical purposes, eliminated technological plateaus.
This evolution is best illustrated by the rapid development and
deployment of successive versions of browser or "communication suite"
software. New versions of popular browsers offering enhanced
capabilities appear about every six months (minor upgrades appear at
even closer intervals). In addition, rapid changes in internet technology
have caused browsers that are more than a year or two old to become

97
obsolete for many applications. Other software designed to support
internet-related functions, such as e-mail, multimedia applications, and
database interactivity, are updated at similar intervals.
Because these innovations occur continuously, it has become impractical
to view the adoption process (at least at the organizational level) as a
series of individual adoption acts. Instead, it appears to be a two-stage
process. The first stage is the initial adoption of internet technology. This
stage follows Rogers' familiar steps of knowledge, persuasion, decision,
implementation, and confirmation (Rogers, 1995). Once the first stage is
complete and the adopting organization is committed to using the
technology for critical business processes, it is immediately faced with
changes in the technology—changes that, if left unaddressed, have the
potential to rapidly make their recently-adopted technology obsolete.
Therefore, the second stage of the process is a maintenance loop that
involves the adoption of enhancements and refinements of the original
technology.
This loop magnifies the importance of organizational heterogeneity
because, in order to take full advantage of enhancements to internet
technology, the loop must be completed repeatedly. Critical mass theory

98
suggests that the loop, like the initial adoption process, is more likely to
be completed in heterogeneous organizations. Therefore, because
enhancements and refinements of the technology occur at close intervals,
organizations having the ability to traverse the loop relatively quickly and
relatively often—organizations having greater heterogeneity—have a
competitive advantage over less heterogeneous organizations. In light of
these factors, it is conceivable that less heterogeneous organizations
could eventually lag several generations behind the state-of-the-art in
their implementation of internet technology, adopting refinements only
as the business cost of not doing so becomes prohibitive.
Discussion of Hypotheses
The hypotheses addressed by this study are listed below and then
discussed in detail.
• H1: Mean Internet Use Index scores will be higher at facilities having
greater heterogeneity.
• H2: Mean Internet Attitude Index scores will be higher at facilities
having greater heterogeneity.
• H3: Mean Organizational Support Index scores will be higher at
facilities having greater heterogeneity.

99
• H4: Managers' mean Internet Use Index scores will be higher at
facilities having greater heterogeneity.
• H5: Perceived management support for internet technology will be
higher at facilities having greater heterogeneity.
• H6: In a regression model containing both Organizational Support and
Individual Adoption variables, the relationship between Organizational
Support and Internet Use will be stronger at low-heterogeneity
facilities and weaker at high-heterogeneity facilities, while the
relationship between Individual Adoption and Internet Use will be
weaker at low-heterogeneity facilities and stronger at high-
heterogeneity facilities.
• H7: In a regression model containing both the Organizational Support
and Individual Adoption variables, the relationship between Individual
Adoption and Internet Attitude will be weaker at low-heterogeneity
facilities and stronger at high-heterogeneity facilities, while the
relationship between Organizational Support and Internet Attitude
will be stronger at low-heterogeneity facilities and weaker at high-
heterogeneity facilities.

100
Hypothesis 1
Mean Internet Use Index scores will be higher at facilities having greater
heterogeneity.
To test H1, mean Internet Use Index scores for each facility were
calculated. As Table 3.14 illustrates, when these scores are arranged in a
hierarchy, a pattern very similar to that which characterizes the
previously mentioned high- and low-heterogeneity facility groupings
appearsthe only difference being that the ORNL and ETTP scores are
virtually identical. To ensure that the means for these high- and low-
heterogeneity groupings were significantly different, a t-test was
performed. As shown in Table 3.15, significant differences (t=8.489;
p<.001) exist between the means of the two groups.
A somewhat clearer demonstration of H1 may be obtained by eliminating
the Oak Ridge facilities (ETTP, ORNL, and the Y-12 Plant) from the
analysis. The rationale for doing so is that, until January of 1997, these
three facilities were part of the same organization (Energy Systems)
within Lockheed Martin Corporation. As a result, despite differences in
their funding sources, they were operated as a single organization. In
January of 1997, ORNL separated from ETTP and the Y-12 Plant,

101
Table 3.14 Mean Internet Use Index scores by facility________________________________________________________________________
N Mean________________________________________________________________________
INEEL 547 3.1578Y-12 Plant 384 3.3403ORNL 503 3.5199ETTP 453 3.5206SNL - Albuquerque 521 3.5809SNL - Livermore 288 3.6383________________________________________________________________________
Table 3.15 Planned comparison of mean Internet Usebetween high- and low-heterogeneity facilities(N=2696)
_________________________________________________________________________Mean df t
_________________________________________________________________________
Low-Heterogeneity Facilities 3.3272ETTP, INEEL,Y-12 Plant
vs. 2694 8.489*
High-Heterogeneity Facilities 3.5701ORNL, SNL - Albuquerque,SNL - Livermore_________________________________________________________________________* p < .001

102
becoming a separate organization (Energy Research). Therefore, it can be
argued that, at the time of the survey, these facilities were still in the
process of developing their own distinctive approaches to implementing
internet technology and were still exerting a moderating influence on one
another in many areas of information technology, including the use of
internet technology. Table 3.16 illustrates that, when the Oak Ridge
facilities are removed from the analysis, somewhat larger differences
(t=10.815; p<.001) appear between the mean scores of the remaining
high- and low-heterogeneity facilities. All of these findings support H1.
Investigation of the data pertinent to H1 also revealed tentative evidence
of an effect identified by Fichman and Kemerer (1995) as the
"assimilation gap," a lag, between the acquisition of a technology and its
actual use or deployment (discussed in Chapter I). This evidence came to
light in an examination of responses to item S4_5 (the fifth item in
section 4 of the survey shown below). This item, a component of the
Internet Use index, is a simple measure of the complexity of tasks
respondents are using internet technology to complete:
5) Which of the following combinations of work-related tasks best describes what youuse internet technology for at work on a regular basis? (Choose only one)
a) nothingb) finding organizational informationc) finding organizational information, performing administrative tasks
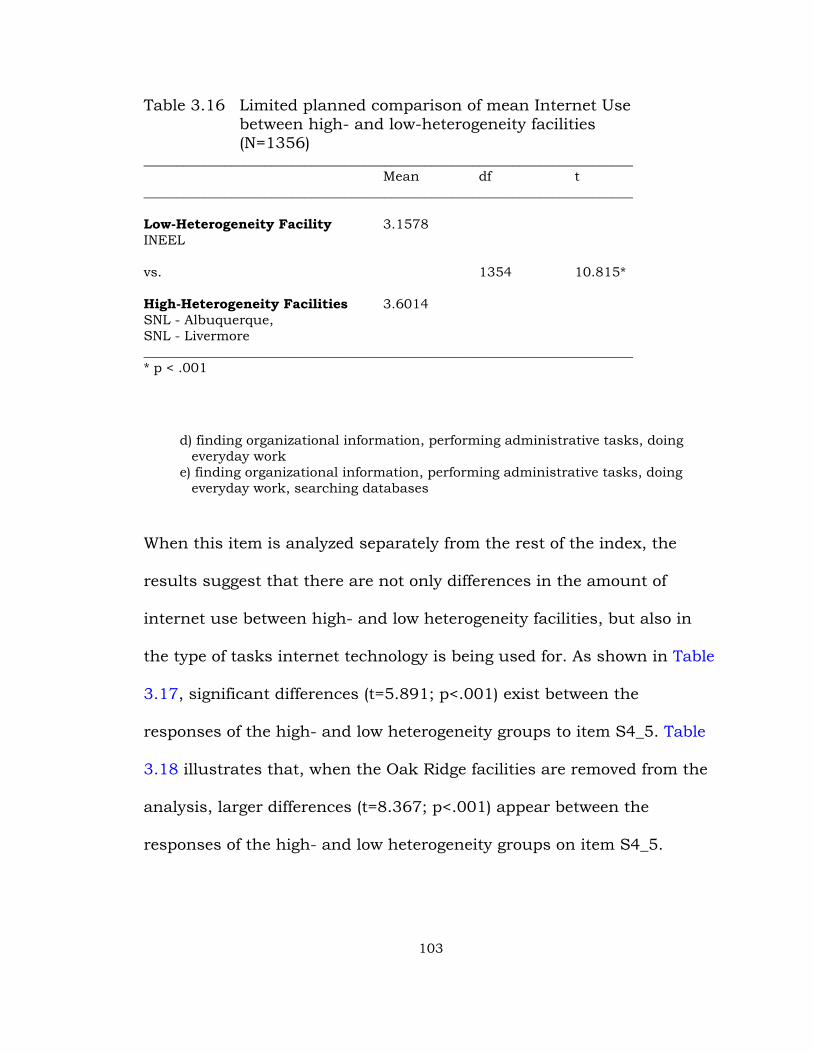
103
Table 3.16 Limited planned comparison of mean Internet Usebetween high- and low-heterogeneity facilities(N=1356)
_________________________________________________________________________Mean df t
_________________________________________________________________________
Low-Heterogeneity Facility 3.1578INEEL
vs. 1354 10.815*
High-Heterogeneity Facilities 3.6014SNL - Albuquerque,SNL - Livermore_________________________________________________________________________* p < .001
d) finding organizational information, performing administrative tasks, doingeveryday work
e) finding organizational information, performing administrative tasks, doingeveryday work, searching databases
When this item is analyzed separately from the rest of the index, the
results suggest that there are not only differences in the amount of
internet use between high- and low heterogeneity facilities, but also in
the type of tasks internet technology is being used for. As shown in Table
3.17, significant differences (t=5.891; p<.001) exist between the
responses of the high- and low heterogeneity groups to item S4_5. Table
3.18 illustrates that, when the Oak Ridge facilities are removed from the
analysis, larger differences (t=8.367; p<.001) appear between the
responses of the high- and low heterogeneity groups on item S4_5.
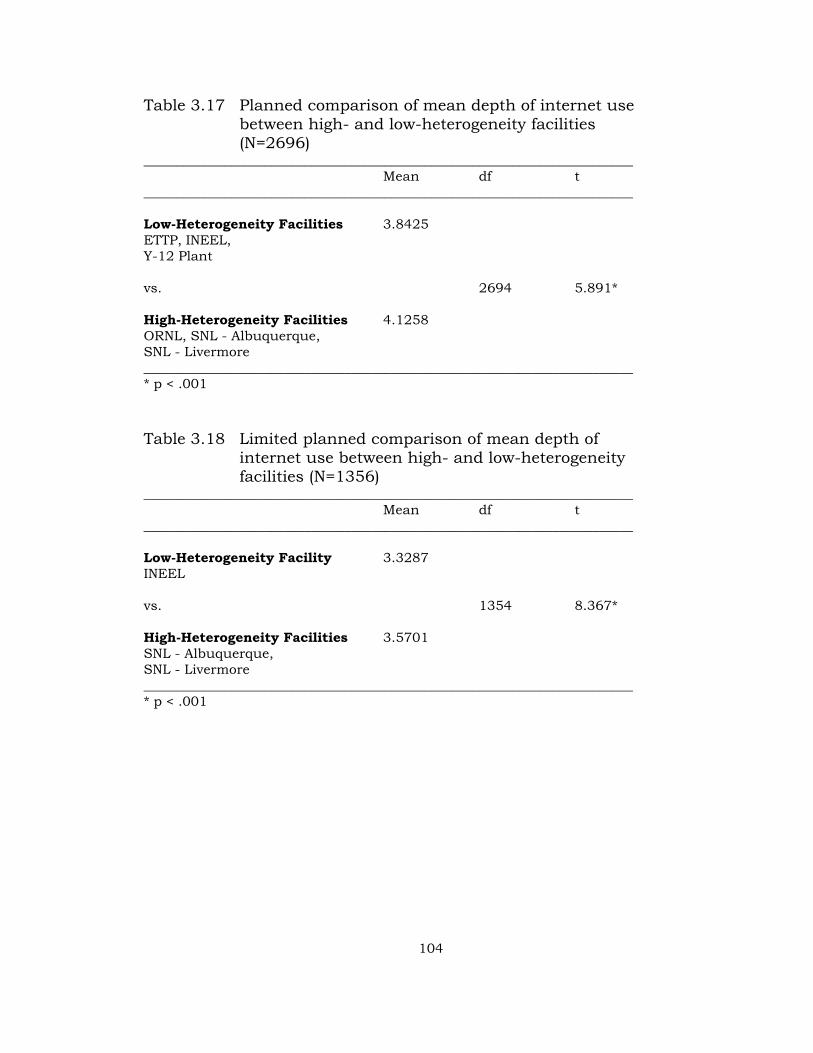
104
Table 3.17 Planned comparison of mean depth of internet usebetween high- and low-heterogeneity facilities(N=2696)
_________________________________________________________________________Mean df t
_________________________________________________________________________
Low-Heterogeneity Facilities 3.8425ETTP, INEEL, Y-12 Plant
vs. 2694 5.891*
High-Heterogeneity Facilities 4.1258ORNL, SNL - Albuquerque,SNL - Livermore_________________________________________________________________________* p < .001
Table 3.18 Limited planned comparison of mean depth ofinternet use between high- and low-heterogeneityfacilities (N=1356)
_________________________________________________________________________Mean df t
_________________________________________________________________________
Low-Heterogeneity Facility 3.3287INEEL
vs. 1354 8.367*
High-Heterogeneity Facilities 3.5701SNL - Albuquerque,SNL - Livermore_________________________________________________________________________* p < .001

105
Whether or not this is a case of replacing "old tools with new ones,"
rather than taking advantage of the technology's higher-level features as
Liker, Fleischer, and Arnsdorf found in their study of CAD technology
systems (Liker, Fleischer, and Arnsdorf, 1992) is a subject for further
research. However, the data suggest that adoption, use, and assimilation
of internet technology can be three very different things.
Hypothesis 2
Mean Internet Attitude Index scores will be higher at facilities having
greater heterogeneity.
One might expect the difference between high- and low-heterogeneity
facilities to be less pronounced in this comparison than in that
considered in the analysis of Hypothesis 1 because, while organizations
can effectively control the extent of their employees' internet use at work
(The focus of H1), they have considerably less influence over employees'
internet use habits outside the workplace and, as a result, less influence
over the attitudes employees form with regard to internet technology (the
focus of H2).
To test H2, mean Internet Attitude Index scores for each facility were
calculated. As Table 3.19 illustrates, when these scores are broken down
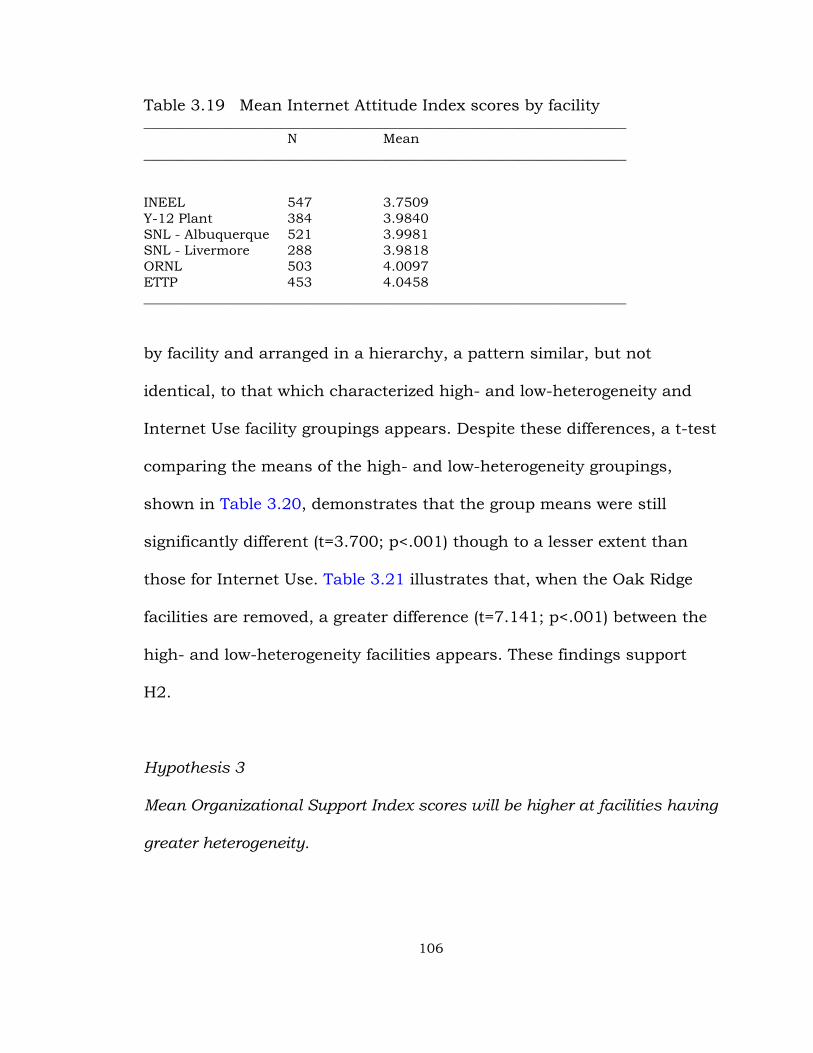
106
Table 3.19 Mean Internet Attitude Index scores by facility________________________________________________________________________
N Mean________________________________________________________________________
INEEL 547 3.7509Y-12 Plant 384 3.9840SNL - Albuquerque 521 3.9981SNL - Livermore 288 3.9818ORNL 503 4.0097ETTP 453 4.0458________________________________________________________________________
by facility and arranged in a hierarchy, a pattern similar, but not
identical, to that which characterized high- and low-heterogeneity and
Internet Use facility groupings appears. Despite these differences, a t-test
comparing the means of the high- and low-heterogeneity groupings,
shown in Table 3.20, demonstrates that the group means were still
significantly different (t=3.700; p<.001) though to a lesser extent than
those for Internet Use. Table 3.21 illustrates that, when the Oak Ridge
facilities are removed, a greater difference (t=7.141; p<.001) between the
high- and low-heterogeneity facilities appears. These findings support
H2.
Hypothesis 3
Mean Organizational Support Index scores will be higher at facilities having
greater heterogeneity.
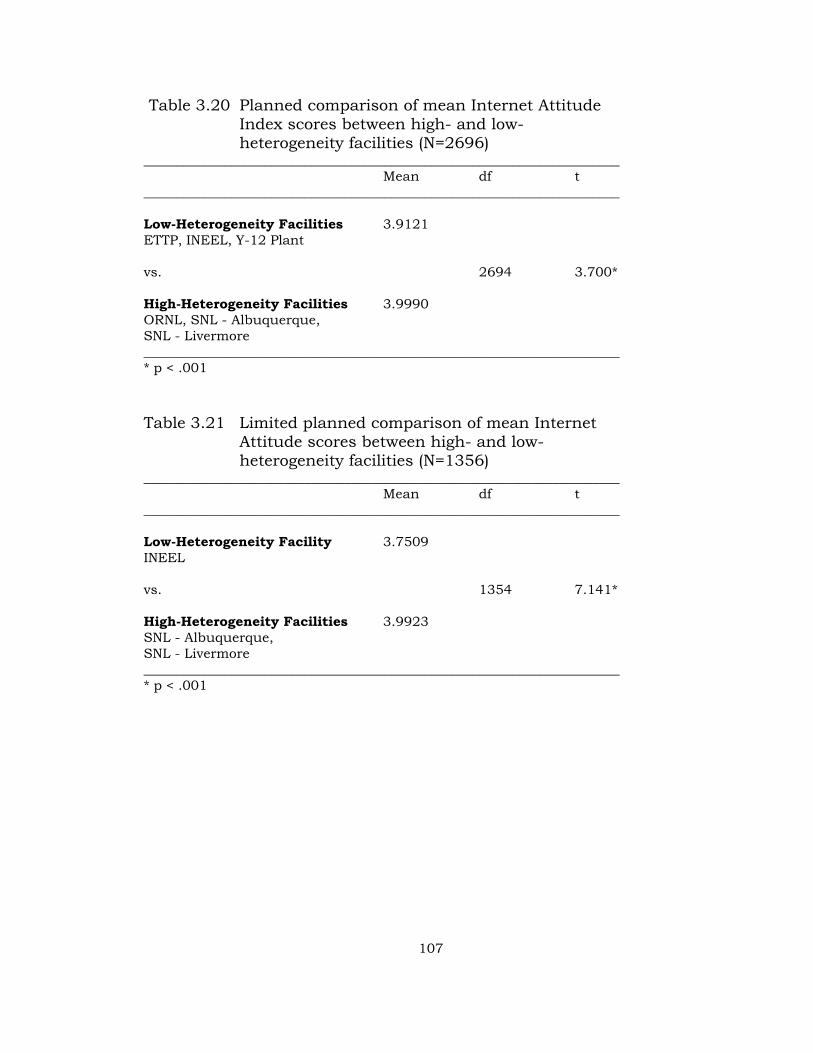
107
Table 3.20 Planned comparison of mean Internet AttitudeIndex scores between high- and low-heterogeneity facilities (N=2696)
_______________________________________________________________________Mean df t
_______________________________________________________________________
Low-Heterogeneity Facilities 3.9121ETTP, INEEL, Y-12 Plant
vs. 2694 3.700*
High-Heterogeneity Facilities 3.9990ORNL, SNL - Albuquerque,SNL - Livermore_______________________________________________________________________* p < .001
Table 3.21 Limited planned comparison of mean InternetAttitude scores between high- and low-heterogeneity facilities (N=1356)
_______________________________________________________________________Mean df t
_______________________________________________________________________
Low-Heterogeneity Facility 3.7509INEEL
vs. 1354 7.141*
High-Heterogeneity Facilities 3.9923SNL - Albuquerque,SNL - Livermore_______________________________________________________________________* p < .001

108
As Table 3.22 illustrates, when these scores are broken down by facility
and arranged in a hierarchy, the pattern that characterizes the
previously established high- and low-heterogeneity facility groupings
again appear. To ensure that the means for these high- and low-use
groupings were significantly different, a t-test was performed. As shown
in Table 3.23, significant differences (t=9.615; p < .001) exist between the
means of the two groups. Table 3.24 illustrates that, when the Oak Ridge
facilities are removed, a somewhat greater difference (t=10.272; p<.001)
between the high- and low-heterogeneity facilities appears. These
findings support H3.
Hypothesis 4
Managers at facilities having higher mean Internet Use Index scores will
have significantly higher mean Internet Use Index scores.
To test H4, the 284 responses from respondents who identified
themselves as managers were divided into the high-and low-use facility
groupings, and a t-test was performed to determine whether significant
differences existed between their mean Internet Use Index scores. Table
3.25 shows that no significant differences exist between the means of the
two groups. Table 3.26 illustrates that, when the Oak Ridge facilities are
removed, a slightly greater, yet still insignificant, difference appears
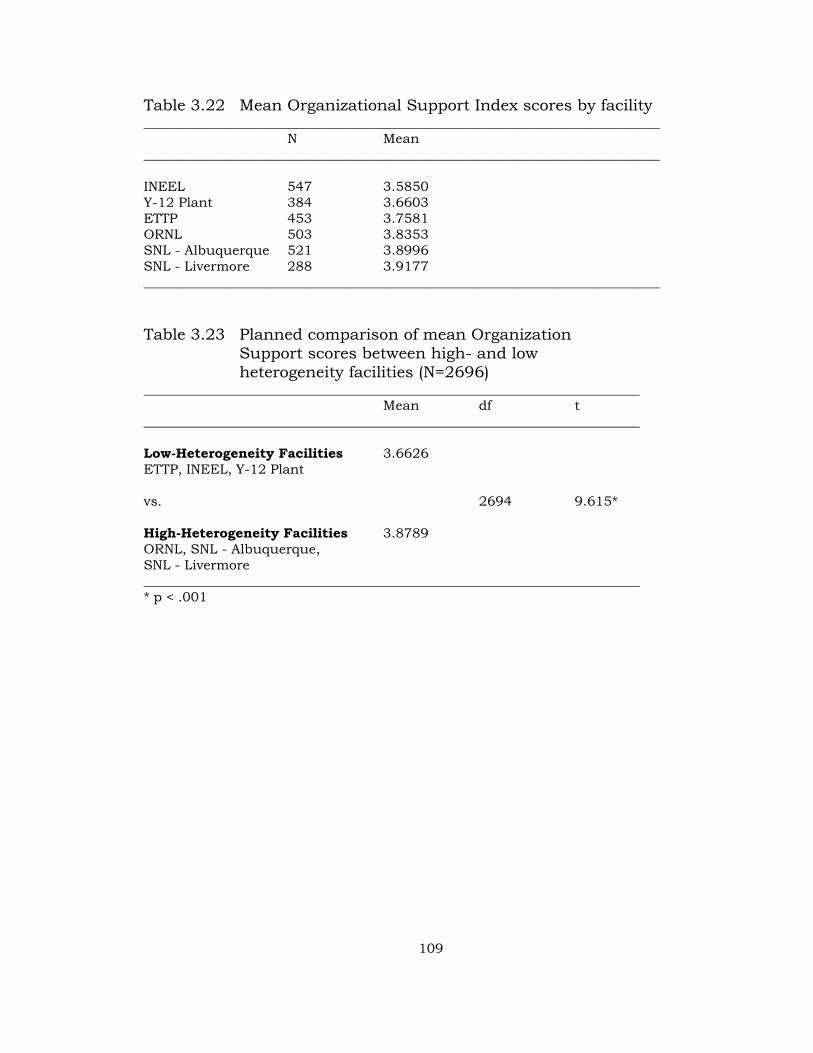
109
Table 3.22 Mean Organizational Support Index scores by facility_____________________________________________________________________________
N Mean_____________________________________________________________________________
INEEL 547 3.5850Y-12 Plant 384 3.6603ETTP 453 3.7581ORNL 503 3.8353SNL - Albuquerque 521 3.8996SNL - Livermore 288 3.9177_____________________________________________________________________________
Table 3.23 Planned comparison of mean OrganizationSupport scores between high- and lowheterogeneity facilities (N=2696)
__________________________________________________________________________Mean df t
__________________________________________________________________________
Low-Heterogeneity Facilities 3.6626ETTP, INEEL, Y-12 Plant
vs. 2694 9.615*
High-Heterogeneity Facilities 3.8789ORNL, SNL - Albuquerque,SNL - Livermore__________________________________________________________________________* p < .001

110
Table 3.24 Limited planned comparison of mean OrganizationSupport scores between high- and lowheterogeneity facilities (N=1356)
__________________________________________________________________________Mean df t
__________________________________________________________________________
Low-Heterogeneity Facility 3.5850INEEL
vs. 1354 10.272*
High-Heterogeneity Facilities 3.9061SNL - Albuquerque,SNL - Livermore__________________________________________________________________________* p < .001
Table 3.25 Planned comparison of mean Internet Usebetween managers from high- and low-heterogeneity facilities (N=284)
______________________________________________________________________Mean df t
______________________________________________________________________
Low-Heterogeneity FacilitiesETTP, INEEL, Y-12 Plant 3.5159
vs. 282 .334
High-Heterogeneity FacilitiesORNL, SNL - Albuquerque, 3.5420SNL - Livermore______________________________________________________________________

111
Table 3.26 Limited planned comparison of mean InternetUse between managers from high- and low-heterogeneity facilities (N=123)
_______________________________________________________________________Mean df t
_______________________________________________________________________
Low-Heterogeneity FacilityINEEL 3.3243
vs. 121 1.027
High-Heterogeneity FacilitiesSNL - Albuquerque, 3.4651SNL - Livermore_______________________________________________________________________
between the high- and low-heterogeneity facilities. These findings fail to
support H4.
Hypothesis 5
Perceived management support for internet technology will be higher at
facilities having greater heterogeneity.
As Table 3.27 illustrates, when these scores are broken down by facility
and arranged in a hierarchy, the previously established high- and low-
heterogeneity facility groupings again appear. To ensure that the means
for these high- and low-heterogeneity groupings were significantly
different, a t-test was performed. As shown in Table 3.28, significant
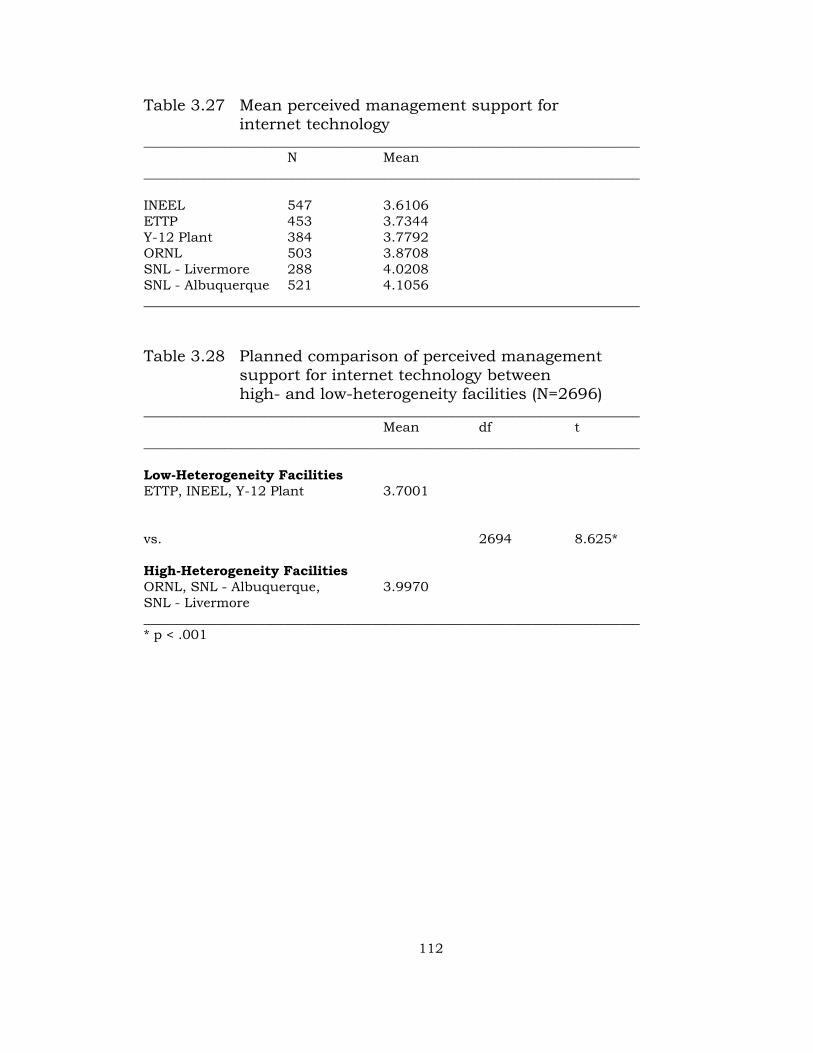
112
Table 3.27 Mean perceived management support forinternet technology
__________________________________________________________________________N Mean
__________________________________________________________________________
INEEL 547 3.6106ETTP 453 3.7344Y-12 Plant 384 3.7792ORNL 503 3.8708SNL - Livermore 288 4.0208SNL - Albuquerque 521 4.1056__________________________________________________________________________
Table 3.28 Planned comparison of perceived managementsupport for internet technology betweenhigh- and low-heterogeneity facilities (N=2696)
__________________________________________________________________________Mean df t
__________________________________________________________________________
Low-Heterogeneity FacilitiesETTP, INEEL, Y-12 Plant 3.7001
vs. 2694 8.625*
High-Heterogeneity FacilitiesORNL, SNL - Albuquerque, 3.9970SNL - Livermore__________________________________________________________________________* p < .001

113
differences (t=8.625; p < .001) exist between the means of the two
groups. Table 3.29 illustrates that, when the Oak Ridge facilities are
removed, a somewhat greater difference (t=9.616; p<.001) between high-
and low-heterogeneity facilities appears. These findings support H5.
Hypothesis 6
In a regression model containing both Organizational Support and
Individual Adoption variables, the relationship between Organizational
Support and Internet Use will be stronger at low-heterogeneity facilities and
weaker at high-heterogeneity facilities, while the relationship between
Individual Adoption and Internet Use will be weaker at low-heterogeneity
facilities and stronger at high-heterogeneity facilities.
This hypothesis assumes that organizational support for internet
technology has potential effects ranging from passive encouragement of
the use of internet technology at high-heterogeneity facilities to active
discouragement of its use at low-heterogeneity facilities. Therefore, the
Organizational Support variable will have greater influence over the use
of internet technology where it is the most activethat is at low-
heterogeneity facilities. The hypothesis goes on to assert that, as a result
of this variation in organizational support, individual adoption decisions
will have greater influence over the use of internet technology at high-

114
Table 3.29 Limited planned comparison of perceived managementsupport for internet technology betweenhigh- and low-heterogeneity facilities (N=1356)
___________________________________________________________________________Mean df t
___________________________________________________________________________
Low-Heterogeneity FacilityINEEL 3.6106
vs. 1354 9.616*
High-Heterogeneity FacilitiesSNL - Albuquerque, 4.0754SNL - Livermore___________________________________________________________________________* p < .001
heterogeneity facilities (where such decisions are less constrained by the
organization) than at low-heterogeneity facilities.
Hypothesis 6 was tested using hierarchical multiple regression. Because
large data sets tend to skew the results of significance testing in multiple
regression procedures, resulting in significance scores that suggest
stronger relationships among variables than may actually exist, Beta
coefficients were used to measure the relative strength of the
relationships between each of the independent variables and the
dependent variable. Unlike significance tests, correlation coefficients
provide a measure of the strength of relationships between variables that
is relatively independent of sample size.

115
The results of this procedure are shown in Table 3.30. As suggested by
H6, the relationship between Organizational Support and Internet Use
was strongest at low-heterogeneity facilities (Beta =.190 vs. .126;
p<.001). However, the relationship between Individual Adoption and
Internet Use was also strongest at low-heterogeneity facilities (Beta =.554
vs. .510; p<.001). Table 3.31 illustrates that, when the Oak Ridge
facilities are removed, a similar pattern appears. Again the relationship
between Organizational Support and Internet Use was slightly stronger at
low-heterogeneity facilities (Beta =.133 vs. .117; p<.001). However, the
relationship between Individual Adoption and Internet Use was again
strongest at low-heterogeneity facilities (Beta =.615 vs. .462; p<.001).
While these results support the contention that the Organizational
Support variable exerts a somewhat greater influence over Internet Use
at low-heterogeneity facilities than at high-heterogeneity facilities, the
Organizational Support variable apparently does not interact in a
reciprocal-like fashion with the Individual Adoption variable (the
Organizational Support Index score rising when the Individual Attitude
Index scores falls, and vice versa).
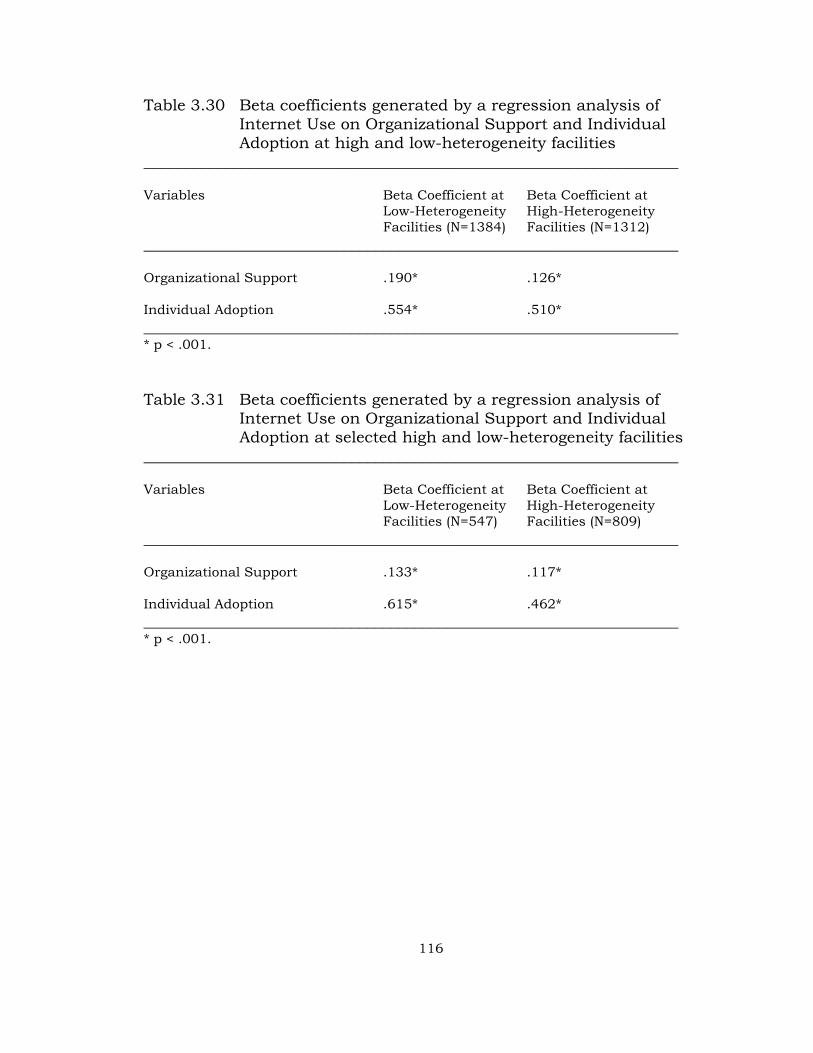
116
Table 3.30 Beta coefficients generated by a regression analysis ofInternet Use on Organizational Support and IndividualAdoption at high and low-heterogeneity facilities
___________________________________________________________________
Variables Beta Coefficient at Beta Coefficient atLow-Heterogeneity High-HeterogeneityFacilities (N=1384) Facilities (N=1312)
___________________________________________________________________
Organizational Support .190* .126*
Individual Adoption .554* .510*___________________________________________________________________* p < .001.
Table 3.31 Beta coefficients generated by a regression analysis ofInternet Use on Organizational Support and IndividualAdoption at selected high and low-heterogeneity facilities
___________________________________________________________________
Variables Beta Coefficient at Beta Coefficient atLow-Heterogeneity High-HeterogeneityFacilities (N=547) Facilities (N=809)
___________________________________________________________________
Organizational Support .133* .117*
Individual Adoption .615* .462*___________________________________________________________________* p < .001.

117
These findings partially support H6 and present new questions regarding
the relationships among the Organizational Support, Individual Adoption
and Internet Use variables.
Hypothesis 7
In a regression model containing both the Organizational Support and
Individual Adoption variables, the relationship between Individual Adoption
and Internet Attitude will be weaker at low-heterogeneity facilities and
stronger at high-heterogeneity facilities, while the relationship between
Organizational Support and Internet Attitude will be stronger at low-
heterogeneity facilities and weaker at high-heterogeneity facilities.
This hypothesis asserts that organizational support for internet
technology (or the lack thereof) will have greater influence over attitudes
toward internet technology at low-heterogeneity facilities than at high-
heterogeneity facilities. It goes on to assert that, as a result of this
variation in organizational support, individual adoption decisions will
have greater influence over the attitudes toward internet technology at
high-heterogeneity facilities (where such decisions are less constrained
by the organization) than at low-heterogeneity facilities.

118
Hypothesis 7 was tested using hierarchical multiple regression. Because
large data sets tend to skew the results of significance testing in multiple
regression procedures, resulting in significance scores that suggest
stronger relationships among variables than may actually exist, Beta
coefficients were used to measure the strength of the relationships
between each of the independent variables and the dependent variable.
The results of this procedure are shown in Table 3.32. As suggested by
H7, the relationship between Organizational Support and Internet
Attitude was strongest at low-heterogeneity facilities (Beta =.259 vs. .203;
p<.001). However, the relationship between Individual Adoption and
Internet Attitude was virtually identical at both high- and low-
heterogeneity facilities (Beta =.484 at low-heterogeneity facilities vs. .482
at high-heterogeneity facilities; p<.001). Table 3.33 illustrates that, when
the Oak Ridge facilities are removed, the relationship between
Organizational Support and Internet Attitude is again strongest at low-
heterogeneity facilities (Beta =.265 vs. .165; p<.001). In addition, the
relationship between Individual Adoption and Internet Attitude is slightly
stronger, as predicted by H7, at high-heterogeneity facilities (Beta =.491
vs. .470; p<.001).

119
Table 3.32 Beta coefficients generated by a regression analysis ofInternet Attitude on Organizational Support andIndividual Adoption at high and low-heterogeneityfacilities
______________________________________________________________________________
Variables Beta Coefficient at Beta Coefficient atLow-Heterogeneity High-HeterogeneityFacilities (N=1384) Facilities (N=1312)
______________________________________________________________________________
Organizational Support .259* .203*
Individual Adoption .484* .482*______________________________________________________________________________* p < .001.
Table 3.33 Beta coefficients generated by a regression analysis ofInternet Attitude on Organizational Support andIndividual Adoption at selected high and low-heterogeneity facilities
______________________________________________________________________________
Variables Beta Coefficient at Beta Coefficient atLow-Heterogeneity High-HeterogeneityFacilities (N=547) Facilities (N=809)
______________________________________________________________________________
Organizational Support .265* .165*
Individual Adoption .470* .491*______________________________________________________________________________* p < .001.

120
Therefore, while these results support the contention that the
Organizational Support variable exerts a somewhat greater influence over
Internet Attitude at low-heterogeneity facilities at high-heterogeneity
facilities, there is little indication that the Organizational Support
variable interacts in a reciprocal-like fashion with the Individual
Adoption variable (the Organizational Support Index score rising when
the Individual Attitude Index scores falls, and vice versa).
These findings partially support H7 and present new questions regarding
the relationships among the Organizational Support, Individual Adoption
and Internet Adoption variables.

121
Chapter IV
Discussion and Conclusions
Since the public release of the first web browser software in 1993, the
internet—or more precisely, internet technology—has become the lingua
franca for an increasingly large number of communication systems
around the world. Nowhere is this trend more apparent than in large
corporations, where internet technology in the form of corporate
intranets is becoming the standard means of communicating among
employees, between employees and corporate information systems, and
between employees and the internet.
Despite this accelerating trend toward broader application of internet
technology, few studies have sought to determine which factors influence
the diffusion of internet technology—either in society in general or in an
organizational setting. As noted in Chapter I, a number of studies
conducted since the mid 1970s have explored the diffusion of the use of
computers, various forms of information technology, and internet
precursors, such as BITNET and electronic messaging systems. However,
studies that address internet technology either deal indirectly with the
122
issue of diffusionin the course of gathering marketing information, for
exampleor they deal with a very specialized aspect of the diffusion
process, as do LaRose and Hoag in their examination of the role of
innovation clusters in the adoption of internet technology by
organizations (LaRose and Hoag, 1996).
To begin to provide a broader view of the process by which internet
technologies are adopted by organizations, this study examined how
organizational and individual/interpersonal factors influence the
diffusion process. The results of this analysis should help to clarify the
applicability of both sets of factors to interactive media in general and to
internet technology in particular.
Theoretical Implications
Effects of Organizational Heterogeneity
Critical mass theorists from Marwell and Oliver to Markus have stressed
the importance of heterogeneity of interests and resources to the process
of starting and sustaining collective action. In the case of this study, the
collective action of note is the diffusion and adoption of internet
technology within organizations. The findings of this study provide broad
support for the contention that organizational heterogeneitydefined as

123
a diversity of resources and interests and measured by the diversity of
organizational funding sourcescatalyzes the diffusion process. In
particular, the study finds that organizational heterogeneity is positively
related to (a) the use of internet technology, (b) attitudes toward internet
technology, (c) organizational support for internet technology, and (d)
perceived managerial support of internet technology. It should be noted
that funding diversity has apparently not been used previously as a
measure of organizational heterogeneity, and further research into its
effectiveness as a predictor is needed to determine its appropriateness.
Relationship Between Organizational and Individual/Interpersonal Factors
The findings of this study also suggest that level of organizational
support for internet technology has a greater impact on internet use and
attitudes toward internet technology at low-heterogeneity facilities than
at high-heterogeneity facilities. This relationship translates into lower
levels of support, use and attitude at low-heterogeneity facilities and
higher levels at high-heterogeneity facilities. In light of the associations
among these variables, two generalizations regarding the influence of
organizational support on the use of, and attitudes toward, internet
technology in high- and low-heterogeneity organizations can be made:

124
• High-heterogeneity organizations tend to create an environment
within which organizational factors enable the diffusion reaction to
proceed unimpeded—possibly reaching critical mass.
• Low-heterogeneity organizations tend to create an environment within
which organizational factors moderate the diffusion reaction, either
slowing or stopping its progress toward critical mass.
These findings suggest that critical mass theory provides a set of
organizational environment variables within which traditional,
individual/interpersonal diffusion of innovation variables operate under
greater or lesser constraints. Rather than defining divergent views of the
diffusion process, critical mass theory and traditional diffusion of
innovation theory seem to provide complementary explanations of
different aspects of the process by which interactive innovations diffuse
through organizations. Further research into the interaction between
organizational and individual/interpersonal factors is needed to
determine the precise nature of their relationship.
Evidence of an Assimilation Gap
An unintended finding of this study is evidence of an effect identified by
Fichman and Kemerer (1995) as the "assimilation gap"—a lag, between
125
the acquisition of a technology and its actual use or deployment. As
suggested in Chapter I, consideration of this phenomenon may be
particularly important in studies of the diffusion of clustered
technologies, such as internet technology, because the composite nature
of these innovations enables the extent of their implementation to be
effectively camouflaged by broad measures of use. As noted in Chapter
III, five hours a week reading e-mail does not represent the same level of
implementation as five hours a week querying on-line databases, yet
both scenarios represent five hours of internet technology use.
While this study provides limited evidence of an assimilation gap, further
research will be required to determine whether such an effect is actually
present and whether it is inherent to the implementation of clustered
innovations in general and interactive technologies in particular. Such
research might also explore the long-term effects of "moderating" the
diffusion of rapidly evolving, or iterative, innovations and whether this
practice leads simply to increasingly late implementation of innovations
or to disruptive technological "leapfrogging"—skipping several
generations of technology in an attempt to rapidly achieve technological
currency. Similarly, future research should also consider whether the
assimilation gap behaves like Tichenor, Donohue and Olien's "knowledge

126
gap" (Tichenor, Donohue and Olien, 1965) and tends to widen over time,
making the technologically rich progressively richer and the poor poorer.
Importance of Management Support
As mentioned in Chapter I, several studies in recent years have
suggested that organizational management plays a critical role in the
adoption and diffusion of computer-related technologies. In his
discussion of critical mass theory, Rogers notes that the composition of
the community of adopters of interactive technology can influence the
level at which critical mass is attained: "a small number of highly
influential individuals who adopt a new idea may represent a stronger
critical mass than a very large number of individual adopters who have
little influence" (Rogers, 1995). This highly influential group may also be
in a position to "provide resources for the adoption of an interactive
technology and thus lower individuals' perceived cost of adopting"
(Rogers, 1995).
Although none of this study's hypotheses directly consider the effect of
management support on the use of internet technology, the fact that (a)
perceived management support for internet technology rises and falls
with organizational heterogeneity, (b) management is influential by

127
definition, and (c) management is in a position to provide or withhold
resources for the adoption of internet technology suggests that
organizational management controls whether the diffusion of internet
technology within the organization is moderated some extent or allowed
to proceed unimpeded.
It may be worthwhile to note that while levels of internet use are
significantly different at high- and low-heterogeneity facilities, levels of
internet use by managers at high- and low-heterogeneity facilities are
virtually identical. The underlying cause of this disparity is not readily
apparent; however, it recall's Abdul-Gader and Kozar's observation
regarding managerial control of access to technology through their
control of financial resources. The authors note that, "the manager who
is confident that computers will not challenge his/her control is more
likely to purchase than the one who perceives threats from computers"
(Abdul-Gader and Kozar, 1995).
Additional research is needed to determine not only the extent of
management's ability to influence the diffusion reaction but also whether
the level or direction of managerial influence is dependent upon the level
of organizational heterogeneity or operates independently of it.

128
Limitations and Directions for Future Research
External Validity
The primary limitation of this study is its external validity. First, there is
the question of whether survey respondents are like non-respondents. As
noted in Chapter II, the percentage of survey responses received from
respondents without e-mail addresses was well below the percentage of
the survey population without e-mail addresses. This result suggests that
respondents tended to be more familiar with internet technology than
non-respondents. This result was not unexpected and seems to be a
result of individuals who are less familiar with internet technology
choosing not to participate in the survey. The external validity of the
study also would have been enhanced by the addition of a comparison of
demographic information between the survey population and survey
respondents to determine whether systematic difference existed between
the two groups; however such information was not readily available.
The second question of external validity concerns the extent to which the
study's findings may be generalized beyond the six participating
organizations. It seems reasonable to suggest that the findings of this
study could be applied to other organizations engaged in large-scale
research and development and/or engineering efforts, based on the

129
similarities of their activities, to the organizations participating in the
study. One would expect the findings to be particularly applicable to
government-related organizations active in these fields. The demographic
profile of the participating organizations, at least in terms of educational
and occupational backgrounds, also suggests that the findings may be
applicable to large private-sector research corporations, as well as
technically oriented academic institutions.
While it would not be surprising to discover that the survey's findings
were applicable to a wider range of organizations and populations, there
is nothing in the current study to suggest a broader applicability.
Further research into the diffusion of internet technology in other types
of organizations would be required to construct credible hypotheses in
this area.
Pretest Sample
It is conceivable that the nature of the pretest sample used in this study
could have had an impact of the quality of the final survey. As noted in
Chapter II, pretest respondents were found to be somewhat younger and
somewhat more likely to be female that final survey respondents;
additionally, the pretest sample was relatively small. Concerns related to

130
the quality of the pretest sample are significant because results from the
pretest were used to refine the indexes employed in this study. It is
possible that pretest sample could have been sufficiently atypical as to
have affected the reliability measures, which in turn would have affected
which index items were deleted or retained. However, the reliability
scores achieved by all of the indexes used in the pretest were well above
the minimum accepted level, making it is unlikely that irregularities in
the pretest sample would have any substantive impact on the results of
the final survey.
Management Support for Completing the Survey
It is possible that potential respondents could have chosen not to
complete the survey based on a perception that their management would
frown on their participation. Therefore, perceived variations in
management's support for completing the survey could be a limitation of
this study and may have caused corresponding variations in the number
of survey responses received from various facilities. This concern is
addressed to some extent by the fact that survey response rates across
the six facilities were fairly similar, ranging from approximately 24% to
34%. It is noteworthy that the highest response rate came from the
facility having the lowest mean score for perceived management support

131
of internet technology. These facts, combined with the anonymity of
responses suggest that it is unlikely that the perceived level of
management support for completing the survey played a significant role
in determining who responded to the survey.
Definition of Organizational Heterogeneity
The decision to measure organizational heterogeneity in terms of
diversity of organizational funding sources could be considered a
limitation of this study. While the contention that funding diversity is a
reasonable measure of task specialization seems sound on its face, it is
apparently not a measure of organizational heterogeneity that has been
previously employed or studied. Further research into both the
appropriateness of funding diversity as a measure of organizational
heterogeneity and into alternative measures of organizational
heterogeneity will be necessary to effectively address this question.
Self-Selection
Clearly, any random survey runs the risk of attracting an atypical group
of respondents. It could be argued that, even in a random sample, some
respondents will be more motivated to respond than others (perhaps
those most and least well-disposed toward the technology). This

132
possibility is counterbalanced to some extent by the fact that the survey
was made available in three different formats to accommodate the
technological comfort level of a wide range of respondents.
Self-Reporting
Any study that relies solely on the word of the individual, without some
means of independent confirmation, is subject to self-reporting error.
Unfortunately, tools that measure the fine details of internet usage are
not generally available, and where they are, they are most often
configured to record and monitor organization-level statistics, rather
than to characterize individual internet use. It should also be noted that
many of the concepts addressed in this study, such as attitudes toward
internet technology and perceptions of support for internet technology,
are most accessible using a self-reporting format. Concern over self-
reporting is addressed to some extent by employing indexes (rather than
individual survey items) to measure the key concepts in this study, such
as internet use and internet attitude. This approach, Babbie notes,
"avoids the biases inherent in single items" (Babbie, 1973). In addition,
the anonymity provided by the largely automated administration and
collection of the form should have encouraged honest responses.
133
Multiple Survey Formats
The fact that the survey was administered in three formats (web, e-mail
and paper) could be considered a threat to the survey's validity. Ideally,
the survey would have been administered in a single format under
identical circumstances for all respondents; however, that wasn't a
practical possibility for a survey of this geographical breadth.
Additionally, using a single survey format could have posed an even
greater threat to the survey's validity by excluding, for practical
purposes, respondents who felt uncomfortable with (or had restricted
access to) whichever medium was chosen.
Summary
The history of technological innovation is dominated by instances and
moments, by snapshots and singular achievements—the Folsom point,
the printing press, the automobile, the internet. However, these
snapshots don't tell us much about how innovation works. By the same
token, an organization doesn't simply decide to use an innovation; the
innovation is adopted as a result of a process that involves a variety of
organizational and individual/interpersonal factors.

134
This study is a small step in the direction of understanding the processes
and identifying the factors that influence the diffusion of internet
technology in the workplace. Its findings include support for the following
assertions:
1) Higher levels of organizational heterogeneity catalyze the diffusion
process by positively influencing factors associated with internet
technology in the following areas: level of use, attitudes,
organizational support, and perceived managerial support.
2) Critical mass theory provides a set of organizational environment
variables within which traditional, individual/interpersonal diffusion
of innovation variables operate under greater or lesser constraints.
This relationship can be described by two generalizations:
• High-heterogeneity organizations tend to create an environment
within which organizational factors enable the diffusion reaction to
proceed unimpeded—possibly reaching critical mass.
• Low-heterogeneity organizations tend to create an environment
within which organizational factors moderate the diffusion
reaction, either slowing or stopping its progress toward critical
mass.

135
3) Rather than defining divergent views of the diffusion process, critical
mass theory and traditional diffusion of innovation theory seem to
provide complementary explanations of different aspects of the
process by which interactive innovations diffuse through
organizations.
The rapid pace of innovation in the area of internet technology has
magnified the need to understand the process by which interactive
technologies are adopted by organizations and the roles played by
organizational and individual/interpersonal factors. This study has
attempted to shed some light on this subject; however, much remains
unilluminated. Questions to be answered by further research on the
diffusion of internet technology in the workplace include the following:
• Can the findings of this study concerning (a) the effects of
organizational heterogeneity on the use of and attitudes toward
internet technology and (b) the relationship between
individual/interpersonal and organizational factors be confirmed?
• To what extent can the findings of this study be generalized to other,
similar organizations or beyond?
• Is funding diversity an effective measures of organizational
heterogeneity?
136
• How does organizational management influence the diffusion reaction,
and is this influence dependent upon organizational heterogeneity?
• Are clustered innovations, such as internet technology particularly
susceptible to the "assimilation gap" effect, and do "iterative"
innovations exacerbate this effect over time?

137
References

138
Abdul-Gader, A. H., & Kozar, K. A. (1995). The impact of computeralienation on information technology investment decisions: anexplanatory cross-national analysis. MIS Quarterly, 19(4), 553–559.
Abrahamson, Eric, & Rosenkopf, Lori (1997). Social network effects onthe extent of innovation diffusion: A computer simulation.Organization Science, 8(3), 289–309.
Achen, Christopher H. (1982). Interpreting and using regression. BeverlyHills, California: Sage Publications, Inc.
Allen, David (1988). New telecommunications services: networkexternalities and critical mass. Telecommunications Policy, 257–271.
Babbie, Earl R. (1973). Survey research methods. Belmont, California:Wadsworth Publishing Company, Inc.
Babcock, Thomas., Bush, Michael, & Lan, Zhiyong (1995). Executive useof information technology in the public sector: an empiricalexamination. Journal of Government Information, 22, 119–130.
Bertot, John Carlo, & McClure, Charles R. (1996). Electronic surveys:implications for using the World Wide Web to collect survey data.Proceedings of the Annual ASIS Meeting, 33, 173–185.
Cohen, Jacob (1969). Statistical power analysis for the behavioralsciences. New York: Academic Press.
CommerceNet/Nielsen Media Research (1995). The CommerceNet/Nielseninternet demographics survey: executive summary.(http://www.commerce.net/).
CommerceNet/Nielsen Media Research (1997). Electronic commerce on therise according to CommerceNet/Nielsen media research survey.(http://www.nielsenmedia.com/)
Constant, David, & Kiesler, Sara (1996). The kindness of strangers: theusefulness of electronic weak ties for technical advice. OrganizationScience, 7(2), 119–135.
139
Dozier, David M, & Rice, Ronald E. (1983). Rival theories of electronicnewsreading. In Everett. M. Rogers (Ed.) The new media. BeverlyHills, California: Sage Publications.
Dunphy, Steven M., Herbig, Paul R. & Howes, Mary E. (1996). Theinnovation funnel, Technological Forecasting and Social Change, 53,279–292.
Emery, Margot (1995). Internet adoption and use by innovator and earlyadopter communicators in Tennessee. Thesis: University ofTennessee.
Fichman, Robert G., & Kemerer, Chris F. (1995). The illusory diffusion ofinnovation: an examination of assimilation gaps.(http://www.pitt.edu/~ckemerer/illusory.htm).
Fulk, Janet, & DeSanctis, Geraldine (1995). Electronic communicationand changing organizational forms. Organization Science, 6, 337–348.
Fulk, Janet, Steinfeld, Charles W., Schmitz, Joseph, & Power, J. Gerard(1987). A social information processing model on media use inorganizations. Communication Research, 14, 529–552.
Graphics, Visualization, & Usability Center (1998). GVU's WWW surveys.(http://www.cc.gatech.edu/gvu/user_surveys/).
Gurbaxani, Vijay (1990). Diffusion in computing networks: the case ofBITNET. Communications of the ACM, 33(12), 65–75.
Hardin, Garrett (1968). The tragedy of the commons. Science, 162, 1243–1248.
Herbert Marilynne, & Benbasat, Izak (1994). Adopting informationtechnology in hospitals: the relationship betweenattitudes/expectations and behavior. Hospital and Health ServicesAdministration, 39, 369–383.
Herbig, Paul A., & Palumbo, Fred (1994). The effect of culture on theadoption process: a comparison of Japanese and American behavior.Technological Forecasting and Social Change, 46, 71–101.

140
Hinds, Pamela, & Kiesler, Sara (1995). Communication acrossboundaries: work, structure, and use of communicationtechnologies in a large organization. Organization Science, 6, 373–393.
Howard, G., & Smith, R. (1986). Computer anxiety in management: mythor reality, Communications of the ACM, 29, 611–615.
Igbaria, M. (1993). User acceptance of microcomputer technology: anempirical test, Omega International Journal of Management Science,21, 73–90.
Kakabasde, Nada Korac, & Kouzmin, Alexander (1996). Innovationstrategies for the adoption of new information technology ingovernment: an Australian experience. Public Administration andDevelopment, 4, 317–330.
Khandwalla, P. N. (1977). The design of organizations, New York:Harcourt Brace Jovanovich.
Koene, Bas A., Boone, A. J. J., & Soeters, Joseph L. (1997)Organizational factors influencing homogeneity and heterogeneity oforganizational cultures. In Sonja A. Sackmann (Ed.), Culturalcomplexity in organizations : inherent contrasts and contradictions,Thousand Oaks: Sage Publications.
LaRose, Robert, & Hoag, Anne (1996). Organizational adoptions of theinternet and the clustering of innovations.(http://www.telecommunication.msu.edu/faculty/larose/html/inno6.htm).
Liker, Jeffrey K., Fleischer, Mitchell, & Arnsdorf, David (1992). Fulfillingthe promises of CAD. Sloan Management Review, Spring 1992, 74–86.
Long, R. J. (1994). The adoption of white-collar computerization byCanadian business firms, Canadian Journal of AdministrativeSciences, 11(4), 295–310.
Mahajan, Vijay (1985). Models for innovation diffusion. Beverly Hills,California: Sage Publications.

141
Maier, Frank H. (1996). Substitution among successive productgenerations—an almost neglected problem in innovation diffusionmodels. The 1996 international system dynamics conference virtualproceedings. (http://web.mit.edu/jsterman/www/SD96/papers.html).
Malone, Thomas W. (1997). Is empowerment just a fad? Control, decisionmaking, and IT. Sloan Management Review, 38(2), 23–35.
Markus, M. Lynne (1994). Electronic mail as the medium of managerialchoice. Organization Science, 5, 502–527.
Markus, M. Lynne (1987). Toward a "critical mass" theory of interactivemedia. Communication Research, 5, 491–511.
Marwell, Gerald, & Oliver, Pamela (1993). The critical mass in collectiveaction: a micro-social theory. Cambridge, Massachusetts: CambridgeUniversity Press.
Mintzberg, Henry (1979). The structuring of organizations. EnglewoodCliffs, New Jersey: Prentice-Hall, Inc.
Moeller, Michael (1996). Boeing network takes flight with pioneeringintranet project. PC Week Online. (http://www.pcweek.com/archive/960219/pcwk0002.htm).
Morris, Merrill, & Ogan, Christine (1996). The internet as mass medium.Journal of Communication, 46(1), 39–50.
Nord, Walter R., & Tucker, Sharon (1987). Implementing routine andradical innovations. Lexington Massachusetts: Lexington Books.
Norton, John A., & Bass, Frank M. (1987). A diffusion theory model ofadoption and substitution for successive generations of high-technology products. Management Science, 33(9), 1069–1086.
Norton, John A., & Bass, Frank M. (1992). Evolution of technologicalgenerations: the law of capture. Sloan Management Review, Winter,1992, 66–77.
142
Nunnally, Jum C. (1978). Psychometric theory. New York: McGraw-Hill,Inc.
O'Brien, Gerald J., & Wilde, W. David (1996). Australian managers'perceptions attitudes and use of information technology. Informationand Software Technology, 38, 783–789.
Oliver, P., Marwell, G., & Teixeira, R. (1985). A theory of critical mass:interdependence, group heterogeneity, and the production ofcollective action. American Journal of Sociology, 91(3), 522–556.
O'Reilly and Associates (1995). Defining the internet opportunity.(http://www.ora.com/research/users/charts/pop-proj.html).
Orlikowski, Wanda J, Yates, Joanne, Okamura, Kazuo, & Fujimoto,Masayo (1995). Shaping electronic communication: themetastructuring of technology in the context of use. OrganizationScience, 6, 423–444.
Pickering, Jeanne M., & King, John Leslie (1995). Hardwiring weak ties:interorganizational computer-mediated communication,occupational communities, and organizational change. OrganizationScience, 6(4), 479–486.
Pitkow, James (1997). In search of reliable usage data on the WWW.(http://proceedings.www6conf.org/HyperNews/get/PAPER126.html).
Pitkow, James, & Kehoe, Colleen. (1996). Surveying the territory: GVU'sfive WWW user surveys. (http://www.cc.gatech.edu/gvu/user_surveys/papers/w3j.html).
Pugh, D. S., Hickson, D. J., Hinings, C. R., & Turner, C. (1968).Dimensions of Organization. Administrative Science Quarterly, 13(1),65–105.
Ray N., & Minch R. (1990). Computer anxiety and alienation toward adefinitive and parsimonious measure. Human Factors, 32(4), 477–491.
143
RHI Consulting (1998). Survey shows intranets and extranets emerge aslatest use of 'net' technology. (http://www.rhic.com/jobsRHIC/About_RHIC/032798.html).
Rice, Ronald E. (1984). Evaluating new media systems. New Directions inProgram Evaluation, 23, 53–72.
Rice, Ronald E. (1993). Media appropriateness: using social presencetheory to compare traditional and new organization media. HumanCommunication Research, 19, 451–484.
Rogers, Everett. M. (1986). Communication technology: the new media insociety. New York: The Free Press.
Rogers, Everett. M. (1995). Diffusion of innovations. New York: The FreePress.
Rogers, Everett. M. (1983). The new media. Beverly Hills, California: SagePublications.
Rosetti, Daniel K., & DeZoort, Frank A. (1989). Organizational Adaptationto Technology Innovation. S.A.M. Advanced Management Journal,54(4), 29–33.
Schelling, Thomas C. (1978). Micromotives and macrobehavior. New York:W. W. Norton & Company.
Silverman, Leslie J., & Bailey, Wilfrid C. (1961). Trends in the adoption ofrecommended farm practices. State College, Mississippi AgriculturalExperiment Station Bulletin 617. RS(E).
Simonson, M., Maurer, M., Montag, M., & Whitaker, M. (1987).Development of a standardized test of computer literacy and acomputer anxiety index. Journal of Educational Computing Research,3, 231–247.
Swanson, E. Burton (1994). Information systems innovation amongorganizations. Management Science, 40(5), 1069–1092.
Tan, Alexis S. (1985). Mass communication theories and research. NewYork: John Wiley & Sons.

144
Tichenor, P. J., Donohue, G. A., & Olien, C. N. (1970). Mass media flowand differential growth in knowledge," Public Opinion Quarterly, 34,159.
Udy, S. H., Jr. (1965). The comparative analysis of organizations. In J. G.March (Ed.), Handbook of organizations. Chicago: Rand McNally,1965.
U.S. Department of Energy, Oak Ridge Operations (1998). DOE facts:East Tennessee Technology Park. (http://www.ornl.gov/doe_oro/factsheets/k-25fact.htm).
U.S. Department of Energy, Oak Ridge Operations (1998). DOE facts:Y-12 Plant. (http://www.ornl.gov/doe_oro/factsheets/y12fact.htm).
U.S. Department of Energy, Office of Energy Research (1998). DOElaboratory fact sheets: Idaho National Engineering Laboratory.(http://www.er.doe.gov/production/er-07/page2a3.html).
U.S. Department of Energy, Office of Energy Research (1998). DOElaboratory fact sheets: Oak Ridge National Laboratory.(http://www.er.doe.gov/production/er-07/page2a7.html).
U.S. Department of Energy, Office of Energy Research (1998). DOELaboratory fact sheets: Sandia National Laboratories.(http://www.er.doe.gov/production/er-07/page2a9.html).
Valente, Thomas W. (1995). Network models of the diffusion of innovation.Cresskill, New Jersey: Hampton Press, Inc.
Vlahos, George E., & Ferratt, Thomas W. (1995). Information technologyuse by managers in Greece to support decision making: amount,perceived value, and satisfaction. Information and Management, 29,305–315.
Witt, Ulrich (1997). "Lock-in" vs. "critical masses"—industrial changeunder network externalities. International Journal of IndustrialOrganization, 15, 753–773.

145
Walther, Joseph B. (1995). Relational aspects of computer-mediatedcommunication: experimental observations over time. OrganizationScience, 6, 186–203.
Zakon, Robert H. (1998). Hobbes' internet timeline v3.3.(http://info.isoc.org/guest/zakon/Internet/History/HIT.html).

146
Appendixes

147
Appendix A: Pretest Survey Instruments

148
Web Survey Instrument
Internet Technology Use Survey: Pretest
This survey is part of a "dry run" for an Internet Technologies Use Survey that will be conducted acrossseveral Lockheed Martin Energy and Environment Sector sites, including ORNL. This version of thesurvey is only being given to CIND staff and has the blessing of CIND management (so you can spend afew minutes fill ing it out without feeling guilty).
No names, e-mail addresses, or IP addresses (computer addresses) will be included among the datagathered from the survey--out of respect for individual privacy, as well to encourage honest answers.When "internet technology" is mentioned in this survey, it refers to the tools used to communicatethrough either internal computer networks, also known as "intranets," or through the public internet.Examples of these tools include e-mail, internet browsers (like Microsoft Internet Explorer, Netscape, andLynx), newsgroups, listservs, etc.
The survey includes six sections, containing a total of 75 items--73 of them can be answered by clickingyour mouse; two will ask you for a written answer. Most folks wil l finish the survey in 15-30 minutes.Thanks for your time and support. Your participation wil l help to make internet technologies more usefulfor all of us.
Section 1Section 1 is 10 items long. Each item includes a statement for you to agree or disagree with. You canindicate how much you agree or disagree by clicking one of the small, round buttons to the right of thestatement. Clicking the button in the 5 column means you strongly agree; clicking 4 means you agree;clicking 3 means you don't really agree or disagree (you're neutral); clicking 2 means you disagree; andclicking 1 means you strongly disagree.
Agree - Disagree
5 4 3 2 1
1) Using internet technology makes my work easier. ����� ����� ����� ����� �����
2) Knowing how to use internet technology won'timprove my career and job security.
����� ����� ����� ����� �����
3) Internet technology fits in with the way myorganization works.
����� ����� ����� ����� �����
4) I've learned what I know about internet technologyfr om people who are very different from me.
����� ����� ����� ����� �����
5) Using internet technology is easy. ����� ����� ����� ����� �����

149
Agree - Disagree
5 4 3 2 1
6) I find internet technology confusing. ����� ����� ����� ����� �����
7) I had opportunities to experiment with internettechnology before I had to use it myself.
����� ����� ����� ����� �����
8) I had to rush into using internet technology. ����� ����� ����� ����� �����
9) I had many opportunities to observe other peopleusing internet technology before I used it myself.
����� ����� ����� ����� �����
10) Few of my coworkers use internet technology. ����� ����� ����� ����� �����
Section 2Section 2 is 18 items long. Each item includes a statement for you to agree or disagree with. You canindicate how much you agree or disagree by clicking one of the small, round buttons to the right of thestatement. Clicking the button in the 5 column means you strongly agree; clicking 4 means you agree;clicking 3 means you don't really agree or disagree (you're neutral); clicking 2 means you disagree; andclicking 1 means you strongly disagree.
Agree - Disagree
5 4 3 2 1
1) I have control over internet technology, rather than ithaving control over me.
����� ����� ����� ����� �����
2) I know what I'm doing when I use internet technology.����� ����� ����� ����� �����
3) Internet technology doesn't have the potential tocontrol my job.
����� ����� ����� ����� �����
4) I usually have to make my work fit internet technologyinstead of the other way around.
����� ����� ����� ����� �����
5) Internet technology is too complicated to understand. ����� ����� ����� ����� �����
Agree - Disagree
5 4 3 2 1
6) Using internet technology requires a lot of terminologythat I don't understand.
����� ����� ����� ����� �����
7) I understand how to use internet technology. ����� ����� ����� ����� �����

150
8) Using internet technology encourages unethicalpractices.
����� ����� ����� ����� �����
9) I trust the people who are in charge of internettechnology in my organization.
����� ����� ����� ����� �����
10) There's a big difference between what internettechnology is supposed to be able to do and what it reallydoes.
����� ����� ����� ����� �����
Agree - Disagree
5 4 3 2 1
11) I get along well with the people who are in charge ofinternet technology in my organization.
����� ����� ����� ����� �����
12) The people who are in charge of internet technologyin my organization are naturally friendly and helpful.
����� ����� ����� ����� �����
13) I don't like to be associated with the people who arein charge of internet technology in my organization.
����� ����� ����� ����� �����
14) Using internet technology is an enjoyable experience.����� ����� ����� ����� �����
15) Using internet technology is more trouble than it'sworth.
����� ����� ����� ����� �����
Agree - Disagree
5 4 3 2 1
16) I would use internet technology even if it were notexpected of me.
����� ����� ����� ����� �����
17) I don't care what other people say, internettechnology is not for me.
����� ����� ����� ����� �����
18) My employer values internet technology too highly. ����� ����� ����� ����� �����
Section 3Section 3 is 21 items long. Each item includes a statement for you to agree or disagree with. You canindicate how much you agree or disagree by clicking one of the small, round buttons to the right of thestatement. Clicking the button in the 5 column means you strongly agree; clicking 4 means you agree;clicking 3 means you don't really agree or disagree (you're neutral); clicking 2 means you disagree; andclicking 1 means you strongly disagree.

151
Agree - Disagree
5 4 3 2 1
1) I feel that I control computers rather than computerscontrol me.
����� ����� ����� ����� �����
2) Computers dehumanize society by treating everyone asa number.
����� ����� ����� ����� �����
3) I don't feel helpless when using the computer. ����� ����� ����� ����� �����
4) Computers don't have the potential to control ourlives.
����� ����� ����� ����� �����
5) I usually have to make my work fit the computerrather than the computer fit my work.
����� ����� ����� ����� �����
Agree - Disagree
5 4 3 2 1
6) I clearly understand what input computers want. ����� ����� ����� ����� �����
7) Working with computers is so complicated it isdifficult to know what's going on.
����� ����� ����� ����� �����
8) Computer terminology sounds like confusing jargon tome.
����� ����� ����� ����� �����
9) I understand computer output. ����� ����� ����� ����� �����
10) Computers encourage unethical practices. ����� ����� ����� ����� �����
Agree - Disagree
5 4 3 2 1
11) I trust computer suppliers. ����� ����� ����� ����� �����
12) There is a big discrepancy between computer andsoftware qualities claimed by computer elite and the realqualities.
����� ����� ����� ����� �����
13) I get along well with computer professionals. ����� ����� ����� ����� �����
14) Computer professionals are just naturally friendlyand helpful.
����� ����� ����� ����� �����
15) I do not like to be associated with any computerdepartment.
����� ����� ����� ����� �����

152
Agree - Disagree
5 4 3 2 1
16) Using a computer is an enjoyable experience. ����� ����� ����� ����� �����
17) If I had a computer, it would probably be moretrouble than it's worth.
����� ����� ����� ����� �����
18) I sometimes get nervous just thinking aboutcomputers.
����� ����� ����� ����� �����
19) I would use computers even if it were not expected ofme.
����� ����� ����� ����� �����
20) I don't care what other people say, computers are notfor me.
����� ����� ����� ����� �����
Agree - Disagree
5 4 3 2 1
21) Society values computers too highly. ����� ����� ����� ����� �����
Section 4Section 4 is 10 items long. Each item includes a statement for you to agree or disagree with. You canindicate how much you agree or disagree by clicking one of the small, round buttons to the right of thestatement. Clicking the button in the 5 column means you strongly agree; clicking 4 means you agree;clicking 3 means you don't really agree or disagree (you're neutral); clicking 2 means you disagree; andclicking 1 means you strongly disagree.
Agree - Disagree
5 4 3 2 1
1) More and more people at my site are using internettechnology.
����� ����� ����� ����� �����
2) Few of the people I work with use internet technology.����� ����� ����� ����� �����
3) I have the skills and/or training I need to use internettechnology.
����� ����� ����� ����� �����
4) I don't have all the equipment I need to use internettechnology.
����� ����� ����� ����� �����
5) Many different groups at my site are interested ininternet technology.
����� ����� ����� ����� �����
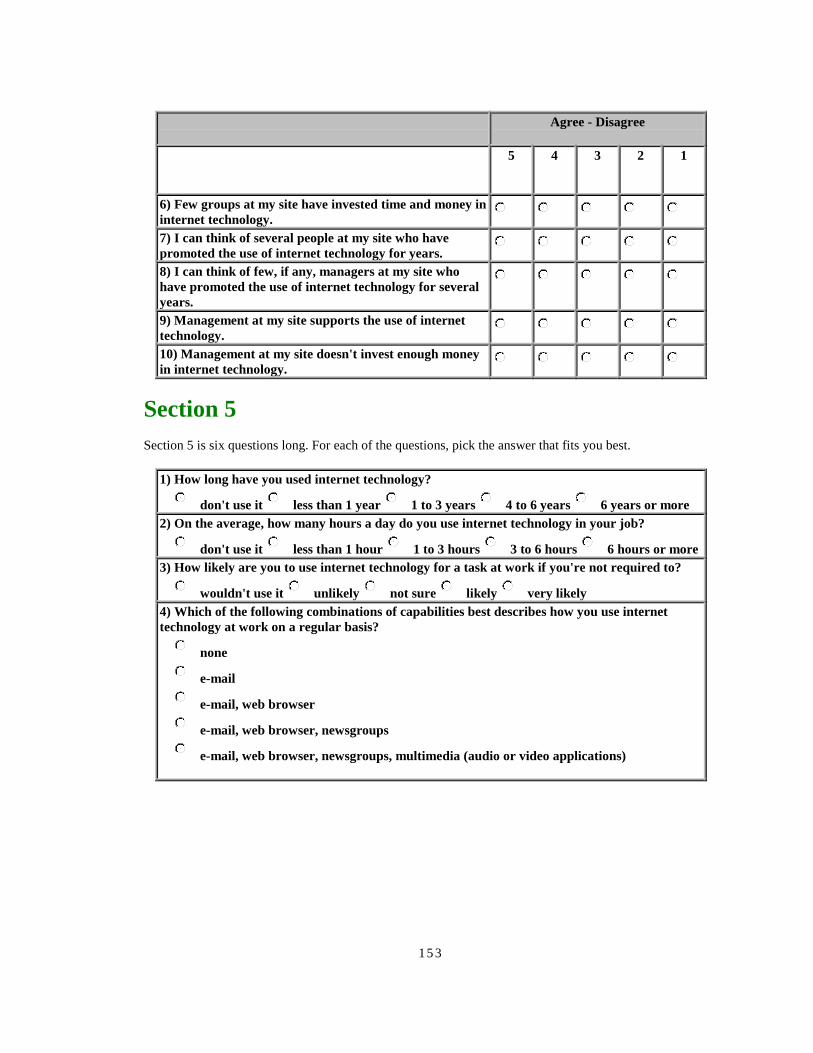
153
Agree - Disagree
5 4 3 2 1
6) Few groups at my site have invested time and money ininternet technology.
����� ����� ����� ����� �����
7) I can think of several people at my site who havepromoted the use of internet technology for years.
����� ����� ����� ����� �����
8) I can think of few, if any, managers at my site whohave promoted the use of internet technology for severalyears.
����� ����� ����� ����� �����
9) Management at my site supports the use of internettechnology.
����� ����� ����� ����� �����
10) Management at my site doesn't invest enough moneyin internet technology.
����� ����� ����� ����� �����
Section 5Section 5 is six questions long. For each of the questions, pick the answer that fits you best.
1) How long have you used internet technology?
����� don't use it ����� less than 1 year ����� 1 to 3 years ����� 4 to 6 years ����� 6 years or more2) On the average, how many hours a day do you use internet technology in your job?
����� don't use it ����� less than 1 hour ����� 1 to 3 hours ����� 3 to 6 hours ����� 6 hours or more3) How likely are you to use internet technology for a task at work if you're not required to?
����� wouldn't use it ����� unlikely ����� not sure ����� likely ����� very likely4) Which of the following combinations of capabilities best describes how you use internettechnology at work on a regular basis?
����� none
����� e-mail, web browser
����� e-mail, web browser, newsgroups
����� e-mail, web browser, newsgroups, multimedia (audio or video applications)

154
5) Which of the following combinations of work-related tasks best describes what you useinternet technology for at work on a regular basis?
����� nothing
����� finding organizational information
����� finding organizational information, performing administrative tasks
����� finding organizational information, performing administrative tasks, doing everydaywork
����� finding organizational information, performing administrative tasks, doing everydaywork, searching databases
6) Which of the following combinations of web-browsing habits best describes how you useinternet technology at work on a regular basis?
����� don't browse
����� following links from local homepages
����� following links from local homepages using bookmarks or hotlists
����� following links from local homepages using bookmarks or hotlists, searching theinternal network (or "intranet")
����� following links from local homepages using bookmarks or hotlists, searching theinternal network (or "intranet"), searching the entire internet
Section 6Section 6 is 10 questions long. For questions 1-8, pick the answer that fits you best. Questions 9-10 ask youfor some of your opinions--write as much or as little as you like.
1) For which of the following LM organizations do you work?
����� Idaho National Engineering and Environmental Laboratory
����� Lockheed Martin Energy Systems (East Tennessee Technology Park--K-25 Site)
����� Lockheed Martin Energy Systems (Oak Ridge Y-12 Plant)
����� Lockheed Martin Utility Services (Paducah)
����� Oak Ridge National Laboratory (Lockheed Martin Energy Research)
����� Sandia National Laboratories (Albuquerque)
����� Sandia National Laboratories (Livermore)

155
2) Which one of the following categories best describes your primary occupation?
����� administrative
����� clerical
����� computer-related
����� craftsperson
����� manager
����� researcher
����� technician
����� professional
����� other
3) What was the primary field covered in your formal education?
����� Business (i.e., Management, Economics, Marketing)
����� Computer Science or Mathematics
����� Crafts (i.e., Electrician, Pipefitter)
����� Humanities (i.e., English, Philosophy, Art)
����� Natural Sciences (i.e., Chemistry, Biology, Physics)
����� Public Management (i.e., Public Administration)
����� other
4) What is your gender?
����� female ����� male ����� prefer not to say5) What is your age?
����� less than 20
����� 20-29
����� 30-39
����� 40-49
����� 50-59
����� 60-69
����� 70-79
����� 80 or over
����� prefer not to say
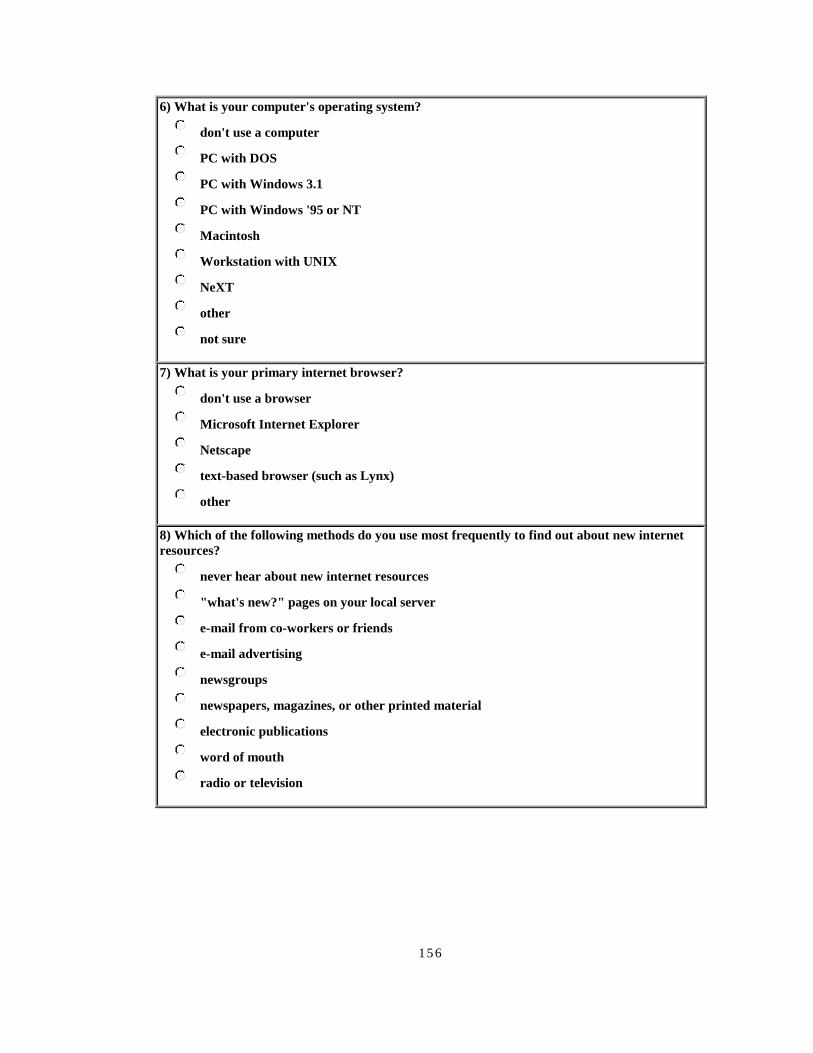
156
6) What is your computer's operating system?
����� don't use a computer
����� PC with DOS
����� PC with Windows 3.1
����� PC with Windows '95 or NT
����� Macintosh
����� Workstation with UNIX
����� NeXT
����� other
����� not sure
7) What is your primary internet browser?
����� don't use a browser
����� Microsoft Internet Explorer
����� Netscape
����� text-based browser (such as Lynx)
����� other
8) Which of the following methods do you use most frequently to find out about new internetresources?
����� never hear about new internet resources
����� "what's new?" pages on your local server
����� e-mail from co-workers or friends
����� e-mail advertising
����� newsgroups
����� newspapers, magazines, or other printed material
����� electronic publications
����� word of mouth
����� radio or television

157
9) What would it take to make internet technology more useful in your everyday work?
10) Are there any other comments you'd like to pass along concerning internet technology?
6HQG ,W ,Q� 7KURZ ,W 2XW�
Thanks for completing the survey. You can send it in by pressing the "Send It In!" button above.

158
E-Mail Survey InstrumentInternet Technology Use Survey: Pretest - 6/97
The name of this survey, "Internet Use Survey: Pretest," means thatit's being used to tune-up both the survey itself and some statisticalodds and ends for use in a larger survey to be conducted across severalLM sites. So, it would be really helpful if you'd take the time to fillit out and send it in. No names, e-mail addresses, or anything elsewill be included among the data gathered from the survey--out ofrespect for individual privacy, as well to encourage honest answers.
When "internet technology" is mentioned in this survey, it refers tothe tools used to communicate through either internal computernetworks, also known as "intranets," or through the public internet.Examples of these tools include e-mail, internet browsers (likeMicrosoft Internet Explorer, Netscape, and Lynx), newsgroups,listservs, etc.
The survey includes six sections, containing a total of 75 items--72 ofthem are multiple-choice items; two will ask for a written answer. Mostfolks will finish the survey in 15-30 minutes.
Responses to this survey will be read by a computer, so it's importantthat you enter your answers in the right places. At the beginning ofeach section, there's a brief description of the items in the sectionand the kind of answers the computer will recognize. Below eachquestion, there is an "answer pointer" that looks something like this:
=>S1_1=> <
You'll need to enter your answers on the same line as the answerpointer. For example, if you wanted to answer one of the survey itemswith a "3", you'd enter it right beside the answer pointer, like so:
=>S1_1=>3<
To fill out this survey, just reply to this mail message, and enteryour answers to the survey items next to the "answer pointers." Whenyou're finished, mail it back to where it came from (the returnaddress).
If you have questions or comments about this survey, don't send them tothe return address on this message (that's just for submittingcompleted surveys). Instead, send them to [email protected] with theSubject line "Internet Use Survey: Pretest - 6/97" comment on thissurvey.
You don't need to delete these instructions before you mail the surveyback.
Thanks for your time and support. Your participation will help to makeinternet technologies more useful for all of us.
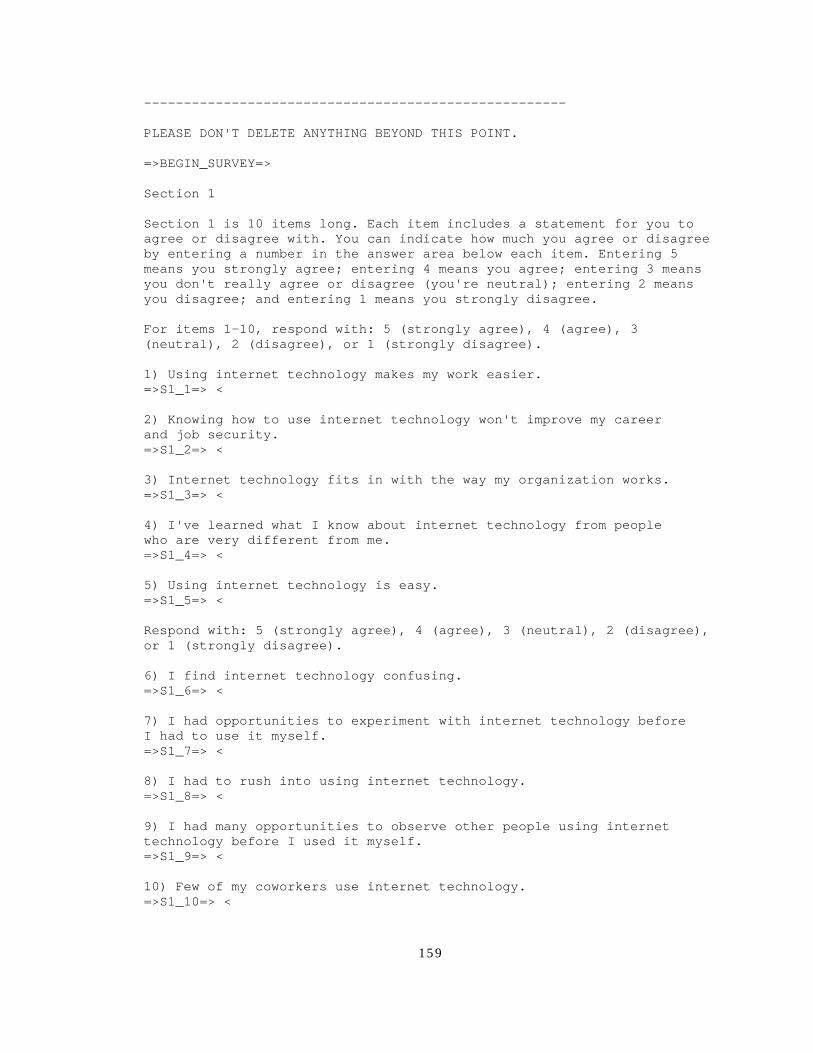
159
-----------------------------------------------------
PLEASE DON'T DELETE ANYTHING BEYOND THIS POINT.
=>BEGIN_SURVEY=>
Section 1
Section 1 is 10 items long. Each item includes a statement for you toagree or disagree with. You can indicate how much you agree or disagreeby entering a number in the answer area below each item. Entering 5means you strongly agree; entering 4 means you agree; entering 3 meansyou don't really agree or disagree (you're neutral); entering 2 meansyou disagree; and entering 1 means you strongly disagree.
For items 1-10, respond with: 5 (strongly agree), 4 (agree), 3(neutral), 2 (disagree), or 1 (strongly disagree).
1) Using internet technology makes my work easier.=>S1_1=> <
2) Knowing how to use internet technology won't improve my careerand job security.=>S1_2=> <
3) Internet technology fits in with the way my organization works.=>S1_3=> <
4) I've learned what I know about internet technology from peoplewho are very different from me.=>S1_4=> <
5) Using internet technology is easy.=>S1_5=> <
Respond with: 5 (strongly agree), 4 (agree), 3 (neutral), 2 (disagree),or 1 (strongly disagree).
6) I find internet technology confusing.=>S1_6=> <
7) I had opportunities to experiment with internet technology beforeI had to use it myself.=>S1_7=> <
8) I had to rush into using internet technology.=>S1_8=> <
9) I had many opportunities to observe other people using internettechnology before I used it myself.=>S1_9=> <
10) Few of my coworkers use internet technology.=>S1_10=> <
160
Section 2
Section 2 is 18 items long. Each item includes a statement for you toagree or disagree with. You can indicate how much you agree or disagreeby entering a number in the answer area below each item. Entering 5means you strongly agree; entering 4 means you agree; entering 3 meansyou don't really agree or disagree (you're neutral); entering 2 meansyou disagree; and entering 1 means you strongly disagree.
For items 1-18, respond with: 5 (strongly agree), 4 (agree), 3(neutral), 2 (disagree), or 1 (strongly disagree).
1) I have control over internet technology, rather than it havingcontrol over me.=>S2_1=> <
2) I know what I'm doing when I use internet technology.=>S2_2=> <
3) Internet technology doesn't have the potential to control my job.=>S2_3=> <
4) I usually have to make my work fit internet technology instead ofthe other way around.=>S2_4=> <
5) Internet technology is too complicated to understand.=>S2_5=> <
Respond with: 5 (strongly agree), 4 (agree), 3 (neutral), 2 (disagree),or 1 (strongly disagree).
6) Using internet technology requires a lot of terminology that Idon't understand.=>S2_6=> <
7) I understand how to use internet technology.=>S2_7=> <
8) Using internet technology encourages unethical practices.=>S2_8=> <
9) I trust the people who are in charge of internet technology in myorganization.=>S2_9=> <
10) There's a big difference between what internet technology issupposed to be able to do and what it really does.=>S2_10=> <
11) I get along well with the people who are in charge of internettechnology in my organization.=>S2_11=> <
161
12) The people who are in charge of internet technology in myorganization are naturally friendly and helpful.=>S2_12=> <
13) I don't like to be associated with the people who are in charge ofinternet technology in my organization.=>S2_13=> <
14) Using internet technology is an enjoyable experience.=>S2_14=> <
15) Using internet technology is more trouble than it's worth.=>S2_15=> <
Respond with: 5 (strongly agree), 4 (agree), 3 (neutral), 2 (disagree),or 1 (strongly disagree).
16) I would use internet technology even if it were not expected ofme.=>S2_16=> <
17) I don't care what other people say, internet technology is not forme.=>S2_17=> <
18) My employer values internet technology too highly.=>S2_18=> <
Section 3
Section 3 is 21 items long. Each item includes a statement for you toagree or disagree with. You can indicate how much you agree or disagreeby entering a number in the answer area below each item. Entering 5means you strongly agree; entering 4 means you agree; entering 3 meansyou don't really agree or disagree (you're neutral); entering 2 meansyou disagree; and entering 1 means you strongly disagree.
For items 1-21, respond with: 5 (strongly agree), 4 (agree), 3(neutral), 2 (disagree), or 1 (strongly disagree).
1) I feel that I control computers rather than computers control me.=>S3_1=> <
2) Computers dehumanize society by treating everyone as anumber.=>S3_2=> <
3) I don't feel helpless when using the computer.=>S3_3=> <
4) Computers don't have the potential to control our lives.=>S3_4=> <
162
5) I usually have to make my work fit the computer rather than thecomputer fit my work.=>S3_5=> <
6) I clearly understand what input computers want.=>S3_6=> <
7) Working with computers is so complicated it is difficult to knowwhat's going on.=>S3_7=> <
8) Computer terminology sounds like confusing jargon to me.=>S3_8=> <
9) I understand computer output.=>S3_9=> <
10) Computers encourage unethical practices.=>S3_10=> <
Respond with: 5 (strongly agree), 4 (agree), 3 (neutral), 2 (disagree),or 1 (strongly disagree).
11) I trust computer suppliers.=>S3_11=> <
12) There is a big discrepancy between computer and softwarequalities claimed by computer elite and the real qualities.=>S3_12=> <
13) I get along well with computer professionals.=>S3_13=> <
14) Computer professionals are just naturally friendly and helpful.=>S3_14=> <
15) I do not like to be associated with any computer department.=>S3_15=> <
Respond with: 5 (strongly agree), 4 (agree), 3 (neutral), 2 (disagree),or 1 (strongly disagree).
16) Using a computer is an enjoyable experience.=>S3_16=> <
17) If I had a computer, it would probably be more trouble than it'sworth.=>S3_17=> <
18) I sometimes get nervous just thinking about computers.=>S3_18=> <
19) I would use computers even if it were not expected of me.=>S3_19=> <

163
20) I don't care what other people say, computers are not for me.=>S3_20=> <
Respond with: 5 (strongly agree), 4 (agree), 3 (neutral), 2 (disagree),or 1 (strongly disagree).
21) Society values computers too highly.=>S3_21=> <
Section 4
Section 4 is 10 items long. Each item includes a statement for you toagree or disagree with. You can indicate how much you agree or disagreeby entering a number in the answer area below each item. Entering 5means you strongly agree; entering 4 means you agree; entering 3 meansyou don't really agree or disagree (you're neutral); entering 2 meansyou disagree; and entering 1 means you strongly disagree.
For items 1-10, respond with: 5 (strongly agree), 4 (agree), 3(neutral), 2 (disagree), or 1 (strongly disagree).
1) More and more people at my site are using internet technology.=>S4_1=> <
2) Few of the people I work with use internet technology.=>S4_2=> <
3) I have the skills and/or training I need to use internettechnology.=>S4_3=> <
4) I don't have all the equipment I need to use internet technology.=>S4_4=> <
5) Many different groups at my site are interested in internettechnology.=>S4_5=> <
Respond with: 5 (strongly agree), 4 (agree), 3 (neutral), 2 (disagree),or 1 (strongly disagree).
6) Few groups at my site have invested time and money in internettechnology.=>S4_6=> <
7) I can think of several people at my site who have promoted the useof internet technology for years.=>S4_7=> <
8) I can think of few, if any, managers at my site who have promotedthe use of internet technology for several years.=>S4_8=> <

164
9) Management at my site supports the use of internet technology.=>S4_9=> <
10) Management at my site doesn't invest enough money in internettechnology.=>S4_10=> <
Section 5
Section 5 is six questions long. For each of the questions, pick theanswer that fits you best.
For items 1-6, respond with: a, b, c, d, or e.
1) How long have you used internet technology?
a) don't use itb) less than 1 yearc) 1 to 3 yearsd) 4 to 6 yearse) 6 years or more
=>S5_1=> <
2) On the average, how many hours a day do you use internet technologyin your job?
a) don't use itb) less than 1 hourc) 1 to 3 hoursd) 3 to 6 hourse) 6 hours or more
=>S5_2=> <
3) How likely are you to use internet technology for a task at work ifyou're not required to?
a) wouldn't use itb) unlikelyc) not sured) likelye) very likely
=>S5_3=> <
4) Which of the following combinations of capabilities best describeshow you use internet technology at work on a regular basis?
a) noneb) e-mailc) e-mail, web browserd) e-mail, web browser, newsgroupse) e-mail, web browser, newsgroups, multimedia (audio or video applications)
=>S5_4=> <
165
5) Which of the following combinations of work-related tasks bestdescribes what you use internet technology for at work on a regularbasis?
a) nothingb) finding organizational informationc) finding organizational information, performing administrative
tasksd) finding organizational information, performing administrative
tasks, doing everyday worke) finding organizational information, performing administrative
tasks, doing everyday work,searching databases
=>S5_5=> <
6) Which of the following combinations of web-browsing habits bestdescribes how you use internet technology at work on a regular basis?
a) don't browseb) following links from local homepagesc) following links from local homepages using bookmarks or hotlistsd) following links from local homepages using bookmarks orhotlists, searching the internal network (or "intranet")e) following links from local homepages using bookmarks orhotlists, searching the internal network (or "intranet"),searching the entire internet
=>S5_6=> <
Section 6
Section 6 is 10 questions long.
For questions 1-8, pick the answer that fits you best. Questions 9-10ask you for some of your opinions--write as much or as little as youlike.
1) For which of the following LM organizations do you work?
a) Idaho National Engineering and Environmental Laboratoryb) Lockheed Martin Energy Systems (East Tennessee TechnologyPark--K-25 Site)c) Lockheed Martin Energy Systems (Oak Ridge Y-12 Plant)d) Lockheed Martin Utility Services (Paducah)e) Lockheed Martin Utility Services (Portsmouth)f) Oak Ridge National Laboratory (Lockheed Martin EnergyResearch)g) Sandia National Laboratories (Albuquerque)h) Sandia National Laboratories ( Livermore)
=>S6_1=> <

166
2) Which one of the following categories best describes your primaryoccupation?
a) administrativeb) clericalc) computer-relatedd) craftspersone) managerf) researcherg) technicianh) professionali) other
=>S6_2=> <
3) What was the primary field covered in your formal education?
a) Business (i.e., Management, Economics, Marketing)b) Computer Science or Mathematicsc) Crafts (i.e., Electrician, Pipefitter)d) Humanities (i.e., English, Philosophy, Art)e) Natural Sciences (i.e., Chemistry, Biology, Physics)f) Public Management (i.e., Public Administration)g) other
=>S6_3=> <
4) What is your gender?
a) femaleb) malec) prefer not to say
=>S6_4=> <
5) What is your age?
a) less than 20b) 20-29c) 30-39d) 40-49e) 50-59f) 60-69g) 70-79h) 80 or overi) prefer not to say
=>S6_5=> <
6) What is your computer's operating system?
a) don't use a computerb) PC with DOSc) PC with Windows 3.1d) PC with Windows '95 or NTe) Macintoshf) Workstation with UNIXg) NeXT

167
h) otheri) not sure
=>S6_6=> <
7) What is your primary internet browser?
a) don't use a browserb) Microsoft Internet Explorerc) Netscaped) text-based browser (such as Lynx)e) other
=>S6_7=> <
8) Which of the following methods do you use most frequently to findout about new internet resources?
a) never hear about new internet resourcesb) "what's new?" pages on your local serverc) e-mail from co-workers or friendsd) e-mail advertisinge) newsgroupsf) newspapers, magazines, or other printed materialg) electronic publicationsh) word of mouthi) radio or television
=>S6_8=> <
9) What would it take to make internet technology more useful in youreveryday work?=>S6_9=>
<=><END_COMMENT=>
10) Are there any other comments you'd like to pass along concerninginternet technology?=>S6_10=>
<=><END_COMMENT=>
=><END_SURVEY=>
Thanks for completing the survey. You can send it in by e-mailing itback the return address.
Again, if you have questions or comments about this survey, don't sendthem to the return address on this message (that's just for submittingcompleted surveys). Instead, send them to [email protected] with theSubject line "Internet Use Survey: Pretest - 6/97."

168
Paper Survey Instrument
Internet Technology Use Survey: Pretest
This survey is part of a "dry run" for an Internet Technologies Use Survey that will be conducted acrossseveral Lockheed Martin Energy and Environment Sector sites, including ORNL. This version of thesurvey is only being given to CIND staff and has the blessing of CIND management (so you can spend afew minutes fill ing it out without feeling guilty).
No names, e-mail addresses, or IP addresses (computer addresses) will be included among the datagathered from the survey--out of respect for individual privacy, as well to encourage honest answers.When "internet technology" is mentioned in this survey, it refers to the tools used to communicatethrough either internal computer networks, also known as "intranets," or through the public internet.Examples of these tools include e-mail, internet browsers (like Microsoft Internet Explorer, Netscape, andLynx), newsgroups, listservs, etc.
The survey includes six sections, containing a total of 75 items--73 of them can be answered by clickingyour mouse; two will ask you for a written answer. Most folks wil l finish the survey in 15-30 minutes.Thanks for your time and support. Your participation wil l help to make internet technologies more usefulfor all of us.
Section 1Section 1 is 10 items long. Each item includes a statement for you to agree or disagree with. You canindicate how much you agree or disagree by clicking one of the small, round buttons to the right of thestatement. Clicking the button in the 5 column means you strongly agree; clicking 4 means you agree;clicking 3 means you don't really agree or disagree (you're neutral); clicking 2 means you disagree; andclicking 1 means you strongly disagree.
Agree - Disagree
5 4 3 2 1
1) Using internet technology makes my work easier. ����� ����� ����� ����� �����
2) Knowing how to use internet technology won'timprove my career and job security.
����� ����� ����� ����� �����
3) Internet technology fits in with the way myorganization works.
����� ����� ����� ����� �����
4) I've learned what I know about internet technologyfr om people who are very different from me.
����� ����� ����� ����� �����
5) Using internet technology is easy. ����� ����� ����� ����� �����
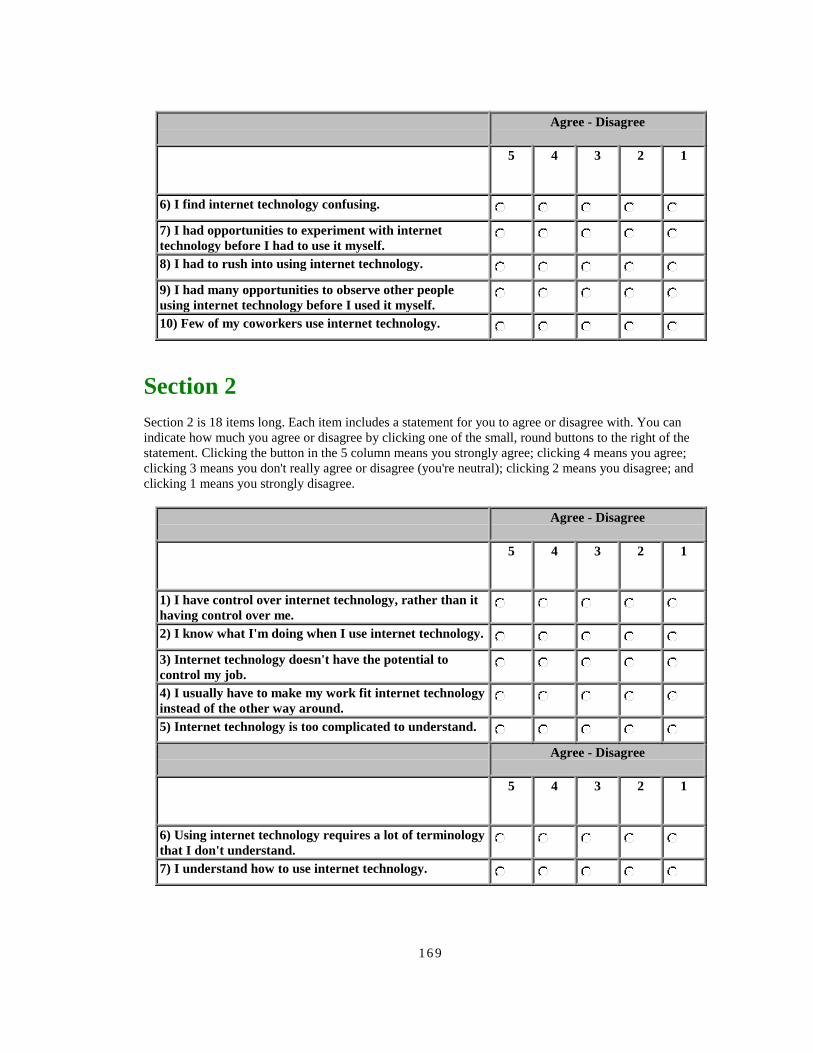
169
Agree - Disagree
5 4 3 2 1
6) I find internet technology confusing. ����� ����� ����� ����� �����
7) I had opportunities to experiment with internettechnology before I had to use it myself.
����� ����� ����� ����� �����
8) I had to rush into using internet technology. ����� ����� ����� ����� �����
9) I had many opportunities to observe other peopleusing internet technology before I used it myself.
����� ����� ����� ����� �����
10) Few of my coworkers use internet technology. ����� ����� ����� ����� �����
Section 2Section 2 is 18 items long. Each item includes a statement for you to agree or disagree with. You canindicate how much you agree or disagree by clicking one of the small, round buttons to the right of thestatement. Clicking the button in the 5 column means you strongly agree; clicking 4 means you agree;clicking 3 means you don't really agree or disagree (you're neutral); clicking 2 means you disagree; andclicking 1 means you strongly disagree.
Agree - Disagree
5 4 3 2 1
1) I have control over internet technology, rather than ithaving control over me.
����� ����� ����� ����� �����
2) I know what I'm doing when I use internet technology.����� ����� ����� ����� �����
3) Internet technology doesn't have the potential tocontrol my job.
����� ����� ����� ����� �����
4) I usually have to make my work fit internet technologyinstead of the other way around.
����� ����� ����� ����� �����
5) Internet technology is too complicated to understand. ����� ����� ����� ����� �����
Agree - Disagree
5 4 3 2 1
6) Using internet technology requires a lot of terminologythat I don't understand.
����� ����� ����� ����� �����
7) I understand how to use internet technology. ����� ����� ����� ����� �����
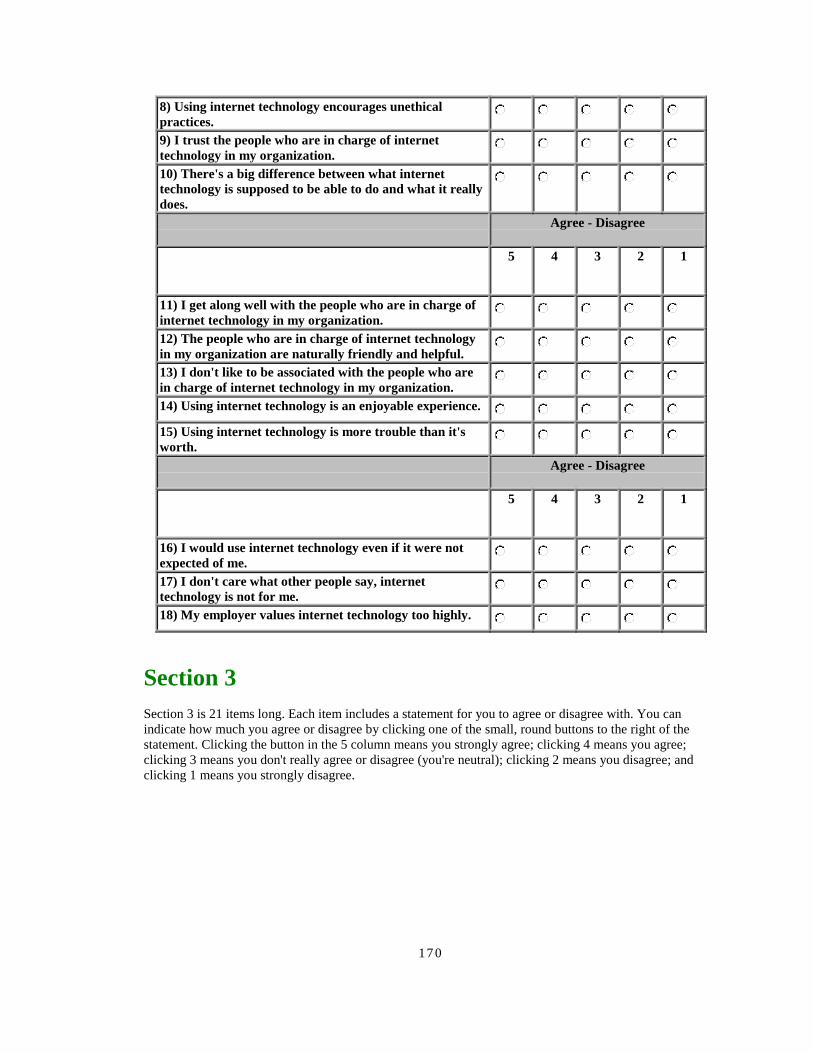
170
8) Using internet technology encourages unethicalpractices.
����� ����� ����� ����� �����
9) I trust the people who are in charge of internettechnology in my organization.
����� ����� ����� ����� �����
10) There's a big difference between what internettechnology is supposed to be able to do and what it reallydoes.
����� ����� ����� ����� �����
Agree - Disagree
5 4 3 2 1
11) I get along well with the people who are in charge ofinternet technology in my organization.
����� ����� ����� ����� �����
12) The people who are in charge of internet technologyin my organization are naturally friendly and helpful.
����� ����� ����� ����� �����
13) I don't like to be associated with the people who arein charge of internet technology in my organization.
����� ����� ����� ����� �����
14) Using internet technology is an enjoyable experience.����� ����� ����� ����� �����
15) Using internet technology is more trouble than it'sworth.
����� ����� ����� ����� �����
Agree - Disagree
5 4 3 2 1
16) I would use internet technology even if it were notexpected of me.
����� ����� ����� ����� �����
17) I don't care what other people say, internettechnology is not for me.
����� ����� ����� ����� �����
18) My employer values internet technology too highly. ����� ����� ����� ����� �����
Section 3Section 3 is 21 items long. Each item includes a statement for you to agree or disagree with. You canindicate how much you agree or disagree by clicking one of the small, round buttons to the right of thestatement. Clicking the button in the 5 column means you strongly agree; clicking 4 means you agree;clicking 3 means you don't really agree or disagree (you're neutral); clicking 2 means you disagree; andclicking 1 means you strongly disagree.
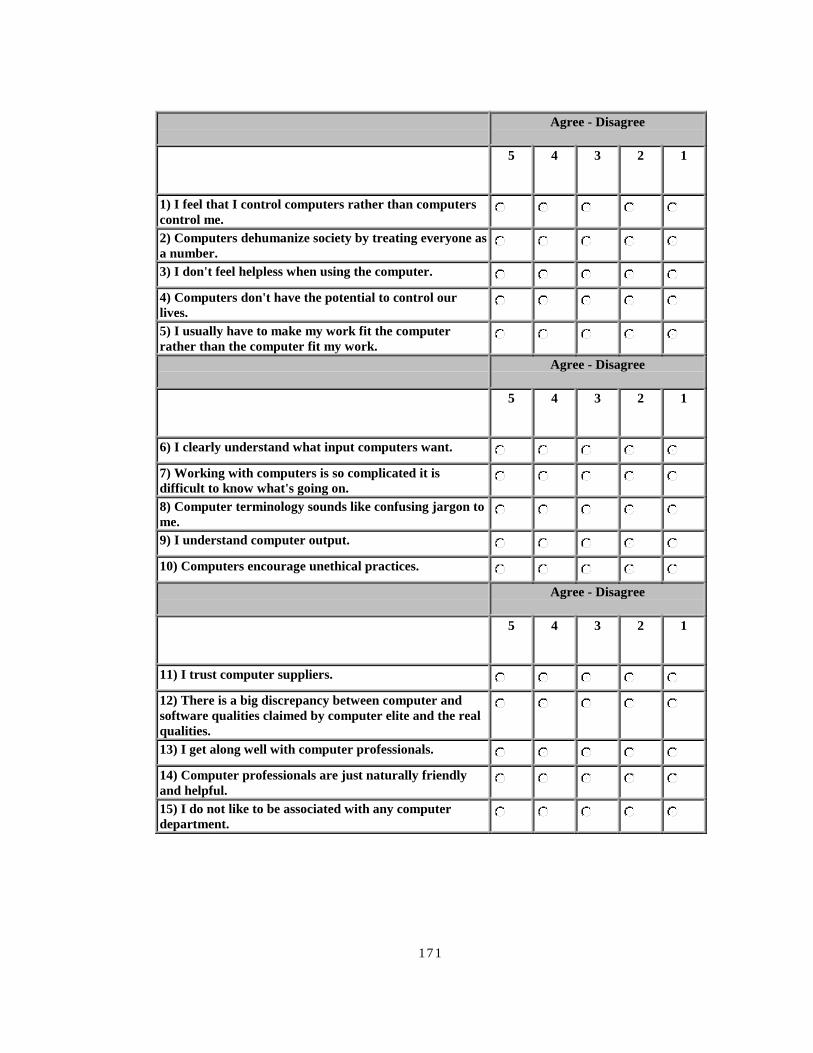
171
Agree - Disagree
5 4 3 2 1
1) I feel that I control computers rather than computerscontrol me.
����� ����� ����� ����� �����
2) Computers dehumanize society by treating everyone asa number.
����� ����� ����� ����� �����
3) I don't feel helpless when using the computer. ����� ����� ����� ����� �����
4) Computers don't have the potential to control ourlives.
����� ����� ����� ����� �����
5) I usually have to make my work fit the computerrather than the computer fit my work.
����� ����� ����� ����� �����
Agree - Disagree
5 4 3 2 1
6) I clearly understand what input computers want. ����� ����� ����� ����� �����
7) Working with computers is so complicated it isdifficult to know what's going on.
����� ����� ����� ����� �����
8) Computer terminology sounds like confusing jargon tome.
����� ����� ����� ����� �����
9) I understand computer output. ����� ����� ����� ����� �����
10) Computers encourage unethical practices. ����� ����� ����� ����� �����
Agree - Disagree
5 4 3 2 1
11) I trust computer suppliers. ����� ����� ����� ����� �����
12) There is a big discrepancy between computer andsoftware qualities claimed by computer elite and the realqualities.
����� ����� ����� ����� �����
13) I get along well with computer professionals. ����� ����� ����� ����� �����
14) Computer professionals are just naturally friendlyand helpful.
����� ����� ����� ����� �����
15) I do not like to be associated with any computerdepartment.
����� ����� ����� ����� �����

172
Agree - Disagree
5 4 3 2 1
16) Using a computer is an enjoyable experience. ����� ����� ����� ����� �����
17) If I had a computer, it would probably be moretrouble than it's worth.
����� ����� ����� ����� �����
18) I sometimes get nervous just thinking aboutcomputers.
����� ����� ����� ����� �����
19) I would use computers even if it were not expected ofme.
����� ����� ����� ����� �����
20) I don't care what other people say, computers are notfor me.
����� ����� ����� ����� �����
Agree - Disagree
5 4 3 2 1
21) Society values computers too highly. ����� ����� ����� ����� �����
Section 4Section 4 is 10 items long. Each item includes a statement for you to agree or disagree with. You canindicate how much you agree or disagree by clicking one of the small, round buttons to the right of thestatement. Clicking the button in the 5 column means you strongly agree; clicking 4 means you agree;clicking 3 means you don't really agree or disagree (you're neutral); clicking 2 means you disagree; andclicking 1 means you strongly disagree.
Agree - Disagree
5 4 3 2 1
1) More and more people at my site are using internettechnology.
����� ����� ����� ����� �����
2) Few of the people I work with use internet technology.����� ����� ����� ����� �����
3) I have the skills and/or training I need to use internettechnology.
����� ����� ����� ����� �����
4) I don't have all the equipment I need to use internettechnology.
����� ����� ����� ����� �����
5) Many different groups at my site are interested ininternet technology.
����� ����� ����� ����� �����

173
Agree - Disagree
5 4 3 2 1
6) Few groups at my site have invested time and money ininternet technology.
����� ����� ����� ����� �����
7) I can think of several people at my site who havepromoted the use of internet technology for years.
����� ����� ����� ����� �����
8) I can think of few, if any, managers at my site whohave promoted the use of internet technology for severalyears.
����� ����� ����� ����� �����
9) Management at my site supports the use of internettechnology.
����� ����� ����� ����� �����
10) Management at my site doesn't invest enough moneyin internet technology.
����� ����� ����� ����� �����
Section 5Section 5 is six questions long. For each of the questions, pick the answer that fits you best.
1) How long have you used internet technology?
����� don't use it ����� less than 1 year ����� 1 to 3 years ����� 4 to 6 years ����� 6 years or more2) On the average, how many hours a day do you use internet technology in your job?
����� don't use it ����� less than 1 hour ����� 1 to 3 hours ����� 3 to 6 hours ����� 6 hours or more3) How likely are you to use internet technology for a task at work if you're not required to?
����� wouldn't use it ����� unlikely ����� not sure ����� likely ����� very likely4) Which of the following combinations of capabilities best describes how you use internettechnology at work on a regular basis?
����� none
����� e-mail, web browser
����� e-mail, web browser, newsgroups
����� e-mail, web browser, newsgroups, multimedia (audio or video applications)

174
5) Which of the following combinations of work-related tasks best describes what you useinternet technology for at work on a regular basis?
����� nothing
����� finding organizational information
����� finding organizational information, performing administrative tasks
����� finding organizational information, performing administrative tasks, doing everydaywork
����� finding organizational information, performing administrative tasks, doing everydaywork, searching databases
6) Which of the following combinations of web-browsing habits best describes how you useinternet technology at work on a regular basis?
����� don't browse
����� following links from local homepages
����� following links from local homepages using bookmarks or hotlists
����� following links from local homepages using bookmarks or hotlists, searching theinternal network (or "intranet")
����� following links from local homepages using bookmarks or hotlists, searching theinternal network (or "intranet"), searching the entire internet
Section 6Section 6 is 10 questions long. For questions 1-8, pick the answer that fits you best. Questions 9-10 ask youfor some of your opinions--write as much or as little as you like.
1) For which of the following LM organizations do you work?
����� Idaho National Engineering and Environmental Laboratory
����� Lockheed Martin Energy Systems (East Tennessee Technology Park--K-25 Site)
����� Lockheed Martin Energy Systems (Oak Ridge Y-12 Plant)
����� Lockheed Martin Utility Services (Paducah)
����� Oak Ridge National Laboratory (Lockheed Martin Energy Research)
����� Sandia National Laboratories (Albuquerque)
����� Sandia National Laboratories (Livermore)
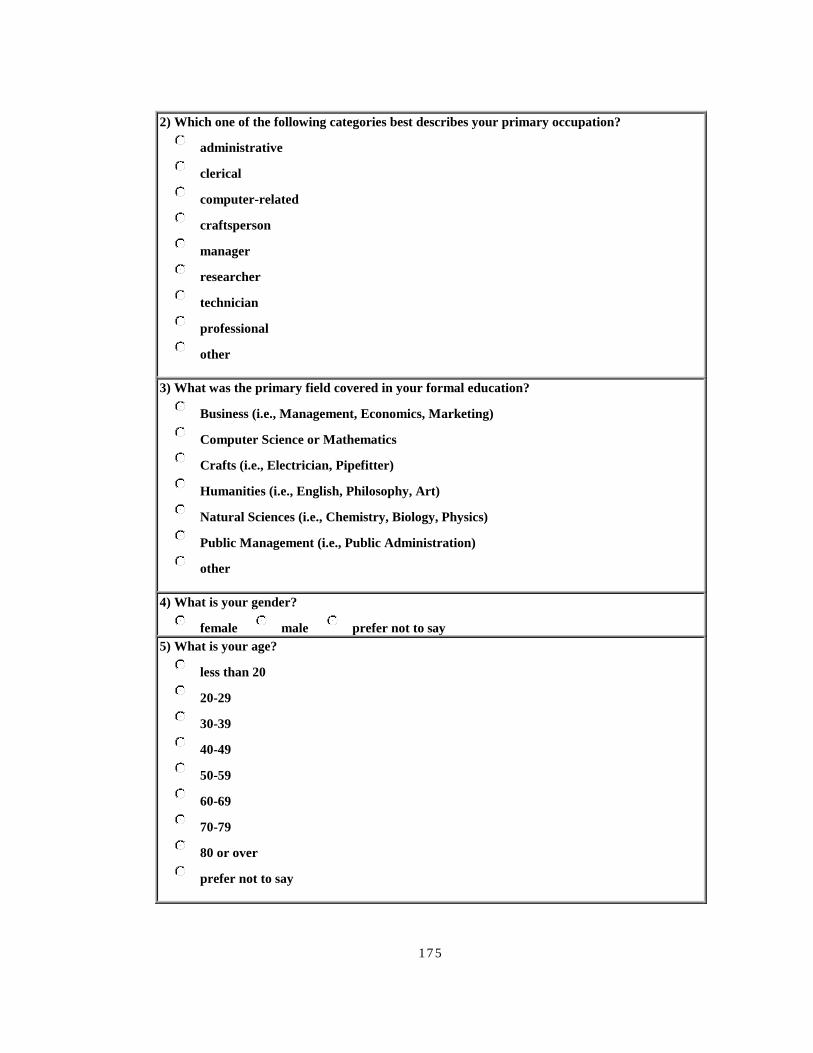
175
2) Which one of the following categories best describes your primary occupation?
����� administrative
����� clerical
����� computer-related
����� craftsperson
����� manager
����� researcher
����� technician
����� professional
����� other
3) What was the primary field covered in your formal education?
����� Business (i.e., Management, Economics, Marketing)
����� Computer Science or Mathematics
����� Crafts (i.e., Electrician, Pipefitter)
����� Humanities (i.e., English, Philosophy, Art)
����� Natural Sciences (i.e., Chemistry, Biology, Physics)
����� Public Management (i.e., Public Administration)
����� other
4) What is your gender?
����� female ����� male ����� prefer not to say5) What is your age?
����� less than 20
����� 20-29
����� 30-39
����� 40-49
����� 50-59
����� 60-69
����� 70-79
����� 80 or over
����� prefer not to say

176
6) What is your computer's operating system?
����� don't use a computer
����� PC with DOS
����� PC with Windows 3.1
����� PC with Windows '95 or NT
����� Macintosh
����� Workstation with UNIX
����� NeXT
����� other
����� not sure7) What is your primary internet browser?
����� don't use a browser
����� Microsoft Internet Explorer
����� Netscape
����� text-based browser (such as Lynx)
����� other
8) Which of the following methods do you use most frequently to find out about new internetresources?
����� never hear about new internet resources
����� "what's new?" pages on your local server
����� e-mail from co-workers or friends
����� e-mail advertising
����� newsgroups
����� newspapers, magazines, or other printed material
����� electronic publications
����� word of mouth
����� radio or television

177
9) What would it take to make internet technology more useful in your everyday work?
10) Are there any other comments you'd like to pass along concerning internet technology?
6HQG ,W ,Q� 7KURZ ,W 2XW�
Thanks for completing the survey. You can send it in by pressing the "Send It In!" button above.

203
Appendix B: Abdul-Gader and Kozar'sComputer Alienation Scale

179
Abdul-Gader and Kozar'sComputer Alienation Scale Items
Powerlessness
1. I feel that I control computers rather than computers control me.2 Computers dehumanize society by treating everyone as a number.3 I don't feel helpless when using the computer.4 Computers don't have the potential to control our lives.5 I usually have to make my work fit the computer rather than
computer fit my work.
Meaninglessness
6 I clearly understand what input computers want.7 Working with computers is so complicated it is difficult to
understand what is going on.8 Computer terminology sounds like confusing jargon to me.9 I understand computer output.
Normlessness
10 Computers encourage unethical practices.11 I trust computer suppliers.12 There is a big discrepancy between computer and software qualities
claimed by computer elite and the real qualities.
Social Isolation
13 I get along well with computer professionals.14 Computer professionals are just naturally friendly and helpful.15 I do not like to be associated with any computer department.
Self-Estrangement
16 Using a computer is an enjoyable experience.17 If I had to use a computer, it would probably be more trouble than
it's worth.18 I sometimes get nervous just thinking about computers.

180
Cultural Estrangement
19 I would use computers even if it were not expected of me.20 I don't care what other people say, computers are not for me.21 Society values computers too highly.

181
Appendix C: Final Survey Instruments
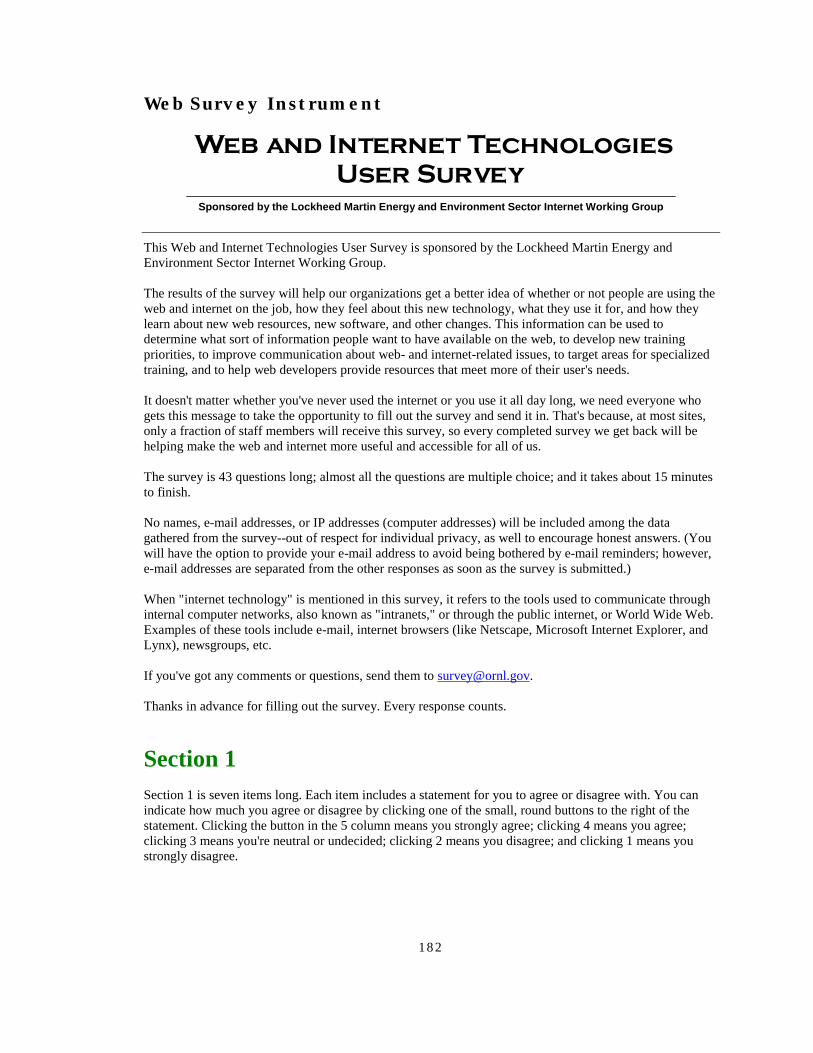
182
Web Survey Instrument
�:HE�DQG�,QWHUQHW�7HFKQRORJLHV
8VHU�6XUYH\
Spon sored by the Lockhee d Martin Energy and En viro nment Secto r Internet Working G roup
This Web and Internet Technologies User Survey is sponsored by the Lockheed Martin Energy andEnvironment Sector Internet Working Group.
The results of the survey will help our organizations get a better idea of whether or not people are using theweb and internet on the job, how they feel about this new technology, what they use it for, and how theylearn about new web resources, new software, and other changes. This information can be used todetermine what sort of information people want to have available on the web, to develop new trainingpriorities, to improve communication about web- and internet-related issues, to target areas for specializedtraining, and to help web developers provide resources that meet more of their user's needs.
It doesn't matter whether you've never used the internet or you use it all day long, we need everyone whogets this message to take the opportunity to fill out the survey and send it in. That's because, at most sites,only a fraction of staff members will receive this survey, so every completed survey we get back will behelping make the web and internet more useful and accessible for all of us.
The survey is 43 questions long; almost all the questions are multiple choice; and it takes about 15 minutesto finish.
No names, e-mail addresses, or IP addresses (computer addresses) will be included among the datagathered from the survey--out of respect for individual privacy, as well to encourage honest answers. (Youwill have the option to provide your e-mail address to avoid being bothered by e-mail reminders; however,e-mail addresses are separated from the other responses as soon as the survey is submitted.)
When "internet technology" is mentioned in this survey, it refers to the tools used to communicate throughinternal computer networks, also known as "intranets," or through the public internet, or World Wide Web.Examples of these tools include e-mail, internet browsers (like Netscape, Microsoft Internet Explorer, andLynx), newsgroups, etc.
If you've got any comments or questions, send them to [email protected].
Thanks in advance for filling out the survey. Every response counts.
Section 1Section 1 is seven items long. Each item includes a statement for you to agree or disagree with. You canindicate how much you agree or disagree by clicking one of the small, round buttons to the right of thestatement. Clicking the button in the 5 column means you strongly agree; clicking 4 means you agree;clicking 3 means you're neutral or undecided; clicking 2 means you disagree; and clicking 1 means youstrongly disagree.
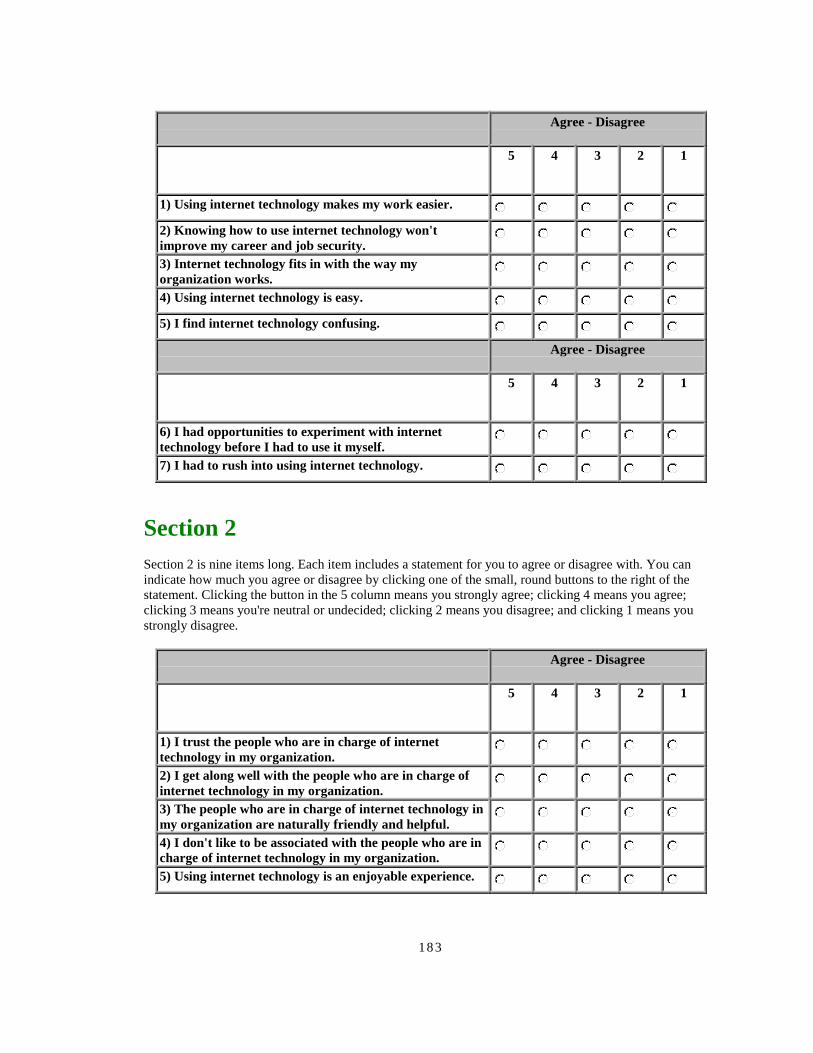
183
Agree - Disagree
5 4 3 2 1
1) Using internet technology makes my work easier. ����� ����� ����� ����� �����
2) Knowing how to use internet technology won'timprove my career and job security.
����� ����� ����� ����� �����
3) Internet technology fits in with the way myorganization works.
����� ����� ����� ����� �����
4) Using internet technology is easy. ����� ����� ����� ����� �����
5) I find internet technology confusing. ����� ����� ����� ����� �����
Agree - Disagree
5 4 3 2 1
6) I had opportunities to experiment with internettechnology before I had to use it myself.
����� ����� ����� ����� �����
7) I had to rush into using internet technology. ����� ����� ����� ����� �����
Section 2Section 2 is nine items long. Each item includes a statement for you to agree or disagree with. You canindicate how much you agree or disagree by clicking one of the small, round buttons to the right of thestatement. Clicking the button in the 5 column means you strongly agree; clicking 4 means you agree;clicking 3 means you're neutral or undecided; clicking 2 means you disagree; and clicking 1 means youstrongly disagree.
Agree - Disagree
5 4 3 2 1
1) I trust the people who are in charge of internettechnology in my organization.
����� ����� ����� ����� �����
2) I get along well with the people who are in charge ofinternet technology in my organization.
����� ����� ����� ����� �����
3) The people who are in charge of internet technology inmy organization are naturally friendly and helpful.
����� ����� ����� ����� �����
4) I don't like to be associated with the people who are incharge of internet technology in my organization.
����� ����� ����� ����� �����
5) Using internet technology is an enjoyable experience.����� ����� ����� ����� �����
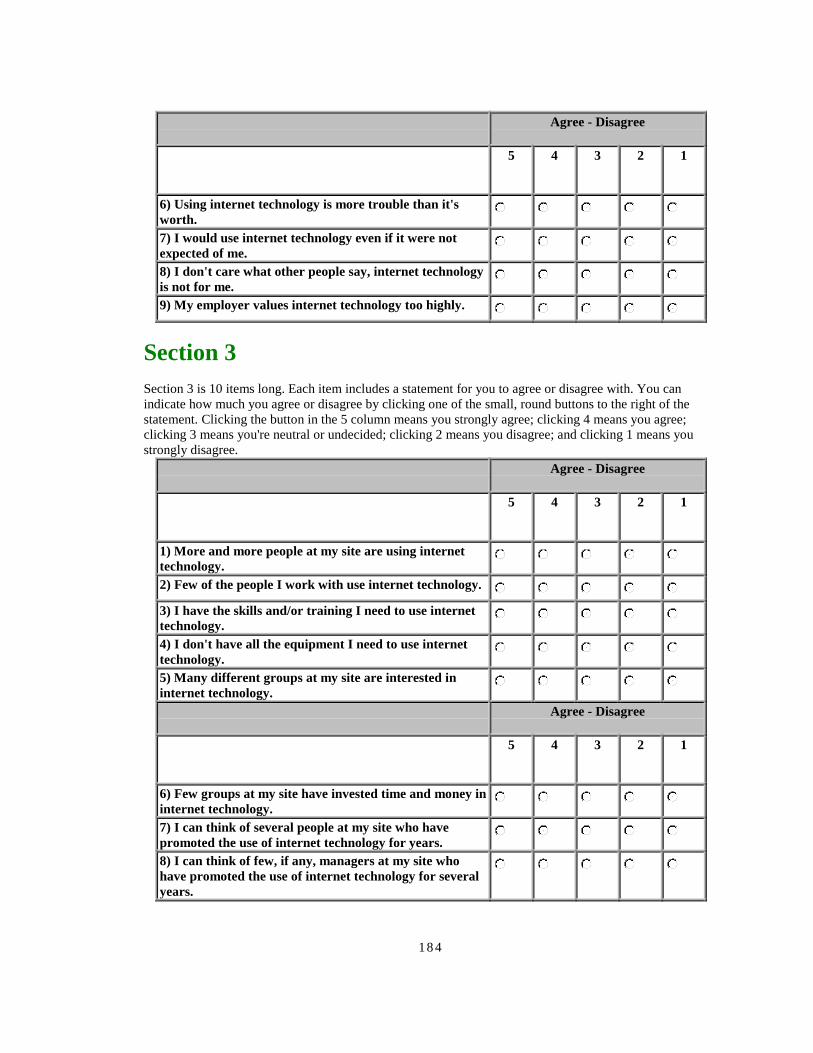
184
Agree - Disagree
5 4 3 2 1
6) Using internet technology is more trouble than it'sworth.
����� ����� ����� ����� �����
7) I would use internet technology even if it were notexpected of me.
����� ����� ����� ����� �����
8) I don't care what other people say, internet technologyis not for me.
����� ����� ����� ����� �����
9) My employer values internet technology too highly. ����� ����� ����� ����� �����
Section 3Section 3 is 10 items long. Each item includes a statement for you to agree or disagree with. You canindicate how much you agree or disagree by clicking one of the small, round buttons to the right of thestatement. Clicking the button in the 5 column means you strongly agree; clicking 4 means you agree;clicking 3 means you're neutral or undecided; clicking 2 means you disagree; and clicking 1 means youstrongly disagree.
Agree - Disagree
5 4 3 2 1
1) More and more people at my site are using internettechnology.
����� ����� ����� ����� �����
2) Few of the people I work with use internet technology.����� ����� ����� ����� �����
3) I have the skills and/or training I need to use internettechnology.
����� ����� ����� ����� �����
4) I don't have all the equipment I need to use internettechnology.
����� ����� ����� ����� �����
5) Many different groups at my site are interested ininternet technology.
����� ����� ����� ����� �����
Agree - Disagree
5 4 3 2 1
6) Few groups at my site have invested time and money ininternet technology.
����� ����� ����� ����� �����
7) I can think of several people at my site who havepromoted the use of internet technology for years.
����� ����� ����� ����� �����
8) I can think of few, if any, managers at my site whohave promoted the use of internet technology for severalyears.
����� ����� ����� ����� �����

185
9) Management at my site supports the use of internettechnology.
����� ����� ����� ����� �����
10) Management at my site doesn't invest enough moneyin internet technology.
����� ����� ����� ����� �����
Section 4Section 4 is six items long. For each item, pick the one answer that fits you best.
1) How long have you used internet technology?
����� don't use it ����� less than 1 year ����� 1 to 3 years ����� 4 to 6 years ����� 6 years or more2) On the average, how many hours a day do you use internet technology in your job?
����� don't use it ����� less than 1 hour ����� 1 to 3 hours ����� 3 to 6 hours ����� 6 hours or more3) How likely are you to use internet technology for a task at work if you're not required to?
����� wouldn't use it ����� unlikely ����� not sure ����� likely ����� very likely4) Which of the following combinations of capabilities best describes how you use internettechnology at work on a regular basis?
����� none
����� e-mail, web browser
����� e-mail, web browser, newsgroups
����� e-mail, web browser, newsgroups, multimedia (audio or video applications)
5) Which of the following combinations of work-related tasks best describes what you useinternet technology for at work on a regular basis?
����� nothing
����� finding organizational information
����� finding organizational information, performing administrative tasks
����� finding organizational information, performing administrative tasks, doing everydaywork
����� finding organizational information, performing administrative tasks, doing everydaywork, searching databases

186
6) Which of the following combinations of web-browsing habits best describes how you useinternet technology at work on a regular basis?
����� don't browse
����� following links from local homepages
����� following links from local homepages using bookmarks or hotlists
����� following links from local homepages using bookmarks or hotlists, searching theinternal network (or "intranet")
����� following links from local homepages using bookmarks or hotlists, searching theinternal network (or "intranet"), searching the entire internet
Section 5Section 5 is 11 items long. For items 1-8, pick the one answer that fits you best. Item 9 is optional and asksfor your e-mail address. Items 10-11 ask you for some of your opinions--write as much or as little as youlike.
1) For which of the following LM organizations do you work?
����� Idaho National Engineering and Environmental Laboratory
����� Lockheed Martin Energy Systems (East Tennessee Technology Park--K-25 Site)
����� Lockheed Martin Energy Systems (Oak Ridge Y-12 Plant)
����� Oak Ridge National Laboratory (Lockheed Martin Energy Research)
����� Sandia National Laboratories (Albuquerque)
����� Sandia National Laboratories (Livermore)
2) Which one of the following categories best describes your primary occupation?
����� administrative
����� clerical
����� computer-related
����� craftsperson
����� manager
����� researcher
����� technician
����� professional
����� other

187
3) What was the primary field covered in your formal education?
����� Business (i.e., Management, Economics, Marketing)
����� Computer Science or Mathematics
����� Crafts (i.e., Electrician, Pipefitter)
����� Humanities (i.e., English, Philosophy, Art)
����� Natural Sciences (i.e., Chemistry, Biology, Physics)
����� Public Management (i.e., Public Administration)
����� other
4) What is your gender?
����� female ����� male ����� prefer not to say5) What is your age?
����� less than 20
����� 20-29
����� 30-39
����� 40-49
����� 50-59
����� 60-69
����� 70-79
����� 80 or over
����� prefer not to say
6) What is your computer's operating system?
����� don't use a computer
����� PC with DOS
����� PC with Windows 3.1
����� PC with Windows '95 or NT
����� Macintosh
����� Workstation with UNIX
����� other
����� not sure
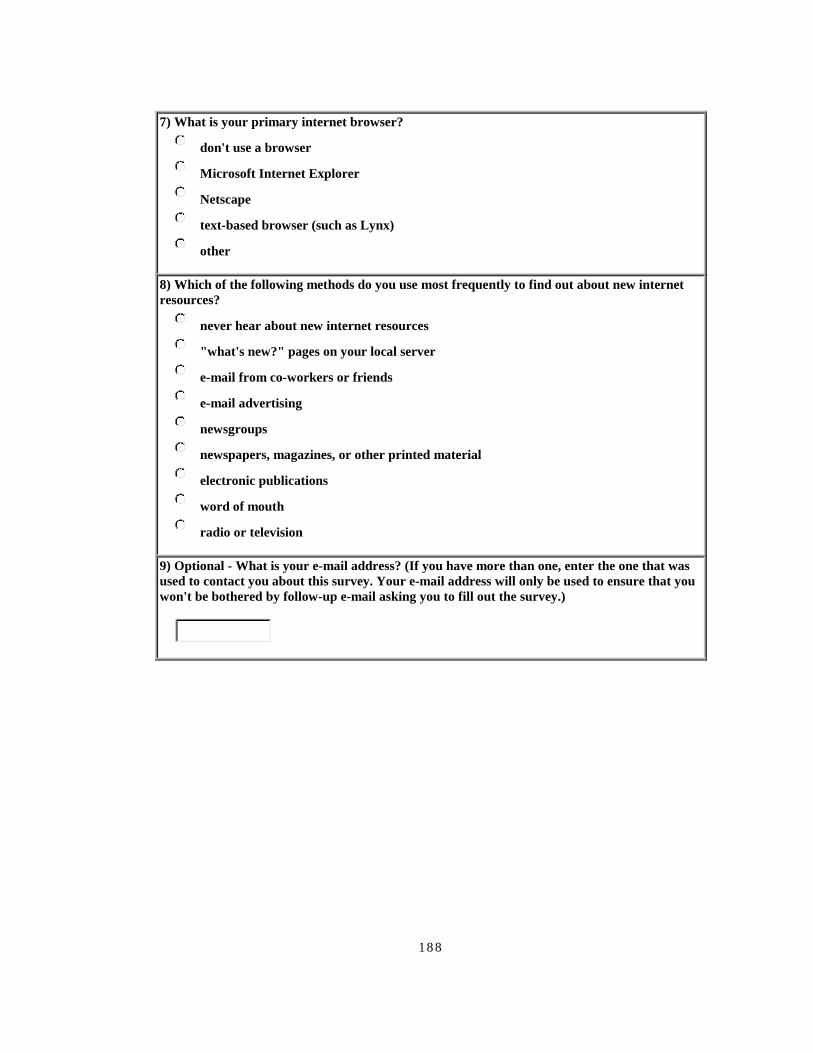
188
7) What is your primary internet browser?
����� don't use a browser
����� Microsoft Internet Explorer
����� Netscape
����� text-based browser (such as Lynx)
����� other
8) Which of the following methods do you use most frequently to find out about new internetresources?
����� never hear about new internet resources
����� "what's new?" pages on your local server
����� e-mail from co-workers or friends
����� e-mail advertising
����� newsgroups
����� newspapers, magazines, or other printed material
����� electronic publications
����� word of mouth
����� radio or television
9) Optional - What is your e-mail address? (If you have more than one, enter the one that wasused to contact you about this survey. Your e-mail address will only be used to ensure that youwon't be bothered by follow-up e-mail asking you to fill out the survey.)
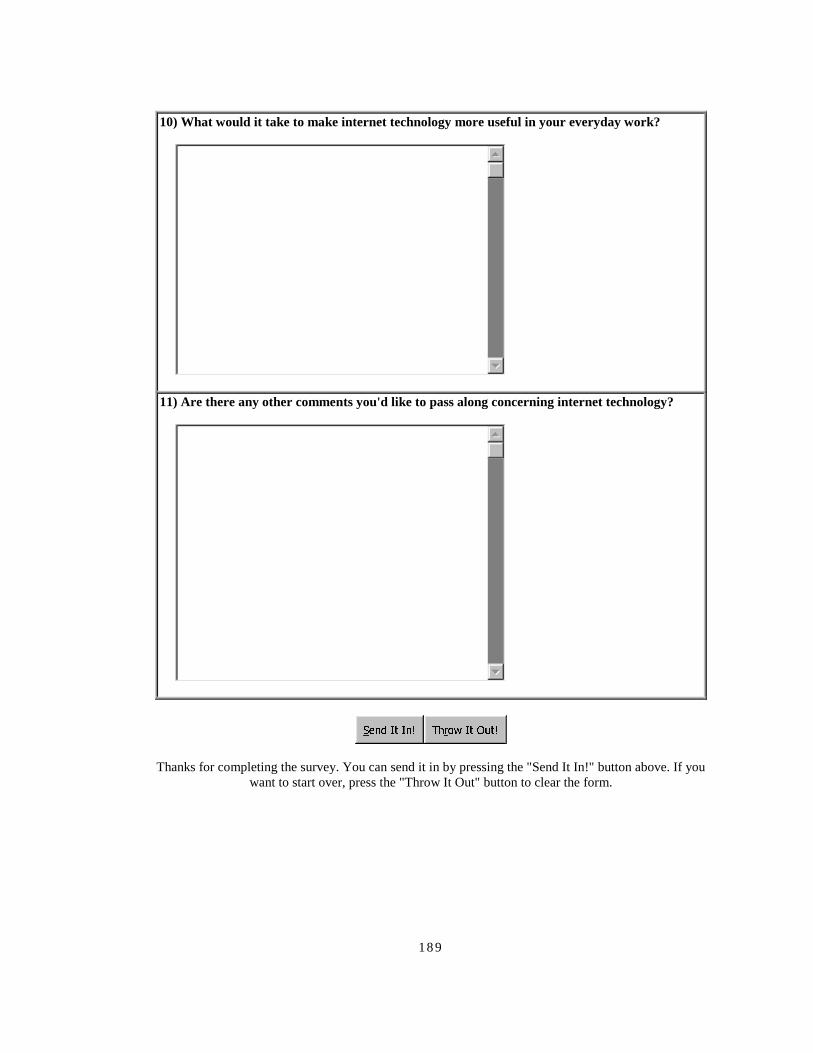
189
10) What would it take to make internet technology more useful in your everyday work?
11) Are there any other comments you'd like to pass along concerning internet technology?
6HQG ,W ,Q� 7KURZ ,W 2XW�
Thanks for completing the survey. You can send it in by pressing the "Send It In!" button above. If youwant to start over, press the "Throw It Out" button to clear the form.

190
E-Mail Survey Instrument***Web and Internet User Survey***
This Web and Internet User Survey is sponsored by the Lockheed MartinEnergy and Environment Sector Internet Working Group.
The results of the survey will help our organizations get a better ideaof whether or not people are using the web and internet on the job, howthey feel about this new technology, what they use it for, and how theylearn about new web resources, new software, and other changes. Thisinformation can be used to determine what sort of information peoplewant to have available on the web, to develop new training priorities,to improve communication about web- and internet-related issues, totarget areas for specialized training, and to help web developersprovide resources that meet more of their user's needs.
It doesn't matter whether you've never used the internet or you use itall day long, we need everyone who gets this message to take theopportunity to fill out the survey and send it in. That's because, atmost sites, only a fraction of staff members will receive this survey,so every completed survey we get back will be helping make the web andinternet more useful and accessible for all of us.
There are three ways to take the survey:
- On the Web: Go to the survey web site at<http://www.ornl.gov/survey/> and follow the instructions you findthere.
- By E-mail: There's a copy of the survey at the bottom of thismessage. Just follow the instructions below, fill out the survey, ande-mail it back to us.
- On Paper: If you'd rather fill out the survey on a paper form, dropus a line at [email protected] (include your mailing address) and we'llsend you a paper copy.The survey is 43 questions long; almost all the questions are multiplechoice; and it takes about 15 minutes to finish.
Responses to this survey will be read by a computer, so it's importantthat you enter your answers in the right places. At the beginning ofeach section, there's a brief description of the items in the sectionand the kind of answers the computer will recognize. Below eachquestion, there is an "answer pointer" that looks something like this:
=>S1_1=> <
You'll need to enter your answers on the same line as the answerpointer. For example, if you wanted to answer one of the survey itemswith a "3", you'd enter it right beside the answer pointer, like so:
=>S1_1=>3<

191
To fill out this survey, just reply to this mail message, and enteryour answers to the survey items next to the "answer pointers." Whenyou're finished, mail it back to where it came from (the returnaddress).
No names, e-mail addresses, or IP addresses (computer addresses) willbe included among the data gathered from the survey--out of respect forindividual privacy, as well to encourage honest answers. (You will havethe option to provide your e-mail address to avoid being bothered by e-mail reminders; however, e-mail addresses are separated from the otherresponses as soon as the survey is submitted.)
When "internet technology" is mentioned in this survey, it refersto the tools used to communicate through internal computer networks,also known as "intranets," or through the public internet, or WorldWide Web. Examples of these tools include e-mail, internet browsers(like Netscape, Microsoft Internet Explorer, and Lynx), newsgroups,etc.
If you've got any comments, questions, etc., don't send them to thereturn address on this message; instead, send them to [email protected].
Thanks in advance for filling out the survey. Every response counts.
--------------------------------------------------------------------
Web and Internet User Survey (E-mail Version)
<!=>BEGIN_SURVEY=>
Section 1
Section 1 is seven items long. Each item includes a statement for youto agree or disagree with. You can indicate how much you agree ordisagree by entering a number in the answer area below each item.Entering 5 means you strongly agree; entering 4 means you agree;entering 3 means you're neutral or undecided; entering 2 means youdisagree; and entering 1 means you strongly disagree.
1) Using internet technology makes my work easier.=>S1_1=> <!
2) Knowing how to use internet technology won't improve my careerand job security.=>S1_2=> <!
3) Internet technology fits in with the way my organization works.=>S1_3=> <!
4) Using internet technology is easy.=>S1_4=> <!
5) I find internet technology confusing.=>S1_5=> <!

192
6) I had opportunities to experiment with internet technology before Ihadto use it myself.=>S1_6=> <!
7) I had to rush into using internet technology.=>S1_7=> <!
Section 2
Section 2 is nine items long. Each item includes a statement for you toagree or disagree with. You can indicate how much you agree or disagreeby entering a number in the answer area below each item. Entering 5means you strongly agree; entering 4 means you agree; entering 3 meansyou're neutral or undecided; entering 2 means you disagree; andentering 1 means you strongly disagree.
1) I trust the people who are in charge of internet technology in myorganization.=>S2_1=> <!
2) I get along well with the people who are in charge of internettechnology in my organization.=>S2_2=> <!
3) The people who are in charge of internet technology in myorganizationare naturally friendly and helpful.=>S2_3=> <!
4) I don't like to be associated with the people who are in charge ofinternet technology in my organization.=>S2_4=> <!
5) Using internet technology is an enjoyable experience.=>S2_5=> <!
6) Using internet technology is more trouble than it's worth.=>S2_6=> <!
7) I would use internet technology even if it were not expected of me.=>S2_7=> <!
8) I don't care what other people say, internet technology is not forme.=>S2_8=> <!
9) My employer values internet technology too highly.=>S2_9=> <!

193
Section 3
Section 3 is 10 items long. Each item includes a statement for you toagree or disagree with. You can indicate how much you agree or disagreeby entering a number in the answer area below each item. Entering 5means you strongly agree; entering 4 means you agree; entering 3 meansyou're neutral or undecided; entering 2 means you disagree; andentering 1 means you strongly disagree.
1) More and more people at my site are using internet technology.=>S3_1=> <!
2) Few of the people I work with use internet technology.=>S3_2=> <!
3) I have the skills and/or training I need to use internet technology.=>S3_3=> <!
4) I don't have all the equipment I need to use internet technology.=>S3_4=> <!
5) Many different groups at my site are interested in internettechnology.=>S3_5=> <!
6) Few groups at my site have invested time and money in internettechnology.=>S3_6=> <!
7) I can think of several people at my site who have promoted the useofinternet technology for years.=>S3_7=> <!
8) I can think of few, if any, managers at my site who have promotedtheuse of internet technology for several years.=>S3_8=> <!9) Management at my site supports the use of internet technology.=>S3_9=> <!
10) Management at my site doesn't invest enough money in internettechnology.=>S3_10=> <!
Section 4
Section 4 is six items long. For each item, pick the one answer thatfits you best.
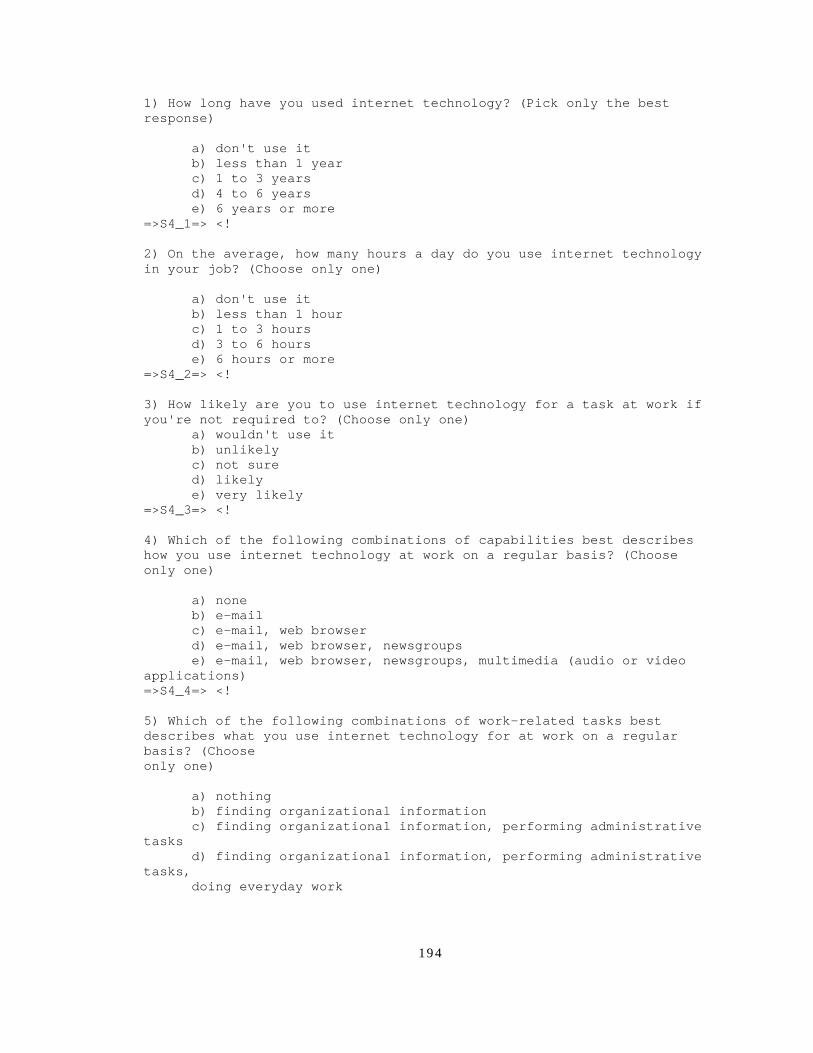
194
1) How long have you used internet technology? (Pick only the bestresponse)
a) don't use itb) less than 1 yearc) 1 to 3 yearsd) 4 to 6 yearse) 6 years or more
=>S4_1=> <!
2) On the average, how many hours a day do you use internet technologyin your job? (Choose only one)
a) don't use itb) less than 1 hourc) 1 to 3 hoursd) 3 to 6 hourse) 6 hours or more
=>S4_2=> <!
3) How likely are you to use internet technology for a task at work ifyou're not required to? (Choose only one)
a) wouldn't use itb) unlikelyc) not sured) likelye) very likely
=>S4_3=> <!
4) Which of the following combinations of capabilities best describeshow you use internet technology at work on a regular basis? (Chooseonly one)
a) noneb) e-mailc) e-mail, web browserd) e-mail, web browser, newsgroupse) e-mail, web browser, newsgroups, multimedia (audio or video
applications)=>S4_4=> <!
5) Which of the following combinations of work-related tasks bestdescribes what you use internet technology for at work on a regularbasis? (Chooseonly one)
a) nothingb) finding organizational informationc) finding organizational information, performing administrative
tasksd) finding organizational information, performing administrative
tasks,doing everyday work

195
e) finding organizational information, performing administrativetasks,
doing everyday work,searching databases
=>S4_5=> <!
6) Which of the following combinations of web-browsing habits bestdescribes how you use internet technology at work on a regular basis?(Choose only one)
a) don't browseb) following links from local homepagesc) following links from local homepages using bookmarks or
hotlistsd) following links from local homepages using bookmarks or
hotlists,searching the internal network (or "intranet")e) following links from local homepages using bookmarks or
hotlists,searching the internal network (or "intranet"), searching the
entire internet=>S4_6=> <!
Section 5Section 5 is 11 items long. Item 9 (e-mail address) is optional. Foritems 1-8, pick the on answer that fits you best. Questions 10-11 askyou for some of your opinions--write as much r as little as you like.
1) For which of the following LM organizations do you work? (Chooseonly one)
a) Idaho National Engineering and Environmental Laboratoryb) Lockheed Martin Energy Systems (East Tennessee Technology
Park--K-25 site)c) Lockheed Martin Energy Systems (Oak Ridge Y-12 Plant)d) Oak Ridge National Laboratory (Lockheed Martin Energy
Research)e) Sandia National Laboratories (Albuquerque)
f) Sandia National Laboratories ( Livermore)=>S5_1=> <!
2) Which one of the following categories best describes your primaryoccupation? (Choose only one)
a) administrativeb) clericalc) computer-relatedd) craftspersone) managerf) researcherg) technician

196
h) professionali) other
=>S5_2=> <!
3) What was the primary field covered in your formal education? (Chooseonly one)
a) Business (i.e., Management, Economics, Marketing)b) Computer Science or Mathematicsc) Crafts (i.e., Electrician, Pipefitter)d) Humanities (i.e., English, Philosophy, Art)e) Natural Sciences (i.e., Chemistry, Biology, Physics)f) Public Management (i.e., Public Administration)g) other
=>S5_3=> <!
4) What is your gender? (Choose only one)
a) femaleb) malec) prefer not to say
=>S5_4=> <!
5) What is your age? (Choose only one)
a) less than 20b) 20-29c) 30-39d) 40-49e) 50-59f) 60-69g) 70-79h) 80 or overi) prefer not to say
=>S5_5=> <!
6) What is your primary computer's operating system? (Choose only one)
a) don't use a computerb) PC with DOSc) PC with Windows 3.1d) PC with Windows '95 or NTe) Macintoshf) Workstation with UNIXg) otherh) not sure
=>S5_6=> <!
7) What is your primary internet browser? (Choose only one)
a) don't use a browserb) Microsoft Internet Explorerc) Netscaped) text-based browser (such as Lynx)

197
e) other=>S5_7=> <!
8) Which of the following methods do you use most frequently to findout about new internet resources? (Choose only one)
a) never hear about new internet resourcesb) "what's new?" pages on your local serverc) e-mail from co-workers or friendsd) e-mail advertisinge) newsgroupsf) newspapers, magazines, or other printed materialg) electronic publicationsh) word of mouthi) radio or television
=>S5_8=> <!
9) Optional - What is your e-mail address? (If you have more than one,enter the one that was used to contact you about this survey. Your e-mail address will only be used to ensure that you won't be bothered byfollow-up e-mail asking you to fill out the survey.)=>S5_9=> <!
10) What would it take to make internet technology more useful in youreveryday work?=>S5_10=>
<!11) Are there any other comments you'd like to pass along concerninginternet technology?=>S5_11=>
<!<=>END_SURVEY=>
Thanks for completing the survey. You can send it in by e-mailing itback the return address.
Again, if you have questions or comments about this survey, don't sendthem to the return address on this message (that's just for submittingcompleted surveys). Instead, send them to [email protected].

198
Paper Survey Instrument
:HE�DQG�,QWHUQHW�7HFKQRORJLHV
8VHU�6XUYH\
Spon sored by the Lockhee d Martin Energy and En viro nment Secto r Internet Working G roup
This Web and Internet Technologies User Survey is sponsored by the Lockheed Martin Energyand Environment Sector Internet Working Group.
The results of the survey will help our organizations get a better idea of whether or not people areusing the web and internet on the job, how they feel about this new technology, what they use itfor, and how they learn about new web resources, new software, and other changes. Thisinformation can be used to determine what sort of information people want to have available onthe web, to develop new training priorities, to improve communication about web- and internet-related issues, to target areas for specialized training, and to help web developers provideresources that meet user's needs.
It doesn't matter whether you've never used the internet or you use it all day long, we needeveryone who gets this message to take the opportunity to fil l out the survey and send it in. That'sbecause, at most sites, only a fraction of staff members will receive this survey, so everycompleted survey we get back will help to make the web and internet more useful and accessiblefor all of us.
The survey is 42 questions long; almost all the questions are multiple choice; and it takes about15 minutes to finish. When "internet technology" is mentioned in this survey, it refers to the toolsused to communicate through internal computer networks, also known as "intranets," or throughthe public internet, or "World Wide Web." These tools include e-mail, internet browsers (li keNetscape, Microsoft Internet Explorer, and Lynx), newsgroups, etc.
The survey is printed on both the front and back of the paper, so be sure you don't miss a side.
If you've got any comments or questions, drop us a line at Web and Internet User Survey, OakRidge National Laboratory, P.O. Box 2008 MS 6144, Oak Ridge, TN 37831-6144, or e-mail us [email protected].
Thanks in advance for fillin g out the survey. Every response counts.

199
Web and Internet Technologies User Survey
Section 1
Section 1 is seven items long. Each item includes a statement for you to agree or disagree with. You canindicate how much you agree or disagree by circling one of the numbers to the right of the statement.Circling 5 means you strongly agree; circling 4 means you agree; circling 3 means you're neutral orundecided; circling 2 means you disagree; and circling 1 means you strongly disagree.
Agree - Disagree1) Using internet technology makes my work easier. 5 4 3 2 12) Knowing how to use internet technology won't improve my career
and job security. 5 4 3 2 13) Internet technology fits in with the way my organization works. 5 4 3 2 14) Using internet technology is easy. 5 4 3 2 15) I find internet technology confusing. 5 4 3 2 16) I had opportunities to experiment with internet technology before
I had to use it myself. 5 4 3 2 17) I had to rush into using internet technology. 5 4 3 2 1
Section 2
Section 2 is nine items long. Each item includes a statement for you to agree or disagree with. You canindicate how much you agree or disagree by circling one of the numbers to the right of the statement.Circling 5 means you strongly agree; circling 4 means you agree; circling 3 means you're neutral orundecided; circling 2 means you disagree; and circling 1 means you strongly disagree.
Agree - Disagree1) I trust the people who are in charge of internet technology in my
organization. 5 4 3 2 12) I get along well with the people who are in charge of internet
technology in my organization. 5 4 3 2 13) The people who are in charge of internet technology in my organization are naturally friendly and helpful. 5 4 3 2 14) I don't like to be associated with the people who are in charge of
internet technology in my organization. 5 4 3 2 15) Using internet technology is an enjoyable experience. 5 4 3 2 16) Using internet technology is more trouble than it's worth. 5 4 3 2 17) I would use internet technology even if it were not expected of me. 5 4 3 2 18) I don't care what other people say, internet technology is not for
me. 5 4 3 2 19) My employer values internet technology too highly. 5 4 3 2 1
Section 3
Section 3 is 10 items long. Each item includes a statement for you to agree or disagree with. You canindicate how much you agree or disagree by circling one of the numbers to the right of the statement.Circling 5 means you strongly agree; circling 4 means you agree; circling 3 means you're neutral orundecided; circling 2 means you disagree; and circling 1 means you strongly disagree.
Agree - Disagree1) More and more people at my site are using internet technology. 5 4 3 2 1

200
2) Few of the people I work with use internet technology. 5 4 3 2 13) I have the skills and/or training I need to use internet technology. 5 4 3 2 14) I don't have all the equipment I need to use internet technology. 5 4 3 2 15) Many different groups at my site are interested in internet
technology. 5 4 3 2 16) Few groups at my site have invested time and money in internet
technology. 5 4 3 2 17) I can think of several people at my site who have promoted the use
of internet technology for years. 5 4 3 2 18) I can think of few, if any, managers at my site who have promoted
the use of internet technology for several years. 5 4 3 2 19) Management at my site supports the use of internet technology. 5 4 3 2 110) Management at my site doesn't invest enough money in internet
technology. 5 4 3 2 1 Section 4
Section 4 is six items long. For each of the items, circle the one answer that fits you best.
1) How long have you used internet technology? (Circle only one)(a) don't use it (b) less than 1 year (c) 1 to 3 years (d) 4 to 6 years (e) 6 years or more
2) On the average, how many hours a day do you use internet technology in your job? (Circle only one)(a) don't use it (b) less than 1 hour (c) 1 to 3 hours (d) 3 to 6 hours (e) 6 hours or more
3) How likely are you to use internet technology for a task at work if you're not required to?(Circle only one)(a) wouldn't use it (b) unlikely (c) not sure (d) likely (e) very likely
4) Which of the following combinations of capabilities best describes how you use internettechnology at work on a regular basis? (Circle only one)(a) none(b) e-mail(c) e-mail, web browser(d) e-mail, web browser, newsgroups(e) e-mail, web browser, newsgroups, multimedia (audio or video applications)
5) Which of the following combinations of work-related tasks best describes what you use internettechnology for at work on a regular basis? (Circle only one)(a) nothing(b) finding organizational information
(c) finding organizational information, performing administrative tasks (d) finding organizational information, performing administrative tasks, doing everyday work (e) finding organizational information, performing administrative tasks, doing everyday work,
searching databases6) Which of the following combinations of web-browsing habits best describes how you use internet
technology at work on a regular basis? (Circle only one)(a) don't browse
(b) following links from local homepages (c) following links from local homepages using bookmarks or hotlists (d) following links from local homepages using bookmarks or hotlists, searching the internal
network (or "intranet") (e) following links from local homepages using bookmarks or hotlists, searching the internal network (or "intranet"), searching the entire internet

201
Section 5
Section 5 is 10 questions long. For items 1-8, circle the one answer that fits you best. Items 9-10 ask youfor some of your opinions--write as much or as little as you like.
1) For which of the following LM organizations do you work? (Circle only one)(a) Idaho National Engineering and Environmental Laboratory
(b) Lockheed Martin Energy Systems (East Tennessee Technology Park--K-25 Site) (c) Lockheed Martin Energy Systems (Oak Ridge Y-12 Plant) (d) Oak Ridge National Laboratory (Lockheed Martin Energy Research) (e) Sandia National Laboratories (Albuquerque) (f) Sandia National Laboratories (Livermore)2) Which one of the following categories best describes your primary occupation? (Circle only one)
(a) administrative (b) clerical (c) computer-related
(d) craftsperson (e) manager (f) researcher (g) technician (h) professional (i) other3) What was the primary field covered in your formal education? (Circle only one)
(a) Business (i.e., Management, Economics, Marketing) (b) Computer Science or Mathematics (c) Crafts (i.e., Electrician, Pipefitter) (d) Humanities (i.e., English, Philosophy, Art)
(e) Natural Sciences (i.e., Chemistry, Biology, Physics) (f) Public Management (i.e., Public Administration) (g) other4) What is your gender? (Circle only one)
(a) female (b) male (c) prefer not to say5) What is your age? (Circle only one)
(a) less than 20 (b) 20-29 (c) 30-39 (d) 40-49 (e) 50-59 (f) 60-69 (g) 70-79
(h) 80 or over (i) prefer not to say6) What is your computer's operating system? (Circle only one)
(a) don't use a computer (b) PC with DOS (c) PC with Windows 3.1 (d) PC with Windows '95 or NT (e) Macintosh (f) Workstation with UNIX (g) other (h) not sure

202
7) What is your primary internet browser? (Circle only one)(a) don't use a browser
(b) Microsoft Internet Explorer(c) Netscape(d) text-based browser (such as Lynx)
(e) other8) Which of the following methods do you use most frequently to find out about new internet resources?
(Circle only one)(a) never hear about new internet resources
(b) "what's new?" pages on your local server (c) e-mail from co-workers or friends (d) e-mail advertising (e) newsgroups
(f) newspapers, magazines, or other printed material (g) electronic publications (h) word of mouth (i) radio or television
9) What would it take to make internet technology more useful in your everyday work?
10) Are there any other comments you'd like to pass along concerning internet technology?
Thanks for participating in the survey. Once you've finished, place the survey in the self-addressedreturn envelope that came with it, and drop it in the mail--it doesn't need a stamp.
Thanks again.

203
Appendix D: E-Mail and Paper Reminder Notices

204
E-Mail Reminder Notice
Just a reminder...
You should have already gotten a notice about the "Web and InternetUserSurvey," sponsored by the Lockheed Martin Energy and EnvironmentSector Internet Working Group. If you've already responded to thesurvey,thanks a million. If you haven't, please try to find about 15 minutestofill out the survey--it's available in web, e-mail and paper forms. Allthedetails you'll need are included below.
Thanks!-----------------------------------
***Web and Internet User Survey***
This Web and Internet User Survey is sponsored by the Lockheed MartinEnergy and Environment Sector Internet Working Group.
The results of the survey will help our organizations get a better ideaof whether or not people are using the web and internet on the job, howthey feel about this new technology, what they use it for, and how theylearn about new web resources, new software, and other changes. Thisinformation can be used to determine what sort of information peoplewant to have available on the web, to develop new training priorities,to improve communication about web- and internet-related issues, totarget areas for specialized training, and to help web developersprovide resources that meet more of their user's needs.
It doesn't matter whether you've never used the internet or you use itall day long, we need everyone who gets this message to take theopportunity to fill out the survey and send it in. That's because, atmost sites, only a fraction of staff members will receive this survey,so every completed survey we get back will be helping make the web andinternet more useful and accessible for all of us.
There are three ways to take the survey:
- On the Web: Go to the survey web site at<http://www.ornl.gov/survey/> and follow the instructions you findthere.
- By E-mail: There's a copy of the survey at the bottom of thismessage. Just follow the instructions below, fill out the survey, ande-mail it back to us.
- On Paper: If you'd rather fill out the survey on a paper form, dropus a line at [email protected] (include your mailing address) and we'llsend you a paper copy.

205
The survey is 43 questions long; almost all the questions are multiplechoice; and it takes about 15 minutes to finish.
Responses to this survey will be read by a computer, so it's importantthat you enter your answers in the right places. At the beginning ofeach section, there's a brief description of the items in the sectionand the kind of answers the computer will recognize. Below eachquestion, there is an "answer pointer" that looks something like this:
=>S1_1=> <
You'll need to enter your answers on the same line as the answerpointer. For example, if you wanted to answer one of the survey itemswith a "3", you'd enter it right beside the answer pointer, like so:
=>S1_1=>3<
To fill out this survey, just reply to this mail message, and enteryour answers to the survey items next to the "answer pointers." Whenyou're finished, mail it back to where it came from (the returnaddress).
No names, e-mail addresses, or IP addresses (computer addresses) willbe included among the data gathered from the survey--out of respect forindividual privacy, as well to encourage honest answers. (You will havethe option to provide your e-mail address to avoid being bothered by e-mail reminders; however, e-mail addresses are separated from the otherresponses as soon as the survey is submitted.)
When "internet technology" is mentioned in this survey, it refersto the tools used to communicate through internal computer networks,also known as "intranets," or through the public internet, or WorldWide Web. Examples of these tools include e-mail, internet browsers(like Netscape, Microsoft Internet Explorer, and Lynx), newsgroups,etc.
If you've got any comments, questions, etc., don't send them to thereturn address on this message; instead, send them to [email protected].
Thanks in advance for filling out the survey. Every response counts.
--------------------------------------------------------------------
Web and Internet User Survey (E-mail Version)
<!=>BEGIN_SURVEY=>
Section 1
Section 1 is seven items long. Each item includes a statement for youto agree or disagree with. You can indicate how much you agree ordisagree by entering a number in the answer area below each item.Entering 5 means you strongly agree; entering 4 means you agree;
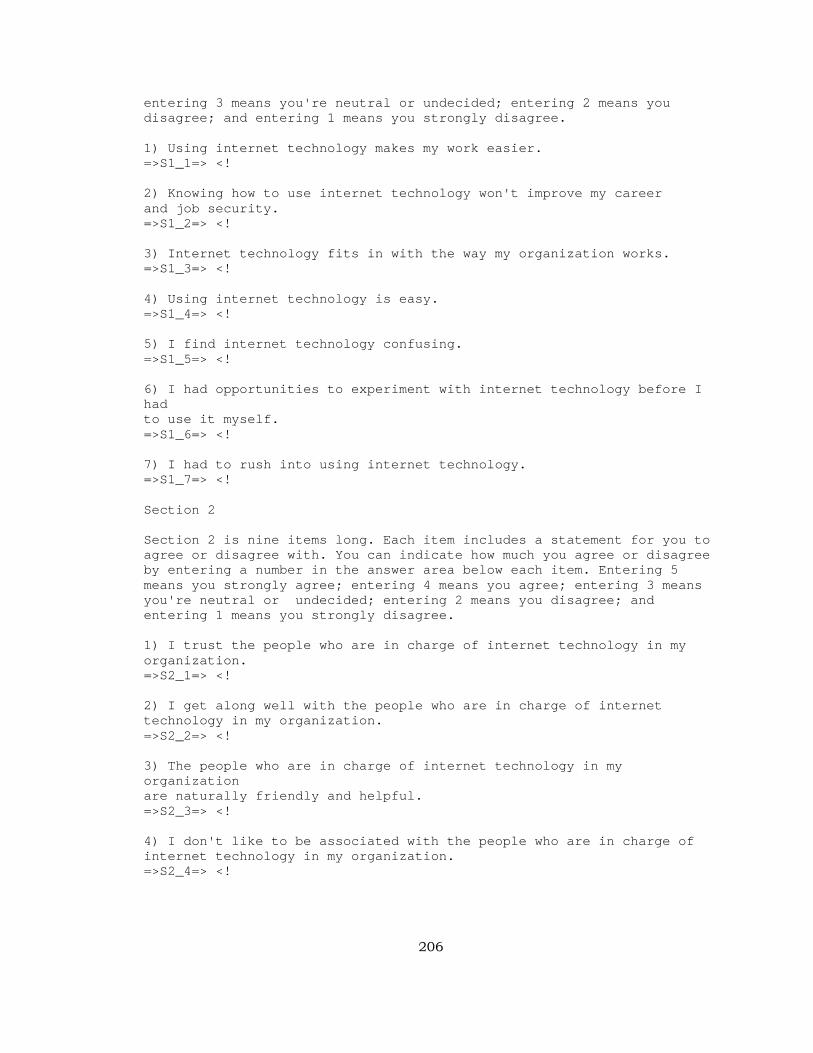
206
entering 3 means you're neutral or undecided; entering 2 means youdisagree; and entering 1 means you strongly disagree.
1) Using internet technology makes my work easier.=>S1_1=> <!
2) Knowing how to use internet technology won't improve my careerand job security.=>S1_2=> <!
3) Internet technology fits in with the way my organization works.=>S1_3=> <!
4) Using internet technology is easy.=>S1_4=> <!
5) I find internet technology confusing.=>S1_5=> <!
6) I had opportunities to experiment with internet technology before Ihadto use it myself.=>S1_6=> <!
7) I had to rush into using internet technology.=>S1_7=> <!
Section 2
Section 2 is nine items long. Each item includes a statement for you toagree or disagree with. You can indicate how much you agree or disagreeby entering a number in the answer area below each item. Entering 5means you strongly agree; entering 4 means you agree; entering 3 meansyou're neutral or undecided; entering 2 means you disagree; andentering 1 means you strongly disagree.
1) I trust the people who are in charge of internet technology in myorganization.=>S2_1=> <!
2) I get along well with the people who are in charge of internettechnology in my organization.=>S2_2=> <!
3) The people who are in charge of internet technology in myorganizationare naturally friendly and helpful.=>S2_3=> <!
4) I don't like to be associated with the people who are in charge ofinternet technology in my organization.=>S2_4=> <!

207
5) Using internet technology is an enjoyable experience.=>S2_5=> <!
6) Using internet technology is more trouble than it's worth.=>S2_6=> <!
7) I would use internet technology even if it were not expected of me.=>S2_7=> <!
8) I don't care what other people say, internet technology is not forme.=>S2_8=> <!
9) My employer values internet technology too highly.=>S2_9=> <!
Section 3
Section 3 is 10 items long. Each item includes a statement for you toagree or disagree with. You can indicate how much you agree or disagreeby entering a number in the answer area below each item. Entering 5means you strongly agree; entering 4 means you agree; entering 3 meansyou're neutral or undecided; entering 2 means you disagree; andentering 1 means you strongly disagree.
1) More and more people at my site are using internet technology.=>S3_1=> <!
2) Few of the people I work with use internet technology.=>S3_2=> <!
3) I have the skills and/or training I need to use internet technology.=>S3_3=> <!
4) I don't have all the equipment I need to use internet technology.=>S3_4=> <!
5) Many different groups at my site are interested in internettechnology.=>S3_5=> <!
6) Few groups at my site have invested time and money in internettechnology.=>S3_6=> <!
7) I can think of several people at my site who have promoted the useofinternet technology for years.=>S3_7=> <!
8) I can think of few, if any, managers at my site who have promotedtheuse of internet technology for several years.=>S3_8=> <!
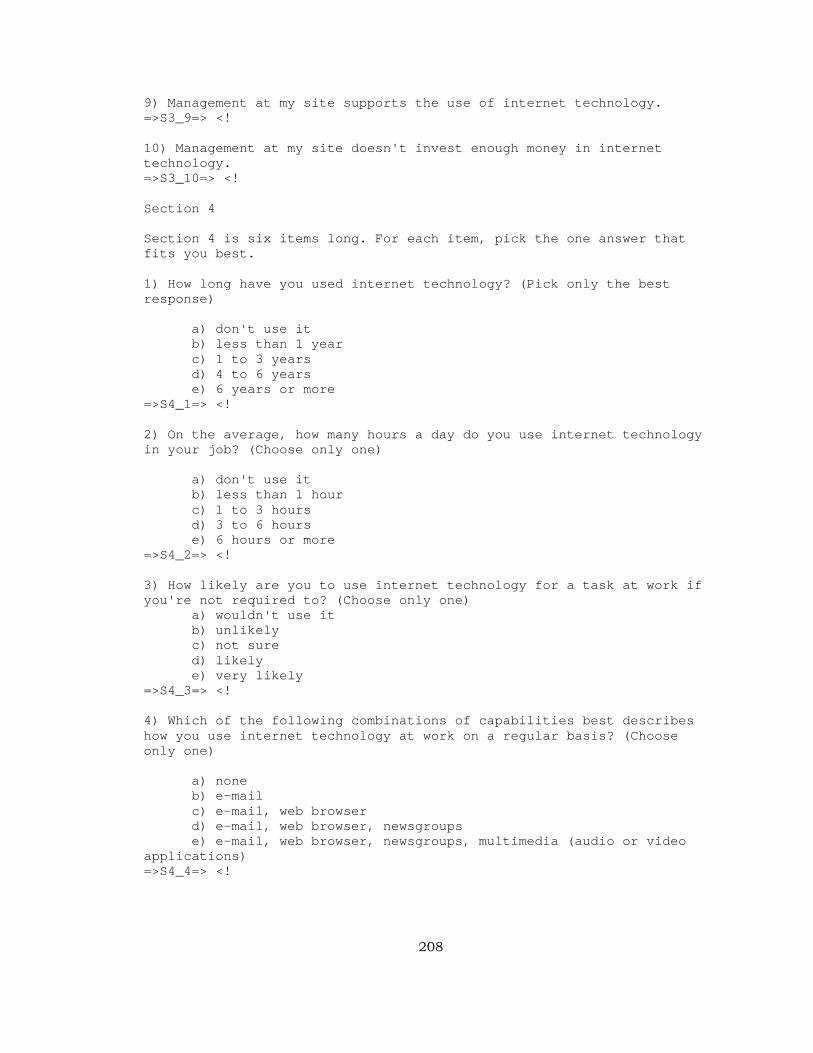
208
9) Management at my site supports the use of internet technology.=>S3_9=> <!
10) Management at my site doesn't invest enough money in internettechnology.=>S3_10=> <!
Section 4
Section 4 is six items long. For each item, pick the one answer thatfits you best.
1) How long have you used internet technology? (Pick only the bestresponse)
a) don't use itb) less than 1 yearc) 1 to 3 yearsd) 4 to 6 yearse) 6 years or more
=>S4_1=> <!
2) On the average, how many hours a day do you use internet technologyin your job? (Choose only one)
a) don't use itb) less than 1 hourc) 1 to 3 hoursd) 3 to 6 hourse) 6 hours or more
=>S4_2=> <!
3) How likely are you to use internet technology for a task at work ifyou're not required to? (Choose only one)
a) wouldn't use itb) unlikelyc) not sured) likelye) very likely
=>S4_3=> <!
4) Which of the following combinations of capabilities best describeshow you use internet technology at work on a regular basis? (Chooseonly one)
a) noneb) e-mailc) e-mail, web browserd) e-mail, web browser, newsgroupse) e-mail, web browser, newsgroups, multimedia (audio or video
applications)=>S4_4=> <!

209
5) Which of the following combinations of work-related tasks bestdescribes what you use internet technology for at work on a regularbasis? (Chooseonly one)
a) nothingb) finding organizational informationc) finding organizational information, performing administrative
tasksd) finding organizational information, performing administrative
tasks,doing everyday worke) finding organizational information, performing administrative
tasks,doing everyday work,searching databases
=>S4_5=> <!
6) Which of the following combinations of web-browsing habits bestdescribes how you use internet technology at work on a regular basis?(Choose only one)
a) don't browseb) following links from local homepagesc) following links from local homepages using bookmarks or
hotlistsd) following links from local homepages using bookmarks or
hotlists,searching the internal network (or "intranet")e) following links from local homepages using bookmarks or
hotlists,searching the internal network (or "intranet"), searching the
entire internet=>S4_6=> <!
Section 5Section 5 is 11 items long. Item 9 (e-mail address) is optional. Foritems 1-8, pick the on answer that fits you best. Questions 10-11 askyou for some of your opinions--write as much r as little as you like.
1) For which of the following LM organizations do you work? (Chooseonly one)
a) Idaho National Engineering and Environmental Laboratoryb) Lockheed Martin Energy Systems (East Tennessee Technology
Park--K-25 site)c) Lockheed Martin Energy Systems (Oak Ridge Y-12 Plant)d) Oak Ridge National Laboratory (Lockheed Martin Energy
Research)e) Sandia National Laboratories (Albuquerque)
f) Sandia National Laboratories (Livermore)=>S5_1=> <!

210
2) Which one of the following categories best describes your primaryoccupation? (Choose only one)
a) administrativeb) clericalc) computer-relatedd) craftspersone) managerf) researcherg) technicianh) professionali) other
=>S5_2=> <!
3) What was the primary field covered in your formal education? (Chooseonly one)
a) Business (i.e., Management, Economics, Marketing)b) Computer Science or Mathematicsc) Crafts (i.e., Electrician, Pipefitter)d) Humanities (i.e., English, Philosophy, Art)e) Natural Sciences (i.e., Chemistry, Biology, Physics)f) Public Management (i.e., Public Administration)g) other
=>S5_3=> <!
4) What is your gender? (Choose only one)
a) femaleb) malec) prefer not to say
=>S5_4=> <!
5) What is your age? (Choose only one)
a) less than 20b) 20-29c) 30-39d) 40-49e) 50-59f) 60-69g) 70-79h) 80 or overi) prefer not to say
=>S5_5=> <!
6) What is your primary computer's operating system? (Choose only one)
a) don't use a computerb) PC with DOSc) PC with Windows 3.1d) PC with Windows '95 or NTe) Macintoshf) Workstation with UNIX

211
g) otherh) not sure
=>S5_6=> <!
7) What is your primary internet browser? (Choose only one)
a) don't use a browserb) Microsoft Internet Explorerc) Netscaped) text-based browser (such as Lynx)e) other
=>S5_7=> <!
8) Which of the following methods do you use most frequently to findout about new internet resources? (Choose only one)
a) never hear about new internet resourcesb) "what's new?" pages on your local serverc) e-mail from co-workers or friendsd) e-mail advertisinge) newsgroupsf) newspapers, magazines, or other printed materialg) electronic publicationsh) word of mouthi) radio or television
=>S5_8=> <!
9) Optional - What is your e-mail address? (If you have more than one,enter the one that was used to contact you about this survey. Your e-mail address will only be used to ensure that you won't be bothered byfollow-up e-mail asking you to fill out the survey.)=>S5_9=> <!
10) What would it take to make internet technology more useful in youreveryday work?=>S5_10=>
<!11) Are there any other comments you'd like to pass along concerninginternet technology?=>S5_11=>
<!<=>END_SURVEY=>
Thanks for completing the survey. You can send it in by e-mailing itback the return address.
Again, if you have questions or comments about this survey, don't sendthem to the return address on this message (that's just for submittingcompleted surveys). Instead, send them to [email protected].

212
Paper Reminder Notice
Guess what?You should have already gotten a copy of the "Web and Internet UserSurvey," sponsored by the Lockheed Martin Energy and EnvironmentSector Internet Working Group. If you've already returned it, thanks amillion. If you haven't, please try to find about 15 minutes to fill out thesurvey, put it in its pre-addressed return envelope, and drop it in themail by September 5.
If you never got a copy of the survey (and you want one) or if you'vegot questions or comments, drop us a line at Web and Internet UserSurvey, Oak Ridge National Laboratory, P.O. Box 2008 MS 6144, OakRidge, TN 37831-6144, or e-mail us at [email protected].
Thanks for your support. You're helping to make the web and internetmore useful and accessible for all of us.

213
Appendix E: Notes on Automated Processing ofWeb and E-Mail Survey Responses
E-Mail Survey Instrument
The most difficult aspect of using e-mail as a survey medium is
structuring the instrument in such a way that responses can be
automatically parsed by a computer program and arranged in a data
matrix. This is usually accomplished by embedding a unique sequence of
characters in the instrument immediately before (and possibly after) each
survey response. These characters are recognized by the computer
program and allow it to separate survey responses from the body of the
survey. A reproduction of the e-mail survey instrument is included in
Appendix D. Other peculiarities with e-mail survey instruments are
discussed below.
Notes on Active and Inactive E-mail Addresses
In virtually any list of organizational e-mail addresses, there will be
addresses that are invalid. This can be caused by changes of e-mail
address, people leaving the organization, changes in network structure,
etc. Therefore, a small percentage of the e-mail addresses on any listing
can reasonably be expected to be invalid. Generally speaking, mail sent
to these addresses will be returned by the mailserver (the computer that
214
handles e-mail) that receives it with some sort of indication that the
address is invalid.
In some organizations, however, a larger problem (at least for survey
research) exists. Some organizations assign all of their employees an e-
mail address, regardless of whether the employees use e-mail or not.
Therefore, it is important to verify that the lists of e-mail addresses
include only "active" addresses (those that have been used recently). This
will help to ensure that mail is sent only to individuals who are regular e-
mail users. Individuals having "inactive" e-mail addresses should be
contacted by alternate means.
Notes on Processing E-Mail Responses
In the course of this study, the primary problem with automatically
processing e-mail survey responses was that the responses were often
entered incorrectly. These surveys were not parsed correctly by the
computer, and caused "garbage" to be written to the data matrix.
Initially, these problems were handled by editing the garbage out of the
data matrix and setting the offending e-mail message aside for manual
processing. However, it eventually became clear that a large percentage
of the e-mail responses had problems of this sort to one extent or
another, so it was determined that processing all e-mail responses by

215
hand would be the best way to proceed to ensure the integrity of the
data.
This problem arises because, when a computer program is parsing an e-
mail message, it depends on finding responses only where it expects
them to be. Responses that appear in other places are ignored. In this
survey, respondents were to place their responses between the angle
brackets "> <" provided on the line below each item. In many cases
that's exactly what happened. In many others, however, responses were
placed outside the brackets, entered on other lines, entered as a group at
the end of the survey, or entered along with extraneous comments
between the brackets. In still other cases the brackets were deleted and
replaced with responses. In a couple of extreme cases, the entire survey
was deleted and replaced with a block of variable names and responses.
These response entry problems often caused a line or two of garbage to
be written to the data matrix. In two cases they apparently caused the
comment file logs to crash, resulting in comment data not being collected
for short periods of time (only comment data, not data from the body of
the survey—the two types of input were logged separately).
Although some of these problems could probably be overcome with
lengthy explanations and illustrations or more complex programming,

216
the fact remains that e-mail surveys designed to be automatically
processed will generate a relatively large number of responses that will
need to be coded manually. Given this eventuality, it is important that
the e-mail message containing the survey instrument is set up to either
(a) send a response both to the computer address where processing will
occur and to the survey researcher (in order to enable the researcher to
diagnose problem responses) or (b) send responses only to the
researcher, so he or she can implement some quality control procedures
to ensure that messages will be amenable to automated processing
before they are forwarded to the computer.
Notes on Processing Web-Based Responses
Almost everything that is wrong with processing e-mail survey responses
is right with processing web-based survey responses. This difference is
due to the fact that information entered into a web-based survey form is
assigned a specific variable name and value the moment the form is
submitted. This information is clearly identified, doesn't have to be
winnowed out of a file of unrelated information, and most importantly,
there's nothing the (non-malicious) respondent can do to cause the
information to be misinterpreted by the computer program it's being
submitted to. None of the responses received from the web-based survey
form during this study had any problems at all.
217
Notes on Preventing Multiple Responses
A number of processes have been developed to guard against individuals'
submitting multiple responses to on-line surveys. However, many of
these involve gathering information that could be perceived by
respondents as compromising their anonymity. In this case, the threat of
individuals intentionally submitting multiple responses was thought to
be relatively low for several reasons. First, the survey was conducted in a
business environment, so it was unlikely that multiple responses would
be submitted as a prank. Second, the pretest survey showed no evidence
that multiple responses had been submitted. Therefore, a relatively
simple mechanism was employed to guard against this problem. In the
case of e-mail responses, the return e-mail address of each respondent
was first compared to a list of previous respondents. If the address
appeared in the log, then the message was disregarded (and the
responses were not added to the data matrix). If the address was not in
log, it was added to the log, the message was processed, and the
responses were added to the data matrix. It is important to note that, in
a survey of this size, there is no reliable way to associate entries in the e-
mail address log with responses in the data matrix. In the case of web-
based responses, respondents were asked to provide an e-mail address
(which most respondents supplied) in order to avoid receiving reminder
messages. When the web-based survey was submitted, the e-mail
218
address was compared to the log file. If the address appeared in the log,
then the survey was disregarded (and the responses were not added to
the data matrix). If the address was not in the log, it was added to the
log, the survey was processed, and the responses were added to the data
matrix. Again, there is no reliable way to associate entries in the e-mail
address log with responses in the data matrix.
While this approach to avoiding duplicate responses was adequate for
this study, it provides little protection against individuals who are
actively seeking to provide multiple survey responses. For example, it is
relatively easy to make it appear that a series of e-mail responses, sent
by one individual, has come from a number of different e-mail addresses
(a practice known as "spoofing"). It is even easier for an individual
replying to the web-based survey form to simply provide a different e-
mail address with each response.
To ensure that it would be relatively difficult for an individual to provide
multiple responses, one would have to either collect a unique identifier
from each respondent when they send their response (such as a static IP
address—a unique identifier for every networked computer) or assign a
unique identifier to each potential respondent. The latter option would be
most effective because it would prevent the tabulation of more than one
219
response to each solicitation—regardless of who is sending the response
(using IP addresses would still allow a series of responses sent from
different computers by the same individual to be tabulated). However, the
usefulness of either of these more extreme measures would have to be
weighed against their real and/or perceived threat to the anonymity of
respondents.
The system used in this study was also not completely effective in
preventing individuals who had already completed the survey and
provided their e-mail addresses from getting e-mail reminder notices.
This is a relatively minor problem that arises from the way e-mail
addresses are sometimes constructed. For example, if a survey
solicitation is sent to John Doe at his e-mail address ([email protected]),
when the message gets to the mailserver (the computer that handles e-
mail) at his facility, the mailserver might re-route the message to yet
another mailserver—changing the John's address to
[email protected]. On the other hand, the e-mail address
the survey was originally sent to may have included an alias (in this
example, a shortened version of John's official e-mail name"doejm") so
the mailserver may re-route the message to his actual e-mail name
([email protected]) or it may change both the e-mail name and the
mailserver name ([email protected]). Similar changes in

220
e-mail address can occur when the respondent returns the e-mail survey
response. As a result of this variability, the return address of the e-mail
survey response (or the e-mail address provided by web survey
respondents) may not match that provided on the employee roster.
Because the addresses provided on the employee roster were used to
send out survey solicitations and reminders, the permutations that
occured as e-mail was routed back and forth among computers can
resulted in reminders being sent out to individuals who had already
responded to the survey.
These variations in e-mail addressing don't happen all the time, but they
do happen enough to make e-mail address-based procedures less than
completely efficient. Therefore it's a good idea to either (a) determine all
possible permutations of e-mail addresses ahead of time or (b) confine
the use of e-mail address identifiers to situations in which their
performance has little or no bearing on the validity of the data being
gathered.
E-mail Input Processing Scripts
In this study, when an e-mail survey response was mailed to the
computer used to process survey results, it was processed by two
computer programs, known as scripts. These scripts work as follows:

221
• The first script simply removes the e-mail message's header and
introductory information and copies the rest of the e-mail message,
now containing only the survey instrument and responses, to a
holding area. As it copies the message to the holding area, it starts a
second script that handles the remainder of the processing.
The second script performs the following functions (a few functions have
been combined to clarify the explanation):
• Indicate in the data matrix that the response was generated by an e-
mail survey.
• Check for a specific character string to ensure that the file it's
processing is a survey
• Split the file into individual survey items (by locating specific
character strings and item identifiers).
• Record the e-mail address.
• Extract the variable values (except comments)
• Remove extra spaces from the values
• Remove the extraneous characters from the values
• Set missing values to zero.
• Calculate index values
• Write variable and index values to the data matrix.

222
• Compare the e-mail address with those in the incoming survey log to
see if the respondent has already submitted a survey. If so, exit. If
not, add the e-mail address to the incoming survey log.
• Remove the respondent's e-mail address from the reminder list.
• Reverse scoring on negatively phrased items.
• Convert the alpha values to numeric values for appropriate questions
in Internet Use and demographic sections.
• Match the facility value with the corresponding position in the
comment log. This enables the grouping of comments by facility.
• Extract comment values.
• Write comments to the comment log files
The result of this processing is a line of data in the data matrix and, if
comments were submitted, entries in the comment log files (there is a log
file, broken down by facility, for each of the two comment items).
Web Input Processing Script
The web input processing script performs the following functions (a few
functions have been combined to clarify the explanation):
• Return a message to the respondent's screen confirming the receipt of
their survey and thanking them for their participation. No
confirmation response was included in the e-mail version of the

223
survey because it was assumed that most e-mail users are relatively
certain that their e-mail goes where they send it, and they're not
interested in receiving any more e-mail than is absolutely necessary.
It was also assumed that some web users are unaccustomed to and
less trusting of web forms, so a response screen would assure them
that they had submitted the survey correctly.
• Indicate in the data matrix that the response was generated by a web-
based survey.
• Record the e-mail address.
• Compare the e-mail address with those in the incoming survey log to
see if the respondent has already submitted a survey. If so, exit. If
not, add the e-mail address to the incoming survey log.
• Remove the respondent's e-mail address from the reminder list.
• Extract the variable values (except comments)
• Calculate index values
• Write variable and index values to the data matrix
• Match the facility value with the corresponding position in the
comment log. This enables the grouping of comments by facility.
• Write comments to the comment log files.