rate of internet diffusion among asean countries using
TRANSCRIPT
International Journal of Applied Science and Engineering
Special Issue –Convergent Technologies for Innovative Learning Environment and Information Systems
https://doi.org/10.6703/IJASE.202106_18(4).002 Vol.18(4) 2021035
OPEN ACCESS
Received: January 29, 2021 Revised: April 5, 2021 Accepted: May 11, 2021
Corresponding Author: Josie B. Quiban [email protected]
Copyright: The Author(s). This is an open access article distributed under the terms of the Creative Commons Attribution License (CC BY 4.0), which permits unrestricted distribution provided the original author and source are cited.
Publisher: Chaoyang University of Technology ISSN: 1727-2394 (Print) ISSN: 1727-7841 (Online)
Rate of internet diffusion among ASEAN countries using bass model
Josie B. Quiban*
Department of Information Technology, Palompon Institute of Technology, Leyte, Philippines
ABSTRACT
This paper examines the rate of Internet diffusion among the Association of Southeast Asian Nations (ASEAN) nations during 2001-2018. This study utilizes the International Telecommunication Union (ITU) 2001-2018 dataset. The bass model was used to estimate and forecast the Internet potential adopters, innovators, and imitators in determining the rate and patterns of internet diffusion and adoption across ASEAN countries. The results showed that the Internet diffusion rate among ASEAN countries is well characterized by an S-shape curve. The predicted diffusion curves provide evidence that high-income countries have higher diffusion rates comparing the upper-middle and lower-income countries in the ASEAN. The forecast results show that the country with the highest inflection point is also the country that becomes the least in the Internet diffusion and adoption process. The results also indicate that among ASEAN countries, four have reached their peak of adoption before 2018, two have reached their saturation point, and one is continuously dominating since the introduction of the Internet.
Keywords: ASEAN, Bass model, Internet adoption, Internet adoption rate, S-shaped curve.
1. INTRODUCTION
Globally, communication exchanges among people have been facilitated by theInternet. The Internet is a global network of computers that is accessible by individuals in various geographic sites. This modality of information exchange has diffused and adopted across social, political, and economic sectors in many developed countries. Na et al. (2020) stressed that Internet connectivity could be the main factor in economic progress. Nevertheless, Internet diffusion significantly varies across many countries worldwide. Thus, it is of interest to determine how the Internet has diffused and been adopted by individuals in many nations particularly, among ASEAN countries.
The ASEAN is a regional association comprising ten Southeast Asian countries such as Brunei Darussalam, Cambodia, Indonesia, Laos, Malaysia, Myanmar, Philippines, Singapore, Thailand, and Vietnam. ASEAN is a large region that supports intergovernmental collaboration and assists economic unification among its members. As indicated by the total population survey in 2019, the ASEAN has a population of more than 622 million individuals and covers almost 4.5 million square kilometers of islands, woodlands, mountains, and urban areas. In addition, ASEAN is one of the largest economies worldwide. Thus, it expects to be the fourth biggest economy in the world by 2050. Moreover, in light of the new report from ITU in 2019, around 63% of the ASEAN population is using the Internet.
Furthermore, the ASEAN telecommunications and IT ministers have implemented the information and communication technology (ICT) development plan over the years to assist economic growth among the ASEAN community. Thus, one of the principal challenges confronting the ASEAN people is to achieve feasible advancement by bridging the digital divide across the region. Also, the ASEAN Economic Community
International Journal of Applied Science and Engineering
Quiban et al., International Journal of Applied Science and Engineering, 18(4), 2021035
https://doi.org/10.6703/IJASE.202106_18(4).002 2
(AEC) had launched ASEAN ICT Master PLAN 2015 in 2011. Part of this plan is bridging the digital divide to eradicate the ICT development gap across the ASEAN region and to increase ICT in education through various initiatives (The ASEAN secretariat, 2011).
Consequently, most of the ASEAN member countries have integrated ICT plans in their national education. As per a report on data and communication technology in education in Asia (UNESCO institute for statistics, 2014), the ASEAN countries such as Malaysia, the Philippines, Singapore, and Cambodia have a stand-alone ICT education plan. Meanwhile, countries such as Indonesia, Myanmar, and Thailand have integrated ICT in their National Education Plans or National ICT Plans. On the other hand, Lao P.D.R. is the only country among ASEAN members without an ICT Education Plan (Prajaknate, 2017).
Numerous studies have identified substantial disparity within the stages of Internet diffusion across countries in political, social, instructional, scientific, financial, technological, and environmental factors, particularly in developing countries (Na et al., 2020; Jha and Saha, 2020; Ningsih and Choi, 2018; Maureal et al., 2020; Fan et al., 2017; Orbach, 2016; Vu, 2017). In the political context, although argued theoretically, the Internet diffuses quicker in democracies due to essential innovation benefits. However, Stier (2017) has found that authoritarian regimes adopt the Internet at similar rates when technological benefits offset democratization threats. On the other hand, Stoycheff and Nisbet (2014) found that Internet diffusion shapes individual discernment of the supply of democratic inclinations. Furthermore, a significant relationship has existed between web distance and the distinctive globalization indexes with economic, financial, political, and social globalization (Huang and Sun, 2016; Penard et al., 2015). Moreover, it has also been found that economic stability, ICT infrastructure, and English proficiency positively affect Internet connectivity (Wunnava and Leiter, 2009).
Many scholars have studied and examined Internet diffusions worldwide. However, previous researchers on Internet diffusion have focused predominantly on the contributing factors affecting Internet diffusion and adoption. Only a small number have been focusing on the rate of Internet diffusion particularly, in the ASEAN region.
This paper intends to determine the rate of Internet diffusion among ASEAN countries from 2001 - 2018. Specifically, it aims to determine the following: the S-shaped curves or patterns of the diffusion process; the countries that have the highest and lowest rates of Internet adoption; the country that has the highest and lowest point of inflection; the countries' peak of adoption, and forecast of the trends of Internet diffusion from 2018-2060 to determine the countries that have reached the saturation point. To shed light on this topic, the researcher decided to examine the rate of Internet diffusion among ASEAN countries using the Bass model.
2. METHODS
2.1 The Data The dataset used in this paper is from the International
Telecommunication Union (2018) that contains information on ten ASEAN member countries for the period 2001-2018 as shown in Fig. 1.
2.2 Bass Model The study was anchored on the Bass diffusion model by
Bass (1969). The Bass model has been used to forecast product sales in marketing and technology innovations (Bass, 1969). However, this paper utilized the Bass model to forecast the rate and trends of Internet diffusion. Moreover, the model is also used to generate an S-shaped curve of the Internet diffusion process among ASEAN countries.
The Bass model assumes that the potential adopters of innovation are influenced by two communication channels - the mass media and word-of-mouth. The adopters who areexternally influenced by mass media communication arecalled innovators. Meanwhile, the adopters who areinternally influenced by word-of-mouth from satisfiedcustomers are called imitators (Bass, 1969), as shown in Fig.2.
Fig. 2 shows the adoptions due to external and internal influences in the Bass model. It illustrates four significant parameters that are present at any stage of the diffusion process. The parameters used in the model are new adopters, time, innovators, and imitators to measure the degree of influence the innovators and imitators have on the rate of Internet diffusion across ASEAN countries.
Fig. 3 (a) and (b) shows the analytical structure generating the Bass diffusion model. As depicted, the noncumulative adopter distribution peaks at time T* - which is the point of inflection, and m as the potential adopters of the S-shaped cumulative adoption curve. Furthermore, the adopter distribution assumes that initial potential adopters or innovators denoted by pm buy the product at the beginning of the diffusion process (Bass, 1969). Once started, the adoption process is exhibiting symmetric concerning time around the peak time T* up to 2T*. Further, the shape of the adoption curve from time T* to 2T* is the reflection image of the adoption curve from the launching of the diffusion process up to time T* (Mahajan et al., 1990).
The researcher used the Bass diffusion model to simulate and forecast the rate of Internet diffusion among ASEAN countries. The researcher assumed a fixed number of Internet adopters in a country as parameter m. Thus, the equation of the adopted Bass model is expressed as: 𝑑𝑑𝑑𝑑(𝑡𝑡)𝑑𝑑𝑡𝑡
= (𝑝𝑝 + 𝑞𝑞𝑞𝑞(𝑡𝑡))(1 − 𝑞𝑞(𝑡𝑡)) (1)

International Journal of Applied Science and Engineering
Quiban et al., International Journal of Applied Science and Engineering, 18(4), 2021035
https://doi.org/10.6703/IJASE.202106_18(4).002 3
Fig. 1. ASEAN’s Internet adoption rate by country. Source: ITU dataset (2001-2018)
Fig. 2. Bass diffusion model
Fig. 3. (a) Noncumulative adoptions, (b) Cumulative adoptions of the Bass model
0
10
20
30
40
50
60
70
80
90
100
2001
2002
2003
2004
2005
2006
2007
2008
2009
2010
2011
2012
2013
2014
2015
2016
2017
2018
Perc
enat
ge o
f Int
erne
t Use
rs p
er 1
00 in
habi
tant
s
Year
Brunei
Cambodia
Indonesia
Laos
Malaysia
Myanmar
Philippines
Singapore
Thailand
Vietnam
(a) (b)

International Journal of Applied Science and Engineering
Quiban et al., International Journal of Applied Science and Engineering, 18(4), 2021035
https://doi.org/10.6703/IJASE.202106_18(4).002 4
Fig. 4. S-shape curve
Let F(t) be the cumulative fraction of Internet adopters at time t, p the coefficient of innovators who have adopted the Internet based on the influence by mass media or company, and q the coefficient of imitators who have adopted the Internet based on the influence of word-of-mouth from prior adopters.
The rate of Internet adoption in a year 𝑑𝑑𝑑𝑑(𝑡𝑡)𝑑𝑑𝑡𝑡
is equal to the rate of Internet adoption 𝑝𝑝 + 𝑞𝑞𝑞𝑞(𝑡𝑡) times the rate of the potential Internet adopters (1 − 𝑞𝑞(𝑡𝑡)) who have not yet adopted the Internet. Rewriting (1), we have 𝑓𝑓(𝑡𝑡) = (𝑝𝑝 + 𝑞𝑞𝑞𝑞(𝑡𝑡))(1 − 𝑞𝑞(𝑡𝑡)) (2) and 𝑆𝑆(𝑡𝑡) = 𝑚𝑚. 𝑓𝑓(𝑡𝑡) (3) where 𝑆𝑆(𝑡𝑡) is the number of Internet adopters in a year t, and m is the total potential Internet adopters. Equation (3) can also be rewritten to 𝑆𝑆(𝑡𝑡) = 𝑚𝑚. (𝑝𝑝 + 𝑞𝑞𝑞𝑞(𝑡𝑡))(1 − 𝑞𝑞(𝑡𝑡)) (4)
For which 𝑌𝑌(𝑡𝑡) = 𝑚𝑚.𝑞𝑞(𝑡𝑡) is the cumulative Internet adoption in year t. At the start, what matters is the value of p. If p > 0, this means that there is an acceleration in Internetadoptions. Once the Internet has been adopted by theinnovators p, there will be a sudden increase rate in adoption.Thus, the adoption takes off. However, as 𝑌𝑌(𝑡𝑡) approachesm, then we have reached the saturation point, and theadoption curve will be flattened, as shown in Fig. 4.
The saturation point is the time t, t > 0 at which the curve of the function F(t) after its rapid increase starts to flatten or decline in negative acceleration until, at zero growth rate, the potential market stabilizes. The flattening of the curve occurs when 𝑑𝑑𝑑𝑑(𝑡𝑡)
𝑑𝑑𝑡𝑡= 0. The saturation point, denoted by (t*,
f (t*)), is given 𝑡𝑡∗ = 𝑙𝑙𝑙𝑙𝑙𝑙(1−𝑐𝑐)−𝑙𝑙𝑙𝑙𝑙𝑙
𝑙𝑙+𝑙𝑙 (5)
where t* is the time of peak adoption and ln denotes natural logarithm of q and p.
𝑓𝑓(𝑡𝑡∗) = 𝑚𝑚�𝑙𝑙(1−𝑐𝑐)4
+ 𝑙𝑙2
+ 𝑙𝑙2
4𝑙𝑙(1−𝑐𝑐)� (6)
The times of inflection points t** are given by 𝑡𝑡∗∗ = �𝑙𝑙𝑙𝑙𝑙𝑙(1−𝑐𝑐)−𝑙𝑙𝑙𝑙𝑙𝑙±𝑙𝑙𝑙𝑙𝑙𝑙𝑙𝑙(2+√3
𝑙𝑙+𝑙𝑙(1−𝑐𝑐)� (7)
or
𝑡𝑡∗∗ = 𝑡𝑡∗ ± 𝑙𝑙𝑙𝑙𝑙𝑙𝑙𝑙 (2+�3)𝑙𝑙+𝑙𝑙(1−𝑐𝑐)
(8) where c – is a parameter that estimates –q/m (Bass, 1969).
The inflection point generally represents when the rate of adoption begins declining and the point at which the number of adopters as a function of time has peaked. After this point, adoption reflects a “bandwagon” effect due to competitive pressures and not “true” innovative behavior.
2.3 Bass Model Software This study used the Bass model software to determine the
parameters m, p, q, and t using the ITU dataset from 2001-2018 in determining the rate of the Internet diffusion process. The model also forecast the trend of the diffusion among ASEAN countries from 2018-2060.
3. RESULTS AND DISCUSSION
3.1 Internet Diffusion Rate Among ASEAN Countries Using Bass Model
Fig. 5 shows a significant difference in Internet diffusion among ASEAN countries. The Bass result follows an S-shaped cumulative adoption curve as the general pattern of the diffusion process. However, the bends are different for low-income, upper-middle-income, and high-income countries. The result was confirmed by ITU (2019) and World bank (2019) that various nations worldwide have different Internet diffusion curves and patterns.

International Journal of Applied Science and Engineering
Quiban et al., International Journal of Applied Science and Engineering, 18(4), 2021035
https://doi.org/10.6703/IJASE.202106_18(4).002 5
Fig. 5. Internet diffusion rate among ASEAN countries using Bass model source: ITU dataset (2001-2018)
Fig. 6. Rate of Internet adoption in 2001
Furthermore, Fig. 5 shows a higher acceleration rate of Internet diffusion in upper-middle and high-income countries. Additionally, they have steeper adoption curves, which eventually flatten out as the model forecasts until 2060. However, the acceleration rate for lower-income countries is lower that it takes 1 to 20 years before it starts to take off. This study was confirmed by Zhang (2013) and Andres et al. (2010), that high-income countries have
steeper Internet diffusion curves and shorter time lags than lower-income countries that are always catching up.
3.2 Rate of Internet Adoption in 2001 Fig. 6 shows Singapore had the highest rate of Internet
adoption among the ASEAN member countries followed by Malaysia, Thailand, Vietnam, Indonesia, Philippines, Laos, Myanmar, and lastly Cambodia. Bass (1969) assumed that a high value for p or innovators indicates that the diffusion
0
50
100
16.470.13 2.7 0.96
26.55
0.22 0.24
35.81
9.37 6.16
Inte
rnet
Ado
pter
s per
100
use
rs
ASEAN Countries
Adoption
International Journal of Applied Science and Engineering
Quiban et al., International Journal of Applied Science and Engineering, 18(4), 2021035
https://doi.org/10.6703/IJASE.202106_18(4).002 6
Fig. 7. The point of inflection
Fig. 8. Peak of Internet adoption
has a quick start. It implies that during the launch of the Internet, Singapore had the highest number of the population called innovators who have adopted the Internet quickly based on the information from the mass media or company in 2001. However, Cambodia had the lowest number of innovators who have adopted the Internet during the early phase of the diffusion process.
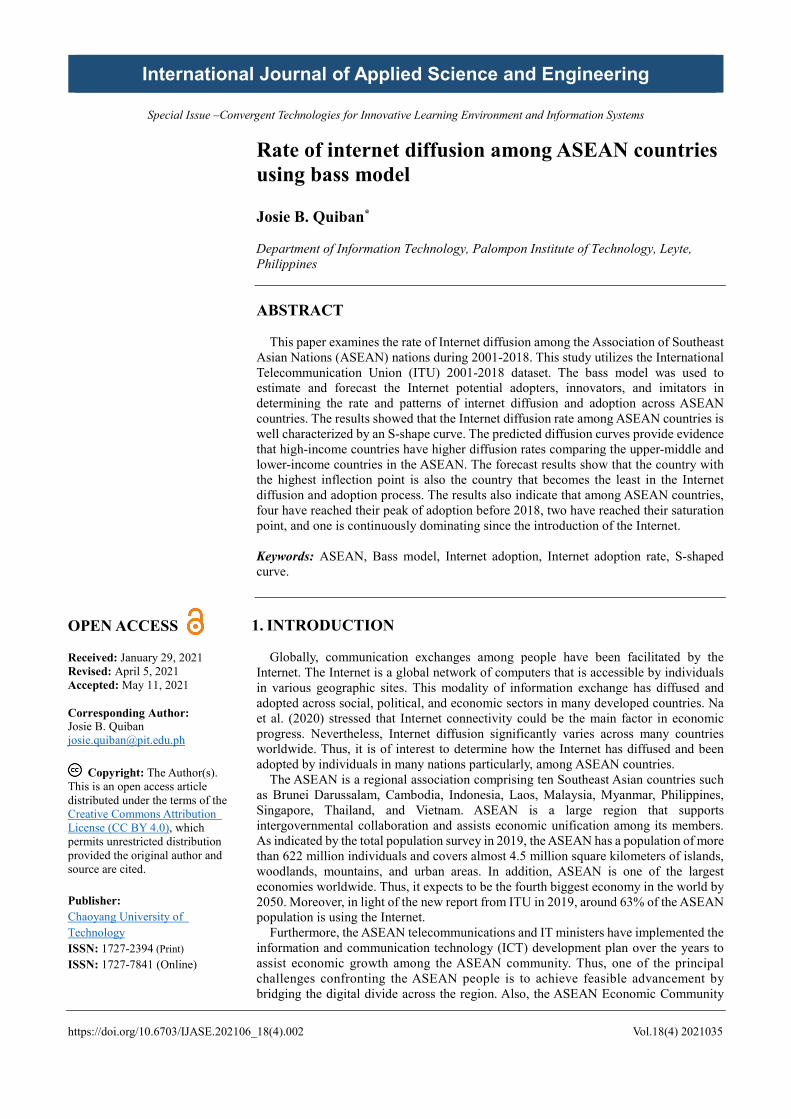
3.3 The Point of Inflection Fig. 7 shows the results of the point of inflection among
ASEAN countries. The results revealed that the Philippines had the highest point of inflections, followed by Cambodia, Myanmar, Vietnam, Laos, Brunei, Malaysia, Thailand, Singapore, and Indonesia. Furthermore, the result shows that as the Internet diffused across countries, the point of inflections slightly varied from one country to another. Bass (1969) assumed the inflection point represented a time in the diffusion process when the growth rate of the diffusion changed from increasing to decreasing. The result implies that the Philippines and Indonesia had to reach a maximum diffusion rate of 70.75% and 5.88% before the diffusion process would start to accelerate or decline.
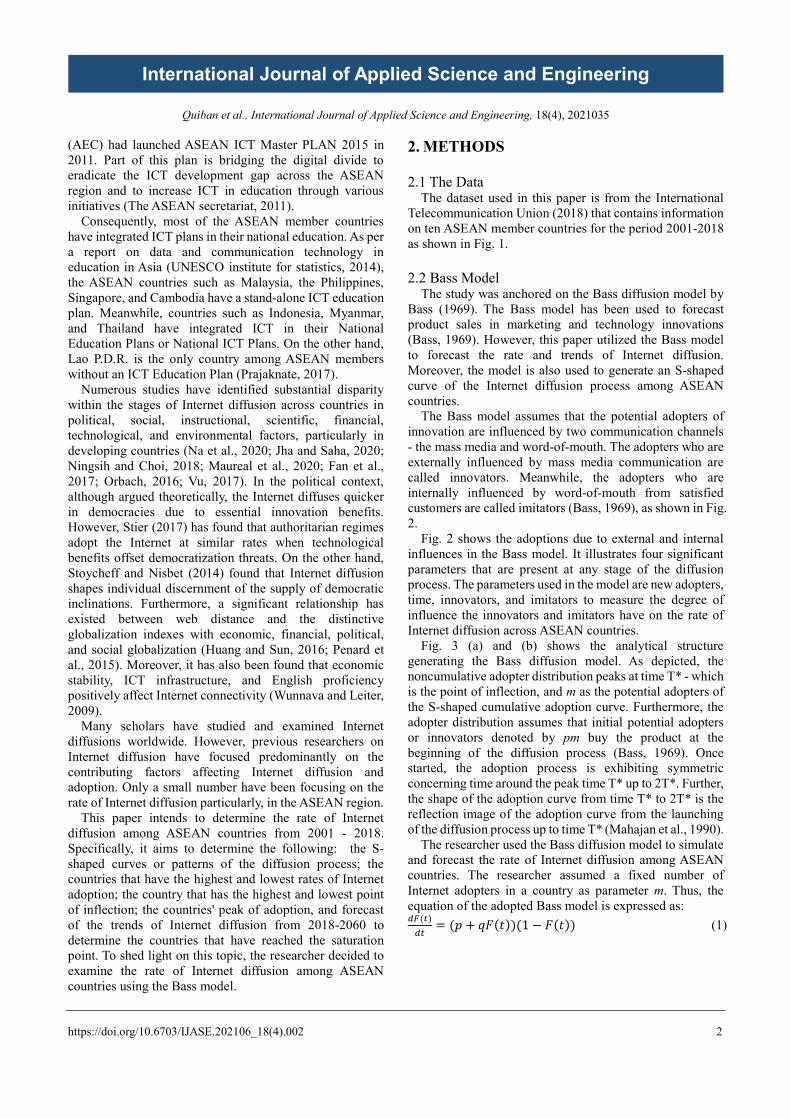
3.4 The Peak of Internet Adoption As shown in Fig. 8, Singapore has the highest peak of
Internet adoption, followed by Malaysia, Brunei, Vietnam, Thailand, Myanmar, Cambodia, Philippines, Laos, and Indonesia. Bass (1969) assumed that the peak of adoption occurs when the maximum potential adopters have adopted the technology at a particular time. Thus, by comparing the results from its peak of adoption and rate of adoption in 2018 from Fig. 8, it revealed that four of the ASEAN member countries namely Singapore, Malaysia, Thailand, and Indonesia have already reached their peak of adoption before 2018.
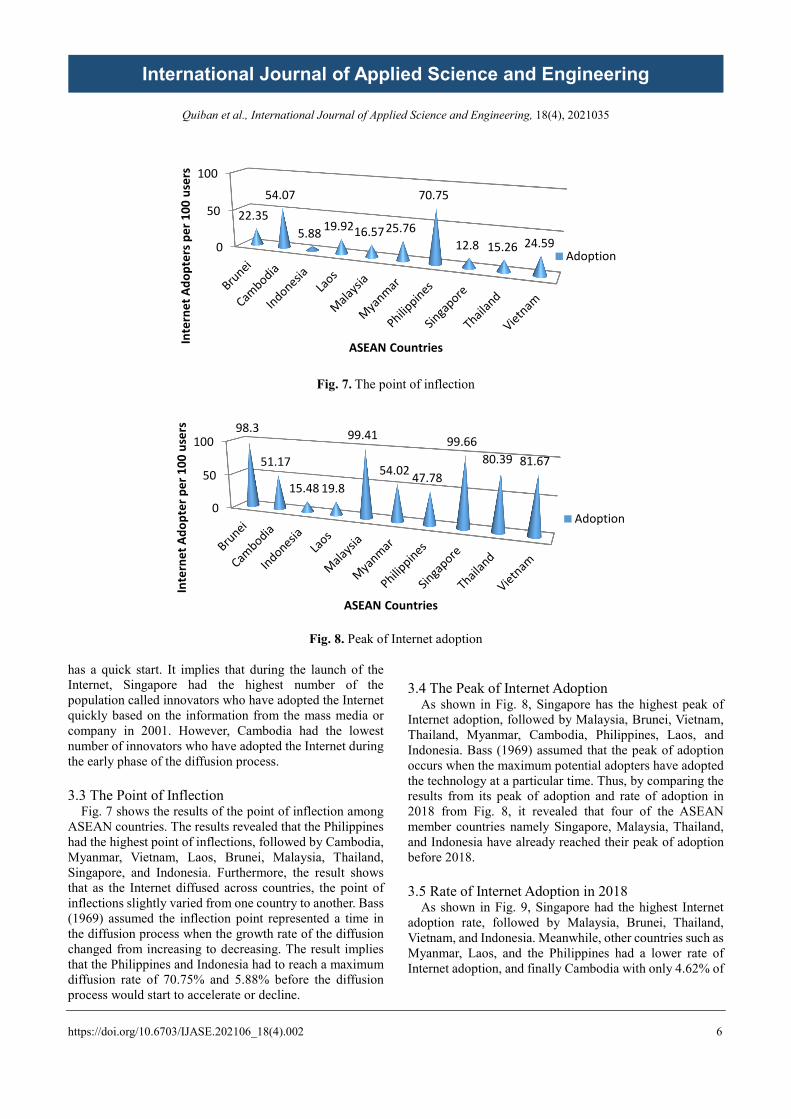
3.5 Rate of Internet Adoption in 2018 As shown in Fig. 9, Singapore had the highest Internet
adoption rate, followed by Malaysia, Brunei, Thailand, Vietnam, and Indonesia. Meanwhile, other countries such as Myanmar, Laos, and the Philippines had a lower rate of Internet adoption, and finally Cambodia with only 4.62% of
0
50
100
22.3554.07
5.88 19.9216.5725.76
70.75
12.8 15.26 24.59
Inte
rnet
Ado
pter
s per
100
use
rs
ASEAN Countries
Adoption
0
50
10098.3
51.17
15.48 19.8
99.41
54.02 47.78
99.6680.39 81.67
Inte
rnet
Ado
pter
per
100
use
rs
ASEAN Countries
Adoption
International Journal of Applied Science and Engineering
Quiban et al., International Journal of Applied Science and Engineering, 18(4), 2021035
https://doi.org/10.6703/IJASE.202106_18(4).002 7
Fig. 9. Rate of Internet adoption in 2018
Fig.10. Rate of internet adoption by 2040
Internet adoption in 2018. Bass (1969) assumed that the adoptions of a new product or technology are primarily driven by word-of-mouth from satisfied customers or adopters (Bass, 1969).
Thus, the result implies that Singapore’s high Internet adoption rate in 2018 was highly influenced by the imitators who have adopted the Internet, based on information from other people (word-of-mouth). So do also with Malaysia, Brunei, Thailand, Vietnam, and Indonesia, while other countries such as Myanmar, Laos, and the Philippines have not highly influenced by the imitators, especially Cambodia.
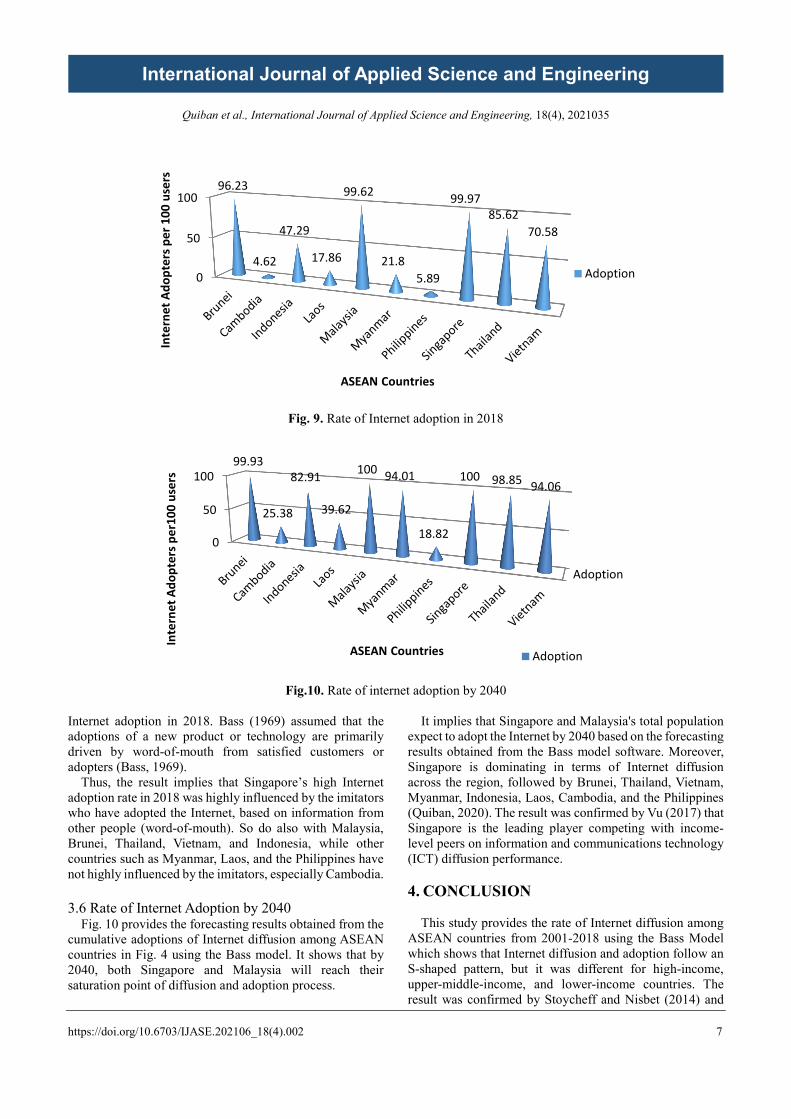
3.6 Rate of Internet Adoption by 2040 Fig. 10 provides the forecasting results obtained from the
cumulative adoptions of Internet diffusion among ASEAN countries in Fig. 4 using the Bass model. It shows that by 2040, both Singapore and Malaysia will reach their saturation point of diffusion and adoption process.
It implies that Singapore and Malaysia's total population expect to adopt the Internet by 2040 based on the forecasting results obtained from the Bass model software. Moreover, Singapore is dominating in terms of Internet diffusion across the region, followed by Brunei, Thailand, Vietnam, Myanmar, Indonesia, Laos, Cambodia, and the Philippines (Quiban, 2020). The result was confirmed by Vu (2017) that Singapore is the leading player competing with income-level peers on information and communications technology (ICT) diffusion performance.
4. CONCLUSION
This study provides the rate of Internet diffusion amongASEAN countries from 2001-2018 using the Bass Model which shows that Internet diffusion and adoption follow an S-shaped pattern, but it was different for high-income,upper-middle-income, and lower-income countries. Theresult was confirmed by Stoycheff and Nisbet (2014) and
0
50
10096.23
4.62
47.29
17.86
99.62
21.85.89
99.9785.62
70.58
Inte
rnet
Ado
pter
s per
100
use
rs
ASEAN Countries
Adoption
Adoption
0
50
10099.93
25.38
82.91
39.62
100 94.01
18.82
100 98.85 94.06
Inte
rnet
Ado
pter
s per
100
user
s
ASEAN Countries Adoption

International Journal of Applied Science and Engineering
Quiban et al., International Journal of Applied Science and Engineering, 18(4), 2021035
https://doi.org/10.6703/IJASE.202106_18(4).002 8
Andres et al. (2010) that Internet adoption follows an S-shaped pattern but different for high-income and lower-income countries. Furthermore, the country's diffusion curve indicates that high-income countries have higher diffusion rates comparing lower-income countries. Based on estimated results, Singapore was considered a highly diffused country among ASEAN countries since the Internet up to the present. Besides, Cambodia was also considered a lowly diffused country from 2001-2018 across the region. The results also found that the Philippines had the highest point of inflections while Indonesia had the lowest turning point in the diffusion process. However, as the Bass model forecasts the diffusion process until 2060, the diffusion model shows the Philippines becomes last in the diffusion rate among ASEAN countries (Quiban, 2020).
Consequently, the peak of adoption revealed that Singapore, Malaysia, Thailand, and Indonesia have already reached their peak of adoption before 2018. Finally, based on the forecast results on the rate of Internet diffusion by 2040, Singapore and Malaysia are among the two countries that will reach their saturation point of adoptions while Brunei, Thailand, Vietnam, Myanmar, Indonesia, Laos, Cambodia, and the Philippines are still following the path (Quiban, 2020).
Further, the result is confirmed in the study of Prajaknate (2017) that Singapore, Malaysia and Brunei have reached the transforming stage at which ICT has become an integral part of the school curricula and Thailand, Vietnam, Myanmar, Indonesia, Cambodia, Philippines are in the applying stage of ICT in their school curricula. On the other hand, in Prajaknate (2017) findings, the teachers in ASEAN nations reported lack of time for integrating ICT infrastructure into the teaching process because of heavy workloads. Moreover, only a small proportion of school heads had a high awareness of the integration of ICT in the school curriculum, hindering teachers from using ICT in the teaching and learning process. Two directions of future studies are recommended. First is exploring the factors of Internet diffusion among ASEAN countries. Second, it would be interesting to conduct ICT integration in education in facing the new normal.
ACKNOWLEDGMENT
The author would like to thank the Editor-in-Chief, the Associate Editors and reviewers for their valuable comments and suggestions in improving my paper, the innovative technology convergence society, Inc. (ITCS) for their recommendation and guidance, and Palompon institute of technology (PIT), Palompon, Leyte, Philippines for the support.
REFERENCES
Andres, L., Cuberes, D., Diouf, M., Serebesky, T. 2010. The diffusion of the internet: A cross-country analysis. Telecommunications Policy, 34, 323–340.
Bass, F.M. 1969. A new product growth for model consumer durables. Management Science, 15, 215–227.
Fan, Z.P., Che, Y.J., Chen, Z.Y. 2017. Product sales forecasting using online reviews and historical sales data: A method combining the Bass model and sentiment analysis. Journal of Business Research, 74, 90–100.
Huang, T., Sun, B. 2016. The impact of the internet on global industry: New evidence of internet measurement. Research in International Business and Finance, 37, 93–112.
International telecommunications union (ITU) (n.d.), 2019. from Measuring the information society.: https://www.itu.int/pub/D-IND-ICTOI
International telecommunications union (ITU). (n.d.), 2019. from World Information Society Report 2007: Beyond WSIS. https://www.itu.int/osg/spu/publicaions/worldinformationsociety/2007
Jha, A., Saha, D. 2020. Forecasting and analyzing the characteristics of 3G and 4G mobile broadband diffusion in India: A comparative evluation of Bass, Norton-Bass, Gompertz, and logistic growth models. Technological Forecasting and Social Change, 152, DOI:10.1016/j.techfore.2019.119885.
Mahajan, V., Bass, F.M., Muller, E. 1990. New product diffusion models in marketing: A review and directions for research. Journal of Marketing, 54, 1–26.
Maureal, Z., Lapates, J.M., Dumandan, M.S., Vicar, V.B., Gaylo, D.N. 2020. Adopted bass diffusion model for the spread of COVID-19 in the Philippines: Implications to interventions and flattening the curve. International Journal of Innovation, Creativity and Change, 14, 1418–1437.
Na, H.S., Hwang, J., Kim, H. 2020. Digital content as a fast internet diffusion factor: Focusing on the fixed broadbant Internet. Information Development, 36, 97–111.
Ningsih, C., Choi, Y.J. 2018. An effect of internet penetration on income iequality is southeast Asian countries. in 22nd Biennial Conference of the International Telecommunications Society (ITS): Beyond the Boundaries: Challenges for Business, Policy and Society. Seoul, Korea.
Orbach, Y. 2016. Parametric analysis of the bass model. Innovative Marketing. 12, 29–40.
Penard, T., Pousing, N., Makoko, B., Bertrand, G., Piaptie, T. 2015. Internet adoption and usage patterns in africa:Evidence from Cameroon. Technology in Society, 42,71–80.
Prajaknate, P. 2017. Information communication technologies (ICT) for education in ASEAN: Can we close the digital divide? Communication, Culture and

International Journal of Applied Science and Engineering
Quiban et al., International Journal of Applied Science and Engineering, 18(4), 2021035
https://doi.org/10.6703/IJASE.202106_18(4).002 9
Change in ASEAN 2, DOI:10.1007/978-981-10-2815-1_6.
Quiban, J.B. 2020. Internet diffusion rate among ASEAN countries. Journal of Innovative Technology Convergence, 2, 1–8.
Stier, S. 2017. Temporal patterns in technology adoption. Internet diffusion and regime type: Temporal patterns in technology adoption. Telecommunications Policy, 41, 25–34.
Stoycheff, E., Nisbet, E. 2014. Whats the bandwidth for democracy? Deconstructing Internet Penetration and Citizen Attitudes About Governance. Political Communication, 31, 628–646.
Vu, K.M. 2017. ICT diffusion and production in ASEAN countries: Patterns, performance, and policy directions. Telecommunications Policy, 41, 962–977.
World bank. (n.d.), 2019. from world development indicators & global development finance. databank.worldbank.org: https://www.databank.worldbank.org/source/world-development-indicators
Wunnava, P., Leiter, D. 2009. Determinants of intercountry diffusion rates. American Journal of Economics and Sociology, 68, 413–426.
Zhang, X. 2013. Income disparity and digital divide: The Internet consumption model and cross-country analysis. Telecommunications Policy, 37, 515–529.