the development of bio analytical techniques for the
TRANSCRIPT

The Development of Bio‐Analytical Techniques for the Treatment of Psoriasis and
Related Skin Disorders.
A thesis submitted to the University of Manchester for the degree of Doctor of Philosophy in
the Faculty of Engineering and Physical Sciences
2010
Katherine Anne Hollywood
School of Chemistry

2
Table of Contents
LIST OF FIGURES 9
LIST OF TABLES 16
ABSTRACT 19
DECLARATION 20
ABBREVIATIONS 21
AKNOWLEDGEMENTS 22
CHAPTER 1: INTRODUCTION .................................................................................................... 26
1.1 SIGNIFICANCE ............................................................................................................................ 26
1.2 AIMS AND OBJECTIVES ................................................................................................................ 26
1.3 PSORIASIS ................................................................................................................................. 28
1.3.1 Introduction to Psoriasis ................................................................................................... 28
1.3.1.1 Clinical Appearance ................................................................................................................ 28
1.3.1.2 Associated Co‐morbidities ..................................................................................................... 29
1.3.2 Histological Features of Psoriasis. .................................................................................... 30
1.3.3 Pathogenesis of Psoriasis: Current Thoughts. ................................................................... 33
1.3.4 Current treatment methods for Psoriasis ......................................................................... 34
1.3.4.1 Topical Treatments ................................................................................................................ 35
1.3.4.1.1 Dithranol ........................................................................................................................... 35
1.3.4.2 Systemic Treatments .............................................................................................................. 36
1.3.4.2.1 Methotrexate .................................................................................................................... 37
1.3.4.2.2 Ciclosporin ......................................................................................................................... 39
1.3.4.3 Biologic Treatments ............................................................................................................... 40
1.4 METABOLOMICS ........................................................................................................................ 42
1.4.1 Introduction to Metabolomics. ......................................................................................... 42
1.4.2 Analytical Platforms for Metabolomics ............................................................................ 43
1.4.2.1 FT‐IR spectroscopy ................................................................................................................. 44

3
1.4.2.1.1 General FT‐IR Introduction ................................................................................................ 44
1.4.2.1.2 FT‐IR Microspectroscopy ................................................................................................... 46
1.4.2.1.3 FT‐IR applications in Clinical Metabolomics ...................................................................... 46
1.4.2.2 Mass Spectrometry ................................................................................................................ 48
1.4.2.2.1 General Overview .............................................................................................................. 48
1.4.2.2.2 GC‐MS ............................................................................................................................... 49
1.4.2.2.3 Quadrupole ....................................................................................................................... 51
1.4.2.2.4 Time of Flight (TOF) Analyser ............................................................................................ 52
1.4.2.2.5 Tandem Mass Spectrometry (MS/MS) .............................................................................. 52
1.4.2.2.6 GC‐MS Applications in Clinical Metabolomics ................................................................... 53
1.5 PROTEOMICS ............................................................................................................................. 55
1.5.1 Introduction to Proteomics ............................................................................................... 55
1.5.2 Analytical Platforms for Proteomics ................................................................................. 55
1.5.2.1 2D Gel Electrophoresis ........................................................................................................... 55
1.5.2.2 MALDI‐MS .............................................................................................................................. 56
1.5.2.3 LC‐MS ..................................................................................................................................... 57
1.5.2.3.1 Orbitrap ............................................................................................................................. 58
1.5.3 Proteomics for Dermatological Research ......................................................................... 59
CHAPTER 2: MALDI‐MS BASED SPATIAL PROTEOMIC ANALYSIS TO INVESTIGATE VARIANCES
BETWEEN NORMAL AND PSORIATIC SKIN. ..................................................................................... 60
2.1 INTRODUCTION .......................................................................................................................... 60
2.2 MATERIAL AND METHODS ........................................................................................................... 60
2.2.1 Sample Collection.............................................................................................................. 60
2.2.2 Sample Preparation .......................................................................................................... 61
2.2.3 MALDI‐MS ......................................................................................................................... 63
2.2.4 Data Analysis .................................................................................................................... 63
2.3 RESULTS AND DISCUSSION ........................................................................................................... 63
CHAPTER 3: PHENOTYPIC PROFILING OF EXTRALESIONAL KELOID SCAR TISSUE CROSS SECTIONS
USING FT‐IR MICROSPECTROSCOPY REVEALS UNIQUE SPECTRAL SIGNATURE FOR KELOID SCARS. .. 66

4
3.1 INTRODUCTION .......................................................................................................................... 66
3.2 MATERIALS AND METHODS .......................................................................................................... 69
3.2.1 Patients & Samples ........................................................................................................... 69
3.2.2 Fourier Transform infrared (FT‐IR) microspectrocopy ...................................................... 71
3.2.3 Sample Preparation .......................................................................................................... 72
3.2.4 FT‐IR Data Collection and Chemometric Analyses ............................................................ 73
3.2.4.1 MCT Infrared Analysis ............................................................................................................ 73
3.2.4.2 FPA Image Analysis ................................................................................................................. 74
3.3 RESULTS & DISCUSSION .............................................................................................................. 75
3.3.1 Histological Findings ......................................................................................................... 75
3.3.2 FT‐IR microspectroscopy ................................................................................................... 76
3.3.3 Chemometric analyses ...................................................................................................... 76
3.3.4 FT‐IR microspectroscopic imaging .................................................................................... 78
3.4 DISCUSSION .............................................................................................................................. 83
3.5 CONCLUSION ............................................................................................................................. 86
CHAPTER 4: A METABOLOMIC BASED APPROACH TO INVESTIGATE THE RESPONSE OF HACAT
CELLS UPON EXPOSURE TO THREE WELL ESTABLISHED ANTI‐PSORIATIC DRUGS. ............................ 87
4.1 INTRODUCTION .......................................................................................................................... 87
4.2 MATERIALS AND METHODS .......................................................................................................... 88
4.2.1 Materials ........................................................................................................................... 88
4.2.2 Methods ............................................................................................................................ 88
4.2.2.1 Cell Culture ............................................................................................................................. 88
4.2.2.1.1 Resurrection of Frozen Cell Lines ...................................................................................... 88
4.2.2.1.2 Replacement of Used Media ............................................................................................. 88
4.2.2.1.3 Sub‐Culturing Monolayer Cell Cultures ............................................................................. 90
4.2.2.1.4 Cryogenic Preservation of Cell Lines ................................................................................. 90
4.2.2.2 Drug Exposures ...................................................................................................................... 91
4.2.2.3 Sample Preparation ................................................................................................................ 91
4.2.2.3.1 Metabolomic Footprint Sample Collection........................................................................ 94
5
4.2.2.3.2 Metabolomic Fingerprint Sample Collection ..................................................................... 94
4.2.2.4 Metabolomic GC‐MS Analysis ................................................................................................ 94
4.2.2.5 GC‐MS Data Processing .......................................................................................................... 95
4.3 RESULTS AND DISCUSSION ........................................................................................................... 96
4.3.1 Metabolite Detection ........................................................................................................ 96
4.3.2 ANOVA Analysis ................................................................................................................ 96
4.3.2.1 Dithranol Fingerprint .............................................................................................................. 97
4.3.2.2 Dithranol Footprint ................................................................................................................ 97
4.3.2.3 Methotrexate Fingerprint ...................................................................................................... 98
4.3.2.4 Methotrexate Footprint ......................................................................................................... 99
4.3.2.5 Ciclosporin Fingerprint ......................................................................................................... 100
4.3.2.6 Ciclosporin Footprint ............................................................................................................ 101
4.3.3 Identification of Metabolites .......................................................................................... 102
4.3.3.1 Dithranol Identification ........................................................................................................ 102
4.3.3.2 Methotrexate & Ciclosporin Identification .......................................................................... 103
4.3.4 Spring embedded correlation analysis. ........................................................................... 107
4.3.4.1 Dithranol Fingerprint ............................................................................................................ 107
4.3.4.2 Dithranol Footprint .............................................................................................................. 111
4.3.4.3 Methotrexate Fingerprint .................................................................................................... 112
4.3.4.4 Methotrexate Footprint ....................................................................................................... 115
4.3.4.5 Ciclosporin Fingerprint ......................................................................................................... 118
4.3.4.6 Ciclosporin Footprint ............................................................................................................ 119
4.3.5 Dithranol Interpretation ................................................................................................. 121
4.3.6 Methotrexate and Ciclosporin Interpretation ................................................................. 128
4.4 CONCLUSION AND FURTHER WORK .............................................................................................. 129
CHAPTER 5: A PROTEOMIC‐BASED APPROACH TO INVESTIGATE THE RESPONSE OF HACAT CELLS
UPON EXPOSURE TO THREE WELL ESTABLISHED ANTI‐PSORIATIC DRUGS. .................................... 131
5.1 INTRODUCTION ........................................................................................................................ 131
5.2 MATERIALS AND METHODS ........................................................................................................ 131
5.2.1 Materials ......................................................................................................................... 131

6
5.2.2 Methods .......................................................................................................................... 131
5.2.2.1 Cell Culture and Drug Exposure ............................................................................................ 131
5.2.2.2 Sample Collection ................................................................................................................. 132
5.2.2.3 Sample Clean Up .................................................................................................................. 132
5.2.2.4 Protein Quantification .......................................................................................................... 133
5.2.2.5 1D Gel Electrophoresis ......................................................................................................... 134
5.2.2.5.1 Separating Buffer ............................................................................................................ 134
5.2.2.5.2 Separating Gel ................................................................................................................. 134
5.2.2.5.3 Stacking Gel ..................................................................................................................... 134
5.2.2.5.4 Pouring of Gel .................................................................................................................. 134
5.2.2.5.5 Sample Cracking .............................................................................................................. 134
5.2.2.5.6 Running Buffer ................................................................................................................ 135
5.2.2.5.7 Gel Running ..................................................................................................................... 135
5.2.2.6 2D Gel Electrophoresis ......................................................................................................... 135
5.2.2.6.1 Rehydration of Immobilised pH Gradient (IPG) Strip and isoelectic focussing. ............... 135
5.2.2.6.2 Equilibration Buffer I ....................................................................................................... 136
5.2.2.6.3 Equilibration Buffer II ...................................................................................................... 136
5.2.2.6.4 Gel Preparation and Running Procedure ......................................................................... 137
5.2.2.7 Coomassie Stain ................................................................................................................... 137
5.2.2.8 Staining Procedure ............................................................................................................... 137
5.2.2.9 Visualisation of Gels ............................................................................................................. 138
5.2.2.10 LC‐MS ................................................................................................................................... 138
5.2.2.10.1 Sample Preparation ....................................................................................................... 138
5.2.2.10.2 Nano‐LC‐MS/MS ............................................................................................................ 138
5.2.2.10.3 Mass Spectrometry ........................................................................................................ 139
5.2.2.10.4 Data analysis .................................................................................................................. 139
5.3 RESULTS & DISCUSSION ............................................................................................................ 140
5.3.1 Protein Quantification .................................................................................................... 140
5.3.2 Gel Electrophoresis ......................................................................................................... 144
5.3.3 LC‐MS Results .................................................................................................................. 146
5.3.3.1 Dithranol .............................................................................................................................. 147

7
5.3.3.2 Methotrexate ....................................................................................................................... 155
5.3.3.3 Ciclosporin ............................................................................................................................ 161
5.4 CONCLUSIONS ......................................................................................................................... 166
CHAPTER 6: METABOLOMIC ANALYSIS OF PLASMA SAMPLES COLLECTED FROM PSORIASIS
PATIENTS DURING METHOTREXATE TREATMENT: A SHORT STUDY. ............................................. 169
6.1 INTRODUCTION ........................................................................................................................ 169
6.2 MATERIAL AND METHODS ......................................................................................................... 171
6.2.1 Materials ......................................................................................................................... 171
6.2.2 Methods .......................................................................................................................... 171
6.2.2.1 Patient Selection .................................................................................................................. 171
6.2.2.2 GC‐MS Sample Preparation .................................................................................................. 171
6.2.2.3 Quality Control Samples ....................................................................................................... 172
6.2.2.4 GC‐MS Data Analysis ............................................................................................................ 173
6.3 RESULTS AND DISCUSSION ......................................................................................................... 174
6.3.1 Post treatment metadata ............................................................................................... 174
6.3.2 Principal Components Analysis ....................................................................................... 175
6.3.3 Kruskal‐Wallis Analysis ................................................................................................... 176
6.3.4 Multivariate Predictive Analysis ..................................................................................... 180
6.4 CONCLUSIONS & FUTURE WORK ................................................................................................. 180
CHAPTER 7: MONITORING THE SUCCINATE DEHYDROGENASE ACTIVITY ISOLATED FROM
MITOCHONDRIA BY SURFACE ENHANCED RAMAN SCATTERING. .................................................. 182
7.1 INTRODUCTION ........................................................................................................................ 182
7.2 MATERIALS & METHODS ........................................................................................................... 186
7.2.1 Chemical and reagents ................................................................................................... 186
7.2.2 Extraction of mitochondria ............................................................................................. 186
7.2.3 Monitoring enzyme activity ............................................................................................ 187
7.2.4 Surface enhanced Raman scattering .............................................................................. 188
7.2.4.1 Colloid preparation .............................................................................................................. 188

8
7.2.4.2 Aggregation .......................................................................................................................... 189
7.2.4.3 Instrumentation ................................................................................................................... 189
7.3 RESULTS AND DISCUSSION .......................................................................................................... 190
7.3.1 Validation of the enzyme systems under study .............................................................. 190
7.3.2 SERS optimisation ........................................................................................................... 192
7.3.3 Monitoring succinate dehydrogenase activity using SERS .............................................. 193
7.4 CONCLUDING REMARKS ............................................................................................................. 197
CHAPTER 8: OVERALL SUMMARY AND CONCLUSIONS ............................................................ 198
CHAPTER 9: REFERENCES ........................................................................................................ 202
APPENDIX A ADDITIONAL METABOLITE BOX PLOTS FOR METHOTREXATE TREATMENT:
FINGERPRINT 214
APPENDIX B ADDITIONAL METABOLITE BOX PLOTS FOR METHOTREXATE TREATMENT:
FOOTPRINT 218
APPENDIX C ADDITIONAL METABOLITE BOX PLOTS FOR CICLOSPORIN TREATMENT: FINGERPRINT
220
APPENDIX D ADDITIONAL METABOLITE BOX PLOTS FOR CICLOSPORIN TREATMENT: FOOTPRINT
220
APPENDIX E PROTEOME RESULTS FOR DITHRANOL TREATMENT ............................................. 221
APPENDIX F PROTEOME RESULTS FOR METHOTREXATE TREATMENT ...................................... 224
APPENDIX G PROTEOME RESULTS FOR CICLOSPORIN TREATMENT ........................................... 229
Word Count: 52,537

9
List of Figures
Figure 1‐1: An example of plaque psoriasis exhibited in the elbow region of a psoriasis
patient (Provided by Prof. CEM. Griffiths, University of Manchester). ................................... 29
Figure 1‐2: Haematoxylin & Eosin stained sections for a) normal skin section, b) Involved
psoriasis section, c) Uninvolved psoriasis section. All images collected using a Zeiss Imager
A1 microscope at 400X magnification. Images captured using a Canon Powershot G6 camera.
................................................................................................................................................. 31
Figure 1‐3: Schematic diagram illustrating the structure and composition of skin. ............... 32
Figure 1‐4: The chemical structure of dithranol. ..................................................................... 36
Figure 1‐5: The chemical structure of methotrexate. ............................................................. 37
Figure 1‐6: The chemical structure of ciclosporin. .................................................................. 40
Figure 1‐7: A schematic representation of an FT‐IR instrument. ............................................ 46
Figure 1‐8: Schematic diagram of a mass spectrometer. A sample is introduced into an ion
source where positive or negatively charged ions are created, separation of ions according to
their mass to charge (m/z) ratio occurs within the mass analyser followed by detection
within the detector element. Instrumental components and experimental parameters are
controlled computationally and in addition all data is collected and stored on the connected
PC. Adapted from (Dunn, 2008). ............................................................................................. 48
Figure 1‐9: Schematic diagram of a quadrupole mass analyser. ............................................. 51
Figure 1‐10: Schematic representation of a TOF mass analyser. ............................................ 52
Figure 1‐11: Schematic illustration of the MALDI process. ..................................................... 56
Figure 2‐1: Diagram illustrating the experimental set‐up for MALDI‐MS profiling. Three
replicate tissue sections are thaw mounted onto a MALDI target plate. A matrix array is

10
applied through ChIP application proving an array of XxY spots. In the example shown
complete matrix coverage requires 9x12 spots equating to 108 individual profiles. ............. 62
Figure 2‐2: Schematic diagram demonstrating the spot size and associated pitch to allow
approximation of sample area to be profiled. ........................................................................ 63
Figure 2‐3: A visible image captured by the ChIP scanner illustrating the matrix deposition
applied to a normal skin section in a 16x22 array. The example spectrum illustrates a number
of peaks which have arisen from the surface of the skin. ....................................................... 64
Figure 3‐1: Diagrammatic and histological cross section of an extralesional keloid scar
including: A: The Grenz zone in a keloid; the histological area corresponding to papillary
dermis of normal dermis located between the epidermal basement membrane and the
upper edge of the reticluar dermis. B: View of thick hyalinized collagen bundles typically
found in middle of keloid scars. C: Keloid with circumscribed borders (marked in blue) which
are well‐demarcated demonstrating the periphery or margin of the keloid scars. ................ 67
Figure 3‐2: This cross section of a typical keloid scar (sample number 3) excised from the
chest wall demonstrates anatomical locations within the keloid scar. Lines in green show
where line mapping using FT‐IR spectroscopy was taken; this resulted in 38 spectra in total: 3
epidermal, 21 normal and 14 from the reticular dermis of the keloid scar. The cyan area
shows where FT‐IR chemical maps were collected from: this included 14 individual maps
containing 64x64 pixels and covered an area of approximately 3.5 x 0.25 mm. .................... 70
Figure 3‐3: A) Typical FT‐IR absorbance spectra collected from normal skin tissue, and keloid
epidermal and dermal regions. B) Expansion of lipid region C) Expansion of amide region,
and D) Offset graph demonstrates a spectrum of collagen. ................................................... 77
Figure 3‐4: (A) PCA scores plot from one of sample no 4 with lines (2nd horizontal line)
showing clear differentiation between normal tissue and keloid scar. (B) Corresponding PC1
loadings plots showing features that are discriminatory. ....................................................... 78

11
Figure 3‐5: Results from PLS‐DA bootstrap analysis from 100 spectra selected from six
samples. (A) Average receiver operating characteristic plots from the test data only from the
10,000 models and (B) Box whisker plots showing the data from all training and test data
from the 10,000 PLS‐DA models that were constructed. Boxes represent the lower median
and upper quartiles. Whiskers represent the range or 1.5 x the length of the box, whichever
is shorter. Outliers (+) are the values out of the whisker range. ............................................ 79
Figure 3‐6: Chemical image plots from sample number 3 of chest wall generated from IR
microspectroscopy. The light image is shown from the unstained tissue and corresponds to
the area detailed in Figure 3‐2. The first four false colour coded maps are from the sum of
the total IR signal, area under lipid, amide and phosphate bands respectively. The next nine
image maps represent the first 9 PC scores. ........................................................................... 80
Figure 3‐7: Typical FT‐IR absorbance spectra collected from normal and keloid skin tissue.
The spectra are annotated to illustrate the wavenumber regions of interest highlighted in
Table 3‐3. ................................................................................................................................. 81
Figure 3‐8: Corresponding PC loadings plots from the PCA of IR microspectroscopy in Figure
3‐6. ........................................................................................................................................... 82
Figure 4‐1: A summary diagram to illustrate the successive stages in the collection of
fingerprint and footprint samples. .......................................................................................... 93
Figure 4‐2: A scatter plot of metabolite feature index vs. p value for all metabolite peaks
identified for the dithranol fingerprint analysis. Peaks that were identified as significant from
ANOVA analysis with a p value < 0.05 are labelled with a number corresponding to feature
index to allow identification of the peak. ................................................................................ 97
Figure 4‐3: A scatter plot of metabolite feature index vs. p value for all metabolite peaks
identified for the dithranol footprint analysis. Peaks that were identified as significant from

12
ANOVA analysis with a p value < 0.05 are labelled with a number corresponding to feature
index to allow identification of the peak. ................................................................................ 98
Figure 4‐4: A scatter plot of metabolite feature index vs. p value for all metabolite peaks
identified for the methotrexate fingerprint analysis. Peaks that were identified as significant
from ANOVA analysis with a p value < 0.05 are labelled with a number corresponding to
feature index to allow identification of the peak. ................................................................... 99
Figure 4‐5: A scatter plot of metabolite feature index vs. p value for all metabolite peaks
identified for the methotrexate footprint analysis. Peaks that were identified as significant
from ANOVA analysis with a p value < 0.05 are labelled with a number corresponding to
feature index to allow identification of the peak. ................................................................. 100
Figure 4‐6: A scatter plot of metabolite feature index vs. p value for all metabolite peaks
identified for the ciclosporin fingerprint analysis. Peaks that were identified as significant
from ANOVA analysis with a p value < 0.05 are labelled with a number corresponding to
feature index to allow identification of the peak. ................................................................. 101
Figure 4‐7: A scatter plot of metabolite feature index vs. p value for all metabolite peaks
identified for the ciclosporin footprint analysis. Peaks that were identified as significant from
ANOVA analysis with a p value < 0.05 are labelled with a number corresponding to feature
index to allow identification of the peak. .............................................................................. 102
Figure 4‐8: Spring embedded correlation plot for the analysis of the internal metabolome of
dithranol treated HaCaT cells. The metabolite peaks are represented by the circles and the
number within the circle is the metabolite ID. The larger the circle the more significant the
metabolite was determined to be by ANOVA analysis. The links shown between metabolites
illustrate the correlations present, the magnitude of which is shown by the number. The
nearer the number is to 1 the greater the degree of correlation. ........................................ 109

13
Figure 4‐9: Box and whisker plots of dithranol concentration (µg/ mL) vs. % peak area to
illustrate the general trends observed from the correlation analysis for groups A, B and C.110
Figure 4‐10: Spring embedded correlation plot for the analysis of the external metabolome
of dithranol treated HaCaT cells. The metabolite peaks are represented by the circles and
the number within the circle is the metabolite ID. The larger the circle the more significant
the metabolite was determined to be by ANOVA analysis. The links shown between
metabolites illustrate the correlations present, the magnitude of which is shown by the
number. The nearer the number is to 1 the greater the degree of correlation. .................. 111
Figure 4‐11: Box and whisker diagrams correlating to metabolites 113, 62, 100 and 109
showing dithranol exposure concentration (µg/ mL) vs. % peak area for the external
metabolome. ......................................................................................................................... 112
Figure 4‐12: Spring embedded correlation plot for the analysis of the internal metabolome of
methotrexate treated HaCaT cells. The metabolite peaks are represented by the circles and
the number within the circle is the metabolite ID. The larger the circle the more significant
the metabolite was determined to be by ANOVA analysis. The links shown between
metabolites illustrate the correlations present, the magnitude of which is shown by the
number. The nearer the number is to 1 the greater the degree of correlation. .................. 113
Figure 4‐13: Box and whisker plots to illustrate the effect of methotrexate exposure within
the internal metabolome of HaCaT cells. Metabolites 62, 70, 134 were selected from within
the right hand side of the correlation plot while metabolites 57, 113, 150 and 105 were
selected from the left hand side. .......................................................................................... 114
Figure 4‐14: Spring embedded correlation plot for the analysis of the metabolic footprint of
methotrexate treated HaCaT cells. The metabolite peaks are represented by the circles and
the number within the circle is the metabolite ID. The larger the circle the more significant
the metabolite was determined to be by ANOVA analysis. The links shown between

14
metabolites illustrate the correlations present, the magnitude of which is shown by the
number. The nearer the number is to 1 the greater the degree of correlation. .................. 116
Figure 4‐15: Box and whisker plots to illustrate the effect of methotrexate exposure within
the metabolic footprint of HaCaT cells. ................................................................................. 117
Figure 4‐16: Spring embedded correlation plot for the analysis of the internal metabolome of
ciclosporin treated HaCaT cells. The metabolite peaks are represented by the circles and the
number within the circle is the metabolite ID. The larger the circle the more significant the
metabolite was determined to be by ANOVA analysis. The links shown between metabolites
illustrate the correlations present, the magnitude of which is shown by the number. The
nearer the number is to 1 the greater the degree of correlation. ........................................ 118
Figure 4‐17: Box and whisker plots to illustrate the affect of ciclosporin exposure within the
internal metabolome of HaCaT cells. Metabolites 7, 83, 100 and 134 were chosen as
example metabolites. The metabolites exhibit varying responses to the drug. Metabolites 7
and 134 increase steadily in concentration until 2x10‐7M, and follow by a notable decrease in
concentration at 2.5x10‐7M. In comparison metabolite 83 increases slightly and plateaus
over the drug exposure range. Metabolite 100 reaches the highest concentration at 1.5x10‐
7M and decreases slightly thereafter. ................................................................................... 119
Figure 4‐18: Spring embedded correlation plot for the analysis of the metabolic footprint of
ciclosporin treated HaCaT cells. The metabolite peaks are represented by the circles and the
number within the circle is the metabolite ID. The larger the circle the more significant the
metabolite was determined to be by ANOVA analysis. The links shown between metabolites
illustrate the correlations present, the magnitude of which is shown by the number. The
nearer the number is to 1 the greater the degree of correlation. ........................................ 120
Figure 4‐19: Box and Whisker plots for metabolites 28, 32, 120 and 135 to illustrate a degree
of metabolic response to ciclosporin exposure within the metabolic footprint. All

15
metabolites show a positive response to initial treatment through an increase in
concentration between 0‐1x10‐7 M followed by a decrease in concentration between
1‐2.5x10‐7 M. .......................................................................................................................... 121
Figure 4‐20: Constructed metabolite map to illustrate the affect of dithranol treatment of
HaCaT cells. ............................................................................................................................ 123
Figure 5‐1: Protein quantification standard curve for dithranol treated HaCaT cells. .......... 140
Figure 5‐2: An example result for 1D gel electrophoresis analysis of the proteome of control
HaCaT cells. ............................................................................................................................ 144
Figure 5‐3: 2D gel electrophoresis results illustrating the protein presence and localisation
within a control, dithranol treated, methotrexate treated and a ciclosporin treated sample.
............................................................................................................................................... 145
Figure 5‐4: Schematic representation indicating the proportion of proteins which were up‐
regulated, down‐regulated, deemed equivalent or non significant within the proteome of
dithranol treated HaCaT cells. ............................................................................................... 147
Figure 5‐5: Reconstructed metabolite map depicting the proteins (red italics) successfully
identified within dithranol treated HaCaT cells and the corresponding linked metabolites
(black normal font). Adjacent metabolites are linked with block lines while pathways with
some metabolites omitted are linked with dashed lines. The presence of proteins over the
concentration range is summarised within the box diagrams whereby green implies that the
protein was present within all three replicate samples, blue indicates that the protein was
detected within two replicates and red indicates that the protein was not detected. The
control sample is the left hand box and the highest concentration the right hand box. ..... 149

16
Figure 5‐6: Schematic representation indicating the proportion of proteins which were up‐
regulated, down‐regulated, deemed equivalent or not significant within the proteome of
methotrexate treated HaCaT cells. ....................................................................................... 155
Figure 5‐7: Reconstructed metabolite map depicting the proteins (purple italics) successfully
identified within methotrexate treated HaCaT cells and the corresponding linked
metabolites (black). Adjacent metabolites are linked with block lines while pathways with
some metabolites omitted are linked with dashed lines. The presence of proteins over the
concentration range is summarised within the box diagrams whereby green implies that the
protein was present within all three replicate samples, blue indicates that the protein was
detected within two replicates and red indicates that the protein was not detected. The
control sample is the left hand box and the highest concentration the right hand box. ..... 158
Figure 5‐8: Schematic representation indicating the proportion of proteins which were up‐
regulated, down‐regulated, deemed equivalent or non significant within the proteome of
ciclosporin treated HaCaT cells. ............................................................................................ 162
Figure 5‐9: Reconstructed metabolite map depicting the proteins (orange) successfully
identified within ciclosporin treated HaCaT cells and the corresponding linked metabolites
(black). Adjacent metabolites are linked with block lines while pathways with some
metabolites omitted are linked with dashed lines. The presence of proteins over the
concentration range is summarised within the box diagrams whereby green implies that the
protein was present within all three replicate samples, blue indicates that the protein was
detected within two replicates and red indicates that the protein was not detected. The
control sample is the left hand box and the highest concentration the right hand box. ..... 164
Figure 6‐1: PCA plots of PC1 vs PC2 accounting for 76.82% total explained variance from the
complete data set. Plot A illustrates the variance within the data in terms of response;

17
responder (R), intermediate responder (I), non‐responder (N) and QC sample (Q). Plot B
illustrates the variance using the sample order as the naming structure. ............................ 176
Figure 7‐1: Detection of enzyme activity and reactions involved. (A) Schematic drawing of
DCPIP (the final electron acceptor) in its oxidised and reduced form. (B) Representation of
the reduction of DCPIP by FADH2 from its oxidised blue form of the dye to the reduced
colourless form. (C) The reaction catalysed by the enzyme succinate dehydrogenase (EC
1.3.5.1). .................................................................................................................................. 184
Figure 7‐2: Schematic representations of (A) the citric acid cycle showing where succinate is
converted into fumarate, and (B) the electron transport chain detailing where sodium azide
inhibits cytochrome oxidase. (C) SERS spectra of the artificial electron acceptor DCPIP in its
oxidised and reduced forms which occurs due to the redirection of electrons from the
electron transport chain. ....................................................................................................... 185
Figure 7‐3: Transmission electron micrograph of citrate reduced Au colloids showing good
homogeneity. The scale bar is 50nm. ................................................................................... 189
Figure 7‐4: Graph representing the kinetic experiments (DCPIPox −> DCPIPred) monitored
spectrophotometrically. The wavelength used for analysis is 600 nm. From the top to
bottom are the controls employed to assay the enzyme activity; see text for full details.
Correlations coeffients (R2) are also shown in the inset. ...................................................... 191
Figure 7‐5: Representative raw Raman and SERS spectra, from top to bottom: Raman spectra
of DCPIP in the solid state; followed by SERS spectra collected after 5 min aggregation at pH
7.2, pH 5.5 and pH 2.2 respectively. The three vibrational bands from SERS that were used
for kinetic analysis are indicated by arrows and these are at 243, 404 and 498 cm‐1. ......... 192
Figure 7‐6: SERS spectra of the succinate dehydrogenase enzyme reaction. Aggregation was
performed without poly L‐lysine at (A) pH 5.5, (C) pH 2.2 and (E) pH 7.2 ‐ from top to bottom

18
the spectra shown were collected after 5, 10, 15, 20, 25 and 30 min of enzyme reaction.
Plots of log10 peak area versus time for the vibrational bands at (B) 238 cm‐1 for
measurements conducted at pH 5.5, (D) 257 cm‐1 (R2 = 0.983) for SERS at pH 2.2, and (F) for
readings at pH 7.2 for bands 243, 404 and 498 cm‐1 (R2 = 0.952, 0.976 and 0.939,
respectively); error bars show standard deviations from the three replicate measurements.
............................................................................................................................................... 195

19
List of Tables
Table 1‐1: A summary table illustrating three biological pathways which have been
highlighted as possible targets during methotrexate treatment. Adapted from Bangert &
Costner, 2007. ......................................................................................................................... 39
Table 1‐2: Summary table of biological treatments, their target, year of approval and
biological composition. Summarised from (Sauder and Mamelak, 2004) .............................. 41
Table 2‐1: Metadata for samples collected for image analysis. Colour coding indicates the
pairing of control and diseased samples. Samples are age and sex matched as closely as
possible. *day of birth unavailable. ......................................................................................... 61
Table 3‐1: Demographic details of keloid cases involved in the study. ................................... 71
Table 3‐2: Clinical details (patient history and examination findings) of keloid scars analysed
in the study, * represents variation to the surrounding skin. ................................................. 71
Table 3‐3: Tentative infrared vibrational band assignments for regions of interest. ............. 81
Table 4‐1: DMEM culture media composition. ....................................................................... 89
Table 4‐2: A summary of the results gained from the internal and external metabolome of
HaCaT cells exposed to dithranol, methotrexate and ciclosporin. The table highlights the
overall number of metabolite peaks identified, the number of metabolite peaks declared
significant and the number of significant metabolite peaks which were identified. .............. 96
Table 4‐3: Identified metabolites from the internal and external metabolome of dithranol
treated HaCaT cells. The majority of metabolites were identified solely within the internal
metabolome (indicated in black) while five metabolites were recorded in the external
metabolome. A reference number corresponding to the human metabolome database and
the chemical formula is given. The correlation group number is supplied for internal
metabolites as discussed in Section 4.3.4.1. Metabolite ID’s labelled with a * highlight
multiple derivatisation products. .......................................................................................... 104
Table 4‐4: Identified metabolites from the internal and external metabolome of dithranol
treated HaCaT cells. The majority of metabolites were identified solely within the internal
metabolome (indicated in black) while five metabolites were recorded in the external
metabolome. A reference number corresponding to the human metabolome database and
the chemical formula is given. The correlation group number is supplied for internal

20
metabolites as discussed in Section 4.3.4.1. Metabolite ID’s labelled with a * highlight
multiple derivatisation products. .......................................................................................... 105
Table 4‐5: Identified metabolites from the internal and external metabolome of
methotrexate and ciclosporin treated HaCaT cells. A reference number corresponding to the
human metabolome database, the chemical formula and corresponding p values supplied
for all metabolites. Metabolite ID’s labelled with a * highlight multiple derivatisation
products. ................................................................................................................................ 106
Table 5‐1: A table to illustrate the protein content of HaCaT cells exposed to dithranol. The
sample name prefix corresponds to the concentration of dithranol (µg/mL) or control (c).
The sample name suffix corresponds to the replicate number. ........................................... 141
Table 5‐2: A table to illustrate the protein content of HaCaT cells exposed to methotrexate.
The sample name prefix corresponds to the concentration of methotrexate (x10‐7M) or
control (c). The sample name suffix corresponds to the replicate number. ......................... 142
Table 5‐3: A table to illustrate the protein content of HaCaT cells exposed to ciclosporin. The
sample name prefix corresponds to the concentration of ciclosporin (x10‐7M) or control (c).
The sample name suffix corresponds to the replicate number. ........................................... 143
Table 5‐4: Summary table illustrating the proteins identified within the proteome of
dithranol treated HaCaT cells. The protein name, associated EC number and the metabolism
location is provided. The colour scheme dictates the presence or omission of a protein at the
given drug treatment concentration. Green implies that the protein was present within all
three replicate samples, blue indicates that the protein was detected within two replicates
and red indicates that the protein was not detected. .......................................................... 148
Table 5‐5: Summary table illustrating additional identified proteins within the proteome of
dithranol treated HaCaT cells. The colour scheme dictates the presence or omission of a
protein at the given drug treatment concentration. Green implies that the protein was
present within all three replicate samples, blue indicates that the protein was detected
within two replicates and red indicates that the protein was not detected. ....................... 151
Table 5‐6: Summary table illustrating the proteins identified within the proteome of
methotrexate treated HaCaT cells. The protein name, associated EC number and the
metabolism location is provided. The colour scheme dictates the presence or omission of a
protein at the given drug treatment concentration. Green implies that the protein was

21
present within all three replicate samples, blue indicates that the protein was detected
within two replicates and red indicates that the protein was not detected. ....................... 156
Table 5‐7: Summary table illustrating additional identified proteins within the proteome of
methotrexate treated HaCaT cells. The colour scheme dictates the presence or omission of a
protein at the given drug treatment concentration. Green implies that the protein was
present within all three replicate samples, blue indicates that the protein was detected
within two replicates and red indicates that the protein was not detected. ....................... 159
Table 5‐8: Summary table illustrating the proteins identified within the proteome of
ciclosporin treated HaCaT cells. The protein name, associated EC number and the
metabolism location is provided. The colour scheme dictates the presence or omission of a
protein at the given drug treatment concentration. Green implies that the protein was
present within all three replicate samples, blue indicates that the protein was detected
within two replicates and red indicates that the protein was not detected. ....................... 163
Table 5‐9: Summary table illustrating additional identified proteins within the proteome of
ciclosporin treated HaCaT cells. The colour scheme dictates the presence or omission of a
protein at the given drug treatment concentration. Green implies that the protein was
present within all three replicate samples, blue indicates that the protein was detected
within two replicates and red indicates that the protein was not detected. ....................... 165
Table 6‐1: Patient metadata collected prior to treatment with methotrexate. The table
illustrates the patient identification code, sex, age and baseline PASI score. ...................... 173
Table 6‐2: Patient information illustrating the dose of methotrexate administered, the
starting PASI score, the PASI score post treatment and the corresponding response rate and
status. .................................................................................................................................... 174
Table 6‐3: Kruskal‐Wallis results table identifying metabolites significantly related to
response to treatment. The metabolite identification and subsequent p value is shown. The
box & whisker plot illustrates the metabolite level in responders (left), intermediate
responders (middle) and non‐responders (right). ................................................................. 177
Table 6‐4: Kruskal‐Wallis results table identifying metabolites significantly related to sex of
patient. The metabolite identification and subsequent p value is shown. The box & whisker
plot illustrates the metabolite level in male patients (left) and female patients (right). ..... 179

22
Abstract
The University of Manchester Katherine Anne Hollywood: June 2010 Degree of Doctor of Philosophy in the Faculty of Engineering and Physical Sciences The Development of Bio‐Analytical Techniques for the Treatment of Psoriasis and Related Skin Disorders. In this investigation a number of post‐genomic technologies have be applied to study the dermatological disorders of psoriasis and keloid disease. In spite of considerable research focus on these diseases the pathogenesis remains unclear and currently no cure is available however, both diseases are manageable by drug intervention. It is common place that patients who are suffering from skin disorders are diagnosed and the extent of the disease assessed by a dermatologist which may be subjective due to human error. The availability and application of methods to screen patients and quantify the level of disease or response to treatment has obvious benefits in disease management. The work has incorporated a two‐pronged approach combining the spectroscopic analysis of excised tissue samples and the phenotypic profiling of a rapidly proliferating cell line in response to drug intervention. The initial analysis of psoriatic skin samples by MALDI‐MS provided poor results which remain relatively unexplained; however similar problems have been observed by other research groups. In a complementary approach the HaCaT cell line was exposed to increasing concentrations of three anti‐psoriatic drugs namely dithranol, methotrexate and ciclosporin and the cells profiled using both metabolomic and proteomic methods. A number of metabolic pathways were highlighted including glycolysis and the TCA cycle. This has resulted in a selection of potential biomarkers which could be investigated in further work. In a small follow on study a collection of plasma samples from patients undergoing methotrexate treatment were analysed. The level of patient metadata and the number of samples was relatively limiting however, a subset of metabolites were significantly altered between responders and non‐responders and with further validation could be potential biomarkers of successful treatment. The analysis of excised keloid samples was conducted using FT‐IR microspectroscopy where it was possible to successfully discriminate between keloid and normal tissue. The use of imaging FTIR illustrated the complex cellular composition within a keloid scar, with increased lipid, amide and phosphate levels being observed. These measurable variations could, in the future, be incorporated into surgical procedures to allow targeted excision ensuring all keloid areas are removed. Finally a SERS‐based analysis was conducted to investigate the possibility of probing dynamic enzymatic processes. This was successful and with the use of varying reporter molecules could be a beneficial tool for the analysis of metabolic processes. This project has successfully used a number of bio‐analytical techniques to investigate dermatological problems. While the ultimate goal would be the application of a single analytical technique to provide answers to biological questions, it has been found that a number of complimentary techniques and statistical data handling approaches can provide a valuable insight into the problems posed.

23
Declaration
No portion of the work referred to in the thesis has been submitted in support of an
application for another degree or qualification of this or any other university or other
institute of learning.
Notes on Copyright:
i. The author of this thesis (including any appendices and/or schedules to this thesis) owns certain
copyright or related rights in it (the “Copyright”) and s/he has given The University of Manchester
certain rights to use such Copyright, including for administrative purposes.
ii. Copies of this thesis, either in full or in extracts and whether in hard or electronic copy, may be made
only in accordance with the Copyright, Designs and Patents Act 1988 (as amended) and
regulations issued under it or, where appropriate, in accordance with licensing agreements which
the University has from time to time. This page must form part of any such copies made.
iii. The ownership of certain Copyright, patents, designs, trademarks and other intellectual property
(the “Intellectual Property”) and any reproductions of copyright works in the thesis, for example
graphs and tables (“Reproductions”), which may be described in this thesis, may not be owned by
the author and may be owned by third parties. Such Intellectual Property and Reproductions
cannot and must not be made available for use without the prior written permission of the
owner(s) of the relevant Intellectual Property and/or Reproductions.
iv. Further information on the conditions under which disclosure, publication and commercialisation of
this thesis, the Copyright and any Intellectual Property and/or Reproductions described in it may
take place is available in the University IP Policy (see
http://www.campus.manchester.ac.uk/medialibrary/policies/intellectual‐property.pdf), in any
relevant Thesis restriction declarations deposited in the University Library, The University Library’s
regulations (see http://www.manchester.ac.uk/library/aboutus/regulations) and in The
University’s policy on presentation of Theses.

24
Abbreviations
2D 2 dimensional
APCI atmospheric pressure chemical ionisation
APPI atmospheric pressure photo ionisation
ATP adenosine triphosphate
ATR attenuated total reflectance
ChIP chemical inkjet printer
CI chemical ionisation
DA discriminant analysis
DC direct current
DHB 2,5‐dihydroxybenzoic acid
DTGS deuterated triglycine sulphate
EI electron impact
ESI electospray ionisation
FDA United States food and drug administration
FPA focal plane array
FPGS folypolyglutamyl synthase
FTICR Fourier transform ion cyclotron resonance
FT‐IR Fourier transform infrared
GC‐MS gas chromatography mass spectrometry
IEF isoelectric focussing
KD keloid disease
LC‐MS liquid chromatography mass spectrometry
LD laser desorption
MALDI matrix assisted laser desorption ionisation
MCT HgCdTe
MS mass spectrometry
OCT optimal cutting temperature
PASI psoriasis area severity index
PC principal component
PCA principal components analysis
PLS partial least squares
PLS‐DA partial least square‐discriminant analysis
Q linear quadrupole
QQQ triple quadrupole
Q‐TOF quadrupole‐time of flight
RF radio frequency
ROC receiver operator curve
RT retention time
SDS sodium dodecyl sulphate
TMS trimethylsilyl
TNF tumor necrosis factor
TOF time of flight
UV ultraviolet

25
Acknowledgements
I am deeply thankful to my PhD supervisor Prof Roy Goodacre for his encouragement,
support and guidance throughout my time within his group and for giving me the
opportunity undertake my PhD. A huge amount of my gratitude is extended to Dr Catherine
Winder and Dr Rick Dunn for their friendship and support and who have both assisted my
work in countless ways and to Dr David Broadhurst for his encouragement and belief in my
work. I am also sincerely grateful to Dr Iqbal Shadi and Dr Kathleen Carroll for sharing their
knowledge and expertise and for inviting me to participate in their area of research. Aside
from my research group, I have been fortunate to collaborate with a number of people.
Great thanks have to be extended to Prof Christopher Griffiths, Dr Richard Warren and Dr
Rachel Watson whose discussion and thoughts on psoriasis have been greatly beneficial and
who have permitted my access to clinical samples. In addition my gratitude is given to Dr
Ardeshir Bayat for sharing his expertise on keloid disease and the provision of samples.
Along the way I have been assisted by a number of extremely kind and helpful people who
have gone above and beyond to help; Ms Susan Slack (for not running away when my
required cell growth escalated at rapid rates) and Sr. June Bowden for recruiting volunteers
and for collecting the required biopsy samples (when I was too squeamish to watch!).
I also need to express my gratitude to my Mum for the initial encouragement and support to
undertake a university education and for believing in the completion of my PhD! Not
forgetting the Meehan/Kane clan for their support and encouragement and especially Sarah
and Jim (aka 009) for providing my Manchester base during the concluding stages. David,
thank you for being part of our team and for helping to get me through this, I’m very excited
about our future together.
Ultimately the work presented within this thesis was made possible due to the financial
sponsorship granted from Stiefel Laboratories, Inc.

26
Chapter 1: Introduction
1.1 Significance
In modern biological research a number of common diseases such as an array of cancers,
diabetes, Crohn’s disease and psoriasis remain at the forefront of focus. The precise etiology
of these diseases is often unknown and complex. The onset of the ‘omic era has provided
novel routes for high‐throughput analysis and subsequent interpretation of biological
questions. These include investigations at the level of gene expression (transcriptomics),
protein translation (proteomics) and more recently the metabolite network (metabolomics).
The implementation of such approaches is often accompanied with the use of systems
biology techniques. Systems biology is a broad term to describe the use of informatics to
explore and interpret complex data sets which are generated during ‘omic procedures. It is
often possible to identify potential biomarkers for disease by utilising these types of
approaches. It is envisaged that by incorporating a range of bio‐analytical platforms and
‘omic approaches into the area of psoriasis research it could be possible to uncover
underlying information regarding the onset and pathogenesis of the disease, and ultimately
treatment.
1.2 Aims and Objectives
The aim of the work presented within this thesis is to incorporate the use of a variety of bio‐
analytical platforms in the field of dermatological research. There are vast arrays of
analytical platforms commercially available for biological research which could provide novel
routes for the detection, diagnosis or for investigating the pathogenesis of disease. These
techniques could provide an automated standardised approach, independent of personal
assessment by dermatologists.

27
In a two‐pronged approach analysis will be performed on both biopsy tissue samples and
cultured cells. The analysis of psoriasis tissue samples will be analysed via matrix assisted
laser desorption ionisation (MALDI) mass spectrometry (MS) and keloid tissue samples
analysed by Fourier transform infrared (FT‐IR) microspectroscopy. Through the spatial
imaging of diseased and non‐diseased skin it will be possible to identify variations in
biological composition between samples and also through varying regions within single
tissue samples. As cell culture is more controllable this will be used in a metabolomic and
proteomic‐based analysis of psoriasis. The HaCaT cell type was chosen to mimic the cellular
level of a psoriatic outbreak. In an attempt to probe the metabolite and protein variation in
psoriasis, the cells will be exposed to a selection of well established anti‐psoriatic drugs. It is
hoped that variations in certain metabolite/protein concentrations will be determined;
which could provide additional information regarding the drug mode of action and identify
potential biomarkers for disease. In a small follow on study a metabolomics approach will be
applied to a selection of plasma samples provided from a psoriasis drop in clinic. Although
this study is limited in terms of sample numbers it could provide addition information
regarding metabolite variation during onset of disease. In a final study we aim to investigate
the possibility of using Raman spectroscopy to monitor the enzyme kinetics of a biological
pathway. This is an area that with further research could be extremely beneficial for
metabolomic and proteomic experiments and consequently could be transferable to
dermatological research in the future.

28
1.3 Psoriasis
1.3.1 Introduction to Psoriasis
Psoriasis is a chronic immune inflammatory mediated disease which affects approximately
2‐3% of the world population. The disease primarily manifests itself in the skin; however an
additional effect is regularly exhibited in nails and joints. Psoriasis can begin at any age,
although the approximate mean age of onset has been estimated to be 33 years, with 75%
of cases occurring before 46 years of age (Nevitt and Hutchinson, 1996). The occurrence of
skin lesions however, varies throughout life and there may be periods of remissions and
exacerbations which are often prompted by environmental or emotional triggers. The
severity of the disease can greatly differ from patient to patient, and beyond the physical
cutaneous symptoms are physiological and social effects on the patient’s life. Psoriasis had a
great impact on the sufferer and has a well known association with depression and low
quality of life (Rapp et al., 1999), (Krueger et al., 2001).
1.3.1.1 Clinical Appearance
The most prevalent form of psoriasis, psoriasis vulgaris, accounts for 90% of all cases
(Bhalerao and Bowcock, 1998). Psoriasis vulgaris is characterized by the appearance of
reddened scaly plaques (Figure 1.1) which vary in density and size and can occupy any
location on the body. A symmetrical distribution is common with the most prominent areas
to be affected being the scalp, knees, elbows and lower back, (Altman and Kamino, 1999).

29
Figure 1‐1: An example of plaque psoriasis exhibited in the elbow region of a psoriasis patient (Provided by Prof. CEM. Griffiths, University of Manchester).
The remaining 10% of psoriasis cases comprise of guttate psoriasis, inverse psoriasis,
pustular psoriasis, palmoplantar psoriasis and erthyroderma.
1.3.1.2 Associated Co‐morbidities
A factor that greatly increases the significance of psoriasis is its association with other
disorders. Psoriasis patients are often at risk of suffering from concurring debilitating and life
threatening morbidities. Psoriasis and other associated diseases are thought to share
common inflammatory pathways. The most prominent non‐cutaneous disease associated
with psoriasis is psoriatic arthritis (FitzGerald and Winchester, 2009), a potentially disabling
inflammatory condition that affects 5‐30% of patients with psoriasis (Kaltwasser et al.,
2004). Irritable bowel syndrome also known as Crohn’s disease is a chronic inflammatory
disease of the digestive system and whose prevalence was shown to be significantly higher
in psoriasis patients compared to a control group (0.5% and 0.2% respectively) (Cohen et al.,
2009). However in recent years the link between psoriasis and cardiometabolic conditions
such as cardiovascular disease, diabetes as well as the metabolic syndrome has received
greater attention (Gottlieb et al., 2008). An increased mortality from cardiovascular diseases
have been documented in patients with severe psoriasis, (Mallbris et al., 2004), confirmed
by a cohort study indicating a twofold more prevalent occurrence for psoriasis patients in
comparison to age matched control patients (Henseler and Christophers, 1995). Several

30
studies have indicated a possible correlation between psoriasis and diabetes including
noticeable variations in glucose levels and insulin resistance (Boehncke et al., 2007), (Brenelli
et al., 1995),(Henseler and Christophers, 1995). Patients with psoriasis are additionally at a
greater risk of suffering from metabolic syndrome (Girolomoni and Gisondi, 2008). The
metabolic syndrome is a cluster of risk factors and in general is defined as the presence of 3
or more of the following components: abdominal obesity, increased insulin
resistance/elevated fasting glucose level, elevated blood levels of triglycerides and/or
cholesterol and hypertension (Gottlieb and Dann, 2009). It is common that symptoms of the
metabolic syndrome go concomitantly with an increased risk of diabetes and cardiovascular
disease. These additional co‐morbidities could provide increased levels of variation in
metabolites and proteins during a psoriatic outbreak.
1.3.2 Histological Features of Psoriasis.
The fundamental variations between psoriatic and normal skin is visible through the
interpretation of haematoxylin and eosin (H&E) stained histological skin sections. Figure 1.2
illustrates normal skin (A), involved psoriatic skin (B) and non‐involved psoriatic skin (C). In
terms of psoriatic skin, an involved section is taken from an area where a psoriatic plaque is
visible on the surface while a non‐involved section is representative of an area which on the
surface appears unaffected.

FigurUninImag
Norm
sche
skin
divid
a “b
skin
fina
in th
kera
whil
corn
co‐o
the
kera
barr
cont
re 1‐2: Haematvolved psoriasges captured us
mal skin is
ematic diagr
whose obje
ded into five
basket weave
i.e. palms o
lly the deep
he epidermis
atinocytes m
le undergoin
neum. The a
ordinated wi
stratum gra
atin and beg
rier formatio
tains melano
A
toxylin & Eosinsis section. All sing a Canon Po
constructed
am is illustra
ective is to
e areas; the o
e” type stru
of hands or s
est layer the
s and are pro
move progre
ng a process
verage epid
th productio
anulosum th
gin to flatte
on and as a s
ocytes and L
n stained sectioimages collectowershot G6 ca
of two fun
ated in Figur
provide a w
outermost ar
cture, the st
oles of feet,
e stratum ba
oduced by ce
ssively throu
termed term
ermal transi
on in order
e migrating
n in structu
source of en
Langerhan ce
B
31
ons for a) normted using a Zeisamera.
ndamental la
re 1.3. The e
waterproof
rea is termed
tratum lucid
the stratum
asale. Keratin
ell division oc
ugh the epi
minal differe
t is 8‐10 we
to maintain
keratinocyt
ure. The pre
nergy and fle
ells. Melanoc
mal skin sectioss Imager A1 m
ayers, the e
epidermis is
protection.
d the stratum
dum a layer
m granulosum
nocytes are
ccurring thro
dermis to t
entiation, to
eeks; the loss
a constant
tes continue
esence of ke
exibility for t
cytes are res
C
n, b) Involved microscope at
pidermis an
the upper m
The epiderm
m corneum w
only found
m, the stratu
the principa
ough the stra
he upper la
resultantly f
s of cells fro
epidermal t
e to differen
eratin is imp
the cells. Th
sponsible fo
psoriasis secti400X magnifica
d the derm
most layer of
mis itself ca
which is visib
in thick area
m spinosum
al cell type fo
atum basale
yers of the
form the stra
om the surfa
thickness. W
ntiate, synthe
portant in w
e epidermis
r the produc
on, c) ation.
is. A
f the
n be
ble as
as of
m and
ound
. The
skin
atum
ace is
Within
esise
water
also
ction

32
of melanin, the pigment accountable for the colour of human skin and for the provision of
protection from UV radiation. Langerhans cells are present to provide immunological
protection.
The dermis, the pale pink area beneath the epidermis, forms a significant part of the
structure of skin. The dermis is a much thicker component in size than the epidermis and is
constructed of a network of connective tissue. The dermis contains a variety of important
structures including blood and lymphatic vessels, sweat glands, nerve endings and hair
follicles. The dermis is responsible for the regulation of body temperature through the
release of sweat and the erection and detraction of hairs on the skin surface and provides
routes of transport through a complex capillary network.
Figure 1‐3: Schematic diagram illustrating the structure and composition of skin.
Psoriatic skin is characterised by a greatly thickened epidermal layer or epidermal
hyperplasia (Figure 1‐2). The hyperplastic epidermal changes are associated with an under
expression of markers of keratinocyte differentiation, including keratin K1 and K10 (Griffiths
and Barker, 2007). The thickened epidermis configuration shows elongated retes that
protrude into the dermis. The amount of epidermal hyperplasia visible is correlated to the
severity of the disease in the patient. An additional feature of psoriatic skin is the presence
��
epidermis (~0.1 mm)
dermis (~1.5 mm)
hypodermis
stratum corneumstratum lucidumstratum granulosumstratum spinosumstratum basale
papilary layerreticule layer
���� ���������������� �� ������

33
of prominent blood vessels in the dermis and the collection of neurophils in the epidermis
and stratum corneum. The histology of non‐involved skin is deemed to be normal.
1.3.3 Pathogenesis of Psoriasis: Current Thoughts.
The pathogenesis of psoriasis has been subject to evolving theories over the last couple of
decades. Environmental and genetic factors are important in the etiology of psoriasis. The
complex interplay amongst epidermal keratinocytes, mononuclear leukocytes, neutrophils,
dendritic cells, and activated T cells, together with growth factors, chemokines, and
cytokines, is now recognised as playing a major role in the pathogenesis of psoriasis (Lowes
et al., 2007).
Dysfunctional keratinocyte apoptosis occurs in psoriatic skin (Laporte et al., 2000). Apoptotic
cell death is critical for balancing keratinocyte proliferation as well as for the formation of
the stratum corneum and hence without sufficient regulation the presence of overgrown
psoriatic plaques is observed. The paradigm of activators, inhibitors, adapters and effectors
is reiterated in multiple apoptotic pathways in mammalian cells, (Raj et al., 2006).
Biochemical studies have illustrated specific changes in the expression of many cellular
markers in psoriasis. The markers of epidermal proliferation; the keratins (namely K6, K10,
K16 and K17), epidermal growth factor (EGF) receptor and ornithine decarboxylase are
usually up‐regulated in psoriasis, (Duvic et al., 1997).
Most current models of pathogenesis are focused on the actions of activated leucocytes and
secreted cytokines that, in turn, produce reactive changes in skin cells according to pre‐
programmed pathways (Krueger and Bowcock, 2005). Nickoloff et al. provides a
comprehensive review on the involvement of cytokines and chemokines in psoriasis,
(Nickoloff et al., 2007). Cytokines are responsible for cellular communication required for
the mediation of reactions between cells. Cytokines are generally recognised for their ability
to influence the proliferation, differentiation, or secretion of proinflammatory or anti‐

34
inflammatory factors by resident and recruited cell types. Chemokines are similar in function
but are readily associated with the modulation of migratory cell movement. Types of
cytokines which have been indicated as significant during a psoriasis outbreak include
tumour necrosis factor (TNF), interleukins (ILs) and interferons (IFNs).
Three types of dendritic cells are found in involved skin but absent in normal skin; dermal
factor dendritic cells, a subset of dendritic cells known as plasmacytoid dendritic cells, and
Langerhans cells in the epidermis (Griffiths and Barker, 2007). Dendritic cells (DCs) are a
unique population of leukocytes that regulate immune responses and have the ability to
interact with and activate T cells. Langerhans cells (LCs) are members of this wider family of
DCs. LCs reside in the epidermis, where they serve as guards of the immune system, their
responsibility being to sample the external environment for changes and challenges and to
deliver information (antigen) to T cells within skin‐draining lymph nodes. The ability of LCs to
migrate from epidermis to regional lymph nodes is thus of pivotal importance to the
induction of cutaneous immune responses (Cumberbatch et al., 2006).
This immunological response if often triggered by an external factor, i.e. a physical injury,
infections or stress and external factors such as drugs, smoking and alcohol is known to
increase the likelihood of a psoriatic outbreak in individuals whom have a genetic
predisposition. The concordance of psoriasis in monozygotic twins has been shown to be
significantly greater than in dizygotic twins; data which is consistent to there being a strong
genetic component to the disease (Bowcock and Krueger, 2005).
1.3.4 Current treatment methods for Psoriasis
There are a number of varying methods available for the treatment of psoriasis. The
treatments can be classified into three arrays; topical, systemic and the more recently
developed biologics. The selection of a treatment method is often dependent of individual
patient needs, cost and geographical location. It is additionally common that multiple

35
treatment methods are used in a multi‐targeted approach. A brief introduction will be given
into each type of treatment and greater emphasis placed on the specific drugs which will be
investigated within the work to be presented.
1.3.4.1 Topical Treatments
Topical treatments are those which are applied directly to the area of inflammation on the
surface of the skin. They are usually the first stage of treatment for mild to moderate cases
of psoriasis. Topical therapies are also advised to patients with more severe disease, mostly
in combinations such as with photo(chemo)therapy (UVB, PUVA), oral systemic agents, or
biological methods (Bos and Spuls, 2008). Several topical treatments are available for
psoriasis sufferers; however the effectiveness varies between cases. The most frequently
used and prevalent forms of topical psoriasis agents are vitamin A and D analogues, tar
preparations and dithranol. The advantage with topical treatments is their availability for
home application and at day centres. There are however, as with most types of treatments,
problems with attributed side‐effects and a particular limitation is patient compliance (van
de Kerkhof et al., 2008).
1.3.4.1.1 Dithranol
Dithranol also known as anthralin has been a mainstay in psoriasis treatment for more than
eight decades and is a natural derivative of chrysarobin, prepared from the araroba tree.
Dithranol’s IUPAC name is 1,8‐dihydroxy‐9‐anthrone whose chemical structure is shown in
Figure 1‐4.

36
OH O OH
Figure 1‐4: The chemical structure of dithranol.
The primary cellular target for dithranol treatment is the mitochondria of cells where it has
been shown to accumulate by using fluorescence and confocal microscopy (McGill et al.,
2005). Dithranol has been shown to act as an electron donor to membrane‐associated redox
components and to inhibit adenosine triphosphate (ATP) synthesis. It is proposed that ATP
depletion will limit energy dependent metabolism and thus could provide a mechanism for
inhibition of cell proliferation (Fuchs et al., 1990).
It has been shown through retrospective studies that dithranol can induce the clearance of
psoriasis outbreaks in 72‐95% of patients whom were treated for 24h (van de Kerkhof et al.,
2008). It can be found in varying formulations including pastes, creams or ointments.
Nevertheless, the use of dithranol is deemed inconvenient and troublesome due to its
irritation and discolouration of normal as well as diseased skin.
1.3.4.2 Systemic Treatments
Systemic treatments are used in moderate to severe cases where topical treatments have
failed to show a significant effect. These forms of treatment are administered orally or
intravenously and therefore the effect of the drug is less localised and witnessed within the
entire body. This approach is advantageous as the underlying biological triggers (as
discussed in Section 1.3.3) are targeted in addition to the presented plaques on the surface
of the skin. The most common and readily administered systemic treatments are
methotrexate, ciclosporin and retanoids. These treatments are sometimes prescribed in
varying combinations depending on the patient’s response rates. However, with systemic

37
treatments there are greater risks of the onset of physical and mental side effects and hence
treatment selection is greatly influenced by a number of factors including, age, sex, general
health, ability to comply with the treatment, previous treatments, as well as the type, extent
and duration of the disease (Spuls et al., 1997). A major advantage of systemic treatments,
especially in respect to newer biological approaches, is the cost; for example the cost of
methotrexate treatment is approximately £55 compared to £10,000 for biological treatment
per annum (Warren et al., 2008).
1.3.4.2.1 Methotrexate
Methotrexate, a folic acid derivative, was approved for use in the treatment of psoriasis in
1972 by the United States food and drug administration (FDA) for the treatment of severe,
recalcitrant, disabling psoriasis (Kalb et al., 2009). The structure of methotrexate is shown in
Figure 1‐5. Methotrexate has been known as the gold standard within the field of systemic
treatments (Saporito and Menter, 2004), however this award is currently being challenged
by the increasing use of new biological treatments. Methotrexate has a number of adverse
side effects associated with its use including severe liver toxicity and bone marrow
suppression. Patients prescribed with methotrexate must be monitored closely and long
term use is not recommended.
N N
N
N
NH2
NH2
N
CH3
O
NH
O
HO
OH
O
Figure 1‐5: The chemical structure of methotrexate.

38
Methotrexate is a drug used to treat many diseases. The general mode of action of
methotrexate is well established; however, the exact action of methotrexate in the anti‐
psoriatic process is somewhat unknown. Methotrexate as a folic acid antagonist functions as
an immunosuppressive agent. Methotrexate competitively inhibits the reduction of folate
co‐factors by binding intra‐cellularly to dihydrofolate reductase thus preventing the
conversion of dihydrofolate to tetrahydrofolate (Strober and Menon, 2005).
Tetrahydrofolate is a co‐factor for a number of enzymes and is linked to amino acid and
nucleic acid synthesis. A number of reactions which are subject to alteration are described in
Table 1.1. This illustrates that via affecting purine and pyrimidine nucleotide synthesis, DNA
and RNA synthesis is impaired hence cellular reproduction capabilities are reduced. A
postulated mechanism of action in psoriasis treatment has also been proposed by Warren et
al., 2008. This mechanism focuses attention on the importance of adenosine and glutamate.
The mechanism involves methotrexate entering the cells through transport via a solute
carrier. Within the cell methotrexate undergoes polyglutamation under the enzymatic
regulation of folypolyglutamyl synthase (FPGS). In the polyglutamated form methotrexate
inhibits aminoimidazole‐4‐carboxamide ribonucleotide transformylase, which is suggested as
a possible route for some of the anti‐inflammatory effects observed. This is proposed to be a
result of an intracellular rise in adenosine which is reported to interact with a number of
adenosine receptors. This theory could surmise that folate inhibition may not be as
important as first thought.

39
Pathway Enzyme inhibited Step involved
De novo pyrimidine synthesis Thymidylate synthetase
Dihydrofolate reductase
dUMP dTMP (cofactor THF)
DHF THF (cofactor for above rxn)
De novo purine synthesis GAR transformylase (early)
AICAR transformylase (late)
GAR FGAR (cofactor THF)
AICAR FAICAR (cofactor THF)
DNA methlylation Methionine synthase Homocyseine Methionine (cofactor THF, B12)
Table 1‐1: A summary table illustrating three biological pathways which have been highlighted as possible targets during methotrexate treatment. Adapted from Bangert & Costner, 2007.
1.3.4.2.2 Ciclosporin
Ciclosporin, whose structure is shown in Figure 1‐6 was isolated originally from a soil fungus,
Tolypocladium inflatum Gams, and was initially used as an anti‐fungal agent. However in
1979 ciclosporin was reported to be beneficial in the treatment of psoriasis (Mueller and
Herrmann, 1979) and since then the immuno‐suppressive effect of ciclosporin has been
readily utilised. Ciclosporin is a prodrug which activates upon forming a complex with
cytoplasmic proteins called immunophilins (Madan and Griffiths, 2007). The primary effect
exhibited by ciclosporin is the potent inhibition of T lymphocytes thus suppressing the
response to antigen by inhibiting lymphokine secretion and proliferation (Berth‐Jones,
2005).The use of ciclosporin has also been shown to have a direct action upon epidermal
keratinocytes including inhibition of proliferation (Fisher et al., 1988, Kanitakis and Thivolet,
1990).
As seen with the majority of treatments available for psoriasis there are side effects
attributed to the use of ciclosporin. The main side‐effects are nephrotoxicity, hypertension
and a potential risk of developing non‐melanoma skin cancer (Flytstrom et al., 2008), hence
close monitoring of patients is required and low doses are often employed.

40
CH3
CH3
O
N
H3C
CH3
NCH3
O
N
CH3
O
H3C
NH
OH
N
CH3
O
CH3H3C
N
CH3
O
CH3
N
CH3
CH3
H3C CH3
HN
O
O O
CH3
HN
O
CH3
HN
O
CH3
CH3
H3C
CH3
OHH3CNH3C
Figure 1‐6: The chemical structure of ciclosporin.
1.3.4.3 Biologic Treatments
As detailed above most traditional anti‐psoriasis drugs are toxic and so new biologic drugs
are being developed to attempt to conquer the problem of side effects. It is expected that
these biologics, which are proteins, are target specific and this reduces the possibility of side
effects. They include fusion proteins, recombinant proteins (e.g. cytokines, selective
receptors), and monoclonal antibodies, and are common forms of treatment for
autoimmune diseases such as rheumatoid arthritis and Crohn’s disease (Menter and
Griffiths, 2007). A recent publication (Papp, 2008) has reviewed the four biologics which are
currently available in the UK for the treatment of psoriasis; alefacept, efalizumab,
etanercept and infliximab. The biologics are divided into two main groups: T cell modulators
and tumour necrosis factor (TNF) inhibitors and their composition details are shown in Table
1‐2. A thorough review of these biological treatments is available in (Tzu and Kerdel, 2008)
and (Menter and Griffiths, 2007).

41
Biologic Target FDA Approval for Psoriasis
Treatment Composition
Alefacept T cells modulation 2003 Receptor‐Antigen fusion protein
Efalizumab T cell modulation 2003 Monoclonal Antibody
Etanercept TNF Inhibition 2004 Receptor‐Antigen fusion protein
Infliximab TNF Inhibition 2006 Chimeric monoclonal antibody
Table 1‐2: Summary table of biological treatments, their target, year of approval and biological composition. Summarised from (Sauder and Mamelak, 2004).
The number of patients eligible for treatment by a biological approach is somewhat limited
due to costs and availability, however, the impact of biologic treatment has been substantial
for the treatment of moderate to severe psoriasis. The inclusion of protein‐based treatment
could lead to the long term regulation of psoriasis resulting in a significant increase in
patient quality of life (van de Kerkhof, 2009). However, for the vast majority of patients a
reliance on systemic treatments such as methotrexate and ciclosporin is prevalent.

42
1.4 Metabolomics
1.4.1 Introduction to Metabolomics.
As the area of metabolomics is relatively new, it was first coined by Oliver and colleagues in
1998, (Oliver et al., 1998) the exact definition and application of metabolomics undergoes
frequent discussion, with theories and ideas differing from group to group. The general
foundation of a metabolomics‐based approach is the holistic and data driven study of the
metabolism of both endogenous and exogenous metabolites present in biological systems
(Dunn, 2008). A holistic approach investigates a system as a whole, incorporating the
complex interactions known to be present into a single problem (Kell and Oliver, 2004).
Hypothesis generation can greatly expand the realms of a scientific investigation, and
although greatly dependant of the validity of produced data sets can allow hypotheses to be
generated through inductive reasoning.
The metabolome is the quantitative complement of all low molecular weight molecules,
termed metabolites, present in cells, tissues or organisms in a given physiological or
developmental state (Hollywood et al., 2006) that are involved in metabolic processes. The
contents of a metabolome denote the cellular processes that control the biochemical
phenotype of the cell, tissue or whole organism (Allwood et al., 2008). Metabolites
contained within a cell or tissue (endometabolome) or those occupying the extracellular
environment (exometabolome) can be studied, either in situ, through imaging based analysis
or more typically after sampling and extracting the metabolites (Dunn, 2008). The study of
the endometabolome is frequently described as metabolic fingerprinting while conversely
the study of the exometabolome can be termed metabolic footprinting.
An important factor in any metabolomic‐based analysis on a cellular system is the effective
quenching of a system. It is imperative that any enzyme action is rapidly and sufficiently
halted without the loss of metabolites through leakage. The general method of quenching

43
involves a rapid change in temperature or pH. The most frequently used quenching method
is the addition of 60% aqueous methanol at approximately ‐50°C. Following the quenching of
metabolism it is necessary to extract the metabolites from the cells (Sellick et al., 2009). The
aim here is to deactivate endogenous enzymes permanently and make the cell permeable to
release the maximum number of cellular metabolites with the highest possible recoveries
(Winder et al., 2008). Extraction methods can be sample specific and vary between research
groups; however, it usually employs heat or cold and occasionally acid or base to facilitate
cell lysis. These additional experimental parameters can be overcome through the use of a
metabolite footprinting approach. Probing the exometabolome of a system can be
undertaken through the study of culture media. This approach is deemed less technically
demanding and is particularly beneficial in high‐throughput studies.
In body fluid analysis (e.g., serum or urine) the content of these metabolomes can be greatly
influenced by external factors such as food, drugs and alcohol as well as intrinsic factors such
as diurnal cycle, age etc (Goodacre, 2007). The effect of external influences is especially
noticeably when the metabolomic analysis of urine or serum is undertaken and for this
reason experimental design frequently incorporates strict regulations on volunteers
including fasting or restricted diet.
It is necessary to apply an element of realism, at present it is impossible to quantify or even
detect all the metabolites within any biological system. Limitations arise because of chemical
complexity and the large dynamic range of metabolites which has an impact on the
analytical capabilities of the platform selected for use and also in the sample preparation
conducted prior to analysis.
1.4.2 Analytical Platforms for Metabolomics
There are a number of analytical techniques which can be employed for metabolomic
analysis. The emphasis is largely placed on mass spectrometry techniques although Fourier

44
transform infrared (FT‐IR) and Nuclear Magnetic Resonance (NMR) spectroscopies are
regularly utilised and Raman spectroscopy is gaining significance in the field. The choice of
analytical platform is highly dependent upon the sample being analysed and ultimately the
required outcome of the experiment.
1.4.2.1 FT‐IR spectroscopy
1.4.2.1.1 General FT‐IR Introduction
Infrared (IR) spectroscopy is one of the most common spectroscopic techniques used by
scientists and has been proven to be a powerful technique for structural determination and
compound identification. FT‐IR spectroscopy is a rapid, reagentless, non‐destructive
analytical technique whose continuing development is resulting in manifold applications
across a wide range of biosciences (Ellis et al., 2004). The major advantage associated with
infrared spectroscopy is that virtually any sample in almost any given state can be
determined with relative ease and minimal sample preparation. There is a vast array of IR
based equipment that allows the optimum set‐up for a sample to be established. Examples
of such equipment include high‐throughput analyses as well as microscope and attenuated
total reflectance (ATR) based systems. It is also possible within a single system to operate in
transmission or reflectance mode which offers further versatility to the user.
FT‐IR is based on the principle that when a sample is interrogated with an infrared light
beam, specific functional groups within a sample will absorb the infrared radiation at specific
wavelengths and vibrate in a variety of manners, i.e. bend or stretch corresponding to
discrete energy levels. A particular absorption or vibration corresponds directly to a
particular chemical species and hence the spectrum produced is specific for that species and
can be termed an infrared fingerprint.
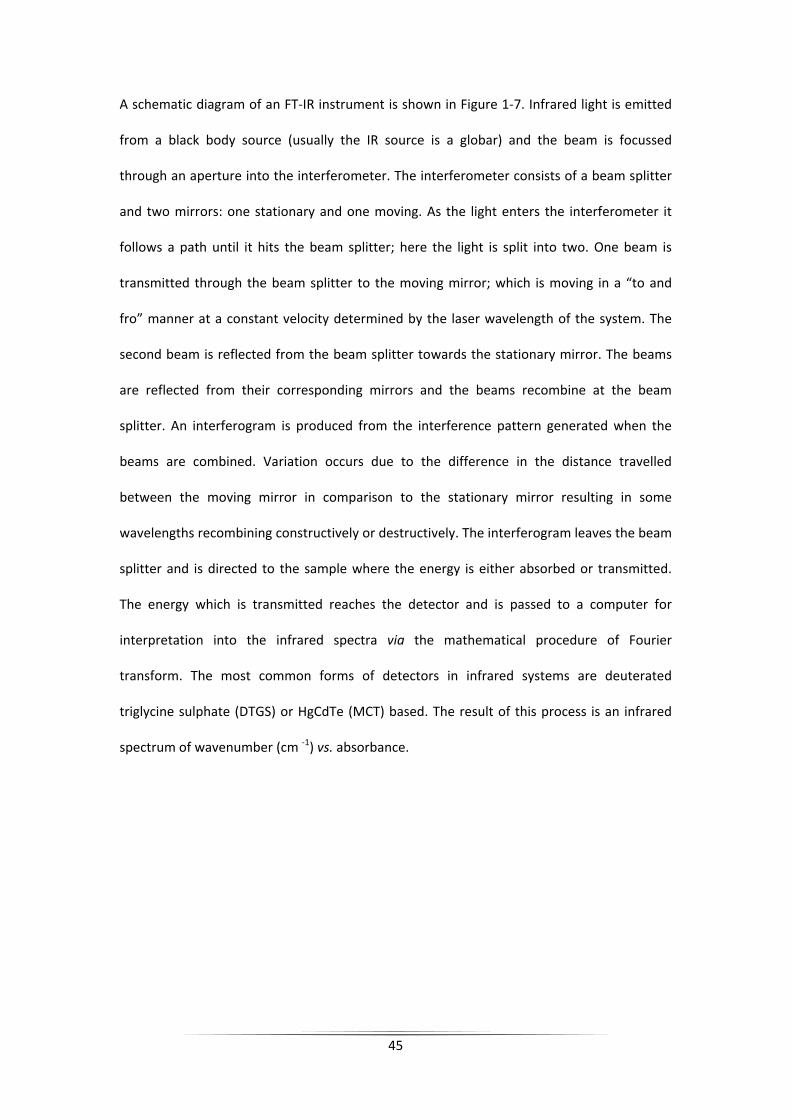
45
A schematic diagram of an FT‐IR instrument is shown in Figure 1‐7. Infrared light is emitted
from a black body source (usually the IR source is a globar) and the beam is focussed
through an aperture into the interferometer. The interferometer consists of a beam splitter
and two mirrors: one stationary and one moving. As the light enters the interferometer it
follows a path until it hits the beam splitter; here the light is split into two. One beam is
transmitted through the beam splitter to the moving mirror; which is moving in a “to and
fro” manner at a constant velocity determined by the laser wavelength of the system. The
second beam is reflected from the beam splitter towards the stationary mirror. The beams
are reflected from their corresponding mirrors and the beams recombine at the beam
splitter. An interferogram is produced from the interference pattern generated when the
beams are combined. Variation occurs due to the difference in the distance travelled
between the moving mirror in comparison to the stationary mirror resulting in some
wavelengths recombining constructively or destructively. The interferogram leaves the beam
splitter and is directed to the sample where the energy is either absorbed or transmitted.
The energy which is transmitted reaches the detector and is passed to a computer for
interpretation into the infrared spectra via the mathematical procedure of Fourier
transform. The most common forms of detectors in infrared systems are deuterated
triglycine sulphate (DTGS) or HgCdTe (MCT) based. The result of this process is an infrared
spectrum of wavenumber (cm ‐1) vs. absorbance.

46
Figure 1‐7: A schematic representation of an FT‐IR instrument.
1.4.2.1.2 FT‐IR Microspectroscopy
The onset of FT‐IR microspectroscopy has significantly increased the ability and adaptability
of the technique. FT‐IR microspectroscopy can incorporate either a single detector element
similar to standard FT‐IR or a multi‐detector element namely a focal plane array (FPA)
detector. The incorporation of a single array detector with a light microscopy based system
has the distinct advantage that the user can define an exact area of interest from which
spectra can be taken. The FPA detector allows the analysis of larger areas again defined by
the user through varying sizes of array e.g., 1x16, 32x32, 64x64 or 128x128 pixels. An
individual infrared spectrum is collected at each pixel thus generating infrared hypercubes.
1.4.2.1.3 FT‐IR applications in Clinical Metabolomics
FT‐IR has been utilised as the analytical tool in many biological investigations. It is common
that FT‐IR is used during the initial stages of investigations as a method to probe global
Fixed Mirror
Moving Mirror
Sample
IR Source
Detector
Beamsplitter

47
changes in biochemical composition i.e. lipid or amide regulation. FT‐IR is regularly used to
interrogate variances in cells, tissues and bio‐fluids associated with disease.
FT‐IR has been used as a tool to distinguish between cell types including discrimination
between drug‐resistant and non‐resistant human melanoma cell line (Zwielly et al., 2009)
and the analysis of leucocytes in leukaemia research (Liu et al., 2007). In a recent study Gazi
et al., used an FT‐IR microscopic approach to investigate the uptake and metabolism of fatty
acids by metastatic prostate cancer. In this study PC‐3 cells were cultured directly onto IR
compatible slides and FT‐IR spectra were collected with a 16x1 MCT linear array detector.
The study illustrates the benefit of using FT‐IR spectroscopy as it eliminates the need to
undertake cell isolation or extraction of lipid molecules prior to investigation (Gazi et al.,
2009).
The analysis of tissue samples is a useful variation of the technique. A diverse collection of
tissue types have been analysed with FT‐IR microspectroscopy; examples include a
comparative study between normal, benign and malignant ovarian tissues (Krishna et al.,
2007), discrimination between normal and malignant human gastric tissues (Fujioka et al.,
2004), and the analysis of cervical cancer and melanoma biopsy samples (Mordechai et al.,
2004), amongst many others. A study highly related to the work within this thesis is a project
undertaken by Pouliot et al. (2007). The authors used ATR‐FT‐IR to analyse the stratum
corneum in skin models derived from uninvolved and involved psoriatic cells in a discussion
of the use of skin models in dermatological research (Bernard et al., 2007). FT‐IR
spectroscopy has also been implemented in a collection of studies investigating the diffusion
of exogenous molecules/drugs through skin sections (Andanson et al., 2009, Tetteh et al.,
2009, Hanh et al., 2000).

1.4.
1.4.
Mas
varie
illus
Figuwhecharelemand
A sa
on t
base
chro
ionis
mas
The
is pa
The
chro
or L
Exam
deso
.2.2 Mass
2.2.1 Gene
ss spectrome
ety of scient
trated in Fig
re 1‐8: Schemre positive orrge (m/z) ratment. Instrumin addition al
ample can be
the configura
ed experime
omatography
sation sourc
ss analyser w
separated io
assed to a PC
configuratio
omatographi
LC‐MS. In ad
mples of ion
orption ionis
Spectrome
eral Overvie
etry was first
tific disciplin
ure 1‐8.
matic diagramr negatively cio occurs wi
mental compoll data is colle
e introduced
ation of the s
ents is throu
y (LC‐ or GC
ce where ion
where the io
ons enter th
C for storage
on of an id
c platforms
dition there
nisation sou
sation (MAL
etry
ew
t invented in
nes. The bas
m of a mass sharged ions athin the masonents and exected and stor
d into the sys
system. A m
ugh a chrom
C‐MS). Upon
ns are gener
ns are separ
he detector d
.
deal system
with varying
are numero
rces include
LDI), electron
48
1912 and is
ic configurat
spectrometer.are created, sss analyser fxperimental red on the co
stem in eithe
ajor method
atographic a
n introductio
ated. These
rated accord
device for re
can vary g
g column ch
ous ionisatio
e electrospra
n impact (EI
now a main
tion of a ma
. A sample is separation of followed by dparameters annected PC. A
er a solid, liq
d of sample i
approach em
on the samp
ions are sub
ding to their
equired dete
reatly. As a
hemistries ar
on sources a
ay ionisation
I), chemical
stay analytic
ass spectrom
introduced iions accordindetection wiare controlledAdapted from
quid or gas p
ntroduction
mploying eith
ple is passed
bsequently f
mass to cha
ction and al
already men
re frequently
nd mass ana
n (ESI), matr
ionisation (
cal platform
metry platfor
nto an ion song to their mathin the detd computatiom (Dunn, 2008
phase depen
in metabolo
her liquid or
d through t
forwarded in
arge (m/z) ra
l generated
ntioned diffe
y used in GC
alysers avail
rix‐assisted
CI), atmosph
for a
rm is
ource ass to ector onally 8).
nding
omic‐
r gas
o an
nto a
atios.
data
erent
C‐MS
able.
laser
heric

49
pressure chemical ionisation (APCI) and atmospheric pressure photo ionisation (APPI).
Additionally, examples of mass analysers include time of flight (TOF), linear quadrupole (Q),
quadrupole time of flight (Q‐TOF), Fourier transform ion cyclotron resonance (FTICR), triple
quadrupole (QQQ) and most recently developed the Orbitrap.
In the following sections a number of systems will be discussed with specific emphasis based
on the systems utilised in the work presented within this thesis. In addition, the relevance to
metabolomics‐based analysis and the advantages and disadvantages associated with the
system will also be highlighted.
1.4.2.2.2 GC‐MS
GC‐MS is a well established technique that is regularly utilised in many analytical fields.
GC‐MS is a combined system for the analysis of volatile and thermally stable polar and non
polar metabolites (Dunn et al., 2005). Compounds are initially separated by GC and eluting
analytes detected by mass spectrometry. GC‐MS is greatly biased towards the detection of
volatile, low molecular weight compounds however the detection of non‐volatile, higher
molecular weight compounds is possible through employing a chemical derivatisation
process prior to analysis. In a metabolomics investigation it is common that a range of
metabolites (i.e., amino acids, sugars, alcohols, lipids and phosphorylated metabolites) will
be present in a sample and hence derivatisation is readily conducted prior to analysis.
Chemical derivatisation of metabolites is a two stage process which can be used for a variety
of classes of compounds. The general process involves oxime formation with
O‐alkylhydroxyamines followed by trimethylsilylation. Oxime formation converts sample
carbonyl groups to oximes providing thermal stability while trimethylsilyation replaces active
hydrogens on polar functional groups with less polar trimethylsilyl (TMS) groups thus
increasing the volatility through the reduction of dipole‐dipole interactions. The process of
chemical derivatisation is well established and greatly increases the number of metabolite

50
peaks detected; however, this process is time consuming and sample stability is a concern
(Dunn and Ellis, 2005). Samples must be dry prior to derivatisation as the presence of water
can result in the reversibility of TMS ester formation. The drying of samples can, however,
result in the loss of volatile metabolites which must be considered.
Once any required derivatisation is performed the sample is introduced into a heated
injector, where vaporisation of the sample occurs followed by mixing with a carrier gas. The
vaporised sample or an aliquot of this gas is introduced onto the top of the chromatography
column. The columns employed in GC are silica based with an internal diameter of between
100‐500 µm. The column is located within a temperature controlled oven thus regulating the
operational temperature. The choice of operational temperature is restricted by the physical
properties of the metabolites to be detected. It is common that the starting temperature is
approximately 20‐30°C below the boiling point of the solvent mobile phase. A temperature
program is then utilised to gradually increase the temperature of the oven to temperatures
that are often between 300‐320°C. This method is used to optimise the chromatographic
separations of metabolites. The metabolites elute from the GC column according to
volatility and polarity; the most volatile metabolites elute first. Upon elution the metabolites
enter the mass spectrometer.
The main sources of ionisation in GC coupled devices are electron impact (EI) or chemical
ionisation (CI) (El‐Aneed et al., 2009). EI ionisation is performed in a high vacuum ion source
where the analyte in vapour form is bombarded with electrons (at 70eV). This transfers
sufficient energy to the molecules to allow the formation of fragment ions (Pasikanti et al.,
2008). The generation of fragments can provide useful information regarding the structure
of an analyte. CI is a relatively soft ionisation approach so the production of fragment ions is
reduced. The process of chemical ionisation involves the presence of neutral molecules such
as methane or ammonia in great excess to the metabolite. The EI process of bombardment

is co
witn
The
emp
the
offe
in ta
1.4.
The
field
rods
varie
amp
anal
thei
onducted cr
nessed due to
next stage
ployed in GC
role of a m
r varying adv
andem mass
2.2.3 Qua
quadrupole
d is applied t
s generate a
ed thus func
plitude less t
lyser wherea
r amplitudes
reating ionis
o the presen
in the proce
‐MS analysis
ass analyser
vantages in t
spectromet
drupole
mass analys
o 2 rods and
n electric fie
ctioning as a
than half the
as ions of low
s are too gre
Figure 1‐9:
sed metabol
nce of the ad
ess occurs w
s are quadru
r is to separ
terms of cos
ry platforms
ser consists
d a radio freq
eld through w
a mass filter
e radius of t
wer and high
at. A schema
Schematic dia
51
ites through
dditional neu
ithin a mass
poles (Q) or
ate ions bas
st, resolution
s.
of four para
quency (RF) f
which the io
r where ions
the quadrup
her mass are
atic diagram
agram of a qu
h charge tra
tral molecul
s analyser. T
time of fligh
sed on their
n, mass range
llel electrica
field is applie
ons can move
s of a chose
oles and su
e lost by coll
is illustrated
uadrupole ma
ansfer but a
es.
The principle
ht (TOF). As p
m/z values
e and their a
al rods. A dir
ed to the oth
e. The applie
en mass hav
uccessfully tr
isions with t
d in Figure 1‐
ass analyser.
a softer effe
e mass analy
previously st
. Mass analy
ability to be
rect current
her 2 rods. T
ed potentials
ve trajectorie
raverse the m
the rods bec
‐9.
ect is
ysers
tated
ysers
used
(DC)
These
s are
es of
mass
cause

The
robu
limit
and
quad
1.4.
The
on t
at t
pote
ener
syst
diag
The
sens
1.4.
A fu
spec
(Q‐T
major advan
ustness and
tations assoc
resolution
drupole is us
2.2.4 Time
TOF analyse
the basis of t
he same tim
ential into th
rgy, the low
em all ions w
gram is show
advantage
sitivity of the
2.2.5 Tand
urther develo
ctrometry in
TOF) or ion t
ntages of qu
the ease of
ciated with t
achievable
sed.
e of Flight (
er is structura
their velocity
me in the io
he TOF drift t
wer m/z ions
will reach th
wn in Figure 1
Figure 1‐10
with TOF in
e detector ca
dem Mass S
opment in th
corporating
rapping syst
uadrupole m
maintenanc
the employm
and the ina
(TOF) Analy
ally the most
y correlated
onisation sou
tube. After a
s achieve hi
e detector b
1‐10.
: Schematic re
nstruments
an be greatly
Spectromet
he field of m
the use of h
ems. The ge
52
ass analyser
ce and autom
ment of quad
ability to pe
yser
t basic mass
to the mass
urce and co
acceleration
gher velocit
but will exhib
epresentation
is the abilit
y increased a
try (MS/MS
mass spectrom
hybrid mass a
neral basis o
rs are the rel
mation. Ther
drupoles inclu
erform MS/
analyser. Th
of the ion. I
nsequently
all ions have
ties than the
bit varying s
n of a TOF ma
ty to scan a
s the length
S)
metry is the
analysers i.e
of hybrid inst
latively low c
re are howe
uding the lim
MS analysis
he TOF syste
n general all
accelerated
e the same a
e higher m/
peeds of tra
ass analyser.
a high mass
of drift tube
application
e. a quadrupo
trumentation
cost, operat
ever a numbe
mited mass r
s unless a t
m separates
l ions are for
through a f
amount of ki
/z ions. In a
avel. A schem
s range and
e increases.
of tandem m
ole‐time‐of‐f
n is the selec
ional
er of
ange
triple
ions
rmed
fixed
netic
TOF
matic
d the
mass
flight
ction

53
of a precursor ion of interest by the first mass analyser followed by the collection of accurate
masses of product ions by the second mass analyser. These mass analysers are separated in
space by a collision cell or can be separated in time by the use of ion trapping systems. In an
ion trapping system the instrumentation has the ability to select the mass of interest,
dissociate the molecular ion and analyse the product ions in the same mass analyser. The
Orbitrap ion trapping system is discussed in more detail in Section 1.5.2.3.1. The major
advantage of these systems is the ability to acquire enhanced structural information and
hence this increases the possibility of analyte identification.
1.4.2.2.6 GC‐MS Applications in Clinical Metabolomics
GC‐MS is at the forefront of analytical techniques utilised in metabolomic studies and as a
consequence there is a wealth of literature regarding the application of the technique in
clinical metabolomics‐based studies. It is common to compare the metabolome of diseased
vs. normal control patients via the analysis of biofluids including urine, plasma or serum or
through investigating disease at a cellular level utilising cell culture techniques or tissue
samples.
One of the most significant metabolomics based investigations of recent times was the study
conducted by Sreekumar and colleagues whom investigated prostate cancer progression
(Sreekumar et al., 2009) using a combination of high‐throughput liquid and gas
chromatography. The authors probed more than 1,126 metabolites across 262 clinical
samples related to prostate cancer including; 42 tissues and 110 each of urine and plasma.
The investigation identified sarcosine, a glycine derivative as being a potential biomarker for
prostate cancer progression. The metabolite was found to be significantly increased during
cancer cell progression to metastasis in tissue studies and was additionally indentified
non‐invasively in urine profiling. To provide an additional example a metabolomics‐based
study of pre‐eclampsia was conducted through the analysis of plasma samples from 87

54
normal volunteers and 87 diseased patients by GC‐TOF‐MS in a study conducted by Kenny
and co‐workers (Kenny et al., 2005). The authors identified three metabolites which could
potentially be used in disease diagnostics.
The literature provides numerous additional examples of GC‐MS‐based metabolomics which
are beyond the scope of this introduction. However, to date there are no known
metabolomic studies investigating the metabolic variance in psoriasis or its associated
co‐morbidities.

55
1.5 Proteomics
1.5.1 Introduction to Proteomics
The global large scale analysis of cellular proteins is termed proteomics. A proteomics
protocol involves the separation of complex protein mixtures via gel electrophoresis or
liquid chromatography followed by protein identification utilising mass spectrometric
techniques (Aebersold and Mann, 2003) including matrix assisted laser desorption ionisation
(MALDI).
1.5.2 Analytical Platforms for Proteomics
1.5.2.1 2D Gel Electrophoresis
The use of 2D gel electrophoresis is a common tool for the separation of protein mixtures
and is a method often used in the initial stages of proteome analysis. The process of high
resolution two‐dimensional electrophoresis of proteins was first described by O’Farrell in
1975 (Ofarrell, 1975). The process involves the separation of proteins according to the
isoelectric point by isoelectric focusing (IEF) in the 1st dimension and according to molecular
weight by sodium dodecyl sulfate (SDS) electrophoresis in the 2nd dimension. As these two
parameters are uncorrelated it is possible to gain a highly resolved separation across the two
dimensions.
As with most analytical techniques there are a number of limitations associated with 2D gel
electrophoresis. In a biological sample there are large variations in the magnitude of protein
expression. In a typical eukaryotic sample there could be in excess of 10,000 different
proteins of which the majority will be housekeeping proteins present in numbers 105 to 106
copies per cell. In addition to these there will be a number of less common proteins such as
receptor molecules that are present in much lower concentrations i.e. 100 per cell. In a 2D
gel analysis it is possible that proteins present at a lesser magnitude will be masked and

56
essentially lost from the analysis. Specific proteins have been recognised as being excluded
or underrepresented in 2D gels. These include very acidic or basic proteins, excessively large
or small proteins and membrane proteins (Peng and Gygi, 2001). The additional limitation
associated with 2D gel electrophoresis is the lack of automation available and hence the
method can be time consuming and in some cases exhibit low reproducibility. A thorough
review discussing the use of 2D gel electrophoresis in proteomics is available for further
reading (Gorg et al., 2004).
1.5.2.2 MALDI‐MS
Matrix assisted laser desorption ionisation (MALDI) mass spectrometry (MS) is a analytical
technique which was conceived in 1987 by Hillenkamp and colleagues (Karas et al., 1987).
The incorporation of a matrix (small organic molecule) into the laser desorption (LD) process
allowed for the detection of a larger mass range of analytes. The principle of the MALDI
process is summarised in Figure 1‐11.
Figure 1‐11: Schematic illustration of the MALDI process.
Analyte
Matrix
Laser
+Mass
Spectrometer

57
The beginning of the process is to dissolve the sample of interest in an excess of matrix
solution; common matrices include α‐cyano‐4‐hydroxycinnamic acid,
3,5‐dimethoxy‐4‐ hydroxycinnamic acid (sinapinic acid) or 2,5‐dihydroxybenzoic acid (DHB).
The sample/matrix solution is applied to a metal target plate where it is irradiated with a
pulsed nitrogen laser at 337nm. The UV absorbing matrix molecules absorb the energy from
the excitation laser. This energy is then rapidly transferred from the matrix to the analyte to
induct vaporisation and ionisation. This leads to the sputtering of pulses of MH+ ions from
each component of the sample. These ions then pass through to the mass analyser which is
most commonly a TOF based system (as detailed in section 1.4.2.2.4) in either a linear or
reflectron configuration.
MALDI is a soft ionisation method which ensures that, on a whole, fragmentation is
minimised. The technique is relatively simple and adaptable and as a consequence is most
often the method of choice for high‐throughput protein identification. A MALDI‐MS
approach is compatible with the analysis of an array of sample types. In particular MALDI‐MS
is used for the identification of protein spots localised within 2D gel analysis. In an
identification approach the protein (spot) is often subjected to enzymatic or chemical
cleavage and a small aliquot of the sample used. The technique can also be applied to the
analysis of bio‐fluids or cultured cells and also for the in situ analysis of tissue samples. In all
approaches a mass spectral fingerprint is produced which can be matched to known libraries
to provide a protein identification. A number of protein sequence databases are available
including Uni‐Prot (pir.georgetown.edu/pirwww) and Swiss‐Prot (ca.expasy.org/sprot), (Kris
and Joël, 2000).
1.5.2.3 LC‐MS
The coupling of liquid chromatography to a mass spectrometer is a well established
technique for both proteome and metabolome analysis. The use of LC‐MS for the analysis of

58
complex peptide mixtures was pioneered by Hunt and colleagues in 1992 (Hunt et al., 1992)
and is now a core method for MS‐based proteomics. LC‐MS is beneficial for the analysis of
peptides and proteins as the technique is biased towards non‐volatile, polar and high
molecular weight analytes. In a metabolomics approach LC‐MS is applied to allow detection
of analytes not usually detectable in GC‐MS, or those that are but require complex
derivatisation to allow detection. This is particularly prevalent in plant sciences due to the
large number of polar/semi‐polar compounds (Allwood and Goodacre, 2010).
The configuration of an LC‐MS system is highly similar to that of a GC‐MS system with the
exception of the basis of analyte separation i.e. LC. In an LC system the analytes are
separated according to their affinities or attraction to either the mobile or stationary phase
within the system. Analytes which are attracted to the mobile phase will elute quickly whilst
those attracted to the stationary phase will be retained longer and hence elute much slower.
Those eluted first will have lower retention times (RT) than those eluted later. Upon eluting
the analytes enter the mass spectrometer where they are ionised, analysed and detected as
previously discussed.
1.5.2.3.1 Orbitrap
The mass analyser employed in the LC‐MS based proteome analysis presented within
Chapter 6 was an LTQ‐Orbitrap system. The Orbitrap was developed relatively recently by
Alexander Makarov (Hardman and Makarov, 2003) and its commercial use in proteomics
was quickly established (Scigelova and Makarov, 2006). The Orbitrap is a form of Kingdom
trap in which moving ions are trapped by an electrostatic field. Ions are directed in a spiral
trajectory around a central electrode and the oscillation frequency is obtained through a
Fourier transformation providing the m/z ratio of individual ions. The benefit of an Orbitrap
system is its high mass resolution (up to 100,000) and mass accuracy (<1ppm) combined
with MS/MS capabilities for improved protein identification.

59
1.5.3 Proteomics for Dermatological Research
The incorporation of proteomics provides a high‐throughput analysis approach for
dermatology research (Goldstein, 2003). A proteomic approach has been utilised in a small
number of dermatological‐based studies. A study undertaken by Park et al., incorporated the
use of 2D gel electrophoresis for the analysis of cultured primary keratinocytes from patients
with atopic dermatitis and normal controls (Park et al., 2006). Differential gel spots were
identified by MALDI‐MS analysis and confirmed by LC‐MS/MS. The authors successfully
identified 18 up‐regulated proteins and 27 down‐regulated proteins in diseased patients vs.
normal controls. A further application of proteomics within dermatology is illustrated by the
proteomic analysis of plasma samples from psoriasis and normal control patients (Plavina et
al., 2008). This study by Plavina and co‐workers investigated the plasma concentrations of
cytoskeletal and Ca2+ binding proteins and peptides, in which 21 proteins were deemed to
be significantly different between control and psoriatic plasma samples. The adaptability of
proteomics is illustrated through the analysis of suction blister fluid isolated from normal
and non‐lesional psoriatic skin (Macdonald et al., 2006). This novel study profiled in excess
of 650 proteins of which 9 were identified as differentially expressed between normal and
diseased skin.
These examples provide a brief insight into the application of proteomics in dermatology
research which is a relatively small area of research. The use of proteomics in clinical
research as a whole is highly prevalent and is a successful tool for disease diagnostics
through the discovery of potential biomarkers.

60
Chapter 2: MALDI‐MS Based Spatial Proteomic Analysis to Investigate Variances Between Normal and Psoriatic Skin.
2.1 Introduction
Matrix assisted laser desorption/ionisation (MALDI) imaging mass spectrometry (MS) is a
relatively new technique first coined by Caprioli and colleagues in 1999 (Chaurand et al.,
1999). The great advantage of the technique is the ability for in situ measurement of
peptides and proteins. The localisation of these peptides and proteins within intact samples
is illustrated through the generation of two‐dimensional ion image maps which correspond
to one or more m/z value (Caprioli et al., 1997). The technique has the ability to detect with
high sensitivity with a capability of detecting in the range of fentomole (10‐15) to attomole
(10‐18) levels. The application of the technique to the analysis of intact biological tissue
samples was first described in detail by Chaurand (Chaurand et al., 1999) and has since been
used in numerous studies.
In this study we have applied a MALDI‐MS imaging approach for the comparative analysis of
skin tissue samples collected from psoriasis patients and normal control volunteers. It was
hoped that we could probe differing localisation and expression of peptides and proteins
present within these biopsy samples to provide information regarding the pathogenesis and
onset of disease.
2.2 Material and Methods
2.2.1 Sample Collection
In collaboration with the Dermatology Research Centre (Hope Hospital, Manchester, UK) a
collection of punch biopsies from the trunk region were collected from psoriatic and non‐
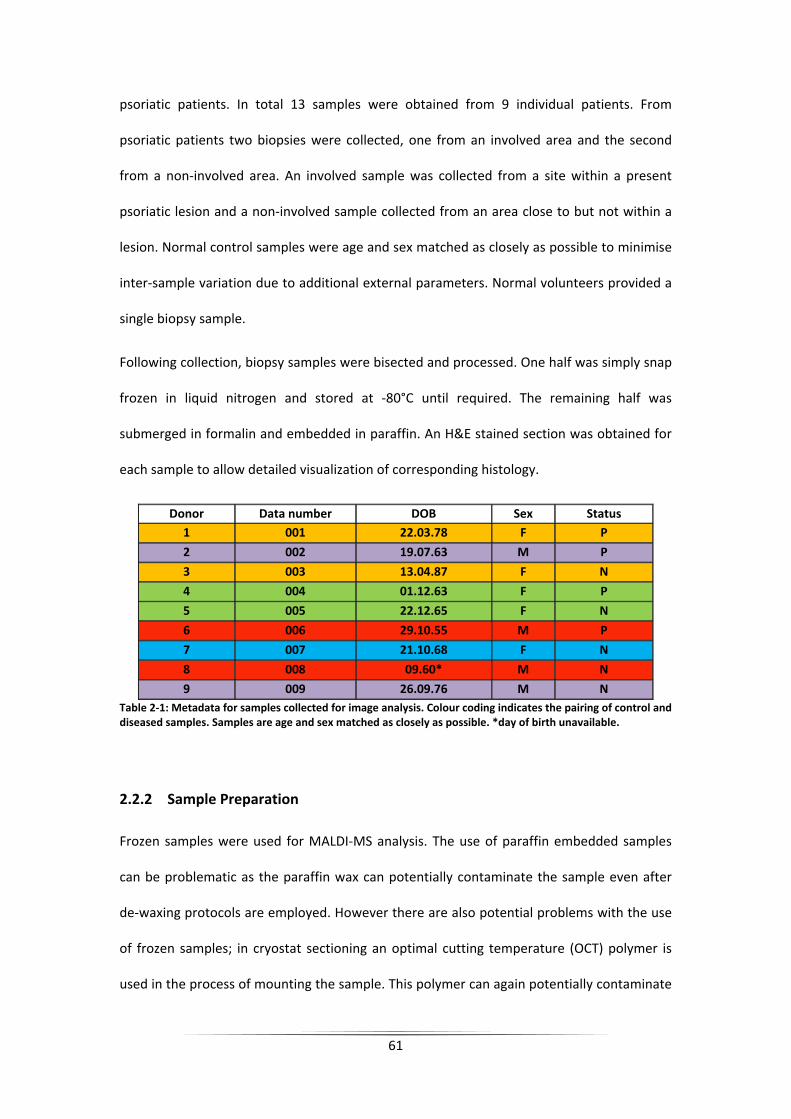
61
psoriatic patients. In total 13 samples were obtained from 9 individual patients. From
psoriatic patients two biopsies were collected, one from an involved area and the second
from a non‐involved area. An involved sample was collected from a site within a present
psoriatic lesion and a non‐involved sample collected from an area close to but not within a
lesion. Normal control samples were age and sex matched as closely as possible to minimise
inter‐sample variation due to additional external parameters. Normal volunteers provided a
single biopsy sample.
Following collection, biopsy samples were bisected and processed. One half was simply snap
frozen in liquid nitrogen and stored at ‐80°C until required. The remaining half was
submerged in formalin and embedded in paraffin. An H&E stained section was obtained for
each sample to allow detailed visualization of corresponding histology.
Donor Data number DOB Sex Status 1 001 22.03.78 F P
2 002 19.07.63 M P
3 003 13.04.87 F N
4 004 01.12.63 F P
5 005 22.12.65 F N
6 006 29.10.55 M P
7 007 21.10.68 F N
8 008 09.60* M N
9 009 26.09.76 M N Table 2‐1: Metadata for samples collected for image analysis. Colour coding indicates the pairing of control and diseased samples. Samples are age and sex matched as closely as possible. *day of birth unavailable.
2.2.2 Sample Preparation
Frozen samples were used for MALDI‐MS analysis. The use of paraffin embedded samples
can be problematic as the paraffin wax can potentially contaminate the sample even after
de‐waxing protocols are employed. However there are also potential problems with the use
of frozen samples; in cryostat sectioning an optimal cutting temperature (OCT) polymer is
used in the process of mounting the sample. This polymer can again potentially contaminate

62
the sample and consequently impact the quality of resultant spectra. It is imperative that
OCT is used carefully and that contact with the cutting edge of the sample minimized.
Samples were sectioned in triplicate at 10µm using a cryostat (Leica Jung CM1800, Leica
Microsystems) and thaw mounted onto a MALDI target plate (microscope slide FlexiMassTM
target, Shimadzu Biotech, Manchester, UK).
Sinapinic acid (5mg/mL in 50:50 Acetonitrile/TFA) was directly applied to tissue sections
using a Chemical Inkjet Printer (ChIP‐1000, Shimadzu Biotech, Manchester, UK). The ChIP
delivered matrix solution (100 pL x 5) to each spot and the process repeated 20 times in
total (previous work within our research group investigated the optimal quantity of matrix
for tissue imaging (Patel et al., 2009)). The result is an array of matrix spots covering the
entire surface of the section in an ordered manner. The ChIP operates by piezo‐electric print
heads that provide a non‐contact delivery of matrix solution. The benefit of this approach is
that the matrix solution remains spatially localised and hence ensures that distinct areas of
interest can be analysed without the possible diffusion of co‐located analytes. MALDI
spectra are collected for all matrix spots thus providing a profiling image. An example
experimental set‐up is detailed in Figure 2.1.
Example: 9 x 12 spots equating to an array of 108 individual profiles consisting of 1-100000
m/z.
Figure 2‐1: Diagram illustrating the experimental set‐up for MALDI‐MS profiling. Three replicate tissue sections arethaw mounted onto a MALDI target plate. A matrix array is applied through ChIP application proving an array ofXxY spots. In the example shown complete matrix coverage requires 9x12 spots equating to 108 individual profiles.
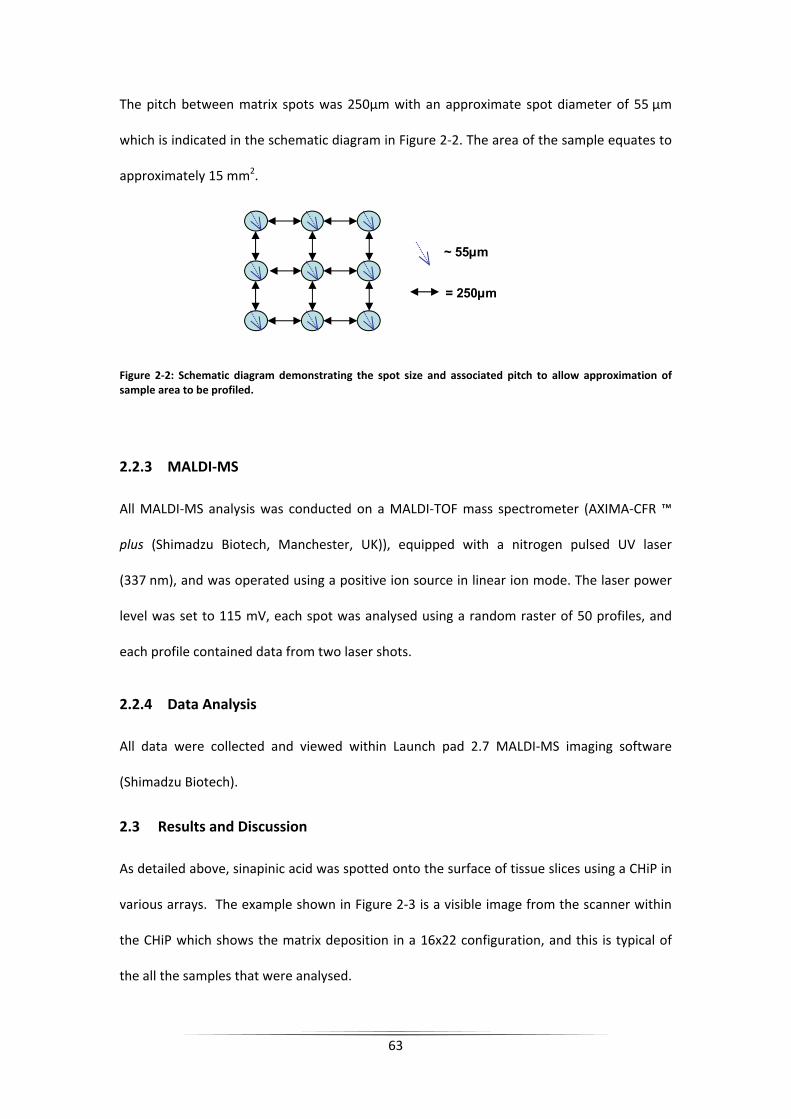
63
The pitch between matrix spots was 250µm with an approximate spot diameter of 55 µm
which is indicated in the schematic diagram in Figure 2‐2. The area of the sample equates to
approximately 15 mm2.
Figure 2‐2: Schematic diagram demonstrating the spot size and associated pitch to allow approximation of sample area to be profiled.
2.2.3 MALDI‐MS
All MALDI‐MS analysis was conducted on a MALDI‐TOF mass spectrometer (AXIMA‐CFR ™
plus (Shimadzu Biotech, Manchester, UK)), equipped with a nitrogen pulsed UV laser
(337 nm), and was operated using a positive ion source in linear ion mode. The laser power
level was set to 115 mV, each spot was analysed using a random raster of 50 profiles, and
each profile contained data from two laser shots.
2.2.4 Data Analysis
All data were collected and viewed within Launch pad 2.7 MALDI‐MS imaging software
(Shimadzu Biotech).
2.3 Results and Discussion
As detailed above, sinapinic acid was spotted onto the surface of tissue slices using a CHiP in
various arrays. The example shown in Figure 2‐3 is a visible image from the scanner within
the CHiP which shows the matrix deposition in a 16x22 configuration, and this is typical of
the all the samples that were analysed.
= 250µm
~ 55µm

The
softw
to n
exam
prof
to b
peak
Figurskin surfa
How
sign
data
and
pixe
app
prof
gene
quality of
ware on the
noise ratio; t
mple, for sa
files the com
be of adequa
ks that have
re 2‐3: A visiblesection in a 16ace of the skin.
wever, when
ificantly low
a cubes were
normal regi
els were of
roximately 2
files would
erated was
the mass s
mass spectr
these settin
mple 003 (n
mplete datase
ate quality (~
arisen from
e image captur6x22 array. The
this approac
wer and the
e generated
ons. Once t
very poor
20% of the
show eithe
not deemed
pectra gene
rometer base
gs were ass
normal tissu
et was manu
~23%). An ex
the surface
red by the ChIPe example spec
ch was repea
reproducibi
in duplicate
the data wer
r quality ev
pixels were
r good mas
d good enou
64
erated from
ed on numb
sessed deter
ue) which co
ually searche
xample of a
of the tissue
P scanner illusttrum illustrate
ated on othe
lity of this a
e from each s
re collated a
ven though
e of sufficie
ss spectra o
ugh to cons
the tissue
er of clearly
rministically
onsisted of a
d and a tota
spectrum is
e can be clea
rating the mates a number of
er normal tis
approach loo
sample; inclu
and processe
they came
nt quality a
or no signal
truct any ch
region was
identifiable
on each M
a total of 35
l of 82 spect
s shown in F
rly seen.
trix deposition peaks which h
sues the spe
oked poor.
uding involve
ed it became
e from tissu
and quite of
l. The qua
hemical map
s assessed u
peaks and s
S image. A
52 mass spe
tra were dee
igure 2‐3, w
applied to a nohave arisen from
ectral quality
Despite this
ed, non‐invo
e clear that m
ue. On ave
ften neighbo
lity of the
ps that coul
using
ignal
As an
ectral
emed
where
ormal m the
y was
s MS
olved
many
erage
oring
data
d be

65
related to the anatomy of the skin. For example it was not possible to differentiate between
dermis, epidermis and sub‐dermal regions.
As the above results were not encouraging this process was repeated with a number of
different matrix applications including DHB and α‐cyano‐4‐hydroxycinnamic acid. In
addition, the number of repeat spots and matrix concentration was also varied (as in (Patel
et al., 2009)). Despite these attempts the data quality remained poor. Subsequent to this
we discussed this problem with Prof. Ron Heeren (personal communication) and he reported
that his MALDI‐MS imaging laboratory had also so far failed to generate good quality MALDI‐
MS data from skin. Thus the idea of using MS‐based protein imaging on skin was
abandoned.

66
Chapter 3: Phenotypic Profiling of Extralesional Keloid Scar Tissue Cross Sections using FT‐IR Microspectroscopy Reveals Unique Spectral Signature for Keloid Scars.
3.1 Introduction
Keloid disease (KD) is a benign fibroproliferative tumour affecting the reticular skin, which
causes a progressive, recurrent dermal tumor (Brown and Bayat, 2009). Previous studies
provide compelling evidence that genetic dysregulation plays an important role in KD
development although the exact aetiopathogenesis remains unknown (Brown et al., 2008).
These fibrous growths can cause significant disfigurement and unwanted symptoms such as
intense itchiness and pain (Brown et al., 2008). The inflammation, itching, and throbbing can
be especially severe during the growth phase, but even long‐standing lesions may continue
to have tender and painful margins compared to a more inactive and often involuting centre
(Bayat and McGrouther, 2006). Keloid disease presents a significant burden for patients and
a significant therapeutic challenge for clinicians (Durani and Bayat, 2008).
KD results from an abnormal tissue response to dermal injury and is characterized by
persistent growth of dermal connective tissue after re‐epithelialisation and extension of scar
tissue beyond the original borders of the wound (Tan et al., 2010). These scars are raised
and spread beyond the margins of the original wound, invade the surrounding normal skin in
a site‐specific way, in contrast to hypertrophic scars, which are the result of an exaggerated
wound healing response and stay confined to the boundaries of the original lesion (Bayat et
al., 2003). KD seems to be unique to humans, can occur at any age and affect individuals of
all races and both sexes (Bayat et al., 2005). In addition, KD can be identified in most
anatomical locations with predisposition to certain sites including the chest, shoulders,
upper back, back of the neck, and earlobes (Bayat and McGrouther, 2005, Bayat et al., 2004)

67
The histological profile of KD is characterized by the presence of thick, hyalinized,
homogeneous, strongly eosinophilic bundles of collagen, haphazardly orientated in reticular
dermis (Figure 3‐1). Keloids have a swirling nodular pattern of collagen fibres and the
resulting fibrous growths invade normal dermis which can produce masses in subcutaneous
tissue (Shih et al., 2010).
Figure 3‐1: Diagrammatic and histological cross section of an extralesional keloid scar including: A: The Grenz zone in a keloid; the histological area corresponding to papillary dermis of normal dermis located between the epidermal basement membrane and the upper edge of the reticluar dermis. B: View of thick hyalinized collagen bundles typically found in middle of keloid scars. C: Keloid with circumscribed borders (marked in blue) which are well‐demarcated demonstrating the periphery or margin of the keloid scars.
Due to the fact that keloid scars do not regress spontaneously, plus the fact that no plausible
long‐term effective treatment has yet been found, research on causation, treatment options
and prognosis is of great interest. A combination of surgical excision followed by
intralesional steroid injection, or other adjuvant therapy, currently appears to be the most
effective regimen for clinical management of KD. Surgical excision alone however
demonstrates recurrence rates of between 45‐100% (Bayat and McGrouther, 2005). It was
recently demonstrated that recurrence of keloid lesions can vary according to the extent of
surgical excision; keloids excised intralesionally had a higher recurrence compared to those

68
removed extralesionally (Tan et al., 2010). In addition, there appears to be phenotypic
differences between the structurally distinct peripheral margin and the centre of the keloid
lesion. The margin is symptomatically more active and hypercellular as opposed to the
relatively inactive hypocellular centre (Tan et al., 2010). The aim of this study was to
delineate the morphological components of an extralesionally excised keloid tissue by
looking at differences in cross sections and comparing different anatomical locations within
the keloid tissue using an alternative technique to histology. The main advantage would be
to simultaneously image the quantity and quality of multiple components in KD in relation to
normal skin using a technique with high molecular sensitivity combined with a spatial
resolution down to a few micrometers.
Fourier transform infrared (FT‐IR) spectroscopy as previously discussed in Section 1.4.2.1, is
a rapid, non‐destructive technique which is well suited for the analysis of human tissue
samples (Ellis et al., 2007, Ellis and Goodacre, 2006). FT‐IR microspectrocopy allows spectral
information to be gained while maintaining the morphology of the sample by combining
simple light microscopy with infrared instrumentation (Fabian et al., 2006, Sulé‐Suso et al.,
2005). Sample preparation is minimal and therefore the possibility of losing relevant
biochemical information as a function of space is minimised. In FT‐IR microspectroscopy
there are two general approaches: the coupling of a mercury cadmium telluride (MCT)
detector allows the collection of spectra from specific areas to be acquired by combination
with a light microscope; by contrast, the incorporation of a focal plane array (FPA) detector
(Lewis et al., 1995) permits the production of larger areas to be examined and a variety of
arrays exist (e.g., 1×16, 32×32, 64×64 or 128×128 pixels) that allow the generation of
infrared hypercubes to be collected in a simultaneous fashion (Fernandez et al., 2005).
These hyperspectral data (where each pixel contains an infrared spectrum) can be
transformed into chemical maps which allow the spatial distribution of functional groups,

69
specific chemical species (Patel et al., 2008), or disease areas using chemometrics (Lasch et
al., 2004) to be generated.
In this chapter FT‐IR microspectroscopy has been applied to investigate the textural
morphometric profiling of extralesionally excised keloid scar tissue specimens. Both MCT
and FPA detectors were used and coupled to chemometric methods for the classification of
keloid vs. normal tissue using partial least squares discriminant analysis (PLS‐DA) or for
chemical mapping using principal components analysis (PCA).
3.2 Materials and Methods
3.2.1 Patients & Samples
KD cases were recruited at a specialist scar service at the outpatient Department of Plastic
and Reconstructive surgery unit in South Manchester University Hospital Foundation Trust
(Manchester, England, U.K.). All patients participating in the study were confirmed to have
keloid scars both by using stringent clinical criteria in addition to histological confirmation by
a pathologist with an interest in dermatopathology. The employment of such rigorous
diagnostic criteria in the recruitment protocol assured the correct diagnosis of all recruited
individuals. This approach was taken to limit the confounding effects of disease
heterogeneity and misdiagnosis potentially inherent in other scarring studies which may fail
to differentiate between hypertrophic and KD. Therefore the following clinical criteria were
used to identify keloid disease cases as opposed to other forms of skin scarring conditions
such as hypertrophic scars. A keloid scar was defined clinically as a dermal tumour that
spread beyond the margin of the original wound, continued to grow over time, did not
regress spontaneously, and had been present for at least a minimum period of 1 year. In
comparison, hypertrophic scars were defined as raised scars that remained within the

bou
the
The
prof
case
was
sam
sect
Figurdemospectderm14 in
A to
from
pati
ndaries of th
initial injury
local and h
formas. Writ
es were pers
taken using
ples were c
tion was snap
re 3‐2: This constrates anatotroscopy was tmis of the keloindividual maps
otal of six his
m four keloid
ents of vary
he original le
(Tan et al., 2
hospital ethic
tten consent
sonally asses
a proforma
collected po
p frozen in li
ross section oomical locationtaken; this resud scar. The cyacontaining 64x
stologically p
d patients. Sp
ying age, se
esion, often r
2010).
cal committ
t was obtain
ssed and exa
and each sc
ost surgery.
quid nitroge
of a typical kens within the kulted in 38 spean area showsx64 pixels and c
proven keloid
pecimens we
ex and ethn
70
regressed sp
ees had giv
ned from al
amined by D
car lesion wa
Each specim
en and the ot
eloid scar (sakeloid scar. Linectra in total: 3 where FT‐IR ccovered an are
d scars (see
ere collected
icity (Table
pontaneously
en approval
l individuals
Dr Ardeshir
s examined
men was bis
ther half plac
mple number es in green sho3 epidermal, 21hemical maps ea of approxima
Figure 3‐2 fo
d from a var
3‐1). A num
y within seve
for the stu
s entered int
Bayat. A full
in detail. Ext
sected and
ced in forma
3) excised frow where line 1 normal and 1were collectedately 3.5 x 0.25
or an examp
iety of anato
mber of add
eral months
udy protocol
to the study
l medical his
tralesional ke
one half of
alin fixative.
rom the chestmapping using14 from the retd from: this inc5 mm.
ple) were exc
omical sites f
ditional feat
after
and
y. All
story
eloid
f the
t wall g FT‐IR ticular luded
cised
from
tures
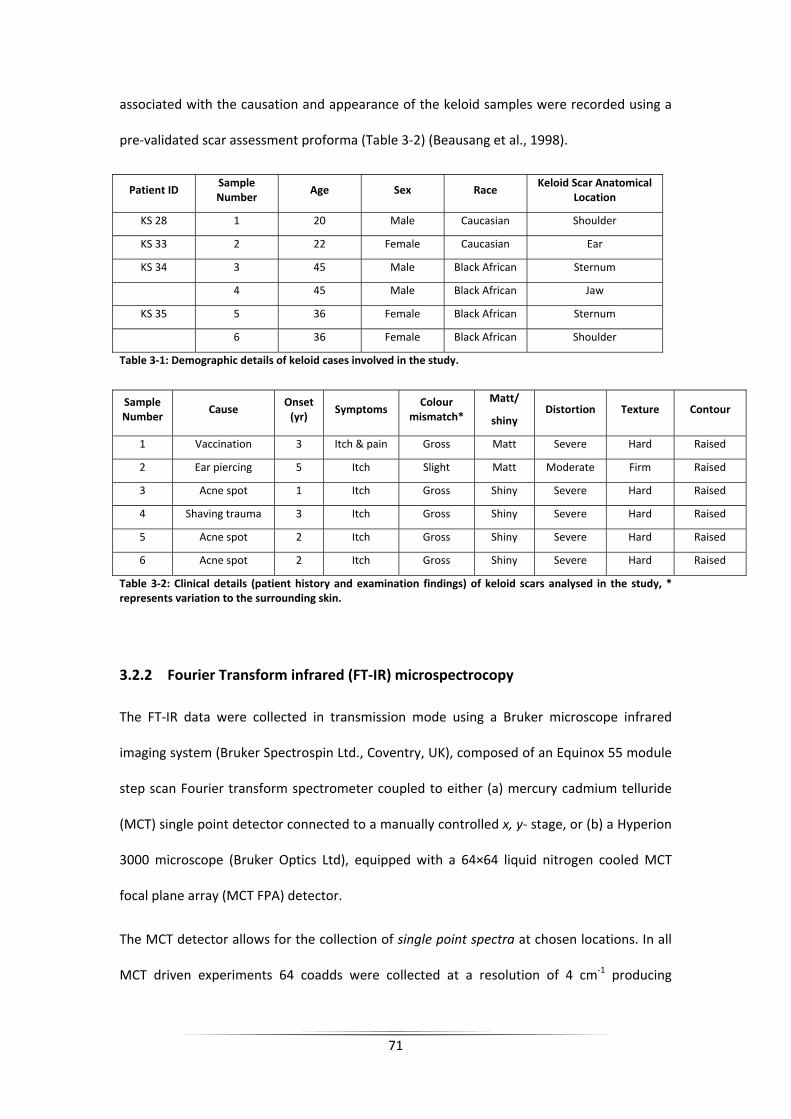
71
associated with the causation and appearance of the keloid samples were recorded using a
pre‐validated scar assessment proforma (Table 3‐2) (Beausang et al., 1998).
Patient ID Sample Number
Age Sex Race Keloid Scar Anatomical
Location
KS 28 1 20 Male Caucasian Shoulder
KS 33 2 22 Female Caucasian Ear
KS 34 3 45 Male Black African Sternum
4 45 Male Black African Jaw
KS 35 5 36 Female Black African Sternum
6 36 Female Black African Shoulder
Table 3‐1: Demographic details of keloid cases involved in the study.
Sample Number
Cause Onset (yr)
Symptoms Colour
mismatch*
Matt/
shiny Distortion Texture Contour
1 Vaccination 3 Itch & pain Gross Matt Severe Hard Raised
2 Ear piercing 5 Itch Slight Matt Moderate Firm Raised
3 Acne spot 1 Itch Gross Shiny Severe Hard Raised
4 Shaving trauma 3 Itch Gross Shiny Severe Hard Raised
5 Acne spot 2 Itch Gross Shiny Severe Hard Raised
6 Acne spot 2 Itch Gross Shiny Severe Hard Raised
Table 3‐2: Clinical details (patient history and examination findings) of keloid scars analysed in the study, * represents variation to the surrounding skin.
3.2.2 Fourier Transform infrared (FT‐IR) microspectrocopy
The FT‐IR data were collected in transmission mode using a Bruker microscope infrared
imaging system (Bruker Spectrospin Ltd., Coventry, UK), composed of an Equinox 55 module
step scan Fourier transform spectrometer coupled to either (a) mercury cadmium telluride
(MCT) single point detector connected to a manually controlled x, y‐ stage, or (b) a Hyperion
3000 microscope (Bruker Optics Ltd), equipped with a 64×64 liquid nitrogen cooled MCT
focal plane array (MCT FPA) detector.
The MCT detector allows for the collection of single point spectra at chosen locations. In all
MCT driven experiments 64 coadds were collected at a resolution of 4 cm‐1 producing

72
absorbance spectra in the range of 4000‐600 cm‐1. The FPA detector can be used to collect
high resolution images of a large sample area. With a ×15 IR objective lens this allows the
analysis of sample areas of approx. 267 µm × 267 µm. A pixel area of 64×64 was collected
equating to 4096 spectra from each of the detector elements. Tissue mapping was
conducted with a spectral resolution of 4 cm‐1 and a spectral range of 4000‐900 cm‐1. A
single coadd was collected and the typical acquisition time for each image was
approximately 12 min.
The data were collected using routines of the OPUS 4.0 IR imaging software (Bruker Optics),
and then exported as ASCII files which were subsequently imported into Matlab version 7.1
(The Math Works, Inc., 24 Prime Par Way, Natick, MA, U.S.A.) for analysis (vide infra).
3.2.3 Sample Preparation
For FT‐IR analysis, specimens were snap frozen in liquid nitrogen and stored at ‐80°C until
analysis. Frozen cross sections from the keloid scars were sectioned using a cryostat
microtome (Leica Jung CM1800, Leica Microsystems) at a thickness of 10 µm and air dried
onto calcium fluoride (CaF2) IR‐transparent windows. Adjacent 5 µm sections were collected
and air dried onto glass slides for pathological analysis by hematoxylin and eosin (H&E)
staining. Digital images were obtained from the H&E stained sections using a Digital Imaging
Microscope (Nikon, Eclipse 80i, Japan) at a magnification of 10×4. Individual images from
each section were manually stitched together within GIMP (version 2.2.15) to allow
classification of keloid and normal skin cross sections.

73
3.2.4 FT‐IR Data Collection and Chemometric Analyses
3.2.4.1 MCT Infrared Analysis
A total of 22 line mapping experiments were conducted from the six individual keloid slices.
Line mapping was conducted in both vertical and horizontal directions. Vertical line maps
represented a transition from epidermis, through normal dermis region (termed Grenz
zone), into the diseased keloid part (superficial edge → keloid centre → deep edge) and
returning to normal dermis region again (See Figure 3‐1 and Figure 3‐2 for clarification).
Similarly, line mapping in a horizontal direction transits from a normal region, into the
diseased keloid part (peripheral edge (margin) → keloid centre → peripheral edge (margin))
and finally returning into a normal dermal region. In this way it was possible to categorise
our measurements in the following categories, epidermis (e), normal (n), keloid (k) or
doubtful provenance (d). Doubtful provenance areas were regions that could not be
assigned without an element of doubt from interpretation of corresponding H&E staining or
light images from the microscope. Each sample was subject to 3 or 4 line mapping
experiments, existing of a number of sampling points (mean of 12 points).
Collected spectra were collated and scaled using extended multiplicative scatter correction
(EMSC (Martens et al., 2003)). To eliminate the region of unavoidable baseline drift that
occurs between ~1650‐2000 cm‐1 and the CO2 absorption in the area of 2350‐2450 cm‐1
these sections were eliminated from analysis by removing these data regions. Principal
component analysis (Jolliffe, 1986) was conducted and typically 3 principal components
(PCs) were extracted and PC loading plots were used to study variability within and between
the samples and anatomical sites. All data analysis was performed within Matlab version 7.1.
Line mapping data were analysed in single line maps, collated per sample and as a large
collective dataset.

74
Partial least squares (PLS) (Martens and Naes, 1989) analysis was conducted on the large
collated dataset consisting of 100 spectra from the six locations on the four patients. Spectra
were selected based on the collection region being clearly differentiated by microscopy as
being normal tissue or keloid. PLS‐discriminant analysis (PLS‐DA) was performed with
defined outputs as 0 = normal and 1 = keloid. In order to validate the classification, so as to
avoid false discovery (Broadhurst and Kell, 2006), PLS‐DA bootstrapping was performed in
PLS‐DA using the replacement method (Westerhuis et al., 2008); thus ‘on average’ 37% of
samples were used for testing and 63% samples were used for training. Bootstrapping was
performed 10,000 times on the data. On the 10,000 test data only (i.e., the validation data,
not the training set) statistics can be performed and this results in a confusion matrix, box
and whisker plot and a receiver operator characteristic curve being produced.
3.2.4.2 FPA Image Analysis
The previously obtained H&E stains (Figure 3‐2) were used to identify sample KS34 as the
best example of a keloid section, and therefore this section was selected for chemical image
analysis. A vertical line image was collected by collating 14 individual FPA images (i.e., 14 by
64×64 pixels). The areas were selected using the visible light images provided by the
microscope on the Hyperion 3000 and were manual aligned using the x‐y stage. The line map
incorporates a transition from normal epidermis to dermal keloid areas and returning to
normal skin morphology.
Upon collection the individual spectral datacubes were concatenated to produce a single
large dataset within Matlab. As some of the pixels were deemed bad (i.e., they were hot
and so gave a signal irrespective of whether infrared absorbance was occurring) these were
removed by filtering the entire data set and setting any pixels with an absorbance greater
than 4.99 recurring to zero (these are later removed prior to PCA; see below). This process

75
removes large domineering spikes in the data while not blanking the pixel entirely. The
spectra were then summed to produce a total intensity image.
To normalise the data for PCA any pixel greater than zero was set to 100% and anything less
than zero was set to ‐100%. This established that 0 is truly zero and its colour will match any
other zero in the dataset. Wavenumber regions contributing a high level of varying noise
corresponding to water and/or CO2 interferences were eliminated by removing the
wavenumber ranges 4000‐3700 cm‐1 and 2450‐2250 cm‐1 respectively. Bad pixels were
removed prior to PCA which was performed using MATLAB’s “princomp.m”routine. Bad
pixels were reinserted into the missing positions in the PC scores matrix with all
wavenumber values set to zero. The datacube was reshaped and PC scores false colour
coded to generate chemical maps. The corresponding PC loadings plots were produced for
the first 9 PC scores.
Finally, nine wavenumber bands were selected as displaying significant variances between
normal and keloid tissue regions (see below). The area under the peak of the given
wavenumber bands were integrated and the subsequent images plotted.
3.3 Results & Discussion
3.3.1 Histological Findings
The epidermis, the Grenz zone (the intermediate papillary zone between the epidermis and
the reticular dermis), the deep reticular dermis of keloid samples (n=6) region as well as the
equivalent regions in normal skin were identified and confirmed by a histopathologist
(e.g., Figure 3‐1 A, B & C). The thickness of the Grenz zone varied between the different
histological sections (Figure 3‐1 A). However, the epidermis remains unaltered at the top in
all lesions (Figure 3‐1 A & C) and the middle of each keloid scar demonstrated a swirling

76
nodular pattern of fibres and thick hyalinised collagen bundles (Figure 3‐1 B). Figure 3‐2
demonstrates a cross section of a keloid lesion which shows the typical, abnormal thick
collagen fibres (“keloid collagen”) at the centre of lesion, the lower part however is
characterized by a diffuse cellularity. The margin or periphery of the cross sections appeared
more cellular.
3.3.2 FT‐IR microspectroscopy
Vibrational bands from cellular proteins, membrane lipids and nucleic acids were observed,
providing molecular information relating to the structure and concentration of these
materials within a cell. Typical representative FT‐IR spectra are shown in Figure 3‐3. These
spectra were obtained from normal regions in the hypodermis or from keloid regions in the
cross‐section, and the arrows indicate the significant differences between the keloid and the
normal skin spectrum. Also included is a spectrum of collagen, which is known to be
predominant in skin and in keloid scars.
3.3.3 Chemometric analyses
PCA was carried out on all line mapping experiments to obtain PCA scores plots. A typical PC
scores plot is shown in Figure 3‐4. In this example, (and others not shown), these scores
plots generally show discrimination between normal and keloid tissue; and where present,
spectra from the epidermis and dermis were clearly differentiated from normal and keloid
tissue. In addition the spectral variance in the keloid areas was less marked than the normal
regions (Figure 3‐4).
PC loading plots were also generated and these allow the spectral features that are used in
the production of the PCA to be revealed. The example shown in Figure 3‐4B is typical
where spectral features from lipids were larger in the normal tissue (positive in PC1) than in

the
(Figu
Figurdermspect
keloid tissue
ure 3‐3).
re 3‐3: A) Typicmal regions. B) trum of collage
e (negative in
cal FT‐IR absorExpansion of lien.
n PC1) which
rbance spectraipid region C) E
77
h seemed to
a collected fromExpansion of am
resemble th
m normal skin mide region, an
he spectrum
tissue, and kend D) Offset gr
of pure coll
eloid epidermaraph demonstra
agen
al and ates a

78
Figure 3‐4: (A) PCA scores plot from one of sample no 4 with lines (2nd horizontal line) showing clear differentiation between normal tissue and keloid scar. (B) Corresponding PC1 loadings plots showing features that are discriminatory.
To follow on from this unsupervised learning method, we trained PLS‐DA to discriminate
between keloid and normal tissue as detailed above. The results from the 10, 000 bootstrap
analyses for the test data only are shown in Figure 3‐5, where it can be seen that the
average ROC is 0.922 which is important for differentiation. Moreover the box and whisker
plot shows the results for all 10,000 models and also shows that PLS‐DA can readily
differentiate between normal tissue and keloid scars.
3.3.4 FT‐IR microspectroscopic imaging
The results of the spectral area maps correspond well with the tissue histological sections
(Figure 3‐6). These maps provide detailed biochemical information, not readily available
from other techniques (Figure 3‐3); these images indicate regions of lipid, amide and
phosphate content within different areas in the tissue section (Figure 3‐6), and PCA on the
total chemical map allowed other features to be revealed by inspecting the corresponding
PC loadings matrices (Figure 3‐8).
-1 0 1 2 3 4-1.5
-1
-0.5
0
0.5
1
6n1 6n2
6n3
6n4
6n5 6n6
6k1 6k2 6k3
6k4
6k5 6k6
6k7 6k8
6k9 6k10 6n7
PC1: 89.18% Explained Variance
PC
2: 8
.30%
Exp
lain
ed V
aria
nce
1000150020002500300035004000-0.05
0
0.05
0.1
0.15
Wavenumber (cm-1)
PC
1 lo
adin
gs
Keloid Normal
BA

79
Figure 3‐5: Results from PLS‐DA bootstrap analysis from 100 spectra selected from six samples. (A) Average receiver operating characteristic plots from the test data only from the 10,000 models and (B) Box whisker plots showing the data from all training and test data from the 10,000 PLS‐DA models that were constructed. Boxes represent the lower median and upper quartiles. Whiskers represent the range or 1.5 x the length of the box, whichever is shorter. Outliers (+) are the values out of the whisker range.
-0.1 0 0.1 0.2 0.3 0.4 0.5 0.6 0.7 0.8 0.90
0.2
0.4
0.6
0.8
1
AUROC : 0.922
False positive rate
True
pos
itive
rate
Receiver Operating Characteristic (Cross Validation Samples)
ROCROCCH
Train Normal Test Normal Train Keloid Test Keloid-2
-1.5
-1
-0.5
0
0.5
1
1.5
2
2.5
PLS
Pred
ictio
n
B
A

80
Figure 3‐6: Chemical image plots from sample number 3 of chest wall generated from IR microspectroscopy. The light image is shown from the unstained tissue and corresponds to the area detailed in Figure 3‐2. The first four false colour coded maps are from the sum of the total IR signal, area under lipid, amide and phosphate bands respectively. The next nine image maps represent the first 9 PC scores.
HighLow
PC1 PC2 PC3 PC4 PC5 PC6 PC7 PC9PC8Light Image
Total Intensity Amide Lipid Phosphate

81
Region Wave number Range
(cm‐1) Mid point (cm‐1)
Assignment
1 3030:2995 3012 Amide B (N‐H stretching) from protein
2 2990:2880 2935 Asymmetric CH2 stretching from lipid
3 2875:2830 2852 Symmetric CH2 stretching from lipid
4 1780:1720 1750 C=0 stretch from lipid
5 1715:1600 1657 Amide I (80% C=O stretch)
6 1590:1490 1540 Amide II (60% N‐H in plane bend, 40% C‐N stretch)
7 1480:1430 1455 CH2 scissoring from lipid
8 1260:1215 1237 Amide III (40% C‐N stretch, 30% N‐H in plane bend, 20%
methyl‐C stretch)
9 1195:1135 1165 Asymmetric PO2‐ stretch from nucleic acids
Table 3‐3: Tentative infrared vibrational band assignments for regions of interest.
Figure 3‐7: Typical FT‐IR absorbance spectra collected from normal and keloid skin tissue. The spectra are annotated to illustrate the wavenumber regions of interest highlighted in Table 3‐3.

82
Figure 3‐8: Corresponding PC loadings plots from the PCA of IR microspectroscopy in Figure 3‐6.
PC1 PC2 PC3
PC4 PC5 PC6
PC7 PC8 PC9

83
3.4 Discussion
This study for the first time demonstrates that FT‐IR microspectroscopy shows significant differences
in spectral profiles from keloid tissue in different anatomical locations within a cross section.
Distinct vibrational bands (100 spectra from six samples) were observed for each lesion using FT‐IR
spectroscopy. PLS‐DA with appropriate validation using bootstrapping (10, 000 bootstrap analyses),
identified whether a spectrum was from the keloid or normal tissue showing an average accuracy of
84.8%, precision of 80.4%, specificity of 76.2% and sensitivity of 92.9%.
FT‐IR spectroscopy is a novel and robust approach for keloid disease diagnostics (Ellis and Goodacre,
2006, Hollywood et al., 2006); this has been complemented in this study with the findings verified by
routine histopathology. The classification and ‘orientation’ of the KD tissue slices were confirmed
with the aid of complementary H&E stained slides as a direct reference for each KD sample studied.
In addition these H&E slides played an important role during the interpretation of the results in
particular during the chemical mapping process.
As is common in FT‐IR studies the spectra are qualitatively very similar (Figure 3‐3) and generally
show only subtle quantitative spectral differences between different tissue types or between
disease and normal cells. Coupled with the inherent large data size (these FT‐IR spectra were
typically represented by 1764 data points) there is a reliance on chemometric approaches for
analysis of these multivariate data.
The first stage in the chemometric analysis was to analyse each sample individually using an
unsupervised method. In such an approach, the algorithm is “unaware” of the data and the main
aim is to assess the natural variance in the data presented. PCA is a reliable approach for this and
this projection method generates new axes called principal components (PCs) which are non‐
correlated. PCs summarise the variance in the data and find any natural structure; which in this
instance is the difference between KD and normal skin. Figure 3‐4 shows an example for sample 4

84
where the PC scores plot shows clear differentiation between normal tissue and KD in the first PC;
that is to say the axes which explain the most natural variance (89.2% total explained variance).
During PCA there is a simultaneous projection in the variable space and these PC loading plots can
reveal (bio)chemical information about what features are important for separations in the PC score
plots. The resulting loadings plot for sample 3 (KS34) is shown in Figure 3‐4B; positive areas are
increased in normal tissue (as the samples are located in the positive part of PC scores 1) and vice
versa, negative loadings are increased in the keloid scar. The negative part of the PC1 loadings plot
shows peaks at ~1600 cm‐1 and ~1450 cm‐1 which can be attributed to amide I (C=O) and II (N‐H), in
addition to a broad peak at ca. 3250 cm‐1 which is another N‐H stretch from proteins. These
correlate well with the FT‐IR spectrum of pure collagen type I (Figure 3‐3D) which is perhaps not
surprising given that collagen is not only found in skin but is densely laid down in KD tissue. By
contrast, the positive loadings are predominantly from lipids. The three vibrational bands from
3050‐2750 cm‐1 are from C‐Hx and the very sharp band at 1780 cm‐1 is from C=O (a constrained
carbonyl vibration) from where the acyl chain joins the polar head group.
In order to distinguish tissue spectra from normal skin or KD irrespective of patient or tissue location
the supervised learning method of PLS‐DA was utilised. In this process the algorithm is given
information on the pathological state of the spectrum’s location and we encoded normal tissue as a
‘0’ and keloid tissue as ‘1’. As some of the spectra were of doubtful origin, that is to say the
pathological status of the border was difficult to interpret, these were removed from the model, this
resulted in 100 spectra in which we had high confidence in their provenance. As only 100 spectra
were taken from 6 samples it is possible to over fit the data analysis (Broadhurst and Kell, 2006) and
therefore in order to validate the PLS‐DA classification model, bootstrapping was performed using
the replacement method (Westerhuis et al., 2008). Bootstrapping was performed 10,000 times on
the data. Figure 3‐5 shows the average ROC curve which has an area of 0.922. In addition, box
whisker plots for the training and test data for the normal and keloid tissues are shown from the

85
10,000 models. This again shows excellent distribution of results and the average statistics on these
models were an accuracy of 84.8%, precision of 80.4%, specificity of 76.2% and sensitivity of 92.9%.
Finally, the true positive rate was 92.9%, true negative rate 76.2%, false positives were 23.8% and
false negative 7.1%.
The H&E section in Figure 3‐2 highlighted sample 3, KS34 from the sternum, as the best example of a
keloid section, therefore this section was selected for chemical image analysis using FT‐IR
microspectroscopy. An area of approximately 3.5 x 0.25 mm was analysed by IR and this was
achieved by collecting 14 separate 64 x 64 datacubes using the FPA detector on the microscope and
aligning the cubes one on top of another (Figure 3‐2). In chemical mapping, a derivative value for
each spectrum is first generated; thus the whole IR spectrum at each pixel is collapsed into a single
value. These are then used to generate false colour maps and in this instance we encoded a high
value as red and a low value as blue. In order for the images to look less pixelated we used
interpolated shading in the mapping function in Matlab. This is known as Gouraud shading
(Gouraund, 1971) and is piecewise linear where the colour in each pixel varies linearly and
interpolates with the corner values from the surrounding 8 pixels. The results are displayed as a
series of chemical maps and shows these for the total IR signal collected (4000‐600 cm‐1), the CHx
from the lipid (3000‐2750 cm‐1), the amide I and II bands (1700‐1500 cm‐1) and the phosphate
content (1350‐1250 cm‐1) representing predominantly nucleic acids. The total IR signal shows that
the keloid scar is very dense in material as is the epidermis, whilst the normal tissue at both
interfaces with the keloid is not as rich in spectral features. The lipid, protein and nucleic acid
chemical maps show very similar spectral features with the obvious exception of the changes in
intensity of these bands. The fact that these images are largely congruent means that alternate
methods are needed to reveal any subtle spectral features.
Thus we applied PCA on these images, 57344 spectra were analysed (equating to 14×64×64
spectra×3400 wavenumbers i.e., 194969600 data points), and extracted the first 9 PCs and their

86
corresponding loadings matrices (Figure 3‐8). It is clear from these PC chemical maps that PCs 1, 2,
3, 7 and 9 relate clearly too histological features (Figure 3‐2). PC1 highlights the keloid epidermis
and dermis as these pixels have high values in PC1, however, this resembles the total IR signal and as
no scaling was used prior to PCA this is not surprising. By contrast PC2 highlights the keloid dermal
region well as PC2 score is low for the keloid reticular region and positive for normal tissue including
the epidermis; the corresponding loadings plot is shown in Figure 3‐8(a protein spectrum correlates
with collagen). The PC 3 loadings plot corresponds to lipids and the features are similar to those
found previously in the analysis of a different tissue (Figure 3‐4; sample 4: KS34), the scores plot of
this feature is uniformly high in the normal tissue but rather granular within the keloid. PCs 7 and 9
largely highlight the keloid epidermis only and many spectral features are evident in the
corresponding loadings plots. From the PCA it is clear that many spectral features are changing
within the keloid, and not just collagen alone. In combination with the visible inspection above (lipid,
protein, nucleic acid) nine spectral areas of interest are potentially important in this pathological
process and these are highlighted in Table 3‐3.
3.5 Conclusion
In conclusion, FT‐IR spectroscopy is a powerful physicochemical technique which when coupled with
microscopy allows detailed chemical maps to be generated from tissues. Strong vibrational bands
were observed for each KD section analysed using FT‐IR spectroscopy. Keloid scarring is a complex
and multifactorial process and such changes were reflected in the complex IR spectra. PCA
suggested that on a per sample basis it was possible to delineate between keloid scars and normal
tissue (both epidermis and sub‐dermal). PLS‐DA was used successfully to distinguish between KD and
normal skin; irrespective of location or patient. This is the first report of the use of FT‐IR
spectroscopy in successful differentiation between keloid scars and normal tissue, and the use of
chemical imaging may in the future allow more targeted surgical treatment with prognostic
information.

87
Chapter 4: A metabolomic based approach to investigate the response of HaCaT cells upon exposure to three well established anti‐psoriatic drugs.
4.1 Introduction
The aim of this work was to apply a metabolomics‐based approach to investigate the impact of three
well established anti‐psoriatic drugs upon direct application to a cellular system at physiologically
relevant concentrations.
The HaCaT cell line was chosen as a model system for psoriasis. HaCaTs are a spontaneously
transformed human epithelial cell line (Boukamp et al., 1988). HaCaT cells retain a remarkable
capacity for normal differentiation even after multiple passages and thus offer a suitable and stable
model for keratinisation studies. The HaCaT cell line has been extensively used as an in vitro model
in a number of psoriasis studies (Farkas et al., 2001, Tse et al., 2006, Belso et al., 2007, Zhang et al.,
2008). The cells are quick growing and cultured following a standard procedure as detailed below.
The drugs chosen for study were dithranol, methotrexate and ciclosporin. The background and
proposed mechanism of action of these drugs is discussed in Section 1.3.4. These drugs were chosen
as they are currently relevant for therapy and in widespread use. Drug selection for treatment is
geographically variable however dithranol is popular in some centres in Europe, ciclosporin is used
extensively in Italy and methotrexate is used in most European countries and the US (Menter and
Griffiths, 2007).
Metabolic profiling was conducted through GC‐MS analysis of both the intra‐cellular metabolome
(fingerprint) and the metabolic footprint. The analysis of the metabolic footprint allows alterations in
overflow metabolism to be observed. This can prove useful to substantiate results from within
intra‐cellular metabolism which can sometimes be compromised by the fast turnover rates observed
for some metabolites.

88
4.2 Materials and Methods
4.2.1 Materials
Drug compounds and reagents were all purchased from Sigma Aldrich, (Gillingham, UK) unless
otherwise stated.
4.2.2 Methods
4.2.2.1 Cell Culture
All culture work was conducted within a Microflow biological safety cabinet and all work areas
thoroughly cleaned with 70% ethanol before use. Unless otherwise stated, all cell culture
consumables were purchased from GIBCO (Invitrogen Group, Paisley UK). The cell culture media
utilised in this work was Dulbecco’s Modified Eagle Media (DMEM) supplemented with 10% Foetal
Bovine Serum (FBS) and 1% Penicillin (5000units/ mL) – Streptomycin (50 mg/ mL). The composition
of DMEM media is shown in Table 4‐1 while it is important to note that all FBS was chosen from a
single tested batch to avoid introduction of variance.
4.2.2.1.1 Resurrection of Frozen Cell Lines
An ampoule of keratinocyte cell line HaCaT was obtained from liquid nitrogen storage. The ampoule
was warmed quickly within a water bath heated to 37°C to thaw the cells. Once thawed the cells
were added drop wise to a T‐25 flask containing 4 mL of warmed complete media and incubated at
37°C and 5% CO2 for 24 h. Cells were examined microscopically at 24 h periods to assess any
morphological changes and nutrient requirements.
4.2.2.1.2 Replacement of Used Media
Cells were routinely fed every 4 days, the media contains phenol red solution, which indicates
acidosis in the culture and so allows visual identification of cell stress. With confluence levels of
approximately 30‐60% a full replacement cycle is completed. All used medium was aspirated and

89
replaced with new warmed medium (37°C). When confluence levels are below 30% a half
replacement of medium was conducted. Replacement of a smaller volume of media allows
endogenous growth factors to be maintained in culture to aid cell growth.
Components Molecular Weight Concentration (mg/ L) mM
Glycine 75 30 0.4
L‐Alanyl‐L‐Glutamine 217 862 3.97
L‐Arginine hydrochloride 211 84 0.398
L‐Cystine 2HCl 313 63 0.201
L‐Histidine hydrochloride‐H2O 210 42 0.2
L‐Isoleucine 131 105 0.802
L‐Leucine 131 105 0.802
L‐Lysine hydrochloride 183 146 0.798
L‐Methionine 149 30 0.201
L‐Phenylalanine 165 66 0.4
L‐Serine 105 42 0.4
L‐Threonine 119 95 0.798
L‐Tryptophan 204 16 0.0784
L‐Tyrosine 181 72 0.398
L‐Valine 117 94 0.803
Choline chloride 140 4 0.0286
D‐Calcium pantothenate 477 4 0.00839
Folic Acid 441 4 0.00907
Niacinamide 122 4 0.0328
Pyridoxine hydrochloride 204 4 0.0196
Riboflavin 376 0.4 0.00106
Thiamine hydrochloride 337 4 0.0119
i‐Inositol 180 7.2 0.04
Calcium Chloride (CaCl2 2H2O) 147 264 1.8
Ferric Nitrate (Fe(NO3)3 9H2O) 404 0.1 0.000248
Magnesium Sulfate (MgSO4 7H2O) 246 200 0.813
Potassium Chloride (KCl) 75 400 5.33
Sodium Bicarbonate (NaHCO3) 84 3700 44.05
Sodium Chloride (NaCl) 58 6400 110.34
Sodium Phosphate monobasic (NaH2PO4 2H2O) 154 141 0.916
D‐Glucose (Dextrose) 180 4500 25
HEPES 238 5958 25.03
Phenol Red 376.4 15 0.0399
Amino Acids
Vitamins
Inorganic Salts
Other Components
Table 4‐1: DMEM culture media composition.

90
4.2.2.1.3 Sub‐Culturing Monolayer Cell Cultures
HaCaT cells grow as a single thickness cell sheet adherent to the base of the culture flask. As cell
growth progresses the base of the culture vessel becomes fully occupied, at which point cell growth
slows (contact inhibition). Therefore, in order to maximise the effective growth of healthy cells it
was necessary to split the cells within a culture vessel. Incorporating the use of proteolytic enzymes
to disrupt the extracellular matrix laid down by the cells on the flask, it was possible to re‐distribute
cells into sterile larger vessels via a process involving washing and dilution.
Flasks were assessed under inverted phase contrast microscopy (NIKON, Tokyo, Japan) to determine
the level of confluency; levels above 80% were selected for sub‐culturing. All used cell media was
aspirated and 5 mL of 10% calcium and magnesium free phosphate buffered saline (PBS) added to
wash the cell monolayer and remove any remaining FBS which can inhibit the action of the
proteolytic enzymes to be used. The PBS was removed, 5 mL of trypsin added to the flask and the
flask incubated at 37°C for 5 min to increase the performance of the enzyme. Once its incubation
time was complete, the flask was agitated slightly to dislodge any remaining attached cells and 5 mL
of warmed complete DMEM media was added. The suspended cells were transferred to a centrifuge
tube and centrifuged for 5 min at 3080g (Thermo Jouan CR322). The supernatant was removed and
10 mL of new complete DMEM media was added to re‐suspend the pellet. This cell mixture was then
distributed equally between 10 new T‐225 culture flasks and the procedure completed by adding
140 mL of DMEM and incubated at 37°C. The cells required 5‐7 days to reach sufficient confluency
and media replacement was performed as necessary.
4.2.2.1.4 Cryogenic Preservation of Cell Lines
Cryogenic preservation is a method of retaining cells in a stable condition for an extended period of
time without the need for maintenance of the cell conditions through feeding and splitting
procedures as detailed above.

91
The sub‐culturing procedure was followed through to the stage where the cell pellet was re‐
suspended in new DMEM medium after centrifugation. In cryopreservation 100 µL of dimethyl
sulphoxide (DMSO) is added to the cell pellet in addition to the new cell medium. DMSO acted as a
cryoprotective medium in the freezing process. The resultant media containing cells was distributed
in 1 mL aliquots to labelled ampoules and placed within a cell freezing device (Nalgene, Rochester,
NY, USA) containing iso‐propanol and stored at ‐80°C for 24 h. Once frozen, the ampoules were
transferred to liquid phase nitrogen storage vessels for long term storage.
4.2.2.2 Drug Exposures
Drug solutions were applied to the samples when the cells were determined by microscope
inspection to be 85‐90% confluent and incubated for 24 h at various concentrations. The
concentration range of the chosen drugs was comparable with the therapeutic doses used during
psoriasis treatment. Dithranol was dissolved in 100% acetone to a final concentration range of
0.1‐0.5 µg/ mL (corresponding to 4.4 x10‐7, 8.84 x10‐7, 1.33 x 10‐6, 1.77 x10‐6 & 2.21 x10‐6 M
respectively but for clarity µg/ mL values are used in discussion). Methotrexate was dissolved
directly in phosphate buffered saline (PBS) to a concentration range of 1‐5 x 10‐7 M and finally
ciclosporin was also dissolved directly into PBS to a concentration range of 0.5‐2.5 x 10‐7 M. Each
drug range described included a total of 5 concentrations and 1 control. All drug solutions were
freshly made before application to the cells. A control exposure was performed for each drug type
through application of acetone or PBS. Drug exposures were performed in triplicate for all
concentration points and the control.
4.2.2.3 Sample Preparation
It was necessary to develop a sampling protocol that would be optimum for metabolome analysis.
The standard process for harvesting adherent cells involves the use of trypsin to detach the cells
from the surface of the flask. This incorporates two distinct problems into the experiment. Firstly the
use of trypsin can potentially alter the metabolite profile due to its interaction with membrane

92
proteins. Secondly the process takes a significant proportion of time and includes centrifugation
which results in a considerable time lapse between harvesting and quenching of metabolism which is
highly likely to result in the loss of significant metabolites. A cell quenching method highly similar to
the method developed within this work was recently published (Teng et al., 2009) and a summary
diagram of our method is shown in Figure 4‐1. The quenching and harvesting method employed
differed only through the temperature of the PBS solution used during the washing procedure. Teng
et al,. used ice cold PBS for the washing stages of the process, however we chose room temperature
PBS to reduce cell shock and thus minimise potential cell leakage.

93
Figure 4‐1: A summary diagram to illustrate the successive stages in the collection of fingerprint and footprint samples.
HaCaT cells grown to ~ 85‐90%
confluency in 18 225ml culture flasks.
Drug Exposure: 5 concentrations of drug applied for 24h with 3 biological replicates Control Flasks
1. Footprintingmedia aspirated
3. Syringe filtered into centrifuge tubes
4. Snap frozen in liquid N2
2. Aliquot retained per flask
5. Stored at ‐80°C until analysis
6. PBS (Room Temperature) added, swilled and removed X 3
7. 100% MeOH ( ‐48°C) added to quench cell metabolism
8. Cell harvested by scraping
9. Cellular biomass removed by pipette aspiration and collected into centrifuge tubes
10. Metabolite extraction through 3 freeze thaw cycles. Snap frozen in liquid N2 and thawed on dry ice
11. Samples centrifuged to pellet cell debris and supernatant collected.12. Stored at ‐80°C until analysis

94
4.2.2.3.1 Metabolomic Footprint Sample Collection
The expired media; to be termed the metabolic footprint was aspirated from each culture flask and
filtered through a 0.45 µm pore size cellulose acetate membrane syringe filter to remove any
remaining cellular debris. The filtered metabolic footprint samples were aliquoted into centrifuge
tubes and immediately snap frozen in liquid nitrogen. All samples were stored at ‐80°C until GC‐MS
analysis.
4.2.2.3.2 Metabolomic Fingerprint Sample Collection
After removal of all of the media, PBS (15 mL, room temperature) was applied to the cellular
monolayer, swilled and aspirated. This process was performed twice to remove any remaining
media. Following this the cell metabolism was quenched by adding 100% methanol (10 mL, ‐48°C)
and harvested by scraping the cells from the flask with a cell scraper. The subsequent biomass was
removed by pipette and transferred to centrifuge tubes. To extract the cells the samples were snap
frozen in liquid nitrogen and allowed to thaw on dry ice. The extraction procedure was repeated
twice to ensure thorough extraction, (Winder et al., 2008). The samples were then centrifuged
(‐14°C, 5 min, 16200g) to pellet the cell debris. The supernatant was removed and stored at ‐80°C
until analysis. A descriptive summary of this method is supplied in Figure 4‐1.
4.2.2.4 Metabolomic GC‐MS Analysis
A 1 mL footprint sample was spiked with 100 µL internal standard solution (1.32 mg/ mL succinic d4
acid, 1.12 mg/ mL malonic d2 acid, 1.08 mg/ mL glycine d5, Sigma‐Aldrich, Gillingham, UK), vortex‐
mixed for 20s and lyophilised (Eppendorf Vacufuge Concentrator 5301, Eppendorf, UK). 9 mL of
fingerprint extract was lyophilised through successive 1 mL cycles. The final 1 mL extract was spiked
with 100 µL internal standard solution (as above), vortex mixed for 20 s and lyophilised (as above).
A two‐stage sample chemical derivatisation was performed on the dried sample, 80 µL of 20 mg/ mL
O‐methylhydroxylamine solution was added and heated at 40°C for 90 min followed by addition of

95
80 µL MSTFA (N‐acetyl‐N‐[trimethylsilyl]‐trifluoroacetamide) and heating at 40°C for 90 min. 20 µL of
a retention index solution (4 mg/ mL n‐decane, n‐dodecane, n‐pentadecane, n‐nonadecane,
n‐docosane dissolved in hexane) was added and the samples were analysed in a random order using
a Agilent 6890 N gas chromatograph and 7683 autosampler (Agilent Technologies, Stockport, UK)
coupled to a LECO Pegasus III electron impact time‐of‐flight mass spectrometer (LECO Corporation,
St Joseph, USA) as detailed in (O'Hagan et al., 2005). Initial data processing of raw data was
undertaken using LECO ChromaTof v2.12 software to construct a data matrix (metabolite peak vs.
sample no.) including response ratios (peak area metabolite/peak area succinic‐d4 internal standard)
for each metabolite peak in each sample. The process of standardising to succinic d4 acid has
previously been reported, details of which can be found in (Pope et al., 2007) and (MacKenzie et al.,
2008).
4.2.2.5 GC‐MS Data Processing
The data matrix was exported from the GC‐MS software and imported into Microsoft Excel. The data
were row normalised to total peak area and an analysis of variance (ANOVA) t test based analysis
performed. Metabolite peaks were selected as significant with a value of p <0.05. Spring embedded
plots were constructed using a correlation threshold of 0.7 (Ebbels et al., 2006).
Metabolite identifications were assigned through searching and matching against an in house
constructed library and also the NIST02 and Golm metabolome libraries. A definitive match means
that the retention index and mass spectrum match that of an authentic standard analysed on the
same instrument (Brown et al., 2009). A putative match implies that the mass spectrum can be
matched only to a non‐Manchester library and cannot be confirmed via an in‐house comparison.
This process corresponds with minimum reporting standards proposed for chemical analysis detailed
within (Sumner et al., 2007).

96
4.3 Results and Discussion
4.3.1 Metabolite Detection
The number of metabolite features detected through GC‐MS analysis was deemed highly acceptable.
The analysis of dithranol treated HaCaT cells yielded 127 metabolite feature peaks from the
intra‐cellular metabolome (fingerprint) and 107 metabolite features for the metabolic footprint. The
analysis of methotrexate and ciclosporin treated cells presented a slightly greater number of
metabolite features: the analysis of the intra‐cellular metabolome of methotrexate and ciclosporin
exposed cells provided 140 and 155 metabolite features respectively; whilst the metabolic footprint
for methotrexate and ciclosporin exposure supplied a total of 146 metabolite features each. This
information is summarized within Table 4‐2.
Dithranol Dithranol Methotrexate Methotrexate Ciclosporin Ciclosporin
Fingerprint Footprint Fingerprint Footprint Fingerprint Footprint
Total Metabolite Features Detected 127 107 140 146 155 146
Number of Significant Metabolite Features
75 13 20 59 8 6
% Significant Metabolite Features 59.1 12.1 14.3 40.4 5.2 4.1
Number of Significant Metabolite Features Identified
45 5 10 26 4 1
% Significant Metabolite Features Identified
60.0 38.5 50.0 44.1 50.0 16.7
Table 4‐2: A summary of the results gained from the internal and external metabolome of HaCaT cells exposed to dithranol, methotrexate and ciclosporin. The table highlights the overall number of metabolite peaks identified, the number of metabolite peaks declared significant and the number of significant metabolite peaks which were identified.
4.3.2 ANOVA Analysis
Metabolite peaks were selected as significant through the application of an ANOVA‐based analysis.
Peaks were selected as significant with a value of p<0.05. The number of peaks which were deemed
significant varied greatly between each drug exposure and also between the analysis of the internal
and external metabolome. A p value limit of <0.05 was used to allow a greater number of metabolite
features to be passed to the correlation analysis stage as discussed in Section 4.3.4.

97
4.3.2.1 Dithranol Fingerprint
The application of ANOVA analysis to the data acquired from the intra‐cellular metabolome of
dithranol treated cells highlighted 75 metabolite peaks as statistically significant, Figure 4‐2. The
number of significant peaks corresponds to approximately 60% of all detected peaks. This represents
the greatest number of significant peaks recorded during the experiment which illustrates that
dithranol exposure successfully enters the cells and interacts with the internal metabolism of HaCaT
cells.
Figure 4‐2: A scatter plot of metabolite feature index vs. p value for all metabolite peaks identified for the dithranol fingerprint analysis. Peaks that were identified as significant from ANOVA analysis with a p value < 0.05 are labelled with a number corresponding to feature index to allow identification of the peak.
4.3.2.2 Dithranol Footprint
The ANOVA analysis of the data provided from the metabolic footprint of dithranol treated cells
indicated only 13 peaks of significant interest, Figure 4‐3. This number of peaks represents only
0 20 40 60 80 100 120
10-7
10-6
10-5
10-4
10-3
10-2
10-1
100
← 1
← 2
← 4
← 5 ← 6 ← 7
← 9
← 10 ← 11
← 13
← 17
← 18
← 19
← 20
← 21 ← 22
← 28
← 29 ← 35
← 36
← 37
← 38
← 39
← 40
← 41
← 42
← 46
← 47
← 48 ← 49
← 50
← 51 ← 54
← 56
← 57
← 58
← 61 ← 63
← 65
← 67
← 68
← 69
← 71
← 72
← 73
← 75
← 78
← 79
← 81
← 83
← 84
← 85 ← 87
← 88
← 89
← 91
← 95
← 96
← 98 ← 99
← 101
← 102
← 104
← 105
← 107
← 110
← 111
← 115
← 116
← 117 ← 118
← 121
← 122
← 123
← 125
← 126
p value
Mass indexMetabolite Feature Index
p value

98
approximately 12% of the total number of detected peaks. This is a lower recorded proportion to
that of the internal metabolome which could indicate that the drug impacts the internal
metabolome to such an extent that little external effect is observed. Alternatively it may be possible
that the turnover of metabolites within the cells is so rapid that overflow metabolism is not in
operation. It is partially expected that the response detected within the footprint media will be
reduced due to the nutrient rich nature of the culture media interfering with metabolite detection.
Figure 4‐3: A scatter plot of metabolite feature index vs. p value for all metabolite peaks identified for the dithranol footprint analysis. Peaks that were identified as significant from ANOVA analysis with a p value < 0.05 are labelled with a number corresponding to feature index to allow identification of the peak.
4.3.2.3 Methotrexate Fingerprint
A total of 20 metabolite peaks were considered to be significant through ANOVA analysis of the
results gained from the intra‐cellular metabolome of methotrexate exposure cells, Figure 4‐4. This
corresponds to approximately 14% of the total number of peaks detected and is in comparison to
the results from dithranol fingerprint notably lower. This result suggests that the methotrexate
0 10 20 30 40 50 60 70 80 90 100
10-4
10-3
10-2
10-1
100
← 1 ← 11
← 18 ← 60
← 62
← 92
← 93
← 100
← 105
← 109
← 113
← 118
← 122
p value
Mass indexMetabolite Feature Index
p value

99
exposure used in this study has not targeted the internal metabolism of the HaCaT cells or at least
has not targeted the metabolites which can be successfully detected through this approach.
Figure 4‐4: A scatter plot of metabolite feature index vs. p value for all metabolite peaks identified for the methotrexate fingerprint analysis. Peaks that were identified as significant from ANOVA analysis with a p value < 0.05 are labelled with a number corresponding to feature index to allow identification of the peak.
4.3.2.4 Methotrexate Footprint
A high proportion of metabolite peaks identified in the metabolic footprint of methotrexate exposed
cells were deemed significant by ANOVA analysis illustrated in Figure 4‐5. A total of 59 metabolite
peaks were selected as significant representing a total of approximately 40% of all peaks identified.
The discovery of this high proportion of significantly affected metabolite features infers that
methotrexate exposure has to a certain degree altered the cellular metabolism of HaCaT cells.
0 20 40 60 80 100 120 140
10-5
10-4
10-3
10-2
10-1
100
← 15
← 26 ← 53
← 57
← 60
← 62
← 64
← 70
← 91 ← 99
← 105
← 106
← 107 ← 112
← 113
← 134
← 141
← 142
← 150
← 152
p value
Mass indexMetabolite Feature Index
p value

100
Figure 4‐5: A scatter plot of metabolite feature index vs. p value for all metabolite peaks identified for the methotrexate footprint analysis. Peaks that were identified as significant from ANOVA analysis with a p value < 0.05 are labelled with a number corresponding to feature index to allow identification of the peak.
4.3.2.5 Ciclosporin Fingerprint
A very small number of the 155 metabolite features detected were highlighted as significant for
ciclosporin exposed cells. In total only 8 peaks were identified as being of significant interest from
the internal metabolome of ciclosporin treated cells, Figure 4‐6. This represents a percentage of
approximately 5% of all identified metabolite peaks. The discovery of such a small proportion of
significant features implies that ciclosporin is failing to enforce any affect on the metabolism of
HaCaT cells which could be related to the mode of action of the drug or the inability of the drug to
penetrate the cells.
0 20 40 60 80 100 120 140
10-6
10-5
10-4
10-3
10-2
10-1
100
← 2 ← 6
← 7
← 8 ← 9
← 12 ← 14
← 18
← 22 ← 23
← 29
← 30 ← 33
← 34
← 35 ← 36 ← 38
← 39 ← 46
← 47 ← 50 ← 53
← 54
← 56
← 67 ← 68
← 70
← 71
← 75 ← 76
← 77
← 87 ← 89
← 91
← 92
← 100
← 104 ← 105
← 108
← 111
← 113
← 115
← 119
← 120
← 121 ← 123
← 125 ← 126
← 127
← 132
← 134
← 135
← 136 ← 140
← 148
← 151 ← 159
← 160
← 161p value
Mass indexMetabolite Feature Index
p value
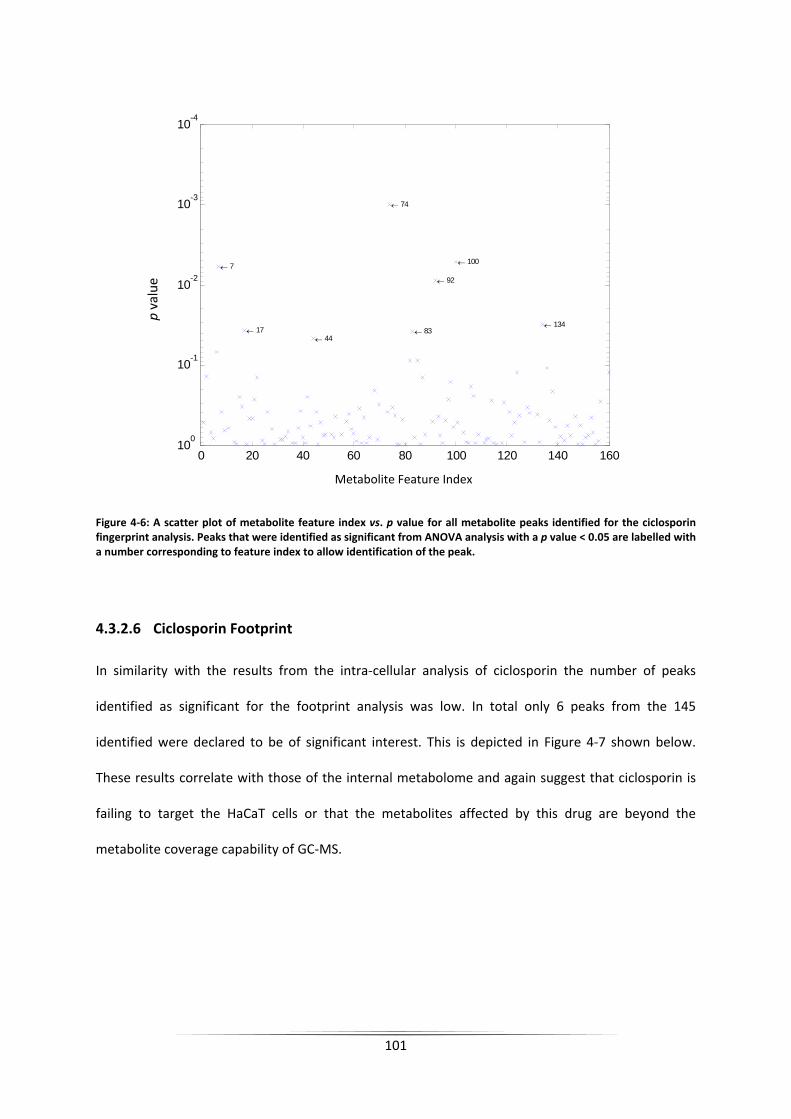
101
Figure 4‐6: A scatter plot of metabolite feature index vs. p value for all metabolite peaks identified for the ciclosporin fingerprint analysis. Peaks that were identified as significant from ANOVA analysis with a p value < 0.05 are labelled with a number corresponding to feature index to allow identification of the peak.
4.3.2.6 Ciclosporin Footprint
In similarity with the results from the intra‐cellular analysis of ciclosporin the number of peaks
identified as significant for the footprint analysis was low. In total only 6 peaks from the 145
identified were declared to be of significant interest. This is depicted in Figure 4‐7 shown below.
These results correlate with those of the internal metabolome and again suggest that ciclosporin is
failing to target the HaCaT cells or that the metabolites affected by this drug are beyond the
metabolite coverage capability of GC‐MS.
0 20 40 60 80 100 120 140 160
10-4
10-3
10-2
10-1
100
← 7
← 17 ← 44
← 74
← 83
← 92
← 100
← 134
p value
Mass indexMetabolite Feature Index
p value

102
Figure 4‐7: A scatter plot of metabolite feature index vs. p value for all metabolite peaks identified for the ciclosporin footprint analysis. Peaks that were identified as significant from ANOVA analysis with a p value < 0.05 are labelled with a number corresponding to feature index to allow identification of the peak.
4.3.3 Identification of Metabolites
The next step of the process requires the metabolites of interest to be identified. The metabolite
identifications were assigned through searching and matching against an in‐house constructed
library and also the NIST02 and Golm metabolome libraries, as outlined in Section 4.2.2.5.
4.3.3.1 Dithranol Identification
A total of 50 metabolites were identified within the internal and external metabolome of dithranol
treated cells and are highlighted within Table 4‐3 and Table 4‐4. The table uses the metabolite mass
index number previously used within the ANOVA significance testing stage. The metabolite
identification, human metabolome database (HMBD) accession number (Wishart et al., 2007) and
0 20 40 60 80 100 120 140
10-3
10-2
10-1
100
← 28
← 32
← 94 ← 109
← 120
← 135
p value
Mass indexMetabolite Feature Index
p value

103
the chemical formula is provided for all metabolites. In addition the table defines the location of the
metabolite within the metabolic fingerprint or metabolic footprint.
The majority of metabolites which were identified were present only within the internal
metabolome of exposed cells (listed as black within Table 4.3 & 4.4). In addition, three metabolites
were identified within the external metabolome (listed as blue in Table 4.3 & 4.4) and two
metabolites were identified in both (listed as red within Table 4.3 & 4.4). The percentage of
significant metabolites which were successfully identified was approximately 60% for the internal
metabolome and approximately 38% for the external metabolome, the data of which is summarised
within Table 4‐2. Duplicative assignments have occurred for a number of metabolite features due to
the formation of multiple products during the derivatisation process. These are indicated by * in
Table 4‐3 and Table 4‐4. The identifications include a variety of metabolites including a number of
amino acids and components of central metabolism.
4.3.3.2 Methotrexate & Ciclosporin Identification
The metabolites identified for the analysis of methotrexate and ciclosporin treated cells are shown
in Table 4‐5. As previous; the table includes the metabolite mass index number and correlating
metabolite identifications, HMBD accession number and corresponding chemical formulas. In total
36 and 5 metabolites were identified for methotrexate and ciclosporin treated cells respectively.
These numbers are somewhat disappointing and may prove a limiting factor in the analysis of the
results.

104
Metabolite Number
Metabolite ID HMDB Accession Number Chemical Formula Metabolic Footprint or
Fingerprint Metabolic Fingerprint Correlation
Group
1 lactic acid HMDB01311 C3H6O3 Footprint & Footprint B
5 stearate HMDB00827 C18H36O2 Fingerprint C
10 glucose‐6‐phosphate HMDB01401 C6H13O9P Fingerprint A
13 leucine* HMDB00687 C6H13NO2 Fingerprint C
17 tryptophan HMDB00929 C11H12N2O2 Fingerprint C
35 isoleucine HMDB00172 C6H13NO2 Fingerprint C
36 leucine* HMDB00687 C6H13NO2 Fingerprint C
37 malonate HMDB00744 C4H6O5 Fingerprint B
38 isoleucine* HMDB00172 C6H13NO2 Fingerprint A
39 isoleucine* HMDB00172 C6H13NO2 Fingerprint C
41 alanine HMDB00161 C3H7NO2 Fingerprint C
42 glycine HMDB00123 C2H5NO2 Fingerprint A
46 serine* HMDB03406 C3H7NO3 Fingerprint C
47 threonine* HMDB00167 C4H9NO3 Fingerprint B
48 serine* HMDB03406 C3H7NO3 Fingerprint C
49 urea HMDB00294 CH4N2O Fingerprint B
50 threonine* HMDB00167 C4H9NO3 Fingerprint C
57 3‐ureidopropanoic acid or beta‐alanine HMDB00026/HMDB00056 C4H8N2O3/C3H7NO2 Fingerprint A
58 threitol/erythritol HMDB04136/HMDB02994 C4H10O4 Fingerprint B
61 threonic acid/erythronic acid HMDB00943/HMDB00613 C4H8O5 Fingerprint A
63 malate HMDB00744 C4H6O5 Fingerprint A
65 4‐hydroxyproline* HMDB00725 C5H9NO3 Fingerprint C
68 aspartate HMDB00191 C4H7NO4 Fingerprint A
Table 4‐3: Identified metabolites from the internal and external metabolome of dithranol treated HaCaT cells. The majority of metabolites were identified solely within the internal metabolome (indicated in black) while five metabolites were recorded in the external metabolome. A reference number corresponding to the human metabolome database and the chemical formula is given. The correlation group number is supplied for internal metabolites as discussed in Section 4.3.4.1. Metabolite ID’s labelled with a * highlight multiple derivatisation products.
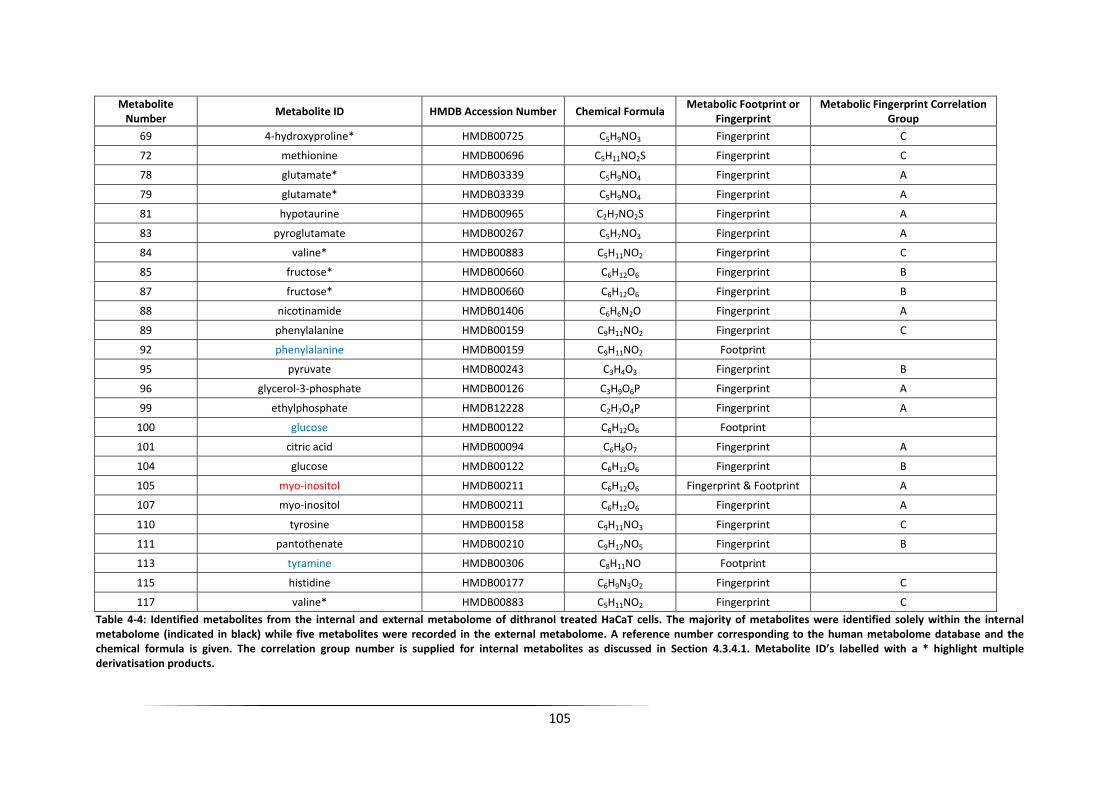
105
Metabolite Number
Metabolite ID HMDB Accession Number Chemical Formula Metabolic Footprint or
Fingerprint Metabolic Fingerprint Correlation
Group
69 4‐hydroxyproline* HMDB00725 C5H9NO3 Fingerprint C
72 methionine HMDB00696 C5H11NO2S Fingerprint C
78 glutamate* HMDB03339 C5H9NO4 Fingerprint A
79 glutamate* HMDB03339 C5H9NO4 Fingerprint A
81 hypotaurine HMDB00965 C2H7NO2S Fingerprint A
83 pyroglutamate HMDB00267 C5H7NO3 Fingerprint A
84 valine* HMDB00883 C5H11NO2 Fingerprint C
85 fructose* HMDB00660 C6H12O6 Fingerprint B
87 fructose* HMDB00660 C6H12O6 Fingerprint B
88 nicotinamide HMDB01406 C6H6N2O Fingerprint A
89 phenylalanine HMDB00159 C9H11NO2 Fingerprint C
92 phenylalanine HMDB00159 C9H11NO2 Footprint
95 pyruvate HMDB00243 C3H4O3 Fingerprint B
96 glycerol‐3‐phosphate HMDB00126 C3H9O6P Fingerprint A
99 ethylphosphate HMDB12228 C2H7O4P Fingerprint A
100 glucose HMDB00122 C6H12O6 Footprint
101 citric acid HMDB00094 C6H8O7 Fingerprint A
104 glucose HMDB00122 C6H12O6 Fingerprint B
105 myo‐inositol HMDB00211 C6H12O6 Fingerprint & Footprint A
107 myo‐inositol HMDB00211 C6H12O6 Fingerprint A
110 tyrosine HMDB00158 C9H11NO3 Fingerprint C
111 pantothenate HMDB00210 C9H17NO5 Fingerprint B
113 tyramine HMDB00306 C8H11NO Footprint
115 histidine HMDB00177 C6H9N3O2 Fingerprint C
117 valine* HMDB00883 C5H11NO2 Fingerprint C
Table 4‐4: Identified metabolites from the internal and external metabolome of dithranol treated HaCaT cells. The majority of metabolites were identified solely within the internal metabolome (indicated in black) while five metabolites were recorded in the external metabolome. A reference number corresponding to the human metabolome database and the chemical formula is given. The correlation group number is supplied for internal metabolites as discussed in Section 4.3.4.1. Metabolite ID’s labelled with a * highlight multiple derivatisation products.

106
Table 4‐5: Identified metabolites from the internal and external metabolome of methotrexate and ciclosporin treated HaCaT cells. A reference number corresponding to the human metabolome database, the chemical formula and corresponding p values supplied for all metabolites. Metabolite ID’s labelled with a * highlight multiple derivatisation products.
Metabolite Number Metabolite ID HMBD Assession Number Chemical Formula Fingerprint or Footprint
Methotrexate
2 Valine HMDB00883 C5H11NO2 Footprint
6 myo‐inositol * HMDB00211 C6H12O6 Footprint
8 myo‐inositol* HMDB00211 C6H12O6 Footprint
9 pyridoxine HMDB00239 C8H11NO3 Footprint
15 pantothenate HMDB00210 C9H17NO5 Fingerprint
46 norvaline Footprint
53 monopalmitin* HMDB00220 C16H32O2 Fingerprint
62 monopalmitin* HMDB00220 C16H32O2 Fingerprint
68 leucine* HMDB00687 C6H13NO2 Footprint
70 monostearin HMDB00827 C18H36O2 Footprint
70 monostearin HMDB00827 C18H36O2 Fingerprint
75 glycerol HMDB00131 C3H8O3 Footprint
76 isoleucine HMDB00172 C6H13NO2 Footprint
77 leucine* HMDB00687 C6H13NO2 Footprint
87 serine* HMDB03406 C3H7NO3 Footprint
89 glyceric acid HMDB00139 C3H6O4 Footprint
91 threonine HMDB00167 C4H9NO3 Footprint
91 threonine HMDB00167 C4H9NO3 Fingerprint
92 serine* HMDB03406 C3H7NO3 Footprint
104 proline HMDB00162 C5H9NO2 Footprint
105 threitol/erythritol HMDB04136/HMDB02994 C4H10O4 Footprint
105 threitol/erthritol HMDB04136/HMDB02994 C4H10O4 Fingerprint
111 p‐benzoquinone HMDB03364 C6H4O2 Footprint
113 threonic acid/erthronic acid HMDB00943/HMDB00613 C4H8O5 Footprint
113 threonic acid/erythronic acid HMDB00943/HMDB00613 C4H8O5 Fingerprint
115 4‐hydroxyproline HMDB00725 C5H9NO3 Footprint
121 3‐hydroxybutanoic acid HMDB00357 C4H8O3 Fingerprint
125 methionine* HMDB00696 C5H11NO2S Footprint
127 methionine* HMDB00696 C5H11NO2S Footprint
136 creatine HMDB00064 C4H9N3O2 Footprint
140 alanine HMDB00161 C3H7NO2 Footprint
141 pyroglutamic acid HMDB00267 C5H7NO3 Fingerprint
150 fructose HMDB00660 C6H12O6 Fingerprint
151 glycine HMDB00123 C2H5NO2 Footprint
152 glycerol‐3‐phosphate HMDB00126 C3H9O6P Fingerprint
Ciclosporin17 hexadeconoic acid HMDB00220 C16H32O2 Fingerprint
44 glucose‐6‐phosphate HMDB01401 C6H13O9P Fingerprint
83 glycine HMDB00123 C2H5NO2 Fingerprint
92 serine HMDB03406 C3H7NO3 Fingerprint
94 threonine HMDB00167 C4H9NO3 Footprint

107
4.3.4 Spring embedded correlation analysis.
Spring embedded correlation analysis was applied to the data corresponding to the metabolite
peaks which were judged to be significant (p value< 0.05). Correlation analysis was employed to
illustrate similarities and variances in the metabolite response to the exposed drug. A major
advantage of this type of analysis is the simplistic schematic manner in which the results are shown.
In the correlation plots (see below) metabolite peaks are represented as circles which are labelled
for identification purposes with the metabolite feature index identification number as illustrated in
the previous collection of ANOVA scatter plots and identification tables. The size of the circle is
representative of the significance of the metabolite peak: the larger the circle the lower the p value
associated with the peak and hence the more significance of its presence and vice versa. The
correlation between metabolites is illustrated by the “spring” element of the plot. The lines or
springs link metabolites that are closely correlated. A value is associated with each line which
quantifies the level of correlation. The closer the value to 1 the more closely correlated the
metabolites are in relationship to each other.
4.3.4.1 Dithranol Fingerprint
The spring embedded correlation plot for the internal metabolome of dithranol treated HaCaT cells
shows the 75 significant peaks clustered into three distinct groups as illustrated in Figure 4‐8.
The classification of metabolites into the three groups infers that there are variations in response to
drug application within the intracellular metabolome of the cells. Figure 4‐9 illustrates the typical
response exhibited within the three groups; A, B and C. The box and whisker diagrams show
dithranol concentration (µg/ mL) versus % peak area for a chosen metabolite from each correlation
group and all other metabolites within that group exhibited very similar results.

108
The trend within group A is demonstrated by the response of metabolite feature 63: malate. The
metabolite concentration decreases more or less linearly as the concentration of dithranol increases
and hence appears to exhibit a down regulated response to the drug.
Group B response is represented by metabolite feature 11: unknown. In response to increasing
dithranol concentration the metabolite concentration increases. A slight increase is observed
between 0.1 and 0.3 µg/ mL followed by a sharp increase above 0.4 µg/ mL.
Metabolite feature 48 , serine; illustrates the parabolic trend associated with group C. Groups B
and C consist of an element of common linkage and resultantly shows an increase in metabolite
concentration as dithranol concentration increases; although for group C the increase in metabolite
concentration is observed much earlier at 0.1 and 0.3 µg/ mL. However in comparison to group B
metabolites, a decrease in recorded concentration of the metabolite occurs at 0.4 and 0.5 µg/ mL.

109
Figure 4‐8: Spring embedded correlation plot for the analysis of the internal metabolome of dithranol treated HaCaT cells. The metabolite peaks are represented by the circles and the number within the circle is the metabolite ID. The larger the circle the more significant the metabolite was determined to be by ANOVA analysis. The links shown between metabolites illustrate the correlations present, the magnitude of which is shown by the number. The nearer the number is to 1 the greater the degree of correlation.
Group B
Group A
Group C

110
Figure 4‐9: Box and whisker plots of dithranol concentration (µg/ mL) vs. % peak area to illustrate the general trends observed from the correlation analysis for groups A, B and C.
0
0.05
0.1
0.15
0.2
0.25
0 0.1 0.2 0.3 0.4 0.5Dithranol Concentration: ug/ml
% P
eak
Are
a
Group A: Metabolite 63
-0.2
0
0.2
0.4
0.6
0.8
1
1.2
1.4
0 0.1 0.2 0.3 0.4 0.5Dithranol Concentration: ug/ml
% P
eak
Are
a
Group B: Metabolite 11
0
0.5
1
1.5
2
0 0.1 0.2 0.3 0.4 0.5Dithranol Concentration: ug/ml
% P
eak
Are
a
Group C: Metabolite 48
Box and whisker plots provide a
descriptive summary of the spread of
replicate results. The upper and lower
whiskers illustrate the sample maximum
and sample minimum of the data
respectively. The box represents the
upper (75th percentile) and lower (25th
percentile) quartiles of the data and the
middle line indicates the median data
value.
Group A metabolites show a gradual
decrease over the concentration range of
applied dithranol as observed for
metabolite 63: malate.
Group B metabolites increase as the
concentration of dithranol exposure
increases as demonstrated by metabolite
11: unknown.
Group C metabolites demonstrate an
initial increase followed by a decrease at
the higher concentrations of dithranol
exposure. This trend is exhibited by
metabolite 48: serine.
Malate
Unknown
Serine

111
4.3.4.2 Dithranol Footprint
The spring embedded correlation analysis plot constructed from the metabolites deemed significant
within the external metabolome of dithranol treated cells is illustrated below in Figure 4‐10.
Figure 4‐10: Spring embedded correlation plot for the analysis of the external metabolome of dithranol treated HaCaT cells. The metabolite peaks are represented by the circles and the number within the circle is the metabolite ID. The larger the circle the more significant the metabolite was determined to be by ANOVA analysis. The links shown between metabolites illustrate the correlations present, the magnitude of which is shown by the number. The nearer the number is to 1 the greater the degree of correlation.
The correlation plot generated for the external metabolome of dithranol treated cells indicated a
limited number of correlations between metabolites. Metabolite 113: Tyramine is a central hub
within the plot while metabolites 62 (unknown), 100 (glucose) and 109 (unknown) are the most
significant metabolites present. Box and whisker diagrams were plotted for these metabolites and
are presented within Figure 4‐11. Tyramine shows a large increase upon exposure to 0.2 µg/ mL of
dithranol a trend which is also exhibited by the unknown metabolites 62 and 109. The trend
exhibited by glucose is highly variable with minimal correlation, at the mid concentration range (0.1‐
0.4 µg/ mL) at least one replicate sample has recorded zero glucose present. The overall trends

112
observed within the dithranol footprint samples are of a lesser magnitude to those from the
fingerprint analysis which as previously stated could be attributed to the interference of the media
in masking metabolite responses.
Figure 4‐11: Box and whisker diagrams correlating to metabolites 113, 62, 100 and 109 showing dithranol exposure concentration (µg/ mL) vs. % peak area for the external metabolome.
4.3.4.3 Methotrexate Fingerprint
The spring embedded correlation plot for the analysis of the internal metabolome of methotrexate
treated HaCaT cells is shown in Figure 4‐12. The metabolites deemed significant correlate into two
loosely connected groups which contain metabolites of ranging significance. The group clustered on
the right hand side contains 10 metabolites including metabolites 62 (monopalmitin),
1
1.5
2
2.5
3
3.5
4
4.5
0 0.1 0.2 0.3 0.4 0.5Dithranol Concentration: ug/ml
% P
eak
Are
a
Metabolite 113
0
0.02
0.04
0.06
0.08
0.1
0.12
0.14
0.16
0 0.1 0.2 0.3 0.4 0.5Concentration: ug/ml
% P
eak
Are
a
Metabolite 62
0
0.05
0.1
0.15
0.2
0.25
0.3
0 0.1 0.2 0.3 0.4 0.5Concentration: ug/ml
% P
eak
Are
a
Metabolite 100
0.05
0.1
0.15
0.2
0.25
0 0.1 0.2 0.3 0.4 0.5Concentration: ug/ml
% P
eak
Are
a
Metabolite 109
Tyramine Unknown
UnknownGlucose

113
70 (monostearin) and 134 (unknown) which are high in significance. Box and whisker plots for these
metabolites which indicate response to methotrexate are shown in Figure 4‐13. These metabolites
exhibit an up regulated response to the application of methotrexate.
Figure 4‐12: Spring embedded correlation plot for the analysis of the internal metabolome of methotrexate treated HaCaT cells. The metabolite peaks are represented by the circles and the number within the circle is the metabolite ID. The larger the circle the more significant the metabolite was determined to be by ANOVA analysis. The links shown between metabolites illustrate the correlations present, the magnitude of which is shown by the number. The nearer the number is to 1 the greater the degree of correlation.
The metabolites which cluster on the left hand of the spring embedded plot include metabolites 57
(unknown), 113 (threonic acid/erythronic acid) and 150 (fructose) which are of the highest
significance and 105 (threitol/erythritol) as a central linker in the cluster of metabolites. Box and
whisker plots illustrating the response of these metabolites to increasing concentrations of
methotrexate are depicted in Figure 4‐13. The trend exhibited by the metabolites correlated on the
left hand side of Figure 4‐12 is less consistent than those previously discussed from the right hand
group and their significance could be questioned.

114
0
0.02
0.04
0.06
0.08
0.1
0.12
0.14
0.16
0 1 2 3 4 5Methotrexate Concentration: 10-7M
% P
eak
Are
aMetabolite 62
-0.1
-0.05
0
0.05
0.1
0.15
0.2
0.25
0.3
0 1 2 3 4 5Methotrexate Concentration: 10-7M
% P
eak
Are
a
Metabolite 70
-0.005
0
0.005
0.01
0.015
0.02
0.025
0.03
0.035
0.04
0 1 2 3 4 5Methotrexate Concentration: 10-7M
% P
eak
Are
a
Metabolite 134
0
0.02
0.04
0.06
0.08
0.1
0.12
0.14
0.16
0.18
0.2
0 1 2 3 4 5Methotrexate Concentration: 10-7M
% P
eak
Are
a
Metabolite 57
0
0.01
0.02
0.03
0.04
0.05
0.06
0.07
0.08
0.09
0 1 2 3 4 5Methotrexate Concentration: 10-7M
% P
eak
Are
a
Metabolite 113
-0.2
-0.1
0
0.1
0.2
0.3
0.4
0 1 2 3 4 5Methotrexate Concentration: 10-7M
% P
eak
Are
a
Metabolite 150
0
0.05
0.1
0.15
0.2
0.25
0.3
0.35
0.4
0 1 2 3 4 5Methotrexate Concentration: 10-7M
% P
eak
Are
a
Metabolite 105
Figure 4‐13: Box and whisker plots to illustrate the effect of methotrexate exposure within the internal metabolome of HaCaT cells. Metabolites 62, 70, 134 were selected from within the right hand side of the correlation plot while metabolites 57, 113, 150 and 105 were selected from the left hand side.
monopalmitin monostearin
Unknown Unknown
threonic acid/erythronic acid Fructose
threitol/erythritol

115
4.3.4.4 Methotrexate Footprint
The 59 significant metabolites obtained from the metabolic footprint of methotrexate treated HaCaT
cells were subjected to correlation analysis. The metabolites largely cluster into one highly
correlated group, while the remaining metabolites form a loosely connected network, Figure 4‐14.
The most significant metabolite within the large group is metabolite 119; other metabolites of high
significance include metabolites 54 (unknown), 71 (unknown), 75 (glycerol) and 123 (unknown).
Figure 4‐15 indicates the changes in concentration of these metabolites at varying levels of
methotrexate exposure. As the most significant metabolite, metabolite 119 (unknown) shows a
minor decrease in mean peak area as the concentration of drug exposure increases. Large
fluctuations are recorded within the three replicate samples at 2 and 5 x10‐7M which could indicate a
varying biological effect.
Metabolites 54 (unknown) and 75 (unknown) exhibit the large fluctuations amongst replicates at 2
and 5 x10‐7M exposure however while metabolite 54 (unknown) shows a general decrease as
concentration increases, metabolite 75 (unknown) remains relatively constant with proportional
down‐regulation at 4 x10‐7M. Metabolites 71 (unknown) and 123 (unknown) show similar responses.
An initial increase in concentration is observed between 1‐3 x10‐7M followed by a decrease at
4 x10‐7M. In comparison to the previously mentioned metabolites, metabolites 71 and 123 show
large fluctuations between replicates at 4 x10‐7M which could be a response to the fluctuations
mentioned above.

116
Figure 4‐14: Spring embedded correlation plot for the analysis of the metabolic footprint of methotrexate treated HaCaT cells. The metabolite peaks are represented by the circles and the number within the circle is the metabolite ID. The larger the circle the more significant the metabolite was determined to be by ANOVA analysis. The links shown between metabolites illustrate the correlations present, the magnitude of which is shown by the number. The nearer the number is to 1 the greater the degree of correlation.
Metabolites 127 (methionine) and 151 (glycine) chosen as representatives of the smaller group
within the correlation analysis show an increase in concentration between 0‐4 x10‐7M of
methotrexate application. This trend is followed by a sharp decrease at 5 x10‐7M. A number of
fluctuations between replicate samples are observed in particular at 2 and 5 x10‐7M. The final
representative metabolite is metabolite 134 (unknown) which is non‐correlated within the spring
embedded correlation plot. This metabolite remains relatively stable at 0‐2 x10‐7M followed by a
sharp decrease at 4 x10‐7M. The overall concentration increases at 5x10‐7M.

117
-0.1
-0.05
0
0.05
0.1
0.15
0.2
0.25
0.3
0 1 2 3 4 5Methotrexate Concentration: 10-7M
% P
eak
Are
aMetabolite 119
0.04
0.06
0.08
0.1
0.12
0.14
0.16
0.18
0 1 2 3 4 5Methotrexate Concentration: 10-7M
% P
eak
Are
a
Metabolite 54
0.2
0.25
0.3
0.35
0.4
0.45
0.5
0.55
0.6
0 1 2 3 4 5Methotrexate Concentration: 10-7M
% P
eak
Are
a
Metabolite 71
0.1
0.12
0.14
0.16
0.18
0.2
0 1 2 3 4 5Methotrexate Concentration: 10-7M
% P
eak
Are
a
Metabolite 75
0.08
0.1
0.12
0.14
0.16
0.18
0.2
0 1 2 3 4 5Methotrexate Concentration: 10-7M
% P
eak
Are
a
Metabolite 123
0.2
0.3
0.4
0.5
0.6
0.7
0.8
0 1 2 3 4 5Methotrexate Concentration: 10-7M
% P
eak
Are
a
Metabolite 127
0.15
0.2
0.25
0.3
0.35
0.4
0.45
0.5
0 1 2 3 4 5Methotrexate Concentration: 10-7M
% P
eak
Are
a
Metabolite 151
0.05
0.1
0.15
0.2
0.25
0.3
0 1 2 3 4 5Methotrexate Concentration: 10-7M
% P
eak
Are
a
Metabolite 134
Figure 4‐15: Box and whisker plots to illustrate the effect of methotrexate exposure within the metabolic footprint of HaCaT cells.
Metabolite 119 is depicted as the most significant metabolite within the correlation analysis and shows a gradual decrease over concentration increase. Large fluctuations are observed at 2 & 5 x10‐7 M.
The other metabolites exhibit varying responses to methotrexate exposure.
Unknown Unknown
Unknown
Unknown
Unknown
Methionine
Glycerol
Glycine

118
4.3.4.5 Ciclosporin Fingerprint
As a consequence of the limited number of metabolites deemed significant for the fingerprint
analysis of ciclosporin treated cells, the correlation plot shown in Figure 4‐16 is very limited in
information. The majority of metabolites which were deemed significant remained unidentified with
the exception of metabolite 83 which was identified as glycine. Metabolites 7, 83, 100 and 134 were
chosen as example metabolites and box and whisker plots were generated which are shown in
Figure 4‐17.
Figure 4‐16: Spring embedded correlation plot for the analysis of the internal metabolome of ciclosporin treated HaCaT cells. The metabolite peaks are represented by the circles and the number within the circle is the metabolite ID. The larger the circle the more significant the metabolite was determined to be by ANOVA analysis. The links shown between metabolites illustrate the correlations present, the magnitude of which is shown by the number. The nearer the number is to 1 the greater the degree of correlation.
The metabolites exhibit varying responses to the drug. Metabolites 7 and 134 increase steadily in
concentration until 2x10‐7M, and follow by a notable decrease in concentration at 2.5x10‐7M. In
comparison metabolite 83 increases slightly and plateaus over the drug exposure range. Metabolite
100 reaches the highest concentration at 1.5x10‐7M and decreases slightly thereafter.

119
Figure 4‐17: Box and whisker plots to illustrate the affect of ciclosporin exposure within the internal metabolome of HaCaT cells. Metabolites 7, 83, 100 and 134 were chosen as example metabolites. The metabolites exhibit varying responses to the drug. Metabolites 7 and 134 increase steadily in concentration until 2x10‐7M, and follow by a notable decrease in concentration at 2.5x10‐7M. In comparison metabolite 83 increases slightly and plateaus over the drug exposure range. Metabolite 100 reaches the highest concentration at 1.5x10‐7M and decreases slightly thereafter.
4.3.4.6 Ciclosporin Footprint
The spring embedded correlation plot for the metabolic footprint of HaCaT cells treated with
ciclosporin displayed in Figure 4‐18 also incorporates a limited number of metabolites. However the
metabolites presented exhibit a trend upon exposure to the drug. An increase in metabolite
concentration is observed between 0‐1x10‐7M exposures to reach a plateau at 1x10‐7M. All
metabolites present within the correlation plot remained unidentified. Metabolites 28, 32 and 120
subsequently decrease in concentration following an almost linear reduction from 1‐2.5x10‐7M.
0
0.5
1
1.5
2
2.5
0 0.5 1 1.5 2 2.5Cyclosporine Concentration: 10-7M
% P
eak
Are
aMetabolite 7
-1
0
1
2
3
4
5
6
7
8
0 0.5 1 1.5 2 2.5Cyclosporine Concentration: 10-7M
% P
eak
Are
a
Metabolite 83
-0.02
0
0.02
0.04
0.06
0.08
0.1
0.12
0.14
0 0.5 1 1.5 2 2.5Cyclosporine Concentration: 10-7M
% P
eak
Are
a
Metabolite 100
-0.01
0
0.01
0.02
0.03
0.04
0.05
0.06
0.07
0.08
0 0.5 1 1.5 2 2.5Cyclosporine Concentration: 10-7M
% P
eak
Are
a
Metabolite 134
Unknown
Unknown Unknown
Glycine

120
Metabolite 135 also shows a decrease in concentration from 1x10‐7M however, the box and whisker
plot is distorted due to the inclusion of zero values in some replicate samples. This information is
displayed in Figure 4‐19.
Figure 4‐18: Spring embedded correlation plot for the analysis of the metabolic footprint of ciclosporin treated HaCaT cells. The metabolite peaks are represented by the circles and the number within the circle is the metabolite ID. The larger the circle the more significant the metabolite was determined to be by ANOVA analysis. The links shown between metabolites illustrate the correlations present, the magnitude of which is shown by the number. The nearer the number is to 1 the greater the degree of correlation.

121
Figure 4‐19: Box and Whisker plots for metabolites 28, 32, 120 and 135 to illustrate a degree of metabolic response to ciclosporin exposure within the metabolic footprint. All metabolites show a positive response to initial treatment through an increase in concentration between 0‐1x10‐7 M followed by a decrease in concentration between 1‐2.5x10‐7 M.
4.3.5 Dithranol Interpretation
As a consequence of the large number of metabolites identified for the dithranol treated cells it
would be unrealistic to interpret individual box and whisker plots for each metabolite without the
inclusion of additional biochemical information. It was for this reason that a metabolic map
illustrated in Figure 4‐20 was constructed utilising information gained from within the KEGG
database.
-0.05
0
0.05
0.1
0.15
0.2
0 0.5 1 1.5 2 2.5Cyclosporine Concentration: 10-7M
% P
eak
Are
aMetabolite 28
0
0.02
0.04
0.06
0.08
0.1
0 0.5 1 1.5 2 2.5Cyclosporine Concentration: 10-7M
% P
eak
Are
a
Metabolite 32
-0.1
-0.05
0
0.05
0.1
0.15
0.2
0.25
0.3
0.35
0 0.5 1 1.5 2 2.5Cyclosporine Concentration: 10-7M
% P
eak
Are
a
Metabolite 120
-0.05
0
0.05
0.1
0.15
0 0.5 1 1.5 2 2.5Cyclosporine Concentration: 10-7M
% P
eak
Are
a
Metabolite 135
Unknown Unknown
Unknown Unknown

122
The metabolite map presents a series of metabolites linked according to the biochemical steps
within their metabolism and degradation. The levels of several intermediates of central metabolism
were affected by exposure to dithranol including a number associated with the TCA cycle and amino
acid metabolism. The use of solid arrows indicates a direct linkage of metabolites while a dashed
arrow corresponds to a pathway including a limited number of undetected metabolites. The
metabolites in black are those which were successfully identified and those in red are included as a
reference. Metabolites highlighted in orange are metabolites which are actively present in the
DMEM growth media employed in the growth of the HaCaT cells. All box and whisker plots represent
metabolites detected in the internal metabolome unless highlighted accordingly, **. To
accommodate the multiple derivatisation products the metabolite feature which was deemed to
show the best trend response was incorporated into the metabolite map.
The concluding part of metabolite analysis is to begin to understand and interpret the role of these
metabolites that vary and are co‐correlated upon drug exposure. It is clearly evident from the results
discussed that dithranol has a pronounced affect on the metabolism of HaCaT cells, and it is
necessary to combine a priori literature based information with the current results to develop an
understanding of the mode of action of dithranol on psoriasis treatment.

123
Figure 4‐20: Constructed metabolite map to illustrate the affect of dithranol treatment of HaCaT cells.
The use of solid arrows indicates a direct linkage of metabolites while a dashed arrow corresponds to a pathway including a limited number of undetected metabolites.
The metabolites in black are those which were successfully identified and those in red are included as a reference. Metabolites highlighted in orange are metabolites which are actively present in the DMEM growth media employed in the growth of the HaCaT cells. All box and whisker plots represent metabolites detected in the internal metabolome unless highlighted accordingly, **.
Green features are provided for interest but are not metabolites.

124
As previously mentioned the mode of action of dithranol during anti‐psoriatic treatment is
not fully understood. One major theory is that dithranol accumulates in the mitochondria of
cells thus inhibiting mitochondrial oxidative respiration. Components of the respiratory
chain are reduced and hence ATP synthesis is restricted (McGill et al., 2005). As the TCA
cycle occurs within the mitochondrial matrix of cells, the down‐regulation of TCA
intermediates is anticipated and this is observed within the constructed metabolite
map, Figure 4‐20. It was relatively disappointing that the number of TCA intermediates
detected was low, however, the concentration of citrate significantly decreases at
0.2 µg/ mL and malate concentration decreases at 0.3 µg/mL. A collection of additional
metabolites exhibit a trend associated with this down‐regulation of TCA intermediates in
association with the increasing concentration of dithranol exposure. These metabolites
include nicotinamide, aspartate, glutamate, pyro‐glutamate, β‐alanine and hypotaurine, all
of which exhibit a similar decreasing trend in concentration as the concentration of drug
application increases.
Nicotinamide concentration decreases as the concentration of dithranol exposure increases.
Nicotinamide is a form of niacin, a vitamin B3, and has recently been implemented in a
number of new patents aimed at psoriasis treatment. However a publication by Lim and
colleagues indicated that within primary human neonatal skin fibroblasts (type 82‐6) an
increase in nicotinamide concentration greatly increased the rate of cell proliferation (Lim et
al., 2006). This result seems to correspond with our results that infer that through dithranol
exposure a decrease in cell proliferation would be observed and hence a decrease in
nicotinamide.
Nicotinamide metabolism is directly related to nicotinamide adenine dinucleotide (NAD+)
and nicotinamide adenine dinucleotide phosphate (NADP+). The response of NAD+ and
NADP+ to dithranol treatment has previously been discussed (Hammar, 1975). In the first
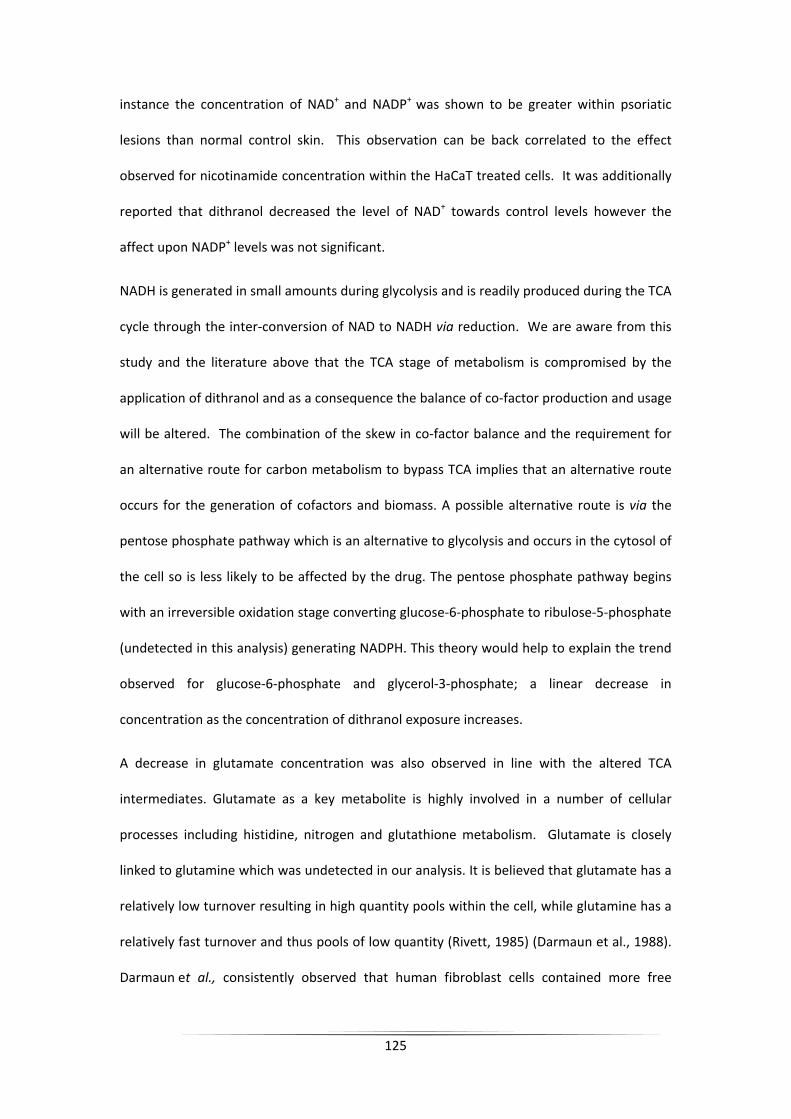
125
instance the concentration of NAD+ and NADP+ was shown to be greater within psoriatic
lesions than normal control skin. This observation can be back correlated to the effect
observed for nicotinamide concentration within the HaCaT treated cells. It was additionally
reported that dithranol decreased the level of NAD+ towards control levels however the
affect upon NADP+ levels was not significant.
NADH is generated in small amounts during glycolysis and is readily produced during the TCA
cycle through the inter‐conversion of NAD to NADH via reduction. We are aware from this
study and the literature above that the TCA stage of metabolism is compromised by the
application of dithranol and as a consequence the balance of co‐factor production and usage
will be altered. The combination of the skew in co‐factor balance and the requirement for
an alternative route for carbon metabolism to bypass TCA implies that an alternative route
occurs for the generation of cofactors and biomass. A possible alternative route is via the
pentose phosphate pathway which is an alternative to glycolysis and occurs in the cytosol of
the cell so is less likely to be affected by the drug. The pentose phosphate pathway begins
with an irreversible oxidation stage converting glucose‐6‐phosphate to ribulose‐5‐phosphate
(undetected in this analysis) generating NADPH. This theory would help to explain the trend
observed for glucose‐6‐phosphate and glycerol‐3‐phosphate; a linear decrease in
concentration as the concentration of dithranol exposure increases.
A decrease in glutamate concentration was also observed in line with the altered TCA
intermediates. Glutamate as a key metabolite is highly involved in a number of cellular
processes including histidine, nitrogen and glutathione metabolism. Glutamate is closely
linked to glutamine which was undetected in our analysis. It is believed that glutamate has a
relatively low turnover resulting in high quantity pools within the cell, while glutamine has a
relatively fast turnover and thus pools of low quantity (Rivett, 1985) (Darmaun et al., 1988).
Darmaun et al., consistently observed that human fibroblast cells contained more free
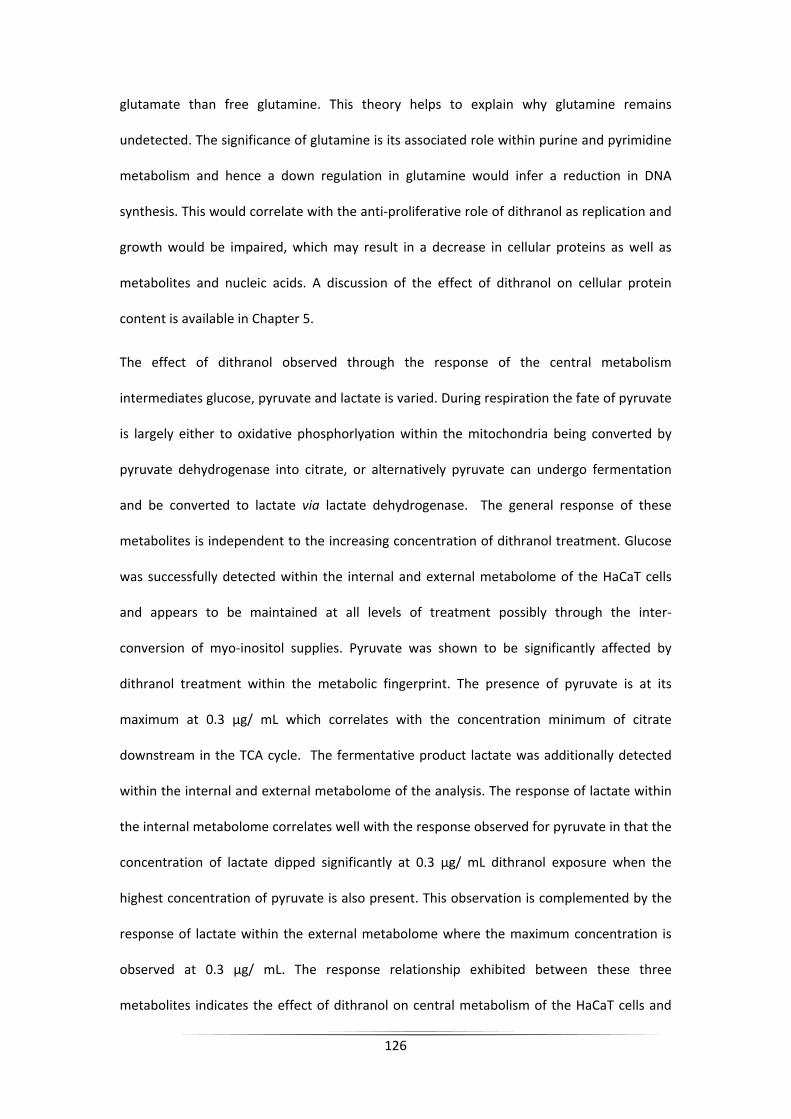
126
glutamate than free glutamine. This theory helps to explain why glutamine remains
undetected. The significance of glutamine is its associated role within purine and pyrimidine
metabolism and hence a down regulation in glutamine would infer a reduction in DNA
synthesis. This would correlate with the anti‐proliferative role of dithranol as replication and
growth would be impaired, which may result in a decrease in cellular proteins as well as
metabolites and nucleic acids. A discussion of the effect of dithranol on cellular protein
content is available in Chapter 5.
The effect of dithranol observed through the response of the central metabolism
intermediates glucose, pyruvate and lactate is varied. During respiration the fate of pyruvate
is largely either to oxidative phosphorlyation within the mitochondria being converted by
pyruvate dehydrogenase into citrate, or alternatively pyruvate can undergo fermentation
and be converted to lactate via lactate dehydrogenase. The general response of these
metabolites is independent to the increasing concentration of dithranol treatment. Glucose
was successfully detected within the internal and external metabolome of the HaCaT cells
and appears to be maintained at all levels of treatment possibly through the inter‐
conversion of myo‐inositol supplies. Pyruvate was shown to be significantly affected by
dithranol treatment within the metabolic fingerprint. The presence of pyruvate is at its
maximum at 0.3 µg/ mL which correlates with the concentration minimum of citrate
downstream in the TCA cycle. The fermentative product lactate was additionally detected
within the internal and external metabolome of the analysis. The response of lactate within
the internal metabolome correlates well with the response observed for pyruvate in that the
concentration of lactate dipped significantly at 0.3 µg/ mL dithranol exposure when the
highest concentration of pyruvate is also present. This observation is complemented by the
response of lactate within the external metabolome where the maximum concentration is
observed at 0.3 µg/ mL. The response relationship exhibited between these three
metabolites indicates the effect of dithranol on central metabolism of the HaCaT cells and

127
illustrates that the drug has successfully penetrated the cells, and again seems to be
targeting the mitochondria.
The results discussed above have partially confirmed the primary mode of action of
dithranol upon HaCaT cells through describing the alteration of the TCA cycle and additional
respiration linked metabolites. The metabolite map also indicates a response by a number of
amino acids which could provide a potential alternative route of action of the drug. As
building blocks for protein synthesis amino acid regulation or alteration could be deemed
influential in the treatment of psoriasis.
The amino acid metabolite tyrosine is of particular interest. The concentration of tyrosine
increases sharply from the control sample through to 0.3 µg/ mL dithranol exposure. This
rise is subsequently followed by a decrease at 0.4 and 0.5 µg/ mL. The down regulation of
phosphotyrosine within HaCaT cells has previously been reported upon exposure to
0.5 µg/ mL of dithranol. The intracellular concentration of phosphotyrosine was determined
by six independent assays and was reported to be 59% lower compared to cells cultured in
100% pure media (Ockenfels et al., 1995). The authors reported that this reduction in
intracellular phosphotyrosine may be one reason for the therapeutic effect of dithranol on
psoriasis.
Tyrosine can be directly linked to tyramine and phenylalanine within the metabolic map. The
external metabolome content of tyramine and phenylalanine is illustrated within the box
and whisker diagrams in Figure 4‐20 . The concentrations of these metabolites remain fairly
constant with the exception of a sharp increase at 0.2 µg/ mL. This increase can be
correlated to the step prior to the maximum concentration of tyrosine being recorded within
the internal metabolome. This could suggest the pathways are triggered in response to the
increasing cellular content of tyrosine. Interestingly the internal composition of

128
phenylalanine follows a trend greatly similar to that of tyrosine. This infers that the internal
and external metabolome is acting independently in this region of the metabolite map.
A collection of amino acids are found on the right hand side of the metabolite map including
the linked metabolites serine, glycine and threonine which originally branch from pyruvate
and leucine, isoleucine and valine which metabolise via 2‐oxobutanoate. These metabolites
with the exception of isoleucine exhibit a parabolic trend upon exposure to increasing
concentrations of dithranol. The parabolic trend associated with these amino acids indicates
a concentration maximum of 0.3 µg/ mL in the case of serine, threonine, leucine and valine;
and a concentration maximum of 0.2 µg/ mL for glycine. Isoleucine shows a negative
correlation to increasing dithranol concentration. These results provide evidence that
dithranol is altering the foundations of growth metabolism (in terms of precursors for
protein production) which successfully implies that dithranol is inhibiting growth. The
parabolic trend is somewhat difficult to explain. It is possible that at mid concentrations of
exposure the cells are able to retrieve supplies of these amino acids from the growth media
in a recovery type mechanism to replenish diminishing energy supplies. The variation in
response exhibited by isoleucine is unexplained and could incorporate a number of factors.
4.3.6 Methotrexate and Ciclosporin Interpretation
The results gained from the metabolomic analysis of methotrexate and ciclosporin treated
HaCaT cells are considerably less noteworthy than those found from the analysis of dithranol
treatment. The most accountable reason for this can be attributed to the variety and mode
of action of the drugs. These two drugs are immunosuppressant’s which are administered
systemically to patients and hence in hindsight it seems unlikely that we would observe a
notable change in metabolites which are detectable using GC‐MS analysis over a 24h period.
The observed cellular growth rate and cell viability was deemed unaffected during drug
exposure and the final cellular biomass recorded did not differ from the dithranol samples.

129
The target of these drugs is unlikely to be directly upon the keratinocyte cells but on
immune cells associated with the disease. This would give reason for the large variation in
the success of this experiment.
However in spite of this, we do have a limited number of metabolite features that have been
highlighted as being significantly affected by treatment and have been successfully
identified. The box and whisker plots have been individually assessed but in large the results
were deemed unworthy of individual discussion. The box and whisker plots generated are
available within Appendix A‐D.
4.4 Conclusion and Further work
The use of a metabolomics approach for the investigation of the mode of action of anti‐
psoriatic drugs has been deemed successful. The application of GC‐MS analysis has provided
information regarding the response of key metabolites located within the central
metabolism of HaCaT cells. The results generated for dithranol treated cells were of much
greater significance and magnitude than those received for methotrexate and ciclosporin
treated cells. This was attributed to the mode of action of the drugs; in that methotrexate
and ciclosporin are immuno‐regulators and hence observing an effect on metabolites would
seem unlikely. Moreover, these are administered either orally or intravenously.
Dithranol is usually administered as a topical agent and is applied directly to the skin of a
patient. In this capability we might expect to observe a direct response within HaCaT cells,
and this was indeed the case. A vast number of metabolites were deemed to be significantly
affected by dithranol treatment compared to controls when ANOVA analysis was conducted.
Correlation analysis of these significant metabolites classified these metabolites into three
distinct groups and upon production of representative box and whisker plots it was possible
to observe the individual trends of metabolites as the concentration of treatment increased.

130
These box and whisker plots were overlaid onto a metabolite map of central metabolism
and could be used to investigate the response of metabolism.
The approach supplies a list of metabolites which could potentially be used as indicators of
successful treatment. Dithranol is known to accumulate in the mitochondria of cells and
hence an effect on the concentration of glycolysis and TCA intermediates is expected. The
concentration of glucose 6‐phosphate, glycerol 3‐phosphate, citrate and malate show a
linear reduction in concentration as the concentration of dithranol increases. This response
is also observed for isoleucine, nicotinamide, aspartate and glutamate. An interesting
response was observed for a number of amino acids which provides evidence that dithranol
is altering the foundations of growth metabolism and hence implies that dithranol is
inhibiting internal growth mechanisms, despite the fact that growth rate was not altered.
Armed with the above knowledge a more targeted metabolite profiling approach could be
adopted to investigate dithranol treatment. This would attempt to detect and quantify
more accurately a larger number of glycolysis and TCA metabolites and hence expand and
validate the results displayed in the metabolite map.
In addition to the changes in metabolome detailed above, this work has established a
successful sampling protocol for the analysis of adherent mammalian cells by GC‐MS. It is
envisaged that this method is transferable and reproducible for the analysis of varying cell
lines and conditions and other group members have adopted this strategy.

131
Chapter 5: A proteomic‐based approach to investigate the response of HaCaT cells upon exposure to three well established anti‐psoriatic drugs.
5.1 Introduction
In a complementary approach to the work depicted in Chapter 4: the cellular response of
HaCaT cells to treatment by dithranol, methotrexate and ciclosporin exposure leading to
differences in the proteome was investigated. As previously stated there is limited
understanding regarding the precise mechanism of action of these anti‐psoriatic drugs and
therefore vital information may be gained through proteomic profiling, and combining this
knowledge with metabolomics. The initial stages of this work incorporated the use of 2D gel
electrophoresis; however, due to problems with gel reproducibility LC‐MS was ultimately
used for the generation of results.
5.2 Materials and Methods
5.2.1 Materials
Drug compounds and reagents were all purchased from Sigma Aldrich, Gillingham, UK unless
otherwise stated.
5.2.2 Methods
5.2.2.1 Cell Culture and Drug Exposure
The HaCaT cell culture protocol and method of drug exposure was conducted as detailed in
section 4.2.2.1 & 4.2.2.2.

132
5.2.2.2 Sample Collection
In a similar approach to metabolomic sample preparation, culture media was removed and
the cellular monolayer was washed with three applications of PBS (15 mL, room
temperature). To minimise the potential loss of any protein, extraction buffer (5 mL, 50 mM
Tris‐HCl pH 7.5, 750 mM NaCl, 4mM MgCl2 and 5mM DTT, room temperature) was added
directly to each flask and cells harvested by cell scraping. Extraction was conducted via 4
cycles of sonification (15 min) followed by centrifugation (5°C, 15 min, 16200g). The
supernatant was collected and stored at ‐80°C until further use.
5.2.2.3 Sample Clean Up
A sample clean up protocol was conducted employing the use of a ReadyPrep™ 2‐D Cleanup
Kit (Bio‐Rad Laboratories, Inc. Hercules, CA, USA). The procedure works by quantitatively
precipitating and concentrating proteins in a sample while leaving behind and subsequently
washing away substances including salts, nucleic acids and lipids. The inclusion of this step
helps to eliminate streaking and improve spot detection for 2D gel electrophoresis and can
help to minimise adduct formation in LC‐MS analysis.
In short; 100 µL of sample was transferred to a clean low bind microcentrifuge tube
(Eppendorf®). 300 µL of precipitating agent 1 was added, mixed well by vortexing and
incubated on ice for 15 min. Precipitating agent 2 (300 µL) was then added to the mixture,
vortexed and centrifuged at 16200g for 5 min. The supernatant was removed and a series of
wash steps performed. Firstly 40 µL of wash reagent 1 was added to the pellet, centrifuged
at 13000 rpm for 5 min and the wash removed. To the protein pellet, 25 µL of HPLC grade
water was added and vortexed to ensure thorough mixing. Finally 1 mL of wash reagent 2
(with added additive) was added, vortexed briefly and incubated at ‐20°C for 30 min. After
the incubation period the sample was centrifuged at 13000 rpm for 5 min and the

133
consequent supernatant removed. The pellet was re‐suspended in 1mL of rehydration buffer
(8M Urea / 0.5% CHAPS / 10mM DTT / 0.2% biolyte ampholytes).
5.2.2.4 Protein Quantification
It was necessary to quantify the amount of protein present within the cellular extracts of
treated cells to ensure that no bias was introduced due to biomass. A RC‐DC protein assay
(Bio‐Rad Laboratories, Inc. Hercules, CA, USA) was employed for protein quantification. The
standard protocol was as follows. In brief, 5 µL of DC reagent S was added to each 250 µL of
DC reagent A which would be needed for each run; i.e., for 18 samples corresponding to 1
drug exposure 65 µL of DC reagent S was added to 3250 µL of DC reagent A. This solution
was referred to as reagent A’.
A number of protein standards were prepared through serial dilution of serum albumin
stock of concentration 1.42 mg/ mL. Protein standards were 0.355, 0.710, 0.852, 1.065 and
1.42 mg/ mL diluted with rehydration buffer as above. 25 µL of samples and standards were
transferred into clean, dry microcentrifuge tubes and 125 µL of RC reagent 1 was added,
vortexed and incubated for 1 min at room temperature. 125 µL of RC reagent 2 was
subsequently added, vortexed thoroughly and centrifuged (16200g for 5 min). The
supernatant was completely removed and 127 µL of reagent A’ added and vortex mixed. The
sample was incubated at room temperature for 5 min to dissolve and remaining precipitate.
Finally 1 mL of DC reagent B was added, vortex mixed and incubated at room temperature
for 15 min. The absorbance maxima at 750 nm were recorded for all samples and the
resultant protein concentration extrapolated.

134
5.2.2.5 1D Gel Electrophoresis
5.2.2.5.1 Separating Buffer
A separating buffer was prepared by dissolving Tris Buffer (18.2 g) and SDS (0.4 g) into ddH20
(80 mL). The pH was adjusted to pH 8.8 by addition of HCl (5M). The volume was increased
to 100 mL by addition of ddH20. Separating buffer can be stored for up to 1 month; however
the pH should be checked.
5.2.2.5.2 Separating Gel
A 12% separating gel was composed of 40% Acrylamide (10 mL), separating buffer (8.34 mL),
ddH20 (14.82 mL), 10% ammonium persulphate (AMPS, 167 µL) and
tetramethylethylenediamine (TEMED, 17 µL).
5.2.2.5.3 Stacking Gel
A 4% stacking buffer was composed of 40% Acrylamide (2.5 mL), separating buffer (6.25 mL),
ddH20 (16.1 mL), 10% AMPS (125 µL) and TEMED (25 µL).
5.2.2.5.4 Pouring of Gel
Separating gel mixture was poured into the gel cassette until approximately two thirds of
the way to the top. A layer of butanol (50%) was added to ensure a straight edge was
achieved. The butanol was removed once the gel had set and the stacking gel mixture
added. A comb insert was added to form wells within the gel to allow application of sample.
Once the gel was set the comb was removed and the gel was ready for sample addition.
5.2.2.5.5 Sample Cracking
Cracking buffer was composed of Tris buffer (0.5M, 3.75 mL), SDS (0.6 g), glycerol (3.0 g),
DTT (0.154 g) and bromophenol blue (1%, 1 mL); made up to 10 mL at pH 6.6.

135
30 µL of each sample was added to 30 µL of cracking buffer, vortexed and heated at 98°C for
5 min. 20 µL of cracked sample was added to each well.
5.2.2.5.6 Running Buffer
Glycine (14.4 g), Tris buffer (3 g) and SDS (1 g) were dissolved in 800 mL of ddH20 to form a
running buffer solution.
5.2.2.5.7 Gel Running
The sample laden gel cassettes were placed into a running chamber and sufficient running
buffer added to cover the gels. Electrodes were connected and a current of 35 mA was
applied. This process was conducted until the blue colouration from the bromophenol blue
was seen to be ~ 1 cm away from the end of the gel.
5.2.2.6 2D Gel Electrophoresis
5.2.2.6.1 Rehydration of Immobilised pH Gradient (IPG) Strip and isoelectic
focussing.
Rehydration and isoelectric focussing was conducted using a PROTEAN IEF cell (Bio‐Rad
Laboratories, Inc. Hercules, CA, USA). An isoelectric focussing tray was used to actively
rehydrate the IPG strip (pH 7‐12) when the sample was maintained within rehydration
buffer. 600 µL of rehydration buffer containing sample was added to each channel within
the focussing tray. The IPG strip was removed from its plastic cover and placed gel side
down into the tray channels. To ensure complete coverage the strip was gently lowered into
the sample solution and slid from side to side making certain that no air bubbles were
introduced. The strip was aligned with the acidic (+) end at the anode and the basic (‐) end
at the cathode. An aliquot of mineral oil was applied to each channel containing an IPG strip,
ensuring that the strip was completely covered and the chamber was approximately half full.

136
The lid was reapplied to the isoelectric tray and the tray placed on the peltier platform
aligned with the electrode. The initial rehydration with the sample was conducted at 50 V,
20°C for 12 h.
Once rehydrated, wicks were placed between the IPG strip and the electrode to provide
protection from the high voltage to be applied. Addition mineral oil was overlayed to
completely cover the strips. The IEF cell was programmed and the isoelectric focussing
process started. The programme incorporated a conditioning step; 250 V, 20°C for 15 min
followed by a voltage ramp. The voltage ramp began at 250 V and ended at 4000 V over a
period of 2h at 20°C. The final focussing step was conducted at 4000 V, 20°C for 5h. The
sample is now separated in the 1st dimension according to pH.
IPG strips were stored at ~5°C for a maximum of 1 month prior to use.
5.2.2.6.2 Equilibration Buffer I
Prior to using the IPG strips it is necessary for them to be equilibrated in SDS based buffer.
Equilibration buffer I was prepared with urea (6M, 3.6 g), SDS (0.2 g), Tris HCl (0.375M, 2.5
mL, pH 8.8), glycerol (2 mL) and DTT (0.02 g) made up to 10 mL with ddH2O. Equilibration
buffer (2 mL) was added to the IPG strips, shaken, left for 10 min and removed.
5.2.2.6.3 Equilibration Buffer II
Equilibration II was prepared with urea (6M, 3.6 g), SDS (0.2 g), Tris‐HCl (0.375M, 2.5 mL, pH
8.8), glycerol (2 mL) and iodoacetamide (0.481 g) made up into 10 mL with ddH20.
Equilibration buffer (2 mL) was added to the IPG strip, shaken, left for 10 min and removed.

137
5.2.2.6.4 Gel Preparation and Running Procedure
The preparation of gel solutions for 2D analysis is highly similar to the details listed above for
the production of a 1D gel, however; for 2D gels the use of a stacking gel is not required. In
short a 12% separating gel was produced in larger quantities to that shown in Sections
5.2.2.5.1 & 5.2.2.5.2. The running buffer was as detailed in Section 5.2.2.5.6.
The gel solution was poured into the gel cassette until approximately 1 cm from the top.
Butanol (50%) was applied to ensure a straight gel edge was achieved. Once the gel was set
the butanol was removed and the IPG strip mounted on top of the gel. It was imperative
that the strip was placed in a straight manner and in direct contact with the gel. The strip
was overlaid and set in place with 1% lowmelt agarose containing bromophenol blue.
The gel cassette was placed within the running chamber and sufficient running buffer added.
The electrodes were attached and a constant current of 35 mA was applied. The procedure
was stopped when the bromophenol blue was ~ 1 cm from the bottom edge of the gel.
5.2.2.7 Coomassie Stain
All gels were stained using colloidal Coomassie staining. Dye stock solution was prepared by
adding phosphoric acid (13.52 mL) and ammonium sulphate (100 g) to ddH2O (800 mL) with
thorough mixing. While stirring Coomassie dye (1 g) was added and the solution made up to
1 L. The stock solution was left for at least 24 h before use. Dye working solution was
prepared by adding dye stock solution (80%) to methanol (20%) while stirring. The dye
working solution was always prepared directly before use.
5.2.2.8 Staining Procedure
All steps were performed on a shaking table at room temperature ensuring that the gel was
completely covered at each stage. The first stage of the procedure is the fixing of the gel. A
fixing solution of ethanol (40%), acetic acid (10%) and ddH2O (50%) was prepared and

138
applied to the gel for a minimum of 60 min. The gel was washed with water twice for a
period of 10 min then the Coomassie stain was applied. The stain was left for a minimum of
24 h. Finally the gel was washed with acetic acid (1%) until all Coomassie particles were
removed.
5.2.2.9 Visualisation of Gels
The gels were imaged using a Syngene Gene Genius bio imaging system (Syngene,
Cambridge, UK).
5.2.2.10 LC‐MS
5.2.2.10.1 Sample Preparation
Stock solutions of ammonium bicarbonate (Ambic/50 mM), Dithiothreitol (DTT/20 mM) and
Iodoacetamide (10 mM) were prepared immediately before the sampling protocol was
begun. 10 µL of extract (from 5.2.2.3) was added to 10 µL DTT (20 mM) and incubated at
56°C for 1 h. Upon cooling 20 µL of iodoacetamide was added and the sample was incubated
at room temperature for 30 min in the dark. An ampoule of lyophilised trypsin (20 µg) was
reconstituted with buffer (20 µL) and Ambic (180 µL) and 10 µL aliquots added to each
sample. Multiple ampoules of trypsin were used as required. The tryptic digest was left
overnight at 37°C.
5.2.2.10.2 Nano‐LC‐MS/MS
The digested samples were diluted 1/50 in 95% water/5% acetonitrile (MeCN)/0.1% formic
and resolved by LC‐MS using a nanoACQUITY chromatograph (Waters MS technologies,
Manchester, UK), coupled to an LTQ Orbitrap XL (Thermofisher Scientific, Bremen,
Germany), equipped with the manufacturer's nanospray source fitted with a PicoTip Emitter
(New Objective, MA, USA).

139
The sample temperature was maintained at 10°C, and 4 µL of sample was injected onto a
trapping column (Waters C18 180 μm X 20 mm), using the partial loop mode of injection, at
a flow rate of 18 μL/ min 95% A1/5% B1 (where A1 is 100% water/0.1% formic, and B1
corresponds to 100% MeCN/0.1%FA), prior to valve switching to the analytical column. The
analytical column (nanoACQUITY UPLC™ BEH C18 75 µm x 150 mm 1.7 µm column) was
maintained at a temperature of 35°C, and at a constant flow rate of 300 nL/ min. The
gradient conditions were as follows: 0.33 min ‐ 95% A1/5% B1, 30 min ‐ 50% B1, 31 min ‐
85% B1, 50 min, 95% A1/5% B1 (equilibration).
5.2.2.10.3 Mass Spectrometry
Full scan MS spectra (m/z 300‐1600) were acquired in an LTQ‐Orbitrap XL with the Orbitrap
operating at a resolution of 30,000 (defined at m/z 400) in data‐dependent mode. The top
five most intense ions from the MS1 scan were selected for tandem MS by collision induced
dissociation (CID) in the LTQ, at a normalized collision energy of 30%, and an activation q of
0.25. Dynamic exclusion was applied for duration of 30 s, with a repeat count of two and an
exclude duration width of 40 s, and all product ion spectra were acquired in the LTQ.
5.2.2.10.4 Data analysis
Data was searched with Sequest (version 28, rev. 12; Thermo Fisher Scientific Inc.) against
human‐specific version of the nrdb database. The digest enzyme was set to trypsin, fixed
modification of carbamidomethylation of cysteine and variable modification of methioinine
oxidisation were selected, and with peptide tolerance and fragment tolerance set to 2.0 Da
and 1.0 Da respectively. Utilising these criteria provided a list of proteins present within each
sample.

140
5.3 Results & Discussion
5.3.1 Protein Quantification
As detailed in Section 5.2.2.4 protein quantification was performed on all samples prior to
analysis via gel electrophoresis or LC‐MS.
The amount of protein was determined for all dithranol exposed cells used in this work. The
results shown below correspond to the samples analysed by LC‐MS but are highly similar to
other quantification results. A standard curve was produced of known protein
concentration vs. UV absorbance. Through the determination of the equation of the line as
shown in Figure 5.1 it is possible to estimate the concentration of protein within the samples
to be analysed (Table 5‐1).
Figure 5‐1: Protein quantification standard curve for dithranol treated HaCaT cells.
y = 0.2675x + 0.0569R² = 0.9769
0
0.05
0.1
0.15
0.2
0.25
0.3
0.35
0.4
0.45
0.5
0 0.2 0.4 0.6 0.8 1 1.2 1.4 1.6
Absorba
nce/Arbitary Units
Protein Concentration (mg/mL)

141
Three UV measurements were conducted per sample and the average UV absorbance is
shown in column two. Protein content was calculated for each replicate and the average
protein content was elucidated. The average protein content results clearly show that
dithranol is directly affecting the cellular protein content as a reduction is observed as the
concentration of dithranol increases.
Sample Name Average Absorbance Protein Content (mg/mL) Average Protein Content (mg/mL)
c1 0.267 0.785
c2 0.275 0.815 0.766
c3 0.244 0.698
0.1_1 0.181 0.465
0.1_2 0.219 0.607 0.573
0.1_3 0.230 0.646
0.2_1 0.220 0.610
0.2_2 0.199 0.531 0.575
0.2_3 0.213 0.584
0.3_1 0.244 0.699
0.3_2 0.158 0.377 0.489
0.3_3 0.162 0.392
0.4_1 0.165 0.405
0.4_2 0.126 0.257 0.313
0.4_3 0.131 0.277
0.5_1 0.094 0.137
0.5_2 0.067 0.037 0.074
0.5_3 0.070 0.048
Table 5‐1: A table to illustrate the protein content of HaCaT cells exposed to dithranol. The sample name prefix corresponds to the concentration of dithranol (µg/mL) or control (c). The sample name suffix corresponds to the replicate number.
The amount of protein was also determined for all methotrexate and ciclosporin exposed
cells, again the results shown correspond to the samples which were used for LC‐MS analysis
but they are indicative of all samples which were quantified. The results of protein
quantification are illustrated in Table 5‐2 and Table 5‐3. The estimated protein
quantification for methotrexate shows minimal change over the increasing concentration

142
range of drug exposure. This could imply that the drug is failing to penetrate the cell
membrane and hence little effect is recorded or that methotrexate alters the protein
content instead of diminishing it. Finally the amount of estimated protein recorded for
HaCaT cells exposed to ciclosporin showed a similar trend to that of methotrexate. The
lowest concentrations of ciclosporin exhibit minimal alteration of protein quantification in
comparison to the control sample; however at concentrations of 1.5x10‐7M upwards there is
a small reduction in protein content however this could be minimal in significance.
Sample Name Average
Absorbance Protein Content
(mg/mL) Average Protein Content
(mg/mL)
c1 0.239 0.759 c2 0.25 0.798 0.809 c3 0.27 0.869 1_1 0.258 0.827 1_2 0.229 0.724 0.801 1_3 0.265 0.852 2_1 0.273 0.880 2_2 0.267 0.859 0.865 2_3 0.266 0.855 3_1 0.301 0.979 3_2 0.169 0.511 0.826 3_3 0.303 0.986 4_1 0.271 0.873 4_2 0.089 0.228 0.612 4_3 0.232 0.735 5_1 0.272 0.876 5_2 0.252 0.805 0.893 5_3 0.306 0.997
Table 5‐2: A table to illustrate the protein content of HaCaT cells exposed to methotrexate. The sample name prefix corresponds to the concentration of methotrexate (x10‐7M) or control (c). The sample name suffix corresponds to the replicate number.

143
Sample Name Average
Absorbance Protein Content
(mg/mL) Average Protein Content
(mg/mL)
c1 0.286 0.875 c2 0.252 0.738 0.770 c3 0.242 0.697
0.5_1 0.248 0.721 0.5_2 0.232 0.657 0.701 0.5_3 0.249 0.726 1_1 0.284 0.867 1_2 0.242 0.697 0.797 1_3 0.274 0.826 1.5_1 0.219 0.605 1.5_2 0.271 0.814 0.683 1.5_3 0.225 0.629 2_1 0.246 0.713 2_2 0.23 0.649 0.668 2_3 0.228 0.641 2.5_1 0.214 0.584 2.5_2 0.226 0.633 0.648 2.5_3 0.249 0.726
Table 5‐3: A table to illustrate the protein content of HaCaT cells exposed to ciclosporin. The sample name prefix corresponds to the concentration of ciclosporin (x10‐7M) or control (c). The sample name suffix corresponds to the replicate number.

144
5.3.2 Gel Electrophoresis
The gel electrophoresis results were variable in their success. The major drawback
associated with the gel approach was the apparent lack of correlation between protein
quantification and density of proteins present on the gel. A 1D gel approach was employed
to check that protein was present in the sample; Figure 5‐2 is an example of a 1D gel
produced. This figure illustrates that sufficient protein appears to be present and that a wide
range of protein mass is incorporated.
Figure 5‐2: An example result for 1D gel electrophoresis analysis of the proteome of control HaCaT cells.
1D gels can not readily be used for protein quantification and identification so 2D gel
electrophoresis was undertaken; example images illustrating the 2D gel results are shown in
Figure 5.5.

Figurdithr
Whi
of p
varia
iden
prod
spot
norm
re 5‐3: 2D gel ranol treated, m
lst these ima
protein prese
ation betwe
ntification pr
duced from
ts when com
malisation p
M
electrophoresimethotrexate t
ages indicate
ent is minim
en the local
roblematic. A
the HaCaT c
mpared to
prior to anal
Methotrexat
is results illusttreated and a c
e that a degr
al. Moreove
isation of pr
Although the
cells treated
the control
ysis, this re
Control
te: 5 x 10‐7 M
145
trating the proiclosporin trea
ree of prote
er, in a comp
roteins withi
e amount of
with dithran
gel. Even
sult correlat
M
otein presence ted sample.
in separation
parative sens
n the gels, a
protein anal
nol shows a
taking in to
tes well wit
and localisatio
n was achiev
se it is possi
and this wou
lysed was eq
marked dec
o considerat
h the prote
Dit
Ciclospo
on within a co
ved, the qua
ible to see s
uld make pro
quivalent, th
crease in pro
tion the pro
in quantifica
hranol: 5µg/
rin: 2.5 x 10‐
ontrol,
ntity
some
otein
e gel
otein
otein
ation
/ mL
‐7 M

146
results previously discussed. In contrast the gels gained from the analysis of methotrexate
and ciclosporin treated cells are highly similar to that of the control. This again corresponds
well with the total protein quantification results.
Despite these general trends, the qualities of these gels (and the many others run) were
deemed of insufficient quality to be used for protein identification and quantification
purposes. The combination of this problem and the time taken in the production of gels
meant that it was decided that an alternative approach was necessary. It was at this stage
that the use of LC‐MS based analysis was incorporated.
5.3.3 LC‐MS Results
The results from LC‐MS analysis were obtained in Excel format upon being exported from
Sequest. An Excel file was retrieved for each individual sample: 18 individual Excel files per
drug corresponding to the 6 drug concentrations and the 3 replicate samples taken. The
Excel array included information regarding the individual peptides generated and the
subsequent matched protein identification name. As the results gained were qualitative
(protein detected or not) rather than quantitative, only the protein name was extracted
from the Excel file and used in further discussion. The protein ID list was alphabetised for
each sample and the three replicate data from each sample was manually mined to match
the presence or absence of the particular protein within these replicates. A selection criteria
was defined that required a protein to be present within at least two out of three replicates,
however a greater degree of confidence was associated with those proteins which were
successfully detected within all three replicates. This process was repeated for each
concentration of drug exposure; in that protein identifications were matched and the
presence or absence of these proteins at each concentration was noted. This process
generated a matrix of protein name vs. drug concentration colour coded to indicate the

pres
(red
Usin
as it
thro
dee
resp
5.3.
A to
dee
equ
add
varia
Figurregul
Up‐
sence of the
d) and thus cr
ng this appro
t was possibl
oughout the
med non sig
ponse of HaC
.3.1 Dithra
otal of 162 p
med to be
ivalent in th
ition 38% o
able over the
re 5‐4: Schemalated, deemed
‐Regulated4%
protein in a
reating a sco
oach it was p
le to assign w
concentrati
gnificant. It is
CaT cells to a
anol
roteins were
down‐regula
at they were
f proteins w
e concentrat
atic representaequivalent or
Not Significa38%
all three rep
oring system
possible to b
whether prot
on range or
s at this stag
nti‐psoriatic
e identified
ated and 4%
e present at
were classifi
tion range, a
ation indicatingnon significant
nt
Down‐Regulated
18%
147
licates (gree
.
begin to und
teins were u
exhibit a no
ge that it is p
treatment.
in the dithra
% up‐regulat
all concentr
ed as not s
nd did not c
g the proportiot within the pro
en), two repl
erstand the
up‐regulated,
on‐correlate
possible to b
anol treated
ted. A total
rations of th
significant as
orrelate with
on of proteins oteome of dith
Equivalent40%
icate (blue)
effect impos
, down regu
ed response
begin to prob
samples of
of 40% we
e drug and i
s their pres
h drug level.
which were uranol treated H
t
or less than
sed by the d
lated, equiva
and hence w
be the prote
which 18% w
ere shown to
in the contro
ence was h
up‐regulated, dHaCaT cells.
two
drugs
alent
were
eome
were
o be
ol. In
ighly
down‐

148
The proteins which were successfully identified within the internal proteome of dithranol
treated HaCaT cells vary greatly in their cellular role and function, and can be classified into
an array of groups.
Firstly there are a number of identified proteins which can be assigned as enzymes located
within central metabolism pathways and in particular glycolysis. These proteins are
summarised in Table 5‐4.
Protein Name EC Number C 0.1 0.2 0.3 0.4 0.5 Metabolism Location
argininosuccinate synthetase 1 6.3.4.5 Urea Cycle
cytosolic malate dehydrogenase 1.1.1.37 TCA
enolase 1 4.2.1.11 Glycolysis
enolase 2 4.2.1.11 Glycolysis
enolase 3 4.2.1.11 Glycolysis
fructose‐bisphosphate aldolase C 4.1.2.13 Glycolysis
glucose‐6‐phosphate isomerase 5.3.1.9 Glycolysis
glutathione transferase 2.5.1.18 Gluthionine Metabolism
glyceraldehyde‐3‐phosphate dehydrogenase 1.2.1.12 Glycolysis
isocitrate dehydrogenase 1 (NADP+), soluble 1.1.1.42 TCA
lactate dehydrogenase A 1.1.1.27 Glycolysis
lactate dehydrogenase B 1.1.1.27 Glycolysis
lactate dehydrogenase C 1.1.1.27 Glycolysis
phosphogluconate dehydrogenase 1.1.1.44 Pentose Phosphate Pathway
phosphoglycerate kinase 1 2.7.2.3 Glycolysis
phosphoglycerate kinase 2 2.7.2.3 Glycolysis
pyruvate kinase, liver and RBC isoform 1 2.7.1.40 Glycolysis
transaldolase 1 2.2.1.2 Pentose Phosphate Pathway
transketolase 2.2.1.1 Pentose Phosphate Pathway
triosephosphate isomerase 1 5.3.1.1 Glycolysis
Table 5‐4: Summary table illustrating the proteins identified within the proteome of dithranol treated HaCaT cells. The protein name, associated EC number and the metabolism location is provided. The colour scheme dictates the presence or omission of a protein at the given drug treatment concentration. Green implies that the protein was present within all three replicate samples, blue indicates that the protein was detected within two replicates and red indicates that the protein was not detected.
It is possible in a similar manner to the analysis of the metabolome data discussed in
Chapter 4: to reconstruct a metabolite map combining the enzyme information provided
within Table 5‐4. This metabolite map is shown in Figure 5‐5.

149
Figure 5‐5: Reconstructed metabolite map depicting the proteins (red italics) successfully identified within dithranol treated HaCaT cells and the corresponding linked metabolites (black normal font). Adjacent metabolites are linked with block lines while pathways with some metabolites omitted are linked with dashed lines. The presence of proteins over the concentration range is summarised within the box diagrams whereby green implies that the protein was present within all three replicate samples, blue indicates that the protein was detected within two replicates and red indicates that the protein was not detected. The control sample is the left hand box and the highest concentration the right hand box.
Glucose
Glucose‐6‐Phosphate
Fructose‐6‐Phosphate
Fructose‐1,6‐Bisphosphate
Glyceraldehyde‐3‐Phosphate
1,3‐Bisphospho‐D‐glycerate
3‐Phospho‐D‐glycerate
2‐Phospho‐D‐glycerate
Phosphoenolpyruvate
Lactate
Citrate
cis‐Aconitate
D‐isocitrate
α‐ketoglutarate
Succinyl‐CoA
Succinate
Fumarate
Malate
Oxaloacetate
Acetyl‐CoA
Pyruvate
Glycerone ‐Phosphate
6‐Phospho‐D‐gluconate
D‐Ribulose 5‐phosphate
D‐Ribose 5‐phosphate
D‐Xylulose 5‐phosphate
D‐Erythrose 4‐phosphate
Sedoheptulose7‐phosphate
glucose‐6‐phosphate isomerase
triosephosphate isomerase1
cytosolic malatedehydrogenase
Aspartate
argininosuccinate synthetase1
Enolase1Enolase2Enolase3
fructose‐bisphosphatealdolaseC
L‐Glutamate
Glutathione
glutathione S‐transferase
glyceraldehyde‐3‐phosphate dehydrogenase
isocitrate dehydrogenase 1 (NADP+), soluble
lactate dehydrogenase Alactate dehydrogenase Blactate dehydrogenase C
phosphogluconatedehydrogenase
phosphoglycerate kinase1
phosphoglycerate kinase2
Pyruvate kinase
transaldolase1 transketolase
cytosol

150
The metabolite map illustrates that a number of proteins located within central metabolism
are affected by dithranol treatment. The effect observed for phosphoglycerate kinase 2 and
enolase 2 & 3 is of particular interest. These enzymes are down‐regulated at the highest
concentrations of dithranol treatment and hence will lead to impaired glycolytic function.
This result could help to explain the decreasing presence of pyruvate at 0.4 & 0.5 µg/ mL
illustrated within the metabolite map shown in Figure 4‐20. The response observed for
lactate dehydrogenase is also of interest; lactate dehydrogenase A is down‐regulated at 0.4
& 0.5 µg/ mL dithranol treatment, lactate dehydrogenase B & C are initially of variable
presence within the three replicate samples, then become stable at mid‐range
concentrations and become down‐regulated at 0.4 µg/ mL. This is a variable response over
the concentration range of dithranol treatment and was also observed in the level of lactate
from metabolite measures (Figure 4‐20).The inclusion of the pentose phosphate enzymes is
an interesting feature as this pathway has been flagged as a possible route of metabolism
from the analysis of the metabolome data in Chapter 4:. The number of enzymes detected
within this cycle is limited however; the down‐regulation of transaldolase 1 is noteworthy.
Aside from the above proteins associated with central metabolism, there is a large array of
additional proteins that were identified within the dithranol treated HaCaT cells, and these
are summarised in Appendix E. A number of proteins were observed as being
down‐regulated upon exposure to dithranol treatment and could be placed into context
with what is known in the literature about these anti‐psoriasis drugs. These proteins are
summarised in Table 5‐5.

151
Protein Name C 0.1 0.2 0.3 0.4 0.5
acidic (leucine‐rich) nuclear phosphoprotein 32 family, member A
acidic (leucine‐rich) nuclear phosphoprotein 32 family, member B
albumin precursor
annexin 5
annexin 4
calmodulin 2
gelsolin‐like capping protein
S100 calcium binding protein A11
S100 calcium binding protein A14
tubulin, alpha, ubiquitous
tubulin, beta polypeptide
tubulin, beta, 2
Table 5‐5: Summary table illustrating additional identified proteins within the proteome of dithranol treated HaCaT cells. The colour scheme dictates the presence or omission of a protein at the given drug treatment concentration. Green implies that the protein was present within all three replicate samples, blue indicates that the protein was detected within two replicates and red indicates that the protein was not detected.
The members of the S100 protein family, A11 and A14, display potential down‐regulation
and down‐regulation at 0.5µg/ mL dithranol exposure respectively. The S100 family of
proteins is the largest sub‐set of proteins within the EF‐hand protein superfamily. S100
proteins are small, acidic proteins of 10‐12kDa and contain 2 distinct EF‐hands. Similarly to
most other EF‐hand proteins, S100 proteins act intracellularly as Ca2+ ‐signalling or Ca2+ ‐
buffering proteins. However, the most unusual characteristic of certain S100 proteins is their
occurrence in the extracellular space, where they act in a cytokine‐like manner (Marenholz
et al., 2004). These S100 proteins have been implemented in a number of potential roles in
epidermal wound repair, cancer, differentiation, and response to stress (Eckert et al., 2004).
S100 proteins are calcium‐responsive signalling proteins that are over‐expressed in cancer
and inflammatory diseases. They act by forming complexes with target proteins to modify
target protein function (Ruse et al., 2003).
A number of these S100 proteins have also been implemented in psoriasis. Broome et al.
(2003) provided a summary of the involvement of five of these S100 proteins in psoriasis.
S100A7 was found to be expressed in both normal and psoriatic epidermis; however levels

152
were markedly increased in psoriatic epidermis. It was postulated that this increased
expression could be related to the cytokine function of S100A7. The co‐expression of S100A8
and S100A9 was determined to be greatly over‐expressed in psoriasis. These proteins are
active as a heterodimer and hence co‐expression is common. In normal epidermis these
proteins are expressed at minimal levels. It was suggested that S100A8 and S100A9 may
have roles in promoting and/or responding to the hyper‐proliferative state observed in
psoriasis. The expression of S100A10 and S100A11 was not noted as different in normal or
psoriatic skin however their association with annexin molecules was noted (Broome et al.,
2003). Upon formation of heterodimers, S100A10 binds two copies of annexin II in a calcium
independent manner to form a heterotetramer called calpactin (Nakata et al., 1990).
Alternatively, S100A11 interacts with annexin I in a calcium dependant manner (Seemann et
al., 1997).
The over‐expression of S100A15 was also recorded in psoriasis and in particular in the
epidermis of diseased skin. The observation of an up‐regulation of S100A15 by calcium and
pro‐inflammatory cytokines in human keratinocytes suggests that both epidermal
maturation and cytokine environment contribute to the elevated S100A15 levels in the
diseased skin (Wolf et al., 2007). Most recently the significance of S100A4 in psoriasis has
been discussed (Zibert et al., 2009); S100A4 was observed as being over‐expressed in upper
dermal regions of psoriatic skin. The authors suggest that S100A4 is an essential contributor
to the pathogenesis of psoriasis.
Table 5‐5 also highlights an up‐regulation in three proteins: acidic (leucine‐rich) nuclear
phosphoprotein 32 family, member A; acidic (leucine‐rich) nuclear phosphoprotein 32
family, member B; and albumin precursor. However, minimal information is available
regarding the association of these proteins with psoriasis.

153
The calcium binding protein calmodulin is observed to be down‐regulated upon exposure to
dithranol treatment of 0.3 µg/ mL (Table 5‐5). This is highly similar to results described by
Tucker et al., whereby dithranol was found to be a potent competitive inhibitor of
calmodulin at clinically relevant concentrations (Tucker et al., 1986). Similarly both involved
plaque and uninvolved epidermis levels of calmodulin activity were determined to be
significantly greater than in normal epidermis (Tucker et al., 1984).
The microtubule cytoskeleton plays roles in determining cell shape, cell polarity, vesicle
trafficking, and cell division and as a consequence microtubule reorganization during cell
differentiation is believed to be essential for cell morphogenesis (Lechler and Fuchs, 2007).
Upon exposure to dithranol three components of microtubules were determined to be
down‐regulated within the proteome of HaCaT cells and hence it would be down‐regulated
in successful treatment. The up‐regulation of class II tubulin has been demonstrated during
keratinocyte differentiation in vivo and in vitro (Lee et al., 2005) and hence we can propose
in this study that it is likely that a high quantity of tubulin would be present within rapidly
differentiating HaCaT cells. The presence of tubulin entities have also been co‐localised with
S100 proteins; it was suggested that S100A11 associates with microtubules and that
microtubules mediate movement of S100A11 to the cell periphery (Broome and Eckert,
2004).
The down‐regulation of annexin IV and annexin V was recorded at 0.3 and 0.2µg/mL
respectively (Table 5‐5). Annexins are a structurally related family of calcium binding
proteins implicated in a number of intracellular processes involving the action of calcium.
Annexins contain calcium‐binding sites distinct from the ‘E‐F hand’ calcium‐binding domain
seen in other calcium‐binding proteins such as calmodulin and S‐100 (Barwise and Walker,
1996). The involvement of annexin I with S100A11 and annexin II with S100A10 has
previously been discussed; however, there is minimal information available within the

154
literature to link the involvement of annexin IV and V with psoriasis and/or dithranol
treatment. In a separate recent study the expression of annexin II has been shown to be
significantly increased within involved atopic dermatitis skin in comparison to normal
control skin (Yamane et al., 2009). This result is highly similar to those found by Bastian et
al., whereby the presence and localisation of a variety of annexins in normal and psoriatic
skin was discussed. The authors found annexin I and annexin II to be significantly increased
in diseased skin however the other annexins remained more or less unchanged in
comparison to normal skin (Bastian et al., 1993). The authors stated that the expression of
annexin I is linked to a distinct state of cell differentiation and noted a high expression of
annexin I in keratinocytes of proliferating pathological conditions including psoriasis.
The down‐regulation of the gelsolin‐like capping protein is also noted. An association
between this protein and psoriasis has previously not been established. Gelsolin‐like capping
proteins are cytosolic factors that have been implicated in a number of physiological
functions requiring rapid actin cytoskeleton reorganization such as cell locomotion or signal
transduction. Gelsolin‐like capping proteins interfere with the growth of actin filaments in
vitro by severing actin filaments and capping their barbed ends through formation of an
actin‐capping protein dimer in a Ca2+ dependent manner (Constantin et al., 1998).
Clearly there are many other proteins that are altered with respect to drug concentration,
and the findings above discuss those that have been reported before as being involved in
psoriasis. These discussions highlight the complex interplay occurring between calcium
regulating entities which upon treatment with the anti‐psoriatic treatment dithranol
become down‐regulated. This implies that during a psoriatic outbreak, an over‐expression of
calcium regulatory processes occur which are consequently minimised during successful
treatment.

5.3.
A to
11%
in th
43%
Figurregul
As w
prot
subs
prot
num
met
.3.2 Metho
otal of 336 p
% were show
hat they we
% of proteins
re 5‐6: Schemalated, deemed
was observe
teome of m
set of prote
teins are su
mber of prot
tabolism also
Up‐Regulated
5%
otrexate
proteins wer
n to be down
re present a
were classif
atic representaequivalent or
ed for the d
ethotrexate
eins to be d
mmarised in
teins were
o increased.
Not Signif43%
d
Down‐Regulated
11%
re identified
n‐regulated
at all concen
ied as not sig
ation indicatingnot significant
ithranol trea
exposed ce
discussed is
n Table 5‐6.
identified a
ficant%
155
in the meth
and 5% up‐r
ntrations of
gnificant.
g the proportiowithin the pro
ated HaCaT
ells vary grea
those asso
In comparis
and hence t
hotrexate tr
egulated. A t
the drug an
on of proteins oteome of meth
cells the pr
atly in their
ociated with
son to dithr
the number
Equ
reated cell sa
total of 41%
d in the con
which were uhotrexate treat
roteins ident
functional c
central me
ranol treated
of associat
uivalent41%
amples of w
were equiva
ntrol. In add
up‐regulated, dted HaCaT cells
tified within
classes. The
etabolism. T
d cells a gre
ted with ce
which
alent
ition
down‐s.
n the
first
hese
eater
ntral

156
Table 5‐6: Summary table illustrating the proteins identified within the proteome of methotrexate treated HaCaT cells. The protein name, associated EC number and the metabolism location is provided. The colour scheme dictates the presence or omission of a protein at the given drug treatment concentration. Green implies that the protein was present within all three replicate samples, blue indicates that the protein was detected within two replicates and red indicates that the protein was not detected.
Protein Name EC Number C 1 2 3 4 5 Metabolism Location
argininosuccinate synthetase 1 6.3.4.5 Urea Cycle
aspartate aminotransferase 1 2.6.1.1 Alanine, Aspartate and Glutamate Metabolism
cytosolic malate dehydrogenase 1.1.1.37 TCA
enolase 1 4.2.1.11 Glycolysis
enolase 2 4.2.1.11 Glycolysis
enolase 3 4.2.1.11 Glycolysis
fructose‐1,6‐bisphosphatase 1 3.1.3.11 Glycolysis
fructose‐bisphosphate aldolase C 4.1.2.13 Glycolysis
glucose‐6‐phosphate isomerase 5.3.1.9 Glycolysis
glucose‐6‐phosphate dehydrogenase 1.1.1.49 Pentose Phosphate Pathway
glutathione transferase 2.5.1.18 Gluthionine Metabolism
glyceraldehyde‐3‐phosphate dehydrogenase 1.2.1.12 Glycolysis
glycogen phosphorylase, liver 2.4.1.1 Starch and Sucrose Metabolism
glyoxalase I 4.4.1.5 Pyruvate Metabolism
isocitrate dehydrogenase 1 (NADP+), soluble 1.1.1.42 TCA
lactate dehydrogenase A 1.1.1.27 Glycolysis
lactate dehydrogenase B 1.1.1.27 Glycolysis
lactate dehydrogenase C 1.1.1.27 Glycolysis
phosphofructokinase, platelet 2.7.1.11 Glycolysis
phosphogluconate dehydrogenase 1.1.1.44 Pentose Phosphate Pathway
phosphoglycerate dehydrogenase 1.1.1.95 Glycine, Serine and Threonine Metabolism
phosphoglycerate kinase 1 2.7.2.3 Glycolysis
phosphoglycerate kinase 2 2.7.2.3 Glycolysis
sorbitol dehydrogenase 1.1.1.14 Fructose and Mannose Metabolism
transaldolase 1 2.2.1.2 Pentose Phosphate Pathway
transketolase 2.2.1.1 Pentose Phosphate Pathway
triosephosphate isomerase 1 5.3.1.1 Glycolysis

157
To summarise the response of the proteins present within the central metabolism of
methotrexate treated HaCaT cells a further metabolite map was constructed as shown in
Figure 5‐7.
Most interestingly it is observed that the central glycolysis enzymes are unaffected by
methotrexate treatment in comparison to the results observed for dithranol treatment. This
trend is also observed for the recorded TCA enzymes. A number of peripheral enzymes are
noted within the proteome of methotrexate treated HaCaT cells including glycogen
phosphorylase, sorbitol dehydrogenase, phosphoglycerate dehydrogenase, glyoxalase I and
aspartate aminotransferase. These enzymes show varied responses to methotrexate
treatment but in the majority of cases are down‐regulated at high concentrations of
treatment.
With approximate twice as many proteins being detected and identified within the
methotrexate treated HaCaT proteome compared to dithranol there is consequently a far
greater number of proteins that could be discussed. The complete list of these proteins is
available in Appendix F. As in the previous section a small subset of these proteins were
selected for discussion, in most cases these selected proteins or variants of have previously
been noted as significant in psoriatic cases. This subset of proteins is summarised in Table
5‐7.

158
Figure 5‐7: Reconstructed metabolite map depicting the proteins (purple italics) successfully identified within methotrexate treated HaCaT cells and the corresponding linked metabolites (black). Adjacent metabolites are linked with block lines while pathways with some metabolites omitted are linked with dashed lines. The presence of proteins over the concentration range is summarised within the box diagrams whereby green implies that the protein was present within all three replicate samples, blue indicates that the protein was detected within two replicates and red indicates that the protein was not detected. The control sample is the left hand box and the highest concentration the right hand box.
Glucose
Glucose‐6‐Phosphate
Fructose‐6‐Phosphate
Fructose‐1,6‐Bisphosphate
Glyceraldehyde‐3‐Phosphate
1,3‐Bisphospho‐D‐glycerate
3‐Phospho‐D‐glycerate
2‐Phospho‐D‐glycerate
Phosphoenolpyruvate
Lactate
Citrate
cis‐Aconitate
D‐isocitrate
α‐ketoglutarate
Succinyl‐CoA
Succinate
Fumarate
Malate
Oxaloacetate
Acetyl‐CoA
Pyruvate
Glycerone –Phosphate
6‐Phospho‐D‐gluconate
D‐Ribulose 5‐phosphate
D‐Ribose 5‐phosphate
D‐Xylulose 5‐phosphate
D‐Erythrose 4‐phosphate
Sedoheptulose7‐phosphate
glucose‐6‐phosphate isomerase
Aspartate
fructose‐bisphosphatealdolase C
L‐Glutamate
Glutathione
argininosuccinate synthetase1
aspartateaminotransferase 1
cytosolic malate dehydrogenase
Enolase 1Enolase 2Enolase3
fructose‐1,6‐bisphosphatase 1
glucose‐6‐phosphate dehydrogenase
glutathione S‐transferase
glyceraldehyde‐3‐phosphate dehydrogenase
Glucose‐1‐Phosphate
Starch; Glycogenglycogen phosphorylase
glyoxalase I
isocitrate dehydrogenase 1 (NADP+), soluble
lactate dehydrogenase Alactate dehydrogenase Blactate dehydrogenase C
phosphofructokinase
phosphogluconatedehydrogenase
phosphoglycerate kinase 1
phosphoglycerate kinase 2
Serine
Hydroxy‐pyruvate
phosphoglyceratedehydrogenase
D‐Fructose D‐Sorbitolsorbitol dehydrogenase
transaldolase 1 transketolase
triosephosphate isomerase 1
cytosol

159
Protein Name C 1 2 3 4 5
actinin, alpha 1
annexin A3
annexin IV
chaperonin containing TCP1, subunit 2
gelsolin isoform b
high mobility group AT‐hook 1 isoform a
high‐mobility group box 1
high‐mobility group box 2
ribosomal protein L5
ribosomal protein L9
ribosomal protein S20
ribosomal protein S4, X‐linked X isoform
ribosomal protein S5
Table 5‐7: Summary table illustrating additional identified proteins within the proteome of methotrexate treated HaCaT cells. The colour scheme dictates the presence or omission of a protein at the given drug treatment concentration. Green implies that the protein was present within all three replicate samples, blue indicates that the protein was detected within two replicates and red indicates that the protein was not detected.
α‐Actinin‐1 is shown to be down‐regulated in HaCaT cells upon methotrexate treatment.
α‐Actinin‐1 has been implemented in a number of functions of migrating cells; it links the
cytoskeleton to many different transmembrane proteins in a collection of junctions, it
regulates the activity of a variety of receptors, and it serves as a scaffold to connect the
cytoskeleton to diverse signalling pathways (Otey and Carpen, 2004). It has been shown that
the binding of α‐Actinin‐1 to actin is essential for the migration of T‐cells (Stanley et al.,
2008) and as psoriasis is a T cell mediated disease this could provide a potential mode of
action for methotrexate, especially since it is known that methotrexate is an
immune‐suppressor. A down‐regulation of α‐Actinin‐1 has been reported in methotrexate
treated human osteogenic sarcoma cells (malignant bone tumour) whereby the down‐
regulated expression is proposed to imply the involvement of α‐Actinin‐1 in the regulation
of cell rounding and detachment that represent early events in drug‐induced apoptosis
(Fellenberg et al., 2003).

160
Similarly to the results received during dithranol treatment, a down‐regulation in the
expression of some annexins is observed. The importance of a down‐regulation of annexin
IV has been discussed previously in Section 5.3.3.1. The significance of annexin A3 in
psoriasis has also been highlighted previously where it has been reported that it is up‐
regulated in patients with active psoriasis in comparison to normal patients (Koczan et al.,
2005).
A down‐regulation is observed in the expression of chaperonin containing TCP1 (subunit 2).
The chaperonins are key molecular complexes that ensure the correct folding of proteins to
produce energetically stable and functionally competent protein conformations, which are
essential for cell growth and survival. The primary substrates for TCP1 appear to be the
cytoskeletal proteins, the tubulins, and actins. Disruption of TCP1 function to down‐regulate
expression of TCP1 alpha is associated with inhibition of cell proliferation, a decrease in cell
viability, cell cycle arrest with hyperdiploid DNA content, and cellular apoptosis (Liu et al.,
2005). Whilst the over expression of TCP1 has recently been correlated to a poorer
prognosis of patients with colonic cancer (Coghlin et al., 2006), an association with psoriasis
is yet to be presented.
A down‐regulation in expression of gelsolin is observed upon exposure to methotrexate,
which was also shown in this study during dithranol exposure. Gelsolin is an actin‐severing
protein which breaks the non‐covalent bonds between actin subunits, reducing F‐actin to its
component parts (Suhler et al., 1997). An increase in gelsolin expression has been associated
with Crohn’s disease; in this immuno‐based co‐morbidity it has been suggested that
increased concentrations of gelsolin in Crohn's muscle cells is consistent with enhanced cell
migration as a consequence of the inflammatory cell state (Ehrlich et al., 2000).
We have detected a down‐regulation in three high‐mobility group proteins; box 1, box 2 and
AT‐hook 1 isoform a. Box 1 type is an extracellular protein which acts as a cytokine by

161
binding to the receptor for advanced glycation end products (RAGE) and initiates a positive
feedback autocrine loop that maintains the inflammatory cascade (Straino et al., 2008). It
also elicits pro‐inflammatory responses in endothelial cells by increasing the expression of
vascular adhesion molecules as well as secretion of cytokines (TNF‐α) and chemokines (IL‐8)
(Fiuza et al., 2003). High levels of high‐mobility group box 1 have been detected in the
synovial fluid of patients with rheumatoid arthritis (Taniguchi et al., 2003). There is no direct
correlation between these proteins and psoriasis or methotrexate treatment however; we
can deduce that these proteins are linked to the inflammatory response observed during a
psoriasis outbreak and hence during successful treatment protein expression is reduced.
In addition to the protein listed above, we have also noted a down‐regulation in a number of
ribosomal proteins upon methotrexate exposure. Whilst there is no direct correlation in the
literature between these specific ribosomal proteins and psoriasis, a link has been made
between ribosomal protein S6 kinase and psoriasis (Choi et al., 1997). In this study ribosomal
protein S6 kinase was found to be increased 4‐fold in involved psoriatic skin in comparison
to non‐lesional and normal epidermis.
5.3.3.3 Ciclosporin
A total of 342 proteins were identified in the ciclosporin treated samples of which 6% were
deemed to be down‐regulated and 8% up‐regulated. A total of 47% were proven to be
equivalent in that they were present at all concentrations of the drug and in the control.
Finally 43% of proteins were classified as not significant as their presence varied over the
concentration range.

Figurregul
A fin
with
sum
re 5‐8: Schemalated, deemed
nal metabol
h the centra
mmarised in T
Not
Up‐Re8
atic representaequivalent or
ite map was
al metabolism
Table 5‐8 and
t Significant39%
egulated8%
ation indicatingnon significant
s constructe
m from ciclo
d the resulta
Down‐Regul6%
162
g the proportiot within the pro
ed to illustra
osporin trea
ant metabolit
lated
on of proteins oteome of ciclo
ate the resp
ated HaCaT
te map depic
Eq
which were uosporin treated
onse of enz
cells. The lis
cted in Figur
quivalent47%
up‐regulated, dd HaCaT cells.
ymes associ
st of enzym
e 5‐9.
down‐
iated
es is
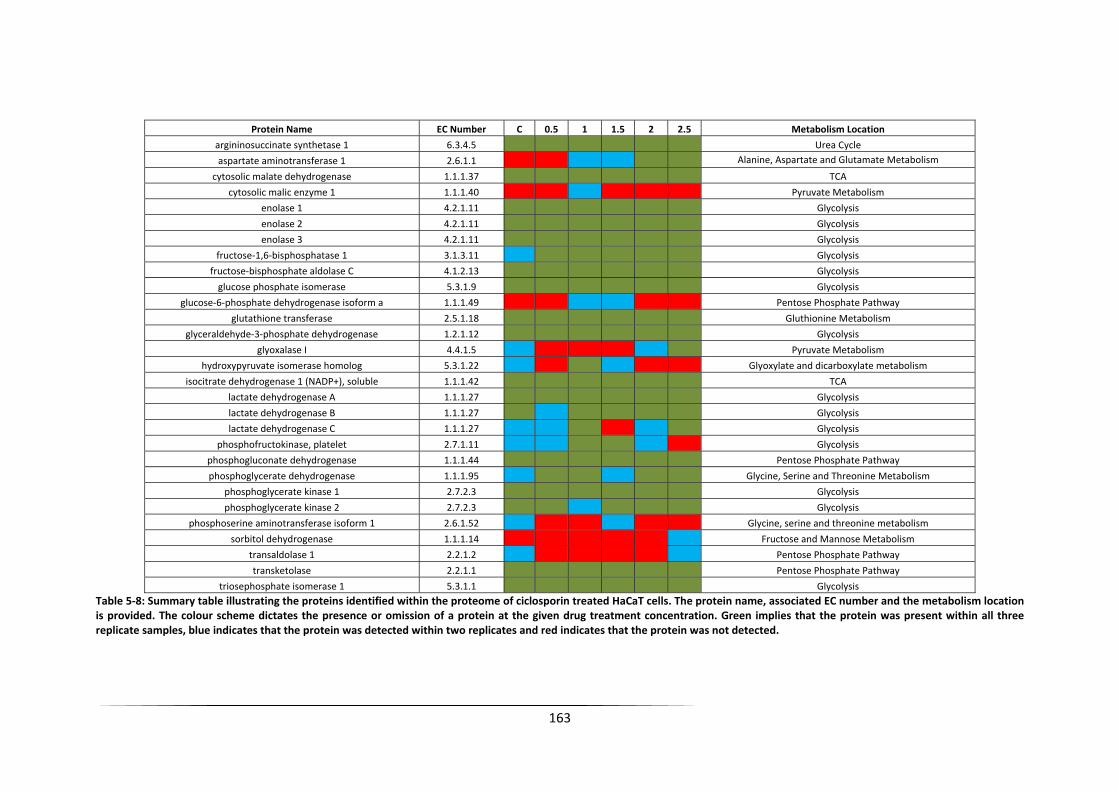
163
Protein Name EC Number C 0.5 1 1.5 2 2.5 Metabolism Location
argininosuccinate synthetase 1 6.3.4.5 Urea Cycle
aspartate aminotransferase 1 2.6.1.1 Alanine, Aspartate and Glutamate Metabolism
cytosolic malate dehydrogenase 1.1.1.37 TCA
cytosolic malic enzyme 1 1.1.1.40 Pyruvate Metabolism
enolase 1 4.2.1.11 Glycolysis
enolase 2 4.2.1.11 Glycolysis
enolase 3 4.2.1.11 Glycolysis
fructose‐1,6‐bisphosphatase 1 3.1.3.11 Glycolysis
fructose‐bisphosphate aldolase C 4.1.2.13 Glycolysis
glucose phosphate isomerase 5.3.1.9 Glycolysis
glucose‐6‐phosphate dehydrogenase isoform a 1.1.1.49 Pentose Phosphate Pathway
glutathione transferase 2.5.1.18 Gluthionine Metabolism
glyceraldehyde‐3‐phosphate dehydrogenase 1.2.1.12 Glycolysis
glyoxalase I 4.4.1.5 Pyruvate Metabolism
hydroxypyruvate isomerase homolog 5.3.1.22 Glyoxylate and dicarboxylate metabolism
isocitrate dehydrogenase 1 (NADP+), soluble 1.1.1.42 TCA
lactate dehydrogenase A 1.1.1.27 Glycolysis
lactate dehydrogenase B 1.1.1.27 Glycolysis
lactate dehydrogenase C 1.1.1.27 Glycolysis
phosphofructokinase, platelet 2.7.1.11 Glycolysis
phosphogluconate dehydrogenase 1.1.1.44 Pentose Phosphate Pathway
phosphoglycerate dehydrogenase 1.1.1.95 Glycine, Serine and Threonine Metabolism
phosphoglycerate kinase 1 2.7.2.3 Glycolysis
phosphoglycerate kinase 2 2.7.2.3 Glycolysis
phosphoserine aminotransferase isoform 1 2.6.1.52 Glycine, serine and threonine metabolism
sorbitol dehydrogenase 1.1.1.14 Fructose and Mannose Metabolism
transaldolase 1 2.2.1.2 Pentose Phosphate Pathway
transketolase 2.2.1.1 Pentose Phosphate Pathway
triosephosphate isomerase 1 5.3.1.1 Glycolysis Table 5‐8: Summary table illustrating the proteins identified within the proteome of ciclosporin treated HaCaT cells. The protein name, associated EC number and the metabolism location is provided. The colour scheme dictates the presence or omission of a protein at the given drug treatment concentration. Green implies that the protein was present within all three replicate samples, blue indicates that the protein was detected within two replicates and red indicates that the protein was not detected.

164
Figure 5‐9: Reconstructed metabolite map depicting the proteins (orange) successfully identified within ciclosporin treated HaCaT cells and the corresponding linked metabolites (black). Adjacent metabolites are linked with block lines while pathways with some metabolites omitted are linked with dashed lines. The presence of proteins over the concentration range is summarised within the box diagrams whereby green implies that the protein was present within all three replicate samples, blue indicates that the protein was detected within two replicates and red indicates that the protein was not detected. The control sample is the left hand box and the highest concentration the right hand box.
Glucose
Glucose‐6‐Phosphate
Fructose‐6‐Phosphate
Fructose‐1,6‐Bisphosphate
Glyceraldehyde‐3‐Phosphate
1,3‐Bisphospho‐D‐glycerate
3‐Phospho‐D‐glycerate
2‐Phospho‐D‐glycerate
Phosphoenolpyruvate
Lactate
Citrate
cis‐Aconitate
D‐isocitrate
α‐ketoglutarate
Succinyl‐CoA
Succinate
Fumarate
Malate
Oxaloacetate
Acetyl‐CoA
Pyruvate
Glycerone ‐Phosphate
6‐Phospho‐D‐gluconate
D‐Ribulose 5‐phosphate
D‐Ribose 5‐phosphate
D‐Xylulose 5‐phosphate
D‐Erythrose 4‐phosphate
Sedoheptulose7‐phosphate
glucose‐6‐phosphate isomerase
triosephosphate isomerase 1
cytosolic malatedehydrogenase
Aspartate
argininosuccinate synthetase 1
Enolase1Enolase2Enolase3
fructose‐bisphosphatealdolaseC
L‐Glutamate
Glutathione
glutathione S‐transferase
glyceraldehyde‐3‐phosphate dehydrogenase
isocitrate dehydrogenase 1 (NADP+), soluble
lactate dehydrogenase Alactate dehydrogenase Blactate dehydrogenase C
phosphogluconatedehydrogenase
phosphoglycerate kinase1
phosphoglycerate kinase2
Pyruvate kinase
transaldolase1 transketolase
aspartateaminotransferase 1
cytosolic malic enzyme 1
fructose‐1,6‐bisphosphatase 1
glucose‐6‐phosphate dehydrogenase
glyoxalase I
Serine
Hydroxy‐pyruvate
hydroxypyruvateisomerase homolog
phosphofructokinase
phosphoglyceratedehydrogenase
3‐Phosphohydroxypyruvate
phosphoserineaminotransferase
isoform 1
D‐Fructose D‐Sorbitolsorbitol dehydrogenase

165
The metabolite map illustrates many similarities between the central metabolism proteome
responses of ciclosporin and methotrexate treated HaCaT cells. The main glycolysis and TCA
enzymes are unaffected by ciclosporin treatment, however a variation in the expression of
some linking proteins is observed. Although up‐regulation in aspartate aminotransferase 1
and glyoxylase expression is recorded, the majority of proteins show a variable response to
ciclosporin treatment. These results imply that ciclosporin has a minimal effect on central
metabolism; this correlates well with the metabolome results highlighted in Chapter 4 which
failed to show a significant impact on metabolites localised within principal metabolism
pathways.
In addition to these central enzymes, a large number of additional proteins were detected
within the proteome of ciclosporin treated HaCaT cells. Table 5‐9 summarises a subset of
proteins which can be linked to ciclosporin treatment, psoriasis or linked inflammatory
disorders and a complete list is available for reference in Appendix G.
Table 5‐9: Summary table illustrating additional identified proteins within the proteome of ciclosporin treated HaCaT cells. The colour scheme dictates the presence or omission of a protein at the given drug treatment concentration. Green implies that the protein was present within all three replicate samples, blue indicates that the protein was detected within two replicates and red indicates that the protein was not detected.
Protein Name C 0.5 1 1.5 2 2.5
chaperonin containing TCP1, subunit 8 (theta)
chaperonin containing TCP1, subunit 5 (epsilon)
chaperonin containing TCP1, subunit 7 isoform a
ribosomal protein S2
ribosomal protein L11
ribosomal protein L12
ribosomal protein S17
histone H2a
keratin 20
myotrophin
tumor protein, translationally‐controlled 1 (TPT1)
actinin, alpha 2
gelsolin‐like capping protein
karyopherin beta 1
myristoylated alanine‐rich protein kinase C substrate (MARCKS)
tubulin, beta, 2

166
On a whole these results appear ambiguous when compared to the results found for
dithranol or methotrexate treatments, as a greater quantity of proteins are up‐regulated
upon ciclosporin treatment. These proteins include actinin, gelsolin‐like capping protein and
tubulin which were found to be down‐regulated by dithranol or methotrexate treatment
which could suggest a completely different mode of action for ciclosporin or potentially
highlight experimental error. A series of chaperonin containing TCP1 subunits were detected
within the proteome of ciclosporin treated HaCaT cells; of which one appeared potentially
down‐regulated and two appeared potentially up‐regulated upon treatment. A similar
observation is recorded in the response of a series of ribosomal proteins, one ribosomal
protein is down‐regulated and three are up‐regulated. These results are difficult to explain
as it seems highly unlikely that proteins from the same family could exhibit such varying
responses to treatment by the same drug. The combination of these findings reduces the
amount of confidence associated with these results and hence a reduced amount of
discussion is provided. Briefly, down‐regulation of histone H2a, keratin 10, myotrophin and
tumor protein (translationally‐controlled 1) was observed and an up‐regulation of
karyopherin beta 1 and myristoylated alanine‐rich protein kinase C substrate (MARCKS) was
recorded, again this may be because ciclosporin modulates the immune system and so is
difficult to correlate to any clear metabolic effects.
5.4 Conclusions
An investigation of the response of HaCaT cells to treatment with three anti‐psoriatic drugs
has been probed at the proteome level. LC‐MS was utilised in a qualitative approach to
identify changes in the expression of proteins over the concentration ranges of treatment. A
scoring system was established to quantify the presence of a specific protein within three
biological replicates leading to three classification groups. Firstly those which were present
within all three replicates and hence a large amount of confidence can be associated with

167
this observation, secondly those which were present in two out of three replicates and
finally those which were present in a single replicate or not observed at all. Through
incorporating this semi‐quantitative approach it was possible to identify proteins which
were up‐regulated, down‐regulated and unaffected by treatment.
A number of enzymes from central metabolism were identified within the proteome of
HaCaT cells exposed to dithranol, methotrexate and ciclosporin. Metabolite maps were
constructed to illustrate changes in enzyme expression with treatment. These maps
demonstrated that dithranol treatment has a greater pronounced effect of the central
metabolism enzymes. In particular a number of enzymes associated with glycolysis and the
TCA cycle were down‐regulated with increasing concentrations of dithranol exposure (viz.
enolase 2 & 3 and phosphoglycerate kinase 2). These results correlate well with the findings
gained from the metabolomic analysis discussed previously. Conversely the results from
methotrexate and ciclosporin treatment demonstrate that they imposed a minimal effect
upon central metabolism and as previously stated this is perhaps expected as these drugs
are immuno‐suppressants. In addition, a variety of proteins that are not primarily associated
with central metabolism were identified in the proteome of the drug treated cells. These
proteins varied greatly between treatment type indicating variable drug mode of actions or
targets. In some cases these proteins had previously been indicated in psoriasis or in similar
disorders with highly proliferating cell processes. However some proteins highlighted in this
study are potential novel biomarkers for psoriasis onset or conversely drug mode of action,
and would need to be investigated further using a more quantitative proteomics approach
such as iTRAQ or SILAC.
The results presented in this chapter illustrate that these anti‐psoriatic drugs induce global
changes in the proteome of HaCaT cells. In the future work it would be necessary to
investigate quantitative protein changes; i.e., by incorporating the use of isotope labelling

168
techniques which would increase the confidence in the proposed biomarkers, and by also
using transcriptomics or qPCR as complementary approaches

169
Chapter 6: Metabolomic analysis of plasma samples collected from psoriasis patients during methotrexate treatment: A short study.
6.1 Introduction
The analysis of plasma using a metabolomics approach is a well established procedure. A
number of studies have used this approach to assign potential biomarkers for a number of
diseases including; diabetes mellitus (Li et al., 2009), ankylosing spondylitis; a form of
chronic inflammatory arthritis (Gao et al., 2008), preeclampsia (Kenny et al., 2008),
Parkinsons’ disease (Bogdanov et al., 2008), schizophrenia (Kaddurah‐Daouk et al., 2007)
and coronary heart disease (Sabatine et al., 2005).
In this study plasma samples were collected from a cohort of psoriasis patients preselected
for a research project undertaken by Dr RB Warren at The Dermatology Centre, The
University of Manchester, Salford Royal Foundation Hospital, Manchester with required
ethics approved (05/Q1407/120). The samples were collected during a routine day clinic
and hence the samples provide a real‐life analysis scenario incorporating all the variance
associated with a lack of fasting prior to sample collection.
The general scope of patient selection criteria was beyond our immediate control and hence
the clinical metadata is rather limited in terms of age of patient, height, weight, BMI and any
other pathology. However as the samples do represent a ‘real life scenario’ it was deemed
important to assess whether a metabolomics‐based investigation could play a role in
predicting drug responders and also to investigate if any link could be made with previous
findings in Chapter 4 & 5.
The patients selected were orally administered with methotrexate and given folic acid
supplements. Folic acid has been proven to increase the likelihood of efficacious, longterm,
tolerable and toxicity free therapy for patients receiving methotrexate (Gisondi et al., 2007,

170
Strober and Menon, 2005). The severity of the psoriasis and the outcome of the treatment
were graded according to the psoriasis area severity index (PASI) score, a method used
worldwide to evaluate the severity and effectiveness of treatment in psoriasis patients
(Exum et al., 1996). The PASI system evaluates the affected body area and the individual
lesional characteristics to produce an overall score. The procedure begins by assessing four
separate areas of the body and calculating the area of involvement; the head (Ah), the upper
extremities (Au), the trunk (At) and the lower extremities (Al) which account for 10%, 20%,
30% and 40% of the total body respectively. Each area is assigned a value between 0‐6
where 0 is equivalent to no involvement, 1 = <10%, 2 = 10‐<30%, 3 = 30‐<50%, 4 =50‐<70%, 5
= 70‐<90% and 6 = 90‐100%. The next stage establishes the type of lesions present in each
region; erythema (E), infiltration (I), and desquamation (D). These three types of lesions are
quantified for each separate region using a five point scale; where 0 = no involvement, 1 =
slight, 2 = moderate, 3 = striking, and 4 = exceptionally striking involvement. To compile all
this information a final equation is generated:
PASI = 0.1Ah (Eh + Ih + Dh) + 0.2Au (Eu + IU + Du) + 0.3At (Et + It + Dt) + 0.4Al (EI + I1 + Dl).
PASI scores can range from 0.0‐72.0 and the greater the value the more severe the psoriasis
outbreak. This summary is adapted from (Exum et al., 1996). Whilst the PASI score is
relatively subjective and dependent upon the assessment by a dermatologist, it is a valid and
tested method which will be used in this study as a quantitative indicator of psoriasis
severity and treatment success. The difference between the PASI score before treatment
and after treatment was calculated and the magnitude of the result was related to
responsiveness.
The samples were analysed via GC‐MS to investigate the presence of plasma‐based
metabolites. The results were analysed to probe inter‐sex and inter‐response variations in
metabolite composition. Kruskal‐Wallis was the primary tool used within this analysis; an

171
element of predictive modelling was undertaken however the outcome was of minimal
validity.
6.2 Material and Methods
6.2.1 Materials
Drug compounds and reagents were all purchased from Sigma Aldrich, Gillingham, UK unless
otherwise stated.
6.2.2 Methods
6.2.2.1 Patient Selection
Patients were recruited from a psoriasis clinic at Salford Royal Foundation Hospital,
Manchester. In total 26 patients of varying age and sex were involved in the study. As
previously stated the PASI score was calculated for each patient prior to methotrexate
treatment. All patient information known prior to treatment is summarised in Table 6‐1. The
table shows that the PASI scores ranged from 8.8 to 28.2 indicating that the patients
involved were low to moderate sufferers. Plasma samples were prepared and separated
following blood collection and all samples stored at ‐80 °C until analysis.
6.2.2.2 GC‐MS Sample Preparation
All samples were thawed on ice and randomised prior to analysis. The internal standard
solution was initially composed of 10 mg succinic d4 acid dissolved in 10 mL ddH2O followed
by a further dilution of 2 mL dissolved in 10 mL of ddH2O. Plasma samples were vortexed for
approximately 20s. To a clean labelled centrifuge tube 100 µL of internal standard, 200 µL of
plasma sample and 60 µL of HPLC grade methanol was added to deproteinize the sample.
The mixture was vortexed for 15s and then centrifuged at 16200g for 15min. The
supernatant was removed and transferred to a clean centrifuge tube. The sample was finally
172
lyophilised (Eppendorf Vacufuge Concentrator 5301, Eppendorf, UK) overnight at a low
temperature. A two‐stage sample chemical derivatisation was performed on the dried
sample 80 µL of 20 mg/mL O‐methylhydroxylamine solution was added and heated at 40°C
for 90 min followed by addition of 80 µL MSTFA (N‐acetyl‐N‐[trimethylsilyl]‐
trifluoroacetamide) and heating at 40°C for 90 min. 20 µL of a retention index solution (4
mg/mL n‐decane, n‐dodecane, n‐pentadecane, n‐nonadecane, n‐docosane dissolved in
hexane) was added and the samples were analysed in a random order using a Agilent 6890 N
gas chromatograph and 7683 autosampler (Agilent Technologies, Stockport, UK) coupled to
a LECO Pegasus III electron impact time‐of‐flight mass spectrometer (LECO Corporation, St
Joseph, USA) as detailed in (O'Hagan et al., 2005). Initial data processing of raw data was
undertaken using LECO ChromaTof v2.12 software to construct a data matrix (metabolite
peak vs. sample no.) including response ratios (peak area metabolite/peak area succinic‐d4
internal standard) for each metabolite peak in each sample. The process of standardising to
succinic‐d4 acid has previously been reported, details of which can be found in (Pope et al.,
2007) and (MacKenzie et al., 2008).
6.2.2.3 Quality Control Samples
Quality control (QC) samples were prepared by combining 100 µL of each plasma sample
into a pooled QC sample. This sample was vortexed for 30s and separated into 10 individual
QC samples. These samples were prepared as above for GC‐MS analysis and were analysed
intermittently during the experiment to quantify process variability. The incorporation of QC
samples acts as an internal reference amongst the individual samples, (Dunn et al., 2008). At
present there are no exact criteria for the assessment of reproducibility in metabolomics
data‐sets however the inclusion of QC samples allows the data quality and sample variance
to be quantified often through the application of a standard deviation limit (Begley et al.,
2009).

173
6.2.2.4 GC‐MS Data Analysis
The data matrix generated within the GC‐MS software was exported to Microsoft Excel
where it was normalised to total peak area. A Kruskal‐Wallis analysis was performed on the
data. Kruskal‐Wallis was employed in the analysis as no assumptions could be made about
the data distributions of the classes. Kruskal‐Wallis is a non‐parametric equivalent to
ANOVA. ANOVA in comparison assumes that the class populations have normal
distributions, i.e. a parametric test (Hollander and Wolfe, 1999).
Metabolites were identified in the same manner as discussed in Section 4.3.3. Metabolites
were defined as a definitive match if the retention time and mass spectrum matched that of
a standard analysed on the same instrument. In comparison a putative match can be
matched by mass spectrum to that from a non‐in house library and cannot be matched by
retention time.
Table 6‐1: Patient metadata collected prior to treatment with methotrexate. The table illustrates the patient identification code, sex, age and baseline PASI score.
Patient Code Sex Age of Onset PASI Baseline Score 99 F 13 22.4100 M 21 16101 F 15 14.2105 F 18 17.4108 F 43 22.4109 F 30 16.4110 M 28 15.6111 M 22 10112 M 22 16113 F 39 12.8114 F 24 18.5115 M 18 9.6116 M 33 15.6117 M 28 9.8119 F 13 15.4120 F 30 16.8121 M 32 8.8122 F 16 12.8123 M 19 14.6124 M 50 18.6125 F 2 13.7126 F 30 28.2127 M 24 21.2128 M 12 10.6129 F 4 13130 M 15 12.6

174
6.3 Results and Discussion
6.3.1 Post treatment metadata
After treatment with methotrexate the patients were reassessed and a new PASI score
generated. The % change in PASI score was calculated and the patients assigned as a
responder, non‐responder or intermediate responder using the following criteria. A PASI
score reduction of >75 % was deemed to be a successful response, a PASI score reduction of
between 50‐75% was determined as an intermediate response and a response of < 50% was
declared as a non‐response. This information is summarised in Table 6‐2.
Patient Code Sex Age of Onset PASI Weekly Dose PASI 3/12 % PASI Response status
Baseline at 3/12 mg Change
99 F 13 22.4 17.5mg 3.6 83.93 Responder
100 M 21 16 N/A N/A N/A N/A Severe GI AE
101 F 15 14.2 20mg 3.1 78.17 Responder
105 F 18 17.4 10mg 4.1 76.44 Responder
108 F 43 22.4 N/A N/A N/A N/A Severe GI AE
109 F 30 16.4 10mg 3.8 76.83 Responder
110 M 28 15.6 15mg 11.2 28.21 Non‐responder
111 M 22 10 10mg 2.4 76.00 Responder
112 M 22 16 17.5mg 3.9 75.63 Responder
113 F 39 12.8 30mg 6.1 52.34 Intermediate response
114 F 24 18.5 10mg 3.9 78.92 Responder
115 M 18 9.6 12.5mg 4.5 53.13 Intermediate response
116 M 33 15.6 15mg 11.2 28.21 Non‐responder
117 M 28 9.8 10mg 8.5 13.27 Non‐responder
119 F 13 15.4 10mg 3.8 75.32 Responder
120 F 30 16.8 25mg 4.1 75.60 Responder
121 M 32 8.8 17.5mg 9.2 ‐4.55 Non‐responder
122 F 16 12.8 N/A N/A N/A N/A MTX stomatitis
123 M 19 14.6 7.5mg 2.9 80.14 Responder
124 M 50 18.6 7.5mg 4.5 75.81 Responder
125 F 2 13.7 17.5mg 9.6 29.93 Non‐responder
126 F 30 28.2 20mg 5.6 80.14 Responder
127 M 24 21.2 10mg 4.5 78.77 Responder
128 M 12 10.6 17.5mg 8.5 19.81 Non‐responder
129 F 4 13 17.5mg 3.2 75.38 Responder
130 M 15 12.6 12.5mg 6 52.38 Intermediate response
Table 6‐2: Patient information illustrating the dose of methotrexate administered, the starting PASI score, the PASI score post treatment and the corresponding response rate and status.

175
From the total of 26 participating patients; 14 patients showed a response, 3 showed an
intermediate response and 6 were non‐responders to methotrexate treatment in this
instance. Three individuals were excluded from the study as they exhibited side effects. Two
patients presented with a severe gastrointestinal adverse effect and one presented with
methotrexate associated stomatitis; an inflammation of the mouth. The patients with
attributed side effects were declined further treatment but plasma samples were still
collected and included in the study.
An interesting feature presented within the table is the non‐correlation between dosage and
response which indicates the varied successfulness achieved by methotrexate treatment.
This factor is further highlighted by the response recorded for patient 121 who
demonstrated an increased level of psoriasis involvement after methotrexate treatment.
6.3.2 Principal Components Analysis
The initial stage of data analysis incorporated the use of principal components analysis (PCA)
to identify any trends within the data which could potentially be associated with
methotrexate response. Additionally PCA is utilised to visualise the repeatability and
correlation between QC samples. Figure 6‐1 illustrates the PCA plot generated for the
complete data set using the first two principal components which account for 76.82% of the
total explained variance. The plot shown in Figure 6‐1A indicates the spread of data in terms
of response whereby the following identifications are observed; response (R), intermediate
response (I), non‐response (N), severe (S) and finally the QC samples (Q). The plot highlights
a lack of clustering within response classes and shows a large amount of variance. This
finding is additionally evident for the QC samples. The QC samples although biologically
identical fail to cluster together in an acceptable manor. A large majority of QC samples are
localised around the origin of PC1 and PC2; however a sub‐set are visible outliers. The plot
presented in Figure 6‐1B was constructed using an identification number corresponding to

176
the order in which the samples were analysed. This plot eliminates sample drift over time as
a reason for the dispersive presence of the QC samples within the PCA analysis. Over time
results from the analysis of complex samples can differ as a function of time and not as a
function of biological variance but this can be discounted as no relationship between
location in PCA space and sample order is observed.
Figure 6‐1: PCA plots of PC1 vs PC2 accounting for 76.82% total explained variance from the complete data set. Plot A illustrates the variance within the data in terms of response; responder (R), intermediate responder (I), non‐responder (N) and QC sample (Q). Plot B illustrates the variance using the sample order as the naming structure.
6.3.3 Kruskal‐Wallis Analysis
Kruskal‐Wallis analysis was used to provide corresponding p values for the metabolites
identified within the plasma samples. The analysis was conducted twice, to identify
metabolites related to response to treatment and also to sex. The first class structure was
generated according to the outcome of the treatment providing three classes; response,
intermediate response, non‐response. The second class structure was generated according
to male or female. Given the small sample size and heterogeneity of patients; metabolites
with a p value <0.08 were considered. This p value is rather high and was chosen as a
threshold value to allow the top proportion of metabolites to be taken into the discussion
stage of the analysis. Table 6‐3 shows the metabolites which fit the p value criteria and the
corresponding identifications according to response. A couple of metabolites were not
-15 -10 -5 0 5 10 15-15
-10
-5
0
5
Q
Q
Q Q
Q Q
Q Q Q Q
R
R
R
I
R R
Q R
N
S N
R N
Q R
R R N R
R
Q R
R
I
I Q
S
S
N N
Q Q
PC1: 60.88% Explained Variance
PC2:
15.
94%
Exp
lain
ed V
aria
nce
-15 -10 -5 0 5 10 15-15
-10
-5
0
5
1
2
3 4
5 6
7 8 910
11
12
13
14
1516
1718
19
2021
2223
2425
2627 2829
30
3132
33
34
3536
37
38
3940
4142
PC1: 60.88% Explained Variance
PC2:
15.
94%
Exp
lain
ed V
aria
nce
A B

177
identified, in that it was not possible to match them to known metabolites in our in house
libraries.
Table 6‐3: Kruskal‐Wallis results table identifying metabolites significantly related to response to treatment. The metabolite identification and subsequent p value is shown. The box & whisker plot illustrates the metabolite level in responders (left), intermediate responders (middle) and non‐responders (right).
Metabolite ID p value Metabolite Box and Whisker
103 0.0138 uric acid
12 0.0279 valine
14 0.0279 valine
76 0.0348 unidentified
74 0.0503 fructose
96 0.0556 hexadeconoic acid
54 0.0568 methionine
10 0.057 p cymene/EDTA
77 0.0598 monosaccharide
43 0.0742 succinic acid
98 0.0746 unidentified
90 0.0782 tyrosine
55 0.0795 cysteine
0.2
0.3
0.4
0.5
0.6
0.7
0.8
0.9
1 2 3Class Identifier
% P
eak
Are
a
Metabolite 103
0
1
2
3
4
5
1 2 3Class Identifier
% P
eak
Are
a
Metabolite 12
0
1
2
3
4
5
1 2 3Class Identifier
% P
eak
Are
a
Metabolite 14
0
0.005
0.01
0.015
0.02
0.025
0.03
0.035
1 2 3Class Identifier
% P
eak
Are
a
Metabolite 76
-0.05
0
0.05
0.1
0.15
0.2
0.25
0.3
0.35
0.4
1 2 3Class Identifier
% P
eak
Are
a
Metabolite 74
0
0.1
0.2
0.3
0.4
0.5
0.6
0.7
0.8
0.9
1 2 3Class Identifier
% P
eak
Are
a
Metabolite 96
0.02
0.03
0.04
0.05
0.06
0.07
0.08
0.09
1 2 3Class Identifier
% P
eak
Are
a
Metabolite 54
-0.3
-0.2
-0.1
0
0.1
0.2
0.3
0.4
0.5
0.6
1 2 3Class Identifier
% P
eak
Are
a
Metabolite 10
-0.6
-0.4
-0.2
0
0.2
0.4
0.6
0.8
1
1.2
1.4
1 2 3Class Identifier
% P
eak
Area
Metabolite 77
0
2
4
6
8
10
12
x 10-3
1 2 3Class Identifier
% P
eak
Are
a
Metabolite 43
-0.03
-0.02
-0.01
0
0.01
0.02
0.03
0.04
0.05
0.06
0.07
1 2 3Class Identifier
% P
eak
Are
a
Metabolite 98
0.3
0.4
0.5
0.6
0.7
0.8
0.9
1
1.1
1 2 3Class Identifier
% P
eak
Are
a
Metabolite 90
0.02
0.03
0.04
0.05
0.06
0.07
1 2 3Class Identifier
% P
eak
Are
a
Metabolite 55

178
The table shows a number of metabolites which vary according to response. The metabolites
uric acid, valine, methionine, tyrosine and cysteine are observed to be reduced in
responders in comparison to non‐responders. In comparison fructose, hexadecanoic acid
and succinic acid appear elevated in responding patients when compared to non‐responding
patients. These metabolites could be potential markers for predicting response to
treatment, but this of course would need further validation. Interestingly in most cases the
variation associated with metabolite concentration is much greater in responders in
comparison to non‐responders. This observation could correlate to the varying magnitude of
response. The derivatisation products of valine help to indicate the reproducibility
associated with the analysis and the two metabolite features illustrate almost identical
trends.
The above ‘markers’ may be generated by chance due to the small number of samples and
the sample collection methods (i.e. the omission of a fasting period). Therefore it was
decided to attempt a prediction where known biological effects have been reported in the
literature. Thus, as previously stated it is also possible to probe the variability of plasma
metabolites according to sex. Table 6‐4 shows the metabolites which fit the p value criteria
and the corresponding identifications according to response. All the identified metabolites
were observed to be at an increased concentration in male patients in comparison to female
patients. The selection of metabolites which were significantly altered between sexes
includes creatinine. Serum creatinine levels have previously been investigated in a large
survey of the US population involving 18,723 participants (Jones, 2000). In this study the
mean serum creatinine levels were found to be significantly higher in male vs. females
through a variety of races. The other metabolites include the amino acids, 4‐hydroxyproline,
threonine, tryptophan and methionine whose increased concentration in males can be
attributed to increased protein turnover in comparison to females. A similar trend was

179
observed by Kochhar and colleagues who screened urine and plasma samples using NMR
(Kochhar et al., 2006).
Table 6‐4: Kruskal‐Wallis results table identifying metabolites significantly related to sex of patient. The metabolite identification and subsequent p value is shown. The box & whisker plot illustrates the metabolite level in male patients (left) and female patients (right).
Metabolite ID p value Metabolite Box & Whisker
50 0.0011 4‐hydroxyproline
60 0.0021 creatinine
38 0.0068 threonine
64 0.0078glutamic acid and/or pyroglutamic acid
86 0.0116 hydrocinnamic acid
71 0.0228 ornithine and/or arginine
69 0.0267 ornithine and/or arginine
103 0.0489 uric acid
115 0.0564 tryptophan
33 0.0564 unidentified
54 0.0564 methionine
63 0.0783 glutamic acid and/or glutamine
0.02
0.04
0.06
0.08
0.1
0.12
0.14
0.16
1 2Class Identifier
% P
eak
Are
a
Metabolite 50
0.04
0.05
0.06
0.07
0.08
0.09
0.1
0.11
0.12
0.13
1 2Class Identifier
% P
eak
Are
a
Metabolite 60
0.5
1
1.5
1 2Class Identifier
% P
eak
Are
a
Metabolite 38
0
1
2
3
4
5
6
7
1 2Class Identifier
% P
eak
Are
a
Metabolite 64
0.015
0.02
0.025
0.03
0.035
0.04
0.045
0.05
1 2Class Identifier
% P
eak
Are
a
Metabolite 86
0.05
0.1
0.15
0.2
0.25
0.3
0.35
1 2Class Identifier
% P
eak
Are
a
Metabolite 71
0.25
0.3
0.35
0.4
0.45
0.5
0.55
0.6
1 2Class Identifier
% P
eak
Area
Metabolite 69
0.2
0.3
0.4
0.5
0.6
0.7
0.8
1 2Class Identifier
% P
eak
Area
Metabolite 103
0.1
0.15
0.2
0.25
0.3
0.35
0.4
1 2Class Identifier
% P
eak
Are
a
Metabolite 115
0.015
0.02
0.025
0.03
0.035
0.04
0.045
0.05
0.055
0.06
0.065
1 2Class Identifier
% P
eak
Are
a
Metabolite 33
0.02
0.03
0.04
0.05
0.06
0.07
0.08
0.09
1 2Class Identifier
% P
eak
Are
a
Metabolite 54
0.04
0.06
0.08
0.1
0.12
0.14
0.16
0.18
0.2
0.22
1 2Class Identifier
% P
eak
Area
Metabolite 63

180
6.3.4 Multivariate Predictive Analysis
To analyse these data further and to investigate whether it was possible to discriminate
between responders and non‐responders to methotrexate treatment successfully and
differentiate between male and female patients we conducted PLS‐DA and support vector
machine (SVM) analyses. For both these analyses bootstrapping was performed.
Unfortunately both PLS‐DA and SVMs failed to discriminate between the defined classes. PLS
results were particularly disappointing for gender classification and provided a correct
classification result (CCR) of approximately 56%. Gender classification utilising SVM provided
a slightly better CCR of 59% from an average of 1000 bootstraps. Finally, predictive
modelling was incorporated to investigate drug response, again this method failed. The
difficulty in modelling drug response can be specifically related to the unbalanced class
structure. In total there were 14 responders, 6 non‐responder and 3 intermediate and
severe responders.
6.4 Conclusions & Future Work
This work was conducted to investigate the application of a metabolomics‐based study in a
‘real life scenario’ in which samples were collected from patients without the incorporation
of a fasting period, during normal clinical practice. The aim was to investigate whether we
could identify potential markers to predict a patient’s response to methotrexate treatment
by plasma‐based metabolomics using GC‐MS analysis.
Initial PCA indicated minimal separation between responders and non‐responders and also
illustrated an unusual amount of variation in the QC samples which itself is difficult to
explain. Kruskal‐Wallis analysis was successful in identifying a small number of significant
metabolites (from a total of 121 metabolite features detected) which seem to be correlated
to response and also a number of metabolites related to gender. Metabolites linked to
methotrexate response included uric acid, valine, methionine, tyrosine and cysteine which

181
were recorded at a reduced level in responders when compared to non‐responders. In these
cases we could potentially imply that these metabolites could be used as indicators of
response, but this of course needs validation in a larger more controlled study. The results
gained for gender analysis were relatively promising and correlated well with previous
findings in the literature. As expected a number of metabolites associated with protein
turnover and muscle growth were detected at increased levels in plasma collected from
males in comparison to females.
This study helps to confirm the importance of experimental design and the regulation of
external parameters when undertaking a clinical metabolomics study in particular those
including human samples.

182
Chapter 7: Monitoring the succinate dehydrogenase activity isolated from mitochondria by surface enhanced Raman scattering.
7.1 Introduction
The main aims of this thesis have been the investigation of bioanalytical approaches to
understanding psoriasis and other skin pathologies. This has involved the development of
imaging approaches based on vibrational spectroscopy, and in depth metabolomics and
proteomics studies using mass spectrometry coupled to gas chromatography and liquid
chromatography respectively. These studies have involved static snapshots of pathology
and drug interactions and therefore in order to investigate highly dynamic processes Raman
spectroscopy was developed to analyse enzymatic activity. This work has transferable
potential into areas of human metabolism research and may be useful for metabolomics
studies.
The theory of Raman spectroscopy was first discovered by CV Raman in 1928 (Raman and
Krishnan, 1928). The technique is often used in a complementary approach to infrared
spectroscopy and is applicable to a wide array of samples including solids, liquids and gases.
The basis of Raman spectroscopy is the scattering of light from a molecule. In normal cases
for Rayleigh scattering the light is elastically scattered in which the photons have the same
energy/frequency and hence wavelength as the incident light. However in Raman
spectroscopy a small fraction of photons are inelastically scattered at different frequencies
than the incident photons. Light scattered with a frequency lower than that of the incident
beam of radiation is referred to as Stokes radiation, while light scattered with a higher
frequency is termed anti‐Stokes radiation. Stokes radiation involves an increase in photon
energy while anti‐Stokes radiation involves a decrease in energy. Similar to IR, Raman
spectra include a number of distinctive peaks which can be attributed to specific functional

183
group vibrations; however, as Raman is complementary to IR, peaks which are weak in IR
can be strong within Raman and vice versa.
The analysis of metabolic processes is important in all areas of biochemistry and particular
interest is shown in the analysis of succinate dehydrogenase, the enzyme involved in the
electron transfer reactions in all kingdoms of life as documented by (Reichmann and
Wildenauer, 1991, Peterson et al., 1994, Trumpower and Gennis, 1994, Dautry et al., 1999).
Succinate dehydrogenase is responsible for catalyzing the oxidation of succinate to fumarate
within the citric acid cycle as illustrated in Figure 7‐1C and Figure 7‐2A. In higher organisms
all enzymes within the cycle are located within the mitochondrial matrix; however an
exception to this is succinate dehydrogenase and its coenzyme flavin adenine dinucleotide
(FAD). The enzyme complex (often represented by E‐FAD) is tightly bound to the inner
membrane of the mitochondrion allowing its easy isolation.
Upon isolation of this E‐FAD it is possible to measure the succinate to fumarate reaction by
monitoring the reduction of an artificial electron acceptor; for example, the Hill reagent 2,6‐
dichlorophenolindophenol (DCPIP). When this redox dye is oxidised it is blue and when
reduced it is colourless (See Figure 7‐1 A&B for reactions), thus simple spectrophotometry
can be employed to follow this redox change. In order to use this artificial electron
acceptor, the normal path of electrons in the electron transport chain must be blocked
(Nelson and Cox, 2008). This is accomplished by adding sodium azide to the reaction
mixture (Figure 7‐2B).

184
Figure 7‐1: Detection of enzyme activity and reactions involved. (A) Schematic drawing of DCPIP (the final electron acceptor) in its oxidised and reduced form. (B) Representation of the reduction of DCPIP by FADH2 from its oxidised blue form of the dye to the reduced colourless form. (C) The reaction catalysed by the enzyme succinate dehydrogenase (EC 1.3.5.1).
This poison inhibits the transfer of electrons from Complex IV (cytochrome a3) to the final
acceptor, oxygen, so that the electrons cannot be passed along the preceding cytochromes
and ubiquinone (also called co‐enzyme Q). Instead these electrons are picked up by DCPIP.
The reduction of DCPIP by E‐FADH2 can then be measured at 600nm (Figure 7‐1A) through
the observed blue to colourless colour change (Nelson and Cox, 2008). However, one of the
problems with spectrophotometry is that no chemical information on the reporter is
available which means that the method potentially lacks specificity. By contrast, Raman
spectroscopy yields information rich spectral fingerprints due to specific vibrational band
frequencies being probed from the molecules under interrogation (Ferraro and Nakamoto,
1994).
N
OHCl
O
Cl
+ 2H+ + 2e
-
NH
OHCl
OH
ClA
B
Csuccinate fumarate
Succinate dehydrogenaseEC 1.3.5.1
DCPIPox DCPIPred
OHOH
O
OH
OHOH
O
OH
+ E-FAD + FADH2
FADH 2 + DCPIP ox (Blue) E-FAD + DCPIP red (Colourless)

185
Figure 7‐2: Schematic representations of (A) the citric acid cycle showing where succinate is converted into fumarate, and (B) the electron transport chain detailing where sodium azide inhibits cytochrome oxidase. (C) SERS spectra of the artificial electron acceptor DCPIP in its oxidised and reduced forms which occurs due to the redirection of electrons from the electron transport chain.
However, this inelastic scattering of light is usually very weak (typically 1 in 106 – 108
photons), and Raman spectra can often be difficult to obtain from organic molecules
because of the presence of fluorescence, which is further compounded in biological
matrices. These shortcomings in Raman spectroscopy can be largely overcome by surface
enhanced Raman scattering (SERS (Moskovits, 1985)), including both fluorescence (Shadi et
al., 2009) and signal enhancement, which for certain molecules allows single molecule
detection (Kneipp et al., 2002, Moskovits et al., 2002). Thus SERS has found wide utility as a
Citrate
cis-Aconitate
D-isocitrate
α-ketoglutarate
Succinyl-CoA
Succinate
Fumarate
Malate
Oxaloacetate
H20
H20
H20
C02
NAD+
NAD+
NADH + H+
NADH + H+
NAD+ + CoA‐SH
NADH,+ H+ + CO2
FAD
FADH2 GDP + Pi
CoA‐SH + GTP
Acetyl-CoA
CoA‐SH
H20
Pyruvate
Electron Transport
Chain:
NADH
Complex I Ubiquinone
Complex II
Complex IV O2Cytochrome cComplex III
Citric Acid Cycle
FADH2 NaN3
XInhibition of cytochrome oxidase
Leads to a redirection of electrons to DCPIP from Ubiqinone
500 1000 15000
500
1000
1500
2000
SER
S In
tens
ity
Wavenumber (cm-1)
DCPIPox
DCPIPred
SERS spectra of DCPIP
243 cm-1
404 cm-1
498 cm-1
A
B
C
e-

186
sensitive analytical and bioanalytical technique (Bailo and Deckert, 2008, Graham and
Faulds, 2008, Jarvis and Goodacre, 2008, Qian and Nie, 2008)
Recently there has been interest in applying SERS to monitor kinetics of reactions
particularly those concerned with metabolism. Success in monitoring kinetics of synthetic
chemical reactions using SERRS (a variant of SERS which includes a resonance enhancement)
has been reported in (Shadi et al., 2004), as well as those detailing general enzyme activity
(Moore et al., 2004), (Ingram et al., 2008). Therefore the aim of the present study was to
investigate whether SERS could be used to gain quantitative enzyme information from
succinate dehydrogenase isolated from mitochondria.
7.2 Materials & Methods
7.2.1 Chemical and reagents
All chemicals and reagents were purchased from Sigma (D‐mannitol KOH, sodium azide,
sodium succinate, malonic acid, MgCl2 6H2O, poly L‐lysine hydrobromide, gold tetra chloride,
tri‐sodium citrate) with the exception of DCPIP (Acros), KH2PO4, K2HPO4, (BDH) and
hydrochloric acid (Fisher). All chemicals were used without further purification. Double de‐
ionised water was used for all experiments.
7.2.2 Extraction of mitochondria
Cauliflowers were obtained from a national retail outlet. 20 g from the 2‐3 mm of the
surface of cauliflower florets was added to 40 mL of ice cold grinding media (0.3 mol dm‐3
mannitol, 0.006 mol dm‐3 KH2PO4, 0.014 mol dm‐3 K2HPO4, adjusted to pH 7.2) and blended
in a Ferretti FEBL10 food processor for 5 min. The ground material was filtered through a
muslin cloth and the supernatant transferred into chilled centrifuge tubes and centrifuged
(Sorvall RC‐5B refrigerated superspeed centrifuge) at 1778 g for 10 min. The post‐nuclear
supernatant was decanted into clean chilled centrifuge tubes and centrifuged (Sorvall RC‐5B

187
refrigerated superspeed centrifuge) at 23042g for 30 min. The mitochondria pellet was
recovered and resuspended in manitol assay medium (0.3 mol dm‐3 mannitol, 0.006 mol
dm‐3 KH2PO4, 0.014 mol dm‐3 K2HPO4, 0.005 mol dm‐3 MgCl2, adjusted to pH 7.2).
7.2.3 Monitoring enzyme activity
In a test tube, 0.5 mL of sodium azide (0.04 mol dm‐3), 0.5 mL (5 x 10‐4 mol dm‐3) DCPIP,
0.5 mL of succinate (0.02 mol dm‐3) and 0.9 mL of mitochondrial suspension was added to
3.2 mL of assay media and mixed. The mixture was allowed to equilibrate for 5 min after
mitochondria addition. The kinetics of the reaction was subsequently measured over a
period of 5 to 30 min using a Thermo‐2 UV‐VIS spectrophotometer set at 600 nm as well as
by SERS.
For SERS measurements an aliquot of 150 µL of the above mixture was taken at 5 min
intervals and added immediately to the gold SERS colloid (vide infra) with subsequent
collection of SERS spectra. In addition to the above reaction mixture, controls were also
incorporated into the analysis and included:
• Removing only the sodium azide inhibitor. This is the negative control so that the
electron transport chain functions normally and the terminal electron acceptor is
oxygen (Figure 7‐2B).
• Removing only the sodium succinate. This is another negative control where as
there is no substrate no electron transport will occur.
• Adding 2 mL of malonic acid (0.2 mol dm‐3). This was included as malonic acid is a
competitive inhibitor for succinate dehydrogenase.
• Reducing the volume of the mitochondria preparation to 0.3 mL or 0.6 mL.

188
7.2.4 Surface enhanced Raman scattering
7.2.4.1 Colloid preparation
A gold colloid was prepared by Dr Iqbal Shadi using the Lee and Meisel method as detailed in
(Lee and Meisel, 1982). All glassware were acid washed with aqua regia [HNO3/HCl (1:3 v/v)]
followed by gentle scrubbing with a soap solution. Colloid was prepared by reduction of
HAuCl4 by sodium citrate. Briefly, 250 mL of 1 mM solution of HAuCl4 was brought to the boil
followed by addition of 25 mL of 38.8 mM solution of sodium citrate. The mixture was boiled
for 30 min followed by cooling at room temperature. The quality of the resulting colloid was
checked by determining the wavelength of the absorption maximum in the visible region on
a Thermo‐2 UV‐VIS spectrophotometer. The nature of the colloid often used for SERS, has
been examined using visible absorption, photon correlation and NMR spectroscopic
techniques (performed by Dr Shadi; data not shown) which confirm that the surface of the
gold particles are covered with a layer of citrate with pendent negatively charged groups.
However, the subsequent addition of poly L‐lysine which coats the surface, results in the
presence of pendent positively charged groups on the colloidal surface (Chaudry et al.,
1996).
The citrate‐reduced sols gave an absorption maximum at ~ 529 nm. An acceptable gold sol is
one which not only absorbed at 529 nm but has an absorption band at this wavelength with
a half height width of ~ 50 nm, and this was the case for this preparation (data not shown).
TEM of the gold sols showed that the particles had a mean diameter of 20 nm and had good
uniformity (Figure 7‐3).

189
Figure 7‐3: Transmission electron micrograph of citrate reduced Au colloids showing good homogeneity. The scale bar is 50nm.
7.2.4.2 Aggregation
In initial experiments the aggregation of the citrate reduced gold colloid particles was
induced by the addition of poly L‐lysine as this has been found by use to be very important
for SERS of dye molecules (Shadi et al., 2009). In this process 150 μL of a 0.01 % aqueous
solution of poly L‐lysine was added to 1 mL of gold colloid, which had been diluted with 1 mL
of de‐ionised water, followed by 150 μL of the dye solution. The pH was then adjusted to
enhance SERS (Whitney et al., 2006) by the addition of 35 μL of hydrochloric acid, 1 mol dm‐3
of KOH, or 10 μL of 1 mol dm‐3 KOH.
The above was found to give very little SERS (see below) so for subsequent experiments
poly‐L‐lysine was excluded with the rest of the analysis mixture as detailed above; a
phenomenon that has been previously observed (Shadi et al., 2003). For the enzyme
reactions the 150 μL of the dye solution was replaced with 150 μL of the enzyme reaction.
7.2.4.3 Instrumentation
Raman analysis spectra were collected using an Ahura Defender system (Ahura Scientifics,
Wilmington, MA, USA), a hand held, portable Raman spectrometer (using back scattered
geometry) with a built in 4 mL sample chamber which provided at the sample 300 mW laser
power at 785 nm +/‐ 0.5 nm laser excitation and 2 cm‐1 line width. The spectrometer has a

190
monochromatic spectral range of 781 – 1014 nm, a Raman spectrum range of 250 – 2875
cm‐1 and a spectral resolution of 7‐10.5 cm‐1 (full width at half maximum; FWHM). Built into
the Ahura spectrometer are Rayleigh rejection filters of OD 7, a silicon CCD 2048 pixels
detector in direct dispersive detection mode and a dispersion mode which is a single pass
spectrometer (1200 grooves/mm blazed at 900 nm).
The SERS colloid‐analyte aggregate was analysed by placing the sample into a 4 mL sample
chamber. All samples were analysed three times to give three machine replicate
measurements.
7.3 Results and discussion
7.3.1 Validation of the enzyme systems under study
Before any SERS analyses took place it was important to make sure that the succinate
dehydrogenase assay using an artificial electron acceptor with visible spectrophotometry as
detailed in Figure 7‐1 & Figure 7‐2 was functioning. Therefore as detailed above a series of
positive and negative controls were conducted. The positive controls included varying the
volume of the mitochondria preparation used (0.3, 0.6 or 0.9 mL), whilst the negative
controls included not having any succinate substrate present or any sodium azide inhibitor.
In addition, malonic acid was added with succinic acid in the reaction mixture as malonate is
a competitive inhibitor for succinate dehydrogenase.
The results of these preliminary experiments are shown in Figure 7‐4 where the absorbance
of DCPIP at 600 nm is plotted against reaction time. It can be seen that there was no
enzyme reaction measured in the negative control that contained no succinic acid substrate
(symbols = pluses) as the slope of the time reaction is more or less flat. This slope was also
very close to the reaction that contained malonic acid which inhibited the succinate
dehydrogenase enzyme (downward pointing triangles). The reaction mixture containing no

191
sodium azide (diamonds) still allowed some of the DCPIP to become reduced as this artificial
electron acceptor likely accepted excessive electrons generated from the electron transport
chain; the slope of this line was identical to the reaction mixture with 0.3 mL of
mitochondria preparation, which suggests that the concentration of succinate
dehydrogenase in this preparation was too low. By contrast, when the volume of
mitochondria preparation was increased to 0.6 mL (upward pointing triangles) and 0.9 mL
(circles) the slope decreased further showing that the enzyme reaction was faster as more
enzyme was used. From these experiments we decided that as the enzyme reaction
occurred fastest with 0.9 mL of mitochondria preparation this was to be used for the SERS
experiments.
Figure 7‐4: Graph representing the kinetic experiments (DCPIPox −> DCPIPred) monitored spectrophotometrically. The wavelength used for analysis is 600 nm. From the top to bottom are the controls employed to assay the enzyme activity; see text for full details. Correlations coeffients (R2) are also shown in the inset.
Figure legend0.3 mL mitochondria (R2=0.99)
0.9 mL mitochondria (R2=0.99)0.6 mL mitochondria (R2=1.00)
0.2 mL malonate (R2=0.99)no Na azide (R2=1.00)no succinate
Abso
rban
ce 6
00nm
(arb
itrar
y un
its)
Abso
rban
ce 6
00nm
(arb
itrar
y un
its)
0 500 1000 1500 2000 2500
Time (seconds)0 500 1000 1500 2000 2500
Time (seconds)

192
7.3.2 SERS optimisation
The Raman spectrum of powdered samples of DCPIP collected with an integration time of
10 s using full laser power (300 mW) is shown in Figure 7‐5 and this an information‐rich
spectrum contains plenty of molecular vibrations. However, whilst solution state spectra of
DCPIP could also be collected at high concentrations, the signal was very low at 3.3 x 10‐5
mol dm‐3 (data not shown) which was the concentration used in the enzyme reaction (vide
supra), therefore without very long collection times SERS would need to be employed.
Figure 7‐5: Representative raw Raman and SERS spectra, from top to bottom: Raman spectra of DCPIP in the solid state; followed by SERS spectra collected after 5 min aggregation at pH 7.2, pH 5.5 and pH 2.2 respectively. The three vibrational bands from SERS that were used for kinetic analysis are indicated by arrows and these are at 243, 404 and 498 cm‐1.
One advantage of SERS is that intense Raman signals enable analyte concentrations well
below monolayer coverage of the (gold) sol to be readily examined. Since aggregation is
essential for obtaining enhanced intensities, control of the aggregation process has to be
achieved if SERS is to be used. Based on previous studies (Shadi et al., 2009) we decided to
500 1000 1500
SE
RS
Inte
nsity
Wavenumber (cm-1)

193
use poly L‐lysine, which contains both positive and negative charged groups as well as HCl
(which maintains an acidic environment), as this combination provides a less dynamic and
thus more controllable aggregation procedure (Sirlin et al., 1990).
For optimisation of the SERS signal a dilute solution of the dye (150 µL; resulting in a final
concentration of 3.3 x 10‐5 mol dm‐3) was added to an aliquot of gold sol (1 mL) diluted with
1 mL of H2O to which was added 150 µL poly‐L‐lysine (0.01 %) and either HCl or KOH to
achieve the optimum solution pH. After this induction of colloid aggregation with
poly‐L‐lysine, subsequent collection of SERS occurred after 5 min. Unfortunately, the spectra
collected did not reveal vibrational bands attributed to DCPIP regardless of whether we
increased further aggregation time or investigating other pH conditions. It therefore
appeared that the addition of poly‐L‐lysine prevented collection of SERS spectra.
A subsequent set of experiments in the absence of poly‐L‐lysine were conducted as
described above. The pH conditions that were tested included pH 7.2, pH 5.5 and pH 2.2
and the resultant SERS spectra of 3.3 x 10‐5 mol dm‐3 DCPIP collected with an integration
time of 10 s using full laser power (300 mW) are shown in Figure 7‐5. It can be seen in this
figure that the best SERS spectrum (in terms of vibrational features) was when the pH of the
aggregating reaction was conducted at pH 7.2, with very few discernible features were
obtained from DCPIP under acidic conditions other than gold sol band at ~250 cm‐1.
7.3.3 Monitoring succinate dehydrogenase activity using SERS
Despite the above pH optimisation, for monitoring the reduction of DCPIP by electron
transfer the SERS aggregation was still assessed at the three different pH conditions as the
dye could exist in either the protonated or deprotonated forms (see Figure 7‐1 for the
structure of DCPIP).
For SERS analysis at pH 5.5 (the natural pH of the aggregating reaction) no vibrational bands
could be seen, with the exception of the sol band at 238 cm‐1 (Figure 7‐6A) and it was
194
therefore not surprising that no enzyme activity could be observed by plotting the intensity
of this band against time at this pH (Figure 7‐6B). When the experiment was repeated and
the pH adjusted to 2.2 (Figure 7‐6C) a direct correlation could be seen between the data
acquired using UV/Vis (Figure 7‐5) and SERS with the disadvantage that only the sol
vibrational band at 257 cm‐1 was suitable for analysis of enzyme activity by SERS. A plot of
SERS peak area versus time (Figure 7‐6D) provided a good correlation coefficient (R2=0.983),
but this is likely to be impractical as no spectral features from DCPIP were involved in this
correlation.
By contrast, by adjusting the pH to 7.2 the most marked SERS effect was observed which
resulted in strong vibrational bands (Figure 7‐6E) where the bands at 243, 404 and 498 cm‐1
could be used for quantitative analysis (Figure 7‐6F) providing good correlation coefficients
of 0.952, 0.976 and 0.939, respectively. In addition, whilst these fits are calculated from
linear regression it is clear from Figure 7‐6F that as expected the enzyme kinetics measured
are not really linear and are decaying as a function of time as the succinate substrate is
being converted into the product fumarate (Figure 7‐2).

195
Figure 7‐6: SERS spectra of the succinate dehydrogenase enzyme reaction. Aggregation was performed without poly L‐lysine at (A) pH 5.5, (C) pH 2.2 and (E) pH 7.2 ‐ from top to bottom the spectra shown were collected after 5, 10, 15, 20, 25 and 30 min of enzyme reaction. Plots of log10 peak area versus time for the vibrational bands at (B) 238 cm‐1 for measurements conducted at pH 5.5, (D) 257 cm‐1 (R2 = 0.983) for SERS at pH 2.2, and (F) for readings at pH 7.2 for bands 243, 404 and 498 cm‐1 (R2 = 0.952, 0.976 and 0.939, respectively); error bars show standard deviations from the three replicate measurements.
Wavenumber
Wavenumber
Wavenumber
(cm‐1)
(cm‐1)
(cm‐1)

196
An interesting physical chemistry observation relates to the quantitative decrease in the
peak areas of the SERS vibrational bands vs. time when comparison is made of the two
experiments conducted at acid and neutral pH (pH 2.2 and 7.2) see Figure 7‐6D and Figure
7‐6E. These data potentially suggest that two forms of the dye, protonated and
deprotonated, are present, and this is feasible when the structure of DCPIP is inspected (see
Figure 7‐1). It can be hypothesized that the decrease in intensity (peak area) of the “sol”
bands, as a function of time, for SERS experiments conducted at pH 2.2 and 7.2 (viz., 257 and
243 cm‐1 respectively) may be due to the packing effects of either competing species of
DCPIP or artefacts of enzyme activity competing for the surface sites on gold. Packing
effects (excess of monolayer coverage) on the surface would almost certainly decrease the
signal intensity and at the start of the enzymatic reaction the DCPIP concentration is
3.3 x 10‐5 mol dm‐3. Successive layers of molecules on the surface of the nanoparticles
would most likely be a contributory factor and appear to be the logical reason for the results
observed; e.g., an excess of monolayer coverage is being observed as enzyme activity
proceeds. The effect of packing effects when collecting SERS spectra have been reported
and this is a similar phenomenon that was observed in a separate study were it was shown
that an excess of monolayer coverage led to a proportional decrease in signal intensity
(Shadi et al., 2001). Close inspection of the two sol bands for pH 2.2 (Figure 7‐6D) and pH 7.2
(Figure 7‐6F) show that the reduction of this band at pH 2.2 is linear, which would support
the above packing hypothesis. By contrast, at pH 7.2 the decrease is non‐linear which shows
that packing is not occurring and follows the classic enzyme kinetic reactions; due to
depletion of substrate as detailed above. An observation that is also observed during the
conversion of DCPIP from its oxidised to reduced forms for the other two peaks at 404 and
498 cm‐1 (Figure 7‐6D). These bands certainly arise from the DCPIP molecule itself and are
possibly from C‐Cl stretches (498 cm‐1) and skeletal vibrations (404 cm‐1) (Degan, 1997) and

197
the additional small intensity band at ca. 800 cm‐1 (Figure 7‐5) originates from ring breathing
(Degan, 1997) further highlighting that the reporter molecule itself is being measured.
7.4 Concluding remarks
The main objective of this work was to monitor a metabolic pathway utilising SERS as the
reporting tool. For the first time a widely studied pathway, the kinetics of succinate
dehydrogenase activity, is reported employing Raman spectroscopy to monitor this enzyme
activity using a SERS reporter dye as a model system probe. The data reported clearly show
a direct correlation between acquisition of SERS spectra at specific time intervals and that
obtained using classical spectrophotometric techniques. Very good correlations were
observed for quantitative analysis as the reaction proceeded and the SERS aggregation
protocol developed was pH dependent. In the future we plan to investigate the multiplexing
of SERS where different reporter molecules are used which are ‘tuned’ into different
metabolic processes, as detailed for DNA sequence detection by Graham, Faulds and
colleagues (Graham et al., 2002, Faulds et al., 2007, MacAskill et al., 2009). In conclusion,
we believe that SERS has considerable potential for being applied to the analysis of
metabolic processes, and to our knowledge this is the first study of a metabolic pathway
that has been monitored by SERS.

198
Chapter 8: Overall Summary and Conclusions
The aim of the work undertaken in this course of research was to incorporate the use of
bio‐analytical techniques into dermatology research. It is common place that patients who
are suffering from skin disorders are diagnosed and the extent of the disease assessed by a
dermatologist and hence an element of subjective human error can be involved. This is
extremely prevalent when you consider the PASI scoring system for psoriasis as described in
Chapter 6: and the importance associated with the complete removal of a keloid scar in
keloid patients undergoing surgery (Chapter 3:). The availability and application of methods
to screen patients and hence potentially quantify the level of disease or response to
treatment could provide beneficial routes in disease management.
The application of these bio‐analytical approaches began with an attempt to analyse human
skin biopsy samples from psoriatic patients using MALDI‐MS. Whilst this technique has been
regularly utilised for the imaging of intact tissue, when applied to skin tissue the results were
disappointing. Although it was possible to gain some mass spectra of sufficient quality, the
reproducibility of the method was poor. It was common that a good spectrum would be
neighboured by mass spectra of poor signal‐to‐noise and minimal peak presence. The reason
for these poor results is as yet unknown and personal communication with Prof. Ron Heeren
confirmed that similar problems associated with imaging skin are occurring in other MALDI‐
MS laboratories. Perhaps in the future this method may be applicable for the study of skin
disorders through further development of the technique.
FT‐IR microspectroscopy was the next approach to be applied to the analysis of skin
samples. In this study the technique was used for the analysis of keloid scars which had been
surgically excised from patients with keloid disease. The major advantage of analysing keloid
sections is the unique morphology of the sample. Upon excision it is common that the

199
surgeon will remove the surrounding normal tissue in an attempt to prolong the time taken
for the keloid tumour to return. The samples that were available therefore contained both
normal and diseased areas in the same section, thus eliminating inter‐sample variation often
incorporated when using control samples. On a case to case basis it was possible through
PCA to discriminate between normal and keloid areas successfully using FT‐IR microscopy.
Through the application of PLS‐DA it was possible to further validate this result to include
100 spectra collected from a collection of patients and sample locations. This model gave a
positive result which can suggest that FT‐IR spectroscopy could be readily used to
discriminate between keloid and normal tissue and has potential to be transferable to other
skin conditions. Furthermore the method of FT‐IR imaging was applied to a keloid sample; by
collating 14 individual FT‐IR images it was possible to investigate the cellular composition
and variation in keloid skin and the surrounding tissue. This method illustrated the complex
cellular composition present within a keloid scar, with increased lipid, amide and phosphate
levels being observed. This measurable variation could, in the future, be incorporated into
surgical procedures to allow targeted excision ensuring all keloid areas where removed.
In an alternative approach the response of HaCaT cells upon exposure to three anti‐psoriatic
drugs was investigated. The response was probed by the analysis of the internal and
external metabolome and the internal proteome of the cells. The use of a metabolomic and
proteomic approach allowed for the holistic, high‐throughput analysis of a wide array of
metabolites and proteins. The metabolome analysis was particularly successful for the
analysis of dithranol treated cells. In this analysis a vast number of metabolites were
deemed to be significantly affected upon drug exposure. It was possible to reconstruct a
metabolite map which began to depict the biological effect of the drug. It became clear that
the drug was successfully targeting principal pathways in central metabolism including
glycolysis and the TCA cycle. In addition, the concentrations of a number of amino acids
were significantly altered by dithranol which implies that growth metabolism is an

200
additional/connected target. This method was successful in highlighting a number of
metabolites which could potentially be used as indicators of successful treatment. It was
however relatively disappointing that the results gained for methotrexate and ciclosporin
treatment failed to provide significant insight into the exposure targets. This was attributed
to the mode of action of these drugs and highlights that although metabolomics is a
powerful method of analysis its application can in some cases be limited.
The complementary qualitative proteomic analysis also provided useful information
regarding the mode of action of these anti‐psoriatic drugs. The development of a scoring
system assessing the presence or absence of a protein allowed for a semi‐quantitative
approach which identified proteins as up‐regulated, down‐regulated or unaffected by
treatment. A number of enzymes from central metabolism were identified within the
proteome of HaCaT cells exposed to dithranol, methotrexate and ciclosporin. Dithranol was
found to have a greater pronounced affect on the enzymes of central metabolism. A
down‐regulation of enzymes located within glycolysis and the TCA was noted which
correlated well with the previous results from metabolome analysis. In addition, vast arrays
of proteins which are not primarily associated with central metabolism were identified
within the proteome of HaCaT cells exposed to the drugs. The findings varied greatly from
drug to drug therefore suggesting varying modes of action. The analysis highlighted a
number of novel proteins which have previously not been linked to anti‐psoriatic treatment
methods which could, with further quantitative validation prove to be novel biomarkers of
successful treatment.
The investigation of methotrexate treated cells utilising both a metabolomic and proteomic
approach was somewhat hindered by the mechanism of action of the drug; i.e., acting as an
immunosuppressant. Therefore when the opportunity arose to analyse a number of plasma
samples from patients undergoing methotrexate treatment a further metabolomic‐based

201
analysis was conducted. This study was not without its limitations and the experimental
design was not optimal for metabolomic profiling. In particular a vast amount of metadata
was unavailable including BMI and age and there was no regulation of diet prior to sample
collection. It was not possible to discriminate between responders and non‐responders
using PCA however a collection of metabolites were deemed to be significant using Kruskal‐
Wallis analysis. These metabolites could potentially be used as indicators of response;
however these results would require significant validation in a larger and more strictly
controlled study. Interestingly, in addition to these indicators of response it was also
possible to identify metabolites correlated to gender of patient. Ultimately this study was
useful to demonstrate the importance of experimental design but also illustrated the
successful technique of plasma analysis in a metabolomics‐based analysis.
The final approach adopted in this thesis was to investigate the dynamic enzymatic succinate
dehydrogenase reaction using SERS as a reporting tool. The enzyme is responsible for
catalyzing the oxidation of succinate to fumarate in the TCA cycle of metabolism, an area
which has been highlighted in the metabolomic and proteomic investigations previously
discussed. The data reported clearly indicates a direct correlation between acquisition of
SERS spectra at specific time intervals and that obtained using classical UV‐VIS
spectrophotometric techniques. The success of this experiment could imply that further
enzymatic reactions could be tracked utilising SERS with a variety of different reporter
molecules. This approach would be a beneficial addition to the analysis of metabolic
process.
This project has successfully used a number of bio‐analytical techniques to investigate
dermatological problems. While the ultimate goal would be the application of a single
analytical technique to provide answers to biological questions, it has been found that a
number of complementary techniques and statistical data handling approaches can provide
a valuable insight into the problems posed.

202
Chapter 9: References AEBERSOLD, R. & MANN, M. (2003) Mass spectrometry‐based proteomics. Nature, 422, 198‐
207. ALLWOOD, J. W., ELLIS, D. I. & GOODACRE, R. (2008) Biomarker metabolites capturing the
metabolite variance present in a rice plant developmental period. Physiologia Plantarum, 132, 117‐135.
ALLWOOD, J. W. & GOODACRE, R. (2010) An Introduction to Liquid Chromatography‐Mass Spectrometry Instrumentation Applied in Plant Metabolomic Analyses. Phytochemical Analysis, 21, 33‐47.
ALTMAN, E. M. & KAMINO, H. (1999) Diagnosis: Psoriasis or not? What are the clues? Seminars in Cutaneous Medicine and Surgery, 18, 25‐35.
ANDANSON, J. M., HADGRAFT, J. & KAZARIAN, S. G. (2009) In situ permeation study of drug through the stratum corneum using attenuated total reflection Fourier transform infrared spectroscopic imaging. Journal of Biomedical Optics, 14, 8.
BAILO, E. & DECKERT, V. (2008) Tip‐enhanced Raman scattering. Chemical Society Reviews, 37, 921‐930.
BARWISE, J. L. & WALKER, J. H. (1996) Annexins II, IV, V and VI relocate in response to rises in intracellular calcium in human foreskin fibroblasts. Journal of Cell Science, 109, 247‐255.
BASTIAN, B. C., VAN DER PIEPEN, U., ROEMISCH, J., PAQUES, E.‐P. & BROECKER, E.‐B. (1993) Localization of annexins in normal and diseased human skin. Journal of Dermatological Science, 6, 225‐234.
BAYAT, A., ARSCOTT, G., OLLIER, W. E. R., FERGUSON, M. W. J. & MC GROUTHER, D. A. (2004) Description of site‐specific morphology of keloid phenotypes in an Afrocaribbean population. British Journal of Plastic Surgery, 57, 122‐133.
BAYAT, A., ARSCOTT, G., OLLIER, W. E. R., MC GROUTHER, D. A. & FERGUSON, M. W. J. (2005) Keloid disease: clinical relevance of single versus multiple site scars. British Journal of Plastic Surgery, 58, 28‐37.
BAYAT, A. & MCGROUTHER, D. A. (2005) Clinical management of skin scarring. Skinmed, 4, 165‐73.
BAYAT, A. & MCGROUTHER, D. A. (2006) Spectrum of abnormal skin scars and their clinical management. British Journal of Hospital Medicine, 67, 527‐532.
BAYAT, A., MCGROUTHER, D. A. & FERGUSON, M. W. J. (2003) Skin scarring. British Medical Journal, 326, 88‐92.
BEAUSANG, E., FLOYD, H., DUNN, K. W., ORTON, C. I. & FERGUSON, M. W. J. (1998) A new quantitative scale for clinical scar assessment. Plastic and Reconstructive Surgery, 102, 1954‐1961.
BEGLEY, P., FRANCIS‐MCINTYRE, S., DUNN, W. B., BROADHURST, D. I., HALSALL, A., TSENG, A., KNOWLES, J., GOODACRE, R., KELL, D. B. & CONSORTIUM, H. (2009) Development and Performance of a Gas Chromatography‐Time‐of‐Flight Mass Spectrometry Analysis for Large‐Scale Nontargeted Metabolomic Studies of Human Serum. Analytical Chemistry, 81, 7038‐7046.
BELSO, N., SZELL, M., PIVARCSI, A., KIS, K., KORMOS, B., KENDERESSY, A. S., DOBOZY, A., KEMENY, L. & BATA‐CSORGO, Z. (2007) Differential Expression of D‐Type Cyclins in HaCaT Keratinocytes and in Psoriasis. J Invest Dermatol, 128, 634‐642.
BERNARD, G., AUGER, M., SOUCY, J. & POULIOT, R. (2007) Physical characterization of the stratum corneum of an in vitro psoriatic skin model by ATR‐FTIR and Raman spectroscopies. Biochimica Et Biophysica Acta‐General Subjects, 1770, 1317‐1323.
BERTH‐JONES, J. (2005) The use of ciclosporin in psoriasis. Journal of Dermatological Treatment, 16, 258‐277.

203
BHALERAO, J. & BOWCOCK, A. M. (1998) The genetics of psoriasis: a complex disorder of the skin and immune system. Human Molecular Genetics, 7, 1537‐1545.
BOEHNCKE, S., THACI, D., BESCHMANN, H., LUDWIG, R. J., ACKERMANN, H., BADENHOOP, K. & BOEHNCKE, W. H. (2007) Psoriasis patients show signs of insulin resistance. British Journal of Dermatology, 157, 1249‐1251.
BOGDANOV, M., MATSON, W. R., WANG, L., MATSON, T., SAUNDERS‐PULLMAN, R., BRESSMAN, S. S. & BEAL, M. F. (2008) Metabolomic profiling to develop blood biomarkers for Parkinson's disease. Brain, 131, 389‐396.
BOS, J. D. & SPULS, P. I. (2008) Topical treatments in psoriasis: today and tomorrow. Clinics in Dermatology, 26, 432‐437.
BOUKAMP, P., PETRUSSEVSKA, R. T., BREITKREUTZ, D., HORNUNG, J., MARKHAM, A. & FUSENIG, N. E. (1988) NORMAL KERATINIZATION IN A SPONTANEOUSLY IMMORTALIZED ANEUPLOID HUMAN KERATINOCYTE CELL‐LINE. Journal of Cell Biology, 106, 761‐771.
BOWCOCK, A. M. & KRUEGER, J. G. (2005) Getting under the skin: The immunogenetics of psoriasis. Nature Reviews Immunology, 5, 699‐711.
BRENELLI, S. L., MORAES, A. M., MONTEALEGRE, S., CARVALHO, O. M. F. & SAAD, M. J. A. (1995) Insulin‐Resistance in Psoriasis. Brazilian Journal of Medical and Biological Research, 28, 297‐301.
BROADHURST, D. & KELL, D. B. (2006) Statistical strategies for avoiding false discoveries in metabolomics and related experiments. Metabolomics, 2, 171‐196.
BROOME, A. M. & ECKERT, R. L. (2004) Microtubule‐dependent redistribution of a cytoplasmic cornified envelope precursor. Journal of Investigative Dermatology, 122, 29‐38.
BROOME, A. M., RYAN, D. & ECKERT, R. L. (2003) S100 protein subcellular localization during epidermal differentiation and psoriasis. Journal of Histochemistry & Cytochemistry, 51, 675‐685.
BROWN, B. C., MCKENNA, S. P., SIDDHI, K., MCGROUTHER, D. A. & BAYAT, A. (2008) The hidden cost of skin scars: quality of life after skin scarring. Journal of Plastic Reconstructive and Aesthetic Surgery, 61, 1049‐1058.
BROWN, J. J. & BAYAT, A. (2009) Genetic susceptibility to raised dermal scarring. British Journal of Dermatology, 161, 8‐18.
BROWN, M., DUNN, W. B., DOBSON, P., PATEL, Y., WINDER, C. L., FRANCIS‐MCINTYRE, S., BEGLEY, P., CARROLL, K., BROADHURST, D., TSENG, A., SWAINSTON, N., SPASIC, I., GOODACRE, R. & KELL, D. B. (2009) Mass spectrometry tools and metabolite‐specific databases for molecular identification in metabolomics. Analyst, 134, 1322‐1332.
CAPRIOLI, R. M., FARMER, T. B. & GILE, J. (1997) Molecular imaging of biological samples: Localization of peptides and proteins using MALDI‐TOF MS. Analytical Chemistry, 69, 4751‐4760.
CHAUDRY, M. A., AMIN, S. & MALIK, M. T. (1996) Tri‐n‐octylamine‐xylene‐based supported liquid membranes and transport of Ce(IV) ions. Separation Science and Technology, 31, 1309‐1326.
CHAURAND, P., STOECKLI, M. & CAPRIOLI, R. M. (1999) Direct profiling of proteins in biological tissue sections by MALDI mass spectrometry. Analytical Chemistry, 71, 5263‐5270.
CHOI, J. H., OCONNOR, T. P., KANG, S., VOORHEES, J. J. & FISHER, G. J. (1997) Activation of ribosomal protein S6 kinase in psoriatic lesions and cultured human keratinocytes by epidermal growth factor receptor ligands. Journal of Investigative Dermatology, 108, 98‐102.

204
COGHLIN, C., CARPENTER, B., DUNDAS, S. R., LAWRIE, L. C., TELFER, C. & MURRAY, G. I. (2006) Characterization and over‐expression of chaperonin t‐complex proteins in colorectal cancer. Journal of Pathology, 210, 351‐357.
COHEN, A. D., DREIHER, J. & BIRKENFELD, S. (2009) Psoriasis associated with ulcerative colitis and Crohn's disease. Journal of the European Academy of Dermatology and Venereology, 23, 561‐565.
CONSTANTIN, B., MEERSCHAERT, K., VANDEKERCKHOVE, J. & GETTEMANS, J. (1998) Disruption of the actin cytoskeleton of mammalian cells by the capping complex actin‐fragmin is inhibited by actin phosphorylation and regulated by Ca2+ ions. Journal of Cell Science, 111, 1695‐1706.
CUMBERBATCH, M., SINGH, M., DEARMAN, R. J., YOUNG, H. S., KIMBER, I. & GRIFFITHS, C. E. M. (2006) Impaired Langerhans cell migration in psoriasis. Journal of Experimental Medicine, 203, 953‐960.
DARMAUN, D., MATTHEWS, D. E., DESJEUX, J. F. & BIER, D. M. (1988) GLUTAMINE AND GLUTAMATE NITROGEN EXCHANGEABLE POOLS IN CULTURED FIBROBLASTS ‐ A STABLE ISOTOPE STUDY. Journal of Cellular Physiology, 134, 143‐148.
DAUTRY, C., CONDE, F., BROUILLET, E., MITTOUX, V., BEAL, M. F., BLOCH, G. & HANTRAYE, P. (1999) Serial 1H‐NMR spectroscopy study of metabolic impairment in primates chronically treated with the succinate dehydrogenase inhibitor 3‐nitropropionic acid. Neurobiology of Disease, 6, 259‐268.
DEGAN, I. A. (1997) Tables of chracteristic group frequencies for the interpretation of infrared and Raman spectra, Acolyte Publications.
DUNN, W. B. (2008) Current trends and future requirements for the mass spectrometric investigation of microbial, mammalian and plant metabolomes. Physical Biology, 5.
DUNN, W. B., BAILEY, N. J. C. & JOHNSON, H. E. (2005) Measuring the metabolome: current analytical technologies. Analyst, 130, 606‐625.
DUNN, W. B., BROADHURST, D., BROWN, M., BAKER, P. N., REDMAN, C. W. G., KENNY, L. C. & KELL, D. B. (2008) Metabolic profiling of serum using Ultra Performance Liquid Chromatography and the LTQ‐Orbitrap mass spectrometry system. Journal of Chromatography B‐Analytical Technologies in the Biomedical and Life Sciences, 871, 288‐298.
DUNN, W. B. & ELLIS, D. I. (2005) Metabolomics: Current analytical platforms and methodologies. Trac‐Trends in Analytical Chemistry, 24, 285‐294.
DURANI, P. & BAYAT, A. (2008) Levels of evidence for the treatment of keloid disease. Journal of Plastic Reconstructive and Aesthetic Surgery, 61, 4‐17.
DUVIC, M., NAGPAL, S., ASANO, A. T. & CHANDRARATNA, R. A. S. (1997) Molecular mechanisms of tazarotene action in psoriasis. Journal of the American Academy of Dermatology, 37, S18‐S24.
EBBELS, T. M. D., BUXTON, B. F. & JONES, D. T. (2006) springScape: visualisation of microarray and contextual bioinformatic data using spring embedding and an 'information landscape'. Bioinformatics, 22, E99‐E107.
ECKERT, R. L., BROOME, A. M., RUSE, M., ROBINSON, N., RYAN, D. & LEE, K. (2004) S100 proteins in the epidermis. Journal of Investigative Dermatology, 123, 23‐33.
EHRLICH, H. P., ALLISON, G. M., PAGE, M. J., KOLTON, W. A. & GRAHAM, M. (2000) Increased gelsolin expression and retarded collagen lattice contraction with smooth muscle cells from Crohn's diseased intestine. Journal of Cellular Physiology, 182, 303‐309.
EL‐ANEED, A., COHEN, A. & BANOUB, J. (2009) Mass Spectrometry, Review of the Basics: Electrospray, MALDI, and Commonly Used Mass Analyzers. Applied Spectroscopy Reviews, 44, 210‐230.
205
ELLIS, D. I., BROADHURST, D. & GOODACRE, R. (2004) Rapid and quantitative detection of the microbial spoilage of beef by Fourier transform infrared spectroscopy and machine learning. Analytica Chimica Acta, 514, 193‐201.
ELLIS, D. I., DUNN, W. B., GRIFFIN, J. L., ALLWOOD, J. W. & GOODACRE, R. (2007) Metabolic fingerprinting as a diagnostic tool. Pharmacogenomics, 8, 1243‐1266.
ELLIS, D. I. & GOODACRE, R. (2006) Metabolic fingerprinting in disease diagnosis: biomedical applications of infrared and Raman spectroscopy. Analyst, 131, 875‐885.
EXUM, M. L., RAPP, S. R., FELDMAN, S. R., FLEISCHER, A. B., REBOUSSIN, D. M. & CLARK, A. R. (1996) Measuring severity of psoriasis: Methodological issues. Journal of Dermatological Treatment, 7, 119‐124.
FABIAN, H., THI, N. A. N., EIDEN, M., LASCH, P., SCHMITT, J. & NAUMANN, D. (2006) Diagnosing benign and malignant lesions in breast tissue sections by using IR‐microspectroscopy. Biochimica et Biophysica acta. Biomembranes, 1758, 874‐882.
FARKAS, A., KEMENY, L., SZONY, B. J., BATA‐CSORGO, Z., PIVARCSI, A., KISS, M., SZELL, M., KORECK, A. & DOBOZY, A. (2001) Dithranol upregulates IL‐10 receptors on the cultured human keratinocyte cell line HaCaT. Inflammation Research, 50, 44‐49.
FAULDS, K., MCKENZIE, F., SMITH, W. E. & GRAHAM, D. (2007) Quantitative simultaneous multianalyte detection of DNA by dual‐wavelength surface‐enhanced resonance Raman scattering. Angewandte Chemie‐International Edition, 46, 1829‐1831.
FELLENBERG, J., DECHANT, M. J., EWERBECK, V. & MAU, H. (2003) Identification of drug‐regulated genes in osteosarcoma cells. International Journal of Cancer, 105, 636‐643.
FERNANDEZ, D. C., BHARGAVA, R., HEWITT, S. M. & LEVIN, I. W. (2005) Infrared spectroscopic imaging for histopathologic recognition. Nature Biotechnology, 23, 469‐474.
FERRARO, J. R. & NAKAMOTO, K. (1994) Introductory Raman Spectroscopy, London, Academic Press.
FISHER, G. J., DUELL, E. A., NICKOLOFF, B. J., ANNESLEY, T. M., KOWALKE, J. K., ELLIS, C. N. & VOORHEES, J. J. (1988) LEVELS OF CYCLOSPORIN IN EPIDERMIS OF TREATED PSORIASIS PATIENTS DIFFERENTIALLY INHIBIT GROWTH OF KERATINOCYTES CULTURED IN SERUM FREE VERSUS SERUM CONTAINING MEDIA. Journal of Investigative Dermatology, 91, 142‐146.
FITZGERALD, O. & WINCHESTER, R. (2009) Psoriatic arthritis: from pathogenesis to therapy. Arthritis Research & Therapy, 11.
FIUZA, C., BUSTIN, M., TALWAR, S., TROPEA, M., GERSTENBERGER, E., SHELHAMER, J. H. & SUFFREDINI, A. F. (2003) Inflammation‐promoting activity of HMGB1 on human microvascular endothelial cells. Blood, 101, 2652‐2660.
FLYTSTROM, I., STENBERG, B., SVENSSON, A. & BERGBRANT, I. M. (2008) Methotrexate vs. ciclosporin in psoriasis: effectiveness, quality of life and safety. A randomized controlled trial. British Journal of Dermatology, 158, 116‐121.
FUCHS, J., NITSCHMANN, W. H. & PACKER, L. (1990) THE ANTIPSORIATIC COMPOUND ANTHRALIN INFLUENCES BIOENERGETIC PARAMETERS AND REDOX PROPERTIES OF ENERGY TRANSDUCING MEMBRANES. Journal of Investigative Dermatology, 94, 71‐76.
FUJIOKA, N., MORIMOTO, Y., ARAI, T. & KIKUCHI, M. (2004) Discrimination between normal and malignant human gastric tissues by Fourier transform infrared spectroscopy. Cancer Detection and Prevention, 28, 32‐36.
GAO, P., LU, C., ZHANG, F. X., SANG, P., YANG, D. W., LI, X., KONG, H. W., YIN, P. Y., TIAN, J., LU, X., LU, A. P. & XU, G. W. (2008) Integrated GC‐MS and LC‐MS plasma metabonomics analysis of ankylosing spondylitis. Analyst, 133, 1214‐1220.

206
GAZI, E., HARVEY, T. J., BROWN, M. D., LOCKYER, N. P., GARDNER, P. & CLARKE, N. W. (2009) A FTIR microspectroscopic study of the uptake and metabolism of isotopically labelled fatty acids by metastatic prostate cancer. Vibrational Spectroscopy, 50, 99‐105.
GIROLOMONI, G. & GISONDI, P. (2008) Psoriasis and metabolic comorbidities: The importance of well‐designed prospective studies. Dermatology, 217, 222‐224.
GISONDI, P., FANTUZZI, F., MALERBA, M. & GIROLOMONI, G. (2007) Folic acid in general medicine and dermatology. Journal of Dermatological Treatment, 18, 138‐146.
GOLDSTEIN, A. M. (2003) Changing paradigms in dermatology: Proteomics: A new approach to skin disease. Clinics in Dermatology, 21, 370‐374.
GOODACRE, R. (2007) Metabolomics of a superorganism. Journal of Nutrition, 137, 259S‐266S.
GORG, A., WEISS, W. & DUNN, M. J. (2004) Current two‐dimensional electrophoresis technology for proteomics. Proteomics, 4, 3665‐3685.
GOTTLIEB, A. B., CHAO, C. & DANN, F. (2008) Psoriasis comorbidities. Journal of Dermatological Treatment, 19, 5‐21.
GOTTLIEB, A. B. & DANN, F. (2009) Comorbidities in Patients with Psoriasis. American Journal of Medicine, 122, 9.
GOURAUND, H. (1971) Continuous shading of curved sufcaes. IEEE Trans Computers, C‐20, 623‐629.
GRAHAM, D. & FAULDS, K. (2008) Quantitative SERRS for DNA sequence analysis. Chemical Society Reviews, 37, 1042‐1051.
GRAHAM, D., MALLINDER, B. J., WHITCOMBE, D., WATSON, N. D. & SMITH, W. E. (2002) Simple multiplex genotyping by surface‐enhanced resonance Raman scattering. Analytical Chemistry, 74, 1069‐+.
GRIFFITHS, C. E. M. & BARKER, J. (2007) Psoriasis 1 ‐ Pathogenesis and clinical features of psoriasis. Lancet, 370, 263‐271.
HAMMAR, H. (1975) EPIDERMAL NICOTINAMIDE ADENINE DINUCLEOTIDES IN PSORIASIS DURING TREATMENT WITH DITHRANOL. Archiv Fur Dermatologische Forschung, 252, 229‐236.
HANH, B. D., NEUBERT, R. H. H., WARTEWIG, S., CHRIST, A. & HENTZSCH, C. (2000) Drug penetration as studied by noninvasive methods: Fourier transform infrared‐attenuated total reflection, Fourier transform infrared, and ultraviolet photoacoustic spectroscopy. Journal of Pharmaceutical Sciences, 89, 1106‐1113.
HARDMAN, M. & MAKAROV, A. A. (2003) Interfacing the orbitrap mass analyzer to an electrospray ion source. Analytical Chemistry, 75, 1699‐1705.
HENSELER, T. & CHRISTOPHERS, E. (1995) Disease Concomitance in Psoriasis. Journal of the American Academy of Dermatology, 32, 982‐986.
HOLLANDER, M. & WOLFE, D. A. (1999) Nonparametric Statistical Methods, Hoboken, NJ, John Wiley & Sons.
HOLLYWOOD, K., BRISON, D. R. & GOODACRE, R. (2006) Metabolomics: current technologies and future trends. Proteomics, 6, 4716‐4723.
HUNT, D. F., HENDERSON, R. A., SHABANOWITZ, J., SAKAGUCHI, K., MICHEL, H., SEVILIR, N., COX, A. L., APPELLA, E. & ENGELHARD, V. H. (1992) CHARACTERIZATION OF PEPTIDES BOUND TO THE CLASS‐I MHC MOLECULE HLA‐A2.1 BY MASS‐SPECTROMETRY. Science, 255, 1261‐1263.
INGRAM, A., BYERS, L., FAULDS, K., MOORE, B. D. & GRAHAM, D. (2008) SERRS‐based enzymatic probes for the detection of protease activity. Journal of the American Chemical Society, 130, 11846‐11847.
JARVIS, R. M. & GOODACRE, R. (2008) Characterisation and identification of bacteria using SERS. Chemical Society Reviews, 37, 931‐936.

207
JOLLIFFE, I. T. (1986) Principal Component Analysis, New York, Springer‐Verlag. JONES (2000) Serum creatinine levels in the US population: Third national health and
nutrition examination survey (vol 32, pg 992, 1998). American Journal of Kidney Diseases, 35, 178‐178.
KADDURAH‐DAOUK, R., MCEVOY, J., BAILLIE, R. A., LEE, D., YAO, J. K., DORAISWAMY, P. M. & KRISHNAN, K. R. R. (2007) Metabolomic mapping of atypical antipsychotic effects in schizophrenia. Molecular Psychiatry, 12, 934‐945.
KALB, R. E., STROBER, B., WEINSTEIN, G. & LEBWOHL, M. (2009) Methotrexate and psoriasis: 2009 National Psoriasis Foundation Consensus Conference. Journal of the American Academy of Dermatology, 60, 824‐837.
KALTWASSER, J. P., NASH, P., GLADMAN, D., ROSEN, C. F., BEHRENS, F., JONES, P., WOLLENHAUPT, J., FALK, F. G. & MEASE, P. (2004) Efficacy and safety of leflunomide in the treatment of psoriatic arthritis and psoriasis ‐ A multinational, double‐blind, randomized, placebo‐controlled clinical trial. Arthritis and Rheumatism, 50, 1939‐1950.
KANITAKIS, J. & THIVOLET, J. (1990) CYCLOSPORINE ‐ AN IMMUNOSUPPRESSANT AFFECTING EPITHELIAL‐CELL PROLIFERATION. Archives of Dermatology, 126, 369‐375.
KARAS, M., BACHMANN, D., BAHR, U. & HILLENKAMP, F. (1987) MATRIX‐ASSISTED ULTRAVIOLET‐LASER DESORPTION OF NONVOLATILE COMPOUNDS. International Journal of Mass Spectrometry and Ion Processes, 78, 53‐68.
KELL, D. B. & OLIVER, S. G. (2004) Here is the evidence, now what is the hypothesis? The complementary roles of inductive and hypothesis‐driven science in the post‐genomic era. Bioessays, 26, 99‐105.
KENNY, L. C., BROADHURST, D., BROWN, M., DUNN, W. B., REDMAN, C. W. G., KILL, D. B. & BAKER, P. N. (2008) Detection and identification of novel metabolomic biomarkers in preeclampsia. Reproductive Sciences, 15, 591‐597.
KENNY, L. C., DUNN, W. B., ELLIS, D. I., MYERS, J., BAKER, P. N. & KELL, D. B. (2005) Novel biomarkers for pre‐eclampsia detected using metabolomics and machine learning. Metabolomics, 1, 227‐234.
KNEIPP, K., KNEIPP, H., ITZKAN, I., DASARI, R. R., FELD, M. S. & DRESSELHAUS, M. S. (2002) Nonlinear Raman probe of single molecules attached to colloidal silver and gold clusters. Optical Properties of Nanostructured Random Media, 82, 227‐247.
KOCHHAR, S., JACOBS, D. M., RAMADAN, Z., BERRUEX, F., FUERHOZ, A. & FAY, L. B. (2006) Probing gender‐specific metabolism differences in humans by nuclear magnetic resonance‐based metabonomics. Analytical Biochemistry, 352, 274‐281.
KOCZAN, D., GUTHKE, R., THIESEN, H. J., IBRAHIM, S. M., KUNDT, G., KRENTZ, H., GROSS, G. & KUNZ, M. (2005) Gene expression profiling of peripheral blood mononuclear leukocytes from psoriasis patients identifies new immune regulatory molecules. European Journal of Dermatology, 15, 251‐257.
KRIS, G. & JOËL, V. (2000) Protein identification methods in proteomics. Electrophoresis, 21, 1145‐1154.
KRISHNA, C. M., SOCKALINGUM, G. D., BHAT, R. A., VENTEO, L., KUSHTAGI, P., PLUOT, M. & MANFAIT, M. (2007) FTIR and Raman microspectroscopy of normal, benign, and malignant formalin‐fixed ovarian tissues. Analytical and Bioanalytical Chemistry, 387, 1649‐1656.
KRUEGER, G., KOO, J., LEBWOHL, M., MENTER, A., STERN, R. S. & ROLSTAD, T. (2001) The impact of psoriasis on quality of life ‐ Results of a 1998 National Psoriasis Foundation Patient‐Membership Survey. Archives of Dermatology, 137, 280‐284.
KRUEGER, J. G. & BOWCOCK, A. (2005) Psoriasis pathophysiology: current concepts of pathogenesis. Annals of the Rheumatic Diseases, 64, 30‐36.

208
LAPORTE, M., GALAND, P., FOKAN, D., DE GRAEF, C. & HEENEN, M. (2000) Apoptosis in established and healing psoriasis. Dermatology, 200, 314‐316.
LASCH, P., HAENSCH, W., NAUMANN, D. & DIEM, M. (2004) Imaging of colorectal adenocarcinoma using FT‐IR microspectroscopy and cluster analysis. Biochimica Et Biophysica Acta‐Molecular Basis of Disease, 1688, 176‐186.
LECHLER, T. & FUCHS, E. (2007) Desmoplakin: An unexpected regulator of microtubule organization in the epidermis. Journal of Cell Biology, 176, 147‐154.
LEE, P. C. & MEISEL, D. (1982) ADSORPTION AND SURFACE‐ENHANCED RAMAN OF DYES ON SILVER AND GOLD SOLS. Journal of Physical Chemistry, 86, 3391‐3395.
LEE, W. H., KIM, J. Y., KIM, Y. S., SONG, H. J., KI‐JOON, S., SONG, J. W., BAEK, L. J., SEO, E. Y., KIM, C. D., LEE, J. H. & KEE, S. H. (2005) Upregulation of class II beta‐tubulin expression in differentiating keratinocytes. Journal of Investigative Dermatology, 124, 291‐297.
LEWIS, E. N., TREADO, P. J., REEDER, R. C., STORY, G. M., DOWREY, A. E., MARCOTT, C. & LEVIN, I. W. (1995) Fourier transform spectroscopic imaging using an infrared focal‐plane array detector. Analytical Chemistry, 67, 3377‐3381.
LI, X., XU, Z. L., LU, X., YANG, X. H., YIN, P. Y., KONG, H. W., YU, Y. & XU, G. W. (2009) Comprehensive two‐dimensional gas chromatography/time‐of‐flight mass spectrometry for metabonomics: Biomarker discovery for diabetes mellitus. Analytica Chimica Acta, 633, 257‐262.
LIM, C. S., POTTS, M. & HELM, R. E. (2006) Nicotinamide extends the replicative life span of primary human cells. Mechanisms of Ageing and Development, 127, 511‐514.
LIU, K. Z., XU, M. Q. & SCOTT, D. A. (2007) Biomolecular characterisation of leucocytes by infrared spectroscopy. British Journal of Haematology, 136, 713‐722.
LIU, X. Q., LIN, C. Y., LEI, M., YAN, S., ZHOU, T. H. & ERIKSON, R. L. (2005) CCT chaperonin complex is required for the biogenesis of functional Plk1. Molecular and Cellular Biology, 25, 4993‐5010.
LOWES, M. A., BOWCOCK, A. M. & KRUEGER, J. G. (2007) Pathogenesis and therapy of psoriasis. Nature, 445, 866‐873.
MACASKILL, A., CRAWFORD, D., GRAHAM, D. & FAULDS, K. (2009) DNA Sequence Detection Using Surface‐Enhanced Resonance Raman Spectroscopy in a Homogeneous Multiplexed Assay. Analytical Chemistry, 81, 8134‐8140.
MACDONALD, N., CUMBERBATCH, M., SINGH, M., MOGGS, J. G., ORPHANIDES, G., DEARMAN, R. J., GRIFFITHS, C. E. M. & KIMBER, I. (2006) Proteomic analysis of suction blister fluid isolated from human skin. Clinical and Experimental Dermatology, 31, 445‐448.
MACKENZIE, D. A., DEFERNEZ, M., DUNN, W. B., BROWN, M., FULLER, L. J., DE HERRERA, S., GUENTHER, A., JAMES, S. A., EAGLES, J., PHILO, M., GOODACRE, R. & ROBERTS, I. N. (2008) Relatedness of medically important strains of Saccharomyces cerevisiae as revealed by phylogenetics and metabolomics. Yeast, 25, 501‐512.
MADAN, V. & GRIFFITHS, C. E. M. (2007) Systemic ciclosporin and tacrolimus in dermatology. Dermatologic Therapy, 20, 239‐250.
MALLBRIS, L., AKRE, O., GRANATH, F., YIN, L., LINDELOF, B., EKBOM, A. & STAHLE‐BACKDAHL, M. (2004) Increased risk for cardiovascular mortality in psoriasis inpatients but not in outpatients. European Journal of Epidemiology, 19, 225‐230.
MARENHOLZ, I., HEIZMANN, C. W. & FRITZ, G. (2004) S100 proteins in mouse and man: from evolution to function and pathology (including an update of the nomenclature). Biochemical and Biophysical Research Communications, 322, 1111‐1122.
MARTENS, H. & NAES, T. (1989) Multivariate Calibration, Chichester, UK, John Wiley & Sons. MARTENS, H., NIELSEN, J. P. & ENGENLSEN, S. B. (2003) Light Scattering and Light
Absorbance Separated by Extended Multiplicative Signal Correction. Application to

209
Near‐Infrared Transmission Analysis of Powder Mixtures. Analytical Chemistry, 75, 394‐404.
MCGILL, A., FRANK, A., EMMETT, N., LEECH, S. N., TURNBULL, D. M., BIRCH‐MACHIN, M. A. & REYNOLDS, N. J. (2005) The antipsoriatic drug anthralin accumulates in keratinocyte mitochondria, dissipates mitochondrial membrane potential, and induces apoptosis through a pathway dependent on respiratory competent mitochondria. Faseb Journal, 19, 1012‐+.
MENTER, A. & GRIFFITHS, C. E. M. (2007) Psoriasis 2 ‐ Current and future management of psoriasis. Lancet, 370, 272‐284.
MOORE, B. D., STEVENSON, L., WATT, A., FLITSCH, S., TURNER, N. J., CASSIDY, C. & GRAHAM, D. (2004) Rapid and ultra‐sensitive determination of enzyme activities using surface‐enhanced resonance Raman scattering. Nature Biotechnology, 22, 1133‐1138.
MORDECHAI, S., SAHU, R. K., HAMMODY, Z., MARK, S., KANTAROVICH, K., GUTERMAN, H., PODSHYVALOV, A., GOLDSTEIN, J. & ARGOV, S. (2004) Possible common biomarkers from FTIR microspectroscopy of cervical cancer and melanoma. Journal of Microscopy‐Oxford, 215, 86‐91.
MOSKOVITS, M. (1985) SURFACE‐ENHANCED SPECTROSCOPY. Reviews of Modern Physics, 57, 783‐826.
MOSKOVITS, M., TAY, L. L., YANG, J. & HASLETT, T. (2002) SERS and the single molecule. Optical Properties of Nanostructured Random Media, 82, 215‐226.
MUELLER, W. & HERRMANN, B. (1979) CYCLOSPORIN A FOR PSORIASIS. New England Journal of Medicine, 301, 555‐555.
NAKATA, T., SOBUE, K. & HIROKAWA, N. (1990) CONFORMATIONAL CHANGE AND LOCALIZATION OF CALPACTIN‐I COMPLEX INVOLVED IN EXOCYTOSIS AS REVEALED BY QUICK‐FREEZE, DEEP‐ETCH ELECTRON‐MICROSCOPY AND IMMUNOCYTOCHEMISTRY. Journal of Cell Biology, 110, 13‐25.
NELSON, D. L. & COX, M. M. (2008) Lehninger: Principles of Biochemistry, Freeman, W.H. NEVITT, G. J. & HUTCHINSON, P. E. (1996) Psoriasis in the community: Prevalence, severity
and patients' beliefs and attitudes towards the disease. British Journal of Dermatology, 135, 533‐537.
NICKOLOFF, B. J., XIN, H., NESTLE, F. O. & QIN, J. Z. (2007) The cytokine and chemokine network in psoriasis. Clinics in Dermatology, 25, 568‐573.
O'HAGAN, S., DUNN, W. B., BROWN, M., KNOWLES, J. D. & KELL, D. B. (2005) Closed‐loop, multiobjective optimization of analytical instrumentation: Gas chromatography/time‐of‐flight mass spectrometry of the metabolomes of human serum and of yeast fermentations. Analytical Chemistry, 77, 290‐303.
OCKENFELS, H. M., NUSSBAUM, G., SCHULTEWOLTER, T., BURGER, P. M. & GOOS, M. (1995) CYCLOSPORINE‐A, FH506 AND DITHRANOL ALTER TYROSINE‐SPECIFIC PROTEIN‐PHOSPHORYLATION IN HACAT KERATINOCYTES. Archives of Dermatological Research, 287, 304‐309.
OFARRELL, P. H. (1975) HIGH‐RESOLUTION 2‐DIMENSIONAL ELECTROPHORESIS OF PROTEINS. Journal of Biological Chemistry, 250, 4007‐4021.
OLIVER, S. G., WINSON, M. K., KELL, D. B. & BAGANZ, F. (1998) Systematic functional analysis of the yeast genome. Trends in Biotechnology, 16, 373‐378.
OTEY, C. A. & CARPEN, O. (2004) alpha‐actinin revisited: A fresh look at an old player. Cell Motility and the Cytoskeleton, 58, 104‐111.
PAPP, K. A. (2008) Monitoring biologics for the treatment of psoriasis. Clinics in Dermatology, 26, 515‐521.
PARK, Y. D., JANG, H. S., KIM, S. Y., KO, S. K., LYOU, Y. J., LEE, D. Y., PAIK, Y. K. & YANG, J. M. (2006) Two‐dimensional electrophoretic profiling of atopic dermatitis in primary cultured keratinocytes from patients. Proteomics, 6, 1362‐1370.

210
PASIKANTI, K. K., HO, P. C. & CHAN, E. C. Y. (2008) Gas chromatography/mass spectrometry in metabolic profiling of biological fluids. Journal of Chromatography B‐Analytical Technologies in the Biomedical and Life Sciences, 871, 202‐211.
PATEL, S. A., BARNES, A., LOFTUS, N., MARTIN, R., SLOAN, P., THAKKER, N. & GOODACRE, R. (2009) Imaging mass spectrometry using chemical inkjet printing reveals differential protein expression in human oral squamous cell carcinoma. Analyst, 134, 301‐307.
PATEL, S. A., CURRIE, F., THAKKER, N. & GOODACRE, R. (2008) Spatial metabolic fingerprinting using FT‐IR spectroscopy: investigating abiotic stresses on Micrasterias hardyi. Analyst, 133, 1707‐1713.
PENG, J. M. & GYGI, S. P. (2001) Proteomics: the move to mixtures. Journal of Mass Spectrometry, 36, 1083‐1091.
PETERSON, J., VIBAT, C. & GENNIS, R. B. (1994) IDENTIFICATION OF THE AXIAL HEME LIGANDS OF CYTOCHROME B(556) IN SUCCINATE ‐ UBIQUINONE OXIDOREDUCTASE FROM ESCHERICHIA‐COLI. Febs Letters, 355, 155‐156.
PLAVINA, T., HINCAPIE, M., WAKSHULL, E., SUBRAMANYAM, M. & HANCOCK, W. S. (2008) Increased Plasma Concentrations of Cytoskeletal and Ca2+ ‐Binding Proteins and Their Peptides in Psoriasis Patients. Clinical Chemistry, 54, 1805‐1814.
POPE, G. A., MACKENZIE, D. A., DEFEMEZ, M., AROSO, M., FULLER, L. J., MELLON, F. A., DUNN, W. B., BROWN, M., GOODACRE, R., KELL, D. B., MARVIN, M. E., LOUIS, E. J. & ROBERTS, I. N. (2007) Metabolic footprinting as a tool for discriminating between brewing yeasts. Yeast, 24, 667‐679.
QIAN, X. M. & NIE, S. M. (2008) Single‐molecule and single‐nanoparticle SERS: from fundamental mechanisms to biomedical applications. Chemical Society Reviews, 37, 912‐920.
RAJ, D., BRASH, D. E. & GROSSMAN, D. (2006) Keratinocyte apoptosis in epidermal development and disease. Journal of Investigative Dermatology, 126, 243‐257.
RAMAN, C. & KRISHNAN, K. (1928) A new type of secondary radiation. Nature Biotechnology, 121, 501‐502.
RAPP, S. R., FELDMAN, S. R., EXUM, M. L., FLEISCHER, A. B. & REBOUSSIN, D. M. (1999) Psoriasis causes as much disability as other major medical diseases. Journal of the American Academy of Dermatology, 41, 401‐407.
REICHMANN, H. & WILDENAUER, D. (1991) QUANTITATIVE SUCCINATE‐DEHYDROGENASE ANALYSIS IN NORMAL AND RAGGED‐RED MUSCLE‐FIBERS. Histochemistry, 96, 251‐253.
RIVETT, A. J. (1985) PREFERENTIAL DEGRADATION OF THE OXIDATIVELY MODIFIED FORM OF GLUTAMINE‐SYNTHETASE BY INTRACELLULAR MAMMALIAN PROTEASES. Journal of Biological Chemistry, 260, 300‐305.
RUSE, M., BROOME, A. M. & ECKERT, R. L. (2003) S100A7 (psoriasin) interacts with epidermal fatty acid binding protein and localizes in focal adhesion‐like structures in cultured keratinocytes. Journal of Investigative Dermatology, 121, 132‐141.
SABATINE, M. S., LIU, E., MORROW, D. A., HELLER, E., MCCARROLL, R., WIEGAND, R., BERRIZ, G. F., ROTH, F. P. & GERSZTEN, R. E. (2005) Metabolomic identification of novel biomarkers of myocardial ischemia. Circulation, 112, 3868‐3875.
SAPORITO, F. C. & MENTER, M. A. (2004) Methotrexate and psoriasis in the era of new biologic agents. Journal of the American Academy of Dermatology, 50, 301‐309.
SAUDER, D. N. & MAMELAK, A. J. (2004) Understanding the new clinical landscape for psoriasis: A comparative review of biologics. Journal of Cutaneous Medicine and Surgery, 8, 205‐212.
SCIGELOVA, M. & MAKAROV, A. (2006) Orbitrap mass analyzer ‐ Overview and applications in proteomics. Proteomics, 16‐21.

211
SEEMANN, J., WEBER, K. & GERKE, V. (1997) Annexin I targets S100C to early endosomes. Febs Letters, 413, 185‐190.
SELLICK, C. A., HANSEN, R., MAQSOOD, A. R., DUNN, W. B., STEPHENS, G. M., GOODACRE, R. & DICKSON, A. J. (2009) Effective Quenching Processes for Physiologically Valid Metabolite Profiling of Suspension Cultured Mammalian Cells. Analytical Chemistry, 81, 174‐183.
SHADI, I. T., CHEUNG, W. & GOODACRE, R. (2009) Quantitative analysis of methyl green using surface‐enhanced resonance Raman scattering. Analytical and Bioanalytical Chemistry, 394, 1833‐1838.
SHADI, I. T., CHOWDHRY, B. Z., SNOWDEN, M. J. & WITHNALL, R. (2001) Semi‐quantitative trace analysis of nuclear fast red by surface enhanced resonance Raman scattering. Analytica Chimica Acta, 450, 115‐122.
SHADI, I. T., CHOWDHRY, B. Z., SNOWDEN, M. J. & WITHNALL, R. (2003) Semi‐quantitative analysis of indigo by surface enhanced resonance Raman spectroscopy (SERRS) using silver colloids. Spectrochimica Acta Part a‐Molecular and Biomolecular Spectroscopy, 59, 2213‐2220.
SHADI, I. T., CHOWDHRY, B. Z., SNOWDEN, M. J. & WITHNALL, R. (2004) Analysis of the conversion of indigo into indigo carmine dye using SERRS. Chemical Communications, 1436‐1437.
SHIH, B., GARSIDE, E., MCGROUTHER, D. A. & BAYAT, A. (2010) Molecular dissection of abnormal wound healing processes resulting in keloid disease. Wound Repair and Regeneration, 18, 139‐153.
SIRLIN, C., BURGARD, M., LEROY, M. J. F. & PREVOST, M. (1990) SILVER‐NITRATE REFINING USING SUPPORTED LIQUID MEMBRANES. Journal of Membrane Science, 54, 299‐305.
SPULS, P. I., WITKAMP, L., BOSSUYT, P. M. M. & BOS, J. D. (1997) A systematic review of five systemic treatments for severe psoriasis. British Journal of Dermatology, 137, 943‐949.
SREEKUMAR, A., POISSON, L. M., RAJENDIRAN, T. M., KHAN, A. P., CAO, Q., YU, J. D., LAXMAN, B., MEHRA, R., LONIGRO, R. J., LI, Y., NYATI, M. K., AHSAN, A., KALYANA‐SUNDARAM, S., HAN, B., CAO, X. H., BYUN, J., OMENN, G. S., GHOSH, D., PENNATHUR, S., ALEXANDER, D. C., BERGER, A., SHUSTER, J. R., WEI, J. T., VARAMBALLY, S., BEECHER, C. & CHINNAIYAN, A. M. (2009) Metabolomic profiles delineate potential role for sarcosine in prostate cancer progression. Nature, 457, 910‐914.
STANLEY, P., SMITH, A., MCDOWALL, A., NICOL, A., ZICHA, D. & HOGG, N. (2008) Intermediate‐affinity LFA‐1 binds alpha‐actinin‐1 to control migration at the leading edge of the T cell. Embo Journal, 27, 62‐75.
STRAINO, S., DI CARLO, A., MANGONI, A., DE MORI, R., GUERRA, L., MAURELLI, R., PANACCHIA, L., DI GIACOMO, F., PALUMBO, R., DI CAMPLI, C., UCCIOLI, L., BIGLIOLI, P., BIANCHI, M. E., CAPOGROSSI, M. C. & GERMANI, A. (2008) High‐mobility group box 1 protein in human and murine skin: Involvement in wound healing. Journal of Investigative Dermatology, 128, 1545‐1553.
STROBER, B. E. & MENON, K. (2005) Folate supplementation during methotrexate therapy for patients with psoriasis. Journal of the American Academy of Dermatology, 53, 652‐659.
SUHLER, E., LIN, W., YIN, H. L. & LEE, W. M. (1997) Decreased plasma gelsolin concentrations in acute liver failure, myocardial infarction, septic shock, and myonecrosis. Critical Care Medicine, 25, 594‐598.

212
SULÉ‐SUSO, J., SKINGSLEY, D., SOCKALINGUM, G. D., KOHLER, A., KEGELAER, G., MANFAIT, M. & EL HAJ, A. J. (2005) FT‐IR microspectroscopy as a tool to assess lung cancer cells response to chemotherapy. Vibrational Spectroscopy, 38, 179‐184.
SUMNER, L. W., AMBERG, A., BARRETT, D., BEALE, M. H., BEGER, R., DAYKIN, C. A., FAN, T. W. M., FIEHN, O., GOODACRE, R., GRIFFIN, J. L., HANKEMEIER, T., HARDY, N., HARNLY, J., HIGASHI, R., KOPKA, J., LANE, A. N., LINDON, J. C., MARRIOTT, P., NICHOLLS, A. W., REILY, M. D., THADEN, J. J. & VIANT, M. R. (2007) Proposed minimum reporting standards for chemical analysis. Metabolomics, 3, 211‐221.
TAN, K. T., SHAH, N., PRITCHARD, S. A., MCGROUTHER, D. A. & BAYAT, A. (2010) The Influence of Surgical Excision Margins on Keloid Prognosis. Annals of Plastic Surgery, 64, 55‐58.
TANIGUCHI, N., KAWAHARA, K., YONE, K., HASHIGUCHI, T., YAMAKUCHI, M., GOTO, M., INOUE, K., YAMADA, S., IJIRI, K., MATSUNAGA, S., NAKAJIMA, T., KOMIYA, S. & MARUYAMA, I. (2003) High mobility group box chromosomal protein 1 plays a role in the pathogenesis of rheumatoid arthritis as a novel cytokine. Arthritis and Rheumatism, 48, 971‐981.
TENG, Q., HUANG, W. L., COLLETTE, T. W., EKMAN, D. R. & TAN, C. (2009) A direct cell quenching method for cell‐culture based metabolomics. Metabolomics, 5, 199‐208.
TETTEH, J., MADER, K. T., ANDANSON, J. M., MCAULEY, W. J., LANE, M. E., HADGRAFT, J., KAZARIAN, S. G. & MITCHELL, J. C. (2009) Local examination of skin diffusion using FTIR spectroscopic imaging and multivariate target factor analysis. Analytica Chimica Acta, 642, 246‐256.
TRUMPOWER, B. L. & GENNIS, R. B. (1994) ENERGY TRANSDUCTION BY CYTOCHROME COMPLEXES IN MITOCHONDRIAL AND BACTERIAL RESPIRATION ‐ THE ENZYMOLOGY OF COUPLING ELECTRON‐TRANSFER REACTIONS TO TRANSMEMBRANE PROTON TRANSLOCATION. Annual Review of Biochemistry, 63, 675‐716.
TSE, W.‐P., CHE, C.‐T., LIU, K. & LIN, Z.‐X. (2006) Evaluation of the anti‐proliferative properties of selected psoriasis‐treating Chinese medicines on cultured HaCaT cells. Journal of Ethnopharmacology, 108, 133‐141.
TUCKER, W. F. G., MACNEIL, S., BLEEHEN, S. S. & TOMLINSON, S. (1984) BIOLOGICALLY‐ACTIVE CALMODULIN LEVELS ARE ELEVATED IN BOTH INVOLVED AND UNINVOLVED EPIDERMIS IN PSORIASIS. Journal of Investigative Dermatology, 82, 298‐299.
TUCKER, W. F. G., MACNEIL, S., DAWSON, R. A., TOMLINSON, S. & BLEEHEN, S. S. (1986) AN INVESTIGATION OF THE ABILITY OF ANTIPSORIATIC DRUGS TO INHIBIT CALMODULIN ACTIVITY ‐ A POSSIBLE MODE OF ACTION OF DITHRANOL (ANTHRALIN). Journal of Investigative Dermatology, 87, 232‐235.
TZU, J. & KERDEL, F. (2008) From conventional to cutting edge: the new era of biologics in treatment of psoriasis. Dermatologic Therapy, 21, 131‐141.
VAN DE KERKHOF, P. C. M. (2009) The relevance of biologics for the treatment of patients with psoriasis. British Journal of Dermatology, 161, 1213‐1214.
VAN DE KERKHOF, P. C. M., BARKER, J., GRIFFTHS, C. E. M., KRAGBALLE, K., MASON, J., MENTER, A. & PAPP, K. (2008) Psoriasis: consensus on topical therapies. Journal of the European Academy of Dermatology and Venereology, 22, 859‐870.
WARREN, R. B., CHALMERS, R. J. G., GRIFFITHS, C. E. M. & MENTER, A. (2008) Methotrexate for psoriasis in the era of biological therapy. Clinical and Experimental Dermatology, 33, 551‐554.
WESTERHUIS, J. A., HOEFSLOOT, H. C. J., SMIT, S., VIS, D. J., SMILDE, A. K., VAN VELZEN, E. J. J., VAN DUIJNHOVEN, J. P. M. & VAN DORSTEN, F. A. (2008) Assessment of PLSDA cross validation. Metabolomics, 4, 81‐89.

213
WHITNEY, A. V., VAN DUYNE, R. P. & CASADIO, F. (2006) An innovative surface‐enhanced Raman spectroscopy (SERS) method for the identification of six historical red lakes and dyestuffs. Journal of Raman Spectroscopy, 37, 993‐1002.
WINDER, C. L., DUNN, W. B., SCHULER, S., BROADHURST, D., JARVIS, R., STEPHENS, G. M. & GOODACRE, R. (2008) Global metabolic profiling of Escherichia coli cultures: An evaluation of methods for quenching and extraction of intracellular metabolites. Analytical Chemistry, 80, 2939‐2948.
WISHART, D. S., TZUR, D., KNOX, C., EISNER, R., GUO, A. C., YOUNG, N., CHENG, D., JEWELL, K., ARNDT, D., SAWHNEY, S., FUNG, C., NIKOLAI, L., LEWIS, M., COUTOULY, M. A., FORSYTHE, I., TANG, P., SHRIVASTAVA, S., JERONCIC, K., STOTHARD, P., AMEGBEY, G., BLOCK, D., HAU, D. D., WAGNER, J., MINIACI, J., CLEMENTS, M., GEBREMEDHIN, M., GUO, N., ZHANG, Y., DUGGAN, G. E., MACINNIS, G. D., WELJIE, A. M., DOWLATABADI, R., BAMFORTH, F., CLIVE, D., GREINER, R., LI, L., MARRIE, T., SYKES, B. D., VOGEL, H. J. & QUERENGESSER, L. (2007) HMDB: the human metabolome database. Nucleic Acids Research, 35, D521‐D526.
WOLF, R., LEWERENZ, V., BUCHAO, A. S., WALZ, M. & RUZICKA, T. (2007) Human S100A15 splice variants are differentially expressed in inflammatory skin diseases and regulated through Th1 cytokines and calcium. Experimental Dermatology, 16, 685‐691.
YAMANE, Y., MORIYAMA, K., YASUDA, C., MIYATA, S., AIHARA, M., IKEZAWA, Z. & MIYAZAKI, K. (2009) New Horny Layer Marker Proteins for Evaluating Skin Condition in Atopic Dermatitis. International Archives of Allergy and Immunology, 150, 89‐101.
ZHANG, M., ZHU, L., FENG, Y., YANG, Y. X., LIU, L. & RAN, Y. P. (2008) Effects of acitretin on proliferative inhibition and RANTES production of HaCaT cells. Archives of Dermatological Research, 300, 575‐581.
ZIBERT, J. R., SKOV, L., THYSSEN, J. P., JACOBSEN, G. K. & GRIGORIAN, M. (2009) Significance of the S100A4 Protein in Psoriasis. Journal of Investigative Dermatology, 130, 150‐160.
ZWIELLY, A., GOPAS, J., BRKIC, G. & MORDECHAI, S. (2009) Discrimination between drug‐resistant and non‐resistant human melanoma cell lines by FTIR spectroscopy. Analyst, 134, 294‐300.
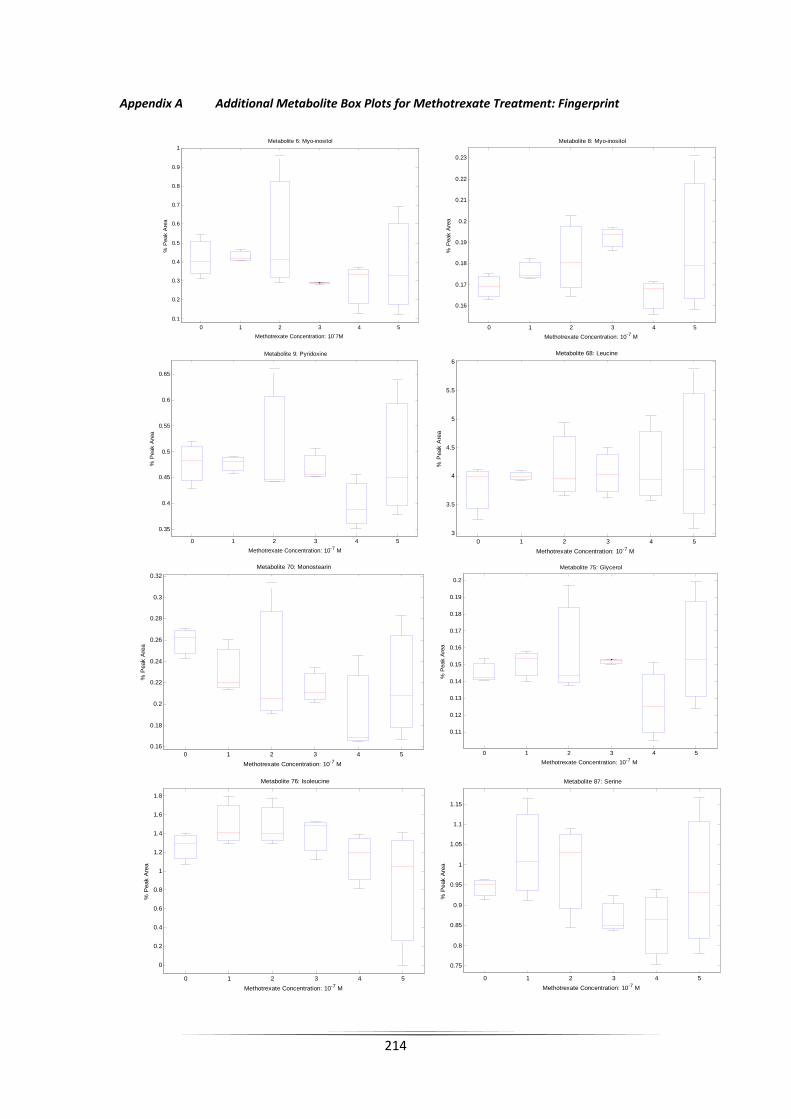
214
Appendix A Additional Metabolite Box Plots for Methotrexate Treatment: Fingerprint
0 1 2 3 4 50.1
0.2
0.3
0.4
0.5
0.6
0.7
0.8
0.9
1
% P
eak
Are
a
Metabolite 6: Myo-inositol
Methotrexate Concentration: 10-7M0 1 2 3 4 5
0.16
0.17
0.18
0.19
0.2
0.21
0.22
0.23
% P
eak
Are
a
Metabolite 8: Myo-inositol
Methotrexate Concentration: 10-7 M
0 1 2 3 4 5
0.35
0.4
0.45
0.5
0.55
0.6
0.65
% P
eak
Are
a
Metabolite 9: Pyridoxine
Methotrexate Concentration: 10-7 M0 1 2 3 4 5
3
3.5
4
4.5
5
5.5
6
% P
eak
Are
a
Metabolite 68: Leucine
Methotrexate Concentration: 10-7 M
0 1 2 3 4 50.16
0.18
0.2
0.22
0.24
0.26
0.28
0.3
0.32
% P
eak
Are
a
Metabolite 70: Monostearin
Methotrexate Concentration: 10-7 M
0 1 2 3 4 5
0.11
0.12
0.13
0.14
0.15
0.16
0.17
0.18
0.19
0.2
% P
eak
Are
a
Metabolite 75: Glycerol
Methotrexate Concentration: 10-7 M
0 1 2 3 4 5
0
0.2
0.4
0.6
0.8
1
1.2
1.4
1.6
1.8
% P
eak
Are
a
Metabolite 76: Isoleucine
Methotrexate Concentration: 10-7 M
0 1 2 3 4 5
0.75
0.8
0.85
0.9
0.95
1
1.05
1.1
1.15
% P
eak
Are
a
Metabolite 87: Serine
Methotrexate Concentration: 10-7 M

215
0 1 2 3 4 50.24
0.26
0.28
0.3
0.32
0.34
0.36
0.38
0.4
% P
eak
Are
a
Metabolite 89: Glyceric Acid
Methotrexate Concentration: 10-7 M
0 1 2 3 4 50.5
0.6
0.7
0.8
0.9
1
1.1
1.2
% P
eak
Are
a
Metabolite 91: Threonine
Methotrexate Concentration: 10-7 M
0 1 2 3 4 5
1.4
1.6
1.8
2
2.2
2.4
% P
eak
Are
a
Metabolite 105: Threitol/Erthritol
Methotrexate Concentration: 10-7 M0 1 2 3 4 5
0.25
0.3
0.35
0.4
0.45
% P
eak
Are
a
Metabolite 111: p-benzoquinone
Methotrexate Concentration: 10-7 M
0 1 2 3 4 50.14
0.16
0.18
0.2
0.22
0.24
0.26
0.28
% P
eak
Are
a
Metabolite 113: Threonic Acid/Erthronic Acid
Methotrexate Concentration: 10-7 M
0 1 2 3 4 5
0.1
0.15
0.2
0.25
0.3
0.35
% P
eak
Are
a
Metabolite 121: 3-hydroxybutanoic Acid
Methotrexate Concentration: 10-7 M
0 1 2 3 4 50.2
0.22
0.24
0.26
0.28
0.3
0.32
0.34
0.36
0.38
0.4
% P
eak
Are
a
Metabolite 125: Methionine
Methotrexate Concentration: 10-7 M0 1 2 3 4 5
0.14
0.16
0.18
0.2
0.22
0.24
0.26
0.28
% P
eak
Are
a
Metabolite 113: Threonic Acid/Erthronic Acid
Methotrexate Concentration: 10-7 M

216
0 1 2 3 4 5
0.1
0.15
0.2
0.25
0.3
0.35
% P
eak
Are
a
Metabolite 121: 3-hydroxybutanoic Acid
Methotrexate Concentration: 10-7 M0 1 2 3 4 5
0.2
0.22
0.24
0.26
0.28
0.3
0.32
0.34
0.36
0.38
0.4
% P
eak
Are
a
Metabolite 125: Methionine
Methotrexate Concentration: 10-7 M
0 1 2 3 4 51.5
2
2.5
3
3.5
4
4.5
% P
eak
Are
a
Metabolite 46: Norvaline
Methotrexate Concentration: 10-7 M 0 1 2 3 4 5
1
1.5
2
2.5
3
% P
eak
Are
a
Metabolite 77: Leucine
Methotrexate Concentration: 10-7 M
0 1 2 3 4 5
0
0.2
0.4
0.6
0.8
1
1.2
% P
eak
Are
a
Metabolite 92: Serine
Methotrexate Concentration: 10-7 M
0 1 2 3 4 5
0.09
0.1
0.11
0.12
0.13
0.14
0.15
0.16
0.17
% P
eak
Are
a
Metabolite 104: Proline
Methotrexate Concentration: 10-7 M
0 1 2 3 4 5
0
0.02
0.04
0.06
0.08
0.1
0.12
% P
eak
Are
a
Metabolite 115: 4-Hydroxyproline
Methotrexate Concentration: 10-7 M0 1 2 3 4 5
0.2
0.3
0.4
0.5
0.6
0.7
% P
eak
Are
a
Metabolite 127: Methionine
Methotrexate Concentration: 10-7 M

217
0 1 2 3 4 5
1
1.5
2
2.5
3
3.5
4
4.5
5
5.5
% P
eak
Are
a
Metabolite 140: Alanine
Methotrexate Concentration: 10-7 M0 1 2 3 4 5
0.15
0.2
0.25
0.3
0.35
0.4
% P
eak
Are
a
Metabolite 151: Glycine
Methotrexate Concentration: 10-7 M
0 1 2 3 4 5
0
2
4
6
8
10
12
x 10-3
% P
eak
Are
a
Metabolite 136: Creatine
Methotrexate Concentration: 10-7 M

218
Appendix B Additional Metabolite Box Plots for Methotrexate Treatment: Footprint
0 1 2 3 4 5
0
0.02
0.04
0.06
0.08
0.1
0.12%
Pea
k A
rea
Metabolite 53: Monopalmitin
Methotrexate Concentration: 10-7 M0 1 2 3 4 5
0.14
0.16
0.18
0.2
0.22
0.24
0.26
0.28
% P
eak
Arre
a
Metabolite 113: Threonic Acid/Erythronic Acid
Methotrexate Concentration: 10-7 M
0 1 2 3 4 5
1.4
1.6
1.8
2
2.2
2.4
% P
eak
Are
a
Metabolite 105: Threitol/Erthritol
Methotrexate Concentration: 10-7 M0 1 2 3 4 5
0.5
0.6
0.7
0.8
0.9
1
1.1
1.2
% P
eak
Are
a
Metabolite 91: Threonine
Methotrexate Concentration: 10-7 M
0 1 2 3 4 5
0
0.02
0.04
0.06
0.08
0.1
0.12
0.14
0.16
0.18
0.2
% P
eak
Are
a
Metabolite 152: Glycerol-3-phosphate
Methotrexate Concentration: 10-7 M0 1 2 3 4 5
0
0.2
0.4
0.6
0.8
1
1.2
% P
eak
Are
a
Metabolite 150: Fructose
Methotrexate Concentration: 10-7 M
0 1 2 3 4 50.16
0.18
0.2
0.22
0.24
0.26
0.28
0.3
0.32
% P
eak
Are
a
Metabolite 70: Monostearin
Methotrexate Concentration: 10-7 M0 1 2 3 4 5
4
6
8
10
12
14
16
% P
eak
Are
a
Metabolite 141: Pyroglutmic Acid
Methotrexate Concentration: 10-7 M

219
0 1 2 3 4 5
0
0.02
0.04
0.06
0.08
0.1
0.12
0.14
0.16
% P
eak
Are
a
Metabolite 15: Pantothenic Acid
Methotrexate Concentration: 10-7 M

220
Appendix C Additional Metabolite Box Plots for Ciclosporin Treatment: Fingerprint
Appendix D Additional Metabolite Box Plots for Ciclosporin Treatment: Footprint
0 0.5 1 1.5 2 2.5
0
0.5
1
1.5
2
2.5
3
% P
eak
Are
a
Metabolite 17: Hexadeconoic Acid
Cyclosporin Concentration: 10-7M
0 0.5 1 1.5 2 2.5
0.1
0.15
0.2
0.25
0.3
0.35
0.4
0.45
0.5
0.55
0.6
% P
eak
Are
a Metabolite 44: Glucose-6-Phosphate
Cyclosporin Concentration: 10-7M0 0.5 1 1.5 2 2.5
1
2
3
4
5
6
7
8
% P
eak
Are
a
Metabolite 83: Glycine
Cyclosporin Concentration: 10-7M
0 0.5 1 1.5 2 2.5
0.1
0.2
0.3
0.4
0.5
0.6
0.7
0.8
0.9
% P
eak
Are
a
Metabolite 92: Serine
Cyclosporin Concentration: 10-7M
0 0.5 1 1.5 2 2.5
0
0.5
1
1.5
2
2.5
% P
eak
Are
a
Metabolite 94: Threonine
Cyclosporin Concentration: 10-7M

221
Appendix E Proteome Results for Dithranol Treatment
Protein Identification C 0.1 0.2 0.3 0.4 0.5annexin 5
annexin IV
argininosuccinate synthetase 1
calmodulin 2
DEAH (Asp‐Glu‐Ala‐His) box polypeptide 15
enolase 2
enolase 3
eukaryotic translation elongation factor 1 alpha 1
eukaryotic translation initiation factor 4A2
gelsolin‐like capping protein
heterogeneous nuclear ribonucleoprotein A1 isoform a
lactate dehydrogenase A
nascent‐polypeptide‐associated complex alpha polypeptide‐like
nucleophosmin 1 isoform 1
phosphoglycerate kinase 2
poly(rC) binding protein 3
PREDICTED: similar to Heterogeneous nuclear ribonucleoprotein A1
PREDICTED: similar to nascent polypeptide‐associated complex alpha polypeptide
PREDICTED: similar to Phosphoglycerate mutase 1 (Phosphoglycerate mutase isozyme B)
PREDICTED: similar to Protein SET (Phosphatase 2A inhibitor I2PP2A)
PREDICTED: similar to ribosomal protein S18 isoform 4
pyruvate kinase 3 isoform 1
ribosomal protein S14
S100 calcium binding protein A14
synaptotagmin binding, cytoplasmic RNA interacting protein
transaldolase 1
tubulin, alpha, ubiquitous
tubulin, beta polypeptide
tubulin, beta, 2
ubiquitin and ribosomal protein L40 precursor
adipose specific 2
ADP‐ribosylation factor 1
aldolase A
alpha 2 actin
annexin A2 isoform 2
annexin I
chloride intracellular channel 1
cofilin 1 (non‐muscle)
enolase 1
eukaryotic translation elongation factor 1 alpha 2
eukaryotic translation elongation factor 2
glucose phosphate isomerase
glutathione transferase
glyceraldehyde‐3‐phosphate dehydrogenase
H2B histone family, member C
H4 histone family, member B
heat shock 27kDa protein 1
heat shock 70kDa protein 1A
heat shock 70kDa protein 8 isoform 2
heat shock 90kDa protein 1, beta
heat shock protein 90kDa alpha (cytosolic), class A member 1 isoform 2
heterogeneous nuclear ribonucleoprotein A2/B1 isoform A2
heterogeneous nuclear ribonucleoprotein D isoform c
heterogeneous nuclear ribonucleoprotein K isoform a
histone cluster 1, H1b
histone cluster 1, H1c
histone H2a
isocitrate dehydrogenase 1 (NADP+), soluble
lactate dehydrogenase C
lamin A/C isoform 1 precursor
lamin A/C isoform 3
LIM and SH3 protein 1
nucleolin
peroxiredoxin 1
peroxiredoxin 6

222
phosphoglycerate kinase 1
PREDICTED: hypothetical protein
PREDICTED: similar to 60S ribosomal protein L23a
PREDICTED: similar to actin‐like protein
PREDICTED: similar to cytoplasmic beta‐actin
PREDICTED: similar to peptidylprolyl isomerase A (cyclophilin A)‐like 4
PREDICTED: similar to peptidylprolyl isomerase A isoform 1
PREDICTED: similar to peptidylprolyl isomerase A isoform 1
profilin 1
pyruvate kinase 3 isoform 2
pyruvate kinase, liver and RBC isoform 1
ribosomal protein P2
S100 calcium binding protein A11
serine (or cysteine) proteinase inhibitor, clade B (ovalbumin), member 5
stratifin
thioredoxin
TNF receptor‐associated protein 1
transgelin 2
transketolase
triosephosphate isomerase 1
tropomyosin 2 (beta) isoform 2
tubulin, alpha 1a
tubulin, beta 2B
tubulin, beta, 4
tumor rejection antigen (gp96) 1
tyrosine 3/tryptophan 5 ‐monooxygenase activation protein, epsilon polypeptide
tyrosine 3/tryptophan 5 ‐monooxygenase activation protein, theta polypeptide
tyrosine 3/tryptophan 5 ‐monooxygenase activation protein, zeta polypeptide
tyrosine 3‐monooxygenase/tryptophan 5‐monooxygenase activation protein, beta polypeptide
villin 2
actin, gamma 1 propeptide
actinin, alpha 4
adenylyl cyclase‐associated protein
AHNAK nucleoprotein isoform 1
aldo‐keto reductase family 1, member B1
aldo‐keto reductase family 1, member B1
annexin A11
annexin A8‐like 1
autoantigen La
chaperonin containing TCP1, subunit 5 (epsilon)
ciliary rootlet coiled‐coil, rootletin
cytochrome P450, family 24 precursor
cytosolic malate dehydrogenase
ErbB3‐binding protein 1
eukaryotic translation initiation factor 3, subunit 10 theta, 150/170kDa
fructose‐bisphosphate aldolase C
GDP dissociation inhibitor 2
heat shock 70kDa protein 6 (HSP70B')
heat shock 70kDa protein 8 isoform 1
heterogeneous nuclear ribonucleoprotein C isoform b
heterogeneous nuclear ribonucleoprotein F
heterogeneous nuclear ribonucleoprotein H2
heterogeneous nuclear ribonucleoprotein R
heterogeneous nuclear ribonucleoprotein U isoform b
hypothetical protein LOC345651
IQ motif containing GTPase activating protein 1
karyopherin beta 1
keratin 1
keratin 10
keratin 1B
keratin 13 isoform a
keratin 2
keratin 5
keratin 6B
lactate dehydrogenase B
myristoylated alanine‐rich protein kinase C substrate

223
nascent‐polypeptide‐associated complex alpha polypeptide
PDZ and LIM domain 1 (elfin)
peroxiredoxin 5 precursor, isoform b
phosphogluconate dehydrogenase
polypyrimidine tract binding protein 2
polypyrimidine tract‐binding protein 1 isoform c
PREDICTED: hypothetical protein
PREDICTED: similar to 40S ribosomal protein S16 isoform 2
PREDICTED: similar to 40S ribosomal protein S28
PREDICTED: similar to 60S ribosomal protein L22 (Heparin‐binding protein HBp15)
PREDICTED: similar to 60S ribosomal protein L29 (Cell surface heparin‐binding protein HIP)
PREDICTED: similar to Protein SET (Phosphatase 2A inhibitor I2PP2A)
PREDICTED: similar to Splicing factor, arginine/serine‐rich, 46kD
PREDICTED: similar to ubiquitin and ribosomal protein S27a precursor
protease, serine, 1 preproprotein
ras‐related nuclear protein
ribosomal protein S3
ribosomal protein S7
SERPINE1 mRNA binding protein 1 isoform 3
SMT3 suppressor of mif two 3 homolog 4
SET translocation (myeloid leukemia‐associated)
stress‐induced‐phosphoprotein 1 (Hsp70/Hsp90‐organizing protein)
tropomyosin 3 isoform 1
valosin‐containing protein
vitronectin precursor
acidic (leucine‐rich) nuclear phosphoprotein 32 family, member A
acidic (leucine‐rich) nuclear phosphoprotein 32 family, member B
albumin precursor
myosin, heavy polypeptide 9, non‐muscle
PREDICTED: similar to ADP‐ribosylation factor 1 like
tropomyosin 3 isoform 2
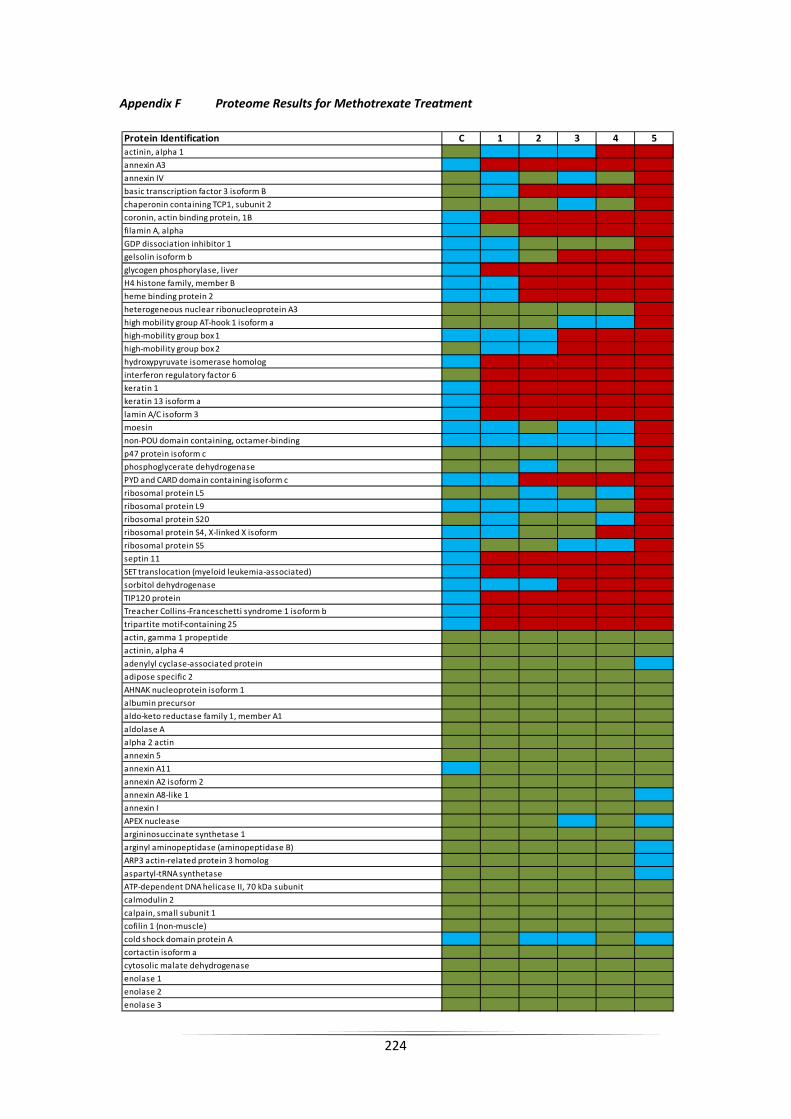
224
Appendix F Proteome Results for Methotrexate Treatment
Protein Identification C 1 2 3 4 5actinin, alpha 1
annexin A3
annexin IV
basic transcription factor 3 isoform B
chaperonin containing TCP1, subunit 2
coronin, actin binding protein, 1B
filamin A, alpha
GDP dissociation inhibitor 1
gelsolin isoform b
glycogen phosphorylase, liver
H4 histone family, member B
heme binding protein 2
heterogeneous nuclear ribonucleoprotein A3
high mobility group AT‐hook 1 isoform a
high‐mobility group box 1
high‐mobility group box 2
hydroxypyruvate isomerase homolog
interferon regulatory factor 6
keratin 1
keratin 13 isoform a
lamin A/C isoform 3
moesin
non‐POU domain containing, octamer‐binding
p47 protein isoform c
phosphoglycerate dehydrogenase
PYD and CARD domain containing isoform c
ribosomal protein L5
ribosomal protein L9
ribosomal protein S20
ribosomal protein S4, X‐linked X isoform
ribosomal protein S5
septin 11
SET translocation (myeloid leukemia‐associated)
sorbitol dehydrogenase
TIP120 protein
Treacher Collins‐Franceschetti syndrome 1 isoform b
tripartite motif‐containing 25
actin, gamma 1 propeptide
actinin, alpha 4
adenylyl cyclase‐associated protein
adipose specific 2
AHNAK nucleoprotein isoform 1
albumin precursor
aldo‐keto reductase family 1, member A1
aldolase A
alpha 2 actin
annexin 5
annexin A11
annexin A2 isoform 2
annexin A8‐like 1
annexin I
APEX nuclease
argininosuccinate synthetase 1
arginyl aminopeptidase (aminopeptidase B)
ARP3 actin‐related protein 3 homolog
aspartyl‐tRNA synthetase
ATP‐dependent DNA helicase II, 70 kDa subunit
calmodulin 2
calpain, small subunit 1
cofilin 1 (non‐muscle)
cold shock domain protein A
cortactin isoform a
cytosolic malate dehydrogenase
enolase 1
enolase 2
enolase 3

225
eukaryotic translation elongation factor 1 alpha 1
eukaryotic translation elongation factor 1 alpha 2
eukaryotic translation elongation factor 1 beta 2
eukaryotic translation elongation factor 2
eukaryotic translation initiation factor 2, subunit 1 alpha, 35kDa
eukaryotic translation initiation factor 4A isoform 1
eukaryotic translation initiation factor 4A2
fatty acid synthase
fructose‐1,6‐bisphosphatase 1
fructose‐bisphosphate aldolase C
GDP dissociation inhibitor 2
glucose phosphate isomerase
glutathione transferase
glyceraldehyde‐3‐phosphate dehydrogenase
GTP‐binding protein PTD004 isoform 1
H2B histone family, member C
heat shock 27kDa protein 1
heat shock 70kDa protein 1A
heat shock 70kDa protein 1‐like
heat shock 70kDa protein 4 isoform a
heat shock 70kDa protein 8 isoform 2
heat shock 90kDa protein 1, beta
heat shock protein 90kDa alpha (cytosolic), class A member 1 isoform 2
hepatoma‐derived growth factor (high‐mobility group protein 1‐like)
heterogeneous nuclear ribonucleoprotein A1 isoform a
heterogeneous nuclear ribonucleoprotein A2/B1 isoform A2
heterogeneous nuclear ribonucleoprotein F
heterogeneous nuclear ribonucleoprotein H2
heterogeneous nuclear ribonucleoprotein K isoform a
involucrin
IQ motif containing GTPase activating protein 1
isocitrate dehydrogenase 1 (NADP+), soluble
KH‐type splicing regulatory protein (FUSE binding protein 2)
lactate dehydrogenase A
lactate dehydrogenase A‐like 6B
lactate dehydrogenase B
LIM and SH3 protein 1
myosin, heavy polypeptide 9, non‐muscle
myristoylated alanine‐rich protein kinase C substrate
nascent‐polypeptide‐associated complex alpha polypeptide
non‐metastatic cells 2, protein (NM23B) expressed in
nuclease sensitive element binding protein 1
nucleolin
nucleophosmin 1 isoform 1
PDZ and LIM domain 1 (elfin)
peroxiredoxin 1
peroxiredoxin 2 isoform a
peroxiredoxin 5 precursor, isoform b
peroxiredoxin 6
PEST‐containing nuclear protein
phosphofructokinase, platelet
phosphogluconate dehydrogenase
phosphoglycerate kinase 1
phosphoglycerate kinase 2
plastin 3
poly(rC) binding protein 3
PREDICTED: similar to 40S ribosomal protein SA (p40)
PREDICTED: similar to 60S ribosomal protein L12
PREDICTED: similar to 60S ribosomal protein L32
PREDICTED: similar to 60S ribosomal protein L32
PREDICTED: similar to actin‐like protein
PREDICTED: similar to chromobox homolog 3
PREDICTED: similar to cytoplasmic beta‐actin
PREDICTED: similar to Elongation factor 1‐gamma (EF‐1‐gamma) (eEF‐1B gamma)
PREDICTED: similar to Heterogeneous nuclear ribonucleoprotein A1 (Helix‐destabilizing protein)
PREDICTED: similar to peptidylprolyl isomerase A isoform 1

226
PREDICTED: similar to Phosphoglycerate mutase 1 (Phosphoglycerate mutase isozyme B)
PREDICTED: similar to Protein SET (Phosphatase 2A inhibitor I2PP2A)
profilin 1
proteasome activator subunit 2
pyrophosphatase 1
pyruvate kinase 3 isoform 1
pyruvate kinase 3 isoform 2
Rho GDP dissociation inhibitor (GDI) beta
ribosomal protein L17
ribosomal protein L19
ribosomal protein L3 isoform a
ribosomal protein L8
ribosomal protein P0
S100 calcium binding protein A11
S100 calcium binding protein A14
S‐adenosylhomocysteine hydrolase
serine (or cysteine) proteinase inhibitor, clade B (ovalbumin), member 13
serine (or cysteine) proteinase inhibitor, clade B (ovalbumin), member 5
SERPINE1 mRNA binding protein 1 isoform 3
small acidic protein
splicing factor proline/glutamine rich (polypyrimidine tract binding protein associated)
stratifin
thioredoxin
transgelin 2
transketolase
triosephosphate isomerase 1
tropomyosin 3 isoform 2
tubulin, alpha 1a
tubulin, alpha, ubiquitous
tubulin, beta 2B
tubulin, beta 4
tubulin, beta polypeptide
tubulin, beta, 4
tyrosine 3/tryptophan 5 ‐monooxygenase activation protein, epsilon
tyrosine 3/tryptophan 5 ‐monooxygenase activation protein, theta
tyrosine 3/tryptophan 5 ‐monooxygenase activation protein, zeta
tyrosine 3‐monooxygenase/tryptophan 5‐monooxygenase activation protein, beta
tyrosine 3‐monooxygenase/tryptophan 5‐monooxygenase activation protein, gamma
UV excision repair protein RAD23 homolog B
valosin‐containing protein
villin 2
vinculin isoform meta‐VCL
acidic (leucine‐rich) nuclear phosphoprotein 32 family, member A
ADP‐ribosylation factor 5
annexin VII isoform 2
aspartate aminotransferase 1
ATP‐dependent DNA helicase II
brain glycogen phosphorylase
calpastatin isoform g
catenin, alpha 1
chaperonin containing TCP1, subunit 7 isoform b
chloride intracellular channel 1
chloride intracellular channel 6
clathrin heavy chain 1
CNDP dipeptidase 2 (metallopeptidase M20 family)
cytokine induced protein 29 kDa
DJ‐1 protein
eIF‐5A2 protein
erythrocyte membrane protein band 4.1‐like 1 isoform a
eukaryotic translation elongation factor 1 gamma
eukaryotic translation initiation factor 3, subunit 12
eukaryotic translation initiation factor 3, subunit 6 48kDa
eukaryotic translation initiation factor 5A
exportin 1
filamin B, beta (actin binding protein 278)
FK506‐binding protein 4

227
flap structure‐specific endonuclease 1
gelsolin‐like capping protein
heterogeneous nuclear ribonucleoprotein D isoform c
histone H2a
HLA‐B associated transcript 1
hypothetical protein LOC401019
inosine triphosphatase isoform a
keratin 15
keratin 19
keratin 1B
lactate dehydrogenase C
leucine rich repeat (in FLII) interacting protein 1
LUC7‐like 2
myosin, light chain 6, alkali, smooth muscle and non‐muscle isoform 1
N‐acetylneuraminic acid phosphate synthase
N‐myc downstream regulated gene 1
opioid growth factor receptor
peroxiredoxin 5 precursor, isoform a
plastin 1
poly (ADP‐ribose) polymerase family, member 1
PREDICTED: similar to 60S ribosomal protein L7a isoform 3
PREDICTED: similar to aminopeptidase puromycin sensitive
PREDICTED: similar to High mobility group protein B1
PREDICTED: similar to nascent polypeptide‐associated complex alpha polypeptide
PREDICTED: similar to peptidylprolyl isomerase A (cyclophilin A)‐like 4
PREDICTED: similar to peptidylprolyl isomerase A isoform 1
PREDICTED: similar to peptidylprolyl isomerase A isoform 1
prosaposin isoform c preproprotein
proteasome activator subunit 1 isoform 2
protein phosphatase 1, catalytic subunit, beta isoform 1
protein phosphatase 1, regulatory subunit 7
ras‐related nuclear protein
RCC1‐like
ribosomal protein L23
ribosomal protein L6
ribosomal protein P2
ribosomal protein S24 isoform c
ribosomal protein S8
small nuclear ribonucleoprotein D1 polypeptide 16kDa
smooth muscle myosin heavy chain 11 isoform SM1A
splicing factor 3b, subunit 1 isoform 1
stress‐induced‐phosphoprotein 1 (Hsp70/Hsp90‐organizing protein)
T‐complex protein 1 isoform a
thioredoxin
thioredoxin‐like 5
TNF receptor‐associated protein 1
tropomyosin 4
tumor‐associated calcium signal transducer 2 precursor
ubiquitin and ribosomal protein L40 precursor
vacuolar protein sorting 35
visfatin precursor
actinin, alpha 2
ADP‐ribosylation factor 1
apolipoprotein A‐I preproprotein
apoptosis inhibitor 5
apoptotic chromatin condensation inducer 1
ATP‐binding cassette, sub‐family F, member 1 isoform a
ATP citrate lyase isoform 1
autoantigen La
carbonic anhydrase II
cathepsin D preproprotein
CD1A antigen precursor
CD9 antigen
cellular retinoic acid binding protein 2
chromatin modifying protein 4B
core‐binding factor, beta subunit isoform 2

228
CSE1 chromosome segregation 1‐like protein
cytochrome P450, family 24 precursor
eukaryotic translation initiation factor 3, subunit 4 delta, 44kDa
eukaryotic translation initiation factor 4A, isoform 3
F‐actin capping protein alpha‐1 subunit
far upstream element‐binding protein
fascin 1
fatty acid desaturase 1
G protein‐coupled receptor associated sorting protein 2
glucose‐6‐phosphate dehydrogenase isoform a
glycogen synthase kinase 3 beta
glyoxalase I
heat shock 105kD
high‐mobility group (nonhistone chromosomal) protein 1‐like 1
hypothetical protein LOC23277
hypothetical protein LOC51493
hypothetical protein LOC79017
immunoglobulin binding protein 1
liver phosphofructokinase isoform b
major vault protein
myosin, heavy chain 14 isoform 1
myosin, heavy polypeptide 10, non‐muscle
myotrophin
nucleosome assembly protein 1‐like 1
poly(A) binding protein, cytoplasmic 1
polypyrimidine tract‐binding protein 1 isoform c
PREDICTED: hypothetical protein
PREDICTED: similar to 60S ribosomal protein L29
PREDICTED: similar to myosin regulatory light chain‐like
PREDICTED: similar to ribosomal protein L5 isoform 1
PREDICTED: similar to ribosomal protein S12
PREDICTED: similar to ribosomal protein S3a isoform 2
PREDICTED: similar to tubulin, beta 6
protein phosphatase 2, catalytic subunit, beta isoform
purine nucleoside phosphorylase
Rho GDP dissociation inhibitor (GDI) alpha
ribosomal protein L10a
ribosomal protein L12
ribosomal protein S13
ribosomal protein S3
ribosomal protein S7
RuvB‐like 1
septin 9
signal transducer and activator of transcription 3 isoform 2
small nuclear ribonucleoprotein polypeptide F
solute carrier family 3 (activators of dibasic and neutral amino acid transport)
splicing factor, arginine/serine‐rich 3
transaldolase 1
tubulin, beta, 2
tumor protein, translationally‐controlled 1
ubiquitin‐activating enzyme E1
ubiquitin‐conjugating enzyme E2I
v‐crk sarcoma virus CT10 oncogene homolog isoform b
zinc finger, CCHC domain containing 11 isoform a
ADP‐ribosylation factor‐like 1
alanyl‐tRNA synthetase
alpha isoform of regulatory subunit A, protein phosphatase 2
chaperonin containing TCP1, subunit 2
coactosin‐like 1
coatomer protein complex, subunit gamma 1
diazepam binding inhibitor isoform 3
hypothetical protein LOC345651
nascent‐polypeptide‐associated complex alpha polypeptide‐like
otubain 1
PREDICTED: similar to 60S ribosomal protein L7 isoform 1
PREDICTED: similar to Actin‐related protein 2/3 complex subunit 1B
PREDICTED: similar to eukaryotic translation initiation factor 3,
PREDICTED: similar to eukaryotic translation initiation factor 3
PREDICTED: similar to Heat shock protein HSP 90‐beta
PREDICTED: similar to Protein SET (Phosphatase 2A inhibitor I2PP2A)
serine (or cysteine) proteinase inhibitor, clade B (ovalbumin), member 1
Tax1 (human T‐cell leukemia virus type I) binding protein 3

229
Appendix G Proteome Results for Ciclosporin Treatment
Protein Identification C 0.5 1 1.5 2 2.5alanyl‐tRNA synthetase
chaperonin containing TCP1, subunit 8 (theta)
diazepam binding inhibitor isoform 3
dUTP pyrophosphatase isoform 1 precursor
high‐mobility group (nonhistone chromosomal) protein 1‐like 1
histone H2a
keratin 20
myotrophin
myristoylated alanine‐rich protein kinase C substrate
non‐POU domain containing, octamer‐binding
p47 protein isoform b
phosphofructokinase, platelet
PREDICTED: similar to eukaryotic translation initiation factor 3
PREDICTED: similar to eukaryotic translation initiation factor 3
PREDICTED: similar to Heat shock protein HSP 90‐beta (HSP 84) (TSTA)
PREDICTED: similar to High mobility group protein B1
PREDICTED: similar to ribosomal protein L5 isoform 1
ribosomal protein S2
tumor protein, translationally‐controlled 1
actin, gamma 1 propeptide
actinin, alpha 1
actinin, alpha 4
adenylyl cyclase‐associated protein
adipose specific 2
AHNAK nucleoprotein isoform 1
albumin precursor
aldo‐keto reductase family 1, member A1
aldolase A
alpha 2 actin
annexin 5
annexin A11
annexin A2 isoform 2
annexin A8‐like 1
annexin I
apolipoprotein A‐I preproprotein
argininosuccinate synthetase 1
arginyl aminopeptidase (aminopeptidase B)
ARP3 actin‐related protein 3 homolog
aspartyl‐tRNA synthetase
ATP‐dependent DNA helicase II, 70 kDa subunit
calmodulin 2
calpain, small subunit 1
chaperonin containing TCP1, subunit 2
chloride intracellular channel 1
clathrin heavy chain 1
cofilin 1 (non‐muscle)
cold shock domain protein A
cortactin isoform a
cytosolic malate dehydrogenase
DJ‐1 protein
eIF‐5A2 protein
enolase 1
enolase 2
enolase 3
eukaryotic translation elongation factor 1 alpha 1
eukaryotic translation elongation factor 1 alpha 2
eukaryotic translation elongation factor 1 beta 2
eukaryotic translation elongation factor 2
eukaryotic translation initiation factor 4A isoform 1
eukaryotic translation initiation factor 4A2
fascin 1
fatty acid synthase
filamin A, alpha
fructose‐1,6‐bisphosphatase 1
fructose‐bisphosphate aldolase C
GDP dissociation inhibitor 1
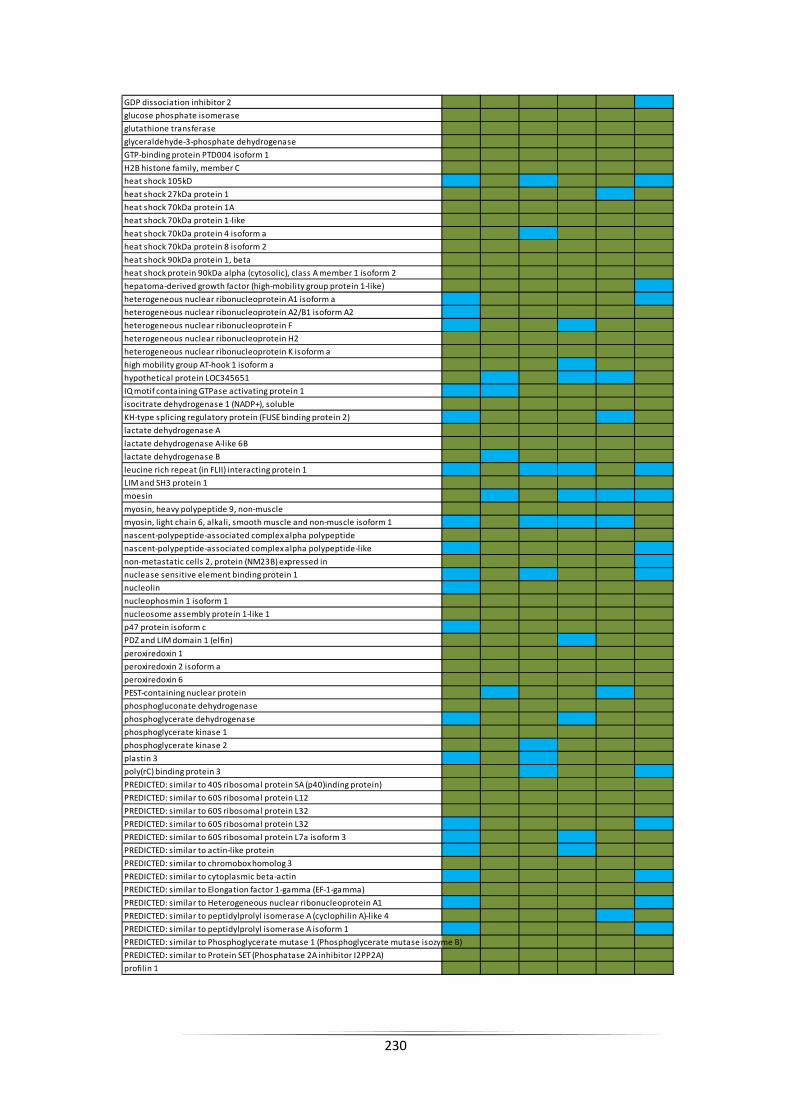
230
GDP dissociation inhibitor 2
glucose phosphate isomerase
glutathione transferase
glyceraldehyde‐3‐phosphate dehydrogenase
GTP‐binding protein PTD004 isoform 1
H2B histone family, member C
heat shock 105kD
heat shock 27kDa protein 1
heat shock 70kDa protein 1A
heat shock 70kDa protein 1‐like
heat shock 70kDa protein 4 isoform a
heat shock 70kDa protein 8 isoform 2
heat shock 90kDa protein 1, beta
heat shock protein 90kDa alpha (cytosolic), class A member 1 isoform 2
hepatoma‐derived growth factor (high‐mobility group protein 1‐like)
heterogeneous nuclear ribonucleoprotein A1 isoform a
heterogeneous nuclear ribonucleoprotein A2/B1 isoform A2
heterogeneous nuclear ribonucleoprotein F
heterogeneous nuclear ribonucleoprotein H2
heterogeneous nuclear ribonucleoprotein K isoform a
high mobility group AT‐hook 1 isoform a
hypothetical protein LOC345651
IQ motif containing GTPase activating protein 1
isocitrate dehydrogenase 1 (NADP+), soluble
KH‐type splicing regulatory protein (FUSE binding protein 2)
lactate dehydrogenase A
lactate dehydrogenase A‐like 6B
lactate dehydrogenase B
leucine rich repeat (in FLII) interacting protein 1
LIM and SH3 protein 1
moesin
myosin, heavy polypeptide 9, non‐muscle
myosin, light chain 6, alkali, smooth muscle and non‐muscle isoform 1
nascent‐polypeptide‐associated complex alpha polypeptide
nascent‐polypeptide‐associated complex alpha polypeptide‐like
non‐metastatic cells 2, protein (NM23B) expressed in
nuclease sensitive element binding protein 1
nucleolin
nucleophosmin 1 isoform 1
nucleosome assembly protein 1‐like 1
p47 protein isoform c
PDZ and LIM domain 1 (elfin)
peroxiredoxin 1
peroxiredoxin 2 isoform a
peroxiredoxin 6
PEST‐containing nuclear protein
phosphogluconate dehydrogenase
phosphoglycerate dehydrogenase
phosphoglycerate kinase 1
phosphoglycerate kinase 2
plastin 3
poly(rC) binding protein 3
PREDICTED: similar to 40S ribosomal protein SA (p40)inding protein)
PREDICTED: similar to 60S ribosomal protein L12
PREDICTED: similar to 60S ribosomal protein L32
PREDICTED: similar to 60S ribosomal protein L32
PREDICTED: similar to 60S ribosomal protein L7a isoform 3
PREDICTED: similar to actin‐like protein
PREDICTED: similar to chromobox homolog 3
PREDICTED: similar to cytoplasmic beta‐actin
PREDICTED: similar to Elongation factor 1‐gamma (EF‐1‐gamma)
PREDICTED: similar to Heterogeneous nuclear ribonucleoprotein A1
PREDICTED: similar to peptidylprolyl isomerase A (cyclophilin A)‐like 4
PREDICTED: similar to peptidylprolyl isomerase A isoform 1
PREDICTED: similar to Phosphoglycerate mutase 1 (Phosphoglycerate mutase isozyme B)
PREDICTED: similar to Protein SET (Phosphatase 2A inhibitor I2PP2A)
profilin 1

231
proteasome activator subunit 1 isoform 2
proteasome activator subunit 2
protein phosphatase 1, catalytic subunit, beta isoform 1
pyrophosphatase 1
pyruvate kinase 3 isoform 1
pyruvate kinase 3 isoform 2
ras‐related nuclear protein
Rho GDP dissociation inhibitor (GDI) beta
ribosomal protein L17
ribosomal protein L19
ribosomal protein L3 isoform a
ribosomal protein L5
ribosomal protein L8
ribosomal protein P0
ribosomal protein S20
ribosomal protein S24 isoform c
ribosomal protein S5
S100 calcium binding protein A11
S‐adenosylhomocysteine hydrolase
serine (or cysteine) proteinase inhibitor, clade B (ovalbumin), member 5
SERPINE1 mRNA binding protein 1 isoform 3
small nuclear ribonucleoprotein D1 polypeptide 16kDa
stratifin
thioredoxin
TNF receptor‐associated protein 1
transgelin 2
transketolase
triosephosphate isomerase 1
tropomyosin 3 isoform 2
tropomyosin 4
tubulin, alpha 1a
tubulin, alpha, ubiquitous
tubulin, beta 2B
tubulin, beta 4
tubulin, beta polypeptide
tubulin, beta, 4
tyrosine 3/tryptophan 5 ‐monooxygenase activation protein, epsilon
tyrosine 3/tryptophan 5 ‐monooxygenase activation protein, theta
tyrosine 3/tryptophan 5 ‐monooxygenase activation protein, zeta
tyrosine 3‐monooxygenase/tryptophan 5‐monooxygenase activation protein, beta
tyrosine 3‐monooxygenase/tryptophan 5‐monooxygenase activation protein, gamma
ubiquitin and ribosomal protein L40 precursor
vacuolar protein sorting 35
villin 2
vinculin isoform meta‐VCL
visfatin precursor
acidic (leucine‐rich) nuclear phosphoprotein 32 family, member A
adenylate kinase 1
ADP‐ribosylation factor‐like 1
aldehyde dehydrogenase 1A3
alpha isoform of regulatory subunit A, protein phosphatase 2
annexin A3
annexin IV
annexin VII isoform 2
APEX nuclease
aryl hydrocarbon receptor interacting protein
ATP‐dependent DNA helicase II
basic transcription factor 3 isoform B
brain glycogen phosphorylase
calpastatin isoform g
calreticulin precursor
cathepsin D preproprotein
CD1A antigen precursor
CDV3 homolog
cell division cycle 37 protein
cellular retinoic acid binding protein 2
chaperonin containing TCP1, subunit 3 isoform a

232
chaperonin containing TCP1, subunit 3 isoform c
chaperonin containing TCP1, subunit 7 isoform b
chloride intracellular channel 6
chromatin modifying protein 4B
CNDP dipeptidase 2 (metallopeptidase M20 family)
coatomer protein complex, subunit gamma 1
cytidylate kinase
cytokine induced protein 29 kDa
cytosolic malic enzyme 1
DEAD (Asp‐Glu‐Ala‐Asp) box polypeptide 39
erythrocyte membrane protein band 4.1‐like 2
eukaryotic translation elongation factor 1 gamma
eukaryotic translation elongation factor 1 delta isoform 1
eukaryotic translation initiation factor 2, subunit 1 alpha, 35kDa
eukaryotic translation initiation factor 3, subunit 12
eukaryotic translation initiation factor 5A
exportin 1
far upstream element‐binding protein
fatty acid desaturase 1
filamin B, beta (actin binding protein 278)
FK506‐binding protein 1A
FK506‐binding protein 4
flap structure‐specific endonuclease 1
G protein‐coupled receptor associated sorting protein 2
germ cell specific Y‐box binding protein
glucose‐6‐phosphate dehydrogenase isoform a
glyoxalase I
H4 histone family, member B
heterogeneous nuclear ribonucleoprotein A3
heterogeneous nuclear ribonucleoprotein D isoform c
high‐mobility group box 1
high‐mobility group box 2
HLA‐B associated transcript 1
hydroxypyruvate isomerase homolog
hypothetical protein LOC401019
hypothetical protein LOC79017
immunoglobulin binding protein 1
integrin beta 4 binding protein isoform a
interferon regulatory factor 6
involucrin
keratin 1
keratin 10
keratin 13 isoform a
keratin 15
keratin 19
keratin 1B
keratin 7
keratin 9
lactate dehydrogenase C
liver phosphofructokinase isoform b
major histocompatibility complex class I HLA‐A29.1
minichromosome maintenance deficient 6
myosin regulatory light chain 9 isoform b
myosin, heavy polypeptide 10, non‐muscle
N‐acetylneuraminic acid phosphate synthase
N‐myc downstream regulated gene 1
opioid growth factor receptor
peroxiredoxin 5 precursor, isoform b
phosphoserine aminotransferase isoform 1
plastin 1
PREDICTED: hypothetical protein
PREDICTED: similar to 40S ribosomal protein SA (p40)
PREDICTED: similar to 60S ribosomal protein L29
PREDICTED: similar to Actin‐related protein 2/3 complex subunit 1B
PREDICTED: similar to myosin regulatory light chain‐like
PREDICTED: similar to peptidylprolyl isomerase A isoform 1
PREDICTED: similar to peptidylprolyl isomerase A isoform 1

233
PREDICTED: similar to Protein C6orf115
PREDICTED: similar to tubulin, beta 6
prefoldin subunit 5 isoform alpha
programmed cell death 6 interacting protein
proliferating cell nuclear antigen
prosaposin isoform c preproprotein
proteasome beta 7 subunit proprotein
protein phosphatase 1, regulatory subunit 7
protein phosphatase 2, catalytic subunit, beta isoform
purine nucleoside phosphorylase
Ras‐GTPase‐activating protein SH3‐domain‐binding protein
RCC1‐like
Rho GDP dissociation inhibitor (GDI) alpha
ribonuclease/angiogenin inhibitor
ribosomal protein L23
ribosomal protein L6
ribosomal protein L9
ribosomal protein P2
ribosomal protein S13
ribosomal protein S3
ribosomal protein S4, X‐linked X isoform
ribosomal protein S8
RuvB‐like 1
S100 calcium binding protein A14
septin 9
SET translocation (myeloid leukemia‐associated)
small acidic protein
smooth muscle myosin heavy chain 11 isoform SM1A
small nuclear ribonucleoprotein polypeptide F
smooth muscle myosin heavy chain 11 isoform SM1A
splicing factor proline/glutamine rich (polypyrimidine tract binding protein )
staphylococcal nuclease domain containing 1
superoxide dismutase 1, soluble
T‐complex protein 1 isoform b
thioredoxin‐like 5
TIP120 protein
transaldolase 1
tubulin, alpha 4a
tumor protein D52‐like 2 isoform e
tumor rejection antigen (gp96) 1
ubiquitin‐activating enzyme E1
ubiquitin carboxyl‐terminal esterase L3
ubiquitin‐conjugating enzyme E2L 3 isoform 1
UV excision repair protein RAD23 homolog B
valosin‐containing protein
v‐crk sarcoma virus CT10 oncogene homolog isoform b
zinc finger, CCHC domain containing 11 isoform a
actinin, alpha 2
alpha isoform of regulatory subunit A, protein phosphatase 2
APEX nuclease
aspartate aminotransferase 1
chaperonin containing TCP1, subunit 5 (epsilon)
chaperonin containing TCP1, subunit 7 isoform a
CSE1 chromosome segregation 1‐like protein
eukaryotic translation initiation factor 3, subunit 2 beta, 36kDa
gelsolin‐like capping protein
histone acetyltransferase 1 isoform b
hypothetical protein LOC51493
inosine triphosphatase isoform a
karyopherin beta 1
membrane‐type 1 matrix metalloproteinase cytoplasmic tail binding protein‐1
myristoylated alanine‐rich protein kinase C substrate
poly (ADP‐ribose) polymerase family, member 1
polypyrimidine tract‐binding protein 1 isoform c
PREDICTED: similar to aminopeptidase puromycin sensitive
PREDICTED: similar to Protein SET (Phosphatase 2A inhibitor I2PP2A(PHAPII) )
ribosomal protein L11

234
ribosomal protein L12
ribosomal protein S17
Sec23 homolog B
sorbitol dehydrogenase
stress‐induced‐phosphoprotein 1 (Hsp70/Hsp90‐organizing protein)
T‐complex protein 1 isoform a
tubulin, beta, 2
tumor protein, translationally‐controlled 1