university of groningen analytical techniques and ... · pdf fileuniversity of groningen...
TRANSCRIPT

University of Groningen
Analytical techniques and formulation strategies for the therapeutic protein alkalinephosphataseEriksson, Hans Jonas Christian
IMPORTANT NOTE: You are advised to consult the publisher's version (publisher's PDF) if you wish to cite fromit. Please check the document version below.
Document VersionPublisher's PDF, also known as Version of record
Publication date:2004
Link to publication in University of Groningen/UMCG research database
Citation for published version (APA):Eriksson, H. J. C. (2004). Analytical techniques and formulation strategies for the therapeutic proteinalkaline phosphatase Groningen: s.n.
CopyrightOther than for strictly personal use, it is not permitted to download or to forward/distribute the text or part of it without the consent of theauthor(s) and/or copyright holder(s), unless the work is under an open content license (like Creative Commons).
Take-down policyIf you believe that this document breaches copyright please contact us providing details, and we will remove access to the work immediatelyand investigate your claim.
Downloaded from the University of Groningen/UMCG research database (Pure): http://www.rug.nl/research/portal. For technical reasons thenumber of authors shown on this cover page is limited to 10 maximum.
Download date: 22-05-2018
Analytical Techniques and Formulation Strategies for
the Therapeutic ProteinAlkaline Phosphatase
Jonas Eriksson


RIJKSUNIVERSITEIT GRONINGEN
Analytical Techniques and Formulation Strategies for
the Therapeutic Protein Alkaline Phosphatase
Proefschrift
ter verkrijging van het doctoraat in de Wiskunde en Natuurwetenschappen aan de Rijksuniversiteit Groningen
op gezag van de Rector Magnificus, dr. F. Zwarts, in het openbaar te verdedigen op
maandag 5 juli 2004 om 16.15 uur
door
Hans Jonas Christian Eriksson
geboren op 4 januari 1971
te Hammarö, Zweden

Promotores Prof. Dr. G.J. de Jong Prof. Dr. H.W. Frijlink Copromotores Dr. W.L.J. Hinrichs Dr. G.W. Somsen Beoordelingscommissie Prof. Dr. R.P.H. Bischoff Prof. Dr. D.J.A. Crommelin Prof. Dr. D.K.F. Meijer
ISBN: 90-367-2027-3

To my parents: Hans and Lena

Paranimfen Per Eriksson Ulrik Jurva ISBN electronic version: 90-367-2028-1 Printing: Kompendiet, Göteborg, Sweden The research described in this thesis was carried out within the framework of the research school GUIDE
Contents Chapter 1 1 Introduction Chapter 2 71 Characterization of human placental alkaline phosphatase by activity and protein assays, capillary electrophoresis and matrix-assisted laser desorption/ionization time-of-flight mass spectrometry Chapter 3 91 Potential of capillary electrophoresis for the monitoring of the stability of placental alkaline phosphatase Chapter 4 107 Feasibility of non-volatile buffers in capillary electrophoresis- electrospray ionization mass spectrometry of proteins Chapter 5 127 Investigations into the stabilization of drugs by sugar glasses: The influence of various high-pH buffers Chapter 6 149 Investigations into the stabilization of drugs by sugar glasses: Tablets prepared from stabilized alkaline phosphatase Chapter 7 169 Investigations into the stabilization of drugs by sugar glasses: Delivery of an inulin-stabilized alkaline phosphatase in the intestinal lumen via the oral route Chapter 8 187 Conclusions and perspectives Samenvatting 193 Acknowledgements 199


Introduction Chapter 1
1
Chapter 1
Introduction
Chapter 1 Introduction
2
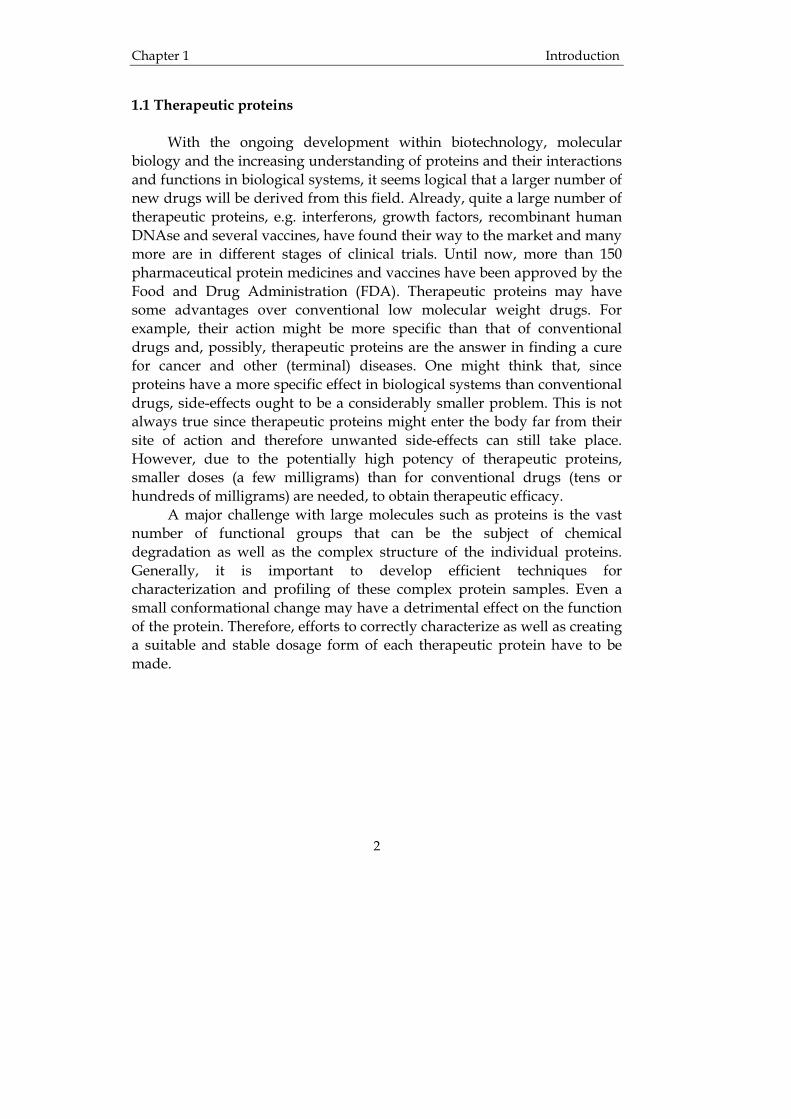
1.1 Therapeutic proteins With the ongoing development within biotechnology, molecular biology and the increasing understanding of proteins and their interactions and functions in biological systems, it seems logical that a larger number of new drugs will be derived from this field. Already, quite a large number of therapeutic proteins, e.g. interferons, growth factors, recombinant human DNAse and several vaccines, have found their way to the market and many more are in different stages of clinical trials. Until now, more than 150 pharmaceutical protein medicines and vaccines have been approved by the Food and Drug Administration (FDA). Therapeutic proteins may have some advantages over conventional low molecular weight drugs. For example, their action might be more specific than that of conventional drugs and, possibly, therapeutic proteins are the answer in finding a cure for cancer and other (terminal) diseases. One might think that, since proteins have a more specific effect in biological systems than conventional drugs, side-effects ought to be a considerably smaller problem. This is not always true since therapeutic proteins might enter the body far from their site of action and therefore unwanted side-effects can still take place. However, due to the potentially high potency of therapeutic proteins, smaller doses (a few milligrams) than for conventional drugs (tens or hundreds of milligrams) are needed, to obtain therapeutic efficacy. A major challenge with large molecules such as proteins is the vast number of functional groups that can be the subject of chemical degradation as well as the complex structure of the individual proteins. Generally, it is important to develop efficient techniques for characterization and profiling of these complex protein samples. Even a small conformational change may have a detrimental effect on the function of the protein. Therefore, efforts to correctly characterize as well as creating a suitable and stable dosage form of each therapeutic protein have to be made.
Introduction Chapter 1
3
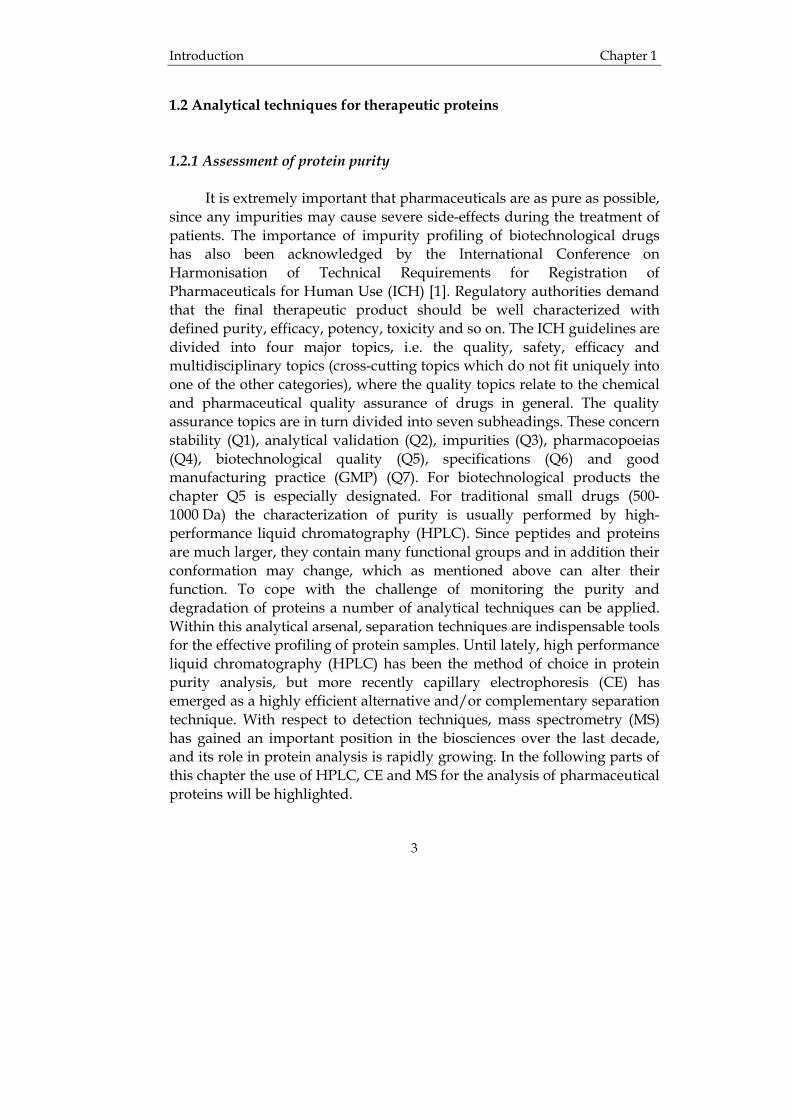
1.2 Analytical techniques for therapeutic proteins 1.2.1 Assessment of protein purity It is extremely important that pharmaceuticals are as pure as possible, since any impurities may cause severe side-effects during the treatment of patients. The importance of impurity profiling of biotechnological drugs has also been acknowledged by the International Conference on Harmonisation of Technical Requirements for Registration of Pharmaceuticals for Human Use (ICH) [1]. Regulatory authorities demand that the final therapeutic product should be well characterized with defined purity, efficacy, potency, toxicity and so on. The ICH guidelines are divided into four major topics, i.e. the quality, safety, efficacy and multidisciplinary topics (cross-cutting topics which do not fit uniquely into one of the other categories), where the quality topics relate to the chemical and pharmaceutical quality assurance of drugs in general. The quality assurance topics are in turn divided into seven subheadings. These concern stability (Q1), analytical validation (Q2), impurities (Q3), pharmacopoeias (Q4), biotechnological quality (Q5), specifications (Q6) and good manufacturing practice (GMP) (Q7). For biotechnological products the chapter Q5 is especially designated. For traditional small drugs (500-1000 Da) the characterization of purity is usually performed by high-performance liquid chromatography (HPLC). Since peptides and proteins are much larger, they contain many functional groups and in addition their conformation may change, which as mentioned above can alter their function. To cope with the challenge of monitoring the purity and degradation of proteins a number of analytical techniques can be applied. Within this analytical arsenal, separation techniques are indispensable tools for the effective profiling of protein samples. Until lately, high performance liquid chromatography (HPLC) has been the method of choice in protein purity analysis, but more recently capillary electrophoresis (CE) has emerged as a highly efficient alternative and/or complementary separation technique. With respect to detection techniques, mass spectrometry (MS) has gained an important position in the biosciences over the last decade, and its role in protein analysis is rapidly growing. In the following parts of this chapter the use of HPLC, CE and MS for the analysis of pharmaceutical proteins will be highlighted.

Chapter 1 Introduction
4
1.2.2 High-performance liquid chromatography Reversed-phase high-performance liquid chromatography (RP-HPLC) RP-HPLC is a separation technique in which the analytes are separated based on hydrophobic interaction between hydrophobic ligands attached to a column support and hydrophobic areas on the protein. Many proteins unfold on contact with the hydrophobic ligands and by being dissolved in an organic solvent of low pH. Consequently, the total number of hydrophobic groups dominates the elution process during RP-HPLC. This means that proteins containing a large proportion of hydrophobic groups will require high concentrations of organic modifier in the mobile phase for elution [2]. Since the total number of hydrophobic groups determines the hydrophobic nature of a protein, it is not unexpected that RP-HPLC of small proteins (less than 50 kDa) is more successful than of larger proteins. At an equal percentage of hydrophobic residues, the organic solvent concentration necessary for protein desorption will increase with protein size. Therefore, high-resolution separations of protein mixtures are commonly performed using gradient elution. It is not necessarily, however, the molecular weight that is the most important factor, but rather the polarity and orientation of the amino acid residues involved in the interaction with the stationary phase. During isocratic elution the best separations are usually achieved when low flow rates are used (typically less than 1 ml/min) while during gradient runs very shallow gradients (about 0.5% per minute) are necessary if high resolution is wanted. This means that one often is faced with a trade-off, i.e. fast analysis or high resolution. The most common stationary phases are microparticulate porous silica derivatized with a silane containing n-butyl, n-octyl or n-octadecyl ligands [3]. The shorter ligands usually give better protein recoveries, and the pore sizes should be in the 100-300 Å range for peptides and 300-4000 Å for proteins. The reason for this is that the solute molecular diameter should be at most one tenth of the pore size to avoid restricted diffusion of the solute and also to allow the total surface area of the sorbent material to be accessible. Another important variable of the reversed-phase material is the particle diameter, where the most commonly used particle diameters are in the range 3-5 µm, but sometimes smaller particles are used. The chromatography of proteins with reversed-phase columns is often problematic compared to RP-HPLC of peptides. In a study by Burton

Introduction Chapter 1
5
and co-workers [4], 33 different proteins ranging from very hydrophilic to very hydrophobic as well as basic and acidic proteins, were investigated. They found that only six out of the thirty-three proteins yielded acceptable results concerning the quality of the chromatography. The problems increase with the size and/or hydrophobicity of a protein. The reasons are given by the numerous interactions of a protein with components of the mobile phase, the stationary phase, and other sample components and with itself. Low recovery and low resolution because of band spreading, tailing and multiple peak formation are caused by these interactions. Even irreversible binding to the stationary phase often occurs. According to the multifunctional (e.g., acidic) moieties of a protein, a large number of equilibria are responsible for the fact that a protein coexists in many different forms (e.g., more or less protonated). More information about the use of RP-HPLC in the analysis of peptides and proteins can be found in the book "Protein Liquid Chromatography” [5]. The mobile phases in RP-HPLC of proteins are usually acidic, containing trifluoro acetic acid (TFA), phosphoric acid or perchloric acid, while acetonitrile, methanol, and 2-propanol are the most commonly employed organic modifiers. Important factors that also must be considered are column temperature, gradient time, gradient shape and mobile phase flow rate [3]. A more thorough investigation on the influence of organic modifier on peptide and polypeptide retention on octadecyl supports can be found in reference [6]. RP-HPLC is often applied in the field of biotechnology as a means of purification or characterization of biotechnology products. Assessing the purity of such compounds is indeed a challenge and not easy without pure reference substances. Quite recently, a procedure for quantitative analysis of impure proteins without the need for a purified reference sample was developed [7]. In that study tryptophane was used as a calibrant. The reason for this is that tryptophane has a distinct and known extinction coefficient. It was concluded that the quantitation is highly convenient and accurate for proteins containing tryptophane. A few current reviews of the use of HPLC and other chromatographic techniques for the separation of peptides and proteins are available [8, 9]. RP-HPLC is frequently used in the field of clinical chemistry, e.g., for the analysis of urinary proteins. Detecting deviations from the normal pattern means that renal disorders can be diagnosed. This was for example demonstrated by Arai et al. [10], who evaluated the possibility to estimate the ratio of α1-acid glycoprotein and albumin in urin by RP-HPLC using a
Chapter 1 Introduction
6
column packed with poly-porous glass. This ratio can be used to diagnose renal disorders. Human glycoprotein hormones are of great value because they are used as medical preparations, components of diagnostic kits and the substances for immunization in antibody production [11]. In the literature there are many examples where RP-HPLC has been employed in the analysis of glycoprotein hormones [11-13]. The use of HPLC in clinical analysis has also recently been reviewed [14]. One of the most extensively analyzed therapeutic proteins is insulin, probably due to its clinical importance and also because it is a quite small protein, only about 5.8 kDa. Lookabaugh et al. [15] evaluated the quantitation of insulin by two separate methods, RP-HPLC and CE, and found that RP-HPLC demonstrated better precision than the CE method (see Table I). Table I. Comparison between HPLC and CE for the analysis of insulin (n=4). From [15].
Sample Insulin content (mg/ml) HPLC
Found;(RSD%);[% of actual]
CE
Found;(RSD%);[% of actual]
1 2.07 2.077;(0.71);[100.3] 2.019;(1.94);[97.5]
2 1.19 1.172;(0.53);[98.5] 1.219;(5.13);[102.4]
3 4.25 4.309;(0.53);[101.4] 4.160;(3.10);[97.9]
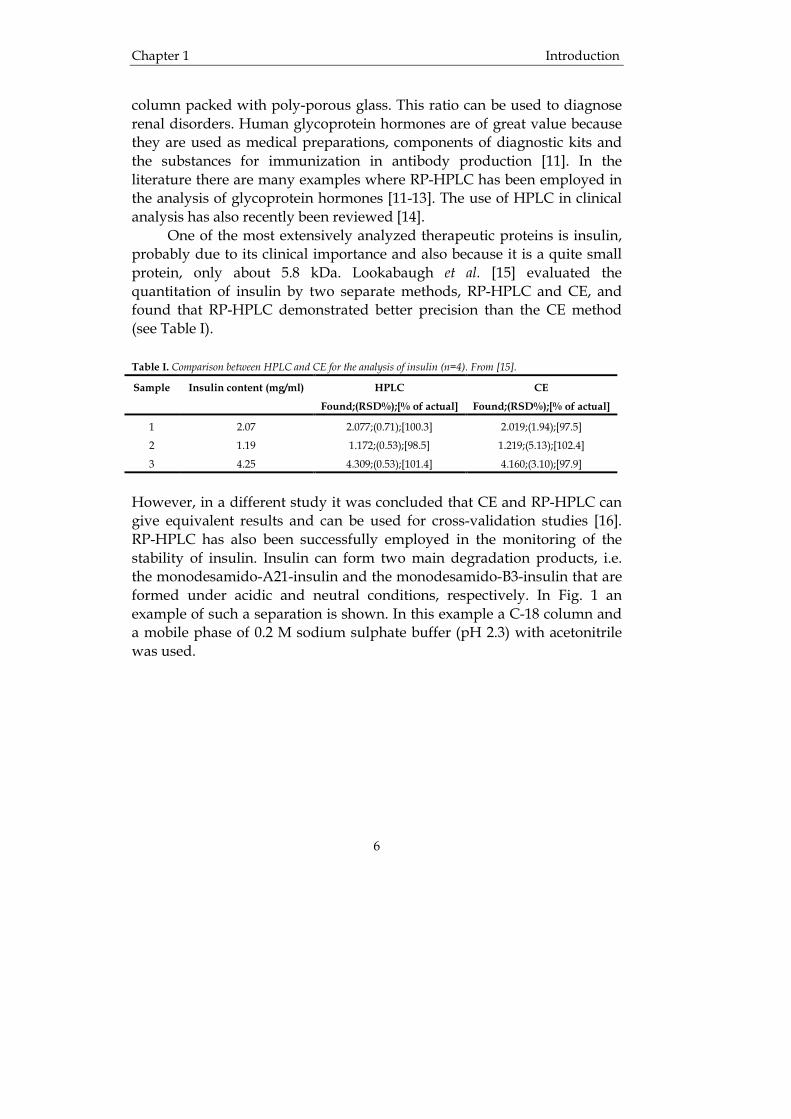
However, in a different study it was concluded that CE and RP-HPLC can give equivalent results and can be used for cross-validation studies [16]. RP-HPLC has also been successfully employed in the monitoring of the stability of insulin. Insulin can form two main degradation products, i.e. the monodesamido-A21-insulin and the monodesamido-B3-insulin that are formed under acidic and neutral conditions, respectively. In Fig. 1 an example of such a separation is shown. In this example a C-18 column and a mobile phase of 0.2 M sodium sulphate buffer (pH 2.3) with acetonitrile was used.
Introduction Chapter 1
7
Fig. 1 Separation of insulin (1) from desamido-A21-insulin (2) and desamido-B3-insulin (3). The left chromatogram was the result of an insulin solution sample stored at 60 °C with shaking, while the right chromatogram is the results of an insulin zinc suspension sample stored at 50 °C without shaking. Clearly, two different degradation products are formed. From [17]. Insulin has also been used as a model compound to evaluate conformational effects in RP-HPLC of polypeptides [18, 19]. The kinetics of the unfolding of insulin was investigated by examination of the dependence of elution profiles on temperature and column residence time. It was also found that one part of the insulin molecule, i.e. the B-chain, dominates the chromatographic behaviour of insulin. The end conclusion of the study was that RP-HPLC can be used to characterize the role of secondary structure in the interactive behaviour of polypeptides and proteins with hydrocarbonaceous ligands. The degradation of insulin has also been successfully monitored by RP-HPLC [17, 20, 21]. Hydrophobic interaction chromatography (HIC) HIC is often used in the separation of proteins. Reversed phase packings are employed as stationary phases, but instead of an organic modifier a salt is used in the mobile phase. The retention in HIC is inversely related to the salt concentration and the salt species can be varied to control the selectivity. HIC is commonly performed on weakly hydrophobic columns (less hydrophobic than those in RP-HPLC) in high salt concentrations of sodium or ammonium sulphate. The proteins are
Chapter 1 Introduction
8
adsorbed to HIC sorbents from high-salt buffers, and the proteins are then eluted with a descending salt gradient, where the proteins elute according to their solubility. The retention of proteins in HIC is sensitive to the hydrophobicity of the stationary phase, which can be altered by both the length and the density of the alkyl side chains of the bonded phase. Even though RP-HPLC is often used in the separation of peptides, it is sometimes necessary to turn to HIC as a separation technique. One such case is when the peptides are likely to precipitate in the mobile phases used in RP-HPLC. This was studied by Alpert [22], who evaluated the use of HIC in the separation of a set of synthetic peptides and small proteins and compared with RP-HPLC. It was found that HIC seems to be broadly applicable to the purification of peptides as well as proteins, and in some cases HIC and RP-HPLC was found to be complementary. For example, a synthetic lipoprotein analogue could not be purified from the impurities using RP-HPLC, while purification by HIC yielded a pure product (data not shown). Size-exclusion chromatography (SEC) In SEC the chromatography depends on the relative molecular size or hydrodynamic volume of the analytes with respect to the size and shape of the pores of the stationary material. To allow the determination of the molecular weight of unknowns the SEC column first has to be calibrated with a set of test compounds with a known molecular mass. SEC is well suited for the measurement of aggregation of proteins, but such measurements are limited to proteins that are linked through covalent or stable non-covalent links. Generally, non-covalently linked proteins dissociate when diluted, which leads to shifts in retention times and altered apparent molecular weights of the aggregates. Since the range of molecular sizes that each SEC column can separate is limited one often needs to use several columns. One way to overcome this dynamic range limit is to place several SEC columns of graded pore size in series. SEC is often used as a confirmatory technique that allows the examination of homogeneity of fractions extracted by other methods. Classical SEC has been used extensively for peptide and protein purification. However, the use of SEC for peptides smaller than about 5000 has been limited, mainly due to the lack of suitable stationary phases. The gels that are commonly used (agarose, dextrane etc.) are often deformed during normal HPLC-conditions. However, with the improvement of stationary phases it is
Introduction Chapter 1
9
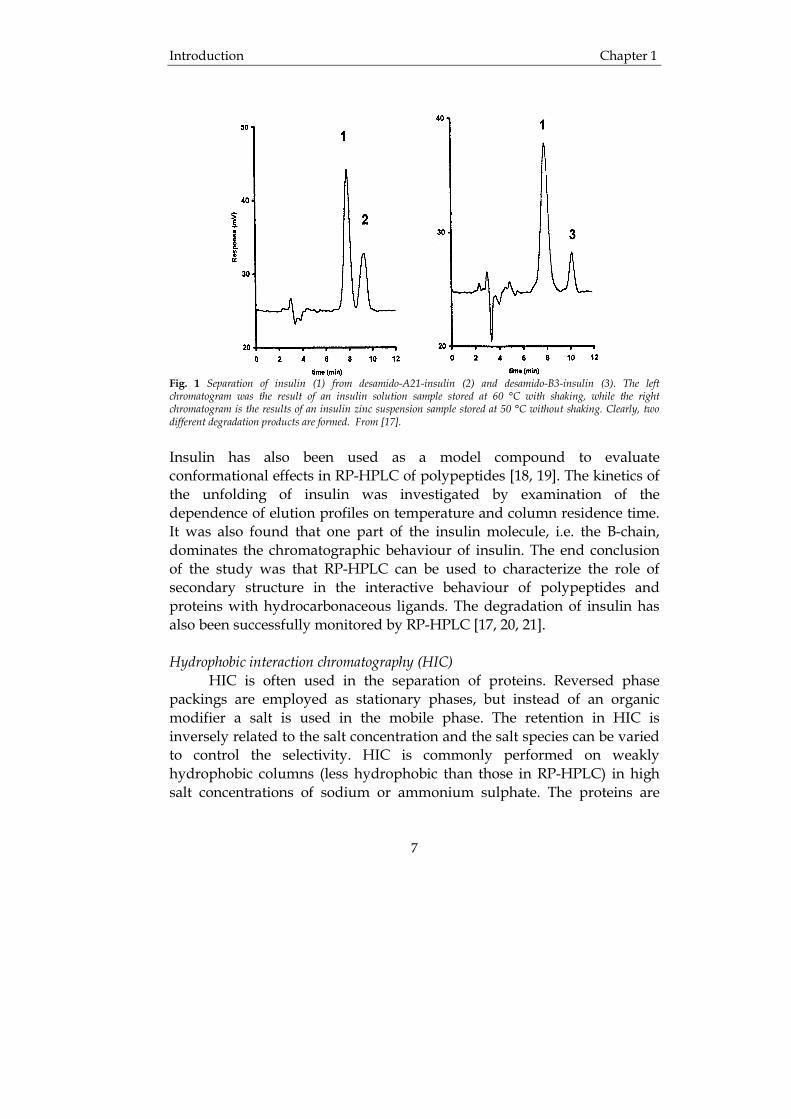
possible that SEC in the future will be more valuable as an analytical tool for peptide and protein analysis. Interestingly, separation based on both a reversed-phase as well as a size-exclusion mechanism may be achieved through the use of high-porosity reversed-phase supports [23]. There are also silica-based SEC-columns, where the porous silica particles have a hydrogel coating, which typically is a few Å thick. The surface of the porous particles is completely covered with this hydrogel, resulting in an interaction between the proteins and the gel phase comparable to that in gel packings. Though these packings do not have the pH range stability of the gels, they can function over a broader pH interval than common silane derivatized silica. SEC has been found to be ideal for the analysis of human growth hormone (hGH) since it can differentiate between monomers and dimers. RP-HPLC, on the other hand, led to the dissociation of the dimer [24]. In a study by Riggin et al. a SEC-method was developed and compared to a rat bioassay. They found that the two methods correlated well but that the SEC-method was much more precise and reliable than the rat bioassay [25]. In Fig. 2 a SEC-chromatogram of biosynthetic hGH is shown, and as can be seen not only the monomer and dimer were detected but also a higher molecular weight species of the hGH.
Fig. 2 SEC of a typical biosynthetic hGH lot. From [25].

Chapter 1 Introduction
10
Ion exchange chromatography (IEC) The separation principle in IEC is based on charge but hydrophobic and polar interactions between analyte and stationary phase also play a role in the retention behaviour. The stationary phase (the ion exchanger) interacts with the analytes through electrostatic phenomena, and a buffer with varying pH and/or ionic strength competes with the ion exchanger for molecular binding sites. The two techniques IEC and RP-HPLC often complement each other, i.e. peptides that can not be separated with one technique may be separated by the other. This means that combining IEC and RP-HPLC often enhances the probability that a complete separation of a peptide or protein mixture is achieved. Often, the presence of an organic modifier in the buffer is needed. The reason for this is that otherwise some peptide/protein peaks are eluted slowly due to their hydrophobicity resulting in broad peaks. Many resins used as stationary phases are susceptible to deformation during high flow rates. One way to increase the rigidity of the stationary phases is to bind the ion exchanger to a microparticulate silica gel. One important draw-back with silica gels is that they are not chemically stable, i.e. they cannot withstand pH above 7.5. This limits their practical use since in IEC pH-gradients or pI-gradients are often applied. It has been suggested that, e.g., ion exchangers based on hydrophilic polyether resins may be available in the future, since they seem to possess adequate chemical stability and loading capacity. IEC has been used for separation of rhDNase differing only in the occurrence of deamidation at a single residue. Since rhDNase is glycosylated it is very charge heterogeneous, making it hard to separate intact and deamidated rhDNase using conventional IEC. However, columns packed with polyanionic ligands, such as a tentacle cation exchanger, immobilized DNA and an immobilized synthetic DNA analogue, were found to accomplish separation between deamidated and intact rhDNase [26]. Separation of glycoforms of rhDNase, differing in the extent and position of mannose phosphorylation, has also been obtained by employing an anion exchanger with a polyethyleneimine (PEI) bonded phase. In Fig. 3 results from this study are given [27]. The separations achieved with a common anion exchanger (diethylaminoethyl, DEAE) were clearly not as good (a) as for the PEI-bonded phase (b). IEC is often used for purification of recombinant therapeutic proteins, e.g., for removal of DNA contaminants [28].

Introduction Chapter 1
11
a ba b
Fig. 3 Separation of rhDNase (A=untreated, B=digested with neuraminidase, C=digested with alkaline phosphatase) using a DEAE-column (a) and a PEI-column (b), respectively. The peaks numbered 1-5 were collected as fractions and subjected to further analysis where it was found that fraction 1 contained no phosphate, 2 and 3 contained 1 mol phosphate, 4 contained about 2 mol phosphate and fraction 5 contained 3 mol phosphate per mol of rhDNase The elution buffer was 5 mM 2-(N-morpholino)-ethanesulfonic acid with 1 mM CaCl2 and a gradient going from 50 to 200 mM NaCl at pH 6.0 for (a), and 10 mM N-2-hydroxyethylpiperazine-N’-ethanesulfonic acid with 1 mM CaCl2 and a gradient going from 0.1 to 1.5 M NaCl at pH 7.0 for (b). From [27]. Affinity chromatography Affinity chromatography is sometimes referred to as biospecific interaction chromatography. This is a technique that is based on specific interactions between molecular pairs from biological systems. Examples of ligands that can be used are antigens, antibodies, hormones, cofactors, receptors etc. This means that it is possible to tailor make a column with affinity only for the analyte of interest, i.e. only this is retained on the column and the rest is eluted. At the end an elution buffer, which disrupts the ligand/protein bond, is applied to rinse the analyte from the column and (ideally) obtain a pure product. This can be very cost effective since as much as 50-80% of the total direct production cost of manufacturing a therapeutic product comes from the final steps, i.e. purification and polishing of the product [29]. Therapeutic proteins often contain mixtures of isoforms, which originate from post-translational modifications in the host cell expression system, e.g., glycosylation, sulphation, oxidation etc. [29]. Since some ligands employed in affinity chromatography originate from natural sources themselves they must also be purified, since they may contain host DNA, and viruses and often show lot-to-lot variation. One way to reduce these problems is to use synthetic ligands such as the
Chapter 1 Introduction
12
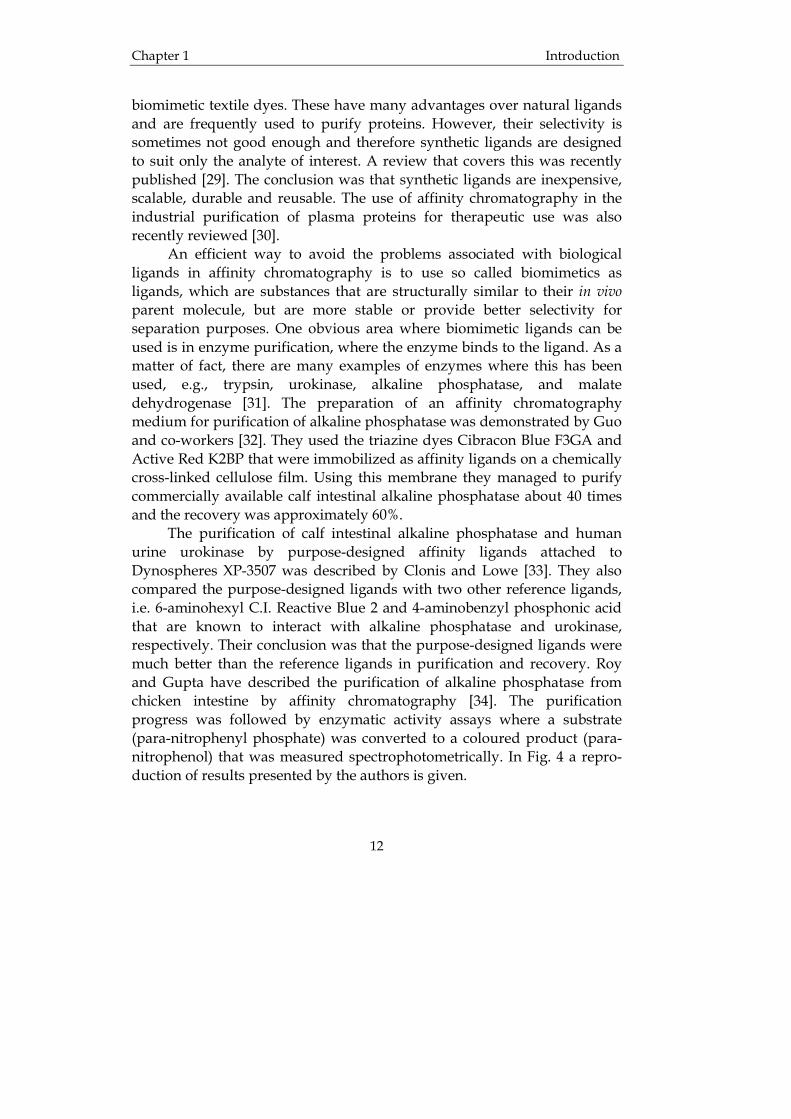
biomimetic textile dyes. These have many advantages over natural ligands and are frequently used to purify proteins. However, their selectivity is sometimes not good enough and therefore synthetic ligands are designed to suit only the analyte of interest. A review that covers this was recently published [29]. The conclusion was that synthetic ligands are inexpensive, scalable, durable and reusable. The use of affinity chromatography in the industrial purification of plasma proteins for therapeutic use was also recently reviewed [30]. An efficient way to avoid the problems associated with biological ligands in affinity chromatography is to use so called biomimetics as ligands, which are substances that are structurally similar to their in vivo parent molecule, but are more stable or provide better selectivity for separation purposes. One obvious area where biomimetic ligands can be used is in enzyme purification, where the enzyme binds to the ligand. As a matter of fact, there are many examples of enzymes where this has been used, e.g., trypsin, urokinase, alkaline phosphatase, and malate dehydrogenase [31]. The preparation of an affinity chromatography medium for purification of alkaline phosphatase was demonstrated by Guo and co-workers [32]. They used the triazine dyes Cibracon Blue F3GA and Active Red K2BP that were immobilized as affinity ligands on a chemically cross-linked cellulose film. Using this membrane they managed to purify commercially available calf intestinal alkaline phosphatase about 40 times and the recovery was approximately 60%. The purification of calf intestinal alkaline phosphatase and human urine urokinase by purpose-designed affinity ligands attached to Dynospheres XP-3507 was described by Clonis and Lowe [33]. They also compared the purpose-designed ligands with two other reference ligands, i.e. 6-aminohexyl C.I. Reactive Blue 2 and 4-aminobenzyl phosphonic acid that are known to interact with alkaline phosphatase and urokinase, respectively. Their conclusion was that the purpose-designed ligands were much better than the reference ligands in purification and recovery. Roy and Gupta have described the purification of alkaline phosphatase from chicken intestine by affinity chromatography [34]. The purification progress was followed by enzymatic activity assays where a substrate (para-nitrophenyl phosphate) was converted to a coloured product (para-nitrophenol) that was measured spectrophotometrically. In Fig. 4 a repro-duction of results presented by the authors is given.

Introduction Chapter 1
13
0
500
1000
1500
2000
2500
0 1 2 3 4 5 6 7 8 9 10 11 12 13Fraction
Act
ivity
(U)
0.0
0.5
1.0
1.5
2.0
2.5
3.0
3.5
4.0
4.5
Protein (mg)
Fig. 4 Purification of alkaline phosphatase from a crude extract of chicken intestine. The squares show the activity and the circles the amount of protein in each fraction. As can be realized from the figure a large amount of protein is eluted in the beginning (fraction 1-6), where also some enzymatic activity can be found. In the later fractions (10-12), a small amount of protein with a relatively higher enzymatic activity is found, indicating that the early fractions were not pure. Reproduced from [34]. Affinity chromatography has also been applied as a means to determine liver- and bone-derived isoenzymes of alkaline phosphatase in serum [35]. A column of wheat-germ lectin conjugated to 7-µm diameter silica particles and an eluent containing N-acetyl-D-glucosamine was used to separate bone and liver isoenzymes of alkaline phosphatase with a peak overlap of about 10%. 1.2.3 Capillary electrophoresis Electrophoresis methodologies are the most commonly used in the separation of proteins, and are the methods of choice for the majority of protein chemists. However, for large-scale procedures (milligram and gram quantities) liquid chromatographic techniques are commonly preferred, since these have larger loading capacity. For purification of small amounts of polypeptides polyacrylamide gel electrophoresis (PAGE) offers the best results. Electrophoretic methods have unsurpassed resolving power and speed and are suitable for the analysis of both hydrophobic as well as hydrophilic peptides and proteins. Capillary electrophoresis (CE)
Chapter 1 Introduction
14
techniques, which have seen a tremendous development during the last two decades, are more and more becoming routine techniques in the biotechnology discipline. For example, when several different glycosylated forms of a protein exist in the same fermentation medium and these forms have different therapeutic activity, the need for a detailed analysis of these forms increases as well. This capability is provided by CE techniques, which consequently are used. Since the progress in biotechnology is an on-going process, the application of CE to the analytical problems encountered in this field is also advancing at the same fast rate. The first biotechnology products were produced using Escherichia coli as host and were, consequently, non-glycosylated and free of most post-translational modifications as well. Nowadays, biotechnology products are produced in mammalian cells, and the resulting proteins are much more complicated. These products possess more complex structural features, such as lipidation, phosphorylation, glycosylation and gamma-carboxylation. Identification of these modifications is vital, since any one of them can have an influence on the activity of a therapeutic protein. The differences in properly and improperly modified proteins are usually small when compared to the molecular size of biologically active proteins that commonly are in the range 20-200 kDa. However, the differences usually involve changes in net charge of the protein. The advantage of capillary electrophoretic techniques is that they provide a charge-based separation mode, and can therefore also give some information about the structure of the protein. The application of capillary electrophoretic techniques in biotechnology has recently been reviewed by several authors [36-42], and the application of CE in the clinical laboratory was also recently reviewed [43]. Even though CE has many advantages there are also disadvantages. Capillary zone electrophoresis (CZE) could in a sense be referred to as “anti-chromatography”, since any interaction with the stationary phase, i.e. the capillary wall, is undesired. Peak broadening and loss of separation efficiency can be caused by adsorption of the proteins to the capillary walls. To counter this phenomenon, one can apply dynamic or static coating of the capillary walls. Dynamic coating is achieved by mixing a suitable additive, i.e. polymer, detergent, or polycation to the background electrolyte. The state of the art of dynamic coatings was recently reviewed [44, 45]. Static wall coatings are often more stable and more efficient than

Introduction Chapter 1
15
dynamic coatings when the goal is to eliminate the electroosmotic flow. Permanent wall coating was recently reviewed [45]. In the review by Roche et al. [41] the history of CE and several different modes of CE are described. In Table II some of the most common modes are outlined. Table II. Different modes of CE separation.
Mode Basis for separation Separation medium Class of molecules
CZE
Charge and size
Low ionic strength buffer
Small molecules
Peptides
Proteins
MEKC
If charged
-charge and size
If neutral
-hydrophobicity and size
Low ionic strength buffer and a micelle-
forming surfactant
Small molecules
Peptides
Proteins
CIEF
Isoelectric point
Acidic (e.g. H3PO4) and basic (e.g. NaOH)
components, linear polymer, and
ampholytes
Proteins
CGE
Chemical gel
-size
Physical gel
- size
Polymerized rigid matrix or replaceable
gel
Replaceable gel
Proteins
dsDNA
ssDNA
Capillary zone electrophoresis (CZE) CZE is the simplest and most popular form of CE. It is applicable for the separation of a diverse array of analytes varying in both size and character. Separation is performed in low ionic strength buffer, and the separation is based on differences in the charge-to-mass ratio of the analytes. Thus, both small molecules and large macromolecular protein complexes can be separated in the same mode, making CZE superior to gel electrophoresis and HPLC. Examples of therapeutic proteins that have been analyzed by CZE are recombinant human deoxyribonuclease (rhDNase) [46] and recombinant human erythropoietin (rhEPO) [47]. Recombinant human DNase is a complex phosphoglycoprotein that is used in the treatment of cystic fibrosis. Its molecular mass is about 34 000 Da and it contains two calcium binding sites. In the study by Felten and co-workers it was found that CZE of rhDNase using a polyvinyl alcohol coated capillary
Chapter 1 Introduction
16
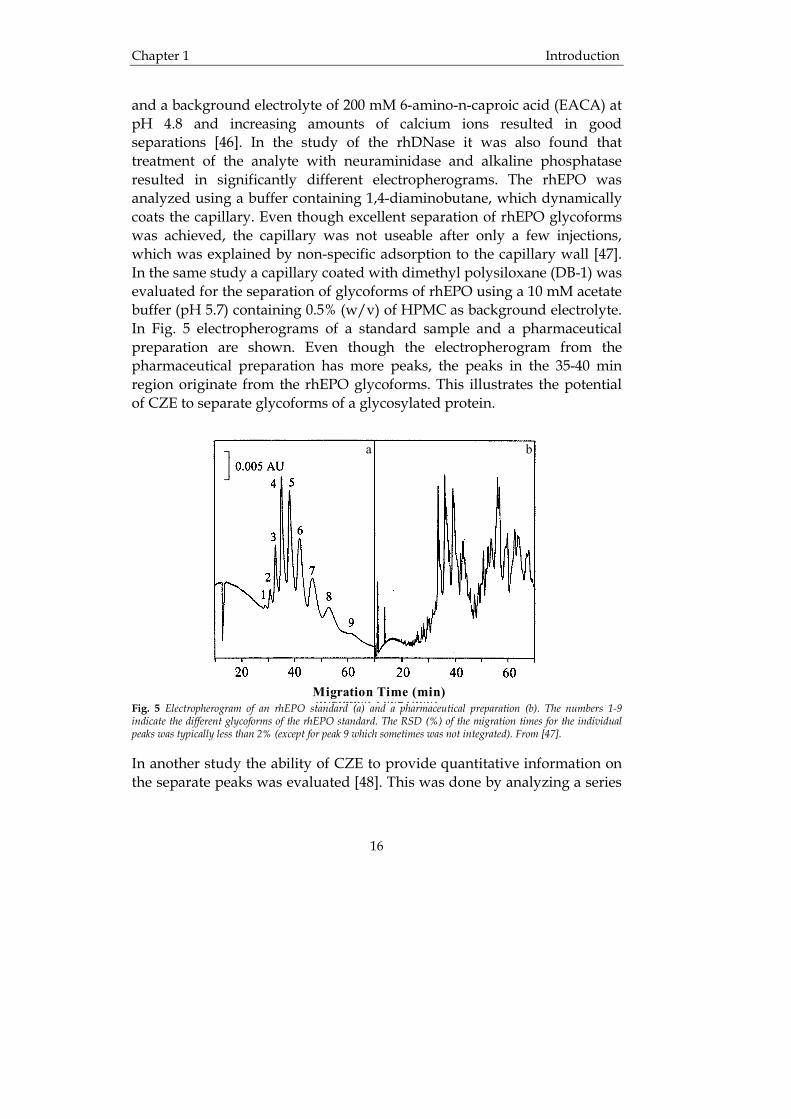
and a background electrolyte of 200 mM 6-amino-n-caproic acid (EACA) at pH 4.8 and increasing amounts of calcium ions resulted in good separations [46]. In the study of the rhDNase it was also found that treatment of the analyte with neuraminidase and alkaline phosphatase resulted in significantly different electropherograms. The rhEPO was analyzed using a buffer containing 1,4-diaminobutane, which dynamically coats the capillary. Even though excellent separation of rhEPO glycoforms was achieved, the capillary was not useable after only a few injections, which was explained by non-specific adsorption to the capillary wall [47]. In the same study a capillary coated with dimethyl polysiloxane (DB-1) was evaluated for the separation of glycoforms of rhEPO using a 10 mM acetate buffer (pH 5.7) containing 0.5% (w/v) of HPMC as background electrolyte. In Fig. 5 electropherograms of a standard sample and a pharmaceutical preparation are shown. Even though the electropherogram from the pharmaceutical preparation has more peaks, the peaks in the 35-40 min region originate from the rhEPO glycoforms. This illustrates the potential of CZE to separate glycoforms of a glycosylated protein.
a b
Migration Time (min)
a ba ba b
Migration Time (min) Fig. 5 Electropherogram of an rhEPO standard (a) and a pharmaceutical preparation (b). The numbers 1-9 indicate the different glycoforms of the rhEPO standard. The RSD (%) of the migration times for the individual peaks was typically less than 2% (except for peak 9 which sometimes was not integrated). From [47]. In another study the ability of CZE to provide quantitative information on the separate peaks was evaluated [48]. This was done by analyzing a series
Introduction Chapter 1
17
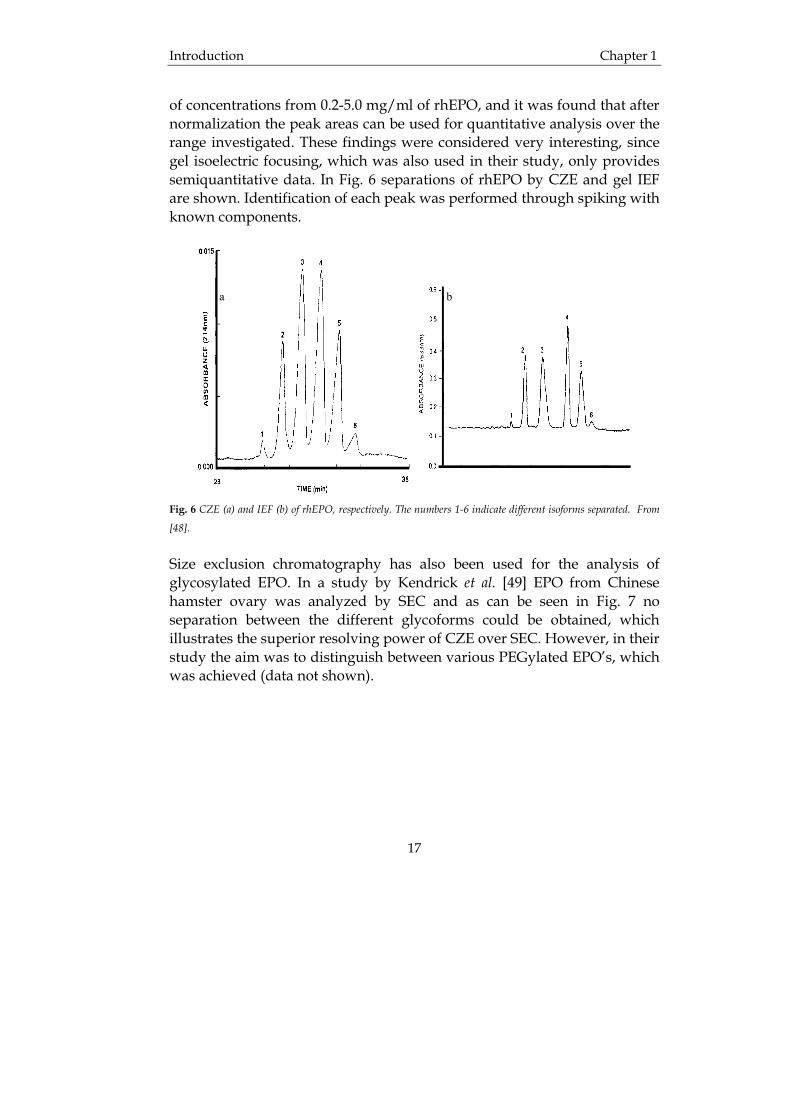
of concentrations from 0.2-5.0 mg/ml of rhEPO, and it was found that after normalization the peak areas can be used for quantitative analysis over the range investigated. These findings were considered very interesting, since gel isoelectric focusing, which was also used in their study, only provides semiquantitative data. In Fig. 6 separations of rhEPO by CZE and gel IEF are shown. Identification of each peak was performed through spiking with known components.
a ba b
Fig. 6 CZE (a) and IEF (b) of rhEPO, respectively. The numbers 1-6 indicate different isoforms separated. From
[48].
Size exclusion chromatography has also been used for the analysis of glycosylated EPO. In a study by Kendrick et al. [49] EPO from Chinese hamster ovary was analyzed by SEC and as can be seen in Fig. 7 no separation between the different glycoforms could be obtained, which illustrates the superior resolving power of CZE over SEC. However, in their study the aim was to distinguish between various PEGylated EPO’s, which was achieved (data not shown).

Chapter 1 Introduction
18
Fig. 7 SEC of EPO from Chinese hamster ovary. Dashed lines represent the part of the fraction that was subjected to further analysis. From [49]. CZE has also been employed for the characterization of insulin, e.g., for purity check [50], quantitation [15, 16], and for the monitoring of the formation of desamido-A21-insulin and desamido-B3-insulin [51]. In Fig. 8 an electropherogram of insulin and the desamido products is shown.
Fig. 8 CZE of human insulin and degradation products. From [51].
Introduction Chapter 1
19
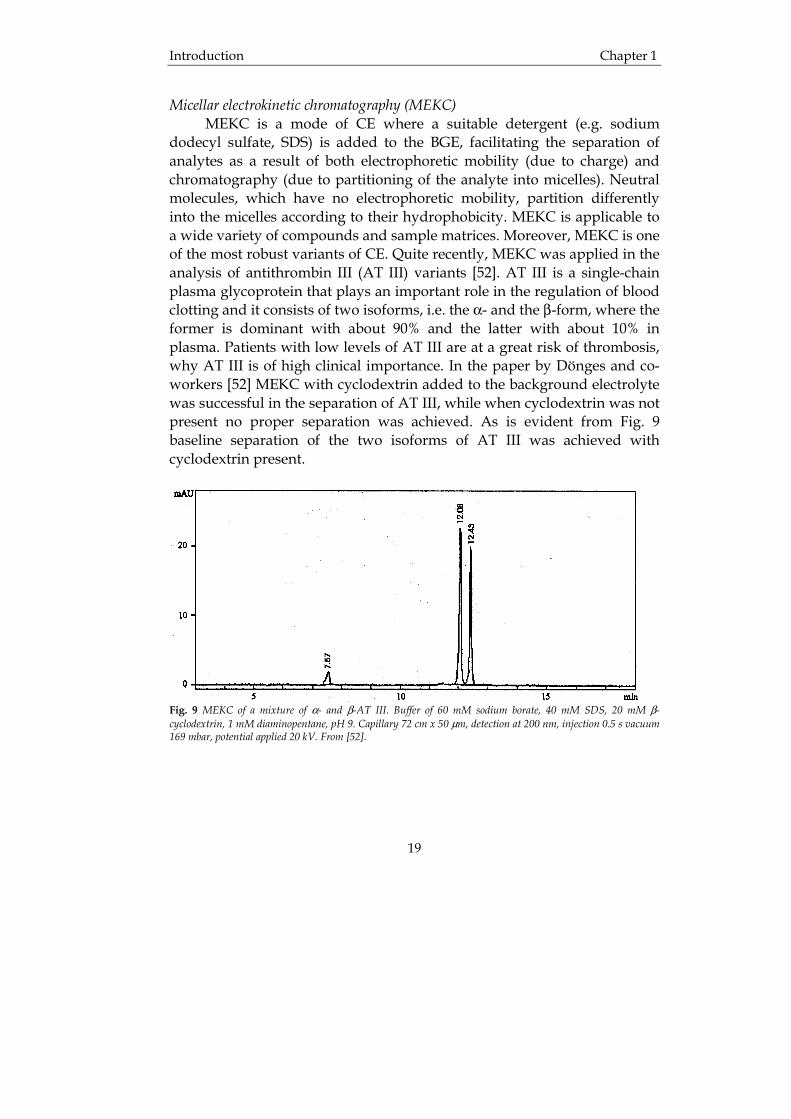
Micellar electrokinetic chromatography (MEKC) MEKC is a mode of CE where a suitable detergent (e.g. sodium dodecyl sulfate, SDS) is added to the BGE, facilitating the separation of analytes as a result of both electrophoretic mobility (due to charge) and chromatography (due to partitioning of the analyte into micelles). Neutral molecules, which have no electrophoretic mobility, partition differently into the micelles according to their hydrophobicity. MEKC is applicable to a wide variety of compounds and sample matrices. Moreover, MEKC is one of the most robust variants of CE. Quite recently, MEKC was applied in the analysis of antithrombin III (AT III) variants [52]. AT III is a single-chain plasma glycoprotein that plays an important role in the regulation of blood clotting and it consists of two isoforms, i.e. the α- and the β-form, where the former is dominant with about 90% and the latter with about 10% in plasma. Patients with low levels of AT III are at a great risk of thrombosis, why AT III is of high clinical importance. In the paper by Dönges and co-workers [52] MEKC with cyclodextrin added to the background electrolyte was successful in the separation of AT III, while when cyclodextrin was not present no proper separation was achieved. As is evident from Fig. 9 baseline separation of the two isoforms of AT III was achieved with cyclodextrin present.
Fig. 9 MEKC of a mixture of α- and β-AT III. Buffer of 60 mM sodium borate, 40 mM SDS, 20 mM β-cyclodextrin, 1 mM diaminopentane, pH 9. Capillary 72 cm x 50 µm, detection at 200 nm, injection 0.5 s vacuum 169 mbar, potential applied 20 kV. From [52].
Chapter 1 Introduction
20
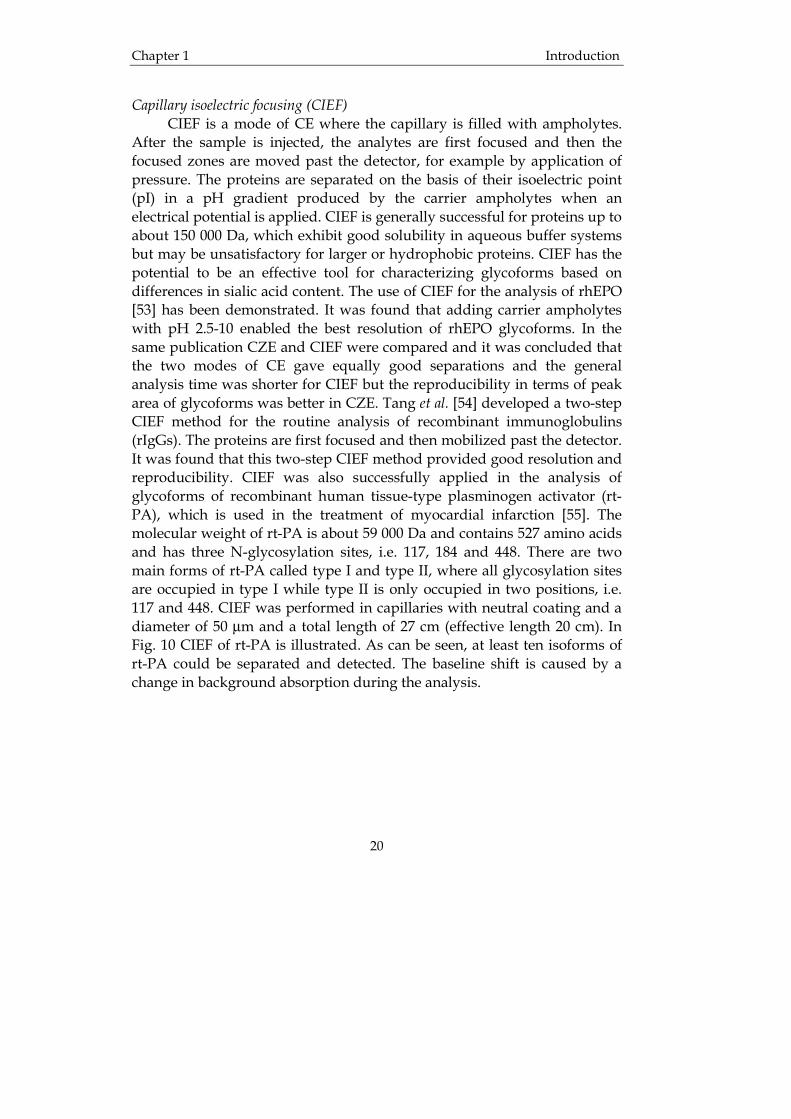
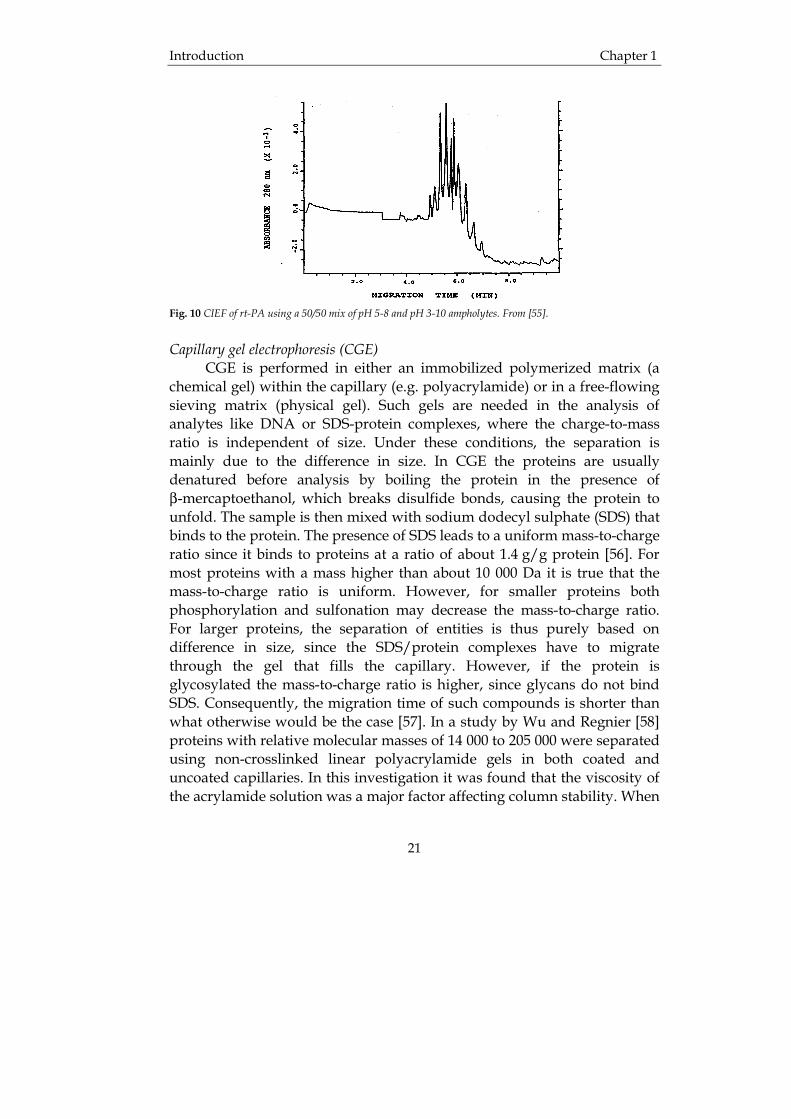
Capillary isoelectric focusing (CIEF) CIEF is a mode of CE where the capillary is filled with ampholytes. After the sample is injected, the analytes are first focused and then the focused zones are moved past the detector, for example by application of pressure. The proteins are separated on the basis of their isoelectric point (pI) in a pH gradient produced by the carrier ampholytes when an electrical potential is applied. CIEF is generally successful for proteins up to about 150 000 Da, which exhibit good solubility in aqueous buffer systems but may be unsatisfactory for larger or hydrophobic proteins. CIEF has the potential to be an effective tool for characterizing glycoforms based on differences in sialic acid content. The use of CIEF for the analysis of rhEPO [53] has been demonstrated. It was found that adding carrier ampholytes with pH 2.5-10 enabled the best resolution of rhEPO glycoforms. In the same publication CZE and CIEF were compared and it was concluded that the two modes of CE gave equally good separations and the general analysis time was shorter for CIEF but the reproducibility in terms of peak area of glycoforms was better in CZE. Tang et al. [54] developed a two-step CIEF method for the routine analysis of recombinant immunoglobulins (rIgGs). The proteins are first focused and then mobilized past the detector. It was found that this two-step CIEF method provided good resolution and reproducibility. CIEF was also successfully applied in the analysis of glycoforms of recombinant human tissue-type plasminogen activator (rt-PA), which is used in the treatment of myocardial infarction [55]. The molecular weight of rt-PA is about 59 000 Da and contains 527 amino acids and has three N-glycosylation sites, i.e. 117, 184 and 448. There are two main forms of rt-PA called type I and type II, where all glycosylation sites are occupied in type I while type II is only occupied in two positions, i.e. 117 and 448. CIEF was performed in capillaries with neutral coating and a diameter of 50 µm and a total length of 27 cm (effective length 20 cm). In Fig. 10 CIEF of rt-PA is illustrated. As can be seen, at least ten isoforms of rt-PA could be separated and detected. The baseline shift is caused by a change in background absorption during the analysis.
Introduction Chapter 1
21
Fig. 10 CIEF of rt-PA using a 50/50 mix of pH 5-8 and pH 3-10 ampholytes. From [55].
Capillary gel electrophoresis (CGE) CGE is performed in either an immobilized polymerized matrix (a chemical gel) within the capillary (e.g. polyacrylamide) or in a free-flowing sieving matrix (physical gel). Such gels are needed in the analysis of analytes like DNA or SDS-protein complexes, where the charge-to-mass ratio is independent of size. Under these conditions, the separation is mainly due to the difference in size. In CGE the proteins are usually denatured before analysis by boiling the protein in the presence of β-mercaptoethanol, which breaks disulfide bonds, causing the protein to unfold. The sample is then mixed with sodium dodecyl sulphate (SDS) that binds to the protein. The presence of SDS leads to a uniform mass-to-charge ratio since it binds to proteins at a ratio of about 1.4 g/g protein [56]. For most proteins with a mass higher than about 10 000 Da it is true that the mass-to-charge ratio is uniform. However, for smaller proteins both phosphorylation and sulfonation may decrease the mass-to-charge ratio. For larger proteins, the separation of entities is thus purely based on difference in size, since the SDS/protein complexes have to migrate through the gel that fills the capillary. However, if the protein is glycosylated the mass-to-charge ratio is higher, since glycans do not bind SDS. Consequently, the migration time of such compounds is shorter than what otherwise would be the case [57]. In a study by Wu and Regnier [58] proteins with relative molecular masses of 14 000 to 205 000 were separated using non-crosslinked linear polyacrylamide gels in both coated and uncoated capillaries. In this investigation it was found that the viscosity of the acrylamide solution was a major factor affecting column stability. When

Chapter 1 Introduction
22
the viscosity is above 100 cP, electro-osmotically driven displacement of the gels is insignificant. CGE has been used for purity check of various proteins. For example, CGE has been successfully employed in the analysis of recombinant bovine somatotropin (rbSt), which enhances milk production in cows and has a molecular weight of about 21 000 [59]. Tsuji subjected production batches of rbSt to CGE and detected fragments, monomers, dimers and trimers of the protein. In Fig. 11 an electrophero-gram from this study is given.
Fig. 11 CGE of rbSt, where A is a fragment, B is the monomer, C is the dimer and D is the trimer of the protein.
From [59].
Tsuji also compared CGE with high performance size exclusion chromatography (HPSEC) and found that SDS gel-filled CE may be a good alternative to HPSEC for the analysis of recombinant proteins. A protein standard mixture containing proteins with a molecular weight from 14 000 to 97 000 was injected in the CGE capillary. After plotting the molecular mass and migration time on a logarithmic (log-log) scale a linear curve with a correlation factor of 0.998 was achieved. The relative standard deviation of molecular mass determinations was about 2-3%, and the CGE also proved to be highly reproducible with rather constant peak migration times even after 140 injections.
Introduction Chapter 1
23
1.2.4 Mass spectrometry Over the last few decades biological and biomedical mass spectrometry has developed to the mature technique that it is today. The use of mass spectrometry in biomedical analysis was recently reviewed by Jonson [60] and Mano and Goto [61]. The development of soft ionization methods, such as electrospray ionization (ESI) and matrix assisted laser desorption ionization (MALDI), has contributed to this since they can produce gas phase ions of large, polar, and thermally labile biomolecules, such as peptides and proteins, nucleic acids and others, and macromolecules larger than 100 kDa can easily be observed. The innovations of these ionization methods have led to a remarkable progress in mass spectrometric technology and in biochemistry, biotechnology and molecular biology research. Additionally, mass spectrometry is a powerful and effective technology employed in drug discovery and development. It can be used for studies on structural determination, drug metabolism, including pharmacokinetics and toxicokinetics, and de novo drug discovery by applying post-genomic approaches [61]. During the last about fifteen years there has been a steady increase in the yearly number of publications where ESI and MALDI are involved in the analysis within the biological and biomedical mass spectrometry. In 1987 the number of published papers involving ESI and MALDI was well under a hundred but had increased to a total of over 1500 published in 2001. Commonly used mass analyzers are the quadrupole mass spectrometers, the ion trap mass spectrometers, and the time-of-flight mass spectrometers [61]. In the quadrupole mass filter, ions produced in the ion source move with a vibration through four perfectly aligned electronically conducting cylindrical rods. The ion-trap mass analyzer also relies on ion separation in the electric field using a quadrupole. There is, however, a difference in the shape of the electrode and scanning mechanism. Ions introduced in the mass analyzer are trapped with a vibration in the space made between end-cap electrodes and ring electrodes. The time-of-flight detector measures the flight time of ions to the ion detector. Heavier ions travel at a lower velocity than lighter ions. This means that the TOF mass analyzer, in principle, has no mass range limit. However, the resolution is limited by the flight-time error, and the difference in the pulsed action and the energy aberration decrease the resolution in a TOF mass analyzer. One way to improve the resolution is to apply a mass reflectron, which
Chapter 1 Introduction
24
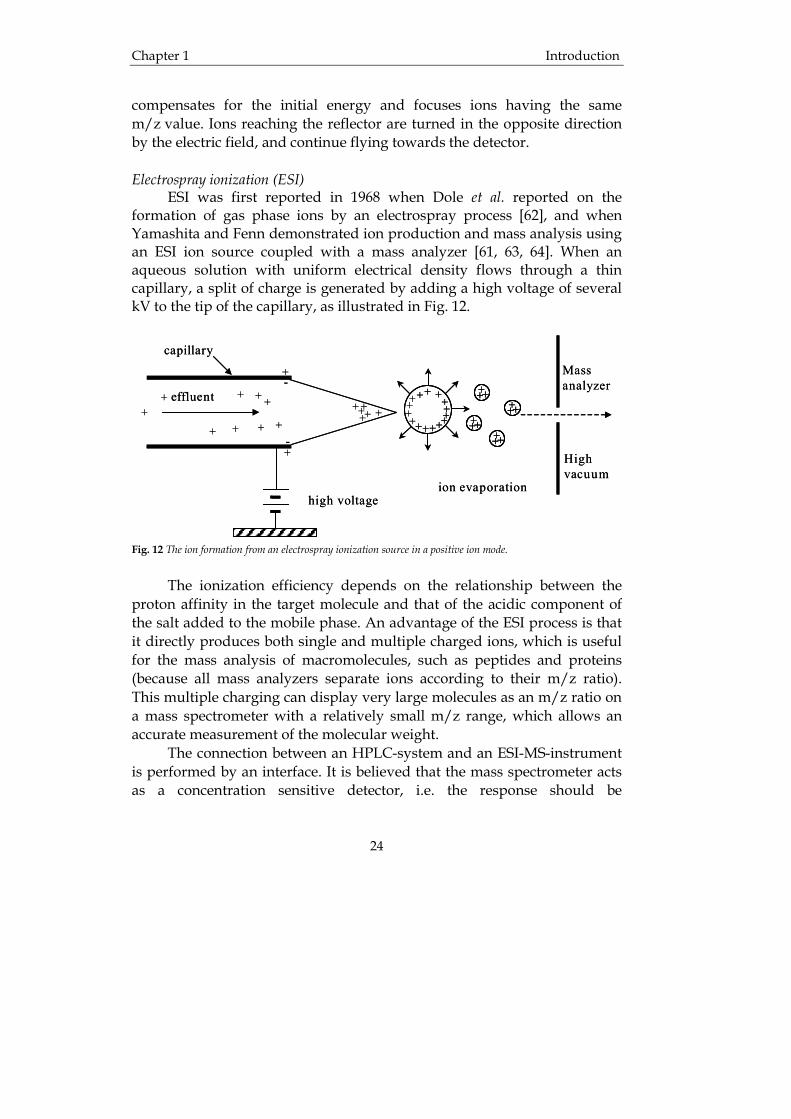
compensates for the initial energy and focuses ions having the same m/z value. Ions reaching the reflector are turned in the opposite direction by the electric field, and continue flying towards the detector. Electrospray ionization (ESI) ESI was first reported in 1968 when Dole et al. reported on the formation of gas phase ions by an electrospray process [62], and when Yamashita and Fenn demonstrated ion production and mass analysis using an ESI ion source coupled with a mass analyzer [61, 63, 64]. When an aqueous solution with uniform electrical density flows through a thin capillary, a split of charge is generated by adding a high voltage of several kV to the tip of the capillary, as illustrated in Fig. 12.
++++
+++
++
+++++++++++ +
effluent +++
++++++
++++
++++
+
+
++
+
+
-
-
ion evaporationhigh voltage
capillaryMassanalyzer
Highvacuum
++++
+++
++
++++++
+++
++
+++++++++++ +
effluent ++++++++
++++++++++++++++
+++++++++
++++
+
+
++
+
+
-
-
ion evaporationhigh voltage
capillaryMassanalyzer
Highvacuum
Fig. 12 The ion formation from an electrospray ionization source in a positive ion mode.
The ionization efficiency depends on the relationship between the
proton affinity in the target molecule and that of the acidic component of the salt added to the mobile phase. An advantage of the ESI process is that it directly produces both single and multiple charged ions, which is useful for the mass analysis of macromolecules, such as peptides and proteins (because all mass analyzers separate ions according to their m/z ratio). This multiple charging can display very large molecules as an m/z ratio on a mass spectrometer with a relatively small m/z range, which allows an accurate measurement of the molecular weight.
The connection between an HPLC-system and an ESI-MS-instrument is performed by an interface. It is believed that the mass spectrometer acts as a concentration sensitive detector, i.e. the response should be

Introduction Chapter 1
25
independent of the flow-rate. The current pneumatically assisted ESI interfaces are optimized for flow rates between 50 and 200 µl/min, and although it is claimed that MS instruments can handle up to 1 ml/min such high flow rates are usually not encountered in practice [65]. It is quite common that a splitter is used in order to decrease the flow from the LC to the MS, where one part of the flow passes for example a UV-detector and the rest goes to the MS. The connection of a CE-system to an ESI-MS-instrument is also quite straightforward. Like for HPLC-ESI-MS a pneumatically assisted nebulizer is employed. The capillary goes through a metallic tube through which a make-up liquid flows at a rate of a few microliters per minute. This make-up liquid is used to ionize the analytes coming from the capillary and is commonly prepared from formic acid or acetic acid with a concentration in the millimolar range. Since the flow from the CE is so small, it does not have to be split before entering the MS. However, due to dilution the sheath flow has a negative effect on the sensitivity.
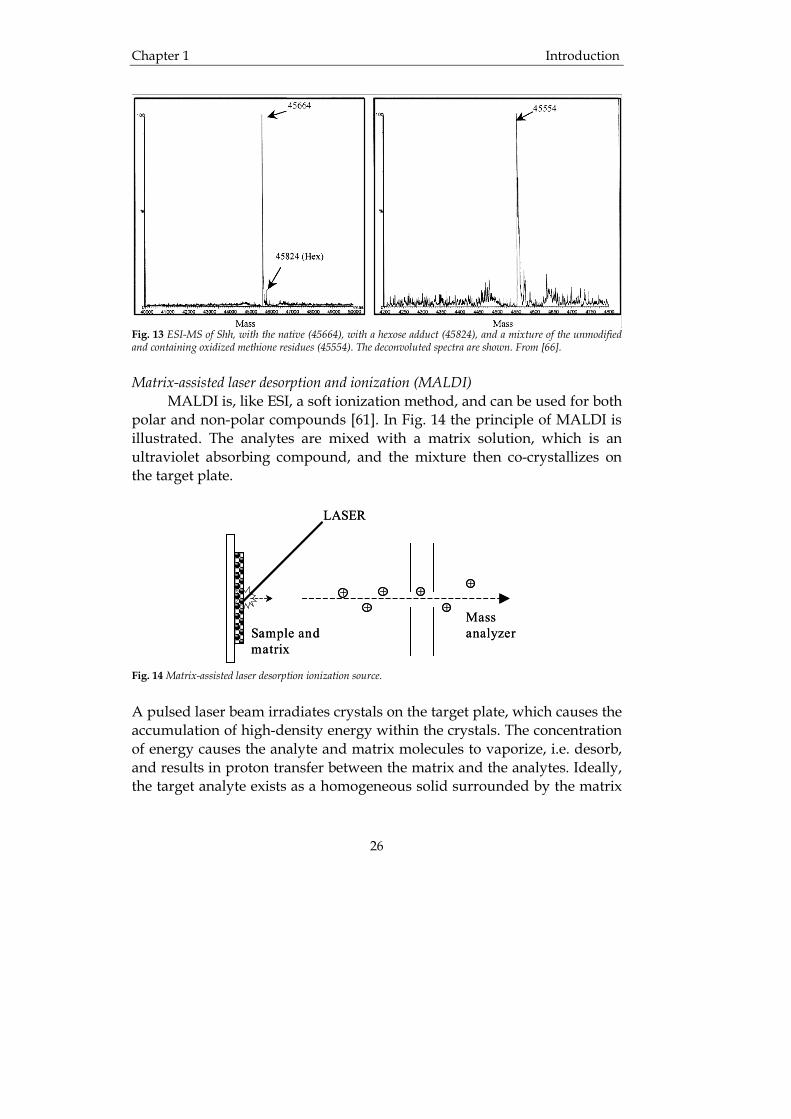
The combination ESI-MS is also common in the analysis of proteins. For example, sonic hedgehog protein fused to an immunoglobulin Fc domain (Shh-Fc) is a therapeutically interesting protein that may be useful in the treatment of neurodegenerative disease and injury [66]. The engineering and expression of human Shh in Pichia pastoris was evaluated by Shapiro et al. [66] using ESI-MS to determine the molecular masses of the expressed proteins. As can be seen from the deconvoluted mass spectra in Fig. 13 analysis of the samples by ESI-MS enabled the authors to distinguish between several different forms of the proteins expressed. A deconvoluted mass spectrum is constructed from a normal mass spectrum where the ions originating from the same analyte are used in a mathematical equation to find the most probable molecular mass of the analyte.
Chapter 1 Introduction
26
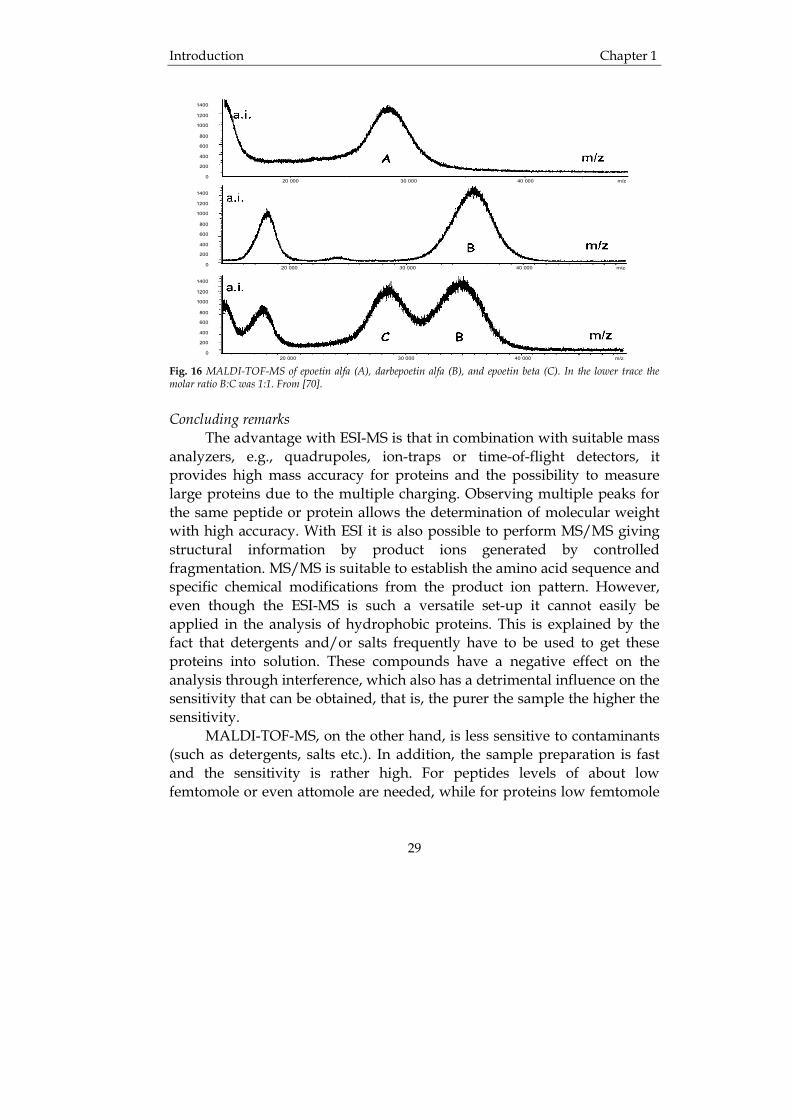
Fig. 13 ESI-MS of Shh, with the native (45664), with a hexose adduct (45824), and a mixture of the unmodified and containing oxidized methione residues (45554). The deconvoluted spectra are shown. From [66]. Matrix-assisted laser desorption and ionization (MALDI) MALDI is, like ESI, a soft ionization method, and can be used for both polar and non-polar compounds [61]. In Fig. 14 the principle of MALDI is illustrated. The analytes are mixed with a matrix solution, which is an ultraviolet absorbing compound, and the mixture then co-crystallizes on the target plate.
++
++
++
MassanalyzerSample and
matrix
LASER
++
++
++
MassanalyzerSample and
matrix
LASER
Fig. 14 Matrix-assisted laser desorption ionization source.
A pulsed laser beam irradiates crystals on the target plate, which causes the accumulation of high-density energy within the crystals. The concentration of energy causes the analyte and matrix molecules to vaporize, i.e. desorb, and results in proton transfer between the matrix and the analytes. Ideally, the target analyte exists as a homogeneous solid surrounded by the matrix

Introduction Chapter 1
27
molecules, constituting a hydrogen bonding network, and this may also guard unstable analytes from energy pulsed laser power. MALDI produces mainly singly charged ions, and results in larger m/z ratios than those produced by ESI, which mainly produces multiply charged ions. Additionally, MALDI operates with pulsed lasers and is normally coupled to time-of-flight (TOF) mass detectors, which have no theoretical upper limit to the m/z ratio. The huge advantage with singly charged ions has made MALDI a routine method in the analysis of proteins and digests thereof. Nowadays, MALDI-TOF is the most common and primary analytical technique for peptides and proteins in proteomics research. There are many examples of off-line separation-MALDI-MS. After separation, fractions are collected and placed on the MALDI target for further analysis. Though this is not a difficult procedure it can be quite laborious and it is desired to minimize such tedious work. Therefore, attempts are made to perform “at-line” separation MALDI-MS. This is done by collection of entire chromatograms (or electropherograms) onto MALDI-targets. Quite recently, a publication describing CE-MALDI-MS was presented [67]. A vacuum deposition interface was used to get the analytes from the CE into the MALDI-instrument. The outlets of an array of capillaries (8 capillaries) were in contact with a moving polyester tape at vacuum, thus creating electropherograms on this tape. The tape can be analyzed either on-line or off-line. In the off-line mode the tape is transferred to an ordinary MALDI-target. Recombinant human erythropoietin (rhEPO) is a glycoprotein hormone that is used for the treatment of anaemia associated with chronic renal failure. The EPO consists of 165 amino acids with two disulfide bonds and about 40 w/w% carbohydrates, which contribute to the heterogeneity of the protein [68]. Recombinant human erythropoietin expressed in Chinese hamster ovary (CHO) contains four potential sites of glycosylation, i.e. one O-linked, serine (Ser) 126, and three N-linked, aspargine (Asn) 24, Asn 38, and Asn 83, respectively. In a study by Zhou et al. several analytical techniques were combined in order to characterize the intact as well as digests of rhEPO [68]. MALDI-TOF MS was employed to determine the molecular mass of the intact rhEPO. From Fig. 15 it is realized that the molecular weight of the molecule is 28 707 Da. This value is much lower than the 34 000 estimated by SDS-PAGE. However, the latter is known to give erroneous results for glycoproteins. The molecular weight of rhEPO as calculated from its amino acid sequence is 18 396, and the 10 311 Da

Chapter 1 Introduction
28
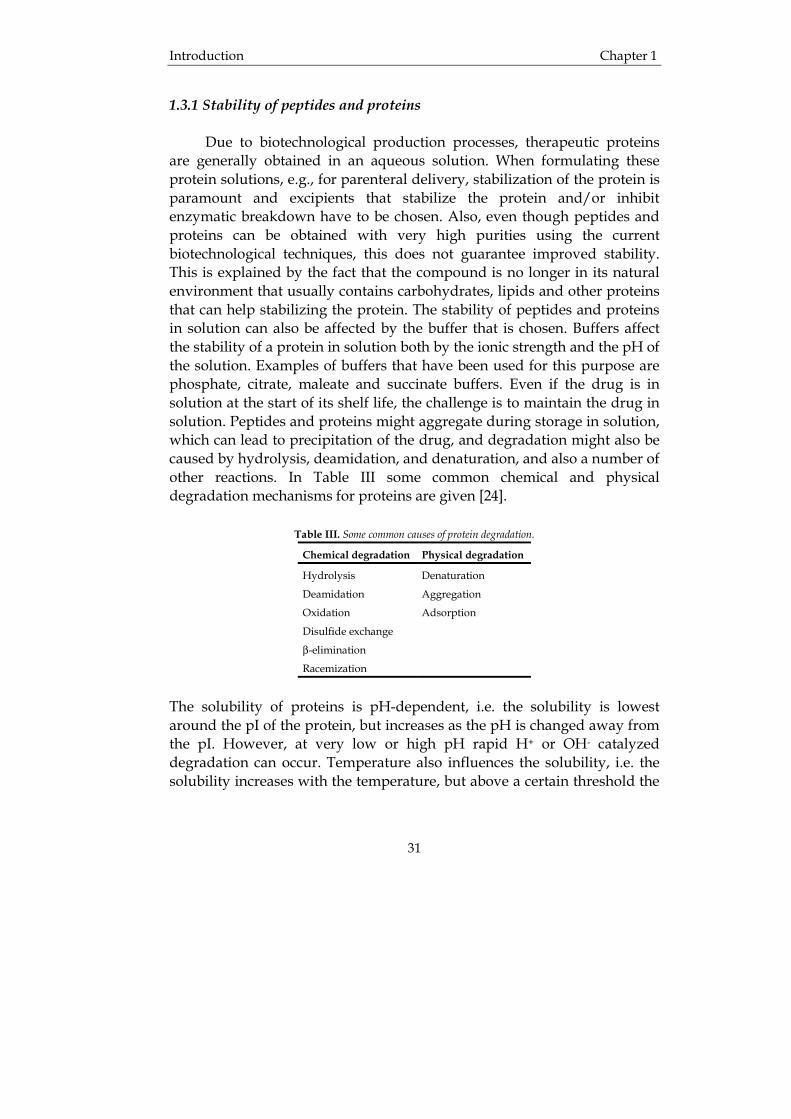
difference can be attributed to the carbohydrates attached to the protein [68]. Recombinant human erythropoietin is a protein that increases the red blood cell mass and it is consequently one of the most common doping substances in sports [69]. Often, the detection of this substance is accomplished by assays, e.g., bioassay or immunoassay. These methods are, however, insensitive but it has been suggested that HPLC-ESI-MS may provide the sensitivity necessary to reliably detect this substance in samples from athletes. The problem with EPO and its use in endurance sports as a performance enhancer stimulated Caldini et al. to develop a method to characterize rhEPO from three different manufacturers [70]. The substances were epoetin alfa, epoetin beta and darbepoetin alfa, which after separation by gel electrophoresis were subjected to analysis by MALDI-TOF-MS. Clearly, as is illustrated in Fig. 16, this approach enabled the differentiation between the three different rhEPO’s supplied by the various manufacturers and can consequently provide evidence that illegal doping has occurred.
Rel
ativ
e In
tens
ity
(%)
Rel
ativ
e In
tens
ity
(%)
Fig. 15 MALDI-TOF-MS of rhEPO. The “Ref” represents the molecular ion. [mMnH]n+: multiply charged (n=1, singly charged; n=2, doubly charged, etc.) ion of oligomer (m=1, monomer; m=2, dimer, etc.). From [68].
Introduction Chapter 1
29
20 000 30 000 40 000 m/z
20 000 30 000 40 000 m/z
20 000 30 000 40 000 m/z
1400
1000
800
600
400
200
1200
0
1400
1000
800
600
400
200
1200
0
1400
1000
800
600
400
200
1200
020 000 30 000 40 000 m/z
20 000 30 000 40 000 m/z
20 000 30 000 40 000 m/z
1400
1000
800
600
400
200
1200
0
1400
1000
800
600
400
200
1200
0
1400
1000
800
600
400
200
1200
0
1400
1000
800
600
400
200
1200
0
1400
1000
800
600
400
200
1200
0
1400
1000
800
600
400
200
1200
0
Fig. 16 MALDI-TOF-MS of epoetin alfa (A), darbepoetin alfa (B), and epoetin beta (C). In the lower trace the molar ratio B:C was 1:1. From [70].
Concluding remarks The advantage with ESI-MS is that in combination with suitable mass analyzers, e.g., quadrupoles, ion-traps or time-of-flight detectors, it provides high mass accuracy for proteins and the possibility to measure large proteins due to the multiple charging. Observing multiple peaks for the same peptide or protein allows the determination of molecular weight with high accuracy. With ESI it is also possible to perform MS/MS giving structural information by product ions generated by controlled fragmentation. MS/MS is suitable to establish the amino acid sequence and specific chemical modifications from the product ion pattern. However, even though the ESI-MS is such a versatile set-up it cannot easily be applied in the analysis of hydrophobic proteins. This is explained by the fact that detergents and/or salts frequently have to be used to get these proteins into solution. These compounds have a negative effect on the analysis through interference, which also has a detrimental influence on the sensitivity that can be obtained, that is, the purer the sample the higher the sensitivity. MALDI-TOF-MS, on the other hand, is less sensitive to contaminants (such as detergents, salts etc.). In addition, the sample preparation is fast and the sensitivity is rather high. For peptides levels of about low femtomole or even attomole are needed, while for proteins low femtomole

Chapter 1 Introduction
30
levels are required to achieve good signals. The mass accuracy that can be achieved with MALDI-MS is from ±5 ppm to 0.05% depending on in which mode the instrument is run, but the matrix material also has an influence on the result [71]. One potential problem with MALDI-MS is that the laser can induce degradation of the sample. The quadrupole-time-of-flight mass spectrometer (QTOF) is considered to be a powerful, robust and versatile set-up. Originally, it was used only for peptide analysis, but today it is applied for the analysis of such different sample types as biological samples using nanospray as well as common pharmaceutical samples for which higher flow-rate LC is used. The QTOF is characterized by a high mass accuracy and sensitivity. Also, its high mass resolution (m/∆m of about 10 000, where ∆m is the full peak width at half height), is very useful in the analysis of peptides and proteins, explaining the increasing popularity of this type of instrument in biological research [72]. 1.3 Technological aspects of the formulation of therapeutic proteins The administration of therapeutic peptides and proteins has been a challenge ever since the invention of the smallpox vaccine by Edward Jenner in 1796, which was later followed by the pioneering work of Louis Pasteur who developed vaccines against chicken cholera, anthrax and rabies. In a much later stage, this was followed by the introduction of insulin in the 1920’s and then by the introduction of thyroid hormone and Factor VIII. The increasing knowledge about the function of peptides and proteins can potentially lead to new tools in the struggle against cancer and other severe disorders. For example, interferons have found increasing clinical applications during the last 20 years [73]. Even though there has been a tremendous development in the field of protein chemistry and (bio)production, this has not yet been matched by a parallel development in the discipline of formulation and delivery of such drugs. The successful delivery of these drugs to patients depends on the solving of specific problems. Examples of such problems are 1) poor stability of the drug (storage in refrigerator or freezer is often necessary), 2) poor biovailability, 3) patient unfriendly dosage forms, usually the parenteral route, which might lead to non-compliance.
Introduction Chapter 1
31
1.3.1 Stability of peptides and proteins Due to biotechnological production processes, therapeutic proteins are generally obtained in an aqueous solution. When formulating these protein solutions, e.g., for parenteral delivery, stabilization of the protein is paramount and excipients that stabilize the protein and/or inhibit enzymatic breakdown have to be chosen. Also, even though peptides and proteins can be obtained with very high purities using the current biotechnological techniques, this does not guarantee improved stability. This is explained by the fact that the compound is no longer in its natural environment that usually contains carbohydrates, lipids and other proteins that can help stabilizing the protein. The stability of peptides and proteins in solution can also be affected by the buffer that is chosen. Buffers affect the stability of a protein in solution both by the ionic strength and the pH of the solution. Examples of buffers that have been used for this purpose are phosphate, citrate, maleate and succinate buffers. Even if the drug is in solution at the start of its shelf life, the challenge is to maintain the drug in solution. Peptides and proteins might aggregate during storage in solution, which can lead to precipitation of the drug, and degradation might also be caused by hydrolysis, deamidation, and denaturation, and also a number of other reactions. In Table III some common chemical and physical degradation mechanisms for proteins are given [24].
Table III. Some common causes of protein degradation.
Chemical degradation Physical degradation
Hydrolysis Denaturation
Deamidation Aggregation
Oxidation Adsorption
Disulfide exchange
β-elimination
Racemization
The solubility of proteins is pH-dependent, i.e. the solubility is lowest around the pI of the protein, but increases as the pH is changed away from the pI. However, at very low or high pH rapid H+ or OH- catalyzed degradation can occur. Temperature also influences the solubility, i.e. the solubility increases with the temperature, but above a certain threshold the
Chapter 1 Introduction
32
protein may unfold leading to decreased solubility or even precipitation [24]. Since proteins are large molecules with many functional groups, they are susceptible to both physical and chemical degradation. This explains why proteins in solution are generally not stable for very long and commonly have to be stored at low temperature, e.g., in a refrigerator or even in a freezer [74]. The tertiary structure of proteins is vital to their function. This tertiary structure can be affected by the degradation mechanisms mentioned in Table III, which ultimately render a non-functional protein. Contrary to proteins, peptides do not posses a tertiary structure and are generally more stable. Many proteins can be stabilized in solution by using certain excipients. The mechanisms of stabilization by these excipients have been described by the so-called preferential interaction theory. This theory claims that the protein prefers to interact with water and the excipient is excluded from the domain of the protein and proportionally more water molecules are found at the surface of the protein than in the bulk. Preferential exclusion of an excipient is therefore usually associated with an increase in the surface tension of water. Examples of compounds that can be used as stabilizers of proteins in solution are amino acids, phosphate and sulfate, glycerol, erythritol and sorbitol. A more thorough discussion on this is found in previously published material [75-82]. Drying of peptides and proteins If the proteins could be stored in their dry form, it would be possible to achieve long-term stability, perhaps even at room temperature. An additional advantage of having the peptide/protein in a dry form instead of the dissolved state is that this would increase the versatility to develop various dosage forms. For example, the dry material can be processed into non-parenteral dosage forms, e.g., into tablets for oral delivery, or the dried powder can be used in a formulation for inhalation. Spray-drying and freeze-drying from a solution are the two most common methods to get proteins in the dry state. Stabilization of proteins through freeze-drying is frequently reported in the literature [83-86]. The importance of using excipients to stabilize proteins during drying is motivated by the fact that the drying process itself is rather harsh to proteins. During spray-drying, as solvent is removed, protein molecules are driven towards each other, which might lead to aggregation and there is also a mechanical stress
Introduction Chapter 1
33
exerted on the protein molecules during the vaporization phase. During freeze-drying aggregation may occur during the freezing phase due to the formation of ice crystals, i.e. freeze concentration. The formation of ice crystals can also cause degradation of the protein molecules due to the action of mechanical forces. Also, as solvent is removed the concentrations of other solutes increase that may also give rise to reactions between the protein and the solutes. A literature review reveals that especially sugars are the most successful excipients to stabilize proteins in the dry state. Sucrose and trehalose appear to be the sugars most often used [74]. A solution containing both protein and sugar properly dried yields a product where the protein is enclosed in a so-called sugar glass. It has been found that sugar glasses can provide long-term stability of the incorporated protein. When solutions of proteins with carbohydrates are freeze-dried the solution is first rapidly frozen in, e.g., liquid nitrogen. The use of liquid nitrogen ensures a very fast freezing of the solution. In the frozen state it is essential that the sample temperature is below the glass transition temperature of the maximally freeze concentrated fraction (Tg’). Above the Tg’ the freeze concentrated fraction is in its rubbery state and is therefore vulnerable to any reactions occurring. In addition, above the Tg’ the sugar may crystallize [87] by which no stabilization of the protein is obtained (see below). Moreover, if freeze-drying is performed below the Tg’ a porous cake will be achieved. A porous cake is often preferred because it is easy to reconstitute. On the other hand, during freeze-drying the sample temperature should be as high as possible to have a process of acceptable rate. Therefore, a high Tg’ is preferred. The Tg’ depends on the type of sugar used. The final dry product should also posses a glass transition temperature (Tg) that is as high as possible. The Tg of the end product depends on the type of sugar used and the water content [88-90]. Since water acts as a plasticizer and dramatically decreases the Tg it is desirable to keep the product as dry as possible. Also, if the product has a sufficiently high Tg it is less sensitive to moisture and it can be exposed to higher relative humidities at ambient temperature without turning into its rubbery state. A transition into the rubbery state would be disastrous to the protein since this leads to loss of protection. The protein would no longer be incorporated in a glass and thus be susceptible to all the reactions that it was meant to be protected from. Additionally, in the rubbery state the sugars may crystallize, which would lead to phase separation and thus the

Chapter 1 Introduction
34
water replacement (see below) is no longer effective. During phase separation the proteins will also no longer be separated from each other and consequently be at risk of aggregation and further degradation. Phase separation is in itself a rather violent event that may harm the incorporated protein mechanically. In Fig. 17 an example of a state diagram illustrating the solid/liquid coexistence boundaries and glass transition profile of a binary sugar/water system is shown.
Fig. 17 A state diagram illustrating the processes during freezing of a binary sugar/water-system.
The solution is in the amorphous glassy state below and to the right of the glass transition line. Ice is present depending on the temperature and freezing path followed. Above and to the left of the glass transition line the solution is in the liquid state, with or without ice depending on temperature. For example, at point A the solution is in its liquid state. During cooling of the system to a temperature slightly below its equilibrium freezing point (due to undercooling), nucleation and crystallization begin at point B and initiate the freeze concentration process removing water in its pure form as ice. As crystallization of ice progresses the increasing solute concentration further depresses the equilibrium freezing point of the unfrozen portion (UFP) in a manner that follows the liquidus curve (towards C). During very rapid cooling freeze concentration continues past the eutectic point (Te) into a non-equilibrium state, since sugars generally do not crystallize as easily as water. As a result, the solution becomes supersaturated. After passage of a certain critical, solute-

Introduction Chapter 1
35
dependent concentration and temperature the unfrozen liquid suddenly exhibits very restricted mobility and the physical state of the UFP changes from a viscoelastic liquid (or rubber) to a brittle, amorphous glass. This critical point is the glass transition of the maximally freeze concentrated fraction with an accompanying temperature denoted as the Tg’ (point D in Fig. 17). At this point the supersaturated solution shows solid properties due to reduced molecular motion by which no crystallization of either water or sugar can occur anymore. During freeze-drying, first water is removed from the frozen system by sublimation of ice. This process is referred to as primary drying. Thereafter, water evaporates from the maximally freeze concentrated fraction. This process is referred to as secondary drying. As can be seen from Fig. 17, the glass transition temperature of the material gradually increases during secondary drying due to the decreasing water content. If during primary drying the sample temperature (accidentally) exceeds the Tg’, the material again transforms into supersaturated liquid (or rubber) with a high molecular mobility and sooner or later crystallization of the sugar will occur. As a consequence no sugar glass will be formed. Stabilization mechanisms of sugar glasses Three major theories have been presented to explain the mechanism behind the enhanced stability of proteins by incorporation into a sugar glass, i.e. the vitrification theory, the water replacement theory and the bulking effect theory. According to the vitrification theory, stabilization of proteins during drying is achieved by enclosure of the protein in a glassy structure [85, 91, 92]. The thermal stability of lactase incorporated in a trehalose sugar glass was evaluated by Mazzobre et al. [92]. They found that the activity of lactase decreased rapidly upon heating if the trehalose was allowed to crystallize. This indicates that the preservation of the glassy state is very important. In a glass the viscosity is in the order of 1012 Pa·s [93] and it is this extreme viscosity that increases the protein stability by slowing down the movements of reactants, and the rate of conformational changes of the proteins is also diminished. This means that the higher the viscosity of the glass the better it works as a stabilizer. Both sucrose and trehalose glasses have a high viscosity and this explains why they are good stabilizers during freeze-drying of proteins [94, 95]. As a matter of fact, it has been found and claimed that the disaccharide trehalose is superior to other saccharides regarding the stabilization of proteins during freeze-
Chapter 1 Introduction
36
drying [92, 96-100]. Mazzobre and Del Pilar Buera later also investigated the freeze-drying of β-galactosidase with trehalose, i.e. incorporation of β-galactosidase in a sugar glass, and evaluated the effect of crystallization of trehalose [85]. It was found that crystallization of trehalose was accelerated by higher amounts of moisture present. As predicted by the vitrification theory, crystallization of trehalose had a detrimental effect on the stability of the incorporated β-galactosidase. The water replacement theory was presented by Carpenter and Crowe in 1988 [101, 102] and states that protein stabilization during drying is achieved by the ability of carbohydrates to take the place of water around the protein during the drying process. Later, this was further investigated by Carpenter and Crowe who used Fourier transform infrared spectroscopy (FT-IR) to assess the interaction between carbohydrates and proteins [103]. Solutions of lysozyme and various carbohydrates, i.e. trehalose, lactose or inositol, were freeze-dried and the product was analyzed by FT-IR. It was found that the carbohydrates interacted with lysozyme in the dry product in a way similar to the water/protein interaction in solution. Some carbohydrates serve as water substitutes and thereby preserve the native structure of the protein [75]. The intra- and interprotein hydrogen bonding may in this way be prevented during dehydration [98]. Therefore, stabilization of proteins requires hydrogen bonding with an excipient during drying. During the drying process, as water is removed, the hydroxy groups of the excipient takes the place of the water, thereby achieving stabilization [75, 91, 104]. Stabilization of proteins by the bulking effect is explained by the “dilution” of the protein in the matrix due to the presence of large quantities of compounds other than the protein. This leads to a lower probability of protein aggregation or the occurrence of degradation reactions. Even though these theories may seem totally different, it does not mean that only one of them is correct. They may all be valid and explain (each a part of) the stabilization of proteins in solution as well as during/after drying. As already mentioned, it is desirable that the sugar glass possesses a Tg as high as possible, since this will enhance its stabilizing capacity. If the sample is exposed to a temperature higher than the Tg the glass will transform into its rubbery state, which would lead to the loss of vitrification and, in addition, crystallization may occur. Crystallization
Introduction Chapter 1
37
leads to phase separation and thus lost stabilization due to the loss of bulking effect and the water replacement theory is no longer valid. It is also known that the Tg is depressed by moisture [105], which further stresses the importance of a high Tg and low hygroscopicity. In a recent study it was demonstrated that the polysaccharide inulin is a sugar that satisfies both these demands. Hinrichs et al. [106] lyophilized alkaline phosphatase with glucose, trehalose and two inulin types with a degree of polymerization of 14.2 and 23, respectively. It was found that after storage of the lyophilized product for six days at 60 °C, only the alkaline phosphatase lyophilized with either of the inulins still demonstrated enzymatic activity. Moreover, it is necessary to employ non-reducing sugars since otherwise the Maillard reaction may be a problem. In this reaction the amine functions of the protein react with the reducing groups of the sugar, causing degradation of the protein. In a study by Schebor et al. [96] it was shown that browning and loss of enzymatic activity of invertase lyophilized with raffinose, lactose, or maltose and subsequently stored at 95 °C for 7 days correlated. Invertase that had been lyophilized with trehalose or sucrose, which are non-reducing sugars, did not show this behaviour, i.e. no browning occurred. However, the invertase lyophilized with sucrose lost enzymatic activity due to crystallization after storage at elevated temperature, which did not occur for the trehalose sample. In addition to these physical properties the stabilizing excipient must also be non-toxic and preferably described in the USP and Generally Recognized as Safe list (GRAS-list). 1.3.2 Drug delivery Delivery by injections Currently, most systemically acting peptides and proteins are delivered via the parenteral route. This can be ascribed to the fact that although many new therapeutic agents recently evolved from biotechnology, only minor attention has been paid to the development of stable formulations that can be used by the patient by more comfortable routes of administration. Another reason is that these drugs have to pass enormous barriers if delivered via other routes, e.g., enzymatic degradation and penetration barriers. There are a number of peptide/protein-based drugs on the market, insulin being the most familiar example. Other
Chapter 1 Introduction
38
examples are Calcitonin, Erythropoietin, Factor VIII, human growth hormone (somatotropin), and a number of interferons. A disadvantage of many peptides and proteins is their very short half-life in the body, commonly only a few minutes. This demands repeated injections during the day, which is inconvenient for the patient. Therefore, efforts are made to increase the half-life of such drugs. This can be accomplished by making controlled release formulations, where a single injection may assure adequate drug plasma levels up to one month or even longer. Examples of controlled release parenteral formulations are polymeric implants, oily injections or particulate systems. A suspension of γ-interferon in oil was reported to prolong the activity of interferon when administered by subcutaneous injection (s.c.) to beagles [24]. Particulate systems are exemplified by microspheres, microparticles, and microcapsules, which are larger than 1 µm and nanocapsules, nanospheres and nanoparticles [24], which are smaller than 1 µm. In general, these microparticulate systems are administered via subcutaneous (s.c.) or intramuscular (i.m.) injection. Various polymers have been described for use in slow release injectable products like implants or microspheres. Examples are polyglycerol esters of fatty acid (PGEFs), polylactic glycolic acid (PLGA), polylactic acid (PLA), gelatine hydrogels, and polyethylene glycol (PEG) [107-112]. Parenteral formulations can also be delivered by continuous infusion via i.m., i.v., or s.c. injection. Freeze-dried or spray-dried formulations of proteins, i.e. stabilized proteins, can also be delivered via the parenteral route, i.e. after reconstitution in a suitable solvent. Delivery via the ocular route An alternative to injections is delivery via the ocular route, i.e. administration via the conjunctival sac under the eye. Christie and Hanzal suggested this already in 1931 as a possible route of administration of insulin [113]. Since then, a number of other peptides and proteins have been investigated. The ocular route of delivery offers a few advantages, e.g., the absorption is relatively fast and the absorbed polypeptide bypass the portal circulation to the liver, thus avoiding the first-pass metabolism by the liver [24]. Even though it has been shown that the eye is a possible route of administration of drugs, there are some important drawbacks of this approach. For example, the bioavailability of proteins administered through the ocular route is low due to their large molecular size.

Introduction Chapter 1
39
Additionally, the eye is very sensitive to foreign substances, and most people are instinctively very protective of their eyes and clinicians are concerned about local toxicity. Nonetheless, for the treatment of ocular disorders it is advantageous to deliver drugs immediately to the eye itself. Several types of dosage forms can be applied as delivery system for the ocular delivery of drugs. The most prescribed dosage form is the eye drop solution, which is easy to administer but has one important drawback; the drug solution is immediately diluted in the tear film as soon as it is instilled into the cul-de-sac and is drained away from the precorneal cavity by the constant tear flow. This tear flow is also more intense in an irritated eye than in a healthy eye. Therefore, quite concentrated drug solutions must be applied to achieve an adequate therapeutic effect. This procedure leads to massive and unpredictable doses of medication, which may also cause unwanted side effects. On the other hand, it has been found that the cell permeability is higher in an inflamed eye. Further reading on the subject of ocular drug delivery can be found in review articles by Zimmer and Kreuter who concentrated on the use of microspheres and nanoparticles [114], while Harris et al. concentrated on the problems with ocular delivery of peptides and proteins in general [115]. Delivery via the nasal route In addition to its primary function as a heat exchanger and an organ to filter particulates, the nose is a possible route for the delivery of drugs. In an adult human the total surface area of the nasal mucosa is approximately 160-180 cm2 and the rich vasculature of the nose makes absorption of drugs possible. Because of this, drugs delivered to the nose lead to a fast onset of action, almost comparable to that after intravenous injection. Delivery via the nose is also advantageous since it provides a patient friendly manner of drug delivery. In addition, drugs absorbed through the nasal mucosa bypass the hepatic circulation and thereby first-pass metabolism, which increases the half-life of the drug in the body. In Table IV a few commercially available peptides that are delivered via the nasal route are given.

Chapter 1 Introduction
40
Table IV. Examples of peptide drugs that are administered via the nasal route by means of nasal spray.
Peptide Therapeutic indication
Lypressin nasal solution USP (Diapid®, Sandoz) Diabetes insipidus
Desmopressin (DDAVP®, Rhône-Poulenc Rorer),
(Stimat®, Armour/Ferring
Diabetes insipidus, Primary nocturnal enuresis
Oxytocin nasal solution USP (Syntocinon®, Sandoz)
(Stimate®, Armour/Ferring)
To assist initial postpartum milk ejection
Nafarelin (LHRH-agonist) (Synarel®, Syntex) Endometriosis
Adapted from Banga [116].
In general, the nasal route is suitable for systemic delivery of molecules with a molecular weight less than about 1000 Da. For these molecules, the nasal bioavailability may be sufficient to achieve therapeutic levels without the use of any adjuvants, i.e. permeability enhancers. With the use of adjuvants, this limit can be pushed up to at least 6000 Da and perhaps even higher [117]. A therapeutically relevant peptide drug that has been extensively studied is insulin. The nasal delivery of insulin in rabbits was studied by Callens and Remon [118], who freeze-dried dispersions of insulin with Carbopol 974 P and starch or maltodextrin. The dry material was then passed through a sieve to get particles smaller than 63 µm. After nasal delivery to rabbits it was found that the bioavailability was higher for the Carbopol 974 P/starch mixture than for the Carbopol 974 P/maltodextrin mixtures. In a later study Callens et al. evaluated the toxicological effects of a bioadhesive nasal powder containing Carbopol 974 P/starch on the rabbit nasal mucosa and slug mucosa, finding that the formulation was not irritating [119]. Later, the influence of multiple nasal administrations of bioadhesive powders on the insulin bioavailability was evaluated by Callens and co-workers [120]. After a single administration the bioavailability of insulin was found to be about 10%, but repeated administration led to decreasing bioavailability. This was explained to be an effect of the high viscosity of the bioadhesive powders, causing a physical barrier towards absorption and a strongly reduced mucociliary clearance. Calcitonin is a 32 amino-acid polypeptide hormone that is used in the treatment of bone diseases such as Paget’s disease, hypercalcemia and osteoporosis. The nasal route of delivery is one of the routes that have been studied and it has been found that the absorption is significantly higher

Introduction Chapter 1
41
when promoters are employed [121]. In the previously mentioned study Calcitonin was delivered with and without 0.5% sodium tauro-24,25-dihydrofusidate (STDHF) and it was found that the bioavailability was up to 4.7 times higher with STDHF. In a review by Pontiroli current and emerging uses of nasal delivery of peptide hormones were highlighted [122]. In this review a number of peptide hormone formulations for nasal delivery are presented which are already on the market, e.g., desmopressin that is used in the treatment of diabetes insipidus, oxytocin that is used for labour induction and buserelin that is used for treatment of prostatic cancer. Common for these peptide hormones is that they are all rather small, less than 10 amino acids in size. This means that the bioavailability is quite high even without absorption enhancers [122]. Delivery via the pulmonary route Another non-invasive route of delivery is via the pulmonary route. In fact, this route of delivery is by no means new or revolutionary. The inhalation of various drugs is well established and can be traced back to the earliest civilizations. The most obvious example is, naturally, tobacco, which was brought back from America to Europe by Christopher Columbus in the 15th century, but had probably been used by American natives for thousands of years. Moreover, inhalation of sea mists, hot vapors and aerosols to ease airway obstruction were remedies used by Hippocrates, and the smoking of leaves of Atropa Belladonna to suppress coughing dates back about 4000 years [123]. Efficient delivery of effective amounts of drug to the lungs is, however, not as simple as it seems. First, the inhaled drug has to travel from the mouth and turn about 90 degrees in the oropharynx without depositing at the back of the throat. Then, there is the progressive branching and narrowing of the airways down the bronchial tree. In all, there are about 23 bifurcations from the mouth to the alveoli. In Fig. 18 an image of the lungs is given.

Chapter 1 Introduction
42
Fig. 18 Image of the lungs demonstrating the branching and complexity of this organ.
Briefly, the human respiratory system can be divided in four regions, i.e. the upper respiratory tract (heats and moistens the air), the conduction zone (the first sixteen generations of branches beginning with the trachea and ending with the terminal bronchioles), the transitional zone (branch generation seventeen to nineteen) and finally the respiratory zone ending with the alveoli. This system presents large obstacles for an inhaled particle to find its way into the deep lung. Moreover, high humidity and mucociliary clearance mechanism further complicate matters and may inhibit the penetration of inhaled drug particles into the deep lung [124]. An important factor affecting the drug deposition in the respiratory tract is the “mass median aerodynamic diameter” (MMAD). This is a function of particle size, shape and density. Also important is the particle charge and patient specific characteristics, such as respiratory rate and the occurrence of, e.g., asthma, bronchitis or emphysema. The successful delivery of drugs to the lungs requires the MMAD being in the range 1-5 µm, which is commonly referred to as the “fine particle fraction” (FPF). If the lower regions of the lung (preferably the alveoli) have to be reached an even smaller size distribution is required (1 – 3 µm) [124]. If the particles are smaller than 1 µm significant fractions will be exhaled again during normal breathing, while if they are bigger than 6 µm they will not make it into the lung, but deposit at the back of the throat and eventually be swallowed [125]. Reaching the alveoli is important if systemic absorption is sought
Introduction Chapter 1
43
since the permeability of the alveolar membrane for polypeptides and proteins is much larger than that of the airway membrane. On the other hand, for local effect reaching the alveoli is not necessary, since just delivering the drug to the airways may already cause a therapeutic effect. Systemic drug delivery via the pulmonary route has the advantage that the first-pass metabolism by the intestinal membrane and the liver is avoided. The lung is regarded as a promising route for the delivery of peptides and proteins, since it is less invasive and better accepted by patients than injections and though there is some degrading enzymatic activity it is low compared to the gastrointestinal tract. Moreover, the surface area of the alveoli is an impressive 43-102 m2, comparable to a tennis court. Additionally, the walls of the alveoli in the deep lung are very thin, typically 0.1-1 µm in thickness and relatively large tight junctions (diameter of about 5 nm) between the cells exist. Therefore it has been predicted that absorption of peptide and protein drugs with a molecular mass up to about 30 kDa should be fast from this organ [125]. As an example, γ-interferon (19 kDa) had 56% bioavailability [126]. Studies have shown that, without surfactant enhancers, the lungs provide substantially greater bioavailability for macromolecules than other routes of delivery [127]. For a drug to enter the blood stream from the lungs it must pass several barriers, i.e. the surfactant layer, the surface lining fluid, the epithelium, the interstitium and basement membrane and, finally, the vascular endothelium. It has been demonstrated that the absorption of large molecules in the lung is partially diffusion controlled. Inhaled molecules with a mass above about 40 kDa are slowly absorbed over many hours from the airspaces. After “absorption” they appear in higher concentrations in pulmonary lymph (relative to plasma) during absorption [127]. However, the absorption rate and bioavailability of these larger proteins are too low to be of therapeutic relevance. Pressurized metered dose inhalers (pMDI) have been used for many years to accomplish the delivery of drug containing (dry) particles to the lung. Unfortunately, these systems have some drawbacks, such as the difficult hand-lung coordination by the patient and the use of environmentally damaging propellants such as CFC’s. Nebulizers, on the other hand, are very efficient in creating mists of fine droplets from drugs in solution that in this manner can be delivered to the lung. Unfortunately, it may take over 30 minutes for a patient to inhale a dose from a nebulizer and proteins may be damaged by the aerosolization process. Therefore, new devices, such as the dry powder

Chapter 1 Introduction
44
inhalers (DPI), have been developed. The advantage with these inhalers is that they are breath-actuated and so coordination problems such as synchronizing dose discharge with inhalation are overcome. Moreover, they can be applied for formulations containing the (stabilized) dry protein. This is, however, a new development and still in the experimental phase. It has recently been shown that with the dry powder inhalers an improved deposition to the lung can be achieved [128, 129]. One proteinous drug that has been extensively investigated regarding pulmonary delivery is insulin. Patton et al. have reviewed the potential of inhalable insulin [130]. Another drug that is routinely delivered via the pulmonary route is recombinant human deoxyribonuclease that is used in the treatment of cystic fibrosis. However, this protein exerts its effect locally and not systemically [123]. Some review articles on this subject that give more information on the state of the art have recently been published [123, 124, 131, 132]. Delivery via the oral route The ultimate challenge is to be able to deliver therapeutic peptides and proteins via the oral route. However, the obstacles that have to be overcome are at a first glance almost insurmountable. Peptides and proteins are chemically and physically unstable. As the drug enters the stomach it is exposed to the harsh, acidic environment. One possibility to protect the drug from the acidic environment is to provide the tablet with an enteric coating. The principle is that the coating is stable at acidic pH but starts dissolving as the pH increases above a certain threshold, e.g., pH 6, and the drug is consequently released in the intestinal lumene. Over the whole gastrointestinal tract the peptides/proteins are exposed to digestive enzymes, e.g., proteases and peptidases. If the drug survives this, it must penetrate through the intestinal membranes and overcome first pass metabolism and the rapid clearance of proteins in the body [133]. Because of the multitude and variety of proteases in the intestinal tract, the enzymatic barrier is considered the most important barrier limiting the bioavailability of protein drugs. A further discussion on the relation of peptidases and oral peptide drug delivery can be found in a review article by Bai and Amidon [134]. The intestinal epithelial barrier separates the internal tissues from the external environment. Its main functions are protection from the outside environment, terminal digestion and selective absorption, and secretion of water, electrolytes etc. As for other epithelia, it is a natural barrier for unwanted substances [135]. The intestinal epithelium

Introduction Chapter 1
45
is made up of a single cell layer, and these cells are connected to their neighbors by a junctional complex creating pores with a size of about 3-9 Å [133]. Underlying the epithelium is the lamina propria, which in turn is supported by the muscularis mucosa. These three together are referred to as the intestinal mucosa. In Fig. 19 an illustration of the intestinal wall is given.
Fig. 19 An illustration of the intestinal wall. From [136].
Because the intestinal tract is lined with phospholipids, hydrophilic proteins cannot easily diffuse through it (by passive paracellular diffusion), and the size of protein molecules prevents them from entering the pores. Nevertheless, passive diffusion across the intestinal membranes has been demonstrated not only for small proteins such as insulin (5.8 kDa) but also relatively large proteins such as bovine serum albumin (66 kDa) [133]. This passive diffusion of macromolecules, such as proteins, is likely to occur through the transcellular pathway [137]. The paracellular pathway is not of major importance, since the pore size is not large enough. The small intestine epithelial mucosa is structured in such a way that it constitutes a barrier to the permeation of macromolecules. However, endocytotic uptake provides ways to circumvent this barrier through a form of active transport called receptor-mediated endocytosis (RME). RME allows the absorptive cells of the intestinal epithelium to select and transport specific molecules while excluding undesirable or potentially harmful ones, e.g., bacterial enterotoxins and endotoxins. Thus, depending

Chapter 1 Introduction
46
on their molecular structure, endogenous and foreign macromolecules may interact with the intestinal epithelial mucosa receptors and subsequently undergo internalization [138]. Indeed, some peptides and proteins are known to enter intestinal mucosal cells through endocytosis. In Table V some proteins that are known to enter the intestinal mucosa through endocytosis are given. It has also been found that lactoferrin (an iron-binding protein in milk) enters the systemic circulation via endocytosis. This was shown by Harada et al. [139] in an investigation where neonatal piglets were fed with bovine lactoferrin, and the transport of lactoferrin was evaluated by immunohistochemical methods.
Table V. Proteins and large peptides transported across the intestinal mucosa.
Protein or peptide Species used in study
Insulin Human (adult), Rat
Horseradish peroxidase Rat
Egg albumin Human (infant)
Trypsin and chymotrypsin Human
Chymotrypsin Rat
Γ-globulin Neonatal pig, neonatal mouse
Native ferritin Rat
Immunoglobulin G Rat
Epidermal growth factor Rat
Nerve growth factor Rat
Reproduced from [138].
Most mammalian cells, including those of the intestinal tract, have some capacity to endocytose macromolecules [140]. For example, Peyer’s patches (PP), discovered already in 1676 by Peyer, belong to the gut-associated lymphoid tissue (GALT) and consist of aggregated lymphoid follicles. PPs are oval or rectangular and extend through the luminal epithelium, lamina propria, and lamina submucosa, and are only one follicle thick. The antigenic stimulation of the intestinal mucosa is correlated with the development of PP, and one patch can contain 5-250 lymphoid follicles. Transport across the epithelium in PP can occur by endocytosis, via the paracellular shunt, or passive diffusion. The endocytotic activity seems to be dependent on age and health state of the individual and it has also been found that several microorganisms can

Introduction Chapter 1
47
enter the circulation via the PP [140]. Despite the problems that are associated with oral delivery of peptides and proteins, it is motivating to see the possibility of local therapy of such drugs when delivered to the intestinal system. Due to the fact that proteins are subjected to various digestive processes, the oral delivery of peptides and proteins is not commonly encountered. There are, however, a few examples of such drugs. One of the most investigated protein drugs for oral delivery is insulin. Ever since its initial discovery by Banting and Best in 1922, an oral dosage form of insulin has been the goal for a multitude of investigators [141]. For insulin a controlled release system was developed by Marschutz et al. [142], who claimed that mucoadhesive polymer-inhibitor conjugates might represent a promising excipient in delivery systems for oral (poly)peptide delivery. These conjugates were made of carboxymethyl-cellulose (CMC)-Bowman-Birk inhibitor and CMC-elastatinal and were homogenized with polycarbophil-cystein conjugate, insulin, and mannitol. It was found that in the formulation containing the inhibitor conjugate, insulin was more stable than in the formulation without the inhibitor when evaluated in an in vitro system. As an extra challenge for insulin, apart from all the common digestive enzymes, is the fact that there also exists a cytosolic insulin-degrading enzyme [143, 144], which makes the oral delivery of insulin even more difficult. The therapeutic potential for orally administered type 1 interferons has been reviewed by Beilharz [73]. In this review it can be found that orally administered interferons may be useful in the treatment of multiple sclerosis, Sjögren’s syndrome (dry mouth), and hepatitis B among others. Also, it has been found that when small amounts of interferon are administered orally the effect is almost always better than when high amounts are delivered [145]. This is explained by the assumption that low doses given orally mimic a natural host/defence process. Delivery via the colon and rectum The human rectum is the final 15-20 cm of the large intestine (colon). The rectal epithelium does not contain villi and its surface area is an unimpressive 200-400 cm2. It is rich in blood vessels, lymphatic vessels and microflora. Three types of haemorrhoidal veins permeate the mucous membrane, i.e. the inferial, middle and superior. The inferior and middle veins are directly connected to the systemic circulation, while the superior
Chapter 1 Introduction
48
is connected to the portal system. Drugs that are administered in the lower region will therefore bypass the hepatic first-pass metabolism to a large extent. Compared to the small intestine and stomach, the proteolytic activity in the rectum is very small, and is consequently a potential mucosal route for the delivery of peptides and proteins. In the presence of adjuvants a high systemic bioavailability may be possible. However, drug absorption may be erratic and may be interrupted by defacation [116]. The most investigated protein for rectal delivery is insulin, probably due to its therapeutic importance. Both gels and suppositories have been evaluated. However, the availability of insulin after rectal delivery is poor due to the mucosal epithelial cell layers that pose a serious barrier to all peptides and proteins. Therefore, some kind of absorption enhancers is frequently used. Barichello et al. [146] used insulin-loaded Pluronic® F-127 gels containing unsaturated fatty acids (oleic acid, eicosapentaenoic acid, and docosahexaenoic acid) in normal rats. They found that the availability of insulin was about 25% with the enhancer compared to only about 5% without, a result that was also found by Onuki et al. [147]. Cyclodextrins have also been evaluated as enhancers of rectal uptake of insulin. It was, for example, found by Watanabe et al. [148] that when cyclodextrins were used the uptake was significantly better than when no cyclodextrin was present in a study performed in rabbits. Van den Mooter and co-workers evaluated the in vitro release properties of methacrylated inulin hydrogels intended for delivery to the colon via the oral route using lysozyme and bovine serum albumin as model proteins [149]. They found that the food composition and the degree of substitution of inulin are important in controlling the extent and rate of release. It was also found that the presence of inulinase led to increased release, which indicates that the methacrylated inulin is indeed biodegradable. Interestingly, inulinase is only present in the colon and not in the other parts of the intestinal system. In a recent review by Chourasia and Jain [150] strategies to perform drug delivery to the colon via the oral route are addressed. There are several suggestions how to achieve colon drug delivery. Tablets containing the drug, e.g., a peptide or a protein, can be coated with polymers that are stable at acidic pH but dissolve once the pH increases to near neutral conditions such as those in the colon. This approach was investigated by Morishita et al. who coated insulin microspheres with Eudragit L100 and S100 [151]. The drug release from the microspheres was evaluated by an in vitro model, i.e. a rotating basket dissolution testing system using
Introduction Chapter 1
49
phosphate buffers at pH 6 to 7.5. The microspheres coated with Eudragit L demonstrated faster dissolution than those coated with Eudragit S. In the in vivo model it was also found that insulin containing microspheres coated with Eudragit L100 provided the highest efficacy. Drugs can also be coated with polymers containing azocompounds. Such polymers are resistant to digestive enzymes, like those present in the stomach and the small intestine, but are digested by the bacteria present in the large intestine. Once dissolved, the drug can act either locally in the colon or even be available for absorption into the blood. This approach has been studied for a number of drugs, e.g., insulin and vasopressin [152]. It was found that administration of vasopressin and insulin, respectively, coated with azoaromatic polymer-coated capsules or pellets resulted in a desirable biologic effect, i.e. antidiuresis and reduced blood glucose levels, respectively. Absorption enhancement Delivery of peptides and proteins into the systemic circulation is in principle not feasible due to the epithelial and enzymatic barriers that have to be overcome. Peptide and protein drug delivery is consequently often combined with penetration enhancement and efforts to suppress enzymatic activity in, e.g., the digestive tract. The penetration enhancers increase the absorption by one or more of the following mechanisms: (1) altering rheologic properties of the mucus layer, (2) fluidizing the membrane lipid layer, (3) altering the intracellular tight junctions and (4) inhibiting enzymatic activity [133]. The use of penetration enhancers is, however, not without risk, since the increased absorption is not only for the peptide or protein for which it is intended, but for all compounds. Therefore, some unwanted toxic effects might occur when such substances are used in the formulation. It has also been found that the use of microparticulate delivery systems as drug/vaccine delivery carriers via mucosal routes give enhanced absorption and was recently reviewed by Hillery [153]. Protease inhibitors have also been investigated and have been found to increase the absorption of peptides and proteins in the mucosal membrane. Examples of protease inhibitors that have been investigated are bacitracin, aprotinin, soybean trypsin inhibitor, bestatin, and puromycin [154].

Chapter 1 Introduction
50
1.4 Alkaline phosphatase In this introduction some of the analytical and technological aspects of pharmaceuticals based on peptides and proteins in general have been addressed. A protein that is thoroughly investigated in this thesis is alkaline phosphatase. Alkaline phosphatases (E.C. 3.1.3.1) are actually a group of cell-membrane-associated enzymes with hydrolase and transferase activity that act on a variety of phosphate substrates. They are structurally and functionally related, i.e. they have high pH optima, their activity is dependent on zinc and magnesium ions, and they have a dimeric structure and suggested monomer molecular masses of about 58 000 [155] and 65 000 Da [156, 157], respectively. The isoelectric point (pI) of alkaline phosphatase is about 4.5 [156]. In humans and other higher organisms there are four isoforms of this enzyme, the intestinal, germ cell, tissue non-specific (liver, bone, kidney) and the placental form. The placental form is more heat stable than the other three isoforms, which lose their enzymatic activity when treated at 56 °C for 30 min, while the placental form has been found to withstand a temperature of up to 70 °C for 30 min [158, 159]. The presence of alkaline phosphatase in human serum was demonstrated already in the 1920s [160] and later its clinical relevance was evaluated [35, 157, 161-165]. In 1997 a possible physiological function of the enzyme was presented by Poelstra et al. [166, 167], who proposed that alkaline phosphatase might play a significant role in the detoxification of endotoxins produced by Gram-negative bacteria. This is achieved by enzymatic removal of the phosphate groups present in the lipopolysaccharides produce by such bacteria. This important finding makes alkaline phosphatase an interesting candidate drug for the treatment of sepsis, which is a serious condition in which endotoxins play a significant role. 1.5 Scope of the thesis In the near future the impact of protein pharmaceuticals will strongly increase. Already today, the therapeutic effectiveness of such biopharmaceuticals is studied extensively and several are used in therapies. As any other drug, pharmaceutical proteins have to meet high standards regarding efficacy and safety. However, as biopharmaceuticals represent

Introduction Chapter 1
51
complex molecular structures and samples, this puts new challenges towards analysis and formulation. In this thesis new analytical and formulation procedures for protein pharmaceutics are investigated using alkaline phosphatase, a potential therapeutic protein, as test compound. From the analytical perspective, emphasis is put on the potential role of CE in purity and stability analysis. Also the possibility to couple CE with MS for the characterization of intact proteins is considered. The formulation research is focused on the use of inulin sugar glasses to stabilize and formulate proteins. Chapter 1 gives an overview of the literature on analytical techniques and formulation aspects regarding therapeutic proteins. In chapter 2 the combination of several analytical techniques to monitor the progress of a purification process of placental alkaline phosphatase is investigated. The extent of purification using preparative ion-exchange chromatography and affinity chromatography is examined. In particular data obtained by CZE, CGE, MALDI-TOF-MS and enzymatic activity assay are evaluated and compared. In chapter 3 the potential of capillary electrophoresis to monitor the forced degradation of alkaline phosphatase is examined. The potential of CZE for the analysis of alkaline phosphatase that has been exposed to various stressful conditions is assessed by studying the separation and detection of several degradation products. In chapter 4 the question is raised and studied whether it is possible to characterize intact proteins by on-line coupled CE-MS while using non-volatile buffers as background electrolyte. The proteins investigated are insulin, myoglobin and bovine serum albumin, and phosphate and borate buffers are tested. In chapter 5-7 the formulation of proteins is considered. In previous studies it has been found that inulin has properties that make it a promising compound for stabilization of proteins as well as production of tablets. In this thesis these findings are combined in an effort to evaluate the possibility to make tablets of proteins incorporated in inulin sugar glasses. The influence of various buffer components on the glass transition temperature of amorphous inulin is evaluated in chapter 5. The possibility to stabilize alkaline phosphatase by freeze-drying from different protein/sugar solutions followed by compaction is evaluated in chapter 6. The two sugars trehalose and inulin are compared. In chapter 7 results from a proof of concept study regarding the delivery of freeze-dried and compacted alkaline phosphatase to the intestinal mucosa of a rat by oral administration are presented. Alkaline phosphatase incorporated in

Chapter 1 Introduction
52
amorphous inulin is compacted to tablets with a diameter of 4 mm that subsequently are coated with an enteric coating.
Introduction Chapter 1
53
1.6 References 1. www.ICH.org, International conference on harmonisation of technical
requirements for registration of pharmaceuticals for human use. 2. Welling, G.W., R. van der Zee, and S. Welling-Wester, Column liquid
chromatography of integral membrane proteins. J Chromatogr, 1987. 418: p. 223-243.
3. Aguilar, M.I. and M.T. Hearn, High-resolution reversed-phase high-
performance liquid chromatography of peptides and proteins. Methods Enzymol, 1996. 270: p. 3-26.
4. Burton, W.G., K.D. Nugent, T.K. Slattery, B.R. Summers, and L.R.
Snyder, Separation of proteins by reversed-phase high-performance liquid chromatography. I. Optimizing the column. J Chromatogr, 1988. 443: p. 363-379.
5. Protein Liquid Chromatography. Journal of Chromatography Library,
ed. M. Kastner. Vol. 61. 1999, Amsterdam: Elsevier. 974. 6. Hearn, M.T.W. and B. Grego, High-performance liquid chromatography
of amino acids, peptides and proteins. J Chromatogr, 1981. 218: p. 497-507.
7. Moffatt, F., P. Senkans, and D. Ricketts, Approaches towards the
quantitative analysis of peptides and proteins by reversed-phase high-performance liquid chromatography in the absence of pure reference sample. J Chromatogr, 2000. 891: p. 235-242.
8. Issaq, H.J., T.P. Conrads, G.M. Janini, and T.D. Veenstra, Methods for
fractionation, separation and profiling of proteins and peptides. Electrophoresis, 2002. 23(17): p. 3048-3061.
9. Issaq, H.J., The role of separation science in proteomics research.
Electrophoresis, 2001. 22(17): p. 3629-3638.
Chapter 1 Introduction
54
10. Arai, H., S. Tomizawa, K. Maruyama, Y. Seki, and T. Kuroume, Reversed-phase high-performance liquid chromatography for analysis of urinary proteins: diagnostic significance of alpha 1-acid glycoprotein. Nephron, 1994. 66(3): p. 278-284.
11. Chlenov, M.A., E.I. Kandyba, L.V. Nagornaya, I.L. Orlova, and Y.V.
Volgin, High-performance liquid chromatography of human glycoprotein hormones. J Chromatogr, 1993. 631(1-2): p. 261-267.
12. Hiyama, J. and A.G. Renwick, Separation of human glycoprotein
hormones and their subunits by reversed-phase liquid chromatography. J Chromatogr, 1990. 529(1): p. 33-41.
13. Parsons, T.F., T.W. Strickland, and J.G. Pierce, Rapid and easy
separation of the subunits of bovine and human glycoprotein hormones by use of high performance liquid chromatography. Endocrinology, 1984. 114(6): p. 2223-2227.
14. Anderson, D.J., High-performance liquid chromatography in clinical
analysis. Anal Chem, 1999. 71(12): p. 314R-327R. 15. Lookabaugh, M., M. Biswas, and I.S. Krull, Quantitation of insulin
injection by high-performance liquid chromatography and high-performance capillary electrophoresis. J Chromatogr, 1991. 549(1-2): p. 357-366.
16. Kunkel, A., S. Gunter, C. Dette, and H. Wätzig, Quantitation of
insulin by capillary electrophoresis and high-performance liquid chromatography. Method comparison and validation. J Chromatogr, 1997. 781: p. 445-455.
17. Oliva, A., J. Farina, and M. Llabres, Development of two high-
performance liquid chromatographic methods for the analysis and characterization of insulin and its degradation products in pharmaceutical preparations. J Chromatogr, 2000. 749: p. 25-34.
Introduction Chapter 1
55
18. Purcell, A.W., M.I. Aguilar, and M.T. Hearn, Conformational effects in reversed-phase high-performance liquid chromatography of polypeptides. I. Resolution of insulin variants. J Chromatogr, 1995. 711(1): p. 61-70.
19. Purcell, A.W., M.I. Aguilar, and M.T. Hearn, Conformational effects in
reversed-phase high-performance liquid chromatography of polypeptides. II. The role of insulin A and B chains in the chromatographic behaviour of insulin. J Chromatogr, 1995. 711(1): p. 71-79.
20. Yomota, C., Y. Yoshii, T. Takahata, and S. Okada, Separation of B-3
monodesamidoinsulin from human insulin by high-performance liquid chromatography under alkaline conditions. J Chromatogr, 1996. 721(1): p. 89-96.
21. Sergeev, N.V., N.S. Gloukhova, I.V. Nazimov, V.A. Gulyaev, S.V.
Shvets, I.A. Donetsky, and A.I. Miroshnikov, Monitoring of recombinant human insulin production by narrow bore reversed phase high performance liquid chromatography, high performance capillary electrophoresis and matrix assisted laser desorption ionisation time of flight mass spectrometry. J Chromatogr, 2001. 907: p. 131-144.
22. Alpert, A.J., Hydrophobic interaction chromatography of peptides as an
alternative to reversed-phase chromatography. J Chromatogr, 1988. 444: p. 269-274.
23. Peptide and Protein Drug Delivery. Advances in parenteral sciences,
ed. V.H. Lee. Vol. 4. 1991, New York: Marcel Dekker Inc. 24. Banga, A.K. Therapeutic peptides and proteins - Formulation,
processing, and delivery systems. 1995, Lancaster, PA, USA: Technomic Publishing Company Inc. 317.
25. Riggin, R.M., C.J. Shaar, G.K. Dorulla, D.S. Lefeber, and D.J. Miner,
High-performance size-exclusion chromatographic determination of the potency of biosynthetic human growth hormone products. J Chromatogr, 1988. 435(2): p. 307-318.

Chapter 1 Introduction
56
26. Cacia, J., C.P. Quan, M. Vasser, M.B. Sliwkowski, and J. Frenz, Protein sorting by high-performance liquid chromatography. I. Biomimetic interaction chromatography of recombinant human deoxyribonuclease I on polyionic stationary phases. J Chromatogr, 1993. 634(2): p. 229-239.
27. Frenz, J., C.P. Quan, J. Cacia, C. Democko, R. Bridenbaugh, and T.
McNerney, Protein sorting by high performance liquid chromatography. 2. Separation of isophosphorylates of recombinant human DNase I on a polyethylenimine column. Anal Chem, 1994. 66(3): p. 335-340.
28. Ng, P. and G. Mitra, Removal of DNA contaminants from therapeutic
protein preparations. J Chromatogr A, 1994. 658(2): p. 459-463. 29. Lowe, C.R., A.R. Lowe, and G. Gupta, New developments in affinity
chromatography with potential application in the production of biopharmaceuticals. J Biochem Bioph Methods, 2001. 49: p. 561-574.
30. Burnouf, T. and M. Radosevich, Affinity chromatography in the
industrial purification of plasma proteins for therapeutic use. J Biochem Bioph Methods, 2001. 49: p. 575-586.
31. Clonis, Y.D., N.E. Labrou, V.P. Kotsira, C. Mazitsos, S. Melissis, and
G. Gogolas, Biomimetic dyes as affinity chromatography tools in enzyme purification. J Chromatogr, 2000. 891: p. 33-44.
32. Guo, W., Z. Shang, Y. Yu, and L. Zhou, Membrane affinity
chromatography of alkaline phosphatase. J Chromatogr, 1994. 685: p. 344-348.
33. Clonis, Y.D. and C.R. Lowe, Monosized adsorbents for high-performance
affinity chromatography. Application to the purification of calf intestinal alkaline phosphatase and human urine urokinase. J Chromatogr, 1991. 540(1-2): p. 103-111.
34. Roy, I. and M.N. Gupta, Purification of alkaline phosphatase from
chicken intestine by expanded-bed affinity chromatography on dye-linked cellulose. Biotechnol Appl Biochem, 2000. 32(2): p. 81-87.

Introduction Chapter 1
57
35. Anderson, D.J., E.L. Branum, and J.F. O'Brien, Liver- and bone-derived isoenzymes of alkaline phosphatase in serum as determined by high-performance affinity chromatography. Clin Chem, 1990. 36(2): p. 240-246.
36. Taverna, M., N.T. Tran, T. Merry, E. Horvath, and D. Ferrier,
Electrophoretic methods for process monitoring and the quality assessment of recombinant glycoproteins. Electrophoresis, 1998. 19(15): p. 2572-2594.
37. Lagu, A.L., Applications of capillary electrophoresis in biotechnology.
Electrophoresis, 1999. 20(15-16): p. 3145-3155. 38. Patrick, J.S. and A.L. Lagu, Review applications of capillary
electrophoresis to the analysis of biotechnology-derived therapeutic proteins. Electrophoresis, 2001. 22(19): p. 4179-4196.
39. Dolnik, V. and K.M. Hutterer, Capillary electrophoresis of proteins
1999-2001. Electrophoresis, 2001. 22(19): p. 4163-4178. 40. Walhagen, K., K.K. Unger, and M.T. Hearn, Capillary
electroendoosmotic chromatography of peptides. J Chromatogr, 2000. 887(1-2): p. 165-185.
41. Roche, M.E., R.P. Oda, and J.P. Landers, Capillary electrophoresis in
biotechnology. Biotechnol Prog, 1997. 13(5): p. 659-668. 42. Hu, S. and N.J. Dovichi, Capillary electrophoresis for the analysis of
biopolymers. Anal Chem, 2002. 74(12): p. 2833-2850. 43. Petersen, J.R., A.O. Okorodudu, A. Mohammad, and D.A. Payne,
Capillary electrophoresis and its application in the clinical laboratory. Clin Chim Acta, 2003. 330(1-2): p. 1-30.
44. Righetti, P.G., C. Gelfi, B. Verzola, and L. Castelletti, The state of the
art of dynamic coatings. Electrophoresis, 2001. 22(4): p. 603-611.
Chapter 1 Introduction
58
45. Horvath, J. and V. Dolnik, Polymer wall coatings for capillary electrophoresis. Electrophoresis, 2001. 22(4): p. 644-655.
46. Felten, C., C.P. Quan, A.B. Chen, E. Canova-Davis, T. McNerney,
W.K. Goetzinger, and B.L. Karger, Use of acidic and basic pH and calcium ion addition in the capillary zone electrophoretic characterization of recombinant human deoxyribonuclease, a complex phosphoglycoprotein. J Chromatogr, 1999. 853(1-2): p. 295-308.
47. Kinoshita, M., E. Murakami, Y. Oda, T. Funakubo, D. Kawakami, K.
Kakehi, N. Kawasaki, K. Morimoto, and T. Hayakawa, Comparative studies on the analysis of glycosylation heterogeneity of sialic acid-containing glycoproteins using capillary electrophoresis. J Chromatogr, 2000. 866: p. 261-271.
48. Watson, E. and F. Yao, Capillary electrophoretic separation of human
recombinant erythropoietin (r-HuEPO) glycoforms. Anal Biochem, 1993. 210(2): p. 389-393.
49. Kendrick, B.S., B.A. Kerwin, B.S. Chang, and J.S. Philo, Online size-
exclusion high-performance liquid chromatography light scattering and differential refractometry methods to determine degree of polymer conjugation to proteins and protein-protein or protein-ligand association states. Anal Biochem, 2001. 299(2): p. 136-146.
50. Yomota, C., Y. Matsumoto, S. Okada, Y. Hayashi, and R. Matsuda,
Discrimination limit for purity test of human insulin by capillary electrophoresis. J Chromatogr, 1997. 703(1-2): p. 139-145.
51. Mandrup, G., Rugged method for the determination of deamidation
products in insulin solutions by free zone capillary electrophoresis using an untreatd fused-silica capillary. J Chromatogr, 1992. 604: p. 267-281.
52. Dönges, R., J. Römisch, H. Stauss, and D. Brazel, Separation of
antithrombin III variants by micellar electrokinetic chromatography. J Chromatogr, 2001. 924: p. 307-313.

Introduction Chapter 1
59
53. Cifuentes, A., M.V. Moreno-Arribas, M. de Frutos, and J.C. Diez-Masa, Capillary isoelectric focusing of erythropoietin glycoforms and its comparison with flat-bed isoelectric focusing and capillary zone electrophoresis. J Chromatogr, 1999. 830(2): p. 453-463.
54. Tang, S., D.P. Nesta, L.R. Maneri, and K.R. Anumula, A method for
routine analysis of recombinant immunoglobulins (rIgGs) by capillary isoelectric focusing (cIEF). J Pharm Biomed Anal, 1999. 19(3-4): p. 569-583.
55. Moorhouse, K.G., C.A. Eusebio, G. Hunt, and A.B. Chen, Rapid one-
step capillary isoelectric focusing method to monitor charged glycoforms of recombinant human tissue-type plasminogen activator. J Chromatogr, 1995. 717: p. 61-69.
56. Guttman, A., Capillary sodium dodecyl sulfate-gel electrophoresis of
proteins. Electrophoresis, 1996. 17(8): p. 1333-1341. 57. Karger, B.L., F. Foret, and J. Berka, Capillary electrophoresis with
polymer matrices: DNA and protein separation and analysis. Methods Enzymol, 1996. 271: p. 293-319.
58. Wu, D. and F.E. Regnier, Sodium dodecyl sulfate-capillary gel
electrophoresis of proteins using non-cross-linked polyacrylamide. J Chromatogr, 1992. 608(1-2): p. 349-356.
59. Tsuji, K., Evaluation of sodium dodecyl sulfate non-acrylamide, polymer
gel-filled capillary electrophoresis for molecular size separation of recombinant bovine somatotropin. J Chromatogr, 1993. 652: p. 139-147.
60. Jonsson, A.P., Mass spectrometry for protein and peptide
characterisation. Cell Mol Life Sci, 2001. 58(7): p. 868-884. 61. Mano, N. and J. Goto, Biomedical and biological mass spectrometry.
Anal Sci, 2003. 19(1): p. 3-14. 62. Dole, M., L.L. Mack, and R.L. Hines, Molecular Beams of Macroions. J
Chem Phys, 1968. 49(5): p. 2240-2249.
Chapter 1 Introduction
60
63. Yamashita, M. and J.B. Fenn, Negative Ion Production with the Electrospray Ion Source. J Phys Chem, 1984. 88: p. 4671-4675.
64. Yamashita, M. and J.B. Fenn, Electrospray Ion Source. Another
variation on the free-jet theme. J Phys Chem, 1984. 88: p. 4451-4459. 65. Niessen, W.M., State-of-the-art in liquid chromatography-mass
spectrometry. J Chromatogr A, 1999. 856(1-2): p. 179-197. 66. Shapiro, R.I., D. Wen, M. Levesque, X. Hronowski, A. Gill, E.A.
Garber, A. Galdes, K.L. Strauch, and F.R. Taylor, Expression of Sonic hedgehog-Fc fusion protein in Pichia pastoris. Identification and control of post-translational, chemical, and proteolytic modifications. Protein Expr Purif, 2003. 29(2): p. 272-283.
67. Preisler, J., P. Hu, T. Rejtar, E. Moskovets, and B.L. Karger, Capillary
array electrophoresis-MALDI mass spectrometry using a vacuum deposition interface. Anal Chem, 2002. 74(1): p. 17-25.
68. Zhou, G.H., G.-A. Luo, Y. Zhou, K.-Y. Zhou, X.-D. Zhang, and L.Q.
Huang, Application of capillary electrophoresis, liquid chromatography, electrospray-mass spectrometry and matrix-assisted laser desorption/ionization-time of flight-mass spectrometry to the characterization of recombinant human erythropoietin. Electrophoresis, 1998. 19: p. 2348-2355.
69. Breymann, C., Erythropoietin test methods. Baillieres Best Pract Res
Clin Endocrinol Metab, 2000. 14(1): p. 135-145. 70. Caldini, A., G. Moneti, A. Fanelli, A. Bruschettini, S. Mercurio, G.
Pieraccini, E. Cini, A. Ognibene, F. Luceri, and G. Messeri, Epoetin alpha, epoetin beta and darbepoetin alfa: two-dimensional gel electrophoresis isoforms characterization and mass spectrometry analysis. Proteomics, 2003. 3(6): p. 937-941.
71. Peptide and Protein Analysis. Mass Spectrometry for Biotechnology,
ed. G. Siuzdak. 1996, San Diego, CA, USA: Academic Press. 161.
Introduction Chapter 1
61
72. Chernushevich, I.V., A.V. Loboda, and B.A. Thomson, An introduction to quadrupole-time-of-flight mass spectrometry. J Mass Spectrom, 2001. 36(8): p. 849-865.
73. Beilharz, M.W., Therapeutic potential for orally administered type 1
interferons. PSTT, 2000. 3(6): p. 193-197. 74. Wang, W., Instability, stabilization, and formulation of liquid protein
pharmaceuticals. Int J Pharm, 1999. 185(2): p. 129-188. 75. Arakawa, T., Y. Kita, and J.F. Carpenter, Protein--solvent interactions
in pharmaceutical formulations. Pharm Res, 1991. 8(3): p. 285-291. 76. Arakawa, T., S.J. Prestrelski, W.C. Kenney, and J.F. Carpenter,
Factors affecting short-term and long-term stabilities of proteins. Adv Drug Deliv Rev, 1993. 10: p. 1-28.
77. Gekko, K. and S.N. Timasheff, Mechanism of protein stabilization by
glycerol: preferential hydration in glycerol-water mixtures. Biochemistry, 1981. 20(16): p. 4667-4676.
78. Gekko, K. and S.N. Timasheff, Thermodynamic and kinetic examination
of protein stabilization by glycerol. Biochemistry, 1981. 20(16): p. 4677-4686.
79. Timasheff, S.N., Solvent stabilization of protein structure. Methods Mol
Biol, 1995. 40: p. 253-269. 80. Arakawa, T. and S.N. Timasheff, Stabilization of protein structure by
sugars. Biochemistry, 1982. 21(25): p. 6536-6544. 81. Arakawa, T. and S.N. Timasheff, Preferential interactions of proteins
with salts in concentrated solutions. Biochemistry, 1982. 21(25): p. 6545-6552.
82. Bhat, R. and S.N. Timasheff, Steric exclusion is the principal source of
the preferential hydration of proteins in the presence of polyethylene glycols. Protein Sci, 1992. 1(9): p. 1133-1143.

Chapter 1 Introduction
62
83. Liao, Y.-H., M.B. Brown, A. Quader, and G.P. Martin, Protective mechanism of stabilizing excipients against dehydration in the freeze-drying of proteins. Pharm Res, 2002. 19(12): p. 1854-1861.
84. Osterberg, T. and T. Wadsten, Physical state of L-histidine after freeze-
drying and long-term storage. Eur J Pharm Sci, 1999. 8(4): p. 301-308. 85. Mazzobre, M.F. and M. Del Pilar Buera, Combined effects of trehalose
and cations on the thermal resistance of beta-galactosidase in freeze-dried systems. Biochim Biophys Acta, 1999. 1473(2-3): p. 337-344.
86. Miller, D.P., R.E. Anderson, and J.J. de Pablo, Stabilization of lactate
dehydrogenase following freeze thawing and vacuum-drying in the presence of trehalose and borate. Pharm Res, 1998. 15(8): p. 1215-1221.
87. Tzannis, S.T. and S.J. Prestrelski, Moisture effects on protein-excipient
interactions in spray-dried powders. Nature of destabilizing effects of sucrose. J Pharm Sci, 1999. 88(3): p. 360-370.
88. Slade, L. and H. Levine, Non-quilibrium behavior of small carbohydrate-
water systems. Pure Appl Chem, 1988. 60: p. 1841-1864. 89. Slade, L. and H. Levine, Beyond water activity: recent advances based on
an alternative approach to the assessment of food quality and safety. Crit Rev Food Sci Nutr, 1991. 30: p. 115-360.
90. Slade, L. and H. Levine, Water and the glass transition: dependence of
the glass transition on the composition and chemical structure: special implications for flour functionality in cookie baking. J Food Eng, 1995. 24: p. 431-509.
91. Crowe, J.H., J.F. Carpenter, and L.M. Crowe, The role of vitrification
in anhydrobiosis. Annu Rev Physiol, 1998. 60: p. 73-103. 92. Mazzobre, M.F., M. del Pilar, and J. Chirife, Protective role of trehalose
on thermal stability of lactase in relation to its glass and crystal forming properties and effect of delaying crystallization. Lebensm Wiss u Technol, 1997. 30: p. 324-329.

Introduction Chapter 1
63
93. Angell, C.A., Formation of Glasses from Liquid and Biopolymers. Science, 1995. 267(March): p. 1924-1935.
94. Duddu, S.P., G. Zhang, and P.R. Dal Monte, The relationship between
protein aggregation and molecular mobility below the glass transition temperature of lyophilized formulations containing a monoclonal antibody. Pharm Res, 1997. 14(5): p. 596-600.
95. Hatley, R.H.M., Glass fragility and the stability of pharmaceutical
preparations-excipient selection. Pharm Dev Technol, 1997. 2: p. 257-264.
96. Schebor, C., L. Burin, M.P. Buera, J.M. Aguilera, and J. Chirife,
Glassy state and thermal inactivation of invertase and lactase in dried amorphous matrices. Biotechnol Prog, 1997. 13(6): p. 857-863.
97. Colaco, C.A.L.S., C.J.S. Smith, S. Sen, D.H. Roser, Y. Newman, S.
Ring, and B.J. Roser, Chemistry of Protein Stabilization by Trehalose. Am Chem Soc Symp Ser, 1994. 567: p. 222-240.
98. Cardona, S., C. Schebor, M.P. Buera, M. Karel, and J. Chirife,
Thermal stability of invertase in reduced-moisture amorphous matrices in relation to glassy state and trehalose crystallization. J Food Science, 1997. 62(1): p. 105-112.
99. Crowe, L.M., D.S. Reid, and J.H. Crowe, Is trehalose special for
preserving dry biomaterials? Biophys J, 1996. 71(4): p. 2087-2093. 100. Hatley, R.H.M. and J.A. Blair, Stabilisation and delivery of labile
materials by amorphous carbohydrates and their derivatives. J Mol Catal B, 1999. 7: p. 11-19.
101. Carpenter, J.F. and J.H. Crowe, The mechanism of cryoprotection of
proteins by solutes. Cryobiology, 1988. 25: p. 244-255. 102. Carpenter, J.F. and J.H. Crowe, Modes of stabilization of a protein by
organic solutes during desiccation. Cryobiology, 1988. 25: p. 459-470.

Chapter 1 Introduction
64
103. Carpenter, J.F. and J.H. Crowe, An infrared spectroscopic study of the interactions of carbohydrates with dried proteins. Biochemistry, 1989. 28(9): p. 3916-3922.
104. Carpenter, J.F., T. Arakawa, and J.H. Crowe, Interactions of stabilizing
additives with proteins during freeze-thawing and freeze-drying. Develop. biol. Standard., 1991. 74: p. 225-239.
105. Ahlneck, C. and G. Zografi, The molecular basis of moisture effects on
the physical and chemical stability of drugs in the solid state. Int J Pharm, 1990. 62: p. 87-95.
106. Hinrichs, W.L., M.G. Prinsen, and H.W. Frijlink, Inulin glasses for the
stabilization of therapeutic proteins. Int J Pharm, 2001. 215(1-2): p. 163-174.
107. Putney, S.D. and P.A. Burke, Improving protein therapeutics with
sustained-release formulations. Nat Biotechnol, 1998. 16(2): p. 153-157. 108. Yamagata, Y., K. Iga, and Y. Ogawa, Novel sustained-release dosage
forms of proteins using polyglycerol esters of fatty acids. J Controlled Release, 2000. 63(3): p. 319-329.
109. Leroux, J.-C., E. Allemann, F. De Jaeghere, E. Doelker, and R.
Gurny, Biodegradable nanoparticles-From sustained release formulations to improved site specific drug delivery. J Controlled Release, 1996. 39: p. 339-350.
110. Ikada, Y. and Y. Tabata, Protein release from gelatin matrices. Adv
Drug Deliv Rev, 1998. 31(3): p. 287-301. 111. Matschke, C., U. Isele, P. van Hoogevest, and A. Fahr, Sustained-
release injectables formed in situ and their potential use for veterinary products. J Controlled Release, 2002. 85(1-3): p. 1-15.
112. Chandy, T., G.S. Das, R.F. Wilson, and G.H.R. Rao, Development of
polylactide microspheres for protein encapsulation and delivery. J Appl Pol Sci, 2002. 86: p. 1285-1295.

Introduction Chapter 1
65
113. Christie, C.D. and R.F. Hanzal, Insulin absorption by the conjunctival membranes in rabbits. J Clin Invest, 1931. 10: p. 787-793.
114. Zimmer, A. and J. Kreuter, Microspheres and nanoparticles used in
ocular delivery. Adv Drug Deliv Rev, 1995. 16: p. 61-73. 115. Harris, D., J.-H. Liaw, and J.R. Robinson, Routes of delivery: Case
studies. Ocular delivery of peptide and protein drugs. Adv Drug Deliv Rev, 1992. 8: p. 331-339.
116. Banga, A.K., Mucosal delivery of therapeutic peptides and proteins.
Therapeutic peptides and proteins - Formulation, processing, and delivery systems, 1995: p. 277-310.
117. McMartin, C., L.E. Hutchinson, R. Hyde, and G.E. Peters, Analysis of
structural requirements for the absorption of drugs and macromolecules from the nasal cavity. J Pharm Sci, 1987. 76(7): p. 535-540.
118. Callens, C. and J.P. Remon, Evaluation of starch-maltodextrin-Carbopol
974 P mixtures for the nasal delivery of insulin in rabbits. J Controlled Release, 2000. 66: p. 215-220.
119. Callens, C., E. Adriaens, K. Dierckens, and J.P. Remon, Toxicological
evaluation of a bioadhesive nasal powder containing a starch and Carbopol 974 P on a rabbit nasal mucosa and slug mucosa. J Controlled Release, 2001. 76: p. 81-91.
120. Callens, C., E. Pringels, and J.P. Remon, Influence of multiple nasal
administrations of bioadhesive powders on the insulin bioavailability. Int J Pharm, 2003. 250: p. 415-422.
121. Lee, W.A., R.D. Ennis, J.P. Longenecker, and P. Bengtsson, The
bioavailability of intranasal salmon calcitonin in healthy volunteers with and without a permeation enhancer. Pharm Res, 1994. 11(5): p. 747-750.
122. Pontiroli, A.E., Peptide hormones: review of current and emerging uses
by nasal delivery. Adv Drug Deliv Rev, 1998. 29: p. 81-87.
Chapter 1 Introduction
66
123. Gonda, I., The ascent of pulmonary drug delivery. J Pharm Sci, 2000. 89(7): p. 940-945.
124. Malcolmson, R.J. and J.K. Embleton, Dry powder formulations for
pulmonary delivery. PSTT, 1998. 1(9): p. 394-398. 125. Marriott, C., Pulmonary delivery of peptides and proteins. Eur J Pharm
Sci, 1996. 4(Suppl): p. S34. 126. Patton, J.S., P. Trinchero, and R.M. Platz, Bioavailability of pulmonary
delivered peptides and proteins-alpha interferon, calcitonins and parathyroid hormones. J Controlled Release, 1994. 28: p. 79-85.
127. Patton, J.S., Mechanisms of macrololecule absorption by the lungs. Adv
Drug Deliv Rev, 1996. 19: p. 3-36. 128. de Boer, A.H., P.P. Le Brun, H.G. van der Woude, P. Hagedoorn,
H.G. Heijerman, and H.W. Frijlink, Dry powder inhalation of antibiotics in cystic fibrosis therapy, part 1: development of a powder formulation with colistin sulfate for a special test inhaler with an air classifier as de-agglomeration principle. Eur J Pharm Biopharm, 2002. 54(1): p. 17-24.
129. Le Brun, P.P., A.H. de Boer, G.P. Mannes, D.M. de Fraiture, R.W.
Brimicombe, D.J. Touw, A.A. Vinks, H.W. Frijlink, and H.G. Heijerman, Dry powder inhalation of antibiotics in cystic fibrosis therapy: part 2. Inhalation of a novel colistin dry powder formulation: a feasibility study in healthy volunteers and patients. Eur J Pharm Biopharm, 2002. 54(1): p. 25-32.
130. Patton, J.S., J. Bukar, and S. Nagarajan, Inhaled insulin. Adv Drug
Deliv Rev, 1999. 35: p. 235-247. 131. Davis, S.S., Delivery of peptide and non-peptide drugs through the
respiratory tract. PSTT, 1999. 2(11): p. 450-456. 132. Wu-Pong, S. and P.R. Byron, Airway-to-biophase transfer of inhaled
oligonucleotides. Adv Drug Deliv Rev, 1996. 19: p. 47-71.

Introduction Chapter 1
67
133. Wang, W., Oral protein drug delivery. Journal of Drug Targeting, 1996. 4(4): p. 195-232.
134. Bai, J.P. and G.L. Amidon, Structural specificity of mucosal-cell
transport and metabolism of peptide drugs: implication for oral peptide drug delivery. Pharm Res, 1992. 9(8): p. 969-978.
135. Mackay, M., I. Williamson, and J. Hastewell, (A) Cell biology of
epithelia. Adv Drug Deliv Rev, 1991. 7: p. 313-338. 136. http://science.widener.edu/~vatnick/power_point/24-
03_pptlect.ppt. 137. Gardner, M.L., Gastrointestinal absorption of intact proteins. Annu Rev
Nutr, 1988. 8: p. 329-350. 138. Baker, J., I.J. Hidalgo, and R.T. Borchardt. Peptide and protein drug
delivery, ed. V.H.L. Lee. 1991, New York, NY, USA: Marcel Dekker Inc. 832.
139. Harada, E., Y. Itoh, K. Sitizyo, T. Takeuchi, Y. Araki, and H.
Kitagawa, Characteristic transport of lactoferrin from the intestinal lumen into the bile via the blood in piglets. Comp Biochem Physiol A Mol Integr Physiol, 1999. 124(3): p. 321-327.
140. Rubas, W. and G.M. Grass, Gastrointestinal lymphatic absorption of
peptides and proteins. Adv Drug Deliv Rev, 1991. 7: p. 15-69. 141. Carino, G.P. and E. Mathiowitz, Oral insulin delivery. Adv Drug
Deliv Rev, 1999. 35: p. 249-257. 142. Marschutz, M.K., P. Caliceti, and A. Bernkop-Schnurch, Design and
In Vivo Evaluation of an Oral Delivery System for Insulin. Pharm Res, 2000. 17(12): p. 1468-1474.
143. Bai, J.P. and L.L. Chang, Transepithelial transport of insulin: I. Insulin
degradation by insulin-degrading enzyme in small intestinal epithelium. Pharm Res, 1995. 12(8): p. 1171-1175.
Chapter 1 Introduction
68
144. Chang, L.L. and J.P. Bai, Evidence for the existence of insulin-degrading enzyme on the brush-border membranes of rat enterocytes. Pharm Res, 1996. 13(5): p. 801-803.
145. Cummins, J.M., M.W. Beilharz, and S. Krakowka, Oral use of
interferon. J Interferon Cytokine Res, 1999. 19(8): p. 853-857. 146. Barichello, J.M., M. Morishita, K. Takayama, Y. Chiba, S. Tokiwa,
and T. Nagai, Enhanced rectal absorption of insulin-loaded Pluronic F-127 gels containing unsaturated fatty acids. Int J Pharm, 1999. 183(2): p. 125-132.
147. Onuki, Y., M. Morishita, K. Takayama, S. Tokiwa, Y. Chiba, K.
Isowa, and T. Nagai, In vivo effects of highly purified docosahexaenoic acid on rectal insulin absorption. Int J Pharm, 2000. 198(2): p. 147-156.
148. Watanabe, Y., Y. Matsumoto, K. Kawamoto, M. Seki, and M.
Matsumoto, Enhancement of nasal and rectal absorption of insulin in rabbits by cyclodextrins. J Controlled Release, 1992. 21(1-3): p. 209-210.
149. Van den Mooter, G., L. Vervoort, and R. Kinget, Characterization of
methacrylated inulin hydrogels designed for colon targeting: in vitro release of BSA. Pharm Res, 2003. 20(2): p. 303-307.
150. Chourasia, M.K. and S.K. Jain, Pharmaceutical approaches to colon
targeted drug delivery systems. J Pharm Pharmaceut Sci, 2003. 6(1): p. 33-66.
151. Morishita, I., M. Morishita, K. Takayama, Y. Machida, and T. Nagai,
Enteral insulin delivery by microspheres in 3 different formulations using Eudragit L100 and S100. Int J Pharm, 1993. 91: p. 29-37.
152. Saffran, M., G.S. Kumar, C. Savariar, J.C. Burnham, F. Williams, and
D.C. Neckers, A new approach to the oral administration of insulin and other peptide drugs. Science, 1986. 233(September): p. 1081-1084.
153. Hillery, A.M., Microparticulate delivery systems: potential drug/vaccine
carriers via mucosal routes. PSTT, 1998. 1(2): p. 69-75.

Introduction Chapter 1
69
154. Lee, V.H., Protease inhibitors and penetration enhancers as approaches to modify peptide absorption. J Controlled Release, 1990. 13: p. 213-223.
155. Gottlieb, A.J. and H.H. Sussman, Human placental alkaline
phosphatase: molecular weight and subunit structure. Biochim Biophys Acta, 1968. 160(2): p. 167-171.
156. Greene, P.J. and H.H. Sussman, Structual comparison of ectopic and
normal placental alkaline phosphatase. Proc Natl Acad Sci U S A, 1973. 70(10): p. 2936-2940.
157. Trowsdale, J., D. Martin, D. Bicknell, and I. Campbell, Alkaline
phosphatases. Biochem Soc Trans, 1990. 18(2): p. 178-180. 158. Neale, F.C., J.S. Clubb, D. Hotchkis, and S. Posen, Heat stability of
human placental alkaline phosphatase. J Clin Path, 1965. 18: p. 359-363. 159. Harkness, D.R., Studies on human placental alkaline phosphatase. II.
Kinetic properties and studies on the apoenzyme. Arch Biochem Biophys, 1968. 126(2): p. 513-523.
160. Martland, M. and R. Robison, XCI. The possible significance of hexose
phosphoric esters in ossification. Biochemistry, 1927. 21: p. 665-674. 161. Magnusson, P., O. Lofman, and L. Larsson, Methodological aspects on
separation and reaction conditions of bone and liver alkaline phosphatase isoform analysis by high-performance liquid chromatography. Anal Biochem, 1993. 211(1): p. 156-163.
162. Magnusson, P., A. Hager, and L. Larsson, Serum osteocalcin and bone
and liver alkaline phosphatase isoforms in healthy children and adolescents. Pediatr Res, 1995. 38(6): p. 955-961.
163. Otto, V.I., B.K. Schar, T. Sulser, and E. Hanseler, Specific
determination of germ cell alkaline phosphatase for early diagnosis and monitoring of seminoma: performance and limitations of different analytical techniques. Clin Chim Acta, 1998. 273(2): p. 131-147.

Chapter 1 Introduction
70
164. Schoenau, E., K.H. Herzog, and H.J. Boehles, Liquid-chromatographic determination of isoenzymes of alkaline phosphatase in serum and tissue homogenates. Clin Chem, 1986. 32(5): p. 816-818.
165. Schoenau, E., K.H. Herzog, and D. Michalk, Particulate (high-
molecular-mass) and soluble alkaline phosphatase in urine determined by high-performance liquid chromatography. Clin Chem, 1990. 36(11): p. 1934-1936.
166. Poelstra, K., W.W. Bakker, P.A. Klok, M.J. Hardonk, and D.K.
Meijer, A physiologic function for alkaline phosphatase: endotoxin detoxification. Lab Invest, 1997. 76(3): p. 319-327.
167. Poelstra, K., W.W. Bakker, P.A. Klok, J.A. Kamps, M.J. Hardonk,
and D.K. Meijer, Dephosphorylation of endotoxin by alkaline phosphatase in vivo. Am J Pathol, 1997. 151(4): p. 1163-1169.

Characterization of alkaline phosphatase Chapter 2
71
Chapter 2
Characterization of human placental alkaline phosphatase by activity and protein assays, capillary electrophoresis
and matrix-assisted laser desorption/ionization time-of-flight mass spectrometry
H.J.C. Eriksson, G.W. Somsen, W.L.J. Hinrichs, H.W. Frijlink, G.J. de Jong. J Chromatogr B, 2001. 755: p. 311-319.

Chapter 2 Characterization of alkaline phosphatase
72
Summary Placental alkaline phosphatase (PLAP) that had been isolated from human placenta was further purified using subsequent ion-exchange chromatography (IEC), affinity chromatography (AC) and centrifugal membrane concentration (CMC). During the process, the PLAP samples from the different stages of purification were characterized regarding purity and activity. This was accomplished by combining Lowry analysis, enzymatic activity assay, capillary zone electrophoresis (CZE), capillary gel electrophoresis (CGE) and matrix-assisted laser desorption ionization time-of-flight mass spectrometry (MALDI-TOF-MS). The sample obtained after IEC had a rather low specific activity (6.8 U/mg) and appeared to contain several major contaminants, among which was human serum albumin (HSA). AC followed by CMC yielded PLAP with a specific activity of 128 U/mg. The purity and identity of the protein was indicated by MALDI-TOF-MS yielding a spectrum with one major peak at m/z 58 101. Interestingly, CZE of the pure PLAP revealed a cluster of peaks, which probably reflects the presence of various glycoforms and/or oligomers. The same analytical approach was used to characterize commercially available PLAP. This sample showed a moderate specific activity (15 U/mg) and appeared to be highly impure containing various other proteins.

Characterization of alkaline phosphatase Chapter 2
73
2.1 Introduction Alkaline phosphatases (APs) are a group of cell-membrane-associated enzymes which act on a variety of phosphorylated substrates and share features such as high pH optima, dependence on magnesium and zinc ions and a dimeric structure. APs (EC 3.1.3.1) exist in humans in four different isoforms: intestinal, germ cell, tissue non-specific (liver, bone, kidney) and placental. Several estimations of the molecular weight of APs have been presented. For example, the molecular mass of the monomers of the placental form has shown to be Mr 58 000 [1] and 64 000 [2], respectively. AP was already demonstrated in human serum in the 1920s [3] and later its relevance in various diseases was shown [4-9]. Recently it was discovered that AP can detoxify endotoxin produced by Gram-negative bacteria. Endotoxin is known to cause sepsis [10], and consists of lipopolysaccharides, which contain phosphate groups that are essential for the toxicity. AP can remove these groups and thus reduce the endotoxin toxicity. Within the University of Groningen the potential use of placental alkaline phosphatase (PLAP) for the treatment of sepsis is investigated. In our groups we set out to develop dosage forms of PLAP and investigate analytical methods to establish the purity and stability of PLAP. Frequently, the purity and concentration of PLAP samples is being checked only by monitoring its enzymatic activity. This method does not provide any information on the presence of inactive enzyme and other degradation products or contaminants. Fast protein liquid chromatography (FPLC) is often used for separation of proteins, and the separation of AP forms from bovine intestine, human placenta and human liver has been reported [11]. Also, liver and bone isoenzyme of AP from human serum has been separated by applying high-performance affinity chromatography (HPAC) [7]. The detection of APs is often accomplished by post-column conversion of p-nitrophenyl phosphate (pNPP) into a colored product. With this approach APs can be detected very sensitively but, since only active AP is detected, no information about the presence of other sample constituents is obtained. In principle, good protein resolutions can be obtained with reversed-phase high- performance liquid chromatography (RP-HPLC) [12-14], but so far no application of RP-HPLC for the analysis of AP has been described.
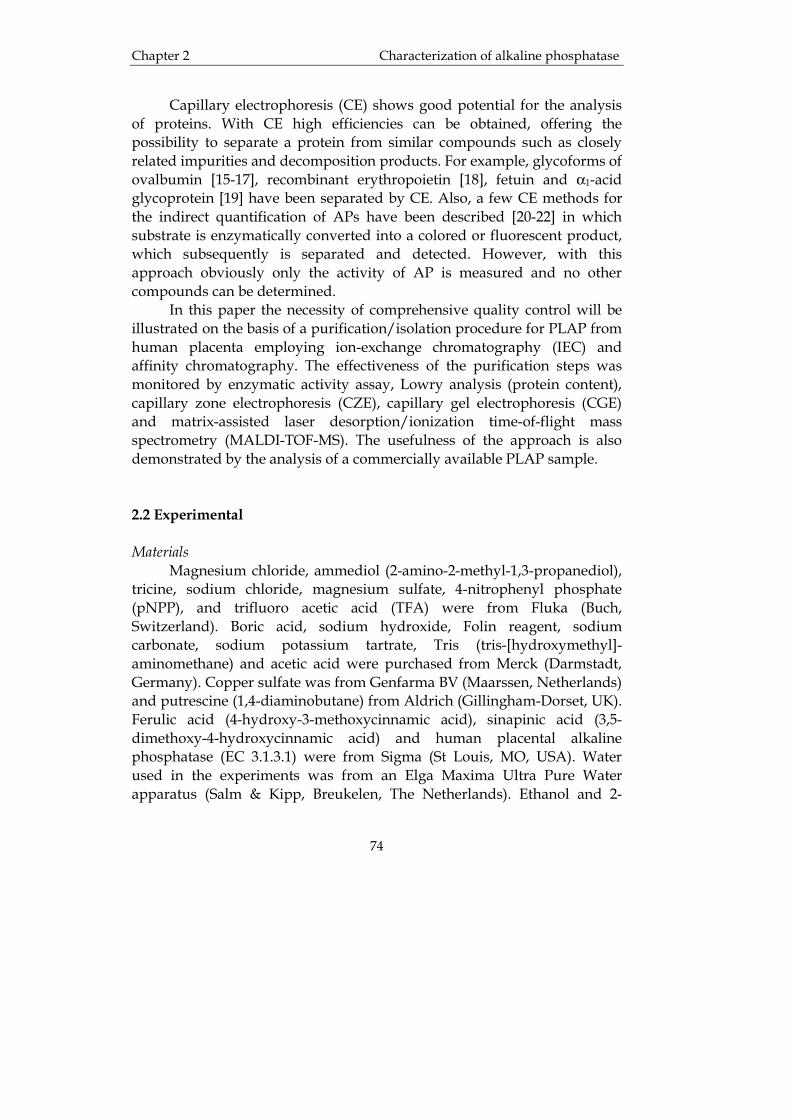
Chapter 2 Characterization of alkaline phosphatase
74
Capillary electrophoresis (CE) shows good potential for the analysis of proteins. With CE high efficiencies can be obtained, offering the possibility to separate a protein from similar compounds such as closely related impurities and decomposition products. For example, glycoforms of ovalbumin [15-17], recombinant erythropoietin [18], fetuin and α1-acid glycoprotein [19] have been separated by CE. Also, a few CE methods for the indirect quantification of APs have been described [20-22] in which substrate is enzymatically converted into a colored or fluorescent product, which subsequently is separated and detected. However, with this approach obviously only the activity of AP is measured and no other compounds can be determined. In this paper the necessity of comprehensive quality control will be illustrated on the basis of a purification/isolation procedure for PLAP from human placenta employing ion-exchange chromatography (IEC) and affinity chromatography. The effectiveness of the purification steps was monitored by enzymatic activity assay, Lowry analysis (protein content), capillary zone electrophoresis (CZE), capillary gel electrophoresis (CGE) and matrix-assisted laser desorption/ionization time-of-flight mass spectrometry (MALDI-TOF-MS). The usefulness of the approach is also demonstrated by the analysis of a commercially available PLAP sample. 2.2 Experimental Materials Magnesium chloride, ammediol (2-amino-2-methyl-1,3-propanediol), tricine, sodium chloride, magnesium sulfate, 4-nitrophenyl phosphate (pNPP), and trifluoro acetic acid (TFA) were from Fluka (Buch, Switzerland). Boric acid, sodium hydroxide, Folin reagent, sodium carbonate, sodium potassium tartrate, Tris (tris-[hydroxymethyl]-aminomethane) and acetic acid were purchased from Merck (Darmstadt, Germany). Copper sulfate was from Genfarma BV (Maarssen, Netherlands) and putrescine (1,4-diaminobutane) from Aldrich (Gillingham-Dorset, UK). Ferulic acid (4-hydroxy-3-methoxycinnamic acid), sinapinic acid (3,5-dimethoxy-4-hydroxycinnamic acid) and human placental alkaline phosphatase (EC 3.1.3.1) were from Sigma (St Louis, MO, USA). Water used in the experiments was from an Elga Maxima Ultra Pure Water apparatus (Salm & Kipp, Breukelen, The Netherlands). Ethanol and 2-

Characterization of alkaline phosphatase Chapter 2
75
propanol were from Merck and acetonitrile from Labscan (Dublin, Ireland). Bovine serum albumin (BSA) was from ICN Biochemicals (Aurora, Ohio, USA) and ß-mercaptoethanol from Life Technologies (Rockville, MD, USA). For dialysis of PLAP fractions Spectra/Por dialysis tubing from Spectrum Companies (Gardena, CA, USA) was used. Centrisart-C 30 centrifuge filters with a molecular mass cut-off (MWCO) of 10 000 were from Sartorius (Göttingen, Germany). Human placenta was kindly donated by the University Hospital Groningen, The Netherlands. Purification Extraction of human placenta Briefly the extraction procedure of the human placenta was as follows. Human placenta (ca. 50 g) was cut into pieces and homogenized in a blender with 560 ml Tris buffer (0.5 M, pH 7.4) and 280 ml butanol. Subsequently, 280 ml butanol was added followed by rigorous stirring for 75 min. The mixture was then centrifuged (23 000 g, 4 °C) for 10 min, and the butanol fraction was removed. After filtration, the water phase was dialyzed (MWCO 60 000) at 4 °C against Tris buffer (0.5 M, pH 7.4) with 5 mM magnesium sulfate. Ion-exchange chromatography IEC was performed on a diethyl-aminoethyl (DEAE-52) column (45 cm×2.5 cm I.D.) using an Econo pump, an Econo UV-monitor and a Model 2110 fraction collector from Bio-Rad (Hercules, CA, USA). Extracts were loaded onto the column, which then was flushed at 1 ml/min using a buffer of 5 mM Tris and 5 mM magnesium sulfate with 80 mM sodium chloride (pH 8.0), while monitoring the absorbance of the eluate at 280 nm. After the baseline was regained, buffer with 135 mM sodium chloride was used to elute the retained PLAP. The enzymatic activity of the eluate was monitored qualitatively during elution and the fractions showing AP activity were pooled (29.5 ml total). The entire volume was dialyzed (MWCO 60 000) twice against 1 L of buffer (5 mM Tris with 5 mM mag-nesium sulfate, pH 8.0) at 4 °C. Affinity chromatography For affinity chromatography a plastic column (10 cm×2 cm I.D.) was slurry packed with MIMETIC Blue AP A6XL phase (Affinity
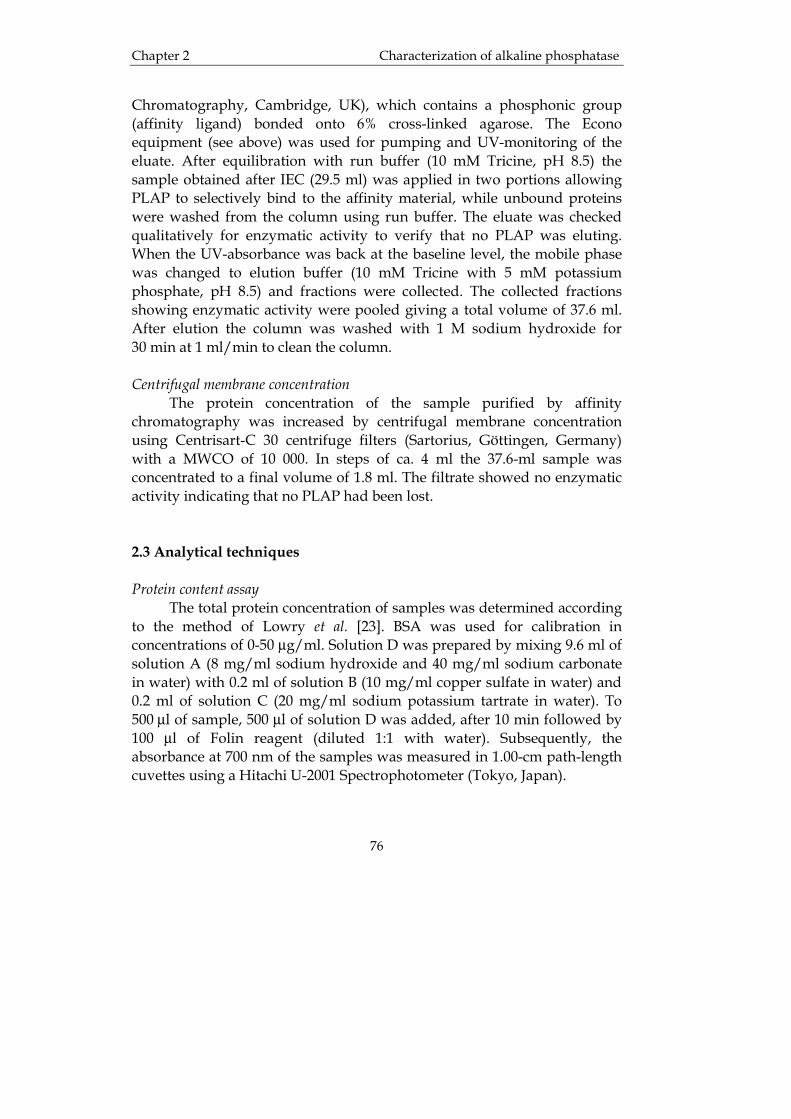
Chapter 2 Characterization of alkaline phosphatase
76
Chromatography, Cambridge, UK), which contains a phosphonic group (affinity ligand) bonded onto 6% cross-linked agarose. The Econo equipment (see above) was used for pumping and UV-monitoring of the eluate. After equilibration with run buffer (10 mM Tricine, pH 8.5) the sample obtained after IEC (29.5 ml) was applied in two portions allowing PLAP to selectively bind to the affinity material, while unbound proteins were washed from the column using run buffer. The eluate was checked qualitatively for enzymatic activity to verify that no PLAP was eluting. When the UV-absorbance was back at the baseline level, the mobile phase was changed to elution buffer (10 mM Tricine with 5 mM potassium phosphate, pH 8.5) and fractions were collected. The collected fractions showing enzymatic activity were pooled giving a total volume of 37.6 ml. After elution the column was washed with 1 M sodium hydroxide for 30 min at 1 ml/min to clean the column. Centrifugal membrane concentration The protein concentration of the sample purified by affinity chromatography was increased by centrifugal membrane concentration using Centrisart-C 30 centrifuge filters (Sartorius, Göttingen, Germany) with a MWCO of 10 000. In steps of ca. 4 ml the 37.6-ml sample was concentrated to a final volume of 1.8 ml. The filtrate showed no enzymatic activity indicating that no PLAP had been lost. 2.3 Analytical techniques Protein content assay The total protein concentration of samples was determined according to the method of Lowry et al. [23]. BSA was used for calibration in concentrations of 0-50 µg/ml. Solution D was prepared by mixing 9.6 ml of solution A (8 mg/ml sodium hydroxide and 40 mg/ml sodium carbonate in water) with 0.2 ml of solution B (10 mg/ml copper sulfate in water) and 0.2 ml of solution C (20 mg/ml sodium potassium tartrate in water). To 500 µl of sample, 500 µl of solution D was added, after 10 min followed by 100 µl of Folin reagent (diluted 1:1 with water). Subsequently, the absorbance at 700 nm of the samples was measured in 1.00-cm path-length cuvettes using a Hitachi U-2001 Spectrophotometer (Tokyo, Japan).
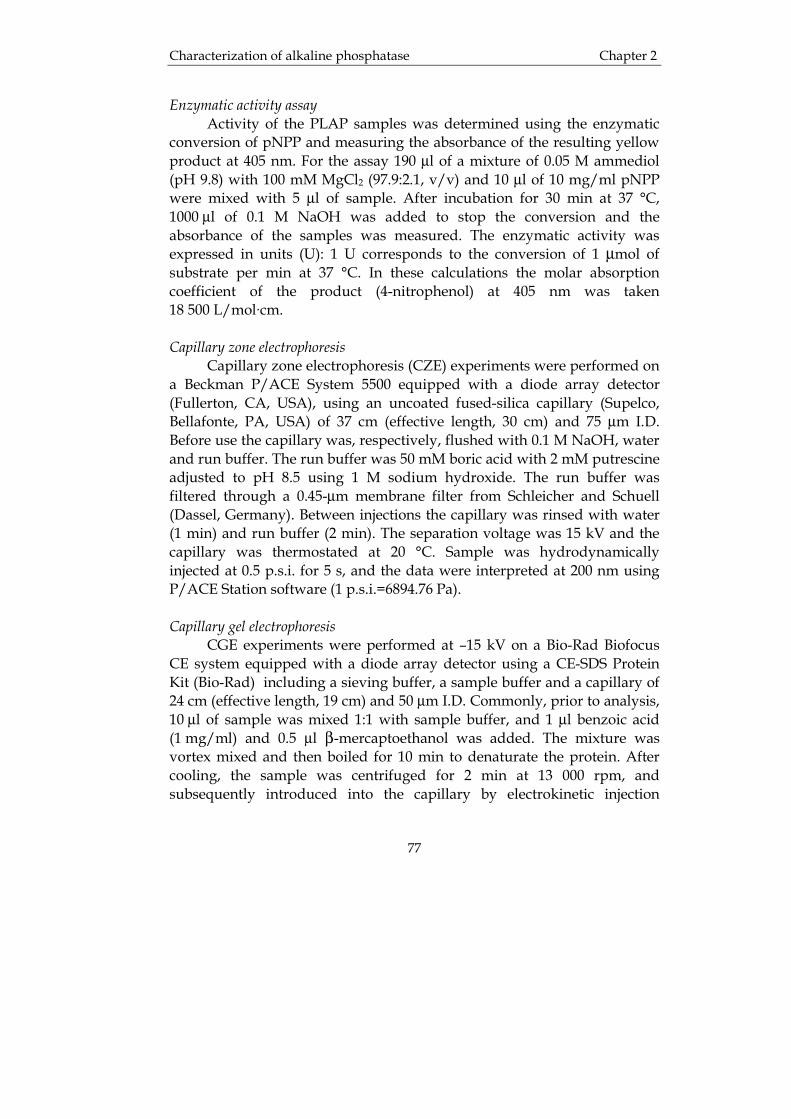
Characterization of alkaline phosphatase Chapter 2
77
Enzymatic activity assay Activity of the PLAP samples was determined using the enzymatic conversion of pNPP and measuring the absorbance of the resulting yellow product at 405 nm. For the assay 190 µl of a mixture of 0.05 M ammediol (pH 9.8) with 100 mM MgCl2 (97.9:2.1, v/v) and 10 µl of 10 mg/ml pNPP were mixed with 5 µl of sample. After incubation for 30 min at 37 °C, 1000 µl of 0.1 M NaOH was added to stop the conversion and the absorbance of the samples was measured. The enzymatic activity was expressed in units (U): 1 U corresponds to the conversion of 1 µmol of substrate per min at 37 °C. In these calculations the molar absorption coefficient of the product (4-nitrophenol) at 405 nm was taken 18 500 L/mol·cm. Capillary zone electrophoresis Capillary zone electrophoresis (CZE) experiments were performed on a Beckman P/ACE System 5500 equipped with a diode array detector (Fullerton, CA, USA), using an uncoated fused-silica capillary (Supelco, Bellafonte, PA, USA) of 37 cm (effective length, 30 cm) and 75 µm I.D. Before use the capillary was, respectively, flushed with 0.1 M NaOH, water and run buffer. The run buffer was 50 mM boric acid with 2 mM putrescine adjusted to pH 8.5 using 1 M sodium hydroxide. The run buffer was filtered through a 0.45-µm membrane filter from Schleicher and Schuell (Dassel, Germany). Between injections the capillary was rinsed with water (1 min) and run buffer (2 min). The separation voltage was 15 kV and the capillary was thermostated at 20 °C. Sample was hydrodynamically injected at 0.5 p.s.i. for 5 s, and the data were interpreted at 200 nm using P/ACE Station software (1 p.s.i.=6894.76 Pa). Capillary gel electrophoresis CGE experiments were performed at –15 kV on a Bio-Rad Biofocus CE system equipped with a diode array detector using a CE-SDS Protein Kit (Bio-Rad) including a sieving buffer, a sample buffer and a capillary of 24 cm (effective length, 19 cm) and 50 µm I.D. Commonly, prior to analysis, 10 µl of sample was mixed 1:1 with sample buffer, and 1 µl benzoic acid (1 mg/ml) and 0.5 µl β-mercaptoethanol was added. The mixture was vortex mixed and then boiled for 10 min to denaturate the protein. After cooling, the sample was centrifuged for 2 min at 13 000 rpm, and subsequently introduced into the capillary by electrokinetic injection

Chapter 2 Characterization of alkaline phosphatase
78
(-10 kV for 5 s). The following proteins were used for calibration: lysozyme (Mr 14 400), trypsin inhibitor (Mr 21 500), carbonic anhydrase (Mr 31 000), ovalbumin (Mr 45 000), serum albumin (Mr 66 200), phosphorylase (Mr 97 000), β-galactosidase (Mr 116 000) and myosin (Mr 200 000). The calibration lines were constructed by plotting the migration of the calibration proteins relative to benzoic acid against log Mr. MALDI-TOF-MS A Micromass VG TofSpec E (Manchester, UK) controlled by Maldi-Tof Version 3.0 software was used to acquire MS data of proteins. The samples were diluted 1:1 in water-acetonitrile (70:30, v/v) with 0.1% TFA. As matrix sinapinic acid (10 mg/ml) was used. For the PLAP of a commercial source a matrix of ferulic acid (20 mg/ml) in 2-propanol-water (1:1, v/v) was also tested. 2.4 Results and discussion Choice of analytical systems Efficient RP-HPLC of peptides and proteins often requires the addition of TFA to the mobile phase. Since AP is highly unstable under acidic conditions, the use of a TFA-containing eluent for the RP-HPLC analysis of PLAP is not desirable. Therefore, we briefly tested RP-HPLC using a C4-column (Alltech Macrosphere RP 300, 5 µm) in combination with a neutral phosphate buffer-methanol gradient. However, an increasing backpressure was observed after repeated sample injections, indicating irreversible adsorption of protein molecules to the C4-stationary phase. Besides, the available sample amounts were rather limited and did not allow repeated injections of 20-50 µl. CZE can be particularly useful for the separation of closely related protein species and requires small volumes but relatively high concentrations, and we turned to this technique for the analysis of our samples. As starting point a run buffer composed of borate and the modifier 1,4-diaminobutane (putrescine) was taken. Other diamino compounds have been investigated by others [18, 24], but putrescine has shown to be particularly useful for the glycoprotein ovalbumin [15, 16]. At alkaline pH, PLAP (pI≈4.5 [2]) will be negatively charged and migrate slower than the electroosmotic flow. The CZE method was briefly

Characterization of alkaline phosphatase Chapter 2
79
optimized with regard to peak shape by varying the borate concentration (25-100 mM), pH (7.5-9.0) and putrescine concentration (1-4 mM) and injecting the sample collected after the IEC (see next section). Putrescine improves the peak shape and resolution of the observed peaks, but also reduces the electroosmotic flow. A run buffer of 50 mM borate with putrescine at a concentration of 2 mM (adjusted to pH 8.5) gave a satisfactory resolution within a reasonable analysis time (less than 30 min). When no putrescine was added only one rather broad band was observed. In order to obtain indicative mass information about species present in PLAP samples, CGE was used. It should be noted that the masses as determined by CGE are not fully reliable for glycoproteins. A considerable portion of the glycoprotein mass originates from carbohydrate residues, which do not bind the negatively charged sodium dodecyl sulfate (SDS) molecules [25]. Consequently, the migration time of a glycoprotein will relatively increase so that its molecular mass is overestimated when normal proteins are used for calibration. To achieve more accurate molecular weight determination of PLAP, MALDI-TOF-MS analysis was carried out, also enabling the identification of other entities present in the isolated samples. To check for total protein content of the retrieved sample the method of Lowry et al. was used [23]. For the estimation of the enzymatic activity of samples an assay based on the conversion of 4-nitrophenyl phosphate into a yellow product was applied. Analysis of PLAP after ion-exchange liquid chromatographic purification In first instance, PLAP was isolated from a crude human placenta extract using IEC, which has previously been used for purification of alkaline phosphatase from various sources [26-31]. After loading the crude sample on the cellulose based DEAE-52 column, PLAP was eluted by applying a salt step-gradient. Fifteen fractions (2 ml each) collected from the column showed enzymatic activity and were pooled and dialyzed. With a Lowry assay, the protein content was determined to be 0.84 mg/ml. The enzymatic activity of the pooled fractions appeared to be 5.7 U/ml, giving a specific activity of 6.8 U/mg protein. This is considerably lower than for PLAP of commercial sources, which claim a specific activity of approx. 15 U/mg. Upon CZE analysis of the collected sample, several (partly overlapping) peaks were found (Fig. 1A).
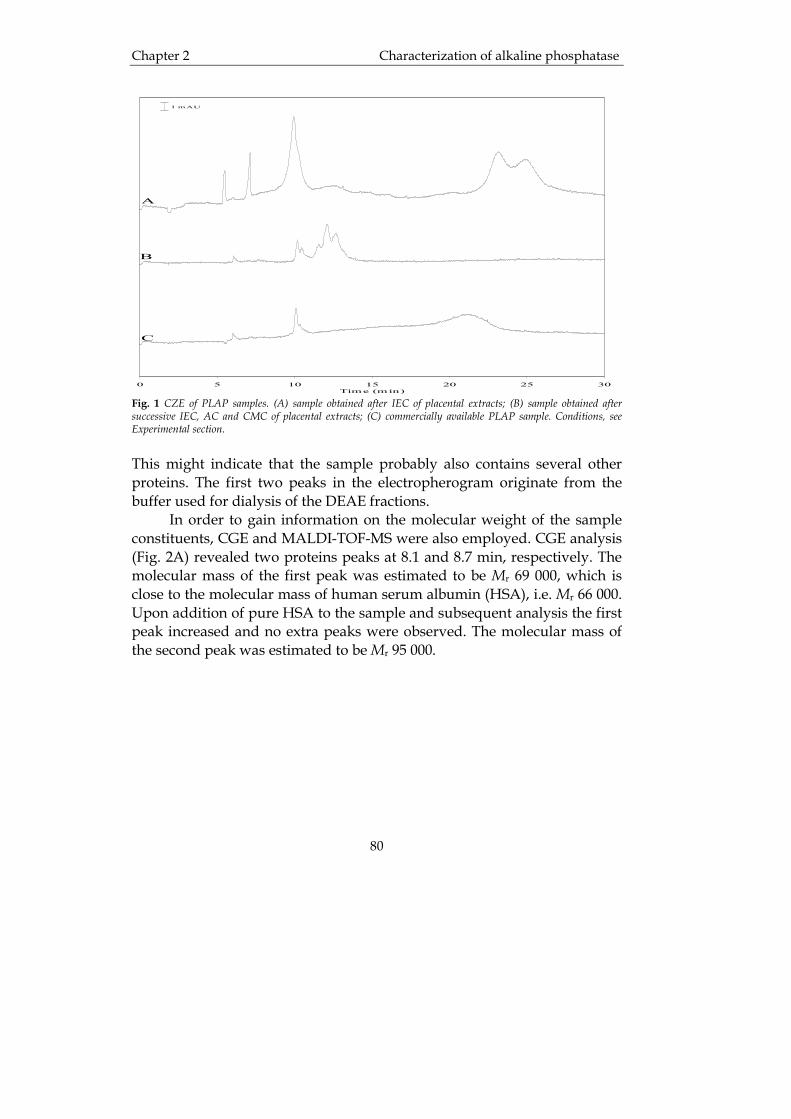
Chapter 2 Characterization of alkaline phosphatase
80
Time (min)0 5 10 15 20 25 30
A
B
C
1 mAU
Fig. 1 CZE of PLAP samples. (A) sample obtained after IEC of placental extracts; (B) sample obtained after successive IEC, AC and CMC of placental extracts; (C) commercially available PLAP sample. Conditions, see Experimental section. This might indicate that the sample probably also contains several other proteins. The first two peaks in the electropherogram originate from the buffer used for dialysis of the DEAE fractions. In order to gain information on the molecular weight of the sample constituents, CGE and MALDI-TOF-MS were also employed. CGE analysis (Fig. 2A) revealed two proteins peaks at 8.1 and 8.7 min, respectively. The molecular mass of the first peak was estimated to be Mr 69 000, which is close to the molecular mass of human serum albumin (HSA), i.e. Mr 66 000. Upon addition of pure HSA to the sample and subsequent analysis the first peak increased and no extra peaks were observed. The molecular mass of the second peak was estimated to be Mr 95 000.
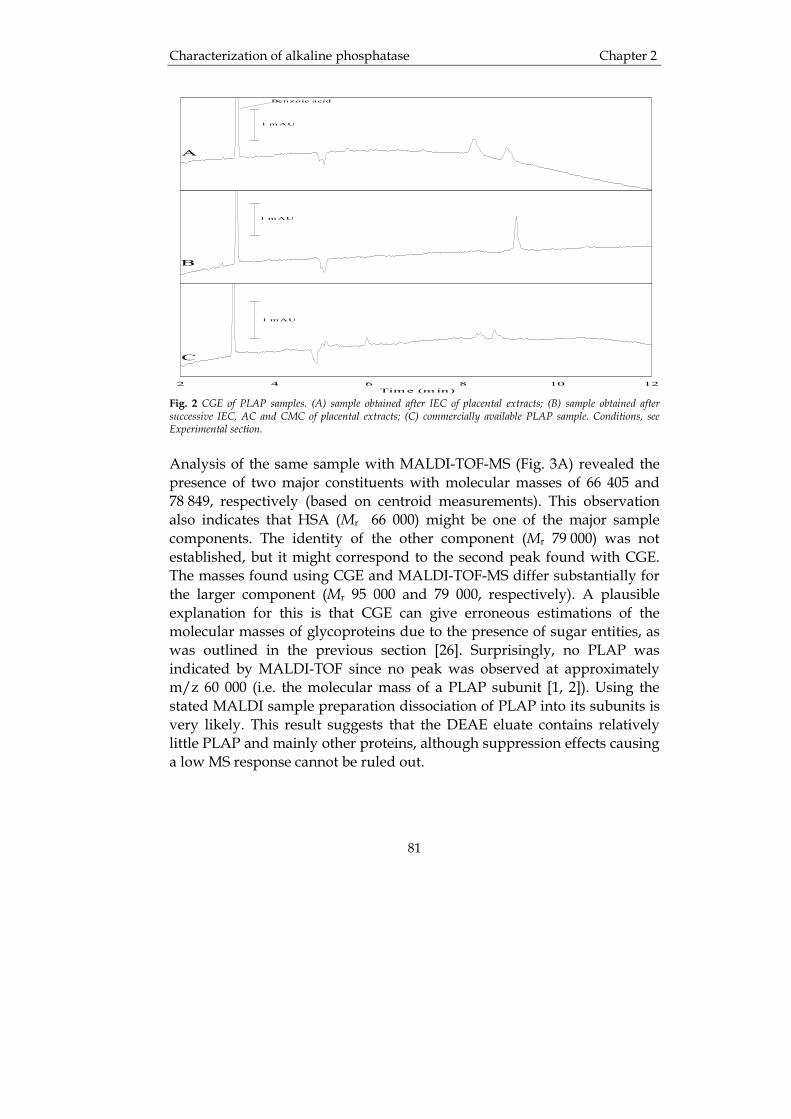
Characterization of alkaline phosphatase Chapter 2
81
Time (min)2 4 6 8 10 12
Benzoic acid
A
B
C
1 mAU
1 mAU
1 mAU
Fig. 2 CGE of PLAP samples. (A) sample obtained after IEC of placental extracts; (B) sample obtained after successive IEC, AC and CMC of placental extracts; (C) commercially available PLAP sample. Conditions, see Experimental section. Analysis of the same sample with MALDI-TOF-MS (Fig. 3A) revealed the presence of two major constituents with molecular masses of 66 405 and 78 849, respectively (based on centroid measurements). This observation also indicates that HSA (Mr 66 000) might be one of the major sample components. The identity of the other component (Mr 79 000) was not established, but it might correspond to the second peak found with CGE. The masses found using CGE and MALDI-TOF-MS differ substantially for the larger component (Mr 95 000 and 79 000, respectively). A plausible explanation for this is that CGE can give erroneous estimations of the molecular masses of glycoproteins due to the presence of sugar entities, as was outlined in the previous section [26]. Surprisingly, no PLAP was indicated by MALDI-TOF since no peak was observed at approximately m/z 60 000 (i.e. the molecular mass of a PLAP subunit [1, 2]). Using the stated MALDI sample preparation dissociation of PLAP into its subunits is very likely. This result suggests that the DEAE eluate contains relatively little PLAP and mainly other proteins, although suppression effects causing a low MS response cannot be ruled out.
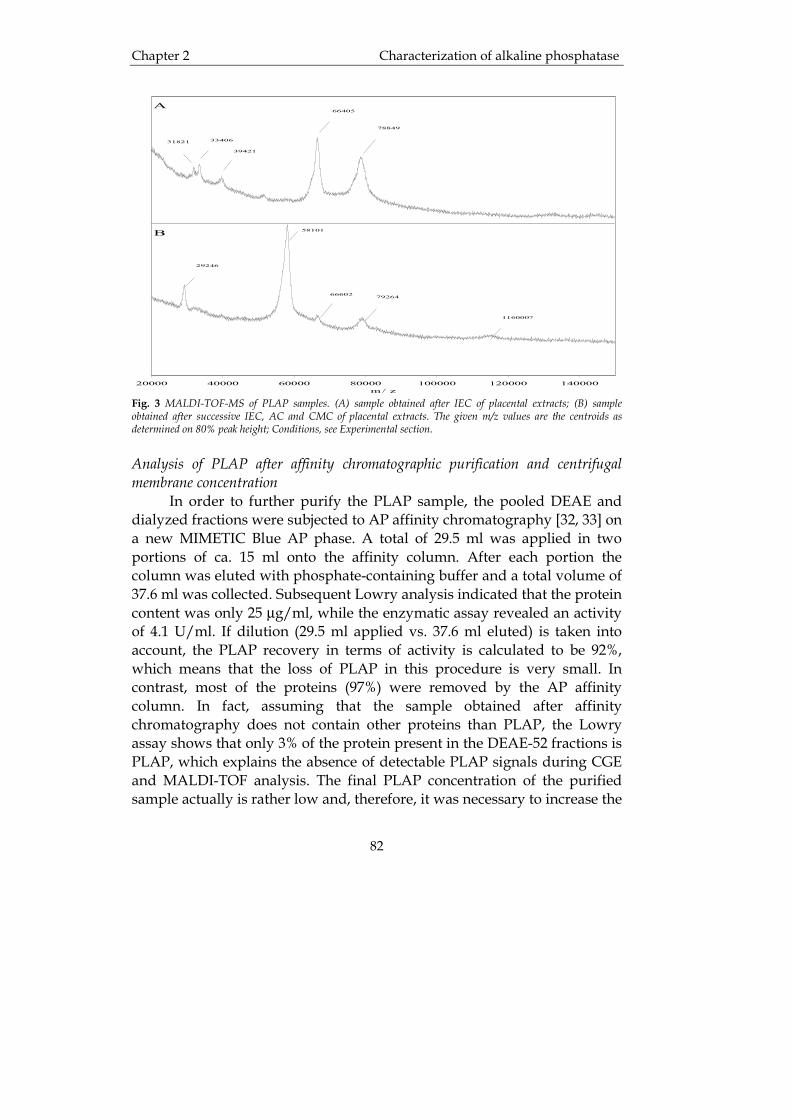
Chapter 2 Characterization of alkaline phosphatase
82
m/ z20000 40000 60000 80000 100000 120000 140000
A
B
78849
66405
39421
33406
29246
58101
66602 79264
116000?
31821
Fig. 3 MALDI-TOF-MS of PLAP samples. (A) sample obtained after IEC of placental extracts; (B) sample obtained after successive IEC, AC and CMC of placental extracts. The given m/z values are the centroids as determined on 80% peak height; Conditions, see Experimental section. Analysis of PLAP after affinity chromatographic purification and centrifugal membrane concentration In order to further purify the PLAP sample, the pooled DEAE and dialyzed fractions were subjected to AP affinity chromatography [32, 33] on a new MIMETIC Blue AP phase. A total of 29.5 ml was applied in two portions of ca. 15 ml onto the affinity column. After each portion the column was eluted with phosphate-containing buffer and a total volume of 37.6 ml was collected. Subsequent Lowry analysis indicated that the protein content was only 25 µg/ml, while the enzymatic assay revealed an activity of 4.1 U/ml. If dilution (29.5 ml applied vs. 37.6 ml eluted) is taken into account, the PLAP recovery in terms of activity is calculated to be 92%, which means that the loss of PLAP in this procedure is very small. In contrast, most of the proteins (97%) were removed by the AP affinity column. In fact, assuming that the sample obtained after affinity chromatography does not contain other proteins than PLAP, the Lowry assay shows that only 3% of the protein present in the DEAE-52 fractions is PLAP, which explains the absence of detectable PLAP signals during CGE and MALDI-TOF analysis. The final PLAP concentration of the purified sample actually is rather low and, therefore, it was necessary to increase the
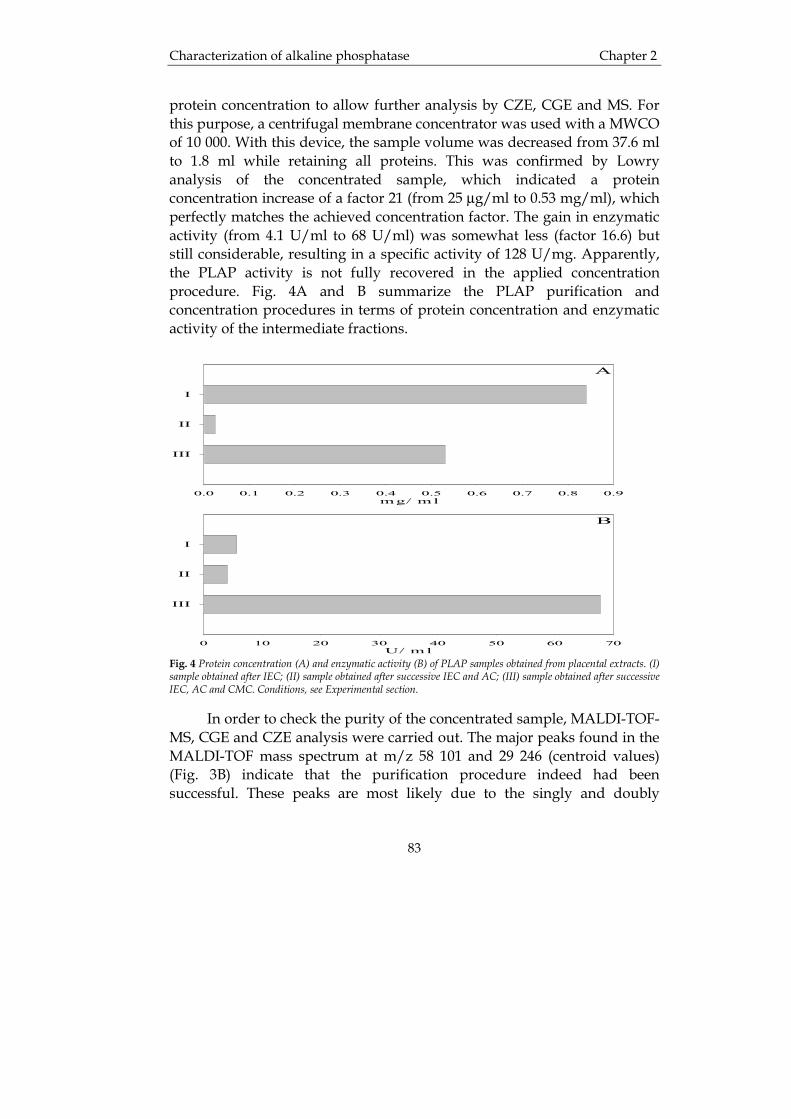
Characterization of alkaline phosphatase Chapter 2
83
protein concentration to allow further analysis by CZE, CGE and MS. For this purpose, a centrifugal membrane concentrator was used with a MWCO of 10 000. With this device, the sample volume was decreased from 37.6 ml to 1.8 ml while retaining all proteins. This was confirmed by Lowry analysis of the concentrated sample, which indicated a protein concentration increase of a factor 21 (from 25 µg/ml to 0.53 mg/ml), which perfectly matches the achieved concentration factor. The gain in enzymatic activity (from 4.1 U/ml to 68 U/ml) was somewhat less (factor 16.6) but still considerable, resulting in a specific activity of 128 U/mg. Apparently, the PLAP activity is not fully recovered in the applied concentration procedure. Fig. 4A and B summarize the PLAP purification and concentration procedures in terms of protein concentration and enzymatic activity of the intermediate fractions.
mg/ ml0.0 0.1 0.2 0.3 0.4 0.5 0.6 0.7 0.8 0.9
III
II
I
U/ ml0 10 20 30 40 50 60 70
III
II
I
A
B
Fig. 4 Protein concentration (A) and enzymatic activity (B) of PLAP samples obtained from placental extracts. (I) sample obtained after IEC; (II) sample obtained after successive IEC and AC; (III) sample obtained after successive IEC, AC and CMC. Conditions, see Experimental section. In order to check the purity of the concentrated sample, MALDI-TOF-MS, CGE and CZE analysis were carried out. The major peaks found in the MALDI-TOF mass spectrum at m/z 58 101 and 29 246 (centroid values) (Fig. 3B) indicate that the purification procedure indeed had been successful. These peaks are most likely due to the singly and doubly
Chapter 2 Characterization of alkaline phosphatase
84
charged subunits of PLAP. Averaging the centroid values reveals a molecular mass of the PLAP subunit of Mr 58 294 Da. In addition, two minor peaks were detected at m/z 66 602 and 79 264, respectively. These reveal that the two major components of the DEAE fractions (HSA and an unknown protein) are still present in the purified sample, but relatively in much lower quantities than before. The relative purity of the concentrated PLAP sample is also supported by CGE analysis, which shows only one peak when the sample is denaturated (i.e. boiled after addition of β-mercaptoethanol) prior to analysis (Fig. 2B). The mass indicated by the CGE calibration (Mr 96 000) does not match the molecular weight of PLAP, but this might be caused by the fact that PLAP is a glycoprotein (see above). The purity of the PLAP sample was also checked by CZE (Fig. 1B). Indeed, a part of the major peaks observed in the DEAE fraction (Fig. 1A) were not present now. But, remarkably, not one peak but several closely spaced peaks showed up. Probably, CZE reveals the microheterogeneity of PLAP, i.e. the cluster of peaks might be caused by several glycoforms and/or oligomers of the enzyme. Analysis of PLAP from a commercial source From the experiments described above, it can be concluded that with a procedure of subsequent IEC, affinity chromatography and centrifugal membrane concentration, highly pure PLAP can be recovered from human placenta. However, since this procedure is quite laborious, we considered the use of PLAP obtained from a commercial source. To check the purity of this sample and to characterize it, we applied the same set of techniques as used to monitor the isolation procedure. A 1.00-mg/ml solution of PLAP sample was subjected to Lowry and activity analysis. The protein content was found to be 0.77 mg/ml, while the enzymatic activity of the same sample was 11.9 U/ml, so that the specific activity was calculated to be 15.6 U/mg, which is in line with the activity claimed by the manufacturer (ca. 15 U/mg). Compared to the PLAP purified in our lab (128 U/mg) this specific activity is considerably lower, but still higher than the value obtained for the PLAP sample obtained by only applying IEC (6.8 U/mg). These results indicate that the PLAP from the commercial source might contain considerable amounts of other proteins. The sample was also analyzed by CGE after first treating it with β-mercaptoethanol at high temperature. The electropherogram showed five peaks corresponding to estimated molecular masses of 13 000, 22 000,
Characterization of alkaline phosphatase Chapter 2
85
75 000, 78 000 and 91 000 (Fig. 2C). In fact, the peak corresponding to Mr 91 000 is close to the Mr 96 000 found for the purified and concentrated PLAP and just within the experimental variation given by the repeatability of the method (RSD=6%, data not shown). The presence of various peaks suggests that the commercial PLAP contains several other proteins, and explains why its specific activity is rather low. Unfortunately, we were not successful in our attempts to get good MALDI-TOF-MS spectra from the commercial PLAP sample. Despite several attempts using two different matrices (sinapinic acid and ferulic acid) in several ratios to the sample, no signal corresponding to the m/z of a PLAP subunit (Mr 58 000) was found. In fact, it was not possible to produce a reliable spectrum of this sample, which might be caused by the fact that the sample contained too much salt. The commercial PLAP sample was also analyzed by CZE (Fig. 1C) revealing only one peak in the 9-13 min region and not a cluster of peaks as found for the purified sample (cf. Fig. 1B). This observation might indicate that the larger part of the PLAP present in the commercial sample is comprised of one glycoform only. This conclusion is supported by the fact that a similar correlation between the peak area (corrected for migration time) of the PLAP peaks and the measured activity is found for both the purified and the commercial PLAP sample (Fig. 1B and 1C). Based on the above mentioned values for activity of the purified PLAP sample (68 U/ml) and the commercial PLAP sample (11.9 U/ml), and assuming a constant injection volume, a peak area-activity ratio of 59 (arbitrary units) was determined for the purified sample, while for the commercial sample a ratio of 51 was calculated. In other words, the band at 10 min in Fig. 1C indeed seems to originate from PLAP. 2.5 Conclusions The combination of several analytical techniques, i.e. enzymatic activity and protein concentration assay, CZE, CGE and MALDI-TOF-MS, is a powerful approach to investigate the purity and composition of enzyme samples. Applying this combination it was shown that IEC alone is surely not sufficient to isolate alkaline phosphatase from human placenta, but that an additional purification by affinity chromatography is required. In addition, it was demonstrated that also commercial PLAP samples may contain several other proteins next to alkaline phosphatase. Clearly such observations are essential when the use of PLAP for medical purposes is
Chapter 2 Characterization of alkaline phosphatase
86
studied and PLAP samples are used for in vivo experiments. In such situations characterization of samples by enzymatic activity assays only is fully inadequate. This study also indicates the potential of CGE, and particularly CZE to reveal the microheterogeneity and macroheterogeneity (e.g., glycoforms, oligomers) of proteins. Currently, we are investigating CZE as a means of monitoring the (forced) degradation of AP. 2.6 Acknowledgements We are grateful to the Department of Pharmacokinetics and Drug Delivery of the University of Groningen for the donation of the crude human placenta extracts.
Characterization of alkaline phosphatase Chapter 2
87
2.7 References 1. Gottlieb, A.J. and H.H. Sussman, Human placental alkaline phosphatase:
molecular weight and subunit structure. Biochim Biophys Acta, 1968. 160(2): p. 167-171.
2. Greene, P.J. and H.H. Sussman, Structual comparison of ectopic and
normal placental alkaline phosphatase. Proc Natl Acad Sci U S A, 1973. 70(10): p. 2936-2940.
3. Martland, M. and R. Robison, XCI. The possible significance of hexose
phosphoric esters in ossification. Biochemistry, 1927. 21: p. 665-674. 4. Magnusson, P., O. Lofman, and L. Larsson, Methodological aspects on
separation and reaction conditions of bone and liver alkaline phosphatase isoform analysis by high-performance liquid chromatography. Anal Biochem, 1993. 211(1): p. 156-163.
5. Otto, V.I., B.K. Schar, T. Sulser, and E. Hanseler, Specific determination
of germ cell alkaline phosphatase for early diagnosis and monitoring of seminoma: performance and limitations of different analytical techniques. Clin Chim Acta, 1998. 273(2): p. 131-147.
6. Trowsdale, J., D. Martin, D. Bicknell, and I. Campbell, Alkaline
phosphatases. Biochem Soc Trans, 1990. 18(2): p. 178-180. 7. Anderson, D.J., E.L. Branum, and J.F. O'Brien, Liver- and bone-derived
isoenzymes of alkaline phosphatase in serum as determined by high-performance affinity chromatography. Clin Chem, 1990. 36(2): p. 240-246.
8. Schoenau, E., K.H. Herzog, and H.J. Boehles, Liquid-chromatographic
determination of isoenzymes of alkaline phosphatase in serum and tissue homogenates. Clin Chem, 1986. 32(5): p. 816-818.
9. Schoenau, E., K.H. Herzog, and D. Michalk, Particulate (high-
molecular-mass) and soluble alkaline phosphatase in urine determined by high-performance liquid chromatography. Clin Chem, 1990. 36(11): p. 1934-1936.
Chapter 2 Characterization of alkaline phosphatase
88
10. Poelstra, K., W.W. Bakker, P.A. Klok, M.J. Hardonk, and D.K. Meijer, A physiologic function for alkaline phosphatase: endotoxin detoxification. Lab Invest, 1997. 76(3): p. 319-327.
11. Hsu, D.S. and S.S. Chen, Heterogeneity of alkaline phosphatase observed
by high-performance liquid chromatography. J Chromatogr, 1985. 328: p. 409-412.
12. Welling, G.W., R. van der Zee, and S. Welling-Wester, Column liquid
chromatography of integral membrane proteins. J Chromatogr, 1987. 418: p. 223-243.
13. Schöneich, C., A.F.R. Humer, S.R. Rabel, J.F. Stobaugh, S.D.S. Jois,
C.K. Larive, T.J. Siahaan, T.C. Squier, D.J. Bigelow, and T.D. Williams, Separation and analysis of peptides and proteins. Anal Chem, 1995. 67: p. 155R-181R.
14. Kishino, S. and K. Miyazaki, Separation methods for glycoprotein analysis
and preparation. J Chromatogr B, 1997. 699(1-2): p. 371-381. 15. Landers, J.P., R.P. Oda, B.J. Madden, and T.C. Spelsberg, High-
performance capillary electrophoresis of glycoproteins: the use of modifiers of electroosmotic flow for analysis of microheterogeneity. Anal Biochem, 1992. 205(1): p. 115-124.
16. Che, F.Y., J.F. Song, X.X. Shao, K.Y. Wang, and Q.C. Xia, Comparative
study on the distribution of ovalbumin glycoforms by capillary electrophoresis. J Chromatogr A, 1999. 849(2): p. 599-608.
17. Chen, Y., Critical conditions for separating the microheterogeneous
components of glycoproteins by capillary electrophoresis. J Chromatogr A, 1997. 768(1): p. 39-45.
18. Watson, E. and F. Yao, Capillary electrophoretic separation of human
recombinant erythropoietin (r-HuEPO) glycoforms. Anal Biochem, 1993. 210(2): p. 389-393.
19. Kinoshita, M., E. Murakami, Y. Oda, T. Funakubo, D. Kawakami, K.
Kakehi, N. Kawasaki, K. Morimoto, and T. Hayakawa, Comparative
Characterization of alkaline phosphatase Chapter 2
89
studies on the analysis of glycosylation heterogeneity of sialic acid-containing glycoproteins using capillary electrophoresis. J Chromatogr, 2000. 866: p. 261-271.
20. Craig, D.B., J.C.Y. Wong, and N.J. Dovichi, Detection of attomolar
concentrations of alkaline phosphatase by capillary electrophoresis using laser-induced fluorescence detection. Anal Chem, 1996. 68: p. 697-700.
21. Xu, Y., X. Liu, and M.P.C. Ip, Michaelis-Menten analysis of alkaline
phosphatase by capillary electrophoresis using plug-plug reaction. J. Liq. Chrom. & Rel. Technol., 1998. 21(18): p. 2781-2797.
22. Wu, D., F.E. Regnier, and M.C. Linhares, Electrophoretically mediated
micro-assay of alkaline phosphatase using electrochemical and spectrophotometric detection in capillary electrophoresis. J Chromatogr, 1994. 657(2): p. 357-363.
23. Lowry, O.H., N.J. Roseborough, A.L. Farr, and R.J. Randall, Protein
measurement with the Folin phenol reagent. J Biol Chem, 1951. 193: p. 265-275.
24. Verzola, B., C. Gelfi, and P.G. Righetti, Protein adsorption to the bare
silica wall in capillary electrophoresis quantitative study on the chemical composition of the background electrolyte for minimising the phenomenon. J Chromatogr A, 2000. 868(1): p. 85-99.
25. Karger, B.L., F. Foret, and J. Berka, Capillary electrophoresis with
polymer matrices: DNA and protein separation and analysis. Methods Enzymol, 1996. 271: p. 293-319.
26. Wachsmuth, E.D. and K. Hiwada, Alkaline phosphatase from pig kidney. Method of purification and molecular properties. Biochem J, 1974. 141(1): p. 273-282.
27. Simpson, R.T., B.L. Vallee, and G.H. Tait, Alkaline phosphatase of
Escherichia coli. Composition. Biochemistry, 1968. 7(12): p. 4336-4342. 28. Saraswathi, S. and B.K. Bachhawat, Heterogeneity of alkaline phosphatase
in sheep brain. J Neurochem, 1966. 13(4): p. 237-246.

Chapter 2 Characterization of alkaline phosphatase
90
29. Principato, G.B., V. Bocchini, G. Rosi, M.C. Aisa, and E. Giovannini, Purification and characterization of four different alkaline phosphatases from Spirographis spallanzanii. Comp Biochem Physiol [B], 1984. 78(2): p. 485-491.
30. Ohkubo, A., N. Langerman, and M.M. Kaplan, Rat liver alkaline
phosphatase. Purification and properties. J Biol Chem, 1974. 249(22): p. 7174-7180.
31. Politino, M., J. Brown, and J.J. Usher, Purification and characterization of
an extracellular alkaline phosphatase from Penicillium chrysogenum. Prep Biochem Biotechnol, 1996. 26(3-4): p. 171-181.
32. Clonis, Y.D. and C.R. Lowe, Monosized adsorbents for high-performance
affinity chromatography. Application to the purification of calf intestinal alkaline phosphatase and human urine urokinase. J Chromatogr, 1991. 540(1-2): p. 103-111.
33. Lindner, N.M., R. Jeffcoat, and C.R. Lowe, Design and applications of
biomimetic anthraquinone dyes. Purification of calf intestinal alkaline phosphatase with immobilised terminal ring analogues of C.I. reactive blue 2. J Chromatogr, 1989. 473(1): p. 227-240.
Potential of capillary electrophoresis Chapter 3
91
Chapter 3
Potential of capillary electrophoresis for the monitoring of the stability of placental alkaline phosphatase
H.J.C. Eriksson, M. Wijngaard, W.L.J. Hinrichs, H.W. Frijlink, G.W. Somsen, G.J. de Jong. J Pharm Biomed Anal, 2003. 31: p. 351-357.

Chapter 3 Potential of capillary electrophoresis
92
Summary Alkaline phosphatase (AP) is a potential therapeutic agent in the treatment of sepsis. In this paper the potential of capillary zone electrophoresis (CZE) for the monitoring of the degradation of placental alkaline phosphatase (PLAP) was investigated. To induce degradation PLAP samples were exposed to high temperatures, low and high pH and freeze-drying. The samples were then analyzed by CZE and enzymatic activity assay. Upon exposure to temperatures above 65 °C, PLAP lost its activity exponentially over time, while CZE revealed both a linear decrease of the area of the main peak and a rise of degradation products. At acidic pH the enzyme appeared to lose its activity. CZE revealed a decrease of the area of the main peak, but no degradation products could be detected. At pH 12 the enzymatic activity and the area of the main peak both decreased linearly over time and, in addition, formation of degradation products could be detected by CZE. Activity and CZE profile of PLAP remained unchanged upon freeze-drying in the presence of inulin. Prolonged storage of freeze-dried samples at room temperature caused a slight decrease of enzymatic activity, while the potential formation of oligomers was revealed by CZE analysis. The examples in this study show that, in combination with activity assays, CZE can provide useful complementary information, especially on the status of the protein and the presence of degradation products.
Potential of capillary electrophoresis Chapter 3
93
3.1 Introduction Pharmaceutically active proteins have been applied for decades. However, their number has been small until the 1980s, but since that time rapid developments in molecular biology resulted in a fast increase in their number. Currently, the FDA has approved over 30 different recombinant DNA-derived proteins, e.g., erythropoietin, interferon alpha-2a/b, somatropin, and follitropin beta and many more are already in a far stage of development. This fast growth asks for improved analytical methods, which can be used for quality control and stability studies. Proteins are complex molecules containing many functional groups, which can undergo a variety of reactions, such as deamidation, hydrolysis, oxidation, and racemization of the amino acids. The type and rate of these reactions depend on the amino acids involved and the conditions applied. These reactions can alter the conformation, size, charge and hydrophobicity of the protein, or may totally degrade it, thereby affecting the activity of the protein or even leading to formation of toxic compounds. Clearly, from the viewpoint of quality control and safety, monitoring of the stability and degradation of pharmaceutical proteins is of utmost importance, as is recognized by the ICH by formulating guidelines for stability testing of biological products [1]. Size-exclusion liquid chromatography (SEC), ion-exchange liquid chromatography (IEC), slab-gel electrophoresis and reversed-phase liquid chromatography (RP-LC) have been used to monitor changes in size, charge and hydrophobicity of proteins [2-9]. Capillary zone electrophoresis (CZE) has a high resolving power and the electrophoretic migration of compounds in free solution basically depends on their molecular charge and size. Therefore, CZE may be a powerful tool to monitor the degradation of proteins. Recently, it was discovered that the endogenous protein alkaline phosphatase (AP, E.C. 3.1.3.1.) can dephosphorylate (and thus detoxify) endotoxins, and that it might be used as a pharmaceutical in the treatment of sepsis [10]. AP is a dimeric enzyme, where each subunit has a molecular weight of 58 kDa [11]. The pI of AP has been reported to be 4.3-4.5 [12] and it exhibits optimum activity at approximately pH 9.8 [10]. Obviously, successful therapeutic use of AP requires availability of material with adequate purity and the development of appropriate dosage forms and formulations. Also, analytical methods for the determination of the purity and stability of (treated) AP are needed. In a previous paper, we

Chapter 3 Potential of capillary electrophoresis
94
demonstrated the usefulness of CZE to study the composition of AP samples during several stages of isolation/purification from human placenta [13]. In these experiments a CZE run buffer containing putrescine (1,4-diaminobutane) was used to prevent protein adsorption to the capillary [14], and to improve the peak shape and resolution. In this paper the possibility to employ CZE as a tool to monitor AP degradation is investigated and compared to enzymatic activity assay. 3.2 Experimental Chemicals Magnesium chloride, ammediol (2-amino-2-methyl-1,3-propanediol), sodium chloride, benzyltrimethylammonium chloride and 4-nitrophenyl phosphate (pNPP) were from Fluka (Buch, Switzerland). Boric acid, hydrochloric acid and sodium hydroxide were purchased from Merck (Darmstadt, Germany). Putrescine (1,4-diaminobutane) was from Aldrich (Gillingham-Dorset, UK) and PLAP (EC 3.1.3.1) (14 U/mg) was from Sigma (St Louis, MO, USA). Water used in the experiments was from an Elga Maxima Ultra Pure Water apparatus (Salm & Kipp, Breukelen, The Netherlands). Inulin with a number/weight average degree of polymerization (DPn/DPw) of 23/26 was a gift from Sensus (Rosendaal, The Netherlands). Analytical techniques Enzymatic activity assay Activity of the PLAP was determined using the enzymatic conversion of pNPP and measuring the absorbance of the yellow product (p-nitrophenol) at 405 nm. For the assay 475 µl of a mixture of 97.9 %v/v of 0.05 M ammediol (pH 9.8) with 2.1 %v/v of 100 mM MgCl2 and 25 µl of 10 mg/ml pNPP were mixed with 12.5 µl of sample. After incubation for 30 min at 37 °C, 2.50 ml of 0.1 M NaOH was added to stop the conversion and the absorbance of the samples was measured on a Hitachi U-2001 Spectrophotometer (Tokyo, Japan).
Potential of capillary electrophoresis Chapter 3
95
Capillary zone electrophoresis CZE experiments were performed on a Beckman P/ACE System 5500 equipped with a diode array detector (Fullerton, CA, USA), using an uncoated fused-silica capillary (Supelco, Bellafonte, PA, USA) with 75 µm I.D. and a length of 37 cm (effective length, 30 cm). Before use the capillary was flushed for 30 min with 0.1 M NaOH, water and run buffer, respectively. The run buffer was 50 mM boric acid, containing 2 mM putrescine, adjusted to pH 8.5 using 1 M sodium hydroxide. Before addition of putrescine, the run buffer was filtered through a 0.45-µm membrane filter from Schleicher and Schuell (Dassel, Germany). Between injections the capillary was rinsed with run buffer (2 min). The separation voltage was 15 kV and the temperature was set to 25 °C. Commonly, samples were hydrodynamically injected at 0.5 p.s.i. for 3.5 s, and detection was carried out at 200 nm. Each sample was analysed in duplicate. For quantitative analysis, migration time-corrected peak areas were used. Stress conditions Heat For the exposure of PLAP to high temperatures a water bath set to the desired temperatures was used. PLAP was dissolved in 0.05 M ammediol buffer pH 9.8 at a concentration of 5 mg/ml. Typically, samples of 10 µl for enzymatic activity assay and 25 µl for CZE analysis were taken every hour for up to 5 hours. Low and high pH Exposure of PLAP to extreme pH-values was accomplished by adding either HCl or NaOH to the sample solution. 0.05 M ammediol pH 9.8 was titrated with acid or base to the desired pH and then PLAP was added to yield a final concentration of 5 mg/ml. Samples for enzymatic activity assay and analysis by CZE were taken as described above. Freeze-drying Ammediol solutions of inulin and PLAP (inulin/PLAP, 9/1 w/w) were freeze-dried by using a CHRIST freeze-dryer equipped with temperature and pressure control. As sample containers 20-ml glass bottles were used, and before the drying process the samples were rapidly pre-frozen in liquid nitrogen. The lyophilization was then performed using a

Chapter 3 Potential of capillary electrophoresis
96
shelf temperature of –30 °C, a condenser temperature of –53 °C and a pressure of 0.220 mbar for 18 hours. Then, the shelf temperature and pressure were gradually raised to 20 °C and 0.520 mbar, respectively, during 6 hours. Finally, the drying process was continued for another 20 hours under these conditions. 3.3 Results and discussion Heat exposure In order to examine the heat stability of PLAP, several PLAP solutions were exposed to temperatures between 25 and 75 °C. These tests were performed with PLAP dissolved in 0.05 M ammediol (pH 9.8), which also was used for the enzymatic activity assay. Up to 65 °C no loss of activity of the exposed PLAP was observed within five hours, and also no change was observed in the electropherograms. This is in agreement with the reported heat stability of the placental form of AP (in contrast to the other isoforms) [15, 16]. Upon further increase of the temperature a dramatic change in activity was observed in a relatively small temperature interval (Fig. 1A).
Time (h)0 1 2 3 4 5 6
%A
ctiv
ity
0
20
40
60
80
100A
Time (h)0 1 2 3 4 5 6
%A
rea
50
60
70
80
90
100
110B
Fig. 1 Analysis of PLAP (5 mg/ml) in 0.05 M ammediol (pH 9.8) after exposure to 67.5 °C (●), 70 °C (■), and 72.5 °C (▲), respectively. (A) relative activity and (B) relative peak area of main peak after CZE. The activity and peak area of PLAP before exposure is set to 100%. Further conditions, see Experimental section. At 67.5 °C still a rather slow and gradual loss of activity is observed, but at 70 °C and 72.5 °C the activity is clearly decreasing at a much higher rate.
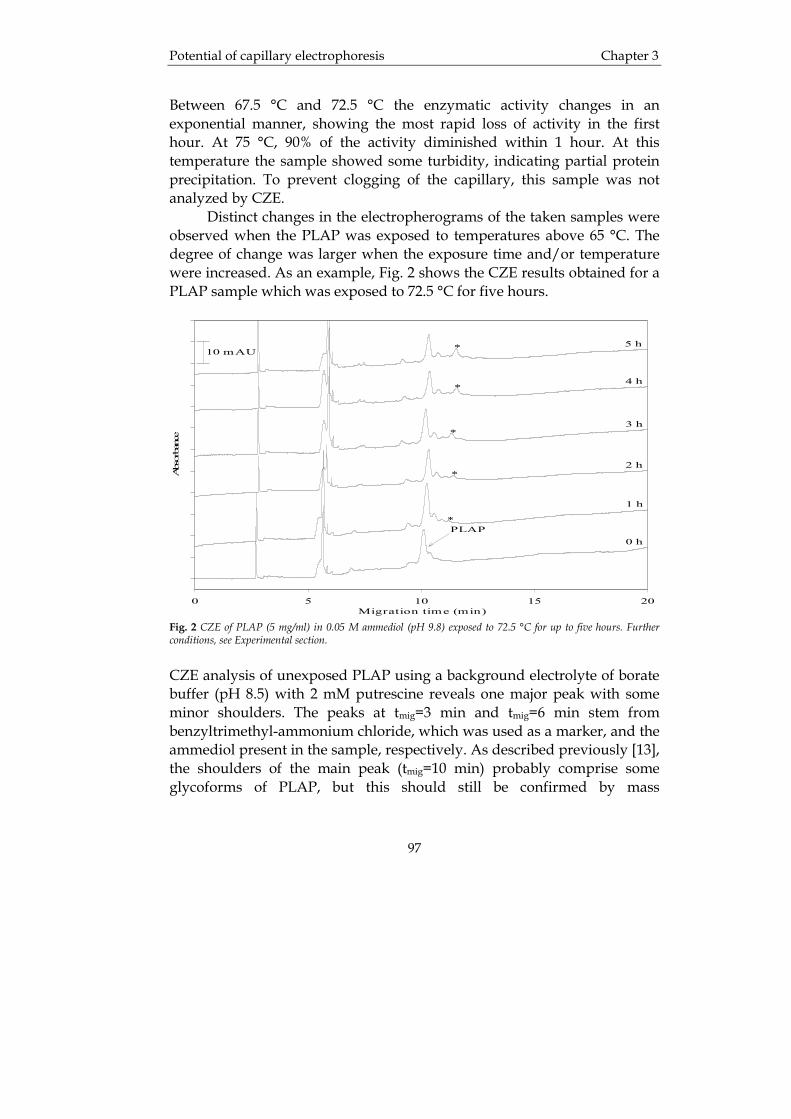
Potential of capillary electrophoresis Chapter 3
97
Between 67.5 °C and 72.5 °C the enzymatic activity changes in an exponential manner, showing the most rapid loss of activity in the first hour. At 75 °C, 90% of the activity diminished within 1 hour. At this temperature the sample showed some turbidity, indicating partial protein precipitation. To prevent clogging of the capillary, this sample was not analyzed by CZE. Distinct changes in the electropherograms of the taken samples were observed when the PLAP was exposed to temperatures above 65 °C. The degree of change was larger when the exposure time and/or temperature were increased. As an example, Fig. 2 shows the CZE results obtained for a PLAP sample which was exposed to 72.5 °C for five hours.
Migration time (min)0 5 10 15 20
Abs
orba
nce
10 mAU
PLAP
*
*
*
*
*
0 h
1 h
2 h
3 h
4 h
5 h
Fig. 2 CZE of PLAP (5 mg/ml) in 0.05 M ammediol (pH 9.8) exposed to 72.5 °C for up to five hours. Further conditions, see Experimental section. CZE analysis of unexposed PLAP using a background electrolyte of borate buffer (pH 8.5) with 2 mM putrescine reveals one major peak with some minor shoulders. The peaks at tmig=3 min and tmig=6 min stem from benzyltrimethyl-ammonium chloride, which was used as a marker, and the ammediol present in the sample, respectively. As described previously [13], the shoulders of the main peak (tmig=10 min) probably comprise some glycoforms of PLAP, but this should still be confirmed by mass

Chapter 3 Potential of capillary electrophoresis
98
spectrometric detection. In contrast to our previous study [13], no late migrating, broad band was detected. Probably, this is related to the fact that two different batches of AP were used in the two studies. Clearly, upon heat exposure the main peak decreases while a degradation product (marked with an asterisk) emerges. In contrast to the activity, the decrease of the area of the main peak was found to be linear over time during exposure to 67.5-72.5 °C (Fig. 1B). After five hours at 67.5 °C the peak area was 85 % of the original value, while at 72.5 °C the area had diminished to 69 %. An explanation of the difference in decay of enzymatic activity and peak area of the main peak (exponential vs. linear), might be that the increased temperature caused both chemical degradation of PLAP and small conformational changes. It is possible that both effects are reflected in the enzymatic activity, while CZE reveals only the effects of chemical modifications of the protein. Exposure to acidic and basic conditions In order to study the stability of PLAP under acidic conditions, PLAP (5 mg/ml) was dissolved in 0.05 M ammediol that had been adjusted to pH 5, 4, 3 and 2 with 1 M HCl. These samples were then monitored over time by enzymatic activity and CZE analysis. Already at pH 4, a considerable loss of activity of PLAP was observed down to 13% within 4 hours. The decay was exponential, showing a 60% loss in the first hour of exposure. CZE analysis of the sample exposed to pH 4 showed an exponential decay of the main peak over time, and after 4 hours the area of the main peak had decreased to 25 % of its original value. However, no new peaks emerged in the electropherogram, i.e. no degradation products were observed. Probably, the PLAP (pI≈4.3-4.5 [12]), simply precipitated at pH 4, although the loss of enzymatic activity could also be caused by an acid-induced loss of Zn2+ [17, 18], which is vital for the enzyme [19]. At pH 3 these effects were much stronger and PLAP instantaneously lost all of its activity and no peaks were observed when this sample was analyzed by CZE. When PLAP solutions were brought to pH 8-10 for a period of 5 hours no changes in the activity or the CZE profiles were observed. Naturally, this can be expected for a protein that shows optimum activity in an alkaline environment. Even at pH 11, PLAP degradation appeared to be negligible. When PLAP was exposed to pH 12 for 5 hours, the activity decreased linearly to 74% of its original value (Fig. 3), and CZE analysis of
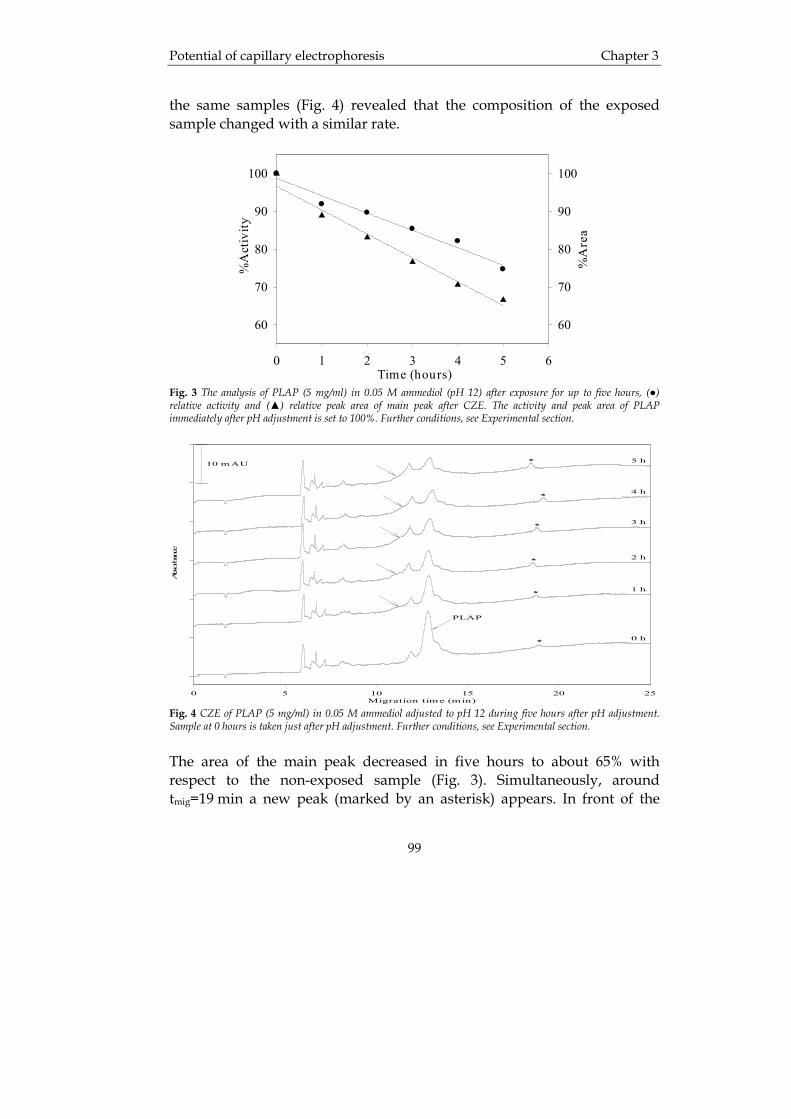
Potential of capillary electrophoresis Chapter 3
99
the same samples (Fig. 4) revealed that the composition of the exposed sample changed with a similar rate.
Time (hours)0 1 2 3 4 5 6
%A
ctiv
ity
60
70
80
90
100
%A
rea
60
70
80
90
100
Fig. 3 The analysis of PLAP (5 mg/ml) in 0.05 M ammediol (pH 12) after exposure for up to five hours, (●) relative activity and (▲) relative peak area of main peak after CZE. The activity and peak area of PLAP immediately after pH adjustment is set to 100%. Further conditions, see Experimental section.
Migration time (min)0 5 10 15 20 25
Abs
orba
nce
0 h
1 h
2 h
3 h
4 h
5 h10 mAU *
*
*
*
*
*
PLAP
Fig. 4 CZE of PLAP (5 mg/ml) in 0.05 M ammediol adjusted to pH 12 during five hours after pH adjustment. Sample at 0 hours is taken just after pH adjustment. Further conditions, see Experimental section. The area of the main peak decreased in five hours to about 65% with respect to the non-exposed sample (Fig. 3). Simultaneously, around tmig=19 min a new peak (marked by an asterisk) appears. In front of the
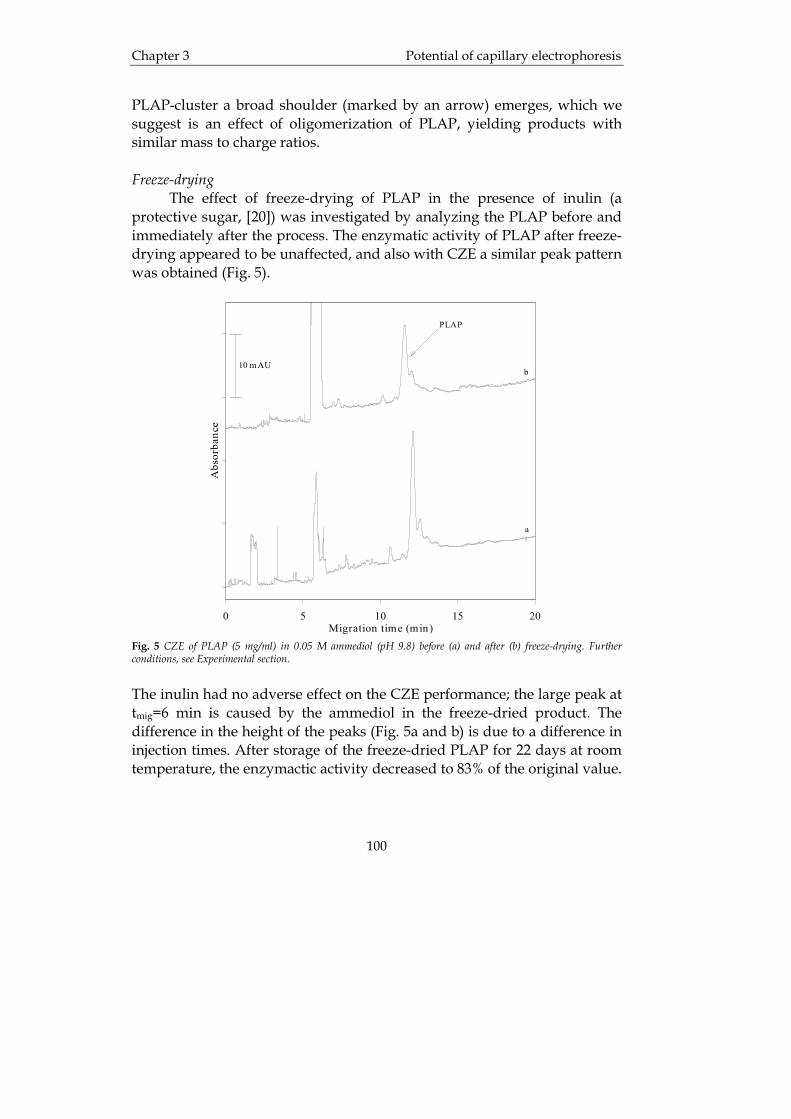
Chapter 3 Potential of capillary electrophoresis
100
PLAP-cluster a broad shoulder (marked by an arrow) emerges, which we suggest is an effect of oligomerization of PLAP, yielding products with similar mass to charge ratios. Freeze-drying The effect of freeze-drying of PLAP in the presence of inulin (a protective sugar, [20]) was investigated by analyzing the PLAP before and immediately after the process. The enzymatic activity of PLAP after freeze-drying appeared to be unaffected, and also with CZE a similar peak pattern was obtained (Fig. 5).
Migration time (min)0 5 10 15 20
Abs
orba
nce
10 mAU
a
b
PLAP
Fig. 5 CZE of PLAP (5 mg/ml) in 0.05 M ammediol (pH 9.8) before (a) and after (b) freeze-drying. Further conditions, see Experimental section.
The inulin had no adverse effect on the CZE performance; the large peak at tmig=6 min is caused by the ammediol in the freeze-dried product. The difference in the height of the peaks (Fig. 5a and b) is due to a difference in injection times. After storage of the freeze-dried PLAP for 22 days at room temperature, the enzymactic activity decreased to 83% of the original value.
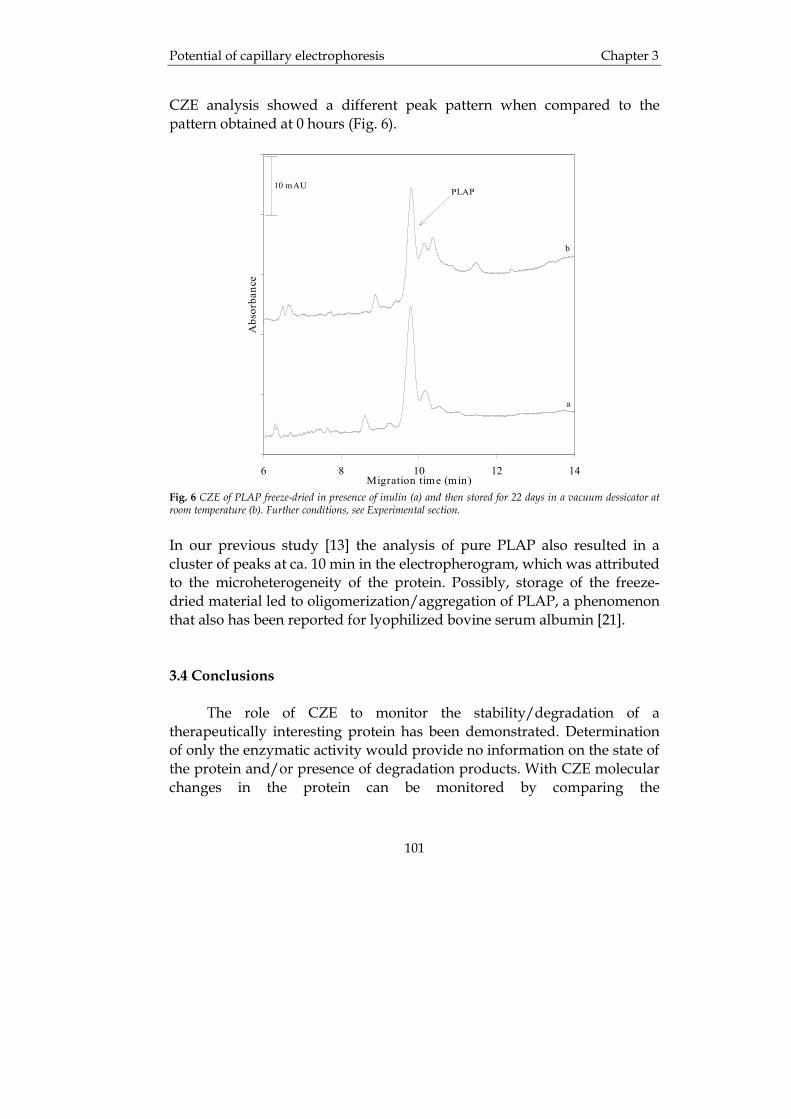
Potential of capillary electrophoresis Chapter 3
101
CZE analysis showed a different peak pattern when compared to the pattern obtained at 0 hours (Fig. 6).
Migration time (min)6 8 10 12 14
Abs
orba
nce
10 mAU
a
b
PLAP
Fig. 6 CZE of PLAP freeze-dried in presence of inulin (a) and then stored for 22 days in a vacuum dessicator at room temperature (b). Further conditions, see Experimental section. In our previous study [13] the analysis of pure PLAP also resulted in a cluster of peaks at ca. 10 min in the electropherogram, which was attributed to the microheterogeneity of the protein. Possibly, storage of the freeze-dried material led to oligomerization/aggregation of PLAP, a phenomenon that also has been reported for lyophilized bovine serum albumin [21]. 3.4 Conclusions The role of CZE to monitor the stability/degradation of a therapeutically interesting protein has been demonstrated. Determination of only the enzymatic activity would provide no information on the state of the protein and/or presence of degradation products. With CZE molecular changes in the protein can be monitored by comparing the
Chapter 3 Potential of capillary electrophoresis
102
electropherograms of the protein sample obtained before and after exposure to stress conditions. For instance, CZE analysis of PLAP shows that the reduction of activity caused by exposure to high temperature or high pH is accompanied by a decrease of the main-peak area as well as with the formation of degradation products. On the other hand, upon freeze-drying and subsequent storage of PLAP, only a minor change in activity of PLAP is observed while CZE reveals a clear change in peak profile, probably indicating aggregation of the protein. Admittedly, we are not yet able to reliably assign observed changes in the CZE profile to specific protein alterations or degradation products. Partly, this is due to the use of UV-detection so that hardly any information on the character of the separated compounds is obtained. Therefore, we are currently investigating the use of coupled CZE and mass spectrometry to characterize the observed protein peaks and to identify degradation products.

Potential of capillary electrophoresis Chapter 3
103
3.5 References 1. www.ICH.org. International conference on harmonisation of
technical requirements for registration of pharmaceuticals for human use, in: Q5C, ICH harmonised tripartite guideline, Quality of biotechnological products: Stability testing biotechnological/ biological products.
2. Arroyo-Reyna, A. and A. Hernandez-Arana, The thermal denaturation
of stem bromelain is consistent with an irreversible two-state model. Biochim Biophys Acta, 1995. 1248(2): p. 123-128.
3. Davio, S.R., K.M. Kienle, and B.E. Collins, Interdomain interactions in
the chimeric protein toxin sCD4(178)-PE40: a differential scanning calorimetry (DSC) study. Pharm Res, 1995. 12(5): p. 642-648.
4. Uversky, V.N., Use of fast protein size-exclusion liquid chromatography
to study the unfolding of proteins which denature through the molten globule. Biochemistry, 1993. 32(48): p. 13288-13298.
5. Daiho, T. and T. Kanazawa, Reduction of disulfide bonds in
sarcoplasmic reticulum Ca(2+)-ATPase by dithiothreitol causes inhibition of phosphoenzyme isomerization in catalytic cycle. This reduction requires binding of both purine nucleotide and Ca2+ to enzyme. J Biol Chem, 1994. 269(15): p. 11060-11064.
6. Zapun, A., D. Missiakas, S. Raina, and T.E. Creighton, Structural and
functional characterization of DsbC, a protein involved in disulfide bond formation in Escherichia coli. Biochemistry, 1995. 34(15): p. 5075-5089.
7. Eichler, J., D.I. Kreimer, L. Varon, I. Silman, and L. Weiner, A
"molten globule" of Torpedo acetylcholinesterase undergoes thiol-disulfide exchange. J Biol Chem, 1994. 269(48): p. 30093-30096.
8. Manning, M.C., K. Patel, and R.T. Borchardt, Stability of protein
pharmaceuticals. Pharm Res, 1989. 6(11): p. 903-918.
Chapter 3 Potential of capillary electrophoresis
104
9. Powell, M.F., Peptide Stability in Aqueous Parenteral Formulations. In: Cleland, J.L., Langer, R. (Eds.), Formulation and Delivery of Proteins and Peptides. American Chemical Society, Washington DC,, 1994: p. 100-117.
10. Poelstra, K., W.W. Bakker, P.A. Klok, M.J. Hardonk, and D.K.
Meijer, A physiologic function for alkaline phosphatase: endotoxin detoxification. Lab Invest, 1997. 76(3): p. 319-327.
11. Gottlieb, A.J. and H.H. Sussman, Human placental alkaline
phosphatase: molecular weight and subunit structure. Biochim Biophys Acta, 1968. 160(2): p. 167-171.
12. Greene, P.J. and H.H. Sussman, Structual comparison of ectopic and
normal placental alkaline phosphatase. Proc Natl Acad Sci U S A, 1973. 70(10): p. 2936-2940.
13. Eriksson, H.J., G.W. Somsen, W.L. Hinrichs, H.W. Frijlink, and G.J.
de Jong, Characterization of human placental alkaline phosphatase by activity and protein assays, capillary electrophoresis and matrix-assisted laser desorption/ionization time-of-flight mass spectrometry. J Chromatogr, 2001. 755(1-2): p. 311-319.
14. Verzola, B., C. Gelfi, and P.G. Righetti, Protein adsorption to the bare
silica wall in capillary electrophoresis quantitative study on the chemical composition of the background electrolyte for minimising the phenomenon. J Chromatogr A, 2000. 868(1): p. 85-99.
15. Harkness, E.R., Studies on human placental alkaline phosphatase. I.
Purification and crystallization. Arch Biochem Biophys, 1968. 126(2): p. 503-512.
16. Neale, F.C., J.S. Clubb, D. Hotchkis, and S. Posen, Heat stability of
human placental alkaline phosphatase. J Clin Path, 1965. 18: p. 359-363. 17. Schlesinger, M.J. and K. Barrett, The reversible dissociation of the
alkaline phosphatase of Escherichia coli. I. Formation and reactivation of subunits. J Biol Chem, 1965. 240(11): p. 4284-4292.

Potential of capillary electrophoresis Chapter 3
105
18. Hiwada, K. and E.D. Wachsmuth, Catalytic properties of alkaline phosphatase from pig kidney. Biochem J, 1974. 141(1): p. 283-291.
19. Hofstee, B.H.J., Alkaline phosphatase. I. Mechanism of action of Zn, Mg,
Glycine, Versene and hydrogen ions. Archives of biochemistry and biophysics, 1955. 59: p. 352-365.
20. Hinrichs, W.L., M.G. Prinsen, and H.W. Frijlink, Inulin glasses for the
stabilization of therapeutic proteins. Int J Pharm, 2001. 215(1-2): p. 163-174.
21. Jordan, G.M., S. Yoshioka, and T. Terao, The aggregation of bovine
serum albumin in solution and in the solid state. J Pharm Pharmacol, 1994. 46(3): p. 182-185.

Chapter 3 Potential of capillary electrophoresis
106

Feasibility of non-volatile buffers Chapter 4
107
Chapter 4
Feasibility of non-volatile buffers in capillary electrophoresis-electrospray ionization
mass spectrometry of proteins
H.J.C. Eriksson, R. Mol, G.W. Somsen, W.L.J. Hinrichs, H.W. Frijlink, G.J. de Jong. Electrophoresis, 2004. 25: p. 43-49.
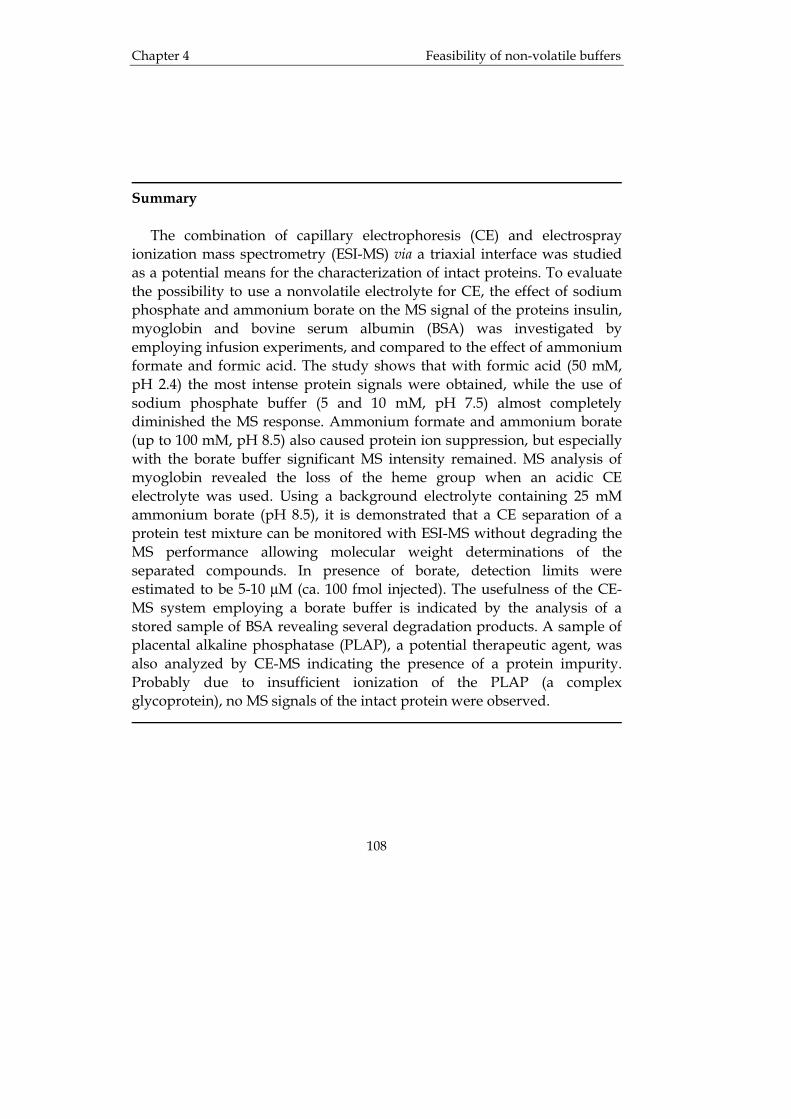
Chapter 4 Feasibility of non-volatile buffers
108
Summary The combination of capillary electrophoresis (CE) and electrospray ionization mass spectrometry (ESI-MS) via a triaxial interface was studied as a potential means for the characterization of intact proteins. To evaluate the possibility to use a nonvolatile electrolyte for CE, the effect of sodium phosphate and ammonium borate on the MS signal of the proteins insulin, myoglobin and bovine serum albumin (BSA) was investigated by employing infusion experiments, and compared to the effect of ammonium formate and formic acid. The study shows that with formic acid (50 mM, pH 2.4) the most intense protein signals were obtained, while the use of sodium phosphate buffer (5 and 10 mM, pH 7.5) almost completely diminished the MS response. Ammonium formate and ammonium borate (up to 100 mM, pH 8.5) also caused protein ion suppression, but especially with the borate buffer significant MS intensity remained. MS analysis of myoglobin revealed the loss of the heme group when an acidic CE electrolyte was used. Using a background electrolyte containing 25 mM ammonium borate (pH 8.5), it is demonstrated that a CE separation of a protein test mixture can be monitored with ESI-MS without degrading the MS performance allowing molecular weight determinations of the separated compounds. In presence of borate, detection limits were estimated to be 5-10 µM (ca. 100 fmol injected). The usefulness of the CE-MS system employing a borate buffer is indicated by the analysis of a stored sample of BSA revealing several degradation products. A sample of placental alkaline phosphatase (PLAP), a potential therapeutic agent, was also analyzed by CE-MS indicating the presence of a protein impurity. Probably due to insufficient ionization of the PLAP (a complex glycoprotein), no MS signals of the intact protein were observed.
Feasibility of non-volatile buffers Chapter 4
109
4.1 Introduction Quite a number of separation techniques have been used to monitor purity and stability of proteins. For example, size-exclusion chromatography (SEC), ion-exchange liquid chromatography (IEC), slab-gel electrophoresis, and reversed-phase liquid chromatography (RP-LC) are routinely applied to monitor changes in size, charge and hydrophobicity of proteins [1-8]. Over the last years, capillary electrophoresis (CE) has enriched the arsenal of protein analysis [9] by providing an efficient alternative to traditional and laborious slab-gel techniques. In addition, CE provides a charge-based mode of separation that often is complementary to the chromatographic techniques heavily used in analytical biotechnology. Presently, CE has become an accepted technique for the analysis of proteins [10-12] such as recombinant insulin [13, 14], erythropoietin [15, 16], and immunoglobulins [17]. CE can be highly useful for efficiently analyzing the differences and charge heterogeneity of intact proteins that might be difficult to assess with LC techniques. Mass spectrometry (MS) nowadays is an important and powerful tool for the analysis and characterization of proteins [18, 19]. The multiple charging of proteins observed in electrospray ionization (ESI) allows their analysis on MS instruments with mass ranges far below the molecular masses of the proteins. MS detection can considerably enhance the utility of CE by providing information about the identity of the separated compounds. In purity and stability studies the availability of MS data is highly desirable. Characterization of peaks by molecular mass strongly adds to the reliability and is very helpful when conditions are changed and cross correlations have to be made. Therefore, for quality control, e.g., when changes in proteins during storage or exposure are monitored, CE-MS would be an attractive approach. CE-ESI-MS analysis of (test) mixtures of intact proteins such as insulin, cytochrome c, lysozyme and lactoglobulins has been reported [20-23]. In most of these cases, for CE volatile electrolyte systems at relatively low concentrations were used. However, optimum CE performance often requires nonvolatile electrolytes at considerable concentrations. In the present study, the possibility of directly introducing non-volatile buffer into the mass spectrometer is studied using a triaxial ESI interface. Using three proteins of different molecular weight as test proteins, viz. insulin, myoglobin and bovine serum albumin (BSA), the influence of

Chapter 4 Feasibility of non-volatile buffers
110
several background electrolytes on the intensity and character of the resulting mass spectra, and the CE-ESI-MS performance is studied. The analysis of degraded BSA with CE-ESI-MS using a non-volatile background electrolyte is investigated. Finally, attempts are made to analyze samples of placental alkaline phosphatase, a potential therapeutic [24], with the CE-ESI-MS system. 4.2 Materials and methods Materials Sodium hydroxide, phosphoric acid, methanol, sodium dihydrogen phosphate, disodium hydrogen phosphate, ammonium hydroxide, formic acid, and acetic acid were from Merck (Darmstadt, Germany), and boric acid, and ammonium formate were from Fluka (Zwijndrecht, The Netherlands). Myoglobin from horse heart, bovine serum albumin and human placental alkaline phosphatase were from Sigma (St. Louis, MO, USA). Insulin (Actrapid) was from Novo Nordisk A/S (Bagsvaerd, Denmark). Deionized water was filtered and degassed before use. The electrolytes studied were 50 mM formic acid (pH 2.4), 5 and 10 mM sodium phosphate (pH 7.5), 10-100 mM ammonium borate (pH 8.5), and 10-100 mM ammonium formate (pH 8.5). The ammonium formate and borate buffers were brought to pH by adding ammonium hydroxide (25%), while the pH of the phosphate buffer was adjusted with either 1M NaOH or 1M phosphoric acid. For the infusion experiments, 100 µM solutions of insulin, myoglobin and BSA, respectively, were prepared in each electrolyte and water. A test mixture of insulin, myoglobin and BSA (~50 µM each), and a solution of placental alkaline phosphatase (~50 µM) were prepared in water. CE system For CE-ESI-MS a PrinCE CE system (Prince Technologies, Emmen, The Netherlands) equipped with a 75 µm I.D. fused-silica capillary of 75 cm was used. The capillaries were from Composite Metal Services (The Chase, Hallow, UK) and flushed with 0.1 M sodium hydroxide and water (each 30 min at 1000 mbar) before use. Prior to every CE analysis the capillary was flushed with fresh background electrolyte for 1 min at 1000 mbar. Hydrodynamic injection of sample was performed at 35 mbar for
Feasibility of non-volatile buffers Chapter 4
111
6 seconds, and CE was performed at a potential of 30 kV while applying an underpressure of typically 35 mbar to the capillary inlet (for reason, see Results and Discussion). During infusion experiments, the sample solution under study was led continuously from the inlet vial through the capillary to the ESI interface at a flow rate of approximately 400 nl/min. MS system MS experiments were carried out on an Agilent 1100 Series LC/MSD-SL ion-trap mass spectrometer (Agilent Technologies, Waldbronn, Germany) operated in the positive ion mode and equipped with an ESI source. CE-ESI-MS was performed using a triaxial interface from Agilent in which capillary effluent is mixed with sheath liquid (5 µl/min) and nebulized by nitrogen gas (pressure, 15 p.s.i.). The sheath liquid was water-acetonitrile-formic acid (50:50:1, v/v/v) or water-methanol-acetic acid (50:50:1, v/v/v), and was supplied by a syringe pump. Drying gas temperature and flow rate was set at 150 °C and 4 L/min, respectively. The electrospray voltage was 5.0 kV and the mass spectrometer was operated in full scan mode (range, 800-2200 m/z) and three scans were averaged for one spectrum. The ion accumulation time was automatically adjusted using the Ion-Charge-Control option of the instrument. The MS settings, such as capillary exit, skimmer and lens voltages, were optimized and tuned by instrument and data acquisition software during infusion of a 50 µM solution of insulin. 4.3 Results and discussion Infusion experiments The influence of various electrolytes on the MS signal of the test proteins was determined by infusion of sample solutions into the ion trap mass spectrometer. In order to mimic CE-ESI-MS conditions as much as possible, the protein solutions in each respective electrolyte were led through the CE capillary to the ESI interface in which the capillary effluent is merged with sheath liquid prior to nebulization. The underpressure caused by the nebulizing gas at the capillary outlet causes a flow through the capillary similar in rate to a common electroosmotic flow (EOF). No separation voltage was applied in this instance because it would have led to different
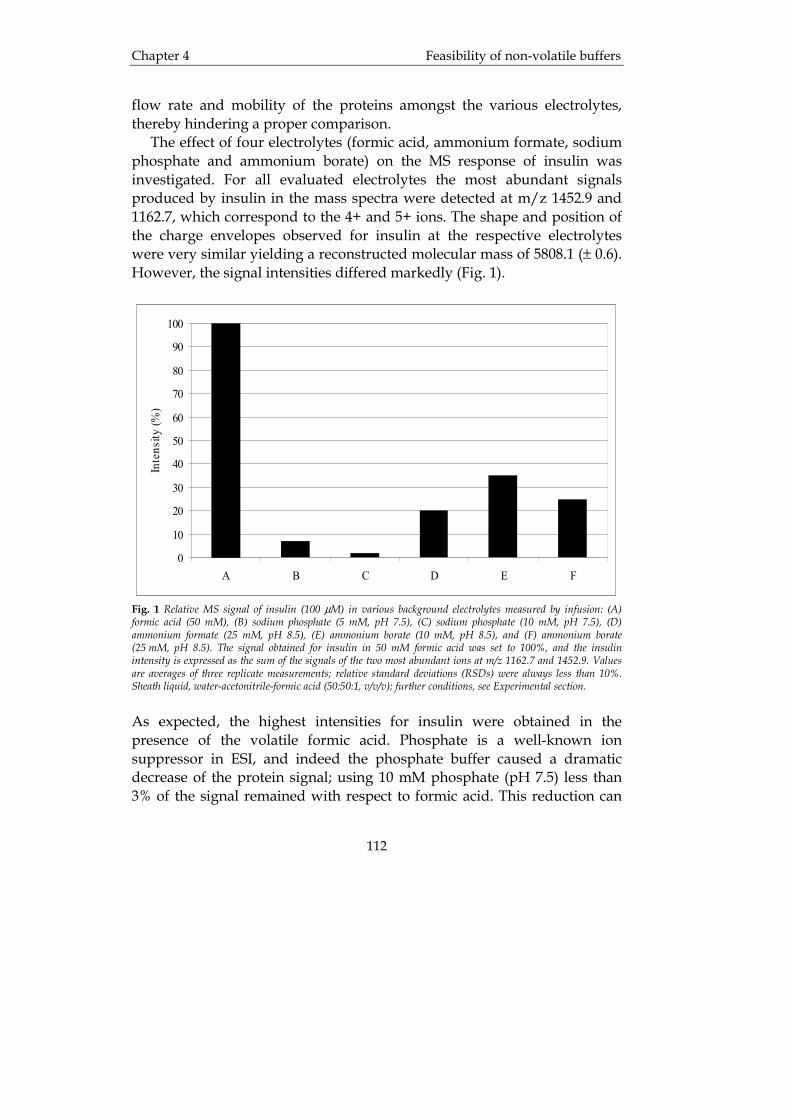
Chapter 4 Feasibility of non-volatile buffers
112
flow rate and mobility of the proteins amongst the various electrolytes, thereby hindering a proper comparison. The effect of four electrolytes (formic acid, ammonium formate, sodium phosphate and ammonium borate) on the MS response of insulin was investigated. For all evaluated electrolytes the most abundant signals produced by insulin in the mass spectra were detected at m/z 1452.9 and 1162.7, which correspond to the 4+ and 5+ ions. The shape and position of the charge envelopes observed for insulin at the respective electrolytes were very similar yielding a reconstructed molecular mass of 5808.1 (± 0.6). However, the signal intensities differed markedly (Fig. 1).
0
10
20
30
40
50
60
70
80
90
100
A B C D E F
Inte
nsity
(%)
Fig. 1 Relative MS signal of insulin (100 µM) in various background electrolytes measured by infusion: (A) formic acid (50 mM), (B) sodium phosphate (5 mM, pH 7.5), (C) sodium phosphate (10 mM, pH 7.5), (D) ammonium formate (25 mM, pH 8.5), (E) ammonium borate (10 mM, pH 8.5), and (F) ammonium borate (25 mM, pH 8.5). The signal obtained for insulin in 50 mM formic acid was set to 100%, and the insulin intensity is expressed as the sum of the signals of the two most abundant ions at m/z 1162.7 and 1452.9. Values are averages of three replicate measurements; relative standard deviations (RSDs) were always less than 10%. Sheath liquid, water-acetonitrile-formic acid (50:50:1, v/v/v); further conditions, see Experimental section.
As expected, the highest intensities for insulin were obtained in the presence of the volatile formic acid. Phosphate is a well-known ion suppressor in ESI, and indeed the phosphate buffer caused a dramatic decrease of the protein signal; using 10 mM phosphate (pH 7.5) less than 3% of the signal remained with respect to formic acid. This reduction can
Feasibility of non-volatile buffers Chapter 4
113
be fully attributed to ion suppression effects, and not to source fouling as the intensity was restored when the insulin solution in formic acid was measured again. When applying an insulin solution in 25 mM ammonium formate (pH 8.5), the observed signal was considerably higher than with phosphate, although still about five times lower than for formic acid. Ammonium borate buffer (25 mM, pH 8.5) also led to a decrease of the insulin signal but it should be noted the MS signal was still significant and could be measured reliably. Somewhat surprisingly, the intensity for insulin in the presence of the nonvolatile borate was even stronger than the signal found for the same concentration in ammonium formate (Fig. 1). For all electrolyte systems studied no increased background signals or noise were observed. The buffer ions and their clusters typically exhibit m/z values below 600 and are therefore not detected in the applied scan range (m/z 800-2200). The influence of the various electrolytes on the MS response of myoglobin (100 µM) was also studied by infusion of the respective solutions into the mass spectrometer via the triaxial interface. In general the effect of the electrolytes on the signal intensity of myoglobin was quite the same as observed for insulin. Phosphate buffer (5 and 10 mM) almost fully diminished the myoglobin signal and no clear charge envelope could be observed. Much better results were obtained for myoglobin in ammonium formate and ammonium borate showing a quite symmetric charge distribution with the most abundant signal at m/z 1598.1. Again the signal suppressing effect of the buffer was more pronounced for ammonium formate than for ammonium borate. For example, addition of 25 mM ammonium formate yielded a decrease of 73% of the total signal intensity of myoglobin (accumulation of intensities of ten most abundant ions), whereas for 25 mM ammonium borate only 20% reduction of the signal was observed. Over the range of 0-100 mM ammonium borate, the protein signal decreased from 100 to 37% in a linear fashion, so even in the presence of 100 mM of this buffer significant protein-ion intensities could still be measured. As could be expected, highly intense spectra were obtained for myoglobin dissolved in 50 mM formic acid (pH 2.4), but quite remarkably, a clearly different charge envelope was found when compared to myoglobin in ammonium borate (Fig. 2).

Chapter 4 Feasibility of non-volatile buffers
114
m / z6 0 0 8 0 0 1 0 0 0 1 2 0 0 1 4 0 0 1 6 0 0 1 8 0 0 2 0 0 0 2 2 0 0
Rel
ativ
e in
tens
ity (%
)
0
2 0
4 0
6 0
8 0
1 0 0
1 2 0
1 5 9 8 .1
1 7 5 7 .7
1 9 5 3 .1
1 4 6 5 .1
1 3 5 2 .61 2 5 6 .1
A
m / z6 0 0 8 0 0 1 0 0 0 1 2 0 0 1 4 0 0 1 6 0 0 1 8 0 0 2 0 0 0 2 2 0 0
Rel
ativ
e in
tens
ity (%
)
0
2 0
4 0
6 0
8 0
1 0 0
1 2 0
1 2 1 2 .0
1 3 0 5 .1
1 4 1 3 .8
1 5 4 2 .2
1 1 3 1 .3
1 0 6 0 .8
9 9 8 .5
B
Fig. 2 Mass spectra of myoglobin (100 µM) in (A) 25 mM ammonium borate (pH 8.5) and (B) 50 mM formic acid (pH 2.4) acquired during infusion. Sheath liquid, water-methanol-acetic acid (50:50:1, v/v/v); further conditions, see Experimental section. In formic acid the centre of the charge distribution (most abundant ion now at m/z 1212.0) as well as the m/z positions of all protein ions were shifted. The shift of observed m/z values towards lower values indicates more charging of the protein. This could be an effect of unfolding of the protein, which would expose additional ionizable groups and thus lead to higher ionization. Based on the obtained spectra, the molecular mass of the
Feasibility of non-volatile buffers Chapter 4
115
analyzed protein in formic acid was calculated to be 16 955.0 (±1.7), where-as a molecular mass of 17 569.2 (±1.6) was found for myoglobin in ammo-nium borate (using the positions of the most abundant ions), a difference of 616 Da. We presume that this discrepancy originates from the heme group of myoglobin, which is not covalently bound to the protein and may be lost under acidic conditions [25-28]. Closer inspection of the mass spectrum of myoglobin obtained in ammonium borate at pH 8.5 (Fig. 2A) shows that also signals of myoglobin without the heme moiety are found, but at relatively low intensity. Possibly, the acidic sheath liquid may cause some detachment of the heme group, but apparently the contact time is too short to result in a full loss of the heme as occurs when myoglobin is dissolved in formic acid prior to MS analysis (Fig. 2B). The influence of various electrolytes on the ESI-MS performance of BSA (100 µM) was essentially in line with results obtained for the other proteins. With formic acid (50 or 100 mM, pH 2.4) a good-quality charge envelope of BSA was obtained. During infusion of BSA (100 µM) in phosphate buffer (5 and 10 mM, pH 7.5), no clearly resolved spectra could be measured. Infusion of BSA dissolved in clear ammonium borate buffer (25 and 50 mM, pH 8.5) still yielded spectra of good quality allowing the molecular mass to be measured: 66 568 (± 23). Yet, the protein signals obtained with borate were considerably lower in intensity than in the presence of formic acid (50 or 100 mM, pH 2.4). CE-MS of test proteins The infusion experiments described above indicate that it should be possible to record significant MS signals from proteins under common CE conditions, i.e. using borate as background electrolyte. In order to evaluate this, a protein test mixture consisting of insulin, myoglobin and BSA (50 µM each) was analyzed by CE-ESI-MS applying a 25 mM ammonium borate buffer (pH 8.5). As mentioned above, the nebulizing gas in the ESI interface caused an underpressure at the capillary outlet and consequently an additional flow through the capillary, which obviously is undesirable when performing CE. In an attempt to avoid this effect, an underpressure of 35 mbar was applied to the capillary inlet during CE-ESI-MS. Fig. 3A shows a typical CE-ESI-MS result of the test mixture with the proteins eluting in the order myoglobin, insulin, BSA. The proteins are well separated and can easily be detected in the total-ion-current (TIC) trace with a satisfactory signal-to-noise ratio. In full-scan mode the detection
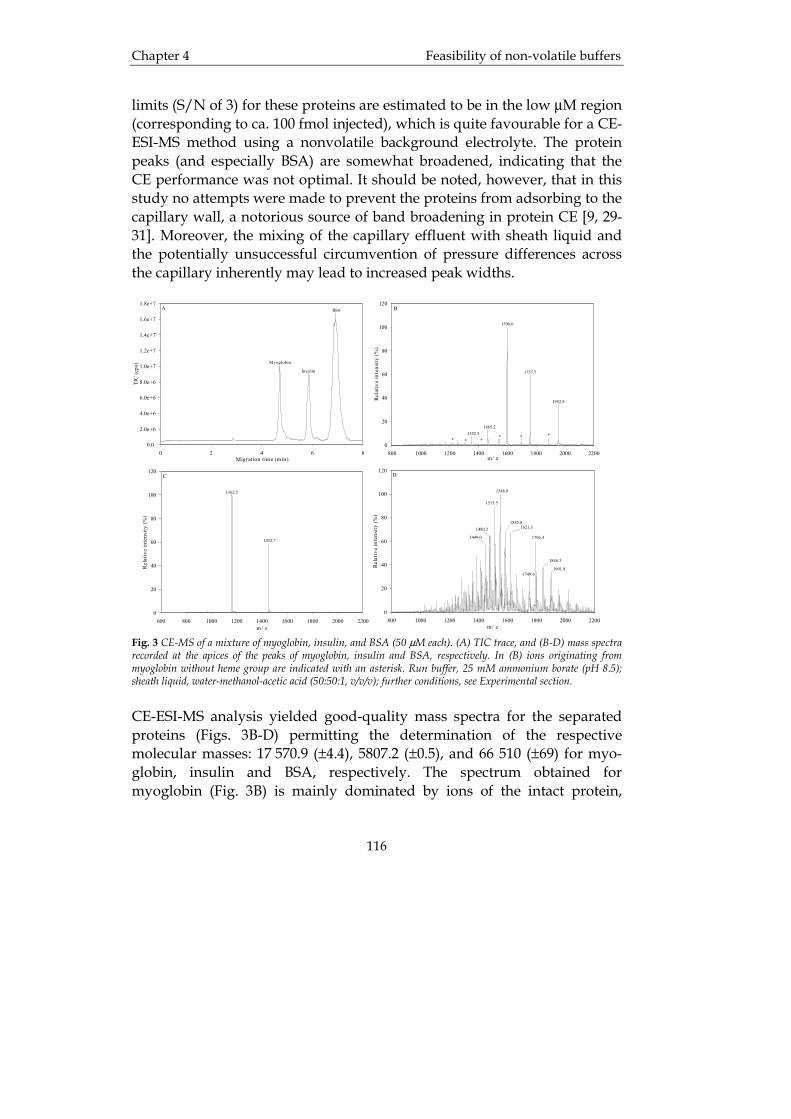
Chapter 4 Feasibility of non-volatile buffers
116
limits (S/N of 3) for these proteins are estimated to be in the low µM region (corresponding to ca. 100 fmol injected), which is quite favourable for a CE-ESI-MS method using a nonvolatile background electrolyte. The protein peaks (and especially BSA) are somewhat broadened, indicating that the CE performance was not optimal. It should be noted, however, that in this study no attempts were made to prevent the proteins from adsorbing to the capillary wall, a notorious source of band broadening in protein CE [9, 29-31]. Moreover, the mixing of the capillary effluent with sheath liquid and the potentially unsuccessful circumvention of pressure differences across the capillary inherently may lead to increased peak widths.
m/ z800 1000 1200 1400 1600 1800 2000 2200
Rela
tive
inte
nsity
(%)
0
20
40
60
80
100
120D
1548.9
1513.5
1480.2
1449.0
1585.81621.3
1749.6
1796.4
1846.3
1901.8
m/ z600 800 1000 1200 1400 1600 1800 2000 2200
Rel
ativ
e in
tens
ity (%
)
0
20
40
60
80
100
120C
1452.7
1162.5
m/ z800 1000 1200 1400 1600 1800 2000 2200
Rel
ativ
e in
tens
ity (%
)
0
20
40
60
80
100
120
******
1598.0
1757.7
1952.8
1465.21352.5
B
Migration time (min)0 2 4 6 8
TIC
(cps
)
0.0
2.0e+6
4.0e+6
6.0e+6
8.0e+6
1.0e+7
1.2e+7
1.4e+7
1.6e+7
1.8e+7A
Myoglobin
Insulin
BSA
m/ z800 1000 1200 1400 1600 1800 2000 2200
Rela
tive
inte
nsity
(%)
0
20
40
60
80
100
120D
1548.9
1513.5
1480.2
1449.0
1585.81621.3
1749.6
1796.4
1846.3
1901.8
m/ z600 800 1000 1200 1400 1600 1800 2000 2200
Rel
ativ
e in
tens
ity (%
)
0
20
40
60
80
100
120C
1452.7
1162.5
m/ z800 1000 1200 1400 1600 1800 2000 2200
Rel
ativ
e in
tens
ity (%
)
0
20
40
60
80
100
120
******
1598.0
1757.7
1952.8
1465.21352.5
B
Migration time (min)0 2 4 6 8
TIC
(cps
)
0.0
2.0e+6
4.0e+6
6.0e+6
8.0e+6
1.0e+7
1.2e+7
1.4e+7
1.6e+7
1.8e+7A
Myoglobin
Insulin
BSA
Fig. 3 CE-MS of a mixture of myoglobin, insulin, and BSA (50 µM each). (A) TIC trace, and (B-D) mass spectra recorded at the apices of the peaks of myoglobin, insulin and BSA, respectively. In (B) ions originating from myoglobin without heme group are indicated with an asterisk. Run buffer, 25 mM ammonium borate (pH 8.5); sheath liquid, water-methanol-acetic acid (50:50:1, v/v/v); further conditions, see Experimental section. CE-ESI-MS analysis yielded good-quality mass spectra for the separated proteins (Figs. 3B-D) permitting the determination of the respective molecular masses: 17 570.9 (±4.4), 5807.2 (±0.5), and 66 510 (±69) for myo-globin, insulin and BSA, respectively. The spectrum obtained for myoglobin (Fig. 3B) is mainly dominated by ions of the intact protein,
Feasibility of non-volatile buffers Chapter 4
117
although some weak signals of myoglobin without the heme group can be discerned in the spectrum (cf. Fig. 2A). CE-ESI-MS analysis of BSA (about 50 µM in water) that had been stored for two weeks at ambient conditions revealed several new peaks next to BSA, indicating degradation of the protein. In other words, the developed CE-MS method could be potentially useful in the stability monitoring of proteins. CE-ESI-MS of alkaline phosphatase Alkaline phosphatase is a promising agent for the treatment of sepsis [24] and recently it has been demonstrated that CE with UV absorbance detection can be useful in the assessment of the purity and stability of this dimeric protein (monomer molecular mass, about 58 kDa) [32, 33]. Clearly, it would be advantageous to have additional mass information on the CE separated species as well. To check the feasibility of this, a commercially available sample of placental alkaline phosphatase (PLAP) was analyzed with the developed CE-ESI-MS system using ammonium borate as background electrolyte. The result shows an electropherogram with a broad hump followed by a rather sharp peak with a shoulder (Fig. 4A). In a previous study with CE-UV [32] a shouldered peak was also found, but the hump was not detected. Unfortunately, the mass spectra acquired in the 5-7 min region (i.e. under the broad band) appeared to be rather featureless and hard to interpret. In contrast, for the PLAP peak at 7.2 min a distinct ion pattern was observed in the acquired mass spectrum (Fig. 4B).

Chapter 4 Feasibility of non-volatile buffers
118
Time (min)0 2 4 6 8 10 12 14
Inte
nsity
(cps
)
0
1e+6
2e+6
3e+6
4e+6
5e+6A
m/ z800 1000 1200 1400 1600 1800 2000 2200
Rel
ativ
e in
tens
ity (%
)
0
20
40
60
80
100
120B
1200.5
1120.6
1865.5
1680.0
1527.9
1400.3
1292.7
Fig. 4 CE-MS of PLAP (50 µM). (A) TIC trace, and (B) mass spectrum recorded at the apex of peak at 7.2 min. Experimental conditions: see Fig. 3. Oddly, the molecular mass that was derived from the positions of the most intense ions in this spectrum was 16 792 Da, and not about 58 000 Da as should be expected for the PLAP monomer. Moreover, considering the injected amount of protein, the absolute intensity of the observed signals was relatively low indicating that the actual intact protein has not been detected. Direct ESI-MS analysis of the PLAP sample by infusion also yielded a spectrum quite similar to Fig. 4B without any signals of native

Feasibility of non-volatile buffers Chapter 4
119
PLAP. An enzymatic activity assay on the sample, on the other hand, indicated that PLAP was actually present in the expected amounts. Moreover, gel electrophoresis previously carried out on the PLAP revealed a band at the appropriate molecular weight. Therefore, we presume that during CE-ESI-MS only an impurity present in the PLAP sample is detected. The determined mass of 16.8 kDa corresponds with the molecular weight of Interferon-γ which indeed can be present in human placenta [34]. The absence of a PLAP signal in the mass spectrum might be caused by the fact the ionization of PLAP, like for other glycoproteins [35], is troublesome and incomplete so that the resulting ions are outside the range of the mass spectrometer and consequently not detected. Earlier attempts to analyze this commercial PLAP by MALDI-TOF-MS were also not successful, although for a sample of in-house purified PLAP a good MALDI-TOF spectrum was obtained indicating a protein monomer mass of about 58 100 Da [35]. ESI-MS analysis of this purified PLAP, however, did not yield a proper spectrum. Further strategies to improve the susceptibility of PLAP for MS detection include deglycosylation prior to MS analysis and tryptic digestion followed by MS analysis of the produced peptides. 4.5 Concluding remarks The influence of some nonvolatile electrolytes on the analysis of proteins by CE-ESI-MS was evaluated. It was found by infusion experiments that sodium phosphate strongly suppressed the MS signals of the proteins yielding no interpretable spectra. However, when ammonium borate buffer was used satisfactory MS intensities for the proteins could be achieved allowing reliable molecular weight determinations on the basis of the recorded charge envelopes. For a background electrolyte containing 25 mM ammonium borate, detection limits of about 100 fmol were found for the proteins. Analysis of a degraded BSA sample indicated that CE-ESI-MS using non-volatile background electrolyte can be employed for the study of the stability of (therapeutic) proteins, although the ionization of glycoproteins might be troublesome. Generally, it can be concluded that the use of nonvolatile electrolytes as ammonium borate for CE-MS is possible. Further research includes the long-term stability of the ESI interface while employing nonvolatile buffer, and a more in-depth evaluation of the influence of these buffers on the

Chapter 4 Feasibility of non-volatile buffers
120
character of the charge envelope of different proteins. On the CE side, we are now evaluating the usefulness of some charged polymers for noncovalently coating the inner wall of the capillary in order to improve the CE performance of proteins, and we will also test the applicability of these coatings in combination with MS detection. We are also interested in investigating whether the application of nonvolatile buffers is feasible in CE-MS with sheathless interfacing.
Feasibility of non-volatile buffers Chapter 4
121
4.6 References 1. Manning, M.C., K. Patel, and R.T. Borchardt, Stability of protein
pharmaceuticals. Pharm Res, 1989. 6(11): p. 903-918. 2. Arroyo-Reyna, A. and A. Hernandez-Arana, The thermal denaturation
of stem bromelain is consistent with an irreversible two-state model. Biochim Biophys Acta, 1995. 1248(2): p. 123-128.
3. Daiho, T. and T. Kanazawa, Reduction of disulfide bonds in sarcoplasmic
reticulum Ca(2+)-ATPase by dithiothreitol causes inhibition of phosphoenzyme isomerization in catalytic cycle. This reduction requires binding of both purine nucleotide and Ca2+ to enzyme. J Biol Chem, 1994. 269(15): p. 11060-11064.
4. Eichler, J., D.I. Kreimer, L. Varon, I. Silman, and L. Weiner, A "molten
globule" of Torpedo acetylcholinesterase undergoes thiol-disulfide exchange. J Biol Chem, 1994. 269(48): p. 30093-30096.
5. Uversky, V.N., Use of fast protein size-exclusion liquid chromatography to
study the unfolding of proteins which denature through the molten globule. Biochemistry, 1993. 32(48): p. 13288-13298.
6. Zapun, A., D. Missiakas, S. Raina, and T.E. Creighton, Structural and
functional characterization of DsbC, a protein involved in disulfide bond formation in Escherichia coli. Biochemistry, 1995. 34(15): p. 5075-5089.
7. Powell, M.F., Peptide Stability in Aqueous Parenteral Formulations. In:
Cleland, J.L., Langer, R. (Eds.), Formulation and Delivery of Proteins and Peptides. Am Chem Soc, Washington DC,, 1994: p. 100-117.
8. Davio, S.R., K.M. Kienle, and B.E. Collins, Interdomain interactions in
the chimeric protein toxin sCD4(178)-PE40: a differential scanning calorimetry (DSC) study. Pharm Res, 1995. 12(5): p. 642-648.
9. Dolnik, V. and K.M. Hutterer, Capillary electrophoresis of proteins 1999-
2001. Electrophoresis, 2001. 22(19): p. 4163-4178.
Chapter 4 Feasibility of non-volatile buffers
122
10. Lagu, A.L., Applications of capillary electrophoresis in biotechnology. Electrophoresis, 1999. 20(15-16): p. 3145-3155.
11. Patrick, J.S. and A.L. Lagu, Review applications of capillary
electrophoresis to the analysis of biotechnology-derived therapeutic proteins. Electrophoresis, 2001. 22(19): p. 4179-4196.
12. Ma, S. and W. Nashabeh, Analysis of protein therapeutics by capillary
electrophoresis. Chromatographia, 2001. 53(Supplement): p. S75-89. 13. Lookabaugh, M., M. Biswas, and I.S. Krull, Quantitation of insulin
injection by high-performance liquid chromatography and high-performance capillary electrophoresis. J Chromatogr, 1991. 549(1-2): p. 357-366.
14. Tong, W. and E.S. Yeung, Determination of insulin in single pancreatic
cells by capillary electrophoresis and laser-induced native fluorescence. J Chromatogr, 1996. 685(1): p. 35-40.
15. Cifuentes, A., M.V. Moreno-Arribas, M. de Frutos, and J.C. Diez-
Masa, Capillary isoelectric focusing of erythropoietin glycoforms and its comparison with flat-bed isoelectric focusing and capillary zone electrophoresis. J Chromatogr, 1999. 830(2): p. 453-463.
16. Watson, E. and F. Yao, Capillary electrophoretic separation of human
recombinant erythropoietin (r-HuEPO) glycoforms. Anal Biochem, 1993. 210(2): p. 389-393.
17. Tang, S., D.P. Nesta, L.R. Maneri, and K.R. Anumula, A method for
routine analysis of recombinant immunoglobulins (rIgGs) by capillary isoelectric focusing (cIEF). J Pharm Biomed Anal, 1999. 19(3-4): p. 569-583.
18. Jonsson, A.P., Mass spectrometry for protein and peptide characterisation.
Cell Mol Life Sci, 2001. 58(7): p. 868-884. 19. Mano, N. and J. Goto, Biomedical and biological mass spectrometry. Anal
Sci, 2003. 19(1): p. 3-14.

Feasibility of non-volatile buffers Chapter 4
123
20. Huber, C.G., A. Premstaller, and G. Kleindienst, Evaluation of volatile eluents and electrolytes for high-performance liquid chromatography-electrospray ionization mass spectrometry and capillary electrophoresis-electrospray ionization mass spectrometry of proteins. II. Capillary electrophoresis. J Chromatogr, 1999. 849(1): p. 175-189.
21. Deterding, L.J., C.E. Parker, and J.R. Perkins, Capillary liquid
chromatography-mass spectrometry and capillary zone electrophoresis-mass spectrometry for the determination of peptides and proteins. J Chromatogr, 1991. 554: p. 329-338.
22. Bonfichi, R., C. Sottani, L. Colombo, J.E. Coutant, E. Riva, and D.
Zanette, Preliminary investigation of glycosylated proteins by capillary electrophoresis and capillary electrophoresis/mass spectrometry using electrospray ionization and by matrix-assisted laser desorption ionization/time-to-flight mass spectrometry. Rapid Commun Mass Spectrom, 1995. Spec: p. S95-106.
23. McComb, M.E., A.N. Krutchinsky, W. Ens, K.G. Standing, and H.
Perreault, Sensitive high-resolution analysis of biological molecules by capillary zone electrophoresis coupled with reflecting time-of-flight mass spectrometry. J Chromatogr, 1998. 800(1): p. 1-11.
24. Poelstra, K., W.W. Bakker, P.A. Klok, M.J. Hardonk, and D.K. Meijer,
A physiologic function for alkaline phosphatase: endotoxin detoxification. Lab Invest, 1997. 76(3): p. 319-327.
25. Covey, T.R., R.F. Bonner, B.I. Shushan, and J. Henion, The
determination of protein, oligonucleotide and peptide molecular weights by ion-spray mass spectrometry. Rapid Commun Mass Spectrom, 1988. 2(11): p. 249-256.
26. Katta, V. and B.T. Chait, Observation of the heme-globin complex in native
myoglobin by electrospray-ionization mass spectrometry. J Am Chem Soc, 1991. 113: p. 8534-8535.
Chapter 4 Feasibility of non-volatile buffers
124
27. Schmidt, A. and M. Karas, The influence of electrostatic interactions on the detection of heme-globin complexes in ESI-MS. J Am Soc Mass Spectrom, 2001. 12: p. 1092-1098.
28. Smith, R.D., H.R. Udseth, C.J. Barinaga, and C.G. Edmonds,
Instrumentation for high-performance capillary electrophoresis-mass spectrometry. J Chromatogr, 1991. 559: p. 197-208.
29. Verzola, B., C. Gelfi, and P.G. Righetti, Protein adsorption to the bare
silica wall in capillary electrophoresis quantitative study on the chemical composition of the background electrolyte for minimising the phenomenon. J Chromatogr, 2000. 868(1): p. 85-99.
30. Verzola, B., C. Gelfi, and P.G. Righetti, Quantitative studies on the
adsorption of proteins to the bare silica wall in capillary electrophoresis. II. Effects of adsorbed, neutral polymers on quenching the interaction. J Chromatogr, 2000. 874(2): p. 293-303.
31. Castelletti, L., B. Verzola, C. Gelfi, A. Stoyanov, and P.G. Righetti,
Quantitative studies on the adsorption of proteins to the bare silica wall in capillary electrophoresis III: Effects of adsorbed surfactants on quenching the interaction. J Chromatogr, 2000. 894: p. 281-289.
32. Eriksson, H.J., G.W. Somsen, W.L. Hinrichs, H.W. Frijlink, and G.J. de
Jong, Characterization of human placental alkaline phosphatase by activity and protein assays, capillary electrophoresis and matrix-assisted laser desorption/ionization time-of-flight mass spectrometry. J Chromatogr, 2001. 755(1-2): p. 311-319.
33. Eriksson, H.J.C., M. Wijngaard, W.L.J. Hinrichs, H.W. Frijlink, G.W.
Somsen, and G.J. de Jong, Potential of capillary zone electrophoresis for the monitoring of the stability of placental alkaline phosphatase. J Pharm Biomed Anal, 2003. 31: p. 351-357.
34. von Rango, U., I. Classen-Linke, G. Raven, F. Bocken, and H.M. Beier,
Cytokine microenvironments in human first trimester decidua are dependent on trophoblast cells. Fertil Steril, 2003. 79(5): p. 1176-1186.
Feasibility of non-volatile buffers Chapter 4
125
35. Huang, L.Q., A. Paiva, R. Bhat, and M. Wong, Characterization of large, heterogeneous proteins by electrospray ionization-mass spectrometry. J Am Soc Mass Spectrom, 1996. 7: p. 1219-1226.

Chapter 4 Feasibility of non-volatile buffers
126
The influence of various high-pH buffers Chapter 5
127
Chapter 5
Investigations into the stabilization of drugs by sugar glasses: The influence of
various high-pH buffers
H.J.C. Eriksson, W.L.J. Hinrichs, G.J. de Jong, G.W. Somsen, H.W. Frijlink. Pharm Res, 2003. 20(9): p. 1437-1443.
Chapter 5 The influence of various high-pH buffers
128
Summary The effect of the high-pH buffers ammediol, borax, CHES, TRIS and Tricine on the glass transition temperature of the freeze-concentrated fraction (Tg’) of trehalose/buffer and inulin/buffer solutions at pH 6.0 and pH 9.8 was studied. Also, the glass transition temperature (Tg) of sugar glasses obtained after freeze-drying of these solutions was elucidated. Additionally, the effect occurring during the freezing process on the pH of the various buffers was investigated. Furthermore, the stability of alkaline phosphatase (AP) incorporated in these sugar glasses prepared from solutions at pH 9.8 was evaluated. The Tg’ and Tg were measured using differential scanning calorimetry (DSC), and the change of pH during freezing was estimated by using an indicator solution added to the respective solutions. The enzymatic activity of AP after freeze-drying and storage at 60 °C was evaluated by an enzymatic activity assay. It was found that the Tg’ and Tg of the samples investigated are strongly influenced by the presence of the buffer. On freezing, only minor changes of the pH were observed. The samples with the lowest Tg and the samples containing buffers that formed complexes with the sugars showed the poorest stability of the AP. The stabilizing capacities of sugars that are currently recognized as excellent stabilizers for proteins during drying and storage can be completely lost if certain high-pH buffers such as ammediol, borax, and TRIS are used at high concentrations. Loss of stabilizing capacities can be ascribed to strong depression of the Tg’ and Tg or to complex formation.
The influence of various high-pH buffers Chapter 5
129
5.1 Introduction With the rapid developments in the field of biopharmaceutics, increasing attention is being paid to the development of protein-based drugs for the treatment of various disorders. During the formulation of such drugs it is necessary to ensure the stability of the protein in order to prevent degradation during production, storage and transportation. A suitable way to stabilize proteins is to dry a solution containing the therapeutic protein and a sugar. The stabilization of the protein is achieved by the formation of a sugar glass matrix in which the protein is enclosed. In previous studies it has been found that the disaccharide trehalose is an excellent stabilizer for proteins during freeze-drying and subsequent storage [1-8]. Recently, it was also shown that inulin, an oligosaccharide, can be used as a stabilizer of proteins during freeze-drying [9] and subsequent compaction to tablets and storage for prolonged time [10]. In those studies it was found that inulin had some advantages over trehalose as a stabilizer of alkaline phosphatase (AP). Freeze-drying of aqueous solutions of protein/sugar mixtures is generally performed in the presence of a buffer. However, the influence of buffers on the physical properties of the lyophilized samples has not been given much attention. It is generally accepted that the use of phosphate buffer should be avoided, since disodium or dipotassium monohydrogen phosphate precipitates more readily during freezing than sodium or potassium dihydrogen phosphate, which leads to a strongly decreased pH of the sample [11-13]. Such a dramatic pH drop is potentially detrimental to the stability of proteins and should be avoided. In a publication of Orii and Morita the change of pH during freezing of 30 different buffers was investigated [12]. It was, for example, found that the pH of phosphate buffers typically dropped by more than about 2 units, TRIS-HCl and Tricine buffers showed increases of less than one unit and cyclohexylaminopropanesulfonic acid buffers showed a decrease of less than one pH unit during freezing. It has been shown that by replacing succinate buffer with glycolate buffer increases the stability of lyophilized interferon-γ. It was found that monosodium succinate crystallized during freezing, which led to a sharp drop in pH. No change of the pH was found for sodium glycolate [14]. It has been found by others that when phosphate buffer pH 7.4 was frozen in presence of a cryoprotectant (sucrose or trehalose, 0.5 and 1 M), the pH dropped by only one pH unit, compared to
Chapter 5 The influence of various high-pH buffers
130
a drop of 2.4 pH units when no protectant was used [15]. An explanation for this effect was, however, not given. The stability of proteins freeze-dried with trehalose was previously found to be enhanced when the samples contained borax at a mole ratio borax/trehalose higher than 0.3 [16]. It was suggested that the reason for the increased stability was the increased Tg caused by the specific interaction between the sugar and borax. The borax ions form covalent linkages with the hydroxyl groups of the trehalose molecule. As a result, the viscosity of the solution increased, and this has been suggested to promote glass formation during freezing. It has also been found that this diol-diol complexation is affected by the pH of the solution [16]. This was also found by Pezron and co-workers, who performed 11B-NMR on glycoside-borax complexes at different pHs. It was found that below pH 7.5 no signals related to borax-diol complexes were detected [17]. Except for the study of Miller et al. [16] as mentioned above, there are to our knowledge no detailed studies published about the effects of buffers on the glass transition temperature of the freeze concentrated fraction (Tg’) and glass transition temperature (Tg) of sugar glasses. This is quite surprising because it is generally accepted that the Tg’ and the Tg play essential roles for the stabilization of proteins during drying [18] and storage [19-21], respectively. In this paper we present the results of an investigation of the influence of the high-pH buffers ammediol, borax, CHES, TRIS and Tricine, on the Tg’ of trehalose and inulin in buffer solutions and the resulting Tg of freeze-dried trehalose and inulin obtained from buffer solutions. The effect of freezing on the pH of various buffers and sugar/buffer solutions was also evaluated. Moreover, the influence of the buffers on the stability of a protein, alkaline phosphatase (AP), that was freeze-dried with trehalose or inulin was also investigated. 5.2 Experimental Materials Trehalose, alkaline phosphatase from bovine intestinal mucosa (BIAP), 2-[N-Cyclohexylamino]ethanesulfonic acid (CHES), 2-amino-2-methyl-1,3-propanediol (ammediol), 2-amino-2-(hydroxymethyl)-1,3-propanediol (TRIS), and para-nitrophenyl phosphate (pNPP) were purchased from Sigma-Aldrich (Steinheim, Germany). N-[TRIS(hydroxy-

The influence of various high-pH buffers Chapter 5
131
methyl)methyl]glycine (Tricine) was from Fluka (Buchs, Switzerland) and sodium tetraborate (borax) was from Brocacef BV (Maarssen, The Netherlands). Inulin with a number/weight average degree of polymerization (DPn/DPw) of 23/26 was a gift from Sensus (Roosendaal, The Netherlands). All other chemicals were obtained from commercial suppliers and were of analytical grade. The chemical structure of ammediol, TRIS, Tricine, and CHES, respectively, are given in Fig. 1.
HOCH2
NH2
CH3
CH2OH HOCH2
NH2
CH2OH
CH2OH
HOCH2
CH2OH
CH2OHNHCH 2COOH NHCH2CH2SO3H
Ammediol TRIS
Tricine CHES
Fig. 1 The chemical structure of the various buffers used. Freeze-drying For the investigation of the influence of buffers on the physical properties of sugar glasses of trehalose or inulin, solutions containing 10% w/v in the respective buffers (ammediol, TRIS, Tricine, CHES, typically 0.05-0.20 M, pH 9.8) were prepared. When borax was used the concentrations were 0.005-0.060 M, pH 9.8. Also, solutions with 10% w/v sugar in buffers at pH 6.0 were freeze-dried in order to evaluate the influence of pH on the Tg. To adjust to pH 9.8, 1 M NaOH was added to all buffers, except to the ammediol, which was adjusted with 1 M HCl. The solutions at pH 6.0 were prepared by addition of 1 M HCl. Before freeze-drying, the Tg’ of the sample solutions was measured (see below). Samples to investigate the influence of buffers on the stability of BIAP incorporated in sugar glasses were prepared by freeze-drying 2.5 or 10% w/v solutions of BIAP/sugar (1/4 and 1/9 w/w) in each buffer (pH 9.8, 0.05 M). Freeze-drying was performed in a Christ Alpha 1-4 freeze-dryer (Salm en Kipp, Breukelen, The Netherlands) as follows: 24 hours at a shelf temperature of -35 °C, a condenser temperature of –53 °C, and a pressure of 0.220 mbar. The pressure was then lowered to 0.050 mbar and the temperature was gradually increased to 20 °C, which was maintained for 24 hours. The dry samples were then transferred to a vacuum desiccator at room
Chapter 5 The influence of various high-pH buffers
132
temperature, where they were kept for at least 2 days. Then half of each sample containing BIAP was transferred to an oven (Termacks, Salm & Kipp B.V., Breukelen, The Netherlands) set to 60 °C for 6 days. The activities of the samples stored at room temperature and at 60 °C were evaluated. Differential scanning calorimetry The differential scanning calorimetry (DSC) thermograms of the samples were recorded using a TA Instruments DSC 2920 (TA instruments, Ghent, Belgium), which had been calibrated with indium. The instrument was equipped with a cooling device that was supplied with a stream of helium (for Tg’) or nitrogen (for Tg) throughout the measurements. The Tg’ measurements were performed by rapid cooling to -60 °C, which was held for 5 minutes, followed by heating at a rate of 20 °C/min to 40 °C. The Tg was measured by heating from 20 °C (held for two minutes) to 300 °C at a rate of 20 °C/min. For the measurement of the Tg’, sample sizes of about 60 mg were weighed into open aluminium pans, while the Tg was measured on sample sizes of about 10 mg in open aluminium pans. The Tg’ and Tg values were taken as the midpoint values of the transitions measured. DSC to determine the Tg’ of the buffers (10% w/v, except borax 5% w/v in water) were performed on a Perkin Elmer DSC 7 (Perkin Elmer, Gouda, The Netherlands). We used this DSC apparatus because it is equipped with a cooling device containing liquid nitrogen to achieve temperatures of -120 °C. The sample size was about 15 mg in sealed aluminium pans. Measurements were performed from -120 °C, which was held for 2 minutes, followed by heating to -40 °C at a rate of 10 °C/minute. Influence of freezing on the pH of the buffers Buffer solutions (2.00 ml, 0.05 M, pH 9.8) were mixed with universal indicator (20 µl). The universal indicator contained 0.02% w/v methyl red, 0.02% w/v phenolphthalein, 0.04% w/v bromthymol blue, and 0.04% w/v thymol blue in ethanol [22]. The color of the solutions before and after being frozen in liquid nitrogen was noted. Phosphate buffer (0.05 M, pH 7.3) was also investigated as a reference because the behaviour of this buffer during freezing is well documented [11-13, 23]. Also, buffers containing 10% w/v of trehalose or inulin, respectively, were frozen with indicator solution present in order to elucidate the influence of sugars on the pH of the respective buffers during freezing.
The influence of various high-pH buffers Chapter 5
133
Activity assay of alkaline phosphatase The activity of alkaline phosphatase was determined by following the enzymatic conversion of the substrate pNPP to para-nitrophenol using a modified version of the method described by Hinrichs et al. [9]. The assays were performed in 96-well microplates as follows: 160 µl of 0.05 M ammediol (pH 9.8) containing 2.2 mM MgCl2 was mixed with 20 µl sample; to this mixture 20 µl of pNPP (10 mg/ml in demineralized water) was added. The plate was then placed in a Benchmark Microplate reader (BioRad, Hercules, CA, USA) set to a temperature of 37 °C. To ensure good mixing the plate was shaken by the plate reader for 10 seconds at the start and then again after 30 min immediately before the absorbance of the samples at 405 nm was measured. A standard curve was prepared by measuring the activity of BIAP in the range 0 to 5 µg/ml. It has been reported that borax can reduce the enzymatic activity of alkaline phosphatase [24]. Therefore, in the present study, the enzymatic activity assay of borax containing samples was performed with a calibration curve generated using standard BIAP solutions containing borax. Because alkaline phosphatase is a glycoprotein, it is likely that the cause of this inhibition is the interaction between borax and the sugar groups attached to the alkaline phosphatase. 5.3 Results and discussion Effect of buffers on the Tg’ During freeze-drying of a solution containing a protein and a sugar it is important to maintain the sample temperature below the Tg’ [18]; otherwise the freeze-concentrated fraction will be in its rubbery state. In that case, the molecular mobility is high, which might lead to degradation of the protein. Also, crystallization of the sugar may occur, by which its protective action will be completely lost. In addition, freeze-drying below the Tg’ results in a porous cake, whereas a collapsed cake is obtained above the Tg’, and reconstitution of a porous cake is easier than a collapsed cake. In a previous study it has been found that the Tg’ of pure inulin is higher than that of pure trehalose [9]. In this study, it was found that, in all cases, the Tg’ of the trehalose/buffer mixtures was lower than the Tg’ of the corresponding inulin/buffer mixtures. In Fig. 2, the Tg’ of each trehalose solution at pH 9.8 is given.

Chapter 5 The influence of various high-pH buffers
134
Bu ffer / su ga r (w / w ) in sam p le0.00 0.05 0.10 0.15 0.20
Tg' (
°C)
-35
-30
-25
-20
-15
Fig. 2 The Tg’ of trehalose and inulin (10% w/v) in various buffers, pH 9.8. Inulin/Tricine (♦), Inulin/CHES (■), Inulin/TRIS (▲), Inulin/Ammediol (●), Trehalose/Tricine (◊), Trehalose/CHES (□), Trehalose/TRIS (∆), Trehalose/Ammediol (○). The data shown are the mean of two to four measurements. The standard deviation was less than 1°C in all cases.
It is evident that ammediol and TRIS have the largest influence on the Tg’, followed by Tricine and CHES; all these buffers substantially depress the Tg’ of the trehalose. Similar results were found for the inulin samples (Fig. 2). The gradual change of the Tg’ with increasing buffer/sugar ratios indicates that the composition of the freeze-concentrated fraction gradually changed. Most likely, the buffer species are incorporated together with the sugars in the freeze-concentrated fractions and form homogeneous mixtures. Ammediol and TRIS had about the same effect on the Tg’, and so did Tricine and CHES. It was expected that ammediol and TRIS have similar effects, because their chemical structures are very similar (Fig. 1). Also, the Tg’ of the pure buffer solutions were almost identical for both ammediol and TRIS (-81 °C and -79 °C, respectively) and for Tricine and CHES (-61 °C and -58 °C, respectively). For borax no Tg’ could be established. In contrast to the other buffers, the Tg’ of trehalose solutions containing borax at pH 9.8 increased with increasing borax/sugar ratios (Fig. 3).

The influence of various high-pH buffers Chapter 5
135
Bu ffer / su gar (w / w ) in sam p le0.00 0.05 0.10 0.15 0.20
Tg' (
°C)
-50
-40
-30
-20
-10
0
Fig. 3 The Tg’ of trehalose and inulin (10% w/v) in borax, pH 6.0 and pH 9.8. Inulin/borax pH 9.8 (♦), Inulin/borax pH 6.0 (◊), Trehalose/borax pH 9.8 (▲), Trehalose/borax pH 6.0 (∆). The data shown are the mean of two to four measurements. The standard deviation was less than 1°C in all cases. An explanation for this is the specific interaction between the borax and the hydroxyl groups of the trehalose, i.e. the borax can form covalent bonds with the hydroxyl groups, leading to a new compound with a different Tg’ than that of the pure sugar. As the amount of borax increases, so does the degree of complexation, resulting in a rise of the Tg’. This interaction is frequently mentioned in the literature and explains the increased viscosity (i.e. gelling) of polysaccharide solutions through formation of monodiol- and didiol-borax crosslinks [17, 25]. The same trend was found for the inulin samples, except that the Tg’ values were higher than those of the corresponding trehalose samples (Fig. 3). It has previously been shown that the Tg’ of oligosaccharides increases with their size [9], explaining why the Tg’ is higher for inulin than for trehalose. In Fig. 4 it is shown that the Tg’ values of trehalose/TRIS and inulin/TRIS solutions at pH 6.0 are lower than at pH 9.8. The other buffers, except borax, demonstrated a similar decrease of the Tg’ when the pH was changed from 9.8 to 6.0 (data not shown). It was hypothesized that the change of the Tg’ is related to the change of the charge of the buffer species.

Chapter 5 The influence of various high-pH buffers
136
TRIS/ su gar (w / w ) in sam p le0.00 0.02 0.04 0.06 0.08 0.10 0.12 0.14
Tg' (
°C)
-40
-35
-30
-25
-20
-15
Fig. 4 The Tg’ of trehalose and inulin (10% w/v) in TRIS buffer, pH 6.0 and pH 9.8. Inulin/TRIS pH 9.8 (♦), Inulin/TRIS pH 6.0 (◊), Trehalose/TRIS pH 9.8 (▲), Trehalose/TRIS pH 6.0 (∆). The data shown are the mean of two to four measurements. The standard deviation was less than 1°C in all cases. The average number of ionized groups of the buffers at pH 6.0 and at pH 9.8 were calculated using the Henderson-Hasselbalch equation, (pH=pKa+log [base]/[acid]). In the case of Tricine and CHES, one charge unit is added because at the pH range under investigation the carboxylic acid and the sulfonic acid groups of the Tricine and the CHES, respectively, are fully deprotonated. As can be seen in Table I, the charge of the buffer component increases dramatically when the pH is lowered from 9.8 to 6.0 in all cases. Table I. The average number of ionized groups of the buffers at different pH.
Average number of ionized groups per buffer species
Buffer pKa pH 9.8 pH 6.0
Ammediol 8.8 0.091 1.0
TRIS 8.1 0.020 1.0
Tricine 8.1 1.0 1.9
CHES 9.3 1.2 2.0
These results, indeed, indicate that the difference in charge of the respective buffers at the two pH values are related to the different values of Tg’. In a

The influence of various high-pH buffers Chapter 5
137
recent study by Shalaev and co-workers [26], the influence of pH on the Tg’ of malate and citrate buffers was investigated. They found that the Tg’ decreased with increasing pH, i.e. with increasing charge, which is in concordance with our results. They suggested that the decrease in Tg’ was an effect of an increasing water content in the freeze-concentrated solution. Since water is a plasticizer the Tg’ will decrease with an increasing amount of water present in the freeze-concentrated solution. The results of the borax containing samples (Fig. 3), on the other hand, were completely different. Instead of showing Tg’ values similar at both pH 6.0 and pH 9.8, the Tg’ actually changed in opposite directions with increasing concentration of borax at the two pH values. We suggest that this is caused by a different kind of interaction between the sugars and borax at the two pH-values tested. It has indeed been found by others that, in contrast to at high pH, there is no complex formation between sugars and borax below pH 7.5 [17, 25]. This means that at pH 6.0 sugar and borax form a homogeneous mixture in the freeze-concentrated fraction as for the other sugar/buffer combinations investigated in the study presented here. Effect of buffers on the Tg It is generally accepted that a sugar glass with a protein incorporated should be stored below the Tg. This is to diminish the risk of degradation of the protein, which otherwise can occur when the glass structure turns into its rubbery state. The rubbery state allows a higher mobility and thus a higher reactivity of the molecules [6, 27]. In addition, in the rubbery state crystallization can occur, which leads to phase separation and thus to a complete loss of protection of the protein [6, 7, 28, 29]. It has even been shown that the molecular mobility in sugar glasses increases when they are stored at temperatures 50 °C below their Tg [30], suggesting that degra-dation can occur even in samples stored far below their Tg. As can be seen in Fig. 5, all buffers, except for borax (see Fig. 6), suppress the Tg of trehalose and inulin. Similar to the Tg’, the Tg of these trehalose samples is in all cases lower than the Tg of the corresponding inulin samples. Also similar to the Tg’, ammediol and TRIS have the largest effect on the Tg followed by Tricine and CHES. The rapid decrease of Tg with increasing amounts of buffer present in the sample indicates that high amounts of these buffers should be avoided.

Chapter 5 The influence of various high-pH buffers
138
Bu ffer / su gar (w / w ) in sa m p le0.00 0.05 0.10 0.15 0.20 0.25 0.30
Tg (°
C)
60
80
100
120
140
160
Fig. 5 The Tg of amorphous trehalose and inulin with different buffers, pH 9.8. Inulin/CHES (■), Inulin/Tricine (♦), Inulin/TRIS (▲), Inulin/Ammediol (●), Trehalose/CHES (□), Trehalose/Tricine (◊), Trehalose/TRIS (∆), Trehalose/Ammediol (○). The data shown are the mean of two to four measurements. The standard deviation was less than 2°C in all cases.
Borax/ su ga r (w / w ) in sam p le0.00 0.01 0.02 0.03 0.04 0.05
Tg (°
C)
120
140
160
180
200
220
240
Fig. 6 Tg of amorphous trehalose and inulin in borax pH 6.0 and pH 9.8. Inulin/borax pH 9.8 (♦), Inulin/borax pH 6.0 (◊), Trehalose/borax pH 9.8 (▲), Trehalose/borax pH 6.0 (∆). The data shown are the mean of two to four measurements. The standard deviation was less than 2°C in all cases.

The influence of various high-pH buffers Chapter 5
139
For homogeneous mixtures the Gordon-Taylor equation applies [31]. The values from the measurements of the Tg of the freeze-dried material were fitted in the Gordon-Taylor equation:
21
2211
wkwTwkTw
Tg gg
⋅+⋅⋅+⋅
=
In this formula Tg is the glass transition temperature of the mixture, Tg1 is the glass transition temperature of the sugar, w1 is the weight fraction of the sugar, Tg2 is the glass transition temperature of the buffer, and w2 is the weight fraction of the buffer. The parameter k is used here as a fitting parameter. Excellent fits were obtained for all mixtures (see Table II). Table II. The results from the Gordon-Taylor fit of the Tg-measurements from samples freeze-dried from solutions at pH 9.8.
Trehalose Inulin
Buffer Correlation coefficient k Correlation coefficient k
Ammediol 0.993 0.86 0.999 0.43
TRIS 0.998 0.63 0.998 0.44
Tricine 0.997 1.12 0.994 0.56
CHES 0.998 0.47 0.996 0.31
The good correlation coefficients indicate that the sugars and buffers were homogeneously distributed on a molecular level. The Tg values of the trehalose and inulin samples that were freeze-dried with ammediol, TRIS, Tricine, or CHES at pH 6.0 showed no significant differences from those of the corresponding samples that were freeze-dried with the respective buffers at pH 9.8 (data not shown). These results show that in the dry amorphous state the pH, and therefore also the charge, of the buffer in the original solution has no significant influence on the Tg of the final dry product. The results for borax are shown in Fig. 6. The Tg of the samples freeze-dried from solutions at pH 9.8 increased with increasing borax content. This is probably explained by complex formation between the sugars and the borax. The Tg of trehalose freeze-dried with borax pH 6.0 was slightly lower than the Tg measured for the corresponding samples freeze-dried with borax pH 9.8. Also, for inulin that was freeze-dried with borax pH 6.0 the Tg values were substantially lower than the Tg at pH 9.8. As indicated by the Tg’ measurements, borax does not form complexes
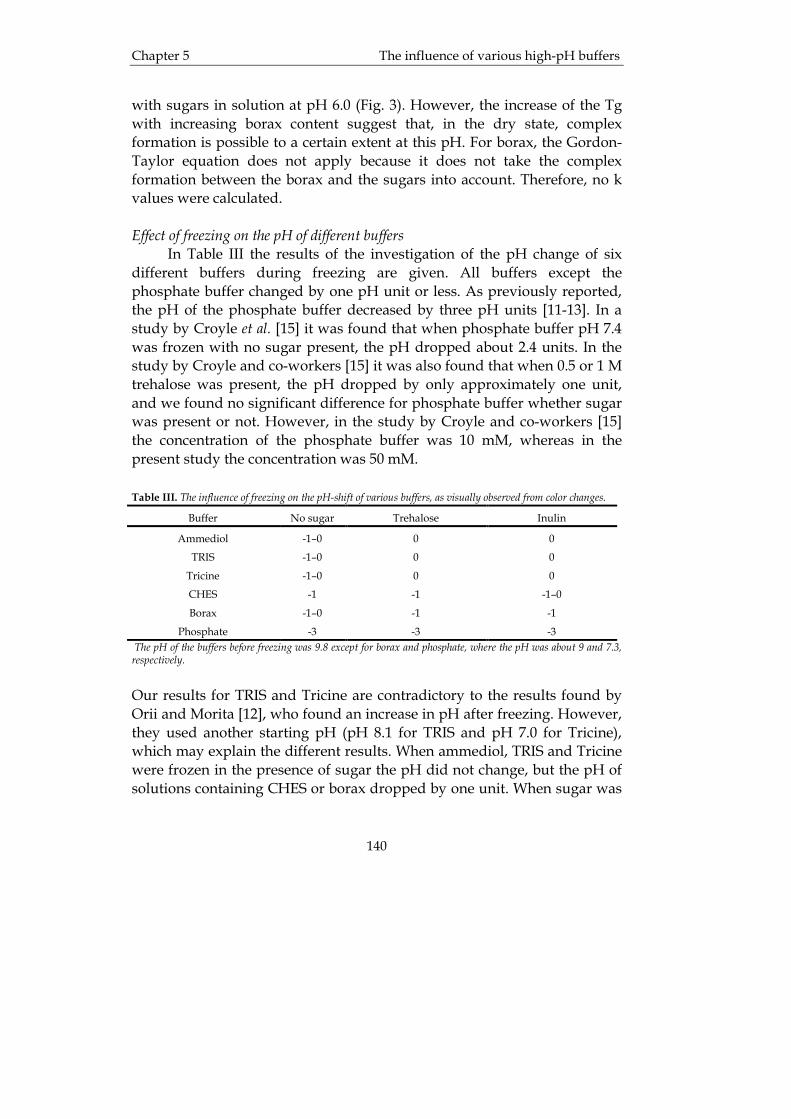
Chapter 5 The influence of various high-pH buffers
140
with sugars in solution at pH 6.0 (Fig. 3). However, the increase of the Tg with increasing borax content suggest that, in the dry state, complex formation is possible to a certain extent at this pH. For borax, the Gordon-Taylor equation does not apply because it does not take the complex formation between the borax and the sugars into account. Therefore, no k values were calculated. Effect of freezing on the pH of different buffers In Table III the results of the investigation of the pH change of six different buffers during freezing are given. All buffers except the phosphate buffer changed by one pH unit or less. As previously reported, the pH of the phosphate buffer decreased by three pH units [11-13]. In a study by Croyle et al. [15] it was found that when phosphate buffer pH 7.4 was frozen with no sugar present, the pH dropped about 2.4 units. In the study by Croyle and co-workers [15] it was also found that when 0.5 or 1 M trehalose was present, the pH dropped by only approximately one unit, and we found no significant difference for phosphate buffer whether sugar was present or not. However, in the study by Croyle and co-workers [15] the concentration of the phosphate buffer was 10 mM, whereas in the present study the concentration was 50 mM. Table III. The influence of freezing on the pH-shift of various buffers, as visually observed from color changes.
Buffer No sugar Trehalose Inulin
Ammediol -1–0 0 0
TRIS -1–0 0 0
Tricine -1–0 0 0
CHES -1 -1 -1–0
Borax -1–0 -1 -1
Phosphate -3 -3 -3 The pH of the buffers before freezing was 9.8 except for borax and phosphate, where the pH was about 9 and 7.3, respectively.
Our results for TRIS and Tricine are contradictory to the results found by Orii and Morita [12], who found an increase in pH after freezing. However, they used another starting pH (pH 8.1 for TRIS and pH 7.0 for Tricine), which may explain the different results. When ammediol, TRIS and Tricine were frozen in the presence of sugar the pH did not change, but the pH of solutions containing CHES or borax dropped by one unit. When sugar was

The influence of various high-pH buffers Chapter 5
141
added to the borax solution, the pH dropped by one unit already before freezing, probably because of complex formation. On freezing the pH dropped by another unit. It seems that trehalose and inulin both act as pH stabilizers of ammediol, TRIS and Tricine during freezing but not for the other buffers investigated here. Effect of buffers on the enzymatic activity of alkaline phosphatase from bovine intestine After freeze-drying and storage at 20 °C for 6 days, the enzymatic activity of BIAP was fully maintained for all samples (data not shown) except for some of the borax samples (see below for further comments). The enzymatic activity of BIAP freeze-dried with trehalose or inulin in the presence of different buffers was also evaluated after 6 days of storage at 60 °C (Table IV). The enzymatic activity was fully preserved in all cases, except for the freeze-dried 2.5% w/v-solutions of trehalose in ammediol or TRIS (and borax, see below). In the products freeze-dried from the 2.5% w/v-solutions of ammediol or TRIS, the buffer content was 17% or higher. Because trehalose has a lower Tg than inulin, and because ammediol and TRIS induce the largest decrease of the Tg, these samples will have the lowest Tg of all samples under investigation. Therefore, the poor enzymatic recovery is most likely caused by the low Tg. This is confirmed by the results of the corresponding inulin samples. These samples will have a higher Tg. Consequently, the enzymatic activity was fully maintained. The samples freeze-dried from 2.5% w/v-solutions with borax demonstrated a loss of enzymatic activity already after freeze-drying and storage at 20 °C. The remaining enzymatic activity was 90% and 65% for trehalose and inulin, respectively. For the samples that were stored for 6 days at 60 °C, the remaining enzymatic activity was also substantially lower (see Table IV). Similar to the samples stored at 20 °C, the enzymatic activity was higher for the trehalose samples than for the corresponding inulin samples. As already mentioned, at pH 9.8 borax forms complexes with the hydroxyl groups of sugars. Apparently, the chemical modification of the sugars by complexing with borax results in a partial loss of the stabilizing properties of the sugars during freeze-drying and storage. Both the samples freeze-dried with trehalose and with inulin lost a substantial amount of activity, but the trehalose samples showed higher activities than
Chapter 5 The influence of various high-pH buffers
142
Table IV. The remaining activity (in %) of BIAP after freeze dried with sugars and various buffers after six days storage at 60 °C.
Ammediol TRIS Concentration sugar+BIAP in
solution before freeze-drying
(% w/v)
Sugar/BIAP
(w/w) Trehalose Inulin Trehalose Inulin
10 9/1 110.3 106.9 120.5 109.6
10 4/1 111.6 108.9 118.5 100.9
2.5 9/1 1.1 100.9 105.2 104.0
2.5 4/1 16.7 99.8 69.4 94.1 The mean is reported, n=4. The standard deviation was less than 4.5% in all cases.
the corresponding inulin samples. Because inulin is an oligosaccharide, the mole ratio for inulin/borax is lower than for trehalose/borax. Possibly, this can explain the different stabilities obtained. The loss of enzymatic activity could not have been caused by a pH drop during the freeze-drying process because no dramatic pH shifts were observed in the freezing experiments described above. In a previous study it was found that above pH 5 no loss of enzymatic activity of occurs [32]. In the present study the pH was always higher than that. 5.4 Conclusions Stabilization of pharmaceutically active proteins by freeze-drying is often performed from solutions containing a sugar and some buffer. However, applications of buffers in these formulations may have a detrimental effect on the enclosed protein. As found in other studies, employment of phosphate buffers may lead to a strong pH drop during freezing, leading to degradation of the protein. In this study, it was found that buffers can also have a large impact on the Tg’ and the Tg of sugar samples, potentially leading to problems with the stability of the product. As a results of the suppression of the Tg’ and Tg by the buffers, it is recommended to choose a sugar with as high Tg’ and Tg as possible, e.g., inulin instead of trehalose, in order to ensure stabilization of the protein during and after freeze-drying. Furthermore, buffers that form complexes with sugar should be avoided because they may severely affect the stabilizing capacity of the sugar. Also bear in mind the fact that these

The influence of various high-pH buffers Chapter 5
143
Table IV, continued.
buffers might also form complexes with the sugar moieties of glyco-proteins, which might harm the protein in question. In addition to these considerations, the buffer giving the best stability must also be compliant with the regulations of the FDA regarding toxicity if the product is to be used as a pharmaceutical agent intended for human use. 5.5 Acknowledgements The authors would like to thank Alberda van Ekenstein (Department of Polymer Chemistry, University of Groningen, The Netherlands), who assisted in the measurements of the Tg’ of the pure buffer solutions.
Tricine CHES Borax
Trehalose
Inulin Trehalose Inulin Trehalose Inulin
116.6 111.8 116.4 102.2 94.8 105.3
111.4 112.1 110.7 94.4 97.1 91.4
109.3 103.1 112.8 108.3 66.2 37.9
101.4 120.6 107.4 95.1 71.1 36.3

Chapter 5 The influence of various high-pH buffers
144
5.6 References 1. Cardona, S., C. Schebor, M.P. Buera, M. Karel, and J. Chirife,
Thermal stability of invertase in reduced-moisture amorphous matrices in relation to glassy state and trehalose crystallization. J Food Science, 1997. 62(1): p. 105-112.
2. Colaco, C.A.L.S., C.J.S. Smith, S. Sen, D.H. Roser, Y. Newman, S.
Ring, and B.J. Roser, Chemistry of Protein Stabilization by Trehalose. Am Chem Soc Symp Ser, 1994. 567: p. 222-240.
3. Crowe, L.M., D.S. Reid, and J.H. Crowe, Is trehalose special for
preserving dry biomaterials? Biophys J, 1996. 71(4): p. 2087-2093. 4. Ford, A.W. and P.J. Dawson, The effect of carbohydrate additives in the
freeze-drying of alkaline phosphatase. J Pharm Pharmacol, 1993. 45(2): p. 86-93.
5. Hatley, R.H.M. and J.A. Blair, Stabilisation and delivery of labile
materials by amorphous carbohydrates and their derivatives. J Mol Catal B, 1999. 7: p. 11-19.
6. Mazzobre, M.F., M. del Pilar, and J. Chirife, Protective role of trehalose
on thermal stability of lactase in relation to its glass and crystal forming properties and effect of delaying crystallization. Lebensm Wiss u Technol, 1997. 30: p. 324-329.
7. Schebor, C., L. Burin, M.P. Buera, J.M. Aguilera, and J. Chirife,
Glassy state and thermal inactivation of invertase and lactase in dried amorphous matrices. Biotechnol Prog, 1997. 13(6): p. 857-863.
8. Xie, G. and S.N. Timasheff, The thermodynamic mechanism of protein
stabilization by trehalose. Biophys Chem, 1997. 64(1-3): p. 25-43. 9. Hinrichs, W.L., M.G. Prinsen, and H.W. Frijlink, Inulin glasses for the
stabilization of therapeutic proteins. Int J Pharm, 2001. 215(1-2): p. 163-174.
The influence of various high-pH buffers Chapter 5
145
10. Eriksson, H.J., W.L. Hinrichs, B. van Veen, G.W. Somsen, G.J. de Jong, and H.W. Frijlink, Investigations into the stabilisation of drugs by sugar glasses: I. Tablets prepared from stabilised alkaline phosphatase. Int J Pharm, 2002. 249(1-2): p. 59-70.
11. Gomez, G., M.J. Pikal, and N. Rodriguez-Hornedo, Effect of initial
buffer composition on pH changes during far-from- equilibrium freezing of sodium phosphate buffer solutions. Pharm Res, 2001. 18(1): p. 90-97.
12. Orii, Y. and M. Morita, Measurement of the pH of frozen buffer solutions
by using pH indicators. J Biochem (Tokyo), 1977. 81(1): p. 163-168. 13. van den Berg, L. and D. Rose, Effect of freezing on the pH and
composition of sodium and potassium phosphate solutions: the reciprocal system KH2PO4-Na2HPO4-H2O. Arch Biochem Biophys, 1959. 81: p. 319-329.
14. Lam, X.M., H.R. Costantino, D.E. Overcashier, P.A. Nguyen, and
C.C. Hsu, Replacing succinate with glycolate buffer improves the stability of lyophilized interferon-y. Int J Pharm, 1996. 142: p. 85-95.
15. Croyle, M.A., B.J. Roessler, B.L. Davidson, J.M. Hilfinger, and G.L.
Amidon, Factors that influence stability of recombinant adenoviral preparations for human gene therapy. Pharm Dev Technol, 1998. 3(3): p. 373-383.
16. Miller, D.P., R.E. Anderson, and J.J. de Pablo, Stabilization of lactate
dehydrogenase following freeze thawing and vacuum-drying in the presence of trehalose and borate. Pharm Res, 1998. 15(8): p. 1215-1221.
17. Pezron, E., A. Ricard, F. Lafuma, and R. Audebert, Reversible gel
formation induced by ion complexation. 1. Borax-galactomannan interactions. 1988, 1988. 21: p. 1121-1125.
18. Tzannis, S.T. and S.J. Prestrelski, Moisture effects on protein-excipient
interactions in spray-dried powders. Nature of destabilizing effects of sucrose. J Pharm Sci, 1999. 88(3): p. 360-370.
Chapter 5 The influence of various high-pH buffers
146
19. Duddu, S.P. and P.R. Dal Monte, Effect of glass transition temperature on the stability of lyophilized formulations containing a chimeric therapeutic monoclonal antibody. Pharm Res, 1997. 14(5): p. 591-595.
20. Slade, L. and H. Levine, Beyond water activity: recent advances based on
an alternative approach to the assessment of food quality and safety. Crit Rev Food Sci Nutr, 1991. 30: p. 115-360.
21. Slade, L. and H. Levine, Water and the glass transition: dependence of
the glass transition on the composition and chemical structure: special implications for flour functionality in cookie baking. J Food Eng, 1995. 24: p. 431-509.
22. van Alpen, J. and K.A. de Vries, Tabellenboekje ten dienste van
laboratoria. Vol. 18:e verbeterde druk. 1962, Hilversum, The Netherlands: D.B. Centens uitgeversmaatschappij. 157.
23. Pikal-Cleland, K.A., J.L. Cleland, T.J. Anchordoquy, and J.F.
Carpenter, Effect of glycine on pH changes and protein stability during freeze- thawing in phosphate buffer systems. J Pharm Sci, 2002. 91(9): p. 1969-1979.
24. Zittle, C.A. and E.S. Della Monica, Effects of borate and other ions on
the alkaline phosphatase of bovine milk and intestinal mucosa. Arch Biochem Biophys, 1950. 26: p. 112-122.
25. Pezron, E., L. Leibler, A. Ricard, and R. Audebert, Reversible gel
formation induced by ion complexation. 2. Phase diagrams. 1988, 1988. 21: p. 1126-1131.
26. Shalaev, E.Y., T.D. Johnson-Elton, L. Chang, and M.J. Pikal,
Thermophysical properties of pharmaceutically compatible buffers at sub- zero temperatures: implications for freeze-drying. Pharm Res, 2002. 19(2): p. 195-201.
27. Levine, H. and L. Slade, Thermomechanical properties of small-
carbohydrate-water glasses and rubbers. J Chem Soc Faraday Trans, 1988. 84: p. 2619-2633.
The influence of various high-pH buffers Chapter 5
147
28. Izutsu, K., S. Yoshioka, and S. Kojima, Physical stability and protein stability of freeze-dried cakes during storage at elevated temperatures. Pharm Res, 1994. 11(7): p. 995-999.
29. Costantino, H.R., J.D. Andya, P.A. Nguyen, N. Dasovich, T.D.
Sweeney, S.J. Shire, C.C. Hsu, and Y.F. Maa, Effect of mannitol crystallization on the stability and aerosol performance of a spray-dried pharmaceutical protein, recombinant humanized anti-IgE monoclonal antibody. J Pharm Sci, 1998. 87(11): p. 1406-1411.
30. Hancock, B.C., S.L. Shamblin, and G. Zografi, Molecular mobility of
amorphous pharmaceutical solids below their glass transition temperatures. Pharm Res, 1995. 12(6): p. 799-806.
31. Gordon, M. and J.S. Taylor, Ideal copolymers and the second-order
transitions of synthetic rubbers. J Appl Chem, 1952. 2: p. 493-500. 32. Eriksson, H.J.C., M. Wijngaard, W.L.J. Hinrichs, H.W. Frijlink, G.W.
Somsen, and G.J. de Jong, Potential of capillary zone electrophoresis for the monitoring of the stability of placental alkaline phosphatase. J Pharm Biomed Anal, 2003. 31: p. 351-357.

Chapter 5 The influence of various high-pH buffers
148

Tablets prepared from stabilized alkaline phosphatase Chapter 6
149
Chapter 6
Investigations into the stabilization of drugs by sugar glasses: Tablets prepared from
stabilized alkaline phosphatase
H.J.C. Eriksson, W.L.J. Hinrichs, B. van Veen, G.W. Somsen, G.J. de Jong, H.W. Frijlink. Int J Pharm, 2002. 249: p. 59-70.

Chapter 6 Tablets prepared from stabilized alkaline phosphatase
150
Summary The aim of this study was to investigate the formulation of sugar glass stabilized alkaline phosphatase from bovine intestine (BIAP) into tablets. Two major subjects of tablet formulation were investigated. First, the compaction behaviour of the inulin sugar glass was investigated. Secondly, the effect of the compaction process on the physical stability of sugar glass stabilized BIAP was evaluated, comparing inulin and trehalose glass. The tabletting properties of freeze-dried inulin without BIAP were studied first. Freeze-dried inulin conditioned at 20 °C/0% relative humidity (RH) or 20 °C/45% RH was compacted at various pressures. As expected, the yield pressure of the material conditioned at 0% RH was higher (68 MPa) than after conditioning at 45% RH (39 MPa). Tablets made of the material stored at 0% RH showed severe capping tendency, especially at high compaction pressures. In contrast, material conditioned at 45% RH gave tablets without any capping tendency and a friability of less than 1%. Sugar glasses of BIAP and either inulin or trehalose were prepared by freeze-drying (BIAP/sugar 1/19 (w/w). The material was subsequently compacted. Tablets and powders were stored at 60 °C/0% RH. The activity of the incorporated BIAP was measured at various time intervals. It was found that inulin was by far superior to trehalose as stabilizer of BIAP in tablets. The poor stabilizing capacities of trehalose after compaction are explained by crystallization of trehalose induced by the compaction process and moisture in the material. The results clearly show that inulin is an excellent stabilizer for BIAP. The tabletting properties are adequate, showing sufficient tablet strengths and low friability. Furthermore, the good (physical) stability of inulin glass with respect to exposure to high relative humidities makes it practical to work with.

Tablets prepared from stabilized alkaline phosphatase Chapter 6
151
6.1 Introduction Pharmaceutically active proteins have been applied for decades. However, their number was small until the 1980s, but since that time rapid developments in molecular biology resulted in a fast increase. Currently, the FDA has approved over 30 different recombinant DNA-derived proteins, e.g. erythropoietin, interferon alpha-2a/b, somatropin, and follitropin beta and many more are already in a far stage of development. This fast growth calls for the development of dosage forms that provide stability of the drug during manufacturing and subsequent storage and that also allow patient friendly administration. Stabilization of proteins can be achieved by mixing the protein solution with a sugar after which the solution is lyophilized or spray-dried. If dried properly, the protein is incorporated in a matrix consisting of amorphous sugar in its glassy state. Among other things, stabilization is achieved because the mobility of the protein is strongly reduced. Several review articles that cover this subject have been published [1-3]. It is often claimed that trehalose is superior as stabilizer when compared to other sugars, like sucrose, maltose, raffinose or lactose [4-11]. However, recently it was shown that also inulin provides excellent stabilization of proteins during freeze-drying and subsequent storage [12]. Once in the dry state, it is possible to develop other than liquid dosage forms, such as tablets or powders for inhalation. Although there is a substantial amount of papers dealing with the stabilization of proteins by lyophilization or spray-drying, papers on the formulation of these drugs for oral administration are scarce. Nonetheless, quite recently a paper on the stabilization of an antibiotic freeze-dried with trehalose and subsequently compacted was presented [11]. However, no experimental details were mentioned. In a previous study spray-dried inulin was tested as excipient for direct compaction [13]. It was shown that this material has excellent tabletting properties. In the study by Hinrichs et al. [12] the possibility to use inulin as a stabilizer of proteins was explored, while in the study by Eissens et al. [13] the compaction properties of spray-dried inulin without the presence of a protein were investigated. The aim of this study was to investigate the formulation of sugar glass stabilized alkaline phosphatase from bovine intestine (BIAP) into tablets. Two major subjects of tablet formulation were investigated. First, the compaction behaviour of the inulin sugar glass was evaluated.
Chapter 6 Tablets prepared from stabilized alkaline phosphatase
152
Secondly, the effect of the compaction process on the physical stability of sugar glass stabilized BIAP was investigated, comparing inulin and trehalose glasses. Alkaline phosphatase (AP) is a thermolabile enzyme [14, 15] that currently is investigated within the University of Groningen as a potential treatment of sepsis, which is caused by endotoxins produced by Gram-negative bacteria. In the case of sepsis the permeability across the intestinal wall increases, which might allow endotoxins to enter the blood stream. The AP can detoxify these endotoxins by removal of their phosphate groups. Since a local effect in the intestinal lumen is desired delivery of AP via the oral route is preferred. 6.2 Material and methods Material Inulin with a number/weight average degree of polymerization (DPn/DPw) of 23/26 was a gift from Sensus (Rosendaal, The Netherlands), D-(+)-trehalose and alkaline phosphatase from bovine intestine mucosa (BIAP) were purchased from Sigma (St Louis, MO, USA), para-nitrophenylphosphate and 2-amino-2-methyl-1,3-propanediol were purchased from Sigma-Aldrich (Steinheim, Germany), and MgCl2 was from Fluka (Buchs, Switzerland). NaOH and HCl were purchased from Merck (Darmstadt, Germany). Freeze-drying Solutions of inulin (10% w/v in demineralized water), BIAP/inulin, BIAP/trehalose (both 1/19 w/w, 10% w/v in 0.05 M ammediol (pH 9.8)) and BIAP without sugar (0.25% w/v in 0.05 M ammediol (pH 9.8)) were rapidly frozen in liquid nitrogen. Freeze-drying was carried out in a Christ Alpha 1-4 freeze-dryer (Salm en Kipp, Breukelen, The Netherlands) as follows; 96 hours at a shelf temperature of –35 °C, a condenser temperature of –53 °C, and a pressure of 0.220 mbar followed by a stepwise increase during 6 h to 20 °C and 0.520 mbar, which then was maintained for another 20 hours. After freeze-drying, the samples were kept in a vacuum desiccator for at least four days.

Tablets prepared from stabilized alkaline phosphatase Chapter 6
153
Compaction behaviour of freeze-dried inulin Before compaction freeze-dried inulin was gently ground and then equilibrated at either 20 °C/0% RH or 20 °C/45% RH. Tablets (round, flat, diameter 13 mm, weight 300 mg) were prepared with a compaction simulator (ESH, Brierley Hill, UK) at an average compaction speed of 3 mm/s. In the compaction chamber the temperature was 19 °C and the relative humidity was 60%. The compaction pressures varied between 7 and 210 MPa. Between each compaction the die was lubricated with magnesium stearate. The upper punch displacements were sine waves with different amplitudes in order to obtain different compaction pressures. The lower punch was stationary during compaction and the ejection time was always 10 s. The yield pressure of the inulin was calculated according to Heckel [16]. In short, the –ln (porosity under pressure) is plotted against the compaction pressure and then the equation of the linear region is calculated. The yield pressure is retrieved from the reciprocal of the slope. After ejection the tablets were stored for at least 16 h at 20 °C and a relative humidity as before compaction. To determine the porosity of the tablets after relaxation their dimensions were measured with an electronic micrometer (Mitutoyo, Tokyo, Japan) and the tablets were weighed on an analytical balance (Mettler-Toledo, Greifensee, Germany). The density of the tablets (DT) was calculated and then the porosity was calculated as 1-DT/DI, where DI=the true density of inulin glass (1.480 g/cm3 for inulin at 45% RH and 1.534 g/cm3 for inulin at 0% RH) [13]. The crushing strengths were measured with the compaction simulator as described previously [17, 18]. The friability of tablets made from material conditioned at 20 °C/45% RH was tested according to the European Pharmacopoeia [19]. Production of tablets for stability testing Tablets for the stability testing of BIAP incorporated in inulin or trehalose glasses were produced using a hydraulic press (ESH, Brierley Hill, UK). The material containing inulin had been conditioned at 20 °C/45% RH, while the material containing trehalose had been conditioned at 20 °C/0% RH in order to prevent crystallization. The RH in the room where compaction took place was 70% and the temperature was 20 °C. The weighing of powders followed by compaction was performed as fast as possible (< 1 minute per tablet). A compaction pressure of 110 MPa was used for all the tablets. Immediately after compaction the tablets were

Chapter 6 Tablets prepared from stabilized alkaline phosphatase
154
transferred to a vacuum desiccator. After 16 to 20 hours the enzymatic activity was measured. Tablets from each material were stored at 60 °C/0% RH or in the vacuum desiccator at room temperature. Uncompacted powders were stored similarly. The enzymatic activity of the BIAP was measured at different time intervals up to 3 months. Physical stability of freeze-dried trehalose and inulin Trehalose and inulin were freeze-dried from aqueous solutions that contained 10% w/v of the respective sugars as described above. After freeze-drying the materials were stored at 0% RH in a vacuum desiccator for at least 2 days. Trehalose was then stored at 0, 33 and 45% RH, respectively, while inulin was stored at 0 and 45% RH, respectively, all at room temperature. The freeze-dried trehalose and inulin powders and tablets prepared from these powders were also stored at 60 °C/0% RH and 60 °C/33% RH. The tablets were made after the materials had been stored for at least two weeks in their respective climates. The compaction process took place under a stream of dry nitrogen in order to achieve 0% RH and thus eliminate the influence of moisture present in the compaction chamber. The physical appearance of the powders was investigated before compaction. Furthermore, the thermal behaviour of the samples was evaluated in duplicate using differential scanning calorimetry (DSC) at a scanning rate of 20 °C/min in open aluminium pans using approximately 10 mg for each measurement. The instrument, a TA Instruments DSC 2920 (TA instruments, Ghent, Belgium), had been calibrated with indium and the instrument was also equipped with a cooling device that was supplied with a stream of nitrogen throughout the measurements. Enzymatic activity assay Just before the enzymatic activity assay the tablets were gently crushed to smaller pieces in a mortar. From each sample duplicates were weighed and each duplicate was assayed twice, according to a previously published method [12]. For each analysis a calibration curve in the range 0 to 40 µg/ml of BIAP was prepared from untreated BIAP, which was stored at –18 °C. All samples were dissolved and diluted in 0.05 M ammediol in water (pH 9.8) to yield a final concentration of BIAP of about 25 µg/ml. The enzymatic activity of the samples was determined by measuring the conversion of pNPP to its yellow product para-nitrophenol. For the assay 900 µl of a mixture of 97.8% v/v of 0.05 M ammediol (pH 9.8)
Tablets prepared from stabilized alkaline phosphatase Chapter 6
155
with 2.2% v/v of 100 mM MgCl2 and 50 µl of sample were mixed with 50 µl 10 mg/ml pNPP in demineralized water. Immediately after the addition of the pNPP-solution the reaction mixtures were vortex mixed and then placed in a water bath (P.M. Tamson N.V., The Netherlands) set to 37 °C for 30 min. The reaction was quenched by adding 5.00 ml 0.1 M NaOH to the reaction solution. The absorbance at 405 nm of the samples was then measured using a Philips PU 8720 spectrophotometer (Philips, The Netherlands). 6.3 Results and Discussion Compaction behaviour and tablet properties of freeze-dried inulin The compaction behaviour of freeze-dried inulin was studied using the powders conditioned at 20 °C/0% RH and 20 °C/45% RH. The dry material showed capping tendency at compaction pressures higher than 67 MPa. When the tablets were ejected from the die, this capping process was evident within a few seconds as an increase in tablet height was clearly visible and the tablets split. This behaviour is explained by the storage of elastic energy, which was released as a fracture in the tablet when the pressure was removed. In contrast, tablets made from the material stored at 45% RH showed no capping, and tablets with high tensile strengths could be prepared. This behaviour has also been found for amorphous lactose [20]. In Fig. 1 the densification of both powders are shown as the porosity under pressure. The porosity under pressure was higher for the dry material compared to the moist material showing a difference in densification behaviour of the powders.
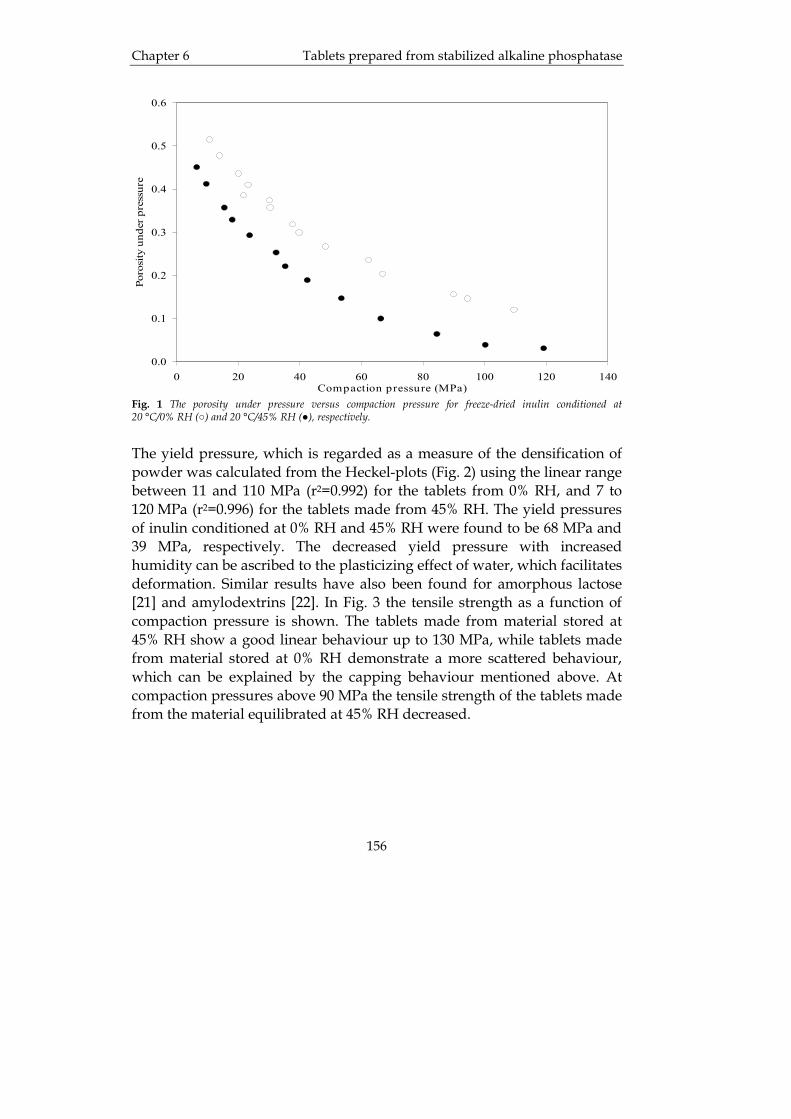
Chapter 6 Tablets prepared from stabilized alkaline phosphatase
156
Compaction pressure (MPa)0 20 40 60 80 100 120 140
Poro
sity
und
er p
ress
ure
0.0
0.1
0.2
0.3
0.4
0.5
0.6
Fig. 1 The porosity under pressure versus compaction pressure for freeze-dried inulin conditioned at 20 °C/0% RH (○) and 20 °C/45% RH (●), respectively. The yield pressure, which is regarded as a measure of the densification of powder was calculated from the Heckel-plots (Fig. 2) using the linear range between 11 and 110 MPa (r2=0.992) for the tablets from 0% RH, and 7 to 120 MPa (r2=0.996) for the tablets made from 45% RH. The yield pressures of inulin conditioned at 0% RH and 45% RH were found to be 68 MPa and 39 MPa, respectively. The decreased yield pressure with increased humidity can be ascribed to the plasticizing effect of water, which facilitates deformation. Similar results have also been found for amorphous lactose [21] and amylodextrins [22]. In Fig. 3 the tensile strength as a function of compaction pressure is shown. The tablets made from material stored at 45% RH show a good linear behaviour up to 130 MPa, while tablets made from material stored at 0% RH demonstrate a more scattered behaviour, which can be explained by the capping behaviour mentioned above. At compaction pressures above 90 MPa the tensile strength of the tablets made from the material equilibrated at 45% RH decreased.

Tablets prepared from stabilized alkaline phosphatase Chapter 6
157
Compaction pressure (MPa)0 20 40 60 80 100 120 140
-LN
(por
osity
und
er p
ress
ure)
0.5
1.0
1.5
2.0
2.5
3.0
3.5
4.0
Fig. 2 The –ln (porosity under pressure) versus compaction pressure for freeze-dried inulin conditioned at 20 °C/0% RH (○) and 20 °C/45% RH (●), respectively. Most likely, at these high pressures material densification with concomitant elastic energy storage occurred, resulting in internal non-visible capping. The reason for the increased tensile strength of tablets prepared from the moist material can again be found in the ability of absorbed water to act as a plasticizer. As a result, the degree of plastic deformation increases during compaction, and the lower porosity leads to a closer packing of the particles. This means that the available bonding surface within the tablet increases [23].
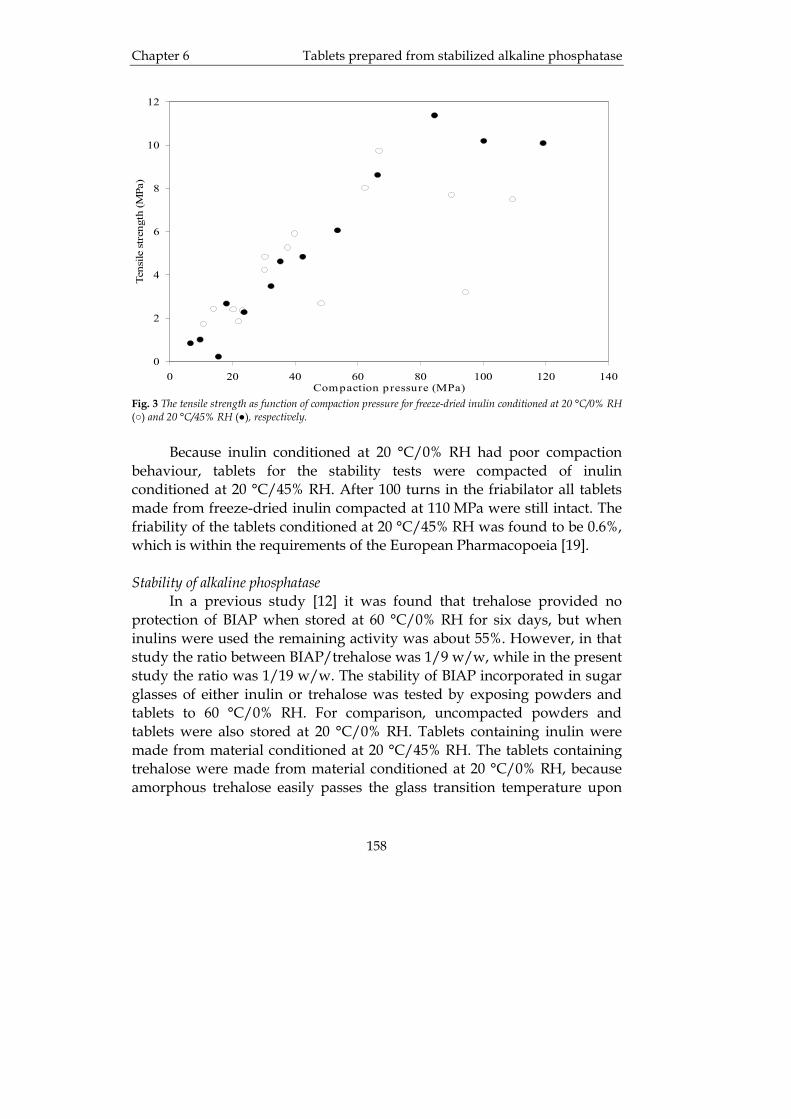
Chapter 6 Tablets prepared from stabilized alkaline phosphatase
158
Compaction pressure (MPa)0 20 40 60 80 100 120 140
Tens
ile s
tren
gth
(MPa
)
0
2
4
6
8
10
12
Fig. 3 The tensile strength as function of compaction pressure for freeze-dried inulin conditioned at 20 °C/0% RH (○) and 20 °C/45% RH (●), respectively. Because inulin conditioned at 20 °C/0% RH had poor compaction behaviour, tablets for the stability tests were compacted of inulin conditioned at 20 °C/45% RH. After 100 turns in the friabilator all tablets made from freeze-dried inulin compacted at 110 MPa were still intact. The friability of the tablets conditioned at 20 °C/45% RH was found to be 0.6%, which is within the requirements of the European Pharmacopoeia [19]. Stability of alkaline phosphatase In a previous study [12] it was found that trehalose provided no protection of BIAP when stored at 60 °C/0% RH for six days, but when inulins were used the remaining activity was about 55%. However, in that study the ratio between BIAP/trehalose was 1/9 w/w, while in the present study the ratio was 1/19 w/w. The stability of BIAP incorporated in sugar glasses of either inulin or trehalose was tested by exposing powders and tablets to 60 °C/0% RH. For comparison, uncompacted powders and tablets were also stored at 20 °C/0% RH. Tablets containing inulin were made from material conditioned at 20 °C/45% RH. The tablets containing trehalose were made from material conditioned at 20 °C/0% RH, because amorphous trehalose easily passes the glass transition temperature upon
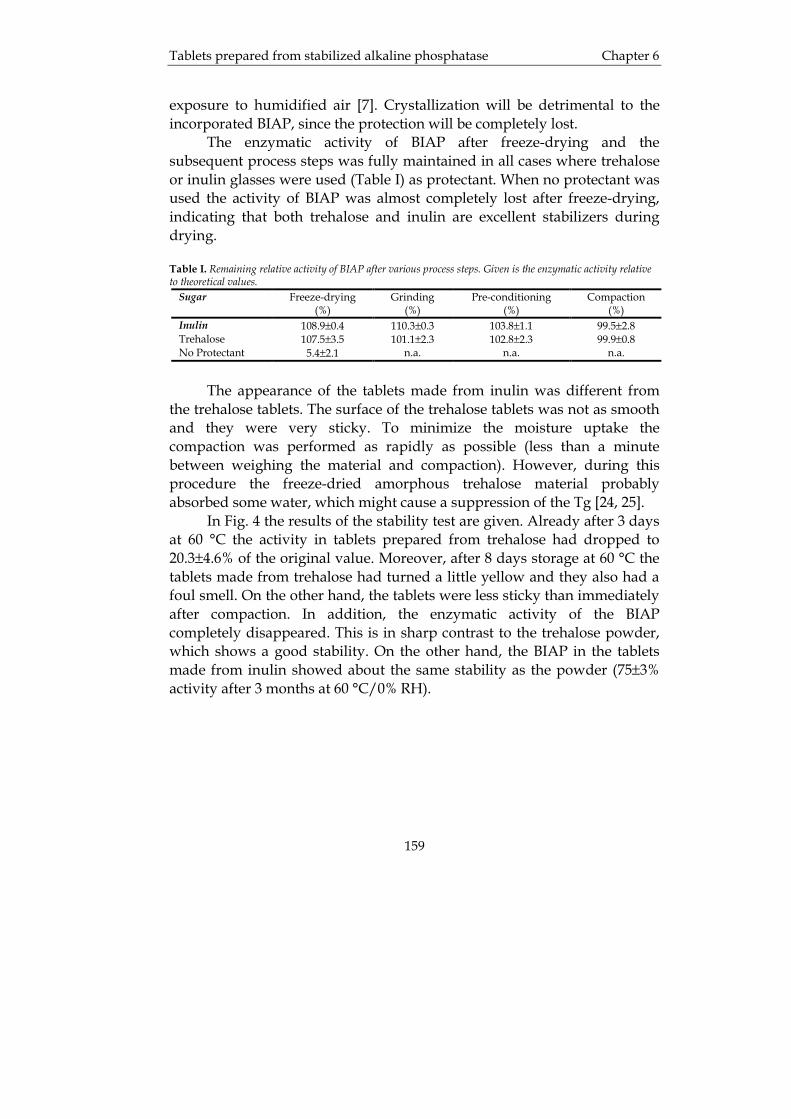
Tablets prepared from stabilized alkaline phosphatase Chapter 6
159
exposure to humidified air [7]. Crystallization will be detrimental to the incorporated BIAP, since the protection will be completely lost. The enzymatic activity of BIAP after freeze-drying and the subsequent process steps was fully maintained in all cases where trehalose or inulin glasses were used (Table I) as protectant. When no protectant was used the activity of BIAP was almost completely lost after freeze-drying, indicating that both trehalose and inulin are excellent stabilizers during drying. Table I. Remaining relative activity of BIAP after various process steps. Given is the enzymatic activity relative to theoretical values.
Sugar Freeze-drying (%)
Grinding (%)
Pre-conditioning (%)
Compaction (%)
Inulin 108.9±0.4 110.3±0.3 103.8±1.1 99.5±2.8 Trehalose 107.5±3.5 101.1±2.3 102.8±2.3 99.9±0.8 No Protectant 5.4±2.1 n.a. n.a. n.a.
The appearance of the tablets made from inulin was different from the trehalose tablets. The surface of the trehalose tablets was not as smooth and they were very sticky. To minimize the moisture uptake the compaction was performed as rapidly as possible (less than a minute between weighing the material and compaction). However, during this procedure the freeze-dried amorphous trehalose material probably absorbed some water, which might cause a suppression of the Tg [24, 25]. In Fig. 4 the results of the stability test are given. Already after 3 days at 60 °C the activity in tablets prepared from trehalose had dropped to 20.3±4.6% of the original value. Moreover, after 8 days storage at 60 °C the tablets made from trehalose had turned a little yellow and they also had a foul smell. On the other hand, the tablets were less sticky than immediately after compaction. In addition, the enzymatic activity of the BIAP completely disappeared. This is in sharp contrast to the trehalose powder, which shows a good stability. On the other hand, the BIAP in the tablets made from inulin showed about the same stability as the powder (75±3% activity after 3 months at 60 °C/0% RH).
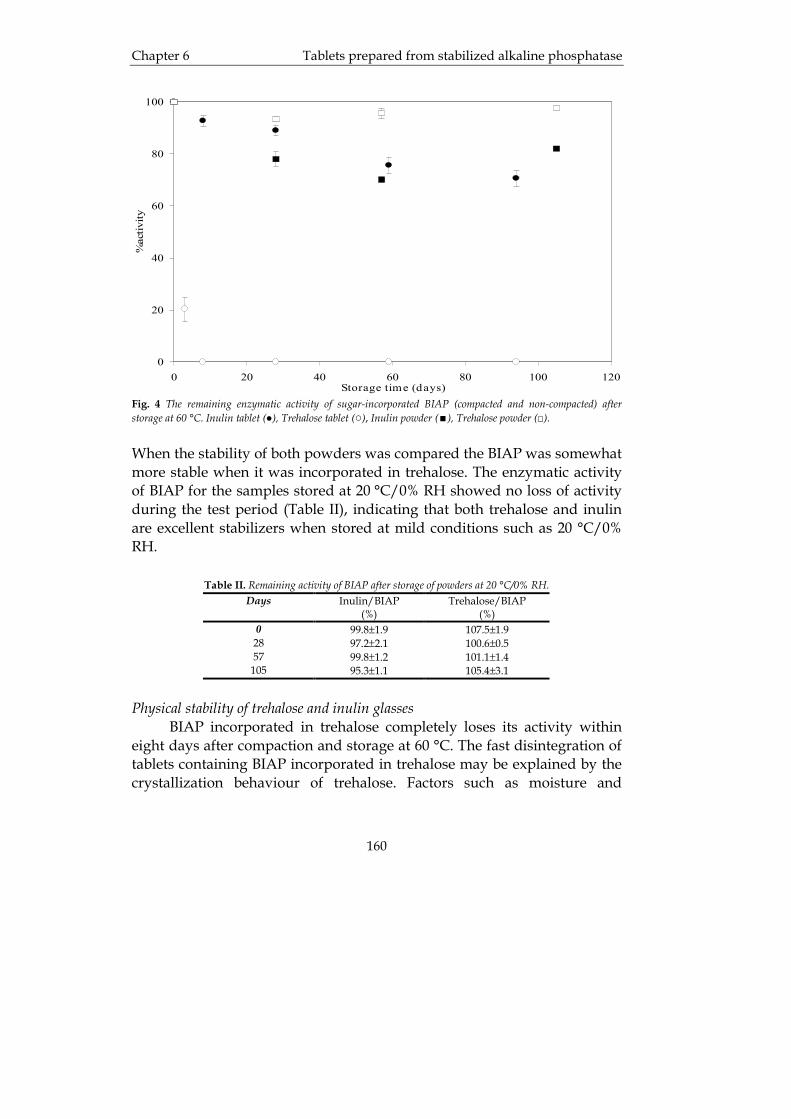
Chapter 6 Tablets prepared from stabilized alkaline phosphatase
160
Storage time (days)0 20 40 60 80 100 120
%ac
tivity
0
20
40
60
80
100
Fig. 4 The remaining enzymatic activity of sugar-incorporated BIAP (compacted and non-compacted) after storage at 60 °C. Inulin tablet (●), Trehalose tablet (○), Inulin powder ( ), Trehalose powder (□). When the stability of both powders was compared the BIAP was somewhat more stable when it was incorporated in trehalose. The enzymatic activity of BIAP for the samples stored at 20 °C/0% RH showed no loss of activity during the test period (Table II), indicating that both trehalose and inulin are excellent stabilizers when stored at mild conditions such as 20 °C/0% RH.
Table II. Remaining activity of BIAP after storage of powders at 20 °C/0% RH. Days Inulin/BIAP
(%) Trehalose/BIAP
(%) 0 99.8±1.9 107.5±1.9
28 97.2±2.1 100.6±0.5 57 99.8±1.2 101.1±1.4
105 95.3±1.1 105.4±3.1
Physical stability of trehalose and inulin glasses BIAP incorporated in trehalose completely loses its activity within eight days after compaction and storage at 60 °C. The fast disintegration of tablets containing BIAP incorporated in trehalose may be explained by the crystallization behaviour of trehalose. Factors such as moisture and

Tablets prepared from stabilized alkaline phosphatase Chapter 6
161
compaction may induce crystallization of amorphous sugars. As mentioned above, amorphous BIAP/trehalose became very sticky during the compaction process. Therefore, it is likely that the glass had partially turned into a rubber due to the compaction process and/or moisture uptake, i.e. the Tg had dropped to close to room temperature. As a result, the low Tg in combination with the compaction process and subsequent storage at 60 °C, crystallization of the lyophilized trehalose and consequently loss of protection of BIAP occured. This hypothesis is endorsed by the result of the DSC analysis showing an endothermic peak at 213 °C (Fig. 5), indicating that the material had fully turned into crystalline anhydrous trehalose [26]. The uncompacted trehalose, on the other hand, did not show any melting at 213 °C, while a Tg at 108 °C was observed indicating the existence of amorphous material (Fig. 5).
212.77°C
108.07°C(I)
105.68°C
Hea
t Flo
w (W
/g)
0 50 100 150 200
Temperature (°C)Exo Up
a
b
1 W /g
212.77°C
108.07°C(I)
105.68°C
Hea
t Flo
w (W
/g)
0 50 100 150 200
Temperature (°C)Exo Up
a
b
1 W /g
Fig. 5 DSC of freeze-dried trehalose/BIAP immediately after compaction (a) and after compaction and storage at 60 °C/0% RH (b), respectively. Pure amorphous trehalose has previously been reported to have a Tg of 115 °C [27] and 119 °C [26], respectively. The somewhat lower Tg found here can be ascribed to the presence of BIAP and/or buffer components in the sample.
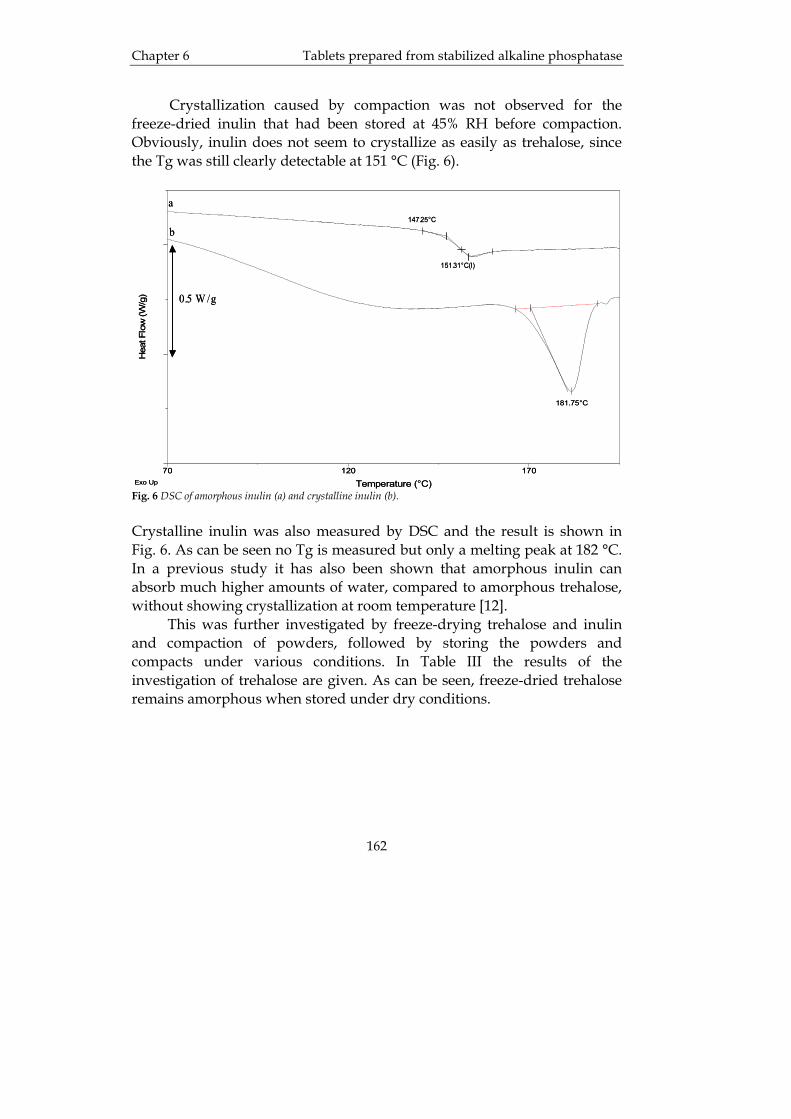
Chapter 6 Tablets prepared from stabilized alkaline phosphatase
162
Crystallization caused by compaction was not observed for the freeze-dried inulin that had been stored at 45% RH before compaction. Obviously, inulin does not seem to crystallize as easily as trehalose, since the Tg was still clearly detectable at 151 °C (Fig. 6).
181.75°C
Hea
t Flo
w (W
/g)
70 120 170
Temperature (°C)Exo Up
a
b
0.5 W /g
147.25°C
151.31°C(I)
181.75°C
Hea
t Flo
w (W
/g)
70 120 170
Temperature (°C)Exo Up
a
b
0.5 W /g
147.25°C
151.31°C(I)
Fig. 6 DSC of amorphous inulin (a) and crystalline inulin (b). Crystalline inulin was also measured by DSC and the result is shown in Fig. 6. As can be seen no Tg is measured but only a melting peak at 182 °C. In a previous study it has also been shown that amorphous inulin can absorb much higher amounts of water, compared to amorphous trehalose, without showing crystallization at room temperature [12]. This was further investigated by freeze-drying trehalose and inulin and compaction of powders, followed by storing the powders and compacts under various conditions. In Table III the results of the investigation of trehalose are given. As can be seen, freeze-dried trehalose remains amorphous when stored under dry conditions.
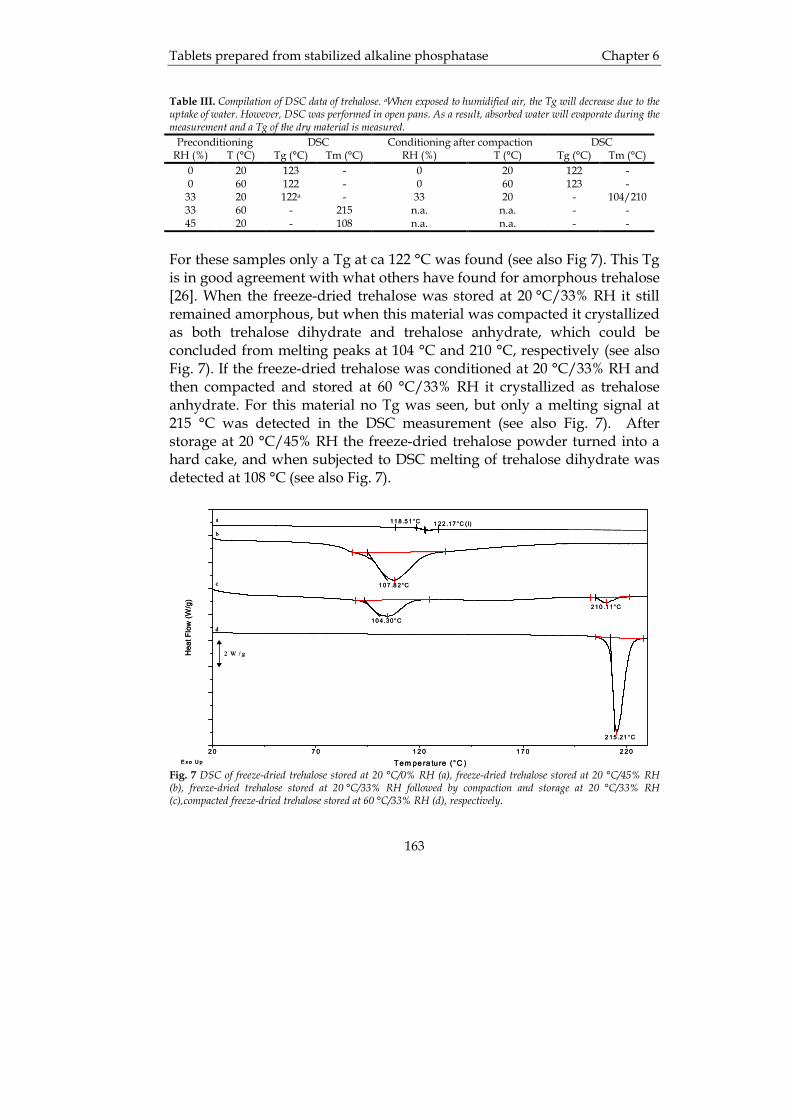
Tablets prepared from stabilized alkaline phosphatase Chapter 6
163
Table III. Compilation of DSC data of trehalose. aWhen exposed to humidified air, the Tg will decrease due to the uptake of water. However, DSC was performed in open pans. As a result, absorbed water will evaporate during the measurement and a Tg of the dry material is measured.
Preconditioning DSC Conditioning after compaction DSC RH (%) T (°C) Tg (°C) Tm (°C) RH (%) T (°C) Tg (°C) Tm (°C)
0 20 123 - 0 20 122 - 0 60 122 - 0 60 123 -
33 20 122a - 33 20 - 104/210 33 60 - 215 n.a. n.a. - - 45 20 - 108 n.a. n.a. - -
For these samples only a Tg at ca 122 °C was found (see also Fig 7). This Tg is in good agreement with what others have found for amorphous trehalose [26]. When the freeze-dried trehalose was stored at 20 °C/33% RH it still remained amorphous, but when this material was compacted it crystallized as both trehalose dihydrate and trehalose anhydrate, which could be concluded from melting peaks at 104 °C and 210 °C, respectively (see also Fig. 7). If the freeze-dried trehalose was conditioned at 20 °C/33% RH and then compacted and stored at 60 °C/33% RH it crystallized as trehalose anhydrate. For this material no Tg was seen, but only a melting signal at 215 °C was detected in the DSC measurement (see also Fig. 7). After storage at 20 °C/45% RH the freeze-dried trehalose powder turned into a hard cake, and when subjected to DSC melting of trehalose dihydrate was detected at 108 °C (see also Fig. 7).
1 22 .17 °C (I)11 8 .5 1°C
2 15 .21 °C
107 .8 2°C
10 4.30°C
210 .1 1°C
Hea
t Flo
w (W
/g)
2 0 7 0 1 2 0 1 7 0 2 2 0
Tem pe ra tu re (°C )E xo U p
2 W / g
d
c
b
a1 22 .17 °C (I)11 8 .5 1°C
2 15 .21 °C
107 .8 2°C
10 4.30°C
210 .1 1°C
Hea
t Flo
w (W
/g)
2 0 7 0 1 2 0 1 7 0 2 2 0
Tem pe ra tu re (°C )E xo U p
2 W / g
d
c
b
a
Fig. 7 DSC of freeze-dried trehalose stored at 20 °C/0% RH (a), freeze-dried trehalose stored at 20 °C/45% RH (b), freeze-dried trehalose stored at 20 °C/33% RH followed by compaction and storage at 20 °C/33% RH (c),compacted freeze-dried trehalose stored at 60 °C/33% RH (d), respectively.
Chapter 6 Tablets prepared from stabilized alkaline phosphatase
164
When all these results are taken together it is evident that moisture and elevated temperature facilitates crystallization of amorphous trehalose. Moreover, crystallization is also induced when the powders are compacted. In previous studies of the crystallization behaviour of trehalose it was found that amorphous trehalose that was humidified at RHs below 44% would not crystallize due to lack of water [7, 8]. However, if the amorphous trehalose was exposed to RHs above 44% it rapidly crystallized. The crystallization of trehalose has previously been claimed to be the reason for the loss of protection of lactase [8]. The results that were found in our investigation of the crystallization behaviour of amorphous trehalose in combination with the findings of others support our assumption that crystallization of trehalose indeed was the reason for the loss of protection and subsequent degradation of the BIAP during the stability study. For inulin it was found that it remained amorphous in climates up to 45% RH, and no collapse of the material was visible. Even when inulin was stored at 60 °C/33% RH it did not crystallize, not even after compaction. These results clearly show that inulin has a lower tendency to crystallize than trehalose, which further explains why the alkaline phosphatase was more stable when freeze-dried with inulin than with trehalose. It is evident that in order to achieve a good stabilization of a protein the use of inulin as stabilizer is to prefer above trehalose. 6.4 Conclusions Tablets with adequate tensile strengths and low friability can be made of amorphous inulin. The moisture content in the material affected the compaction properties of inulin. In addition, the results indicate that tablets can be made of proteins incorporated in the inulin glass without loss of activity during compaction and subsequent storage, which is not the case for trehalose. Our assumption that crystallization of trehalose was the reason for the lost activity of BIAP was also confirmed. Indeed, it was found that amorphous trehalose started crystallizing when exposed to various process conditions, such as increased RH, increased temperature and compaction, a phenomenon that was not found for amorphous inulin. These findings point to the superiority as stabilizer of amorphous inulin over amorphous trehalose. Inulin can be processed under less tight conditions, i.e.

Tablets prepared from stabilized alkaline phosphatase Chapter 6
165
amorphous inulin can be exposed to higher RHs than amorphous trehalose, which readily crystallizes. Inulin is clearly a better choice than trehalose when solid dosage forms are prepared.
Chapter 6 Tablets prepared from stabilized alkaline phosphatase
166
6.5 References 1. Crowe, J.H., L.M. Crowe, J.F. Carpenter, and C. Aurell Wistrom,
Stabilization of dry phospholipid bilayers and proteins by sugars. Biochem J, 1987. 242(1): p. 1-10.
2. Wang, W., Instability, stabilization, and formulation of liquid protein
pharmaceuticals. Int J Pharm, 1999. 185(2): p. 129-188. 3. Wang, W., Lyophilization and development of solid protein
pharmaceuticals. Int J Pharm, 2000. 203(1-2): p. 1-60. 4. Ford, A.W. and P.J. Dawson, The effect of carbohydrate additives in the
freeze-drying of alkaline phosphatase. J Pharm Pharmacol, 1993. 45(2): p. 86-93.
5. Colaco, C.A.L.S., C.J.S. Smith, S. Sen, D.H. Roser, Y. Newman, S.
Ring, and B.J. Roser, Chemistry of Protein Stabilization by Trehalose. Am Chem Soc Symp Ser, 1994. 567: p. 222-240.
6. Crowe, L.M., D.S. Reid, and J.H. Crowe, Is trehalose special for
preserving dry biomaterials? Biophys J, 1996. 71(4): p. 2087-2093. 7. Cardona, S., C. Schebor, M.P. Buera, M. Karel, and J. Chirife,
Thermal stability of invertase in reduced-moisture amorphous matrices in relation to glassy state and trehalose crystallization. J Food Science, 1997. 62(1): p. 105-112.
8. Mazzobre, M.F., M. del Pilar, and J. Chirife, Protective role of trehalose
on thermal stability of lactase in relation to its glass and crystal forming properties and effect of delaying crystallization. Lebensm Wiss u Technol, 1997. 30: p. 324-329.
9. Schebor, C., L. Burin, M.P. Buera, J.M. Aguilera, and J. Chirife,
Glassy state and thermal inactivation of invertase and lactase in dried amorphous matrices. Biotechnol Prog, 1997. 13(6): p. 857-863.
Tablets prepared from stabilized alkaline phosphatase Chapter 6
167
10. Xie, G. and S.N. Timasheff, The thermodynamic mechanism of protein stabilization by trehalose. Biophys Chem, 1997. 64(1-3): p. 25-43.
11. Hatley, R.H.M. and J.A. Blair, Stabilisation and delivery of labile
materials by amorphous carbohydrates and their derivatives. J Mol Catal B, 1999. 7: p. 11-19.
12. Hinrichs, W.L., M.G. Prinsen, and H.W. Frijlink, Inulin glasses for the
stabilization of therapeutic proteins. Int J Pharm, 2001. 215(1-2): p. 163-174.
13. Eissens, A.C., G.K. Bolhuis, W.L. Hinrichs, and H.W. Frijlink, Inulin
as filler-binder for tablets prepared by direct compaction. Eur J Pharm Sci, 2002. 15(1): p. 31-38.
14. Neale, F.C., J.S. Clubb, D. Hotchkis, and S. Posen, Heat stability of
human placental alkaline phosphatase. J Clin Path, 1965. 18: p. 359-363. 15. Eriksson, H.J., W.L. Hinrichs, B. van Veen, G.W. Somsen, G.J. de
Jong, and H.W. Frijlink, Investigations into the stabilisation of drugs by sugar glasses: I. Tablets prepared from stabilised alkaline phosphatase. Int J Pharm, 2002. 249(1-2): p. 59-70.
16. Heckel, R.W., Density-Pressure Relationships in Powder Compaction.
Transactions of the Metallurgical Society of AIME, 1961. 221: p. 671-675.
17. Van der Voort Maarschalk, K., H. Vromans, G.K. Bolhuis, and C.F.
Lerk, The effect of viscoelasticity and tabletting speed on consolidation and relaxation of a viscoelastic material. Eur J Pharm Biopharm, 1996. 42(1): p. 49-55.
18. Van der Voort Maarschalk, K., K. Zuurman, H. Vromans, G.K.
Bolhuis, and C.F. Lerk, Porosity expansion of tablets as a result of bonding and deformation of particulate solids. Int J Pharm, 1996. 140: p. 185-193.
Chapter 6 Tablets prepared from stabilized alkaline phosphatase
168
19. European Pharmacopeia, 2001, fourth ed., Strasbourg, France, pp. 200-201.
20. Sebhatu, T., A.A. Elamin, and C. Ahlneck, Effect of moisture sorption
on tabletting characteristics of spray dried (15% amorphous) lactose. Pharm Res, 1994. 11(9): p. 1233-1238.
21. Sebhatu, T., C. Ahlneck, and G. Alderborn, The effect of moisture
content on the compression and bond-formation properties of amorphous lactose particles. Int J Pharm, 1997. 146: p. 101-114.
22. Steendam, R., H.W. Frijlink, and C.F. Lerk, Plasticisation of
amylodextrin by moisture. Consequences for compaction behaviour and tablet properties. Eur J Pharm Sci, 2001. 14(3): p. 245-254.
23. Nyström, C. and P.G. Karehill, The use of surface area measurements
for the evaluation of bonding surface area in compressed powders. Powder Technology, 1986. 47: p. 201-209.
24. Hancock, B.C. and G. Zografi, The relationship between the glass
transition temperature and the water content of amorphous pharmaceutical solids. Pharm Res, 1994. 11(4): p. 471-477.
25. Elamin, A.A., T. Sebhatu, and C. Ahlneck, The use of amorphous model
substances to study mechanically activated materials in the solid state. Int J Pharm, 1995. 119: p. 25-36.
26. Taylor, L.S. and P. York, Characterization of the phase transitions of
trehalose dihydrate on heating and subsequent dehydration. J Pharm Sci, 1998. 87(3): p. 347-355.
27. Saleki-Gerhardt, A. and G. Zografi, Non-isothermal and isothermal
crystallization of sucrose from the amorphous state. Pharm Res, 1994. 11(8): p. 1166-1173.

Delivery of an inulin-stabilized alkaline phosphatase Chapter 7
169
Chapter 7
Investigations into the stabilization of drugs by sugar glasses: Delivery of an inulin-stabilized
alkaline phosphatase in the intestinal lumen via the oral route
H.J.C. Eriksson, W.R. Verweij, K. Poelstra, W.L.J. Hinrichs, G.J. de Jong, G.W. Somsen, H.W. Frijlink. Int J Pharm, 2003. 257: p. 273-281.
Chapter 7 Delivery of an inulin-stabilized alkaline phosphatase
170
Summary In this study the possibility to deliver the acid sensitive enzyme alkaline phosphatase (AP) from calf intestine (CIAP) to the intestinal system by oral administration was investigated. Tablets were prepared and in vitro evaluated. Final proof of concept studies were performed in rats. This acid labile enzyme is potentially useful in the treatment of sepsis, a serious condition during which endotoxins can migrate into the blood stream. The CIAP was freeze-dried with inulin and subsequently compacted into round biconvex tablets with a diameter of 4 mm and a weight of 25-30 mg per tablet. The tablets were coated with an enteric coating in order to ensure their survival in the stomach. In vitro evaluation of tablets containing alkaline phosphatase from bovine intestine (BIAP) was the first step in the development. It was found that tablets without enteric coating dissolved rapidly in 0.10 M HCl with total loss of enzymatic activity of the alkaline phosphatase. Tablets that were coated were stable for at least two hours in 0.10 M HCl, but dissolved rapidly when the pH was increased to 6.8. Furthermore, it was shown that the enzymatic activity of the released BIAP was fully preserved. The in vivo test clearly showed that the oral administration of enteric coated tablets resulted in the release of enzymatically active CIAP in the intestinal lumen of rats. The location of the enhanced enzymatic activity of AP in the intestines varied with the time that had passed between the administration of the tablets and the sacrificing of the rats. Also, the level of enzymatic activity increased with an increasing number of tablets that were administered.
Delivery of an inulin-stabilized alkaline phosphatase Chapter 7
171
7.1 Introduction Pharmaceutically active proteins have been applied for decades. However, not many therapeutic proteins were available until the 1980s. Since that time rapid developments in molecular biology resulted in a fast increase in the number of such proteins. Currently, the FDA has approved over thirty different recombinant DNA-derived proteins, e.g., erythropoietin, interferon alpha-2a/b, somatropin, and follitropin beta and many more are already in a far stage of development. This fast growth calls for the development of formulations that provide stability of the drug during manufacturing and subsequent storage and that also provide patient friendly administration. Proteins are usually administered by subcutaneous injection, e.g., insulin and recombinant human growth hormone. The reason for this is the poor bioavailability of such drugs after oral administration [1]. However, if the therapeutic protein has its target in the intestinal tract it would be advantageous if it could be administered orally. One way to achieve this is to freeze-dry a solution of the protein with a sugar and then compact the product into tablets. Inclusion of the protein in the sugar glass protects it from degradation during further processing (e.g., compaction) and storage. Furthermore, the tablets need to be covered with an enteric coating in order to protect the active substance from the acidic environment in the stomach with its high enzymatic activity. In previous studies it has been found that the disaccharide trehalose is a good stabilizer for proteins during freeze-drying and subsequent storage [2-9]. Recently, we showed that inulin, an oligosaccharide, is a good alternative for trehalose [10]. It was shown that inulin-stabilized protein could be processed into tablets of sufficient mechanical strength and low friability without any loss of enzymatic activity of the incorporated protein [11]. Furthermore, it was found that both the stabilizing capacity and the compaction behaviour of inulin were superior to trehalose. In previous studies it was found that alkaline phosphatase (AP) is a highly promising therapeutic agent for the treatment of sepsis, which is caused by endotoxins produced by Gram-negative bacteria [12, 13]. Endotoxins can be detoxified by AP by the removal of a phosphate group from the lipid A moiety of the lipopolysaccharides. In case of sepsis the intestinal wall becomes more permeable, which leads to the translocation of
Chapter 7 Delivery of an inulin-stabilized alkaline phosphatase
172
endotoxins from the intestinal lumen into the blood stream. This may further deteriorate the condition of the patient. Increasing the local AP activity may therefore be highly relevant to detoxify luminal endotoxin and prevent their translocation into the bloodstream. Also when a patient is already suffering from sepsis, the oral delivery of AP may still be quite relevant. Even when no endotoxin is present in the blood stream the presence of cytokines in the blood leads to increased vascular permeability in the intestinal wall, which ultimately might lead to a second wave of endotoxins entering the bloodstream. Moreover, reperfusion ischemia induced by the septic shock may damage the intestinal wall too, again leading to leakage of macromolecules from the intestinal lumen into the blood. This might be prevented by the administration of AP to the intestines. In this study the possibility to deliver AP to the intestinal lumen via the oral route was investigated by the combination of a number of well-established techniques, such as freeze-drying, compaction and application of enteric coating. 7.2 Experimental Materials Inulin with a number/weight average degree of polymerization (DPn/DPw) of 23/26 was a gift from Sensus (Rosendaal, The Netherlands), alkaline phosphatase from calf intestine (CIAP) with a specific activity of 5937 U/mg was purchased from PharmAAware (Bunnik, The Netherlands). Alkaline phosphatase from bovine intestine (BIAP), para-nitrophenylphosphate (pNPP) and 2-amino-2-methyl-1,3-propanediol (ammediol) were purchased from Sigma-Aldrich (Steinheim, Germany). Triethyl citrate (citroflex) was from Fluka (Buchs, Switzerland). Sodium potassium tartrate and Folin reagent were purchased from Merck (Darmstadt, Germany). Copper sulfate was from Genfarma BV (Maarssen, The Netherlands) and bovine serum albumin (BSA) was from ICN Biochemicals (Aurora, Ohio, USA). Talc was from Genfarma (Zaandam, The Netherlands). Silicon antifoam suspension was from Boom (Meppel, The Netherlands). Eudragit L100-55 was from Röhm (Darmstadt, Germany). A Slide-A-Lyzer with a molecular weight cut off at Mw=3500 was from Pierce (Rockford, IL, USA). Sodium starch glycolate USP-NF

Delivery of an inulin-stabilized alkaline phosphatase Chapter 7
173
(Primojel) was from AVEBE (Veendam, The Netherlands). All other chemicals were purchased from commercial suppliers. Dialysis The CIAP was retrieved as a solution that contained glycerol. Since this substance strongly depresses the glass transition temperature of inulin it was removed by dialysis. A Slide-A-Lyzer (molecular weight cut-off: MW 3500) was filled with the sample solution (1 ml). Subsequently, dialysis was performed against 1 L of 5 mM Tris, 5 mM MgSO4, pH 8.6 at 4 °C for two days, during which the dialysis medium was refreshed twice. The dialyzed sample was then transferred to an Eppendorf tube and stored in a refrigerator at 4 °C until use. Determination of protein content After dialysis the total protein concentration of the sample was determined according to the method of Lowry [14]. A calibration curve was produced in the concentration range 0-50 µg/ml using BSA. Solution D was prepared by mixing 9.6 ml of solution A (8 mg/ml sodium hydroxide and 40 mg/ml sodium carbonate in water) with 0.2 ml of solution B (10 mg/ml copper sulfate in water) and 0.2 ml of solution C (20 mg/ml sodium potassium tartrate in water). To 500 µl of sample, 500 µl of solution D was added. After 10 minutes 100 µl of Folin reagent (diluted 1:1 with water) was added to the mixture. The samples were then stored for 1 h in darkness. Subsequently, the absorbance of the samples at 700 nm was measured using a Philips UV 2100 spectrophotometer (Eindhoven, The Netherlands). Activity assay of alkaline phosphatase The activity of BIAP was determined by following the enzymatic conversion of the substrate pNPP to para-nitrophenol according to a previously published method [10]. A standard curve was prepared by measuring the activity of BIAP in the range 0 to 50 µg/ml in 0.05 M ammediol buffer pH 9.8. For the samples of the in vitro dissolution test the standard curve was prepared using the dissolution testing medium as solvent. The activity of the CIAP was determined using the same assay, but the activity was expressed in units (U): 1 U corresponds to the conversion of 1 µmol of substrate per min at 37 °C. In these calculations the molar absorption coefficient of the product (4-nitrophenol) at 405 nm was taken 18 450 L/mol·cm [15].
Chapter 7 Delivery of an inulin-stabilized alkaline phosphatase
174
Freeze-drying Solutions of 10% w/v of inulin, 10% w/v inulin/BIAP 19/1 w/w and 10% w/v inulin/CIAP (approximately 110 units/mg inulin), all in 0.05 M ammediol pH 9.8, were freeze-dried as described previously [11]. Tablet production Freeze-dried material (inulin or AP/inulin) was ground to a fine powder and stored at 20 °C/0% relative humidity (RH) for at least 3 days. Subsequently, the material was stored at 20 °C/45% RH for at least 2 days. If primojel (5% w/w) was incorporated in the tablets, this was mixed with pestle and mortar followed by mixing with a Turbula mixer (Willy A. Bachofen AG Maschinenfabrik, Basel, Switzerland) for 30 min. Round biconvex tablets with a diameter of 4 mm and a weight of about 25-30 mg per tablet were compacted. An automated hydraulic press from ESH Hydro Mooi (Appingedam, The Netherlands) was used to employ a compaction pressure of about 110 MPa. After compaction the tablets were stored in the vacuum desiccator at room temperature. The compaction behaviour of freeze-dried inulin has been described in an earlier publication [11]. Coating procedure Tablets were coated with poly(methacrylic acid-co-methyl-methacrylate) (Eudragit L100-55). The acidic groups are protonated at acidic pH, which leads to insolubility of the material. When the pH is increased the solubility increases due to deprotonation of the polymer. A 30% w/w suspension of Eudragit L100-55 was prepared in 0.14 M NaOH. 2.5 g of this suspension was mixed with isopropanol (2 g), talc (0.375 g), citroflex (0.075 g) and silicon antifoam (0.05 g). This suspension was used for the application of the first coating layer, which was performed by adding small drops (ca. 10 µl) of the liquid to each tablet. Each individual tablet was then rolled under a stream of warm air until the isopropanol had evaporated. Following the first layer, nine additional layers of coating were applied to a total coating weight of about 7 mg. The suspension for these layers was made in a similar way, except that water instead of isopropanol was used as solvent. After the coating procedure was complete the tablets were stored in a vacuum desiccator at room temperature until used for other experiments.
Delivery of an inulin-stabilized alkaline phosphatase Chapter 7
175
In vitro dissolution of tablets The in vitro tests were performed in dissolution testing baths from Prolabo (Rowa Techniek B.V., Leiderdorp, The Netherlands). The dissolution behaviour of the tablets was evaluated first in 750 ml 0.10 M HCl at 37 °C and a rotation speed of 100 rpm for 120 min to test the acid resistance of the tablets. Subsequently, 250 ml 0.20 M Na3PO4 (preheated to a temperature of 37 °C) was added to the dissolution vessel to increase the pH to 6.8 (tablets without coating were only exposed to the acid stage). Throughout the test, 1.0 ml samples were taken at different time intervals. Each experiment was performed in triplicate. Immediately after being taken samples for the determination of enzymatic activity were diluted to 10 ml in 0.05 M ammediol pH 9.8 in order to stop the acid induced degradation. The amount of dissolved inulin was determined by using the anthron reaction [16]. To 1.0 ml of standard or sample 2.0 ml of a solution of anthron in concentrated sulfuric acid (0.10% w/w) was added. Immediately after addition of the anthron solution the samples were mixed using a vortex. After 10 minutes the samples were placed in a water bath of 20 °C to cool the samples to room temperature. The absorbance at 625 nm of the samples was then measured using a Philips UV 2100 spectrophotometer (Eindhoven, The Netherlands). In vivo test Oral administration of CIAP tablets to rats Animal experiments were conducted according to the guidelines provided by the Dutch Animal Protection Act, and were approved by the Committee for Animal Experimentation (DEC) of the University of Groningen. For all experiments male Male Wistar rats, 190 – 200 g on arrival were allowed to adapt for 1 week. During the experiment, i.e. from the time point of administration of the tablet(s) until sacrifice, rats were refrained from food. In the case of the 7.5 and 12.5 h time-interval studies, rats were also fasting during the night period prior to the experiment. Just prior to the administration of the tablets, rats were anaesthetized with isofluran/O2/N2O and the tablet(s) were placed at the back of the throat by a pair of tweezers and gently forced into the upper part of the esophagus by a bent, blunt probe. During recovery from anaesthesia, rats were stimulated to swallow by gentle throat massage.
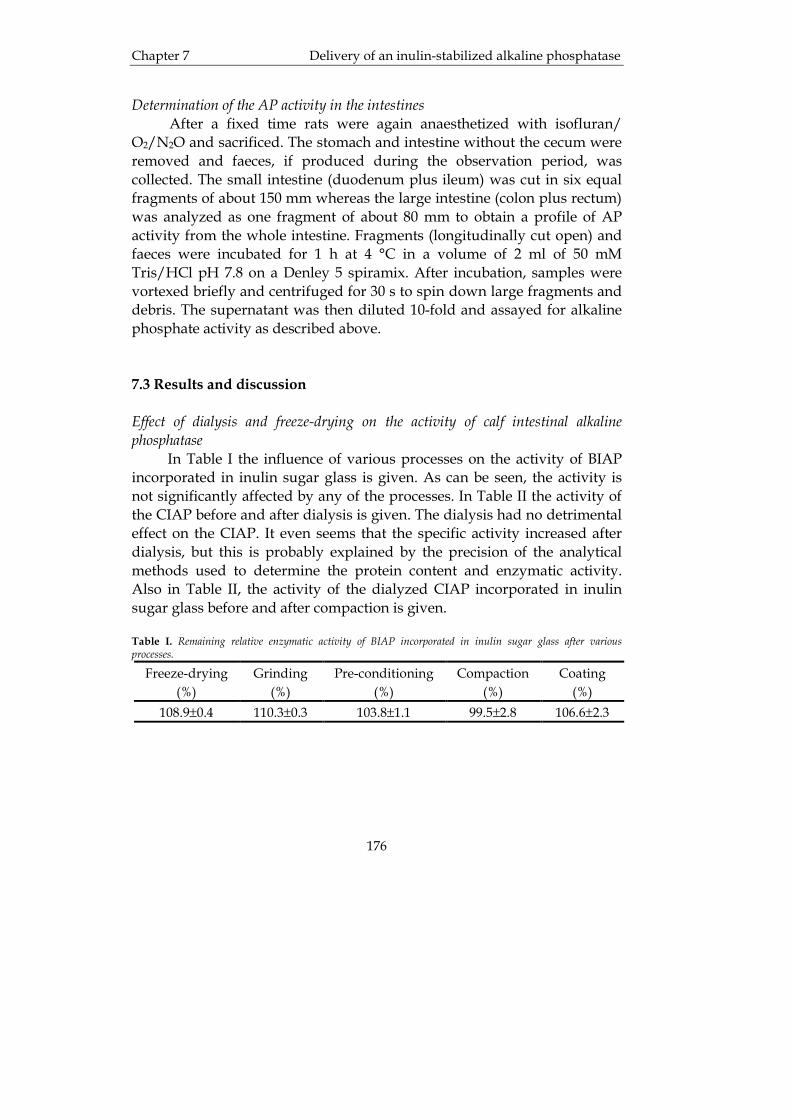
Chapter 7 Delivery of an inulin-stabilized alkaline phosphatase
176
Determination of the AP activity in the intestines After a fixed time rats were again anaesthetized with isofluran/ O2/N2O and sacrificed. The stomach and intestine without the cecum were removed and faeces, if produced during the observation period, was collected. The small intestine (duodenum plus ileum) was cut in six equal fragments of about 150 mm whereas the large intestine (colon plus rectum) was analyzed as one fragment of about 80 mm to obtain a profile of AP activity from the whole intestine. Fragments (longitudinally cut open) and faeces were incubated for 1 h at 4 °C in a volume of 2 ml of 50 mM Tris/HCl pH 7.8 on a Denley 5 spiramix. After incubation, samples were vortexed briefly and centrifuged for 30 s to spin down large fragments and debris. The supernatant was then diluted 10-fold and assayed for alkaline phosphate activity as described above. 7.3 Results and discussion Effect of dialysis and freeze-drying on the activity of calf intestinal alkaline phosphatase In Table I the influence of various processes on the activity of BIAP incorporated in inulin sugar glass is given. As can be seen, the activity is not significantly affected by any of the processes. In Table II the activity of the CIAP before and after dialysis is given. The dialysis had no detrimental effect on the CIAP. It even seems that the specific activity increased after dialysis, but this is probably explained by the precision of the analytical methods used to determine the protein content and enzymatic activity. Also in Table II, the activity of the dialyzed CIAP incorporated in inulin sugar glass before and after compaction is given. Table I. Remaining relative enzymatic activity of BIAP incorporated in inulin sugar glass after various processes.
Freeze-drying (%)
Grinding (%)
Pre-conditioning (%)
Compaction (%)
Coating (%)
108.9±0.4 110.3±0.3 103.8±1.1 99.5±2.8 106.6±2.3
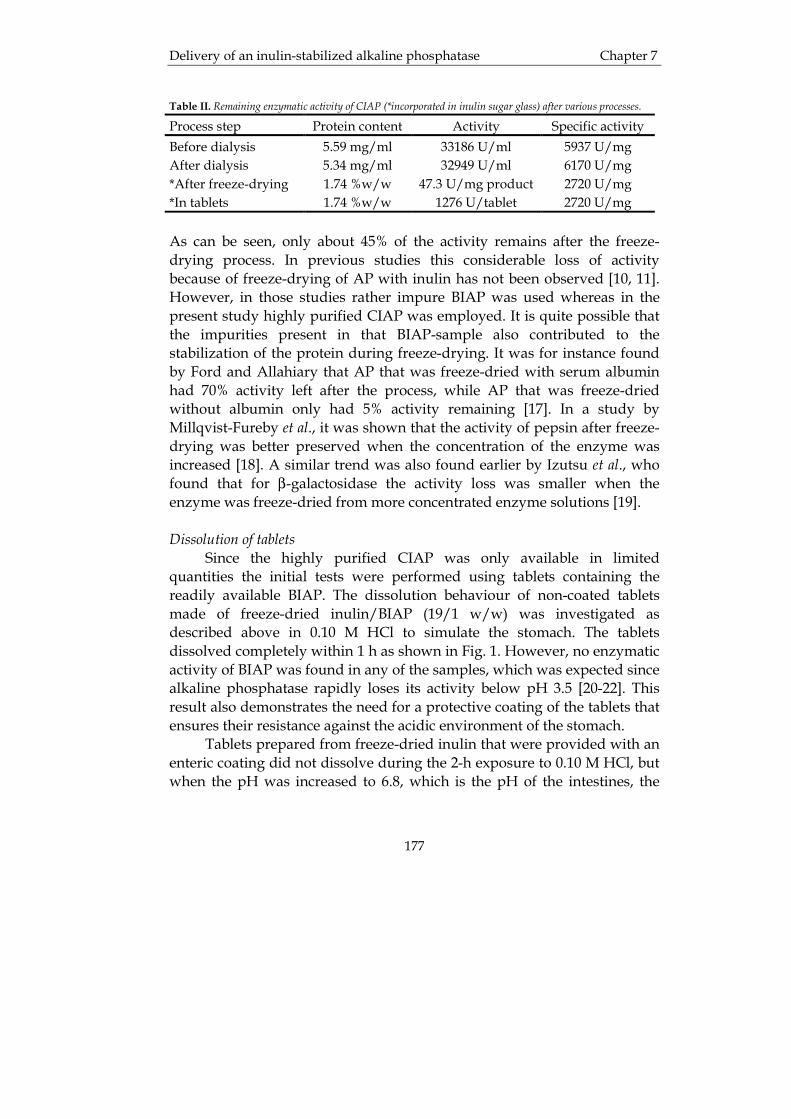
Delivery of an inulin-stabilized alkaline phosphatase Chapter 7
177
Table II. Remaining enzymatic activity of CIAP (*incorporated in inulin sugar glass) after various processes.
Process step Protein content Activity Specific activity Before dialysis 5.59 mg/ml 33186 U/ml 5937 U/mg After dialysis 5.34 mg/ml 32949 U/ml 6170 U/mg *After freeze-drying 1.74 %w/w 47.3 U/mg product 2720 U/mg *In tablets 1.74 %w/w 1276 U/tablet 2720 U/mg As can be seen, only about 45% of the activity remains after the freeze-drying process. In previous studies this considerable loss of activity because of freeze-drying of AP with inulin has not been observed [10, 11]. However, in those studies rather impure BIAP was used whereas in the present study highly purified CIAP was employed. It is quite possible that the impurities present in that BIAP-sample also contributed to the stabilization of the protein during freeze-drying. It was for instance found by Ford and Allahiary that AP that was freeze-dried with serum albumin had 70% activity left after the process, while AP that was freeze-dried without albumin only had 5% activity remaining [17]. In a study by Millqvist-Fureby et al., it was shown that the activity of pepsin after freeze-drying was better preserved when the concentration of the enzyme was increased [18]. A similar trend was also found earlier by Izutsu et al., who found that for β-galactosidase the activity loss was smaller when the enzyme was freeze-dried from more concentrated enzyme solutions [19]. Dissolution of tablets Since the highly purified CIAP was only available in limited quantities the initial tests were performed using tablets containing the readily available BIAP. The dissolution behaviour of non-coated tablets made of freeze-dried inulin/BIAP (19/1 w/w) was investigated as described above in 0.10 M HCl to simulate the stomach. The tablets dissolved completely within 1 h as shown in Fig. 1. However, no enzymatic activity of BIAP was found in any of the samples, which was expected since alkaline phosphatase rapidly loses its activity below pH 3.5 [20-22]. This result also demonstrates the need for a protective coating of the tablets that ensures their resistance against the acidic environment of the stomach. Tablets prepared from freeze-dried inulin that were provided with an enteric coating did not dissolve during the 2-h exposure to 0.10 M HCl, but when the pH was increased to 6.8, which is the pH of the intestines, the
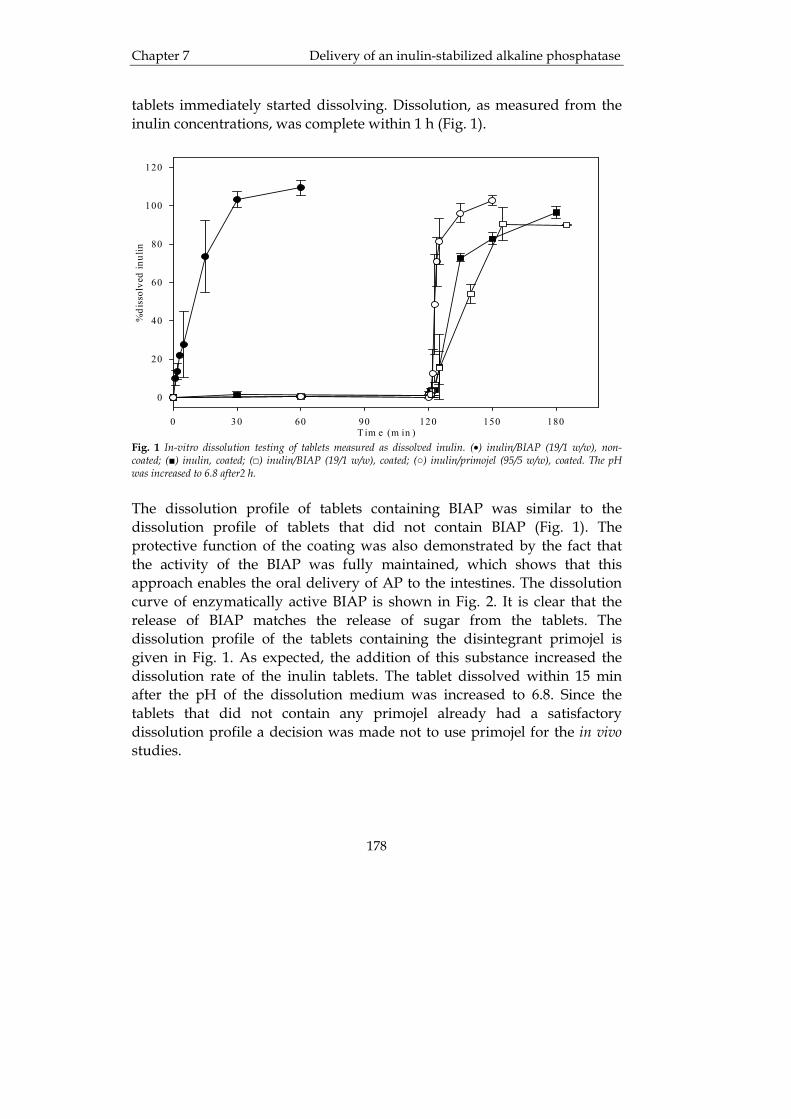
Chapter 7 Delivery of an inulin-stabilized alkaline phosphatase
178
tablets immediately started dissolving. Dissolution, as measured from the inulin concentrations, was complete within 1 h (Fig. 1).
T im e (m in )0 30 60 90 120 150 180
%di
ssol
ved
inul
in
0
20
40
60
80
100
120
Fig. 1 In-vitro dissolution testing of tablets measured as dissolved inulin. (•) inulin/BIAP (19/1 w/w), non-coated; (■) inulin, coated; (□) inulin/BIAP (19/1 w/w), coated; (○) inulin/primojel (95/5 w/w), coated. The pH was increased to 6.8 after2 h. The dissolution profile of tablets containing BIAP was similar to the dissolution profile of tablets that did not contain BIAP (Fig. 1). The protective function of the coating was also demonstrated by the fact that the activity of the BIAP was fully maintained, which shows that this approach enables the oral delivery of AP to the intestines. The dissolution curve of enzymatically active BIAP is shown in Fig. 2. It is clear that the release of BIAP matches the release of sugar from the tablets. The dissolution profile of the tablets containing the disintegrant primojel is given in Fig. 1. As expected, the addition of this substance increased the dissolution rate of the inulin tablets. The tablet dissolved within 15 min after the pH of the dissolution medium was increased to 6.8. Since the tablets that did not contain any primojel already had a satisfactory dissolution profile a decision was made not to use primojel for the in vivo studies.
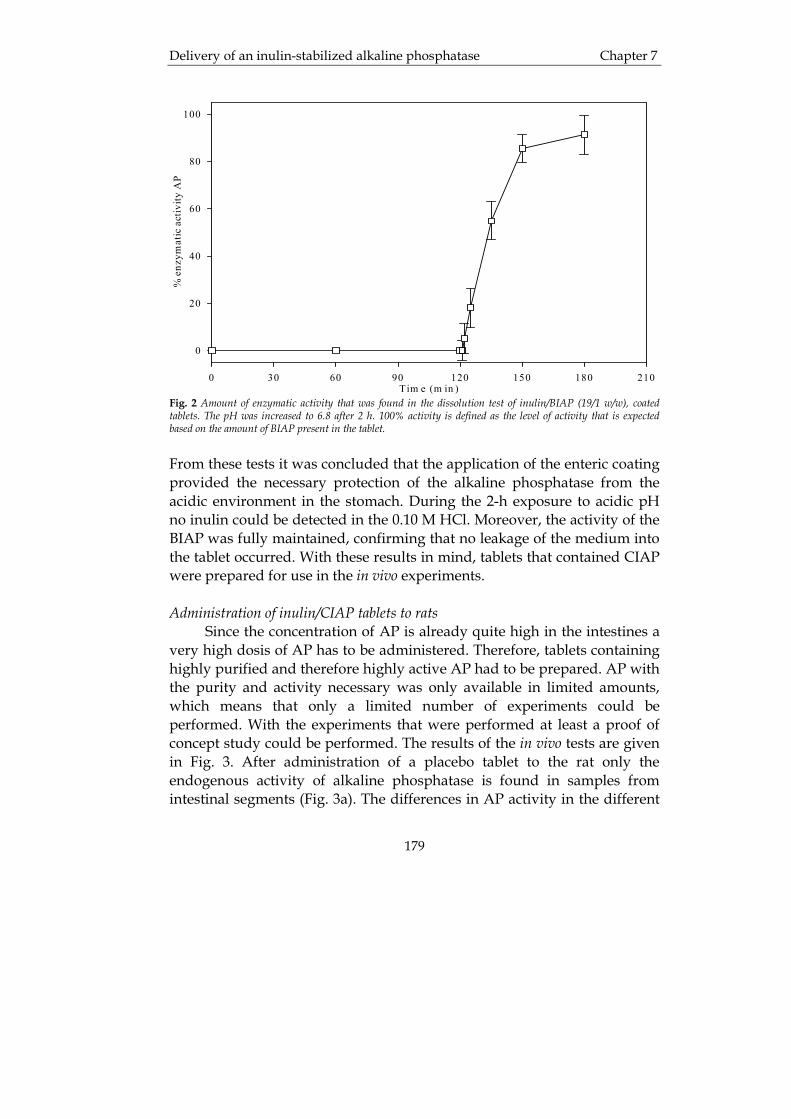
Delivery of an inulin-stabilized alkaline phosphatase Chapter 7
179
Tim e (m in )0 30 60 90 120 150 180 210
% e
nzym
atic
act
ivity
AP
0
20
40
60
80
100
Fig. 2 Amount of enzymatic activity that was found in the dissolution test of inulin/BIAP (19/1 w/w), coated tablets. The pH was increased to 6.8 after 2 h. 100% activity is defined as the level of activity that is expected based on the amount of BIAP present in the tablet.
From these tests it was concluded that the application of the enteric coating provided the necessary protection of the alkaline phosphatase from the acidic environment in the stomach. During the 2-h exposure to acidic pH no inulin could be detected in the 0.10 M HCl. Moreover, the activity of the BIAP was fully maintained, confirming that no leakage of the medium into the tablet occurred. With these results in mind, tablets that contained CIAP were prepared for use in the in vivo experiments. Administration of inulin/CIAP tablets to rats Since the concentration of AP is already quite high in the intestines a very high dosis of AP has to be administered. Therefore, tablets containing highly purified and therefore highly active AP had to be prepared. AP with the purity and activity necessary was only available in limited amounts, which means that only a limited number of experiments could be performed. With the experiments that were performed at least a proof of concept study could be performed. The results of the in vivo tests are given in Fig. 3. After administration of a placebo tablet to the rat only the endogenous activity of alkaline phosphatase is found in samples from intestinal segments (Fig. 3a). The differences in AP activity in the different

Chapter 7 Delivery of an inulin-stabilized alkaline phosphatase
180
samples reflect the natural profile in the intestine. First, the effect of time between the administration of the tablets and the sacrifying of the rats was investigated. After 7.5 h a considerable increase in enzymatic activity was found in the first fragment of the small intestine (Fig. 3b), and after 12.5 h (Fig. 3c) this increase was evident in the last fragment of the small intestine but, most strikingly, the enzymatic activity was very large in the faeces that had been produced by this rat. This was the only rat that produced faeces.
Stomach Frag. 1 Frag. 2 Frag. 3 Frag. 4 Frag. 5 Frag. 6 Colon Faeces
Units
0
50
100
150
200
250
300
Stomach Frag. 1 Frag. 2 Frag. 3 Frag. 4 Frag. 5 Frag. 6 Colon Faeces
Units
0
50
100
150
200
250
300
Stomach Frag. 1 Frag. 2 Frag. 3 Frag. 4 Frag. 5 Frag. 6 Colon Faeces
Units
0
50
100
150
200
250
300
Stomach Frag. 1 Frag. 2 Frag. 3 Frag. 4 Frag. 5 Frag. 6 Colon Faeces
Units
0
50
100
150
200
250
300
Stomach Frag. 1 Frag. 2 Frag. 3 Frag. 4 Frag. 5 Frag. 6 Colon Faeces
Units
0
50
100
150
200
250
300
a
b
c
d
e
Placebo
1 AP-tablet, t=7.5 h
1 AP-tablet, t=12.5 h
1 AP-tablet, t=16 h
2 AP-tablets, t=16 h
Fig. 3 Results of the in-vivo tests. The enzymatic activity found after administration of: (a) the placebo tablet, rat sacrificed after 16 h; (b) one tablet with CIAP, rat sacrificed after 7.5 h; (c) one tablet with CIAP, rat sacrificed after 12.5 h; (d) one tablet with CIAP, rat sacrificed after 16 h; (e) two tablets with CIAP, rat sacrificed after 16 h. With a time-interval of 16 h between administration of tablets and sacrifice (Fig. 3d), all the increase in enzymatic activity was found in the colon.

Delivery of an inulin-stabilized alkaline phosphatase Chapter 7
181
Finally, the effect of two tablets on local AP activity in the intestine was examined, 16 h after oral application of the tablets. In this case the increase in enzymatic activity was also found in the last fragment of the small intestine and in the colon (Fig. 3e). It was also found that the increase was considerably higher compared to the one tablet administration (cf. Fig. 3d). Even though each tablet contained approximately 1200-1300 units of CIAP only about one third of this was found in the enzymatic activity assays. This can be explained by the presence of trypsin and other digestive enzymes in the intestine, which most likely digested a substantial part of the administered AP. It is also possible that part of the active site of the AP was occupied by free inorganic phosphate and/or endotoxins that inevitably are present in the samples. These substances are known to attenuate the AP activity. In addition, phosphorylcholine, which also has been reported to act as a susbstrate for intestinal alkaline phosphatase [23], might have influenced the enzymatic activity of AP. These results indicate that if substantially less than 1200 units of CIAP is administered it is likely that no activity at all will be found back in the enzymatic activity assay. 7.4 Conclusions Even though each technique used in this study is not new the combination of them is. The present study describes a combination of in vitro and in vivo studies, although the latter only provides a proof of concept. For the in vivo studies very pure enzyme preparations with very high specific activity was needed. These pure enzyme preparations can only be obtained in low yield, thus limiting the number of in vivo experiments. It was shown that the inclusion in a sugar glass by freeze-drying, compaction to tablets and enteric coating, enable the intestinal delivery of inulin-stabilized AP to rats via the oral route. The successful delivery of this highly acid-sensitive enzyme opens the possibility to deliver other therapeutically interesting proteins to the intestines, where a local therapeutical effect can be achieved.

Chapter 7 Delivery of an inulin-stabilized alkaline phosphatase
182
7.5 Acknowledgements The authors would like to thank Anne-Miek van Loenen-Weemaes for her helpful assistance in the performance of the in vivo tests.

Delivery of an inulin-stabilized alkaline phosphatase Chapter 7
183
7.6 References 1. Cleland, J.L., A. Daugherty, and R. Mrsny, Emerging protein delivery
methods. Curr Opin Biotechnol, 2001. 12(2): p. 212-219. 2. Cardona, S., C. Schebor, M.P. Buera, M. Karel, and J. Chirife, Thermal
stability of invertase in reduced-moisture amorphous matrices in relation to glassy state and trehalose crystallization. J Food Science, 1997. 62(1): p. 105-112.
3. Colaco, C.A.L.S., C.J.S. Smith, S. Sen, D.H. Roser, Y. Newman, S.
Ring, and B.J. Roser, Chemistry of Protein Stabilization by Trehalose. Am Chem Soc Symp Ser, 1994. 567: p. 222-240.
4. Crowe, L.M., D.S. Reid, and J.H. Crowe, Is trehalose special for
preserving dry biomaterials? Biophys J, 1996. 71(4): p. 2087-2093. 5. Ford, A.W. and P.J. Dawson, The effect of carbohydrate additives in the
freeze-drying of alkaline phosphatase. J Pharm Pharmacol, 1993. 45(2): p. 86-93.
6. Hatley, R.H.M. and J.A. Blair, Stabilisation and delivery of labile
materials by amorphous carbohydrates and their derivatives. J Mol Catal B, 1999. 7: p. 11-19.
7. Mazzobre, M.F., M. del Pilar, and J. Chirife, Protective role of trehalose
on thermal stability of lactase in relation to its glass and crystal forming properties and effect of delaying crystallization. Lebensm Wiss u Technol, 1997. 30: p. 324-329.
8. Schebor, C., L. Burin, M.P. Buera, J.M. Aguilera, and J. Chirife, Glassy
state and thermal inactivation of invertase and lactase in dried amorphous matrices. Biotechnol Prog, 1997. 13(6): p. 857-863.
9. Xie, G. and S.N. Timasheff, The thermodynamic mechanism of protein
stabilization by trehalose. Biophys Chem, 1997. 64(1-3): p. 25-43.
Chapter 7 Delivery of an inulin-stabilized alkaline phosphatase
184
10. Hinrichs, W.L., M.G. Prinsen, and H.W. Frijlink, Inulin glasses for the stabilization of therapeutic proteins. Int J Pharm, 2001. 215(1-2): p. 163-174.
11. Eriksson, H.J., W.L. Hinrichs, B. van Veen, G.W. Somsen, G.J. de Jong,
and H.W. Frijlink, Investigations into the stabilisation of drugs by sugar glasses: I. Tablets prepared from stabilised alkaline phosphatase. Int J Pharm, 2002. 249(1-2): p. 59-70.
12. Bentala, H., W.R. Verweij, A. Huizinga-Van der Vlag, A.M. van
Loenen-Weemaes, D.K. Meijer, and K. Poelstra, Removal of phosphate from lipid A as a strategy to detoxify lipopolysaccharide. Shock, 2002. 18(6): p. 561-566.
13. Poelstra, K., W.W. Bakker, P.A. Klok, M.J. Hardonk, and D.K. Meijer,
A physiologic function for alkaline phosphatase: endotoxin detoxification. Lab Invest, 1997. 76(3): p. 319-327.
14. Lowry, O.H., N.J. Roseborough, A.L. Farr, and R.J. Randall, Protein
measurement with the Folin phenol reagent. J Biol Chem, 1951. 193: p. 265-275.
15. Craig, D.B., J.C.Y. Wong, and N.J. Dovichi, Detection of attomolar
concentrations of alkaline phosphatase by capillary electrophoresis using laser-induced fluorescence detection. Anal Chem, 1996. 68: p. 697-700.
16. Scott, T.A. and E.H. Melvin, Determination of dextran with anthrone.
Analytical Chemistry, 1953. 25(11): p. 1656-1661. 17. Ford, A.W. and Z. Allahiary, The adverse effect of glycation of human
serum albumin on its preservative activity in the freeze-drying and accelerated degradation of alkaline phosphatase. J Pharm Pharmacol, 1993. 45(10): p. 900-906.
18. Millqvist-Fureby, A., M. Malmsten, and B. Bergenstahl, Surface
characterization of freeze-dried protein/carbohydrate mixtures. Int J Pharm, 1999. 191: p. 103-114.

Delivery of an inulin-stabilized alkaline phosphatase Chapter 7
185
19. Izutsu, K., S. Yoshioka, and T. Terao, Stabilization of β-galactosidase by amphiphilic additives during freeze-drying. Int J Pharm, 1993. 90: p. 187-194.
20. Butterworth, P.J., The reversible inactivation of pig kidney alkaline
phosphatase at low pH. Biochem J, 1968. 108(2): p. 243-246. 21. Eriksson, H.J., G.W. Somsen, W.L. Hinrichs, H.W. Frijlink, and G.J. de
Jong, Characterization of human placental alkaline phosphatase by activity and protein assays, capillary electrophoresis and matrix-assisted laser desorption/ionization time-of-flight mass spectrometry. J Chromatogr, 2001. 755(1-2): p. 311-319.
22. Scutt, P.B. and D.W. Moss, Reversible inactivation of alkaline phosphatase
in acid solution. Enzymologia, 1968. 35(3): p. 157-167. 23. Irino, T., M. Matsushita, Y. Sakagishi, and T. Komoda,
Phosphorylcholine as a unique substrate for human intestinal alkaline phosphatase. Int J Biochem, 1994. 26(2): p. 273-277.

Chapter 7 Delivery of an inulin-stabilized alkaline phosphatase
186
Conclusions and perspectives Chapter 8
187
Chapter 8
Conclusions and perspectives Pharmaceutical proteins are fundamentally different from the traditional low molecular weight pharmaceuticals in a number of ways. For small drugs a limited number of analytical techniques commonly suffices to reliably characterize them. However, proteins are much more complex, and assessing their characteristics (purity, identity, and conformation) is indeed a challenge. Proteins are constructed from L-amino acids (sometimes conjugated with sugar molecules) forming a sequence called the primary structure. The amino acid chain turns into random coils, alpha helices and beta sheets (secondaty structure) and folds in a three-dimensional shape (tertiary structure). Sometimes protein monomers join to form a quaternary structure. The activity of a protein, but also its potential toxicity/immunogenicity, depends on its structure. Therefore, protein unfolding, aggregation and interactions with formulation excipients are important quality parameters that ideally should be monitored. What also complicates matters is that pharmaceutical proteins may consist of several isoforms. Furthermore, pharmaceutical proteins may comprise (toxic) contaminants, e.g., proteinaceous entities, originating from the cell expression systems. Also, in formulation of biopharmaceuticals components such as buffers, stabilizers and other excipients further complicate the sample. This means that quality control of proteins often poses a mixture analysis problem requiring efficient separation techniques. In this thesis, particular attention was paid to the potential of capillary electrophoresis (CE) for the analysis of a protein therapeutic. CE offers efficient and fast separations requiring only small sample amounts, and is highly useful for drug impurity analysis. Capillary zone electrophoresis (CZE) is the simplest and most popular form of CE, where separation is carried out using buffers with low ionic strength. Separation is based on differences in mass-to-charge ratios of the analytes being small molecules or large macromolecules such as proteins. The high efficiency of CZE allows separation of molecules with subtle differences in mass-to-charge ratio such as isoforms of glycoproteins. Also changes in protein charge as a result of, e.g., chemical degradation (e.g., oxidation or reduction) are reflected in the observed electrophoretic mobility. CZE was applied to the analysis of the protein alkaline phosphatase (AP), which
Chapter 8 Conclusions and perspectives
188
potentially is useful for the treatment of sepsis. In this thesis, the utility of capillary electrophoresis, alone and in combination with other techniques, to give information about AP and other protein containing samples was evaluated. In chapter 2 and 3 the employment of several analytical techniques to monitor the purification and stability of AP is illustrated. It was revealed that the combination of CZE, MALDI-TOF-MS, capillary gel electrophoresis and enzymatic activity assays is a powerful array of techniques that is able to elucidate the progress of an isolation and purification procedure for AP involving ion-exchange chromatography followed by affinity chromatography. In fact, the combination of these analytical techniques showed that ion-exchange chromatography alone was insufficient to achieve a fully purified protein (see chapter 2). The potential of CZE for the monitoring of the stability of placental alkaline phosphatase was also established. AP that was exposed to various harsh conditions, i.e. acidic and basic pH and freeze-drying, lost its enzymatic activity in a manner that was reflected in the appearance of the recorded electropherograms. In fact, after freeze-drying and storage of AP only minor changes in enzymatic activity were observed, while analysis by CE revealed the formation of new entities, probably aggregates (see chapter 3). So exposure of the protein can lead to changes in the observed peak pattern in CE-analysis, although they are not always correlated to changes in activity and vice versa. The utility of CE for purity and stability analysis of AP was demonstrated. Still, CE offers some additional characteristics for the analysis of pharmaceutical proteins that are worthwhile to be further explored. CE is performed in simple buffers and the high electric field strengths do not affect the protein structure. This means that denaturation or unfolding caused by organic solvents and or high salt concentrations or interaction with stationary phases (like frequently occurs in liquid chromatography) is eliminated. In other words, CE allows detection of proteins in their native state, and thus gives a 'true' picture of the protein in the analyzed sample. In addition, CE in itself can provide information on the structure of the protein. The CE separation mechanism is governed by electrophoretic mobility which also is a function of size of the ionic species. This means that changes in protein size (unfolding/aggregation) in principle could be probed by CE . To gain more specific information about proteins than what can be retrieved by a UV-detector, combination of CE with mass spectrometry
Conclusions and perspectives Chapter 8
189
(MS) is indicated. In chapter 4, it was found that direct coupling of CZE to MS using “normal” CE buffers can be performed. Generally, it has been believed that the buffers commonly employed in CZE, e.g., phosphate buffers and borate buffers, are incompatible with electrospray ionization (ESI) MS and that electrolytes such as acetic and formic acid as well as acetate and formate buffers are the preferred choice. Unfortunately, these often do not yield an optimal performance during CZE. Nevertheless, the findings in this thesis show that borate buffers in particular do not lead to serious ion-suppression effects in the CE-MS of intact proteins. As the influence of only a few electrolyte systems on the performance of CE-ESI-MS was evaluated, the study ought to be expanded to several more buffers over a large pH-interval. This would potentially lead to a tool box of buffer systems to choose from depending on, e.g., the properties of the protein of interest. It was also shown that MS detection can be used for molecular weight determination and identity confirmation of intact proteins. The work also demonstrated that the loss of the heme group of myoglobin could nicely be followed by CE-MS, thereby touching upon an interesting additional feature of ESI-MS to reveal protein conformational information. Mass spectra of proteins recorded using electrospray ionization (ESI) typically show a number of bands that correspond to differently charged protein molecules. As this charge state distribution reflects the state of the protein in solution and as the conformational state of the protein affects the charge state, ESI-MS could be used to characterize the folding of the protein in solution. An unfolded, denatured protein in solution leads to the formation of higher charge states than the same protein in its native, tightly folded configuration. Clearly, the acquisition of this kind of information on proteins separated by CE, can be very useful for the characterization of protein therapeutics. Due to the very high resolving power of CE, changes in a protein affecting the mass to charge ratio can be detected. Although, it may be easy to separate degraded protein from non-degraded, it is not possible to determine what part of the protein has changed. To determine the reacted amino acid side-chains, it would potentially be advantageous to perform a protein digestion using trypsine followed by, e.g., CE-ESI-MS. Comparing the peak pattern of the peptides from digests of a fresh protein to that of degraded can give information on what part of the protein has been modified.

Chapter 8 Conclusions and perspectives
190
The analysis of therapeutic proteins in a formulation, e.g., a solid dosage form, is arguably still a challenge for CE. Therapeutic proteins are usually very potent, so that rather low amounts are present in the samples requiring sensitive detection. Also, the samples usually contain stabilizers (buffers and salts) which could affect the separation efficiency. So, for the effective characterization of formulated protein pharmaceuticals, preconcentration and desalting procedures might be required prior to CE analysis. In the second part of this thesis (chapter 5-7) investigation into the formulation aspects of AP are described. Proteins are produced as aqueous solutions. A disadvantage is that most proteins are not stable in solution which limits their shelf life. In the dry state, however, proteins are generally much more stable. Therefore, drying a protein solution would give the possibility to store the protein for perhaps years even at room temperature without loss of biological activity. Stabilization of proteins in the dry state can be achieved by freeze-drying of a solution containing the protein and a sugar, e.g., trehalose (in this thesis inulin). For optimal stabilization it is essential that after drying the sugar is in the glassy state. Usually, to keep the pH constant also the presence of a buffer in the solution is required. It has been found that phosphate buffers should be avoided, since during freezing large pH-shifts occur due to the precipitation of one of the buffer salts. Such changes in the pH may lead to degradation, aggregation or denaturation of the protein. However, the properties of high-pH buffers during freeze-drying and their impact on the stability of proteins have not yet been investigated systematically. In this thesis, the high pH buffers, ammediol, borax, CHES, TRIS and Tricine, have been evaluated (chapter 5). It has been found that the pH of the solutions containing these buffers did not change substantially during freezing. However, during freeze-drying ammediol, CHES, TRIS and Tricine were incorporated monomolecularly in the sugar glasses which strongly depressed the Tg of the resulting glasses. Furthermore, borate formed complexes with sugars. Both Tg depression and complex formation could have a detrimental effect on the stability of the incorporated AP. In the literature it is often claimed that optimal stability is achieved if the protein is freeze-dried from solutions containing disaccharides. In particular, trehalose is recognized as the ultimate stabilizer. Oligo- and polysaccharides are generally considered as poor stabilizers. In

Conclusions and perspectives Chapter 8
191
contradiction to this claim, in this thesis it is found that the application of the oligosaccharide inulin as a stabilizer for AP during freeze-drying and storage is preferred over trehalose, especially when the freeze-dried material is exposed to humidified air. Investigations into the oral administration of proteins are rarely addressed in the literature. Therefore, tablets were made from AP incorporated in sugar glasses of trehalose or inulin. It was found that the compaction properties of the trehalose sugar glasses were poor. Moisture uptake from the air cause severe handling problems. Moreover, during processing, compaction induced crystallization of the sugar occurred which was accompanied with a complete loss of protection of the incorporated AP. In contrast, inulin sugar glasses showed no such behaviour and tablets with adequate tensile strength and friability could be produced without any loss of enzymatic activity (see chapter 6). In vitro experiments revealed that tablets prepared from inulin stabilized AP and provided with an enteric coating showed the required dissolution behaviour, i.e. they did not dissolve at pH 1 (pH of the stomach) but rapidly dissolved at pH 6.8 (pH of the intestines). The tablets were given to rats through oral administration (chapter 7). Evaluation of the intestines revealed that with the inulin glass technology AP can be delivered to the intestinal system via oral administration. It was found that adequate stability of the therapeutically interesting protein AP can be achieved through freeze-drying with the oligosaccharide inulin. Consequently, it would be interesting to evaluate the versatility of inulin as a stabilizer. That is, to evaluate the stabilization of not only other proteins but also other labile drug substances like liposomes and viruses by inulin during freeze-drying and storage. Spray-drying is another drying technique worthwhile to evaluate because it can yield particles of 1-5 µm. Particles of these sizes are optimal for pulmonary delivery. Drug therapy via inhalation can be highly relevant for pulmonary diseases, e.g., the labile protein DNzse can be used as a mucolytic agent in cystic fibrosis patients. Another issue is the mechanism of stabilization by inulin. As mentioned earlier, oligosaccharides do generally act as poor stabilizers. Obviously, inulin is an exception. A unique property of inulin is its high chain flexibility in solution. It can be hypothesized that during drying the flexible inulin is smoothly wrapped around the surface of the drug substance. The resulting tight covering of the drug substance may be highly relevant for optimal stabilization. Therefore, evaluation of the stabilizing

Chapter 8 Conclusions and perspectives
192
capacities and sugar/drug interactions of various oligosaccharides differing in chain flexibility may reveal the validity of the above mentioned hypothesis.

Samenvatting
193
Samenvatting De snelle ontwikkeling van de moleculaire biologie gedurende de afgelopen decennia heeft geleid tot een sterke stijging van het aantal geneesmiddelen van biotechnologische oorsprong. Veel van deze (potentiële) geneesmiddelen zijn eiwitten. Dit zijn stoffen met een complexe structuur, wat op vele terreinen vraagt om een andere aanpak dan voor de traditionele laagmoleculaire geneesmiddelen. Omdat het grote aantal functionele groepen en de complexe structuur bepalend zijn voor de therapeutische activiteit van het eiwit, is het van groot belang om over analytische methoden te beschikken welke de zuiverheid en structuur van het eiwit kunnen vaststellen. Verder is het belangrijk dat voor deze eiwitten formuleringen worden ontwikkeld waarin de conformatie van de eiwitten gehandhaafd blijft en die via geschikte toedieningswegen door de patiënt gebruikt kunnen worden.
In dit proefschrift worden verschillende aspecten van de analyse en formulering van therapeutische eiwitten behandeld aan de hand van het eiwit alkalische fosfatase (AF). AF is een enzym dat in het menselijk lichaam voorkomt in vier isovormen. Het enzym is in staat om endotoxines te defosforyleren waardoor het toxische effect van deze stoffen wordt geëlimineerd. Deze eigenschap maakt AF tot een potentieel geneesmiddel voor de behandeling van sepsis. Het eerste gedeelte van het proefschrift beschrijft de analyse van AF. De nadruk ligt hierbij met name op de bruikbaarheid van capillaire electroforese (CE) voor de karakterisering van therapeutische eiwitten. CE is een scheidingstechniek die gebaseerd is op verschil in migratiesnelheid van geladen verbindingen die zich in een nauw capillair bevinden waarover een hoogspanning wordt geplaatst. Met CE kunnen in potentie zeer efficiënte scheidingen worden verkregen van stoffen die in lading en/of grootte van elkaar verschillen. Het tweede deel van dit proefschrift behandelt een aantal formuleringsaspecten van therapeutische eiwitten. Vriesdrogen is een veel toegepaste techniek om de eiwitten in vaste vorm te verkrijgen. Om te voorkomen dat het therapeutische eiwit tijdens drogen of de daarop volgende periode van opslag ontleedt, worden aan de te vriesdrogen oplossing vaak suikers toegevoegd. De eiwitten worden nu tijdens het drogen als het ware ingebouwd in een suikermatrix. Deze technologie vormt de kern van dit deel van het onderzoek.
Samenvatting
194
Een overzicht van de mogelijkheden voor de analyse en formulering van therapeutische eiwitten wordt gegeven in hoofdstuk 1. De analyse van de zuiverheid van AF na een aantal isoleringsstappen is het onderwerp van hoofdstuk 2. De zuiverheid van het eiwit werd met capillaire zone electroforese (CZE), capillaire gelelectroforese (CGE), matrix-assisted laser desorption/ionization time of flight massaspectrometrie (MALDI-TOF MS) en een enzymatische methode onderzocht. De initieel gebruikte zuiveringsmethode, bestaande uit isolatie van AF uit humane placenta’s gevolgd door ionenwisselingschromatografie, bleek te resulteren in een mengsel dat o.a. nog veel humaan serum albumine bevatte. Verder opzuiveren van het product met behulp van affiniteitchromatografie verhoogde de specifieke activiteit van het materiaal van 6.8 tot 128 U/mg. Het CGE elektroferogram van het opgezuiverde product vertoonde één piek, terwijl de zuiverheid en identiteit verder werd aangegeven door het MALDI-TOF-MS spectrum dat één hoofdpiek vertoonde bij m/z 58 101. CZE analyse van dit product toonde een cluster van AF glycovormen. De toepassing van CE in het onderzoek naar de ontleding van AF wordt beschreven in hoofdstuk 3. AF werd blootgesteld aan verschillende condities zoals hoge en lage zuurgraad, verhoogde temperaturen en het vriesdroogproces. Naast CE werd ook een enzymatische bepaling uitgevoerd. De uitkomsten van de CE en activiteitsbepaling waren niet altijd eenduidig. AF dat was blootgesteld aan verhoogde temperaturen vertoonde een exponentieel verlies in enzymatische activiteit, terwijl de piekgrootte in CE lineair afnam. AF dat was blootgesteld aan sterk zure condities vertoonde een lineaire afname van zowel activiteit als van piekgrootte in CE. Tenslotte bleek dat het vriesdrogen gevolgd door enige tijd opslag resulteerde in pieken die zouden kunnen worden toegeschreven aan AF oligomeren. Op basis van deze resultaten kan worden geconcludeerd dat de combinatie van enzymatische bepaling en CE complementaire informatie levert over de activiteit van het eiwit en de aanwezigheid van ontledingsproducten. Om therapeutische eiwitten te karakteriseren zou het aantrekkelijk zijn om CE te combineren met MS. Hiermee kan informatie verkregen worden over de identiteit van de gescheiden verbindingen. In hoofdstuk 4 wordt de combinatie van CE en elektrospray ionisatie massaspectrometrie (ESI-MS) voor de analyse van eiwitten onderzocht. Een probleem dat optreedt bij deze combinatie is dat niet alle buffers die gebruikt worden voor CE verenigbaar zijn met MS. Om de mogelijke toepassing van niet-
Samenvatting
195
vluchtige bufferzouten te onderzoeken werd het effect van natriumfosfaat en ammoniumboraat op het MS signaal van de eiwitten insuline, myoglobine en albumine onderzocht in infusie-experimenten. De effecten werden vergeleken met die van de bufferzouten ammoniumformiaat en mierenzuur. De toepassing van mierenzuur als achtergrond elektrolyt resulteerde in de meest intense eiwitsignalen. Natriumfosfaat gaf een vrijwel volledige suppressie van het signaal terwijl ammoniumformiaat en ammoniumboraat een gedeeltelijke suppressie van het signaal veroorzaakten. Na CE-scheiding van eiwitten gebruikmakend van een boraatbuffer konden deze worden gedetecteerd met ESI-MS zonder dat de kwaliteit van de MS spectra afnam. Hierdoor was het mogelijk om de molecuulgewichten van de gescheiden eiwitten te bepalen. De toepasbaarheid van dit CE-MS systeem is gedemonstreerd voor verouderde albuminemonsters waarin de massa’s van verschillende ontledingsproducten kon worden bepaald. AF is ook geanalyseerd met CE-MS, maar helaas werden geen MS signalen van het intacte eiwit waargenomen. Dit wordt waarschijnlijk veroorzaakt door de onvolledige ionisatie van dit complexe glycoproteïne. In hoofdstuk 5 wordt het effect van verschillende buffers op de glas-rubber transitie temperatuur van de zogenaamde “freeze-concentrated fraction” (Tg’) van suiker/buffer oplossingen onderzocht en wordt het effect van buffers op de glas-rubber transitie temperatuur (Tg) van de gedroogde poeders beschreven. In het algemeen werd een daling van de Tg’ en de Tg van de onderzochte systemen gevonden wanneer de hoeveelheid buffer toenam. Deze daling wijst op een homogene verdeling van de buffer in de suikers. Een uitzondering op de bevindingen was de borax buffer. Bij deze buffer namen Tg’ en Tg toe bij toenemende concentratie bij een pH van 9.8. Bij een pH van 6.0 trad echter een daling op van de Tg’ terwijl de Tg juist toenam. Dit afwijkende gedrag kan worden verklaard door de vorming van een complex tussen de borax en de suikers in de oplossingen met een pH van 9.8. Ook werden de suikers inuline en trehalose vergeleken. Zowel de Tg’ als de Tg waren in alle mengsels hoger wanneer inuline als suiker werd verwerkt. Tijdens het invriesproces van de verschillende oplossingen bleek de pH enigszins te dalen. De stabiliteit van AF ingesloten in suikerglazen met buffers pH 9.8 werd ook bepaald. Gedurende het vriesdrogen en de daaropvolgende opslag bij 60 °C gedurende zes dagen trad een afname op in de enzymactiviteit wanneer trehalose werd gecombineerd met grote hoeveelheden ammediol, TRIS of
Samenvatting
196
borax buffer. Ook wanneer inuline werd gecombineerd met borax buffer nam de enzymactiviteit af. In de andere monsters, inuline met alle concentraties van de andere buffers, en trehalose met lage concentraties ammediol of TRIS buffer, werd geen afname van de enzymactiviteit waargenomen. De ontleding kan verklaard worden door de lage Tg van de trehalose monsters met een hoog buffer gehalte. De slechte resultaten van de borax bevattende monsters worden veroorzaakt door de complexvorming tussen borax en suiker waardoor de suiker niet meer als een adequate stabilisator kan optreden. In hoofdstuk 6 wordt de ontwikkeling van een tabletformulering beschreven van AF dat is ingebouwd in verschillende suikers. Het tabletteergedrag van de suikerglazen kon sterk verbeterd worden wanneer de bij 0% relatieve vochtigheid bewaarde monsters werden geconditioneerd bij 45% relatieve vochtigheid. In het bijzonder de neiging tot kappen werd sterk gereduceerd door dit conditioneren. In de tabletten bleek de stabiliteit van AF dat gestabiliseerd was met inuline superieur te zijn aan die van AF gestabiliseerd met trehalose. Het slechte stabiliseren van de trehalose na compactie kan verklaard worden door het feit dat het compactieproces kristallisatie van de geconditioneerde trehalose induceert. Door deze kristallisatie verliest het trehalose zijn stabiliserende werking. Inuline vertoonde geen kristallisatie na compactie, waardoor de stabilisatie van AF gehandhaafd bleef. De goede fysische stabiliteit van de inuline suikerglazen bij hoge vochtigheid en bij druk gecombineerd met de geschikte tableteigenschappen maken deze suiker een geschikte stabilisator voor AF. De ontwikkeling van een formulering waarmee AF na orale toediening afgeleverd kan worden in de darm wordt beschreven in hoofdstuk 7. Hierbij is het van belang dat het zuurgevoelige AF niet in contact komt met de zure maagsappen. Van inuline gestabiliseerde AF werden tabletten geslagen. Deze tabletten werden omhuld met een maagsap resistente omhulling om zodoende het AF te beschermen tegen het maagsap. Tabletten zonder deze omhulling losten snel op in een zure oplossing waarbij de AF activiteit volledig verloren ging door ontleding van het eiwit. Omhulde tabletten bleven gedurende twee uur stabiel in een zure oplossing maar losten snel op wanneer de zuurgraad werd verhoogd tot neutrale waarden zoals die in de darm voorkomen. Na het oplossen van de omhulde tabletten bleek de enzymactiviteit van AF nog volledig intact te zijn. Een in vivo studie in ratten toonde aan dat deze tabletten goed in

Samenvatting
197
staat waren om intact AF af te leveren in de darm. De enzymactiviteit van AF in de darm nam toe wanneer er meer tabletten werden toegediend. Deze resultaten tonen aan dat dit product in potentie een bruikbaar geneesmiddel in de behandeling van sepsis zou kunnen zijn.

Samenvatting
198
Acknowledgements
199
Acknowledgements
What you are holding in your hands is the result of four years research and even though my name only is printed on this book I was not alone in this great effort. First of all I would like to thank my promotors Ad and Erik for giving me the opportunity to live and work in Groningen. It has been an experience I am very happy I have. It was a remarkable time of my life and I am glad I have learnt to understand Dutch, a language that I thought was almost incrompehensible. I would also like to thank Govert for his enthusiasm and many ideas. Thanks Wouter for your neverending stream of ideas and guidance. I would also like to thank Martijn, Emile, Mischa, Carolien, Paul, Alex, Theo, Harm M, Harm N, Jolanda, Kees, Jan-Piet, Rokus, Jan and all the others at Analysis who became my colleagues during my first years in Groningen. Thank you Hafida and Klaas for providing me with material to work with and teaching me how to purify a protein. Thank you Willem for helping out in feeding the rats with my tablets. Thank you all the people at Pharmaceutical Technology for making my last years in Groningen such a pleasant stay, it was with you guys I first started practising and using Dutch. Thanks Anko and Paul for your assistance whenever there was a computer problem. Thank you Klaas, Doetie, Anne, Gerad, Joke B, Jan, Hans, Els, Lidia. Thank you Bouwe, Marinella and Hans for your company in our office space, it was great fun. Thank you Bastiaan and Gerrit, it was a great trip to Belgium (we got to practise our French). Thanks Bert for your assistance in making my first tablets, we even got a paper out of it. Thank you Anneke and Dirk-Jan, it was a pleasure working and spending time with you. I tried to teach you the strangest Swedish words I could come up with, you’ll probably always remember “knäckebrödsmaskinsoperatörsutbildning”. Dirk-Jan, we had some really extreme experiments going, often late in the evenings with some great and loud music on. Thank you also Anneke T and good luck at the bank. Thanks Jaap, and good luck with your chess and volley ball. I must also thank Annie, Margot, Albert, Hjalmar and especially Andries in the MS group, some of the data you helped me get was eventually published. Thanks Roelof for helping with the MS experiments in Utrecht. During my time as an AIO there were also some students I had the privilege to get to know; thanks to Esther Tennekes, Marieke Kroeze,

Acknowledgements
200
Liesbeth Hegge, and in particular Marijn Wijngaard who helped me gather data for a publication. As an AIO within Pharmacy there is one man in the building you must know. I am of course talking about Jan Visser, this remarkable man who always has time, and no matter what you need for your experiments he has it somewhere in his storage. Thanks Ulrik for mentioning me when Ad and Erik were looking for a new AIO. Without you none of this would have been realized. Thank you Damon and Tina for inviting me in your home. We had some nice bike trips together and cooking and eating with you was always fun. Thanks Yuki for your fun parties. Thanks Alex and Marguerite. Thanks Håkan and Eva for your hospitality and excellent dinners. I would also like to thank the members of the reading committee, professor Bischoff, professor Crommelin and professor Meijer, for taking some of your time to read my work. During my four years in Groningen I met and got to know so many people and even though some of you have not been mentioned here I still think about you sometimes, you all know who you are. Till sist, ni som står mig närmast, det vill säga mina föräldrar och bror, vet att jag lagt ner en stor del av mitt liv i denna lilla bok men jag har alltid känt att det funnits ett stöd och intresse från er. Det har blivit många helger och sena kvällar då jag suttit med läs- och skrivarbete och ofta undrat vad det egentligen är jag håller på med. Ibland när det känts för betungande har det varit en befrielse att få komma till tystnaden och stillheten som man kan uppleva vid en sjö i de värmländska skogarna. Varje sommar och jul var det en lisa för själen att få lämna trängseln i Holland för att för någon vecka bara få slappna av och känna lugnet.