the development of a magic population for qtl … development of a magic population for qtl...
TRANSCRIPT
The development of a MAGIC population for QTL detection in Maize P. Dubreuil - BIOGEMMA
MAG
IC W
ors
hop /
NIA
B 1
2-1
3 J
une 2
013

The development of a MAGIC population for QTL detection in Maize
Outline of the presentation
• Introduction
• The development of the MAGIC population
• Genetic characteristics of the MAGIC panel
• Phenotypic evaluation
• Association mapping (some examples)
• Conclusion and the future
P / 2 MAG
IC W
ors
hop /
NIA
B 1
2-1
3 J
une 2
013

• In the context of the business model of Biogemma, association mapping is a method of choice to map QTL at high resolution (as compared to QTLs from
linkage mapping approaches with single populations)
• Genetic diversity in Maize highly structured
same strong structure in the diversity panels
reduced power to detect genomic regions involved in the variation of traits correlated to the structure (eg. flowering date,…)
• MAGIC population as an alternative
High level of functional diversity (numerous alleles with balanced frequencies)
loose structure (broken by accumulating generations of intermating)
large panel size
combine resolution and power (to some extent)
P / 3
Introduction
MAG
IC W
ors
hop /
NIA
B 1
2-1
3 J
une 2
013

Development of the MAGIC population
• Started in 2004 !
• Parental lines from very diverse origins
P / 4 MAG
IC W
ors
hop /
NIA
B 1
2-1
3 J
une 2
013
US B73 ISSS US A632 ISSS (RYD) US C103 LSC US OH43 LSC US A654 Minn.13 US W117 Minn.13 US D63 mainly Iodent US ND245 CBD
US VA85 CBD US F252 Early dent US F492 Miscelaneous US CO255 Mixed (Flint/Minn.13) EU F2 European flint EU EP1 European flint EU D105 European flint SA B96 Argentina flint
Origin Line Origin Group Line Group
“Funnel” crossing scheme synthetic population

P / 5
3 cycles of intermating (pair-cross scheme) involving ~ 2000 individuals per cycle
Development of the MAGIC population
MAG
IC W
ors
hop /
NIA
B 1
2-1
3 J
une 2
013

P / 6
At the 3nd generation, extraction of lines using a double haploid technology we expected 800, we got only 550 !
Development of the MAGIC population
MAG
IC W
ors
hop /
NIA
B 1
2-1
3 J
une 2
013

• Genotyping with the 50K SNP Illumina bead array 543 DH lines + 16 parental lines
• Genetic diversity (44.990 SNP effectively used)
High level of genetic diversity in the panel / limited genetic drift during the development of the panel (high effective population size)
P / 7
Genetic characteristics of the panel
MAGIC panel
Broad-based Diversity panel
Distribution of the SNP MAF in parental lines and DH lines
MAG
IC W
ors
hop /
NIA
B 1
2-1
3 J
une 2
013

• Genetic structure Use of 18218 SNP randomly sampled among those with missing data < 5%
PCoA & UPGMA clustering from squared MRD
No strong structure in the panel (no visible group, small part of variance
explained by PCA axes, chaining effect in the dendrogram)
P / 8
Flint
Iodent
ISS
Axis
2 (
0.8
4%
)
Axis1 (0.87%)
Genetic characteristics of the panel
MAG
IC W
ors
hop /
NIA
B 1
2-1
3 J
une 2
013

• Genetic structure (results from R. Rincent, PhD, INRA) PCoA with markers …
Markers located near the centromeric regions reveals a significant structure (high portion of variance explained)
Can be explained by low recombination frequencies near the centomeres
P / 9
22%
12%
NEAR the centromere
Genetic characteristics of the panel
3.4%
2.8%
located NOT NEAR the centromere
MAG
IC W
ors
hop /
NIA
B 1
2-1
3 J
une 2
013

• LD analysis (from SNP loci)
LD decay (arbitrary threshold of 0.2) ranges between 50 to 300 Kb
(conversion used 400-600 kb/cM depending on the chr.) ON AVERAGE
but highly variable among the regions (high near the centromere)
P / 10
Relationship bw LD and genetic distance
Fitted with the model from Hill & Weir (1988)
MAG
IC W
ors
hop /
NIA
B 1
2-1
3 J
une 2
013
Genetic characteristics of the panel

P / 11
• LD analysis (from SNP loci)
LD decay (arbitrary threshold of 0.2) ranges between 50 to 300 Kb
(conversion used 400-600 kb/cM depending on the chr.) ON AVERAGE
but highly variable among the regions (high near the centromere)
Genetic characteristics of the panel
Evolution of LD along the chrosome (from a R script kindly provided to use by S. Nicolas)
R2=0.2
Physical distance (bp)
R2=0.2
Physical distance (bp)
MAG
IC W
ors
hop /
NIA
B 1
2-1
3 J
une 2
013

Genetic characteristics of the panel
• Comparison of LD decay among differents panels
MAGIC panel has an LD decay profil closer to that of the broad-based diversity panel than that of the narrow-base one
MAG
IC W
ors
hop /
NIA
B 1
2-1
3 J
une 2
013
0.74
0.64
0.58 0.55 0.54
0.42 0.38
0.32
0.25
0.61
0.45
0.40
0.31 0.30
0.21 0.18
0.12 0.08
0.44
0.34 0.29
0.24 0.24
0.14 0.12
0.06 0.03
0.00
0.10
0.20
0.30
0.40
0.50
0.60
0.70
0.80
Range of physical distance
Chromosome 7
Me
an r
²
Panels Broad-based diversity panel Narrow-based diversity panel MAGIC
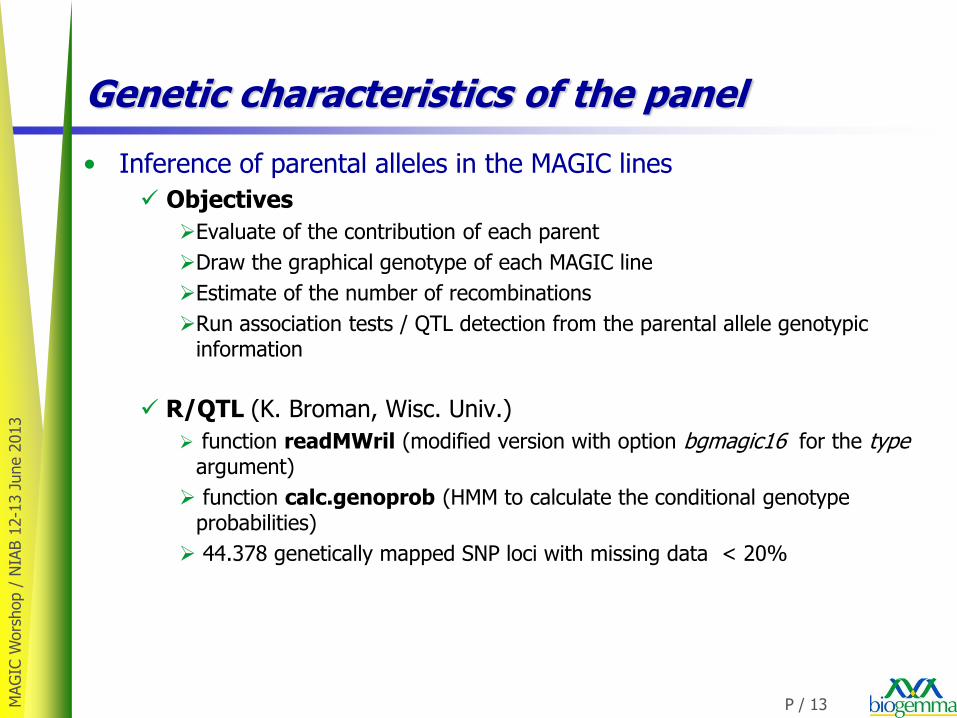
• Inference of parental alleles in the MAGIC lines
Objectives
Evaluate of the contribution of each parent
Draw the graphical genotype of each MAGIC line
Estimate of the number of recombinations
Run association tests / QTL detection from the parental allele genotypic information
R/QTL (K. Broman, Wisc. Univ.)
function readMWril (modified version with option bgmagic16 for the type argument)
function calc.genoprob (HMM to calculate the conditional genotype probabilities)
44.378 genetically mapped SNP loci with missing data < 20%
P / 13 MAG
IC W
ors
hop /
NIA
B 1
2-1
3 J
une 2
013
Genetic characteristics of the panel

• Results from R/QTL
Very contrasted probabilities among the
16 parental alleles at a locus
P / 14
MAGIC lines
Mark
ers
Par. a
llele
Conditional probability matrix (from calc.genoprob function) Imputed parental allele matrix
Mark
ers
MAGIC lines
Graphical genotypes QTL detection
Imputation of the most likely parental allele (probability > 0.8;
missing data otherwise)
Genetic characteristics of the panel
MAG
IC W
ors
hop /
NIA
B 1
2-1
3 J
une 2
013

• Contribution of parental genomes to the genetic make-up of the DH lines
Expected contribution from each parent 6.25%
Estimated contributions from 5.27 to 6.75; very close to the expected one
No significant drift, nor selection
P / 15
Genetic characteristics of the panel
MAG
IC W
ors
hop /
NIA
B 1
2-1
3 J
une 2
013

• DH lines represented as mosaics of the parental genomes
GGT v2
P / 16
Genetic
dis
tance
(cM
)
MAGIC lines
Chr. 7
33.7
Genetic characteristics of the panel
MAG
IC W
ors
hop /
NIA
B 1
2-1
3 J
une 2
013
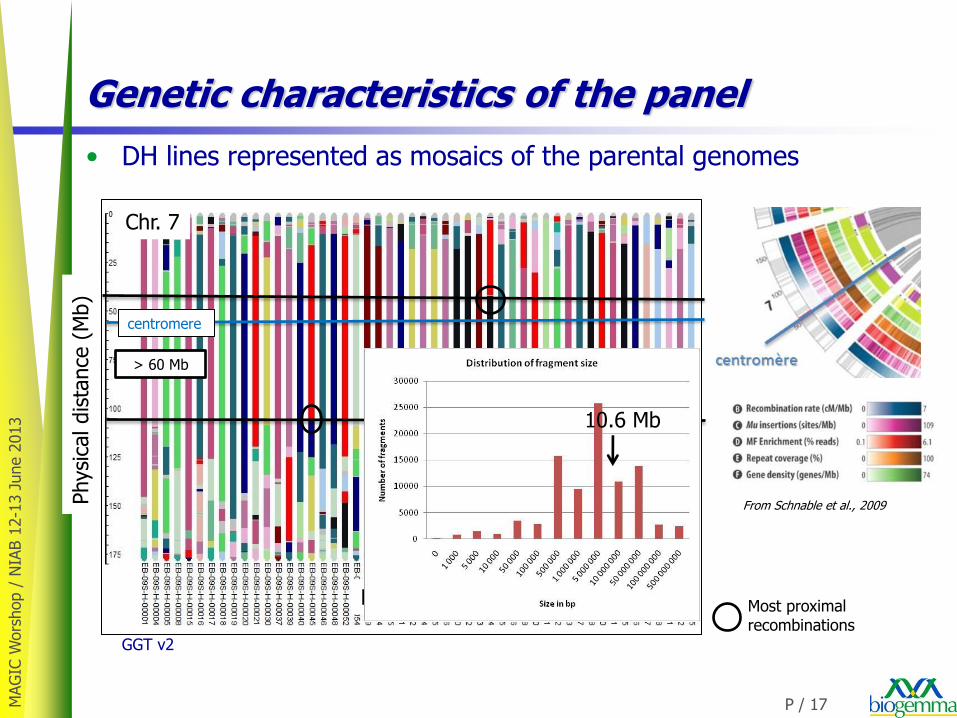
P / 17
centromere
> 60 Mb
MAGIC lines
Physi
cal dis
tance
(M
b)
Chr. 7
10.6 Mb
• DH lines represented as mosaics of the parental genomes
GGT v2
Genetic characteristics of the panel
Most proximal recombinations
From Schnable et al., 2009
MAG
IC W
ors
hop /
NIA
B 1
2-1
3 J
une 2
013
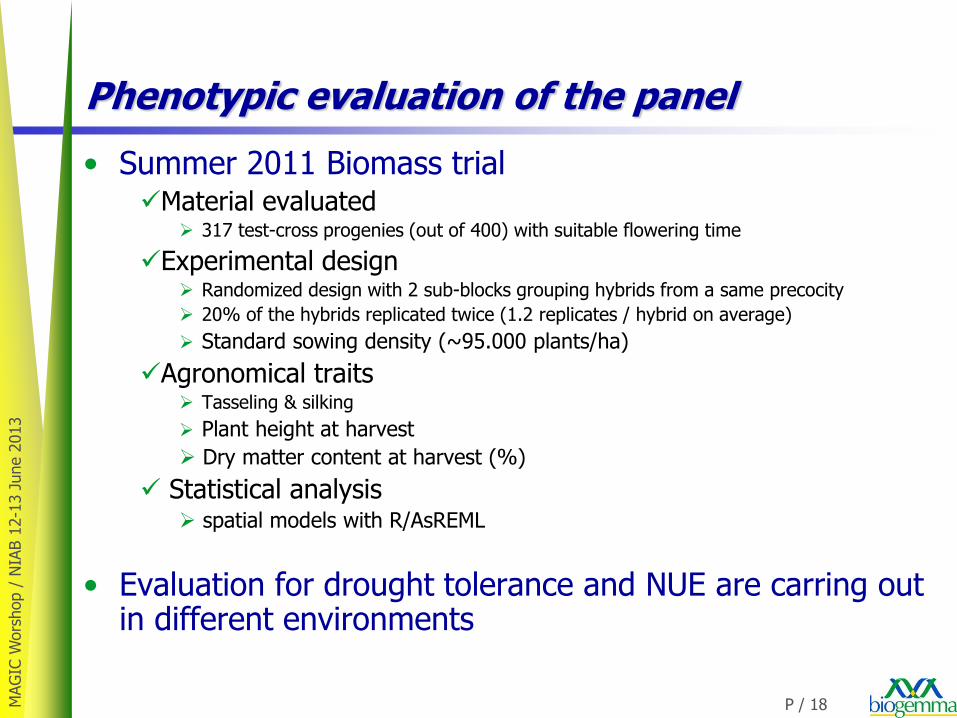
• Summer 2011 Biomass trial Material evaluated
317 test-cross progenies (out of 400) with suitable flowering time
Experimental design Randomized design with 2 sub-blocks grouping hybrids from a same precocity
20% of the hybrids replicated twice (1.2 replicates / hybrid on average)
Standard sowing density (~95.000 plants/ha)
Agronomical traits Tasseling & silking
Plant height at harvest
Dry matter content at harvest (%)
Statistical analysis spatial models with R/AsREML
• Evaluation for drought tolerance and NUE are carring out in different environments
P / 18 MAG
IC W
ors
hop /
NIA
B 1
2-1
3 J
une 2
013
Phenotypic evaluation of the panel

• Mixed model P = mu + L + K + R , fitted with R/EMMA or R/AsREML
P = adjusted means
K = kinship matrix (1- squared MRD)
L can be a SNP, a haplotype or a « parental allele imputed » locus
• Identification of haplotype loci
based on LD extent (Haploview)
Confidence Intervals (Gabriel & al., 2002): strong LD between each pair of markers
Solid Spine of LD (Barrett et al., 2005): strong LD between boundary markers pairs
Four Gamete Rule (Wang & al., 2002): based on two-marker halotypes frequencies
based on a sliding windows
Window of 100 kb / Step 50 Kb
P / 19
Association mapping
MAG
IC W
ors
hop /
NIA
B 1
2-1
3 J
une 2
013
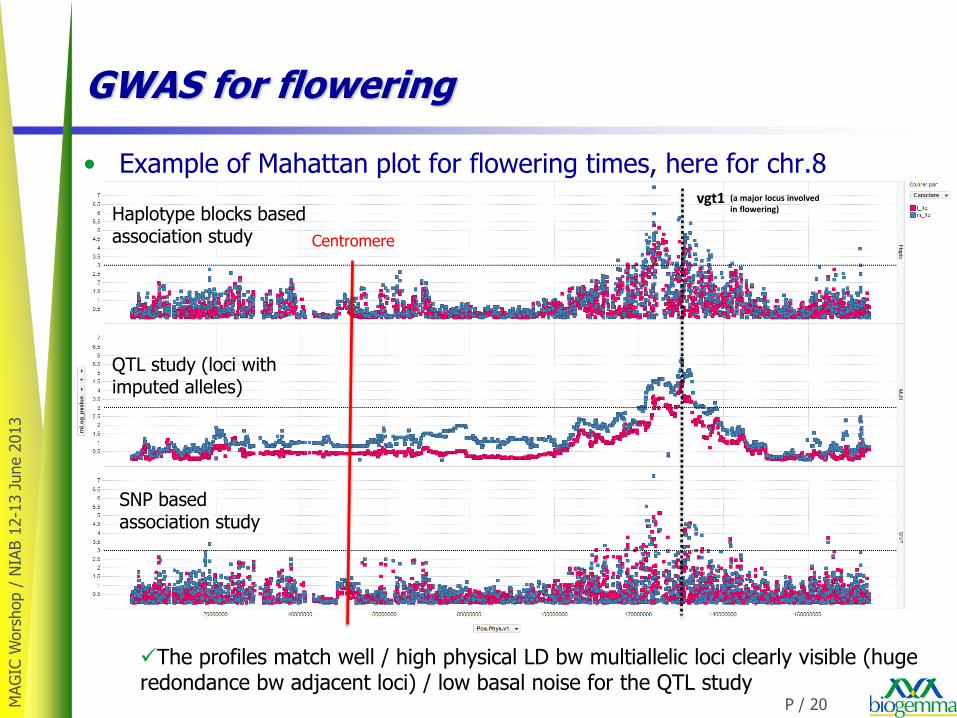
• Example of Mahattan plot for flowering times, here for chr.8
The profiles match well / high physical LD bw multiallelic loci clearly visible (huge redondance bw adjacent loci) / low basal noise for the QTL study
P / 20 M
AG
IC W
ors
hop /
NIA
B 1
2-1
3 J
une 2
013
GWAS for flowering
vgt1
SNP based association study
QTL study (loci with imputed alleles)
Haplotype blocks based association study
(a major locus involved in flowering)
Centromere

P / 21
• Example of Mahattan plot for dry matter content, here chr. 4
Good agreement between both approaches better confidence in the
localisation of true genetic factor
DMC
SNP based association study
QTL study (loci with imputed parental alleles)
MAG
IC W
ors
hop /
NIA
B 1
2-1
3 J
une 2
013
GWAS for flowering and biomass

Comparison of panels for detection power
• 3 panels compared Broad-based diversity panel
Narrow-based diversity panel (breeding lines)
MAGIC panel
• Based on a simulation study
Simulation of a polygenic trait from the SNP data
Genetic effect
One SNP (all each at a turn) as a QTL explaining a fraction of the phenotypic
variance
100 other SNP loci evenly sampled in the genome to simulate the genetic background
Environmental effect
drawn in a normal distribution to obtain a given heritability of the trait
Each QTL subjected to association study using the appropriate model
(Q+K or K only depending of the panel). Statistical power as the ratio between the number of QTL detected over the total number of tests
P / 22 MAG
IC W
ors
hop /
NIA
B 1
2-1
3 J
une 2
013

• MAGIC panel more powerful that the 2 diversity panels. The broad-based panel may suffer from a high structure whereas the narrow-based panel suffers from a lack of diversity and a smaller size P / 23 M
AG
IC W
ors
hop /
NIA
B 1
2-1
3 J
une 2
013
Comparison of panels for detection power
Heritability of the QTL
Heritability of the trait = 0.4 a-risk = 0.001
Sta
tist
ical pow
er
Heritability of the QTL
Sta
tist
ical pow
er
Heritability of the trait = 0.4 a-risk = 1.10-6
Panels Braod-based diversity panel Narrow-based diversity panel MAGIC
Panels Broad-based diversity panel Narrow-based diversity panel MAGIC

Heritability of the trait = 0.9 a-risk = 1.10-6
Heritability of the QTL
Sta
tist
ical pow
er
• For highly heritable traits, the MAGIC panel is still more powerful though the difference between the panels are lesser
P / 24 MAG
IC W
ors
hop /
NIA
B 1
2-1
3 J
une 2
013
Comparison of panels for detection power
Heritability of the trait = 0.9 a-risk = 0.001
Heritability of the QTL
Sta
tist
ical pow
er Panels
Broad-based diversity panel Narrow-based diversity panel MAGIC
Panels Broad-based diversity panel Narrow-based diversity panel MAGIC

• The MAGIC panel is appropiate for QTL and association mapping
High allele diversity (~ broad-based diversity panel)
Balanced frequencies of parental alleles
No structure of the diversity (except around the centromere)
Highly variable LD but not too strong in the telomeric parts (where most genes lie)
High power (>0.8) to detect with a high confidence (1.10-6 ) a loci explaining a modest part (5%) of a trait with a medium heritability (0.4)
Detection of genomic regions that colocalize with previously mapped QTL/MetaQTL
P / 25 MAG
IC W
ors
hop /
NIA
B 1
2-1
3 J
une 2
013
Conclusions

• Continue the phenotypic evaluation
improved precision of phenotypic evaluation more sensitivity and
power to detect association
more characterized environments modelling GxE
investigate QTL x E interaction, estimate environmental specific allele effects
• Increase marker density
200K SNP GBC
500K SNP Axiom array
• Extract a new panel of DH lines from an more advanced generation of intermating to increase resolution
the 11th generation will be achieved this year
P / 26
The near future and after
MAG
IC W
ors
hop /
NIA
B 1
2-1
3 J
une 2
013

Project partly supported by the KBBE-CornFed program (2009-2013) Special thanks to: - Clément Buet who has performed most of the statistical analyses - Renault Rincent for his contribution to the statistical analyses - Karl Broman for having helped us to infer parental alleles - Morgan Renault for having developed the MAGIC pop - Alain Murigneux who has initiated the project - Sébastien Praud the head of the GGC team
Contact: [email protected]
Thank you for your attention
MAG
IC W
ors
hop /
NIA
B 1
2-1
3 J
une 2
013