the determination of sugar cane quality in louisiana by
TRANSCRIPT
Louisiana State UniversityLSU Digital Commons
LSU Historical Dissertations and Theses Graduate School
1977
The Determination of Sugar Cane Quality inLouisiana by the Core Press Method.Harold Sydney BirkettLouisiana State University and Agricultural & Mechanical College
Follow this and additional works at: https://digitalcommons.lsu.edu/gradschool_disstheses
This Dissertation is brought to you for free and open access by the Graduate School at LSU Digital Commons. It has been accepted for inclusion inLSU Historical Dissertations and Theses by an authorized administrator of LSU Digital Commons. For more information, please [email protected].
Recommended CitationBirkett, Harold Sydney, "The Determination of Sugar Cane Quality in Louisiana by the Core Press Method." (1977). LSU HistoricalDissertations and Theses. 3051.https://digitalcommons.lsu.edu/gradschool_disstheses/3051
INFORMATION TO USERS
This material was produced from a microfilm copy of the original document. While the most advanced technological means to photograph and reproduce this document have been used, the quality is heavily dependent upon the quality of the original submitted.
The following explanation of techniques is provided to help you understand markings or patterns which may appear on this reproduction.
1 .The sign o r "target" for pages apparently lacking from the document photographed is "Missing Page(s)". If it was possible to obtain the missing page(s) or section, they are spliced into the film along with adjacent pages. This may have necessitated cutting thru an image and duplicating adjacent pages to insure you complete continuity.
2. When an im age on the film is obliterated with a large round black mark, it is an indication that the photographer suspected that the copy may have moved during exposure and thus cause a blurred image. You will find a good image o f the page in the adjacent frame.
3. When a m a p , drawing or chart, etc., was part of the material being photographed the photographer followed a definite method in "sectioning" the material. It is customary to begin photoing at the upper left hand corner of a large sheet and to continue photoing from left to right in eq u al sections with a small overlap. If necessary, sectioning is continued again - beginning below the first row and continuing on until complete.
4. The m ajority of users indicate tha t the textual content is of greatest value, however, a somewhat higher quality reproduction could be made from "photographs" if essential to the understanding of the dissertation. Silver prints of "photographs" may be ordered at additional charge by writing the Order Department, giving the catalog number, title, author and specific pages you wish reproduced.
5. PLEASE NOTE: Some pages may have indistinct print. Filmed as received.
Xerox University Microfilms300 North Zoeb RoadAnn Arbor, Michigan 48106
77-25,368BIRKETT, Harold Sydney, 1940- THE DETERMINATION OF SUGAR CANE QUALITY IN LOUISIANA BY THE CORE PRESS METHOD.
The Louisiana State University and Agricultural and Mechanical College, Ph.D., 1977 Engineering, chemical
Xerox University Microfilms, Ann Arbor, Michigan 48io6
@ 1977
HAROLD SY D NE Y B I R K E T T
ALL RIGHTS RESERVED
THE DETERMINATION OF SUGAR CANE QUALITY
IN LOUISIANA BY THE CORE PRESS METHOD
A Dissertation
Submitted to the Graduate Faculty of the Louisiana State University and
Agricultural and Mechanical College in partial fulfillment of the
requirements for the degree of Doctor of Philosophy
in
The Department of Chemical Engineering
byHarold Sydney Birkett
B.S., Louisiana State University, 1964 M.S., Louisiana State University, 1971
May, 1977
EXAMINATION AND THESIS REPORT
Candidate:
Major Field:
Title of Thesis:
Harold Sydney Birkett
Chemical Engineering
The Determination of Sugar Cane Quality in Louisiana
by the Core Press Method.
Approved:
iuf Professor and Chairman
Dean of the Graduate School
EXAMINING COMMITTEE:
Qprri j,. jLXTor6-c{£a**JL.
Date of Examination:
April 22, 1977
ACKNOWLEDGEMENT
The author wishes to express his appreciation to the late
Dr. John J. Seip, Professor of Chemical Engineering, for his guidance
and counsel during these studies; and also to Dr. Joseph A. Polack,
Professor of Chemical Engineering, for his assistance and suggestions
in the presentation of the final results.
The author is indebted to the management of Cinclare Central
factory who willingly cooperated in the commercial portion of this
study; to J & L Engineering Company who made available the commercial
corer and hydraulic press; to the American Sugar Cane League who
supported and funded the commercial portion of these studies; and to
the Audubon Sugar Factory staff who assisted with the initial and
semi-commercial studies.
Pag
x
1
2
2
3
4
67
101117
18
23
25
29
29
32
45
47
49
TABLE OP CONTENTS
SUMMARY ......................................
Elements of a Sampling System ...........
Outline of the Experimental Program . . .
The Conventional Louisiana Cane Sampling System ........... .....................
The Core-Press Cane Sampling System . . .
Results ..................................
Conclusions ..............................
A GENERAL COVERAGE OF THE GROWTH, HARVEST AND CULTURE OF SUGAR CANE .......................
Review of Literature .....................
THE IDEAL CANE PAYMENT SYSTEM ...............
Inter-relationship between Cane Quality and Factory Efficiency.......................
Cane Sampling ..................... .
OUTLINE OF THE EXPERIMENTAL PROGRAM ........
THE HYDRAULIC PRESS .........................
The Hydraulic Press.......................
Press Reproducibility.....................
Hydraulic Press Extraction Severity. . . .
Constancy of Bagasse Analysis.............
S u m m a r y ............................... .
iii
TABLE OF CONTENTS(Continued)
CHAPTER Page
VI CORE SAMPLING................................... 50
The Core Sampler............................ 50
The Farrel Sample M i l l ...................... 54
Experimental Procedure .......................... 55
Variability of Cane Within the Consignment . . . 56
Comparison of the Conventional and Core-Farrel Sampling Methods with Commercial Milling. . . . 67
The 1973 Studies............................ 74
Variability of Cane Within the Consignment . . . 75
Comparative Cane Quality by Press, Farrel Mill, and Cold Digestion........................... 79
Comparison of Theoretically Recoverable Sugar from Core-Press Sample with the Farrel Mill Predicted Yield ................................ 83
Sugar Yield Calculation Methods.............. 84
Summary . . ..... 88
VII PRESS RESPONSE TO T R ASH......................... 89
Experimental Procedure........................ . 89
Bagasse % C a n e ............................... 81
Fiber % C a n e ................................. 99
Juice Purity................................. 99
Pol % C a n e ................................... 195
Pol Extraction............................... 105
Bagasse Moisture............................. H I
Discussion of Press Response to Trash........ 115
Summary....................................... I20
iv
TABLE OP CONTENTS(Continued)
CHAPTER Page
VIII COMMERCIAL SCALE CORE STUDIES...................... 122
Procedure......................................... 123
Discussion of Results............................ 124
Direct Comparison of the Core and Conventional Sampling Methods................................ 125
Comparison of the Core and Conventional r Sampling Methods with the Factory Performance 128
Comparison of Core and Conventional Sampling Methods by Grower.............................. 129
Comparison of Core and Conventional Yields • . 136
BIBLIOGRAPHY................................................... 138
APPENDIX........................................................ 142
I NOMENCLATURE......................................... 142
II THE LOUISIANA CANE SAMPLING AND TESTING METHOD(CONVENTIONAL METHOD) .............................. 147
III THE PRESS METHOD..................................... 130
IV ANALYTICAL METHODS................................... 163
V SUPPLEMENTARY DATA FOR CHAPTER V I .................. 165
VITA . . 167
v
LIST OF TABLES
TABLE Page1 Per Cent Coefficient of Variation of
Parameters in Hydraulic Press Replicate . . . ^5
2 Reproducibility Runs on Blended Core Samples . 36
3 Reproducibility Runs on Blended Core Samples . 37
4 Reproducibility Runs on Blended Core Samples . 38
5 Reproducibility Runs on Blended Core Samples . 39
6 Reproducibility Runs on Blended Core Samples . 40
7 Reproducibility Runs on Blended Core Samples . 41
8 Reproducibility Rims on Blended Core Samples . 42
9 Reproducibility Rims on Blended Core Samples . 43
10 Reproducibility Runs on Blended Core Samples . 44
11 Average Pol Extraction and Fiber % Canefor 9 Reproducibility Runs................... 45
12 Average Fiber % Bagasse and Moisture % Bagassefor 9 Reproducibility Runs................... 48
13 Comparison of Predicted Yield from theConventional and Core Sample Methods, lbs
96° Sugar/Gross Ton C a n e ..................... 57
14 Variability of Key Cane Quality Parametersamong Core Samples from the Same Consignment. 62
15 Summary of the Average Standard Deviation andthe Average Per Cent Coefficient of Variation of the Key Cane Quality Parameters for Three Core Samples in the Same Consignment......... 64
16 Comparison of the Per Cent Coefficient ofVariation Between the Means of the Back,Middle, and Front Core Sample Points for the 7 Cane Deliveries shown in Table 1 4 ......... 66
17 Factory Mill Data.............................. 68
vi
LIST OF TABLES(Continued)
TABLE
18
19
20
21
22
23
24
25
26
27
28
29
30
31
32
33
Correlation of Juice Quality as Brix;Crusher versus Core and Conventional Sucrose Samples ..............................
Correlation of Juice Quality as Pol; Crusher versus Core and Conventional Sucrose Sample .
Correlation of Juice Quality from Bagasse % Cane by Factory Method and by Core Sampling Method........................................
Variability Among Back, Middle, and Front Core Samples from Same Load - Typical Run and Average for 15 Runs .........................
Comparison of Average of 15 Core Samples Each from Back, Middle and Front of Bundle . . . .
Comparative Cane Quality by Press, Farrel Mill, and Cold Digestion...........................
Correlation of Theoretically Recoverable Sugar from the Core Sample (TRS) with the Farrel Mill predicted Yield (RS) and the Corrected Recoverable Sugar (CRS) .....................
Effect of Green Leaves on Clean Chipped Cane .
Effect of Dry Leaves on Clean Chipped Cane . .
Effect of Mhoon Soil on Clean Chipped Cane . .
Effect of Sharkey Soil on Clean Chipped Cane .
Effect of Commerce Soil on Clean Chipped Cane.
Bagasse % Cane as a Function of Different Types of Trash......................................
Fiber % Cane as a Function of Different Types of Trash......................................
Extracted Juice Purity as a Function of Different Types of Trash.......... ..........
Pol % Cane as a Function of Different Types of Trash ........................................
vii
Page
69
70
73
76
77
82
87
92
93
94
95
96
97
100
103
106
LIST OP TABLES(Continued)
TABLE Page34 Comparison of Regression and Material
Balance.........................................108
35 Effect of Trash on Pol Extraction................109
36 Effect of Trash on Bagasse Moisture..............112
37 Sugar Yield by Core Press and ConventionalMethod as a Function of Green Leaf and DryLeaf Trash.......................................117
38 Summary of Regression Analyses.................. 13°
39 Correlation Coefficients Between SamplingMethods and Mill Performance................. 131
40 Data and Results Summary........................ 132
41 Comparison of Core and Conventional SamplingMethods.........................................133
42 Comparison of Predicted CRS by Core andConventional Sampling Methods ............... 135
43 Comparison of Yields by Press and ConventionalM e t h o d .........................................137
viii
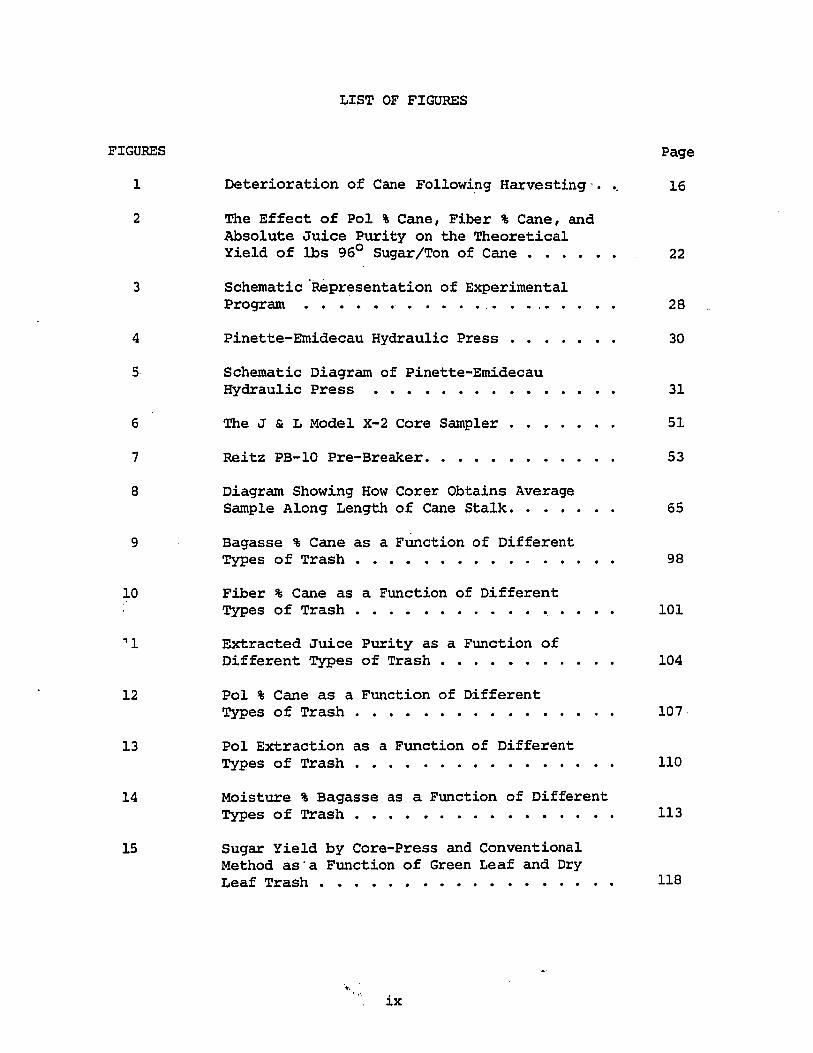
LIST OF FIGURES
FIGURES Page1 Deterioration of Cane Following Harvesting-. .. 16
2 The Effect of Pol % Cane, Fiber % Ccine, and Absolute Juice Purity on the TheoreticalYield of lbs 96° Sugar/Ton of C a n e ........... 22
3 Schematic Representation of ExperimentalP r o g r a m ............ 28
4 Pinette-Emidecau Hydraulic Press .............. 30
5 Schematic Diagram of Pinette-EmidecauHydraulic Press .............................. 31
6 The J & L Model X-2 Core Sampler.............. 51
7 Reitz PB-10 Pre-Breaker........................ 53
8 Diagram Showing How Corer Obtains AverageSample Along Length of Cane Stalk............. 65
9 Bagasse % Cane as a Function of DifferentTypes of T r a s h ................................ 98
10 Fiber % Cane as a Function of DifferentTypes of T r a s h ......................... 101
’1 Extracted Juice Purity as a Function ofDifferent Types of Trash ..................... 104
12 Pol % Cane as a Function of DifferentTypes of T r a s h ................................ 107
13 Pol Extraction as a Function of DifferentTypes of T r a s h ................................ 110
14 Moisture % Bagasse as a Function of DifferentTypes of T r a s h ................................ 113
15 Sugar Yield by Core-Press and Conventional Method as a Function of Green Leaf and DryLeaf T r a s h .................................... 118
ix
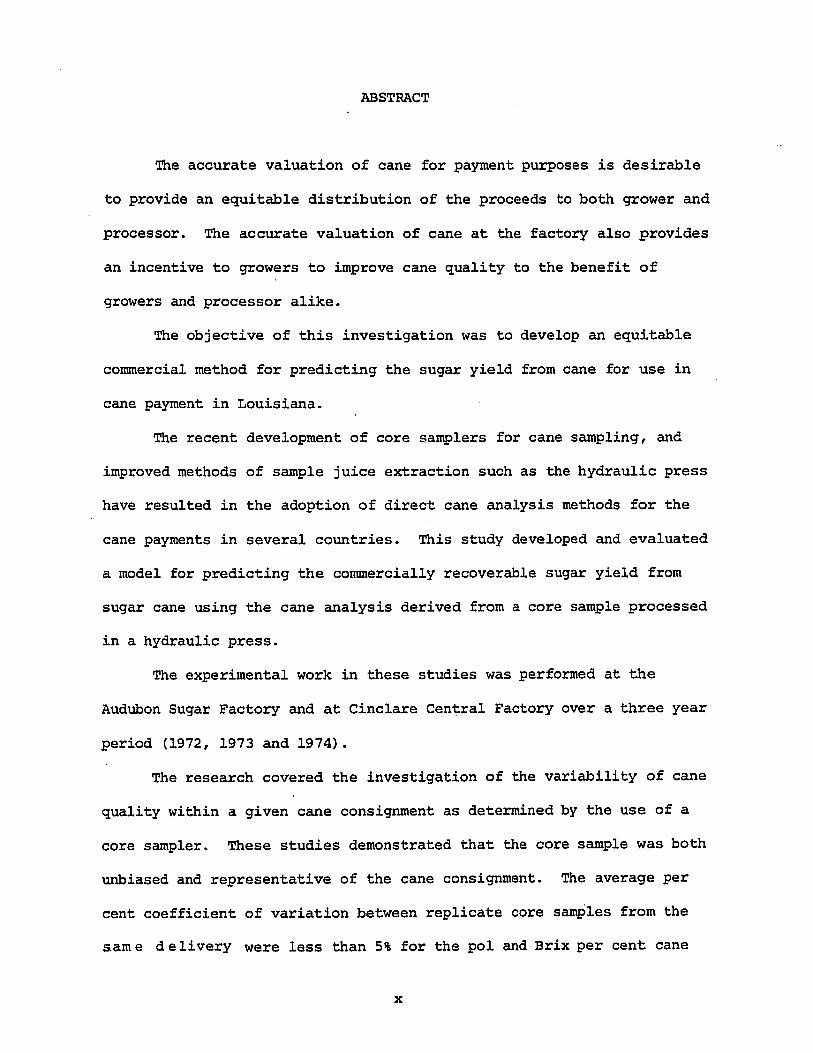
ABSTRACT
The accurate valuation of cane for payment purposes is desirable
to provide an equitable distribution of the proceeds to both grower and
processor. The accurate valuation of cane at the factory also provides
an incentive to growers to improve cane quality to the benefit of
growers and processor alike.
The objective of this investigation was to develop an equitable
commercial method for predicting the sugar yield from cane for use in
cane payment in Louisiana.
The recent development of core samplers for cane sampling, and
improved methods of sample juice extraction such as the hydraulic press
have resulted in the adoption of direct cane analysis methods for the
cane payments in several countries. This study developed and evaluated
a model for predicting the commercially recoverable sugar yield from
sugar cane using the cane analysis derived from a core sample processed
in a hydraulic press.
The experimental work in these studies was performed at the
Audubon Sugar Factory and at Cinclare Central Factory over a three year
period (1972, 1973 and 1974).
The research covered the investigation of the variability of cane
quality within a given cane consignment as determined by the use of a
core sampler. These studies demonstrated that the core sample was both
unbiased and representative of the cane consignment. The average per
cent coefficient of variation between replicate core samples from the
same delivery were less than 5% for the pol and Brix per cent cane
determinations, and about 8% for the fiber per cent cane.
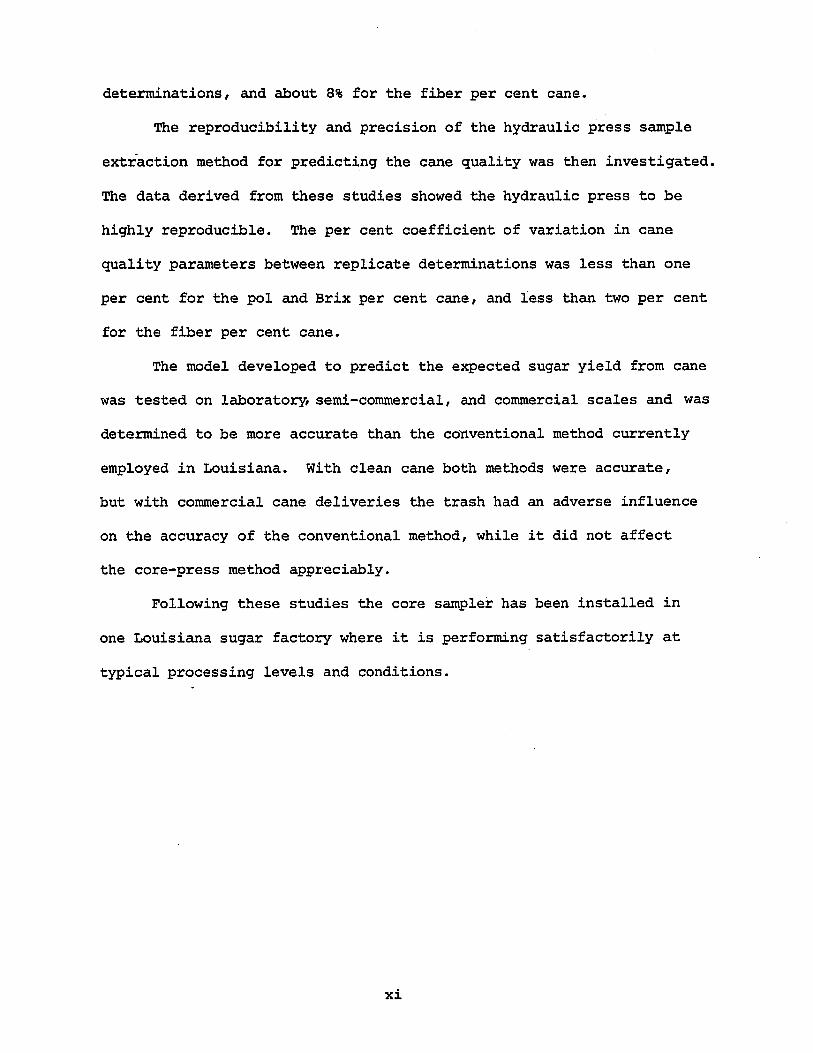
The reproducibility and precision of the hydraulic press sample
extraction method for predicting the cane quality was then investigated.
The data derived from these studies showed the hydraulic press to be
highly reproducible. The per cent coefficient of variation in cane
quality parameters between replicate determinations was less than one
per cent for the pol and Brix per cent cane, and less than two per cent
for the fiber per cent cane.
The model developed to predict the expected sugar yield from cane
was tested on laboratory, semi-commercial, and commercial scales and was
determined to be more accurate than the conventional method currently
employed in Louisiana. With clean cane both methods were accurate,
but with commercial cane deliveries the trash had an adverse influence
on the accuracy of the conventional method, while it did not affect
the core-press method appreciably.
Following these studies the core sampler has been installed in
one Louisiana sugar factory where it is performing satisfactorily at
typical processing levels and conditions.
xi
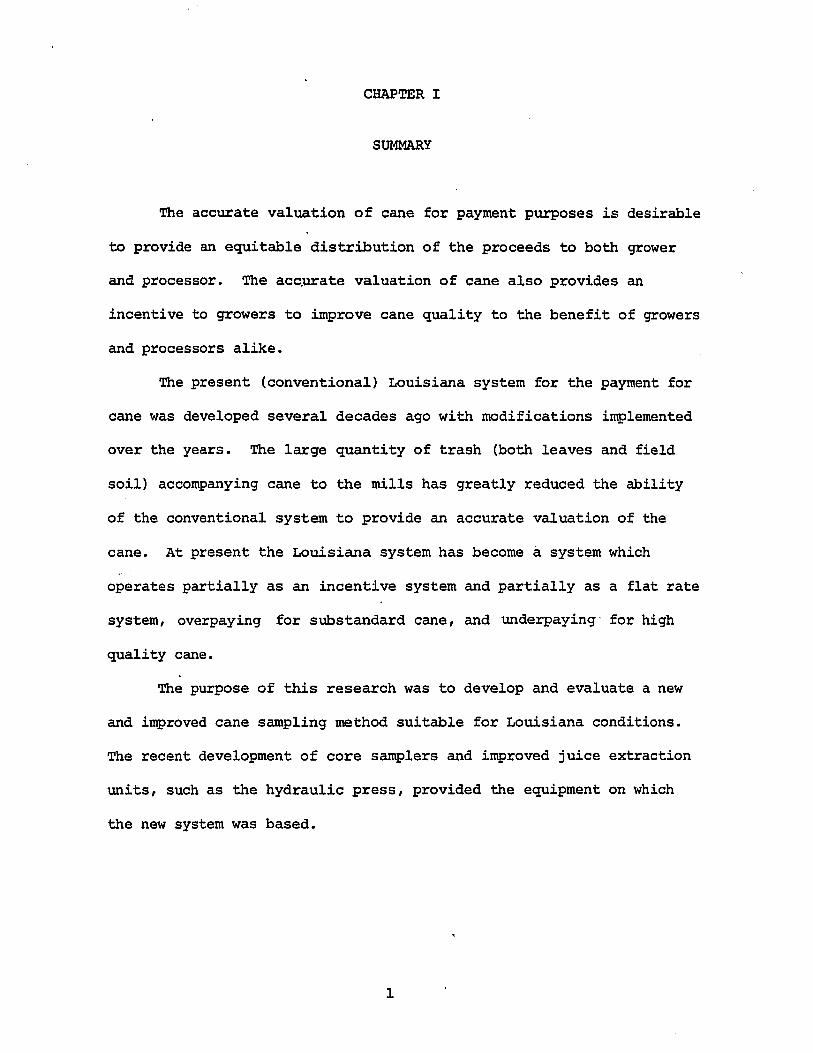
CHAPTER I
SUMMARY
The accurate valuation of cane for payment purposes is desirable
to provide an equitable distribution of the proceeds to both grower
and processor. The accurate valuation of cane also provides an
incentive to growers to improve cane quality to the benefit of growers
and processors alike.
The present (conventional) Louisiana system for the payment for
cane was developed several decades ago with modifications implemented
over the years. The large quantity of trash (both leaves and field
soil) accompanying cane to the mills has greatly reduced the ability
of the conventional system to provide an accurate valuation of the
cane. At present the Louisiana system has become a system which
operates partially as an incentive system and partially as a flat rate
system, overpaying for substandard cane, and underpaying for high
quality cane.
The purpose of this research was to develop and evaluate a new
and improved cane sampling method suitable for Louisiana conditions.
The recent development of core samplers and improved juice extraction
units, such as the hydraulic press, provided the equipment on which
the new system was based.
1
2
Elements of a Sampling System
The elements of a sampling system are:
1. The removal of a representative sample.
2. The preparation of the sample for processing.
3. The processing of the sample.
4. The analysis of the sample.
5. The expressing of the results in meaningful terms.
In implementing a cane sampling system the goals should be to:
1. Eliminate the judgement factor in selecting and processing
the sample.
2. Standardize the sample procurement and processing equipment.
3. Minimize personnel requirements.
4. Divorce the sampling system from the mill operation.
5. Reflect the effect of juice quantity as well as quality in
cane.
6. Evolve a model for accurately predicting the recoverable
sugar.
7. Provide data which supplements that of the routine factory
chemical control.
Outline of the Experimental Program
The experimental program entailed the following steps:
1. The testing of the core sampler for sample representativeness
2. The testing of the hydraulic press for reproducibility and
accuracy of predicting the cane analysis.
3
3. The development of a model that predicted the recoverable
sugar yield from the core-press cane analysis.
4. The testing of the procedure developed on the laboratory,
semi-commercial, and commercial scales.
5. The determination of the effect of various types of trash
(extraneous material in cane) on both the core-method and on
the conventional method sugar yield predictions.
6. The comparison of the core-press method with the conventional
method.
The Conventional Louisiana Cane Sampling System
The Current Sampling System; The conventional Louisiana system of cane
sampling and testing for payment is based on the factory normal juice
analysis, and on the per cent trash in the delivered cane. In practice
two grab samples of a grower's cane are obtained for testing. The
first sample is manually detrashed to obtain the trash content. The
second sample is ground to yield a juice sample which is analyzed.
Correction factors which relate the sample mill juice to the factory
normal juice are applied to the sample mill juice analysis to give
the grower's 'normal' juice used in the payment formula. The validity
of the conventional method is affected by variations in the fiber
content of the cane. Mechanically harvested and loaded cane deliveries
contain large quantities of trash which increase the apparent fiber
content of the cane and lead to inequities in the payment for cane by
this method.
4
The disadvantages of the current conventional Louisiana cane
sampling system are
1. It accounts for juice quality but not juice quantity.
2. Constant mill efficiency is assumed, although it is
universally accepted that high fiber canes produce more
bagasse residue leading to greater losses than low fiber
canes.
3. The yield prediction is dependent on the factory's mill
performance (i.e. normal juice analysis) that varies from
factory to factory.
4. The system is labor intensive; typically seven to ten
persons are employed.
5. The sample consists of a limited number of whole cane stalks
from a single, limited area of the shipment.
The Core-Press Cane Sampling Method
The core-press method as developed for Louisiana differs from
the conventional Louisiana cane sampling system in three major aspects.
Sample Removal; Instead of a mechanical grab the cane sample is
removed by a corer (circular hollow tube with a circular saw) that
penetrates the full depth of the cane delivery.
Sample Processing; A hydraulic press separates the cane sample into
juice and bagasse, both of which are analyzed, the former for Brix and
pol, and the latter only for moisture. The pol, Brix and fiber
content of the cane is calculated from these analyses on the assumption
that the small quantity of juice remaining in the bagasse has the
same composition as that of the juice extracted.
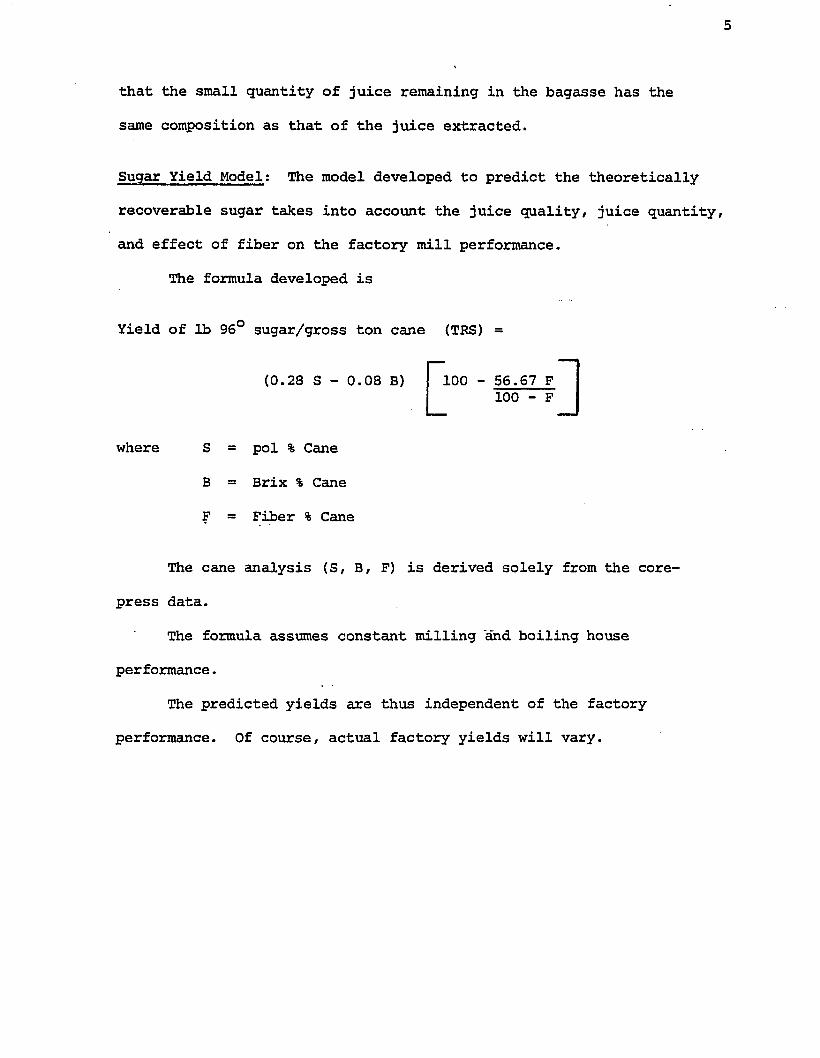
Sugar Yield Model; The model developed to predict the theoretically
recoverable sugar takes into account the juice quality, juice quantity,
and effect of fiber on the factory mill performance.
The formula developed is
Yield of lb 96° sugar/gross ton cane (TRS) =
The cane analysis (S, B, P) is derived solely from the core-
press data.
The formula assumes constant milling and boiling house
performance.
The predicted yields are thus independent of the factory
performance. Of course, actual factory yields will vary.
(0.28 S - 0.08 B) 100 - 56.67 F100 - F
where S = pol % Cane
B = Brix % Cane
F = Fiber % Cane
6
Results
The studies showed that
1. On the average the core sampler extracts a representative cane
sample regardless of point of coring in the load.
2. The juice obtained from the core sample is more closely related to
the factory normal juice than that from the conventional method.
3. The core sample yields a fiber % cane value that is very closely
related to that of the factory. On the other hand, the trash
determination of the conventional system bears very little
relationship to, the factory fiber % cane.
4. The hydraulic press is extremely reproducible. The standard
deviation of the theoretically recoverable sugar was only +1.5%
of the mean.
5. The hydraulic press pol extractions of over 70% were much closer
to the 90% pol extraction achieved commercially, than the pol
extractions of sample mills (usually about 50%) .
6. The pol % cane figure obtained by use of the hydraulic press is
within 2% of the value obtained by the direct cane wet digestion
method (the most accurate method available— but very time-
consuming) .
7. The hydraulic press responds to trash in the same manner as mills
do. For example, green leafy trash only lightly loads the mill,
while dry leaves load the mill greatly. Similarly, in the press,
dry leaves increase the bagasse % cane more than green leaves do.
8. The core sampling method more accurately predicts the factory
recoverable sugar than does the conventional method.
7
9. The recoverable sugar in the' cane figured by the conventional
method only gives the growers about 60% of the premium value for
cane of above average quality. Conversely, the conventional
method only penalizes growers 60% of the penalty value for cane
of below average quality. Thus the conventional system falls
about midway between a cane payment system truly based on cane
quality (recoverable sugar basis) and a "flat rate" system (no
allowance for cane quality).
10. The 1975 and 1976 commercial core-press results at St. Martin
Sugar Cooperative accurately predicted the factory sugar yield.
Conclusions
The core-press method of sampling came meets all of. the require
ments of a good sampling system since:
1. The corer yields a representative sample.
2. The hydraulic press operation is reproducible.
3. The personnel requirements are minimized ( 3 - 4 people for a
core-press installation versus 7 - 1 0 people for the conventional
method).
4. The system is independent of factory mill performance.
5. The effect of juice quantity and quality are taken into account.
6. The method predicts recoverable sugar - a meaningful quantity.
7. The method yields a direct cane analysis that supplements the
routine factory chemical control.
8
The implementation of the core-press method of cane sampling in
Louisiana would put the industry on a sound basis for the valuation
of cane. Prom the grower's stand point, growers supplying high
quality cane would recieve the full value (based on sugar) of their
cane, and growers supplying poor quality cane would not be subsidized
by the good growers., , The result of payment for cane on a true quality
basis would encourage higher quality cane production since increased
grower returns would justify the additional expenditures required to
achieve higher quality cane. It is generally recognized that high
quality cane is the most important single requirement for a profitable
sugar industry. In Louisiana where climatic conditions make it
difficult to achieve quality cane, efforts to improve cane quality
would have a major impact on the profitability of the industry.
The disadvantage of the core-press method lies in its cost.
A new core-press installation suitable for the average Louisiana
factory would cost about $80,000, while the equipment required for the
conventional Louisiana cane sampling system costs about $20,000 to
$25,000. The lower labor requirement for the core-press (4 people
versus 7 - 1 0 people for the conventional method) would save the
factory about $10,000 per crop. Thus, on a labor-savings basis the
return (or payout period) is not attractive enough to warrant
conversion to the core-press method. However, the real justification
for the core-press installation is its accurate valuation of cane
which encourages good quality cane which improves the profitability
of growers and processors alike. The installation of the core-press
method at St. Martin Sugar Cooperative was accompanied by a sharp
9
increase in the quality of cane delivered to that factory. The
initial result of sampling cane by the core-press method appears to
improve the delivered cane quality by about 4 pounds of sugar per ton
cane. For a factory grinding 200,000 tons per crop the value of
this additional sugar (at IOC/lb) is $80,000.
It is recommended that the conversion to core-press sampling
in Louisiana be accelerated.
CHAPTER II
A GENERAL COVERAGE OF THE GROWTH, HARVEST,
AND CULTURE OF SUGAR CANE
The most important single factor in the economics of cane sugar
manufacture is the quality of the sugar cane since the better the
quality of the cane the less is the cost of manufacture and the higher
the recovery of sugar per ton of cane processed and per dollar of
capital invested in factory equipment.
A high quality cane is one having a high sucrose content and a
relatively soft fiber of sufficiently low content to allow a high
sucrose extraction by the mills but one that nevertheless provides
sufficient bagasse to meet the steam requirements of the factory with
out the necessity of purchasing supplementary fuel.* In addition, the
juice of the cane should be of high purity, that is to say, having a
high sucrose/total solids ratio. Further, the non-sucroses should be
such as would give a minimum of difficulty in the manufacturing process
and permit a high recovery of sucrose.
In practice, cane quality depends on many factors, the major ones
being the climatic and soil conditions of the area in which the cane
is grown; the fertilizer and agricultural practices; the cane variety;
the stage of maturity of the cane when reaped; the degree of damage
*In some localities where other low cost fuel is available, bagasse has
a sufficiently high value for board-making etc., to permit other fuels
being substituted for bagasse.
10
11
to the cane stalks by wind, insects and micro-organisms, and/or in the
course of the reaping and loading operations; and the time which
elapses between reaping and processing at the factory, i.e. the degree
of freshness.
Of the various factors by which cane quality is judged, the
sucrose (pol) content of the cane holds first place but the purity of
the juice is also of major importance as both the quantity and the
nature of the non-sucrose components present with the” sucrose greatly
influence the percentage of extracted sucrose that is recovered.
Review of the Literature
The literature on cane quality is voluminous but a brief summary
which will illustrate the significance of the major factors is given
below.
Effect of Climate on Cane Quality
The effect of climate on sucrose % cane has been summarized by
Shaw^ who collected and reported on data from a wide range of cane-
growing countries. A plot of sucrose % cane against latitude led him
to the generalization that "the data suggest that cane quality is an
inherent function of latitude. The curve obtained is bi-modal in form
with peaks of superior sucrose % cane at approximately 18°N and 18°S
latitude. Above latitude 18°N and S sucrose content drops rapidly as
the apparent ecological limits of latitudes 30°N and 30°S are
approached”. The causal agencies associated with latitude appear to
^Shaw, M. R., "An International Glance at Sucrose Content of Cane",
Proceedings ISSCT, 1953, pp. 283-291.
12
be the length of day and temperature.
At any given latitude, the intensity and distribution of rainfall
also affects the sucrose % cane. Very low or high rainfall tends to
low sucrose % cane values and moderate rainfall to high ones.
The distribution of the rainfall is also important. Best cane
quality is obtained if the bulk of the rainfall is uniformly Spread
over the first 70% to 75% of the growth cycle with light showers at
intervals over the remaining ripening period of growth. There is also
evidence that moderately large temperature differences between day and
night during ripening is conducive to higher than average sucrose %
cane and juice purity.
Cane Variety
The sugar cane is a large grass belonging to the genus saccharum.
This genus contains numerous varieties many of which have been devel
oped by controlled crossing of the so-called noble and wild varieties.
The noble canes which are of high sucrose content and low fiber with
relatively high juice purity were the only varieties formerly grown.
However, their yield of cane per acre was low as was their resistance
to diseases. In consequence, present day varieties in cultivation are
crosses between the noble and wild canes. Such crosses vary in
sucrose % cane and juice purity from good to poor depending on their
genetic composition. The cane varieties grown in any given locality
will be those found to be best suited to the prevailing conditions and
therefore giving the highest monetary return. The breeding of better
cane varieties is a major objective in the industry.
13Fertilizer and Agricultural Practices
Heavy applications of nitrogenous fertilizers tend to reduce the
sucrose % cane and the juice purity but coincident applications of
potash tend to offset such reductions in quality^. As an example of
the average effect of applications of nitrogen on the sucrose % cane,
the following formula has been shown to apply for clay soils inAGuyana .
S = 100 + logN - 0.038N
where S = pol % cane as a percentage of the pol content without
nitrogen, and N = the amount of nitrogen applied in lbs.
per acre.
Agricultural practices, e.g. proper tillage, drainage and mulch
ing, etc., that avoid excessively high or low moisture levels in the
soil promote high sucrose % cane and juice purity, particularly if a
moderate degree of moisture stress occurs during the ripening period.
Stage of Maturity of Cane When Reaped
As may be expected, the sucrose % cane and juice purity usually
attain a maximum when full maturity of the cane stalk has occured.
Within the tropics, the cane usually attains maturity between 12
and 24 months age but outside of the tropics climatic conditions do
2Halliday, D. J., "The Manuring of Sugar Cane", Published by the Centre
D'Etude de L'Azote, Geneva, p. 71.*5Saint, S. J., "Manorial Trials with Sugar Cane", Agric. J., Barbados,
1933, 2(4), 1-32; 1935, (4), 1-24; 129-164; 1937, (6), 20-41.
^Sugar Bulletin, No. 22 Dept, of Agriculture, Georgetown, British
Guiana, 1954, pp. 41-54.
14not always allow of reaping at this age. In Louisiana, for example,
the stubble cane is reaped after 8 or 9 months of growth and plant
cane usually one month less than stubble and in consequence the cane
is not fully mature when reaped.
Not all cane stalks in a field of cane are of equal age at time
of reaping and therefore the period of optimum cane quality may extend
over 3 to 5 weeks depending not only on climate and other conditions
but also on the age distribution of the stalk population.
The maximum sucrose % cane attained in any given cane stalk does
not necessarily coincide with its physiological maturity although it
will usually be near that period of its life. The rainfall during
the ripening period is the major factor determining the period of
optimum sucrose % cane and juice purity during the life cycle.
The Degree of Damage Sustained by the Cane Prior to Reaping
When cane cells are damaged or killed by the action of high
winds, insects, micro-organisms, or by reaping and loading operations,
chemical changes occur in the damaged cells leading to the loss of
sucrose by inversion and to further decomposition of the reducing
sugars thereby produced as well as to decomposition of other plant
substances present in the juice of the cane. These decomposition
products are frequent causes of difficulties in the manufacturing
processes.
Damage to cane stalks leading to severe infection by micro
organisms has assumed great importance with the wide adoption of
mechanized cutting and loading of canes. In particular, infection
of damaged stalks by leuconostoc mesenteroides bacteria results in
the conversion of sucrose to dextran which not only causes loss of
15sucrose but also results in serious manufacturing difficulties. This
Chas been the subject of much recent study .
Time Elapsing between Reaping and Milling
Under favorable growth conditions, relatively few cane stalks
will have sustained much damage or have died at time of reaping. How
ever, even under the best of conditions some stalks will have died from
stalk competition or have been damaged as the result of the action of
freezes, boring insects, micro-organisms, the splitting of stalks by
wind, or excessive drying out. As soon, however, as a cane stalk is
killed or severely damaged by fire in the course of reaping operations,
growth processes cease and inversion of sucrose by the enzyme invertase
(which is present in the juice of the cane) commences. The most
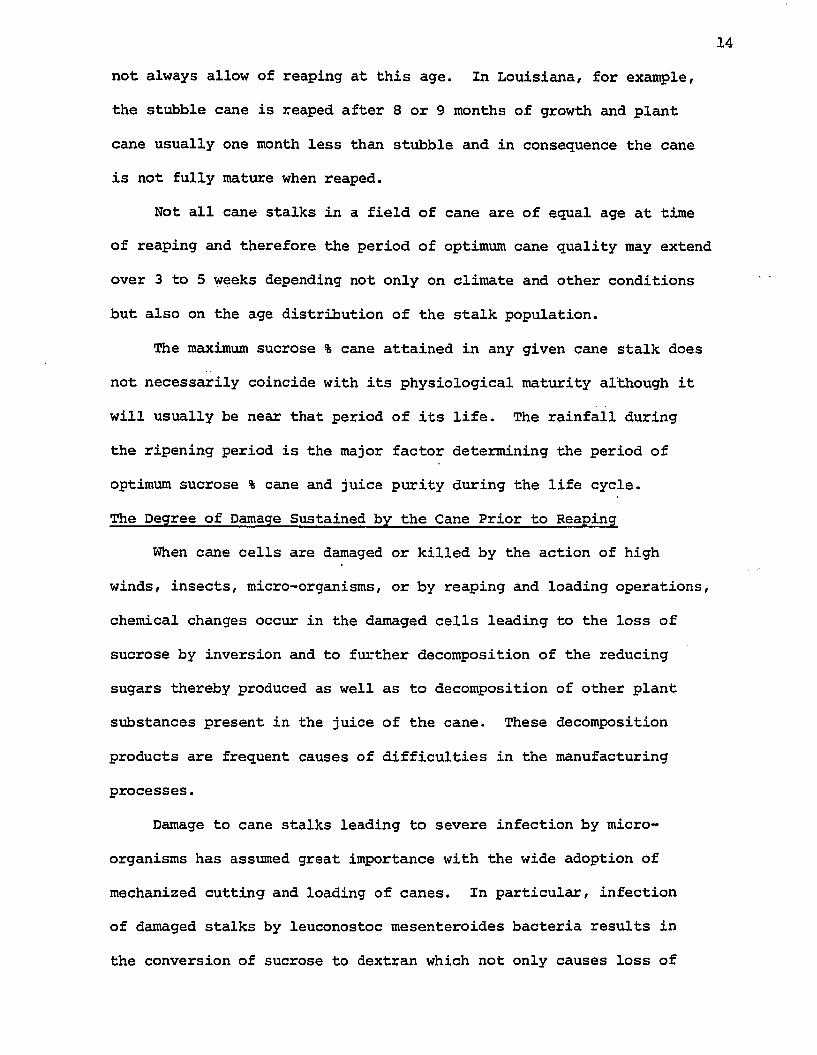
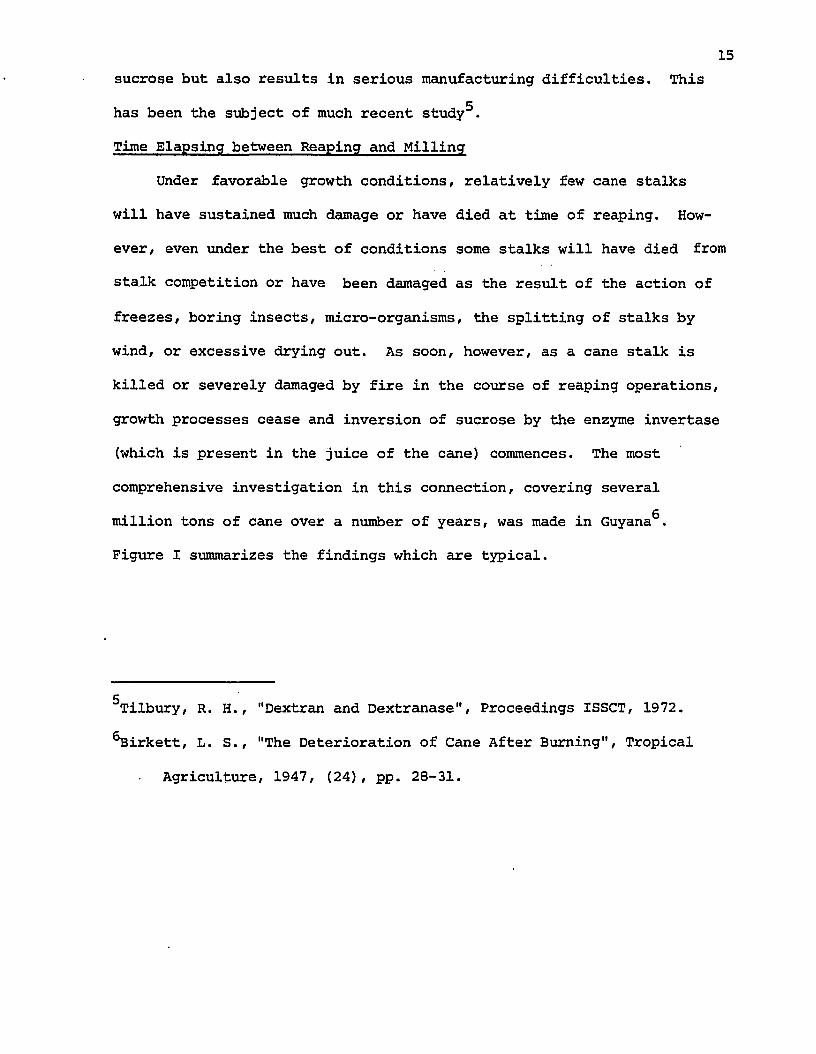
comprehensive investigation in this connection, covering severalgmillion tons of cane over a number of years, was made in Guyana .
Figure I summarizes the findings which are typical.
5Tilbury, R. H., "Dextran and Dextranase", Proceedings ISSCT, 1972.g°Birkett, L. S., "The Deterioration of Cane After Burning", Tropical
Agriculture, 1947, (24), pp. 28-31.
POL
IN CA
NE
% P
OL.
IN FR
ESH
CANE
.
16Figure 1
Deterioration of Cane Following Harvesting
________________ DAYS AFTER BURNING.____________________________2 3 4 5 6 7 8 9
CHAPTER III
THE IDEAL CANE PAYMENT SYSTEM
The valuation of sugar cane has changed from the early flat rate
method to the more sophisticated methods of the present time which
reflect cane quality. An excellent summary of the major cane payment
methods is given by Seip.^
There are four basic methods of valuing sugar cane and these are
listed in order of increasing suitability for determining its true
value as follows:
1. A price is paid per ton of cane with no regard to the quality
of the cane.
2. The price per ton of cane is based on a cane having a certain
pol % cane as standard with proportionate premiums and dis
counts on price as the pol % cane increases and decreases
relative to the standard.
3. The price per ton of cane is based on a cane having a certain
available pol % cane as standard with proportionate premiums
or discounts as the available pol % cane increases or decreases
relative to the standard. Available pol is the name given to
that portion of the total pol which will be recovered. The
universally used formula for available pol is the Winter-Carp
formula:
^Seip, J. J., "A Method of Determining Sugar Cane Quality in Louisiana",
Ph.D. Dissertation, LSU, January, 1963.
17
Available pol = (1.4 - x 100Pwhere P is the juice purity.
4. The price per ton of cane is determined on the basis of
its quality and on the manner in which its quality influences
factory performance, that is to say, on the resultant yield
of commercial sugar per ton of cane. Thus, in addition to
the available pol, the quantity of fiber (and hence juice)
should be taken into account. This is the ideal method.
The ideal method for assessing the potential value of the cane
as a source of sugar should take into consideration the influence
of its quality on factory efficiency. It is desirable, therefore, to
describe briefly the inter-relationships between cane quality and
factory efficiency. In addition, the methods of measuring factory
efficiency must be indicated and also the efficiency standards which
are considered applicable to factories operating in the area of
application.
Inter-relationship between Cane Quality and Factory Efficiency
Cane Composition
The sugar cane consists of fiber and juices of different concen
tration and purity. For instance, the juice of the top portion of
the mature cane is lower in Brix, pol and purity than that of the
middle and bottom portions. Also, the juice of the nodes is similarly
lower in Brix, pol and purity than that of the internodes. A uniform
mixture of all the juices present in the cane is termed the absolute
juice and this concept is adopted in practice as provides a
fixed basis for eva;uating the mill performance. That is to say,
19
the cane is considered simply to consist of fiber and absolute juice.
On the factory scale the composition of the absolute juice is calcu
lated from the sum of the weights of Brix and pol in the extracted
juice plus the Brix and pol in the bagasse, the purity of the residual
juice in the bagasse being assumed to have the same purity as the last
extracted juice.
Cane Quality
No factory is capable of extracting all the absolute juice nor
is it practical to do so in the laboratory for routine control using
procedures similar to those of the factory process. In methods of
assessing cane quality, the purity of that portion of the absolute
juice which is extracted by the mills, namely, the mixed juice, is used
instead of the absolute juice.
The major factors determining cane quality are the pol % cane,
the fiber % cane, and the purity of the mixed juice.
The percentage of the pol in the cane that is recovered as
commercial sugar is not directly proportional to the pol % cane but
depends upon the percentage of fiber in the cane and the purity of
the mixed juice assuming factory efficiency to be constant.
The fiber % cane influences the value of the cane since the
greater the fiber content of the cane, the lower will be its juice
content. In addition, high fiber increases the quantity of juice
lost in the bagasse. That is to say, the higher the fiber % cane the
greater will be the loss of absolute juice (and hence pol) in the
bagasse and therefore the lower will be the pol extraction and vice
versa. Accordingly, the efficiency of the milling process is best
measured by the amount of absolute juice lost per unit of fiber. In
20
practice, the "absolute juice lost per cent fiber" is used. The ab
solute juice lost per cent fiber is calculated from the following
formula:
Absolute Juice Lost % Fiber = (100 - Pol Extraction)(100 - Fiber % Cane)Fiber % Cane
where the Pol Extraction is defined as
Pol Extraction = Pol Extracted in Mixed Juice x 100Pol in Cane
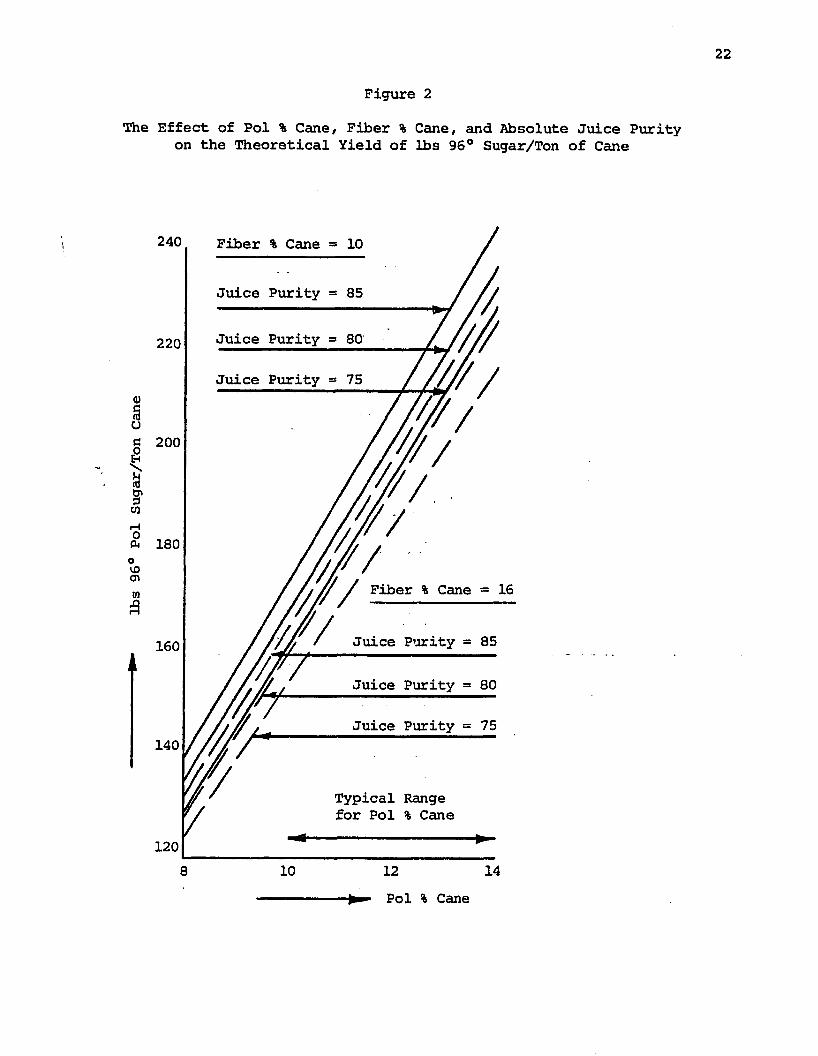
The effect of the percentage of fiber on the pol extraction by
mills at constant milling efficiency is shown in Figure 2 where the
absolute juice lost % fiber is assumed to be 56.67 (a typical value
for Louisiana). For an absolute juice purity of 80 and a pol % cane
of 10%, the recoverable sugar at 10 and 16 fiber % cane is 168.67
and 160.57 lbs 96° sugar/ton cane respectively.
In Louisiana a typical value of the fiber % cane is 16, although
in any given crop the values reported by the factories may vary from
12 to 22%. In Florida the average fiber % cane is 10-12 %. Drought
and/or freeze damaged cane usually results in an increase in the fiber
% cane.
In order to demonstrate the influence of the purity of the ex
tracted juice (mixed juice) on the available pol that is extracted,
it is first necessary to describe how the available pol is determined.
For this purpose the Winter-Carp formula which has found wide use
throughout the cane sugar industry and which is applicable to all cane
sugar products, is generally used. It is
Available pol % in product = 100(1.4 - 40/P)
21
where, P is the purity of the cane juice.
This formula assumes that one part of non-pol solids holds 0.4
parts of pol in the final molasses. In fact, one part of non-pol
solids will hold different amounts of pol in a final molasses depend
ing upon the relative proportions of reducing sugars to ash in the
final molasses and on processing conditions. Nevertheless, the formula
has proved a useful one in practice since the reducing sugars/ash
ratio does not usually deviate widely from the ratios that existed
when the formula was developed.
The effect of absolute juice purity differences on the recoverable
sugar at constant pol and fiber per cent cane are also shown in
Figure 2. For a pol % cane of 10, and fiber % cane of 16, the recov-
able sugar at 75 and 85 juice purity are 154.62 and 165.82 lbs 96°
sugar/ton cane respectively.
In Louisiana, the juice purities at the start of a crop are
typically about 75, but rise rapidly to about 80-82 giving a crop
average purity close to 80. The juice purities near the end of the
crop may decline following unfavorable climatic conditions such as
heavy rains or a freeze. In Florida juice purities are 2-4 points
higher than in Louisiana. In some tropical countries, juice purities
often reach the upper eighties.
The difference in the recoverable sugar yield between high fiber
and low fiber cane is about 10%. The difference in the recoverable
sugar between high purity and low purity juices is also about 10%.
However, the difference in the recoverable sugar yield between high
lbs
96° Pol
Sugar/Ton
Cane
22
Figure 2
The Effect of Pol % Cane, Fiber % Cane, and Absolute Juice Purity on the Theoretical Yield of lbs 96° Sugar/Ton of Cane
240 Fiber % Cane = 10
Juice Purity = 85
Juice Purity = 80220
Juice Purity = 75
200
180
Fiber % Cane = 16
Juice Purity = 85160
Juice Purity = 80
Juice Purity = 75140
Typical Range for Pol % Cane
12010 12 148
Pol % Cane
23
pol and low pol cane may be as great as 40%. Thus, the pol % cane is
the single most important parameter affecting the sugar yield.
Cane Sampling
The representative sampling of cane is inherently a difficult
problem, being one of sampling a non-homogenous mixture of solid
material. The quality of the cane varies along the length of the stalk
with the lower portion being highest in pol and purity, and the upper
portion being of lower pol and purity. The quality of the came also
varies along its length with each node. The nodes are high in fiber
and contain poor quality juice, while the larger internode areas contain
high quality juice arnd relatively less fiber. Cane composition also
varies radially at any given location along the length of the stalk.
In general, the rind contains low quality juice and a high percentage
of fiber, while the inner tissue contains high quality juice and a
lower percentage of fiber.
The maturity of cane stalks from a given field vary from stalk to
stalk , as a result of soil conditions, insect damage, wind damage and
other variables. Harvesting conditions introduce additional variables
that affect the delivered cane quality. Ideally cane stalks free of
any extraneous material is the objective of good harvesting methods.
However, the incomplete removal of leaves and grass by burning (or other
means) , and the inclusion of field soil by virtue of the harvesting and
loading methods result in delivered cane containing an average of about
10-20% extraneous material. Wet weather or freeze conditions can
greatly increase the quantity of extraneous matter accompanying cane
24
deliveries to the sugar factories.
In addition to the above variables, stratification of the
extraneous material can occur when the cane is transloaded or trans
ported over moderate distances, or when loaded cane deliveries are
subjected to rain. Often the lower portion of such deliveries are
visibly higher in field soil.
Typical Louisiana sugar factories process between 2000 and 6000
tons of cane daily. The quantity of cane that can be conveniently processed in a sampling station is usually only about 0.05
to 0.20 per cent of this throughput.
The conventional method of sampling cane involves the removal of
a grab sample of whole stalk cane either manually or with the aid of a
mechanical grab. In the corer method the sample is obtained by
removing a cylindrical cane sample in a tube along a diagonal extending
from the top of the delivery to the bottom.
The core sample would be expected to be a more representative
sample than a grab sample since more stalks are sampled, and since it
overcomes the problem associated with the stratification of the
extraneous material. The validity of this expectation is borne out by
the results given in the following chapters.
CHAPTER IV
' OUTLINE OF THE EXPERIMENTAL PROGRAM
The laboratory, semi-commercial and commercial testing of the
corer and the hydraulic press was conducted by methods that might at
first sight appear to be complicated in nature. The purpose of this
chapter is to explain the reasons for the methods used, and to prepare
the reader for what is to follow.
In evaluating a sampling and analytical procedure of this type
it would be desirable to conduct an experiment where a given homogeneous
sample of cane could be subjected to all the tests required. From this
rigorously controlled ideal experiment the maximum quantity of results
could be obtained with the minimum of experimental data. Unfortunately,
practical considerations such as equipment availability, the scheduling
of commercial mill runs, the deterioration of sugar cane on storage,
and the duration of the investigation, precluded this type of ideal
experiment.
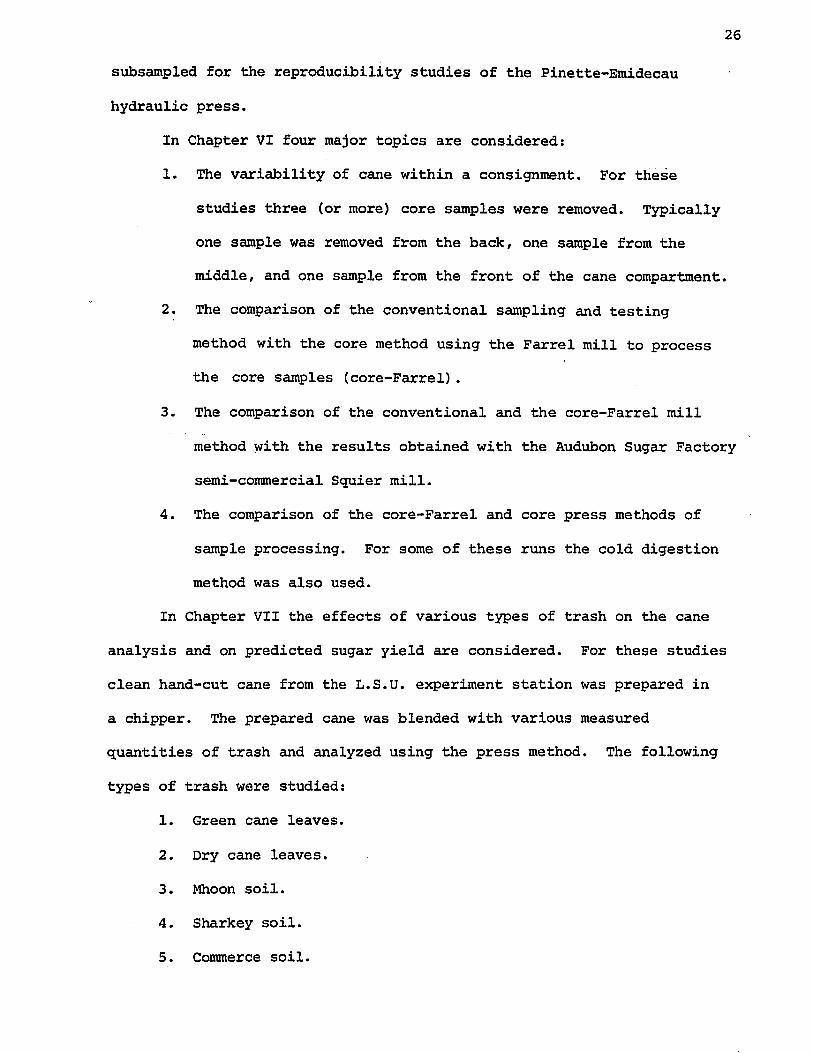
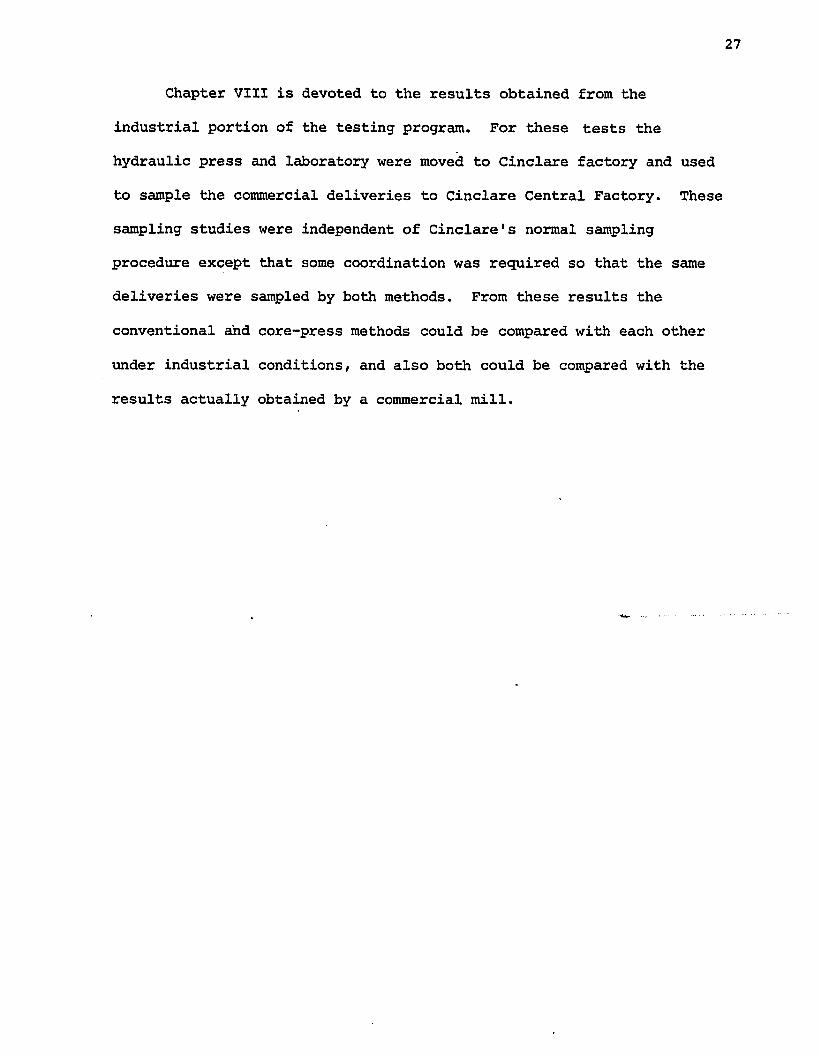
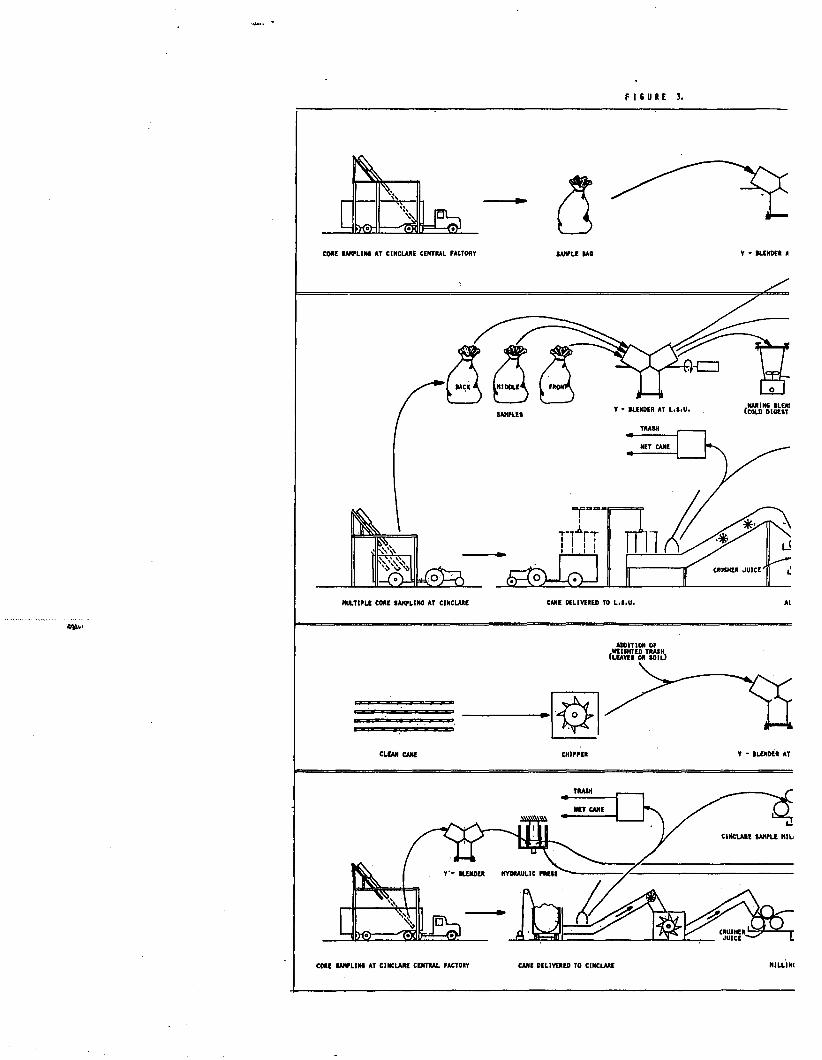
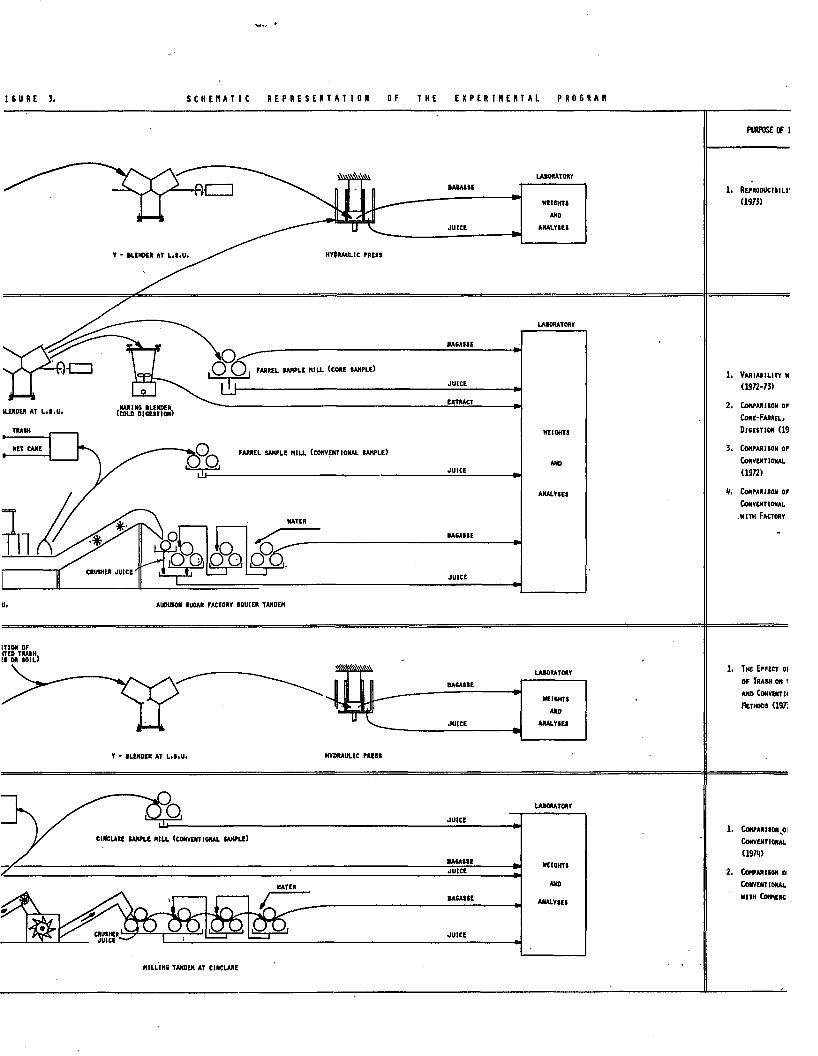
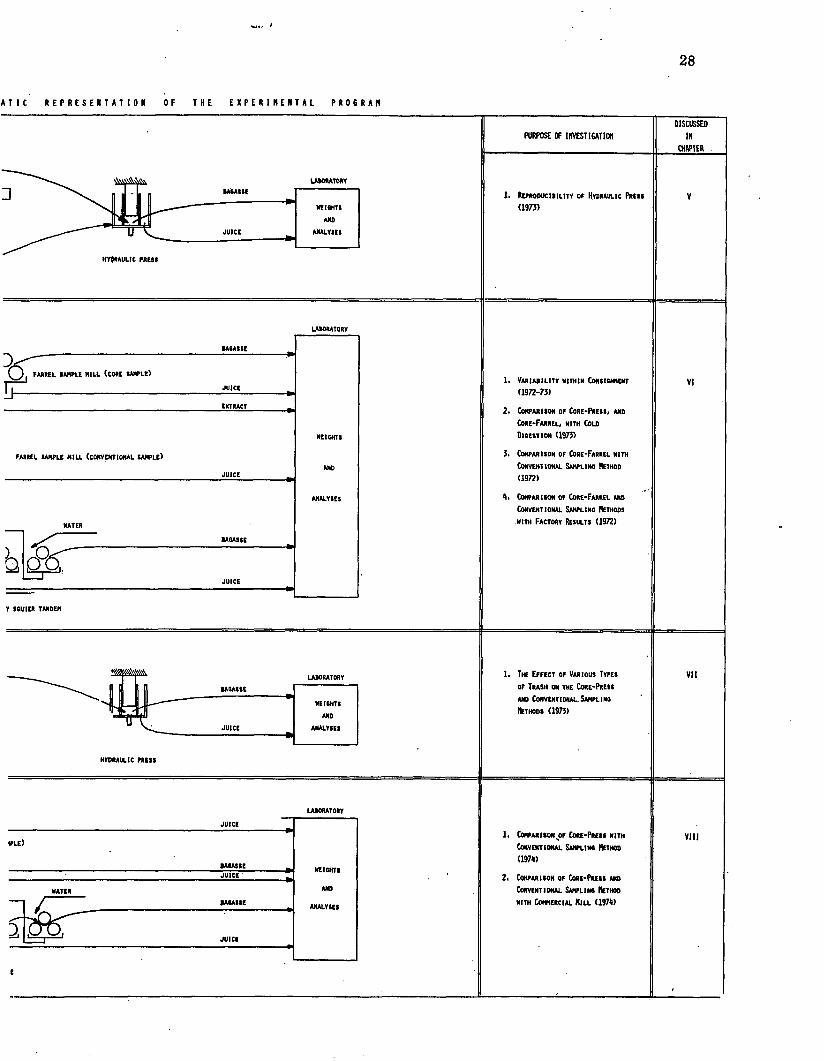
Figure 3 schematically depicts the tests conducted and the
equipment and facilities employed together with the Chapter in which
the tests are discussed. The reader may find it helpful to refer to
Figure 3 at the start of each of the .following four chapters.
In Chapter V the reproducibility of the hydraulic press is
studied. The cane samples used in these reproducibility studies were
obtained and shredded by the J & L corer and pre-breaker located at
Cinclare Central Factory. The samples were transferred to L.S.U.
where the shredded cane was mixed in a Y-blender before being
25
26
subsampled for the reproducibility studies of the Pinette-Emidecau
hydraulic press.
In Chapter VI four major topics are considered:
1. The variability of cane within a consignment. For these
studies three (or more) core samples were removed. Typically
one sample was removed from the back, one sample from the
middle, and one sample from the front of the cane compartment.
2. The comparison of the conventional sampling and testing
method with the core method using the Farrel mill to process
the core samples (core-Farrel).
3. The comparison of the conventional and the core-Farrel mill
method with the results obtained with the Audubon Sugar Factory
semi-commercial Squier mill.
4. The comparison of the core-Farrel and core press methods of
sample processing. For some of these runs the cold digestion
method was also used.
In Chapter VII the effects of various types of trash on the cane
analysis and on predicted sugar yield are considered. For these studies
clean hand-cut cane from the L.S.U. experiment station was prepared in
a chipper. The prepared cane was blended with various measured
quantities of trash and analyzed using the press method. The following
types of trash were studied:
1. Green cane leaves.
2. Dry cane leaves.
3. Mhoon soil.
4. Sharkey soil.
5. Commerce soil.
27
Chapter VIII is devoted to the results obtained from the
industrial portion of the testing program. For these tests the
hydraulic press and laboratory were moved to Cinclare factory and used
to sample the commercial deliveries to Cinclare Central Factory. These
sampling studies were independent of Cinclare's normal sampling
procedure except that some coordination was required so that the same
deliveries were sampled by both methods. From these results the
conventional and core-press methods could be compared with each other
under industrial conditions, and also both could be compared with the
results actually obtained by a commercial mill.
F I G U R E 3.
- l U —
CORE SAKPLINO AT CINCLARE CENTRAL FACTORY V - SLENDER A
SACK iKIDOLE*
.MARINO BLENI (COLD DIGESTV - BLENDER AT L.S.U.
TRASH
NET CANE
\s \\ n W VL
i rCANE DELIVERED TO L.I.U.
CRUSHER JUICE
MULTIPLE CORE SAMFLINO AT CINCLARE
T - BLENDER ATCLEAN CANE
TRASH
NET CANE
CINCLARE SAMPLE MIL
HYDRAULIC PRESS
CORE SAMPLING AT CINCLARE CENTRAL FACTORY HILLIN'CANE DELIVERED TO CINCLARE
I S U A E 3. S C H E K A T I C R C P R E S E N T A T I O N O F T H E E X P E R t N E H T A L P A O G R A H
LABORATORY
■flCZl BAGASSEWEIGHTS
ANDJUICE
HYDRAULIC PRESSV * BUNDER AT L.I.U.
LABORATORY
PARREL SAMPLE HILL (CORE SAMPLE) Variability n (1972-73)JUICE
EXTRACTILENDER AT L.S.U.
WEIGHTSComparison of Conventional (1972)
NET CANE FARREL SAMPLE HILL (CONVENTIONAL SAMPLE)AND
JUICE
ANALYSES
MATERBAGASSE
O Q ,O Q ,CRUSHER JUICE JUICE
AUDUBON SUGAR FACTORY SOUIER TANDEM
ITION OF fTED TRASH. IS OR SOIL)The Effect oi of Trash on 1 and Convent i < feTHODS (197:
LABORATORYBAGASSE
JUICE *HYDRAULIC PRESSY - BUNDER AT L.S.U.
LABORATORYJUICE
CINCLARE SAMPLE HILL (CONVENTIONAL SAMPU)
JUICEANDMATER
ANALYSES
JUICE
HILLING TANDEM AT CINCLARE
28
A T I C R E P R E S E N T A T I O N O F T H E E X P E R I M E N T A L P R O G R A M
HEIGHTSAND
ANALVICIJUICE
HYDRAULIC PRESS
PURPOSE OF IKVESTIGATION
J. Reproduci bilit y o f Hydraulic Pres s(1973)
DISCUSSEDIN
CHAPTER
BASASSE
FARREL SAMPLE MILL (CORE SAMPLE)JUICE
EXTRACT
HEIGHTS
FARREL SAMPLE MILL (COHVBITIOHAL SAMPLE)ANDJUICE *
NATERBAGASSE
JUICE
Y SQUIER TANDEM
1. Va r i a b i l i t y within Cons ignme nt (1972-73)
2. Com p a r i s o n of Co r e-Pr e s s, and Co r e-Fa r r e l. with Co l d D i ge stion (1973)
3. Co m p a r i s o n of Co r e -Farr e l nith Co n v e n t i o n a l Sa mp ling Method (1972)
4. Com p a r i s o n of Co r e-Fa r r e l and Co n v e n t i o n a l Sam p l i n g Methods with Fact o r y Resu lts (1972)
LABORATORYU f i M U
VEI6HTSANO
_ JUICE ANALYSIS
HYDRAULIC PRESS
1. The Ef f e c t of Va ri o u s Types of Tr a s h o n the Co r e-Press and Con v e ntio nal. Samp l i n g Meth ods (1973)
V II
JUICE
IPLE)
BAGASSE HEIGHTS
ANDHATERANALYSES
JUICE
E
1, Co m p a r i s o n^ Co r e-Pr es s h it h Co n v e n t i o n a l Sa mp ling Method(1974)
2. Co m p a r i s o n o f Core-Pr e s s and Co n v e n t i o n a l Samp ling Method hith Comm e r c i a l M ill (1974)
VIII
CHAPTER V
THE HYDRAULIC PRESS
The hydraulic press offers several advantages as a sample
extraction unit over the conventional small 3-roll sample mills.
Among these advantages are:
1. Lower Cost.
2. Semi-automatic operation.
3. Greater Pressure (yielding higher extractions).
4. Uniform operating procedure regardless of the press operator.
In this chapter the reproducibility of the press method is
investigated. The constancy of the bagasse analysis, particularly
fiber and moisture per cent bagasse are investigated. Extraction
severity as indicated by pol extraction is determined.
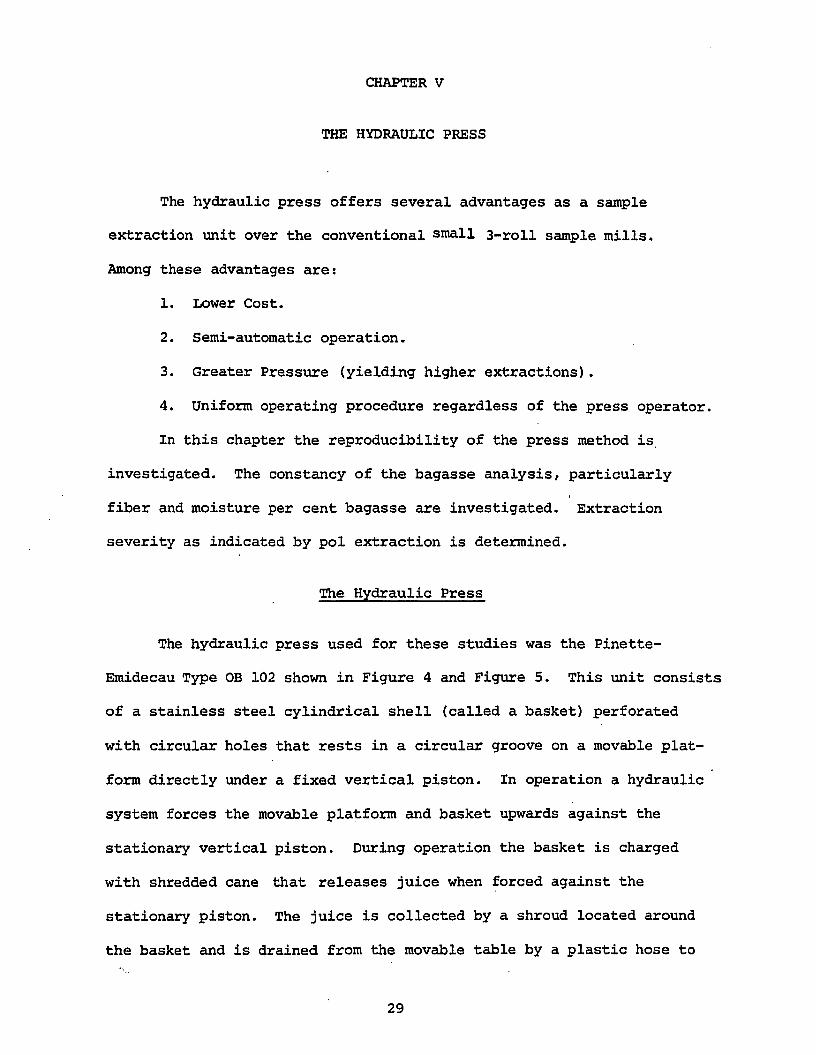
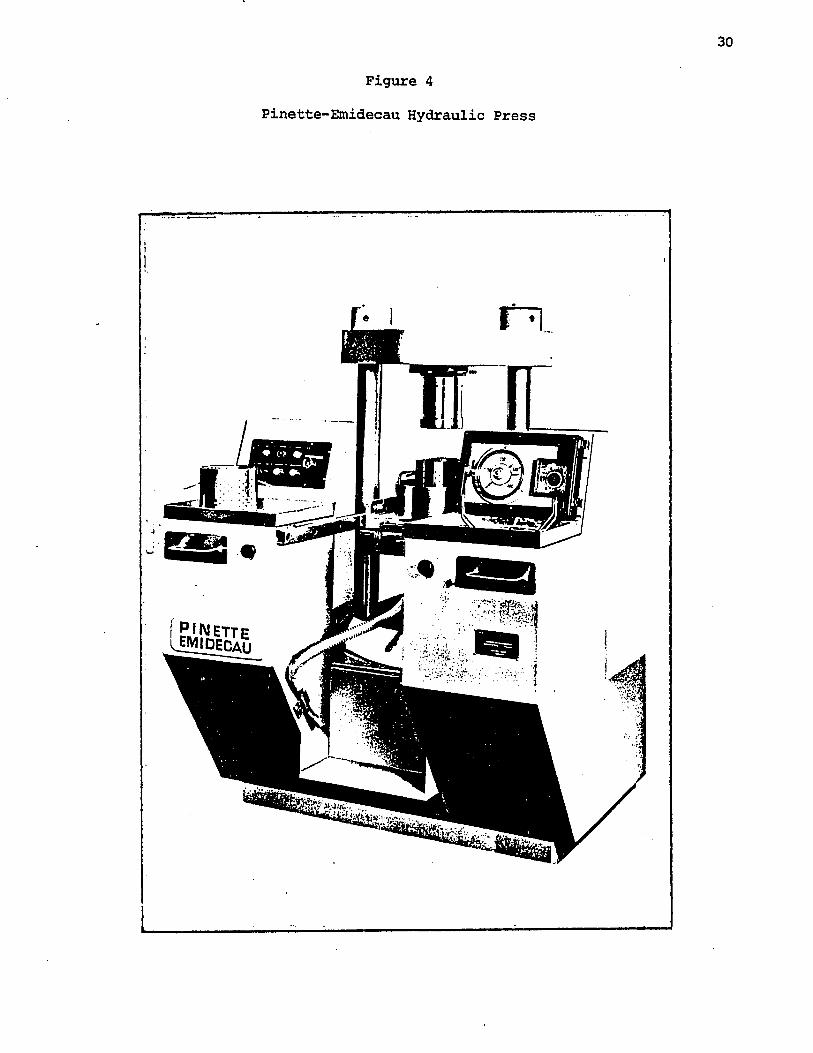
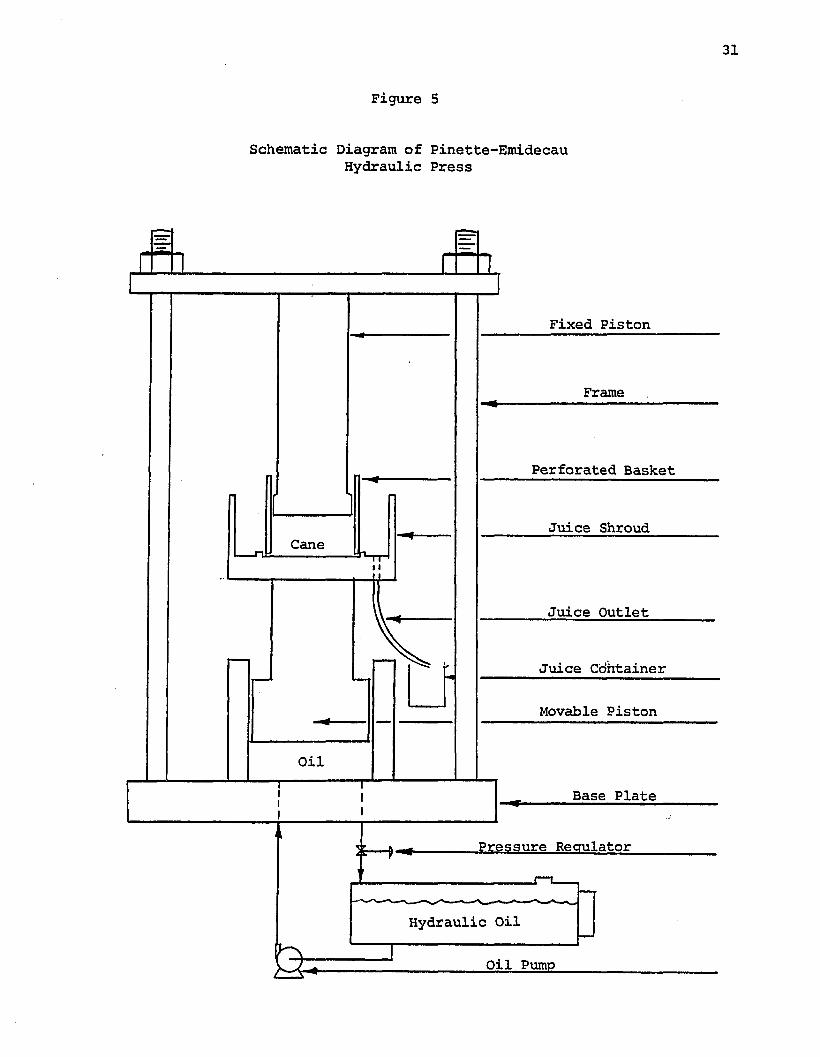
The Hydraulic Press
The hydraulic press used for these studies was the Pinette-
Emidecau Type OB 102 shown in Figure 4 and Figure 5. This unit consists
of a stainless steel cylindrical shell (called a basket) perforated
with circular holes that rests in a circular groove on a movable plat
form directly under a fixed vertical piston. In operation a hydraulic
system forces the movable platform and basket upwards against the
stationary vertical piston. During operation the basket is charged
with shredded cane that releases juice when forced against the
stationary piston. The juice is collected by a shroud located around
the basket and is drained from the movable table by a plastic hose to
29
30
Figure 4
Pinette-Emidecau Hydraulic Press
p i n e t t ee j v u d e c a u
31
Figure 5
Schematic Diagram of Pinette-Emidecau Hydraulic Press
Fixed Piston
Frame
Perforated Basket
Juice ShroudCane
Juice Outlet
Juice Cclhtainer
Movable Piston
Oil
Base Plate
Pressure RegulatorYz— fr
Hydraulic Oil
Oil Pump
32
to a juice sample container located below the movable table.
The sample basket diameter is 145 mm (5.7") and the working
height is 145 mm (5.7"). The maximum working force is 50 tons giving2a pressure on the sample of 3860 psi (272 kg/cm ).
Press Reproducibility
A primary consideration in any sampling technique is the
reproducibility of the method. A series of replicate pressings and
analyses were performed on a well mixed batch of prepared cane to
obtain reproducibility data.
Procedure; The cane used in these studies was obtained from commercial
cane deliveries to Cinclare Central Factory in 1973 using the J & L
corer (described in Chapter vi) fitted with the Rietz PB-10 Prebreaker.
The core samples were placed in plastic bags and transported to the
Audubon Sugar Factory for processing. At the Audubon Sugar Factory
the sample was placed in a Y-blender and tumbled for 10 minutes. The
tumbled sample weighing about 30 lbs. was then sub-sampled into 1000
gram sub-samples which were pressed and analyzed individually.
Altogether, nine of these replication determinations were performed.
In one of these runs six sub-samples were processed, in five of the
runs four sub-samples were processed, in the other three runs three
sub-samples were processed.
In all of these ruins the pressing time was five minutes at a
pressure of 3500 psig (45 tons total force). The feed to the press
consisted of a 1000 gram charge of the prepared cane. The juice and
bagasse weights were determined by weighing.
33
The extracted juice was analyzed for’pol by the Horne's dry lead
method, and for Brix using a refractometer fitted with a constant
temperature bath.
The bagasse was analyzed for pol by the cold digestion method
using a Waring blender. The moisture per cent bagasse was determined
by drying to constant weight using the Dietert Moisture teller. The
Brix per cent bagasse was calculated assuming that the purity of the
residual juice in the bagasse was the same as that of the extracted
juice.
Results: The individual results of each run are shown in Tables 2 - 1 0 ,
together with the average value, the standard deviation, and the per
cent coefficient of variation. The per cent coefficient of variation
(% C.V.) is defined as the standard deviation expressed as a percentage
of the average. Table 1 summarizes the per cent coefficients of
variation of each parameter for all nine runs.
From Table 1 it can be seen that the juice analysis is highly
reproducible. The per cent coefficient of variation of juice Brix
ranged from 0 to 0.65%, with an average of 0.35%. The per cent
coefficient of variation of the juice pol varied from 0 to 1.32%,
with an average value of 0.45%.
The bagasse related analyses (Bagasse % cane, moisture % bagasse,
pol % bagasse, and fiber % bagasse) and fiber % cane value derived from
the bagasse data show a per cent coefficient of variation of about 2%.
The 2% variation can be considered very good in view of the non
homogeneity of cane.
The average per cent coefficient of variation of the pol % cane
34
replicates was 0.91%, and 0.81% for the Brix % cane replicates.
The theoretical recoverable sugar (TRS) had an average per cent
coefficient of variation of 1.44%, with a range from 0.40% to 2.89%.
The per cent coefficient of variation of the pol extraction ranged
from 0.74% to 3.29% with an average value of 1.52%.
Conelusions; The relatively small variation in..the juice, and bagasse
inspections and the calculated cane analysis and predicted sugar yield,
show the press to be highly reproducible.
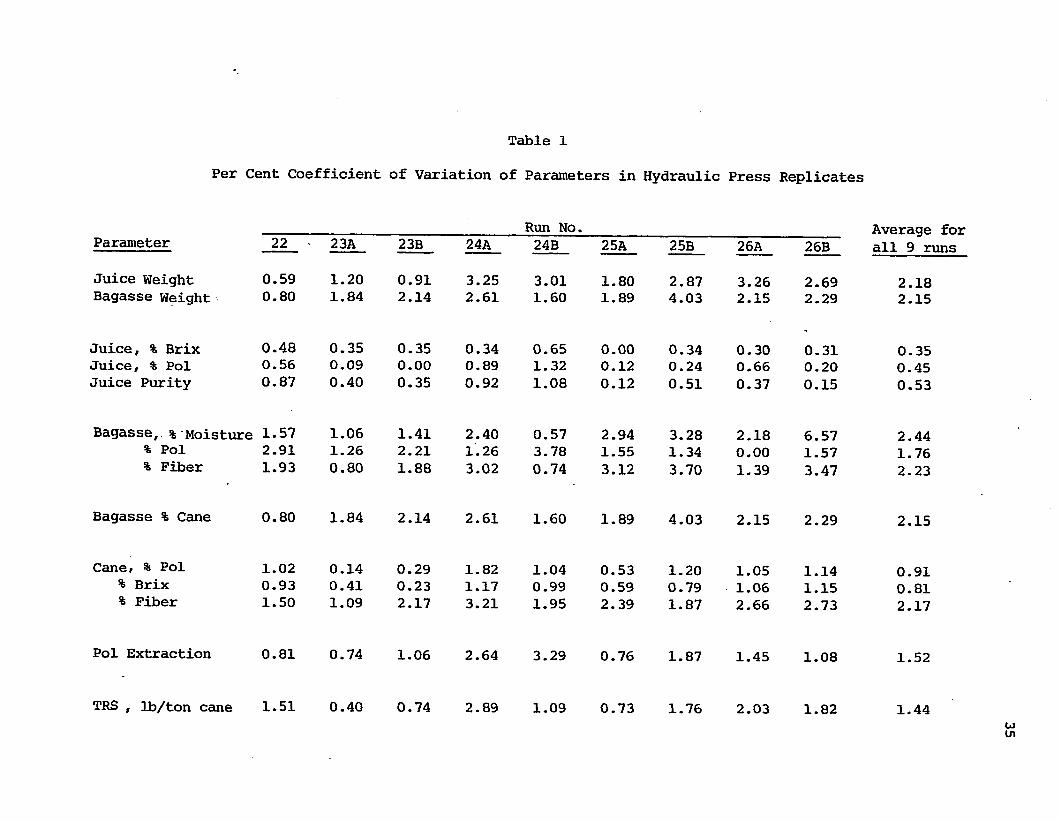
Table 1
Per Cent Coefficient of Variation of Parameters in Hydraulic Press Replicates
______________________________ Run No. ___________________________ Average forParameter 22 2 3 A 23B 24A 24B 25A 25B 26A 26B all 9 runs
Juice Weight 0.59 1.20 0.91 3.25 3.01 1.80 2.87 3.26 2.69 2.18Bagasse Weight 0.80 1.84 2.14 2.61 1.60 1.89 4.03 2.15 2.29 2.15
Juice, % Brix 0.48 0.35 0.35 0.34 0.65 0.00 0.34 0.30 0.31 0.35Juice, % Pol 0.56 0.09 0.00 0.89 1.32 0.12 0.24 0.66 0.20 0.45Juice Purity 0.87 0.40 0.35 0.92 1.08 0.12 0.51 0.37 0.15 0.53
Bagasse, % M o is tu r e 1-57 1.06 1.41 2.40 0.57 2.94 3.28 2.18 6.57 2.44% Pol 2.91 1.26 2.21 1.26 3.78 1.55 1.34 0.00 1.57 1.76% Fiber 1.93 0.80 1.88 3.02 0.74 3.12 3.70 1.39 3.47 2.23
Bagasse % Cane 0.80 1.84 2.14 2.61 1.60 1.89 4.03 2.15 2.29 2.15
Cane, % Pol 1.02 0.14 0.29 1.82 1.04 0.53 1.20 1.05 1.14 0.91% Brix 0.93 0.41 0.23 1.17 0.99 0.59 0.79 1.06 1.15 0.81% Fiber 1.50 1.09 2.17 3.21 1.95 2.39 1.87 2.66 2.73 2.17
Pol Extraction 0.81 0.74 1.06 2.64 3.29 0.76 1.87 1.45 1.08 1.52
TRS , lb/ton cane 1.51 0.40 0.74 2.89 1.09 0.73 1.76 2.03 1.82 1.44
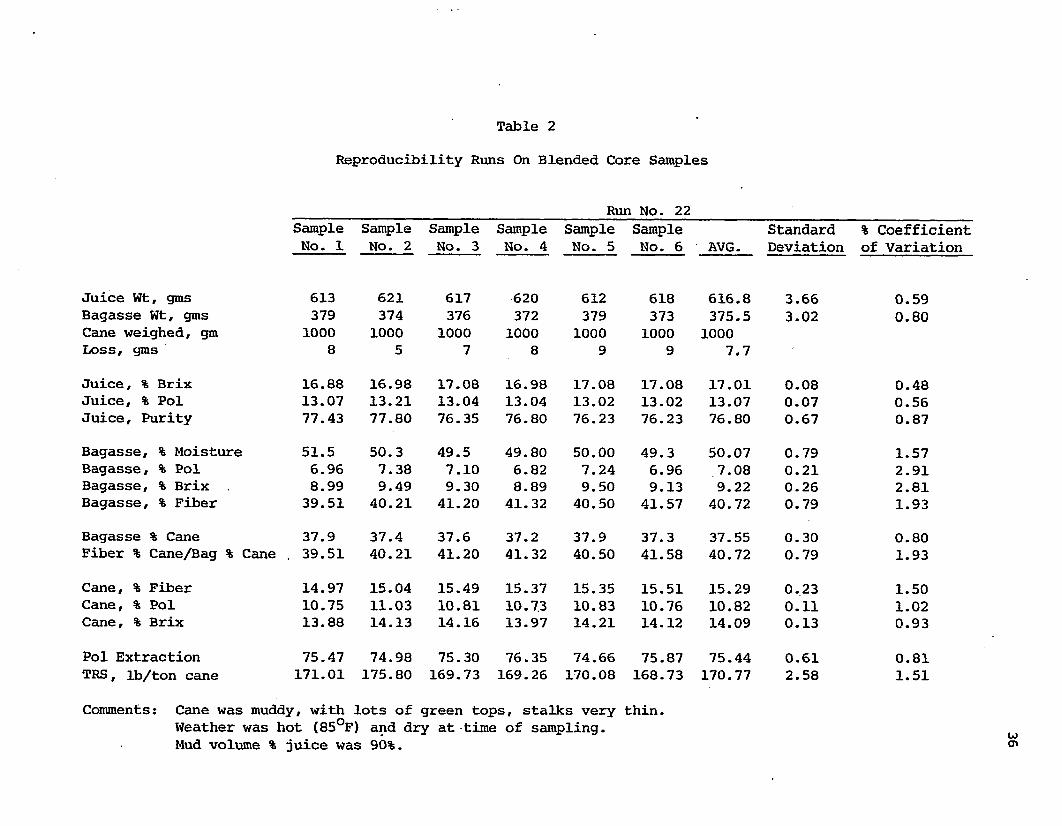
Table 2Reproducibility Runs On Blended Core Samples
Run No. 22Sample No. 1
Sample No. 2
Sample No. 3
Sample No. 4
Sample No. 5
Sample No. 6 AVG.
StandardDeviation
% Coefficient of Variation
Juice Wt, gms 613 621 617 620 612 618 616.8 3.66 0.59Bagasse Wt, gms 379 374 376 372 379 373 375.5 3.02 0.80Cane weighed, gm 1000 1000 1000 1000 1000 1000 1000Loss, gms 8 5 7 8 9 9 7.7
Juice, % Brix 16.88 16.98 17.08 16.98 17.08 17.08 17.01 0.08 0.48Juice, % Pol 13.07 13.21 13.04 13.04 13.02 13.02 13.07 0.07 0.56Juice, Purity 77.43 77.80 76.35 76.80 76.23 76.23 76.80 0.67 0.87
Bagasse, % Moisture 51.5 50.3 49.5 49.80 50.00 49.3 50.07 0.79 1.57Bagasse, % Pol 6.96 7.38 7.10 6.82 7.24 6.96 7.08 0.21 2.91Bagasse, % Brix 8.99 9.49 9.30 8.89 9.50 9.13 9.22 0.26 2.81Bagasse, % Fiber 39.51 40.21 41.20 41.32 40.50 41.57 40.72 0.79 1.93Bagasse % Cane 37.9 37.4 37.6 37.2 37.9 37.3 37.55 0.30 0.80Fiber % Cane/Bag % Cane . 39.51 40.21 41.20 41.32 40.50 41.58 40.72 0.79 1.93
Cane, % Fiber 14.97 15.04 15.49 15.37 15.35 15.51 15.29 0.23 1.50Cane, % Pol 10.75 11.03 10.81 10.7.3 10.83 10.76 10.82 0.11 1.02Cane, % Brix 13.88 14.13 14.16 13.97 14.21 14.12 14.09 0.13 0.93
Pol Extraction 75.47 74.98 75.30 76.35 74.66 75.87 75.44 0.61 0.81TRS, lb/ton cane 171.01 175.80 169.73 169.26 170.08 168.73 170.77 2.58 1.51
Comments: Cane was muddy, with lots of green tops, stalks very thin.Weather was hot (85°F) and dry at time of sampling.Mud volume % juice was 90%.
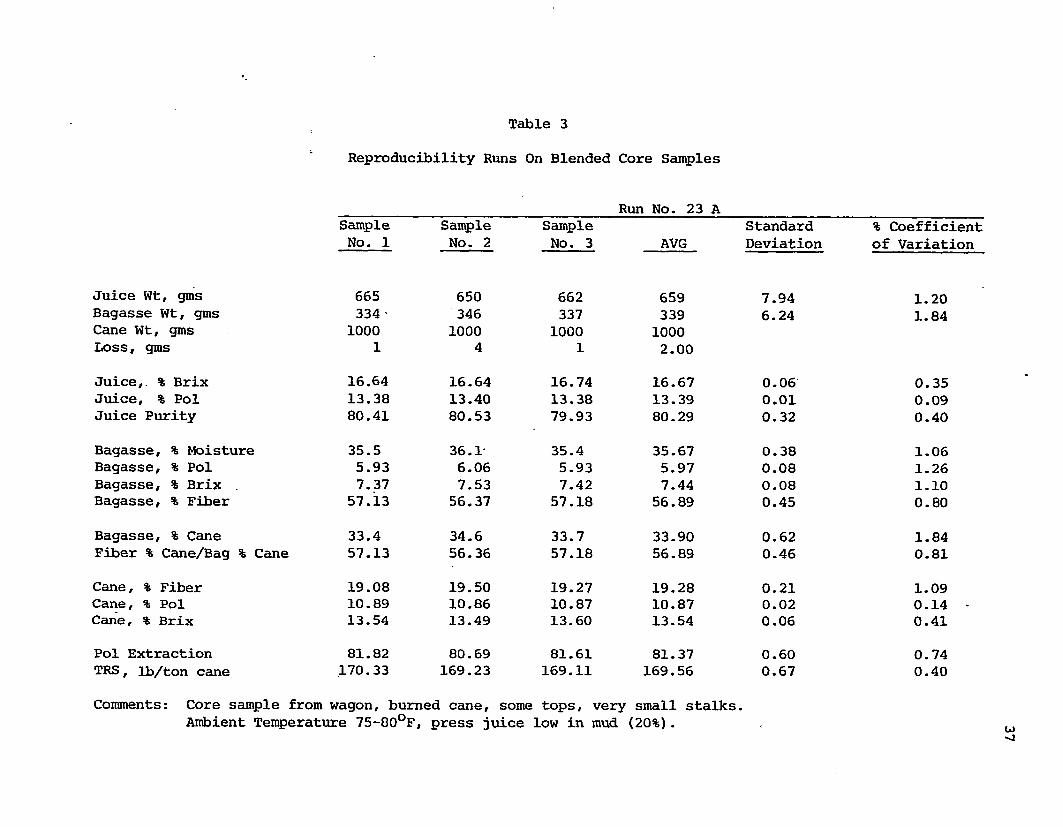
Table 3
Reproducibility Runs On Blended Core Samples
Run No. 23 ASample Sample Sample Standard % CoefficientNo. 1 No. 2 No. 3 AVG Deviation of Variation
Juice Wt, gms 665 650 662 659 7.94 1.20Bagasse Wt, gms 334 ' 346 337 339 6.24 1.84Cane Wt, gms 1000 1000 1000 1000Loss, gms 1 4 1 2.00Juice,. % Brix 16.64 16.64 16.74 16.67 0.06 0.35Juice, % Pol 13.38 13.40 13.38 13.39 0.01 0.09Juice Purity 80.41 80.53 79.93 80.29 0.32 0.40
Bagasse, % Moisture 35.5 36.1 35.4 35.67 0.38 1.06Bagasse, % Pol 5.93 6.06 5.93 5.97 0.08 1.26Bagasse, % Brix . 7.37 7.53 7.42 7.44 0.08 1.10Bagasse, % Fiber 57.13 56.37 57.18 56.89 0.45 0.80
Bagasse, % Cane 33.4 34.6 33.7 33.90 0.62 1.84Fiber % Cane/Bag % Cane 57.13 56.36 57.18 56.89 0.46 0.81
Cane, % Fiber 19.08 19.50 19.27 19.28 0.21 1.09Cane, % Pol 10.89 10.86 10.87 10.87 0.02 0.14Cane, % Brix 13.54 13.49 13.60 13.54 0.06 0.41
Pol Extraction 81.82 80.69 81.61 81.37 0.60 0.74TRS, lb/ton cane .170.33 169.23 169.11 169.56 0.67 0.40
Comments: Core sample from wagon, burned cane, some tops, very small stalks.Ambient Temperature 75-80°Ff press juice low in mud (20%).
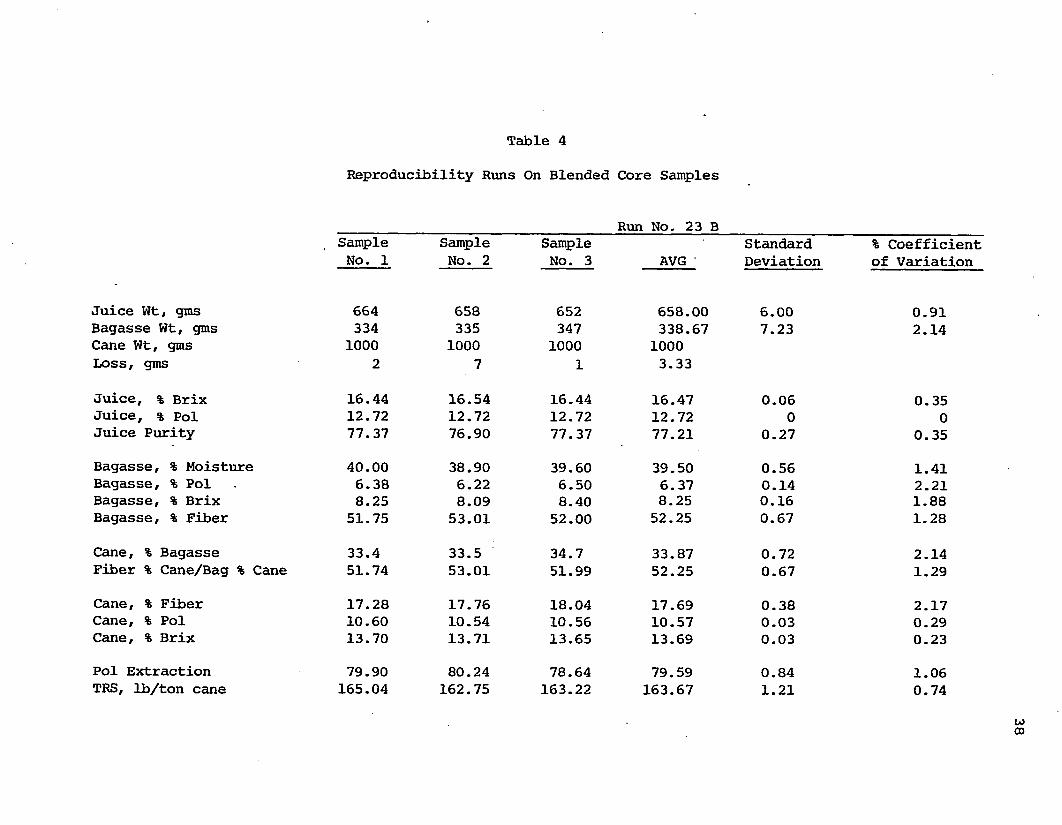
Table 4
Reproducibility Runs On Blended Core Samples
Run No. 23 BSample No. 1
Sample No. 2
Sample No. 3 AVG
StandardDeviation
% Coefficient of Variation
Juice Wt, gms 664 658 652 658.00 6.00 0.91Bagasse Wt, gms 334 335 347 338.67 7.23 2.14Cane Wt, gms 1000 1000 1000 1000Loss, gms 2 7 1 3.33
Juice, % Brix 16.44 16.54 16.44 16.47 0.06 0.35Juice, % Pol 12.72 12.72 12.72 12.72 0 0Juice Purity 77.37 76.90 77.37 77.21 0.27 0.35Bagasse, % Moisture 40.00 38.90 39.60 39.50 0.56 1.41Bagasse, % Pol 6.38 6.22 6.50 6.37 0.14 2.21Bagasse, % Brix 8.25 8.09 8.40 8.25 0.16 1.88Bagasse, % Fiber 51.75 53.01 52.00 52.25 0.67 1.28
Cane, % Bagasse 33.4 33.5 34.7 33.87 0.72 2.14Fiber % Cane/Bag % Cane 51.74 53.01 51.99 52.25 0.67 1.29Cane, % Fiber 17.28 17.76 18.04 17.69 0.38 2.17Cane, % Pol 10.60 10.54 10.56 10.57 0.03 0.29Cane, % Brix 13.70 13.71 13.65 13.69 0.03 0.23Pol Extraction 79.90 80.24 78.64 79.59 0.84 1.06TRS, lb/ton cane 165.04 162.75 163.22 163.67 1.21 0.74
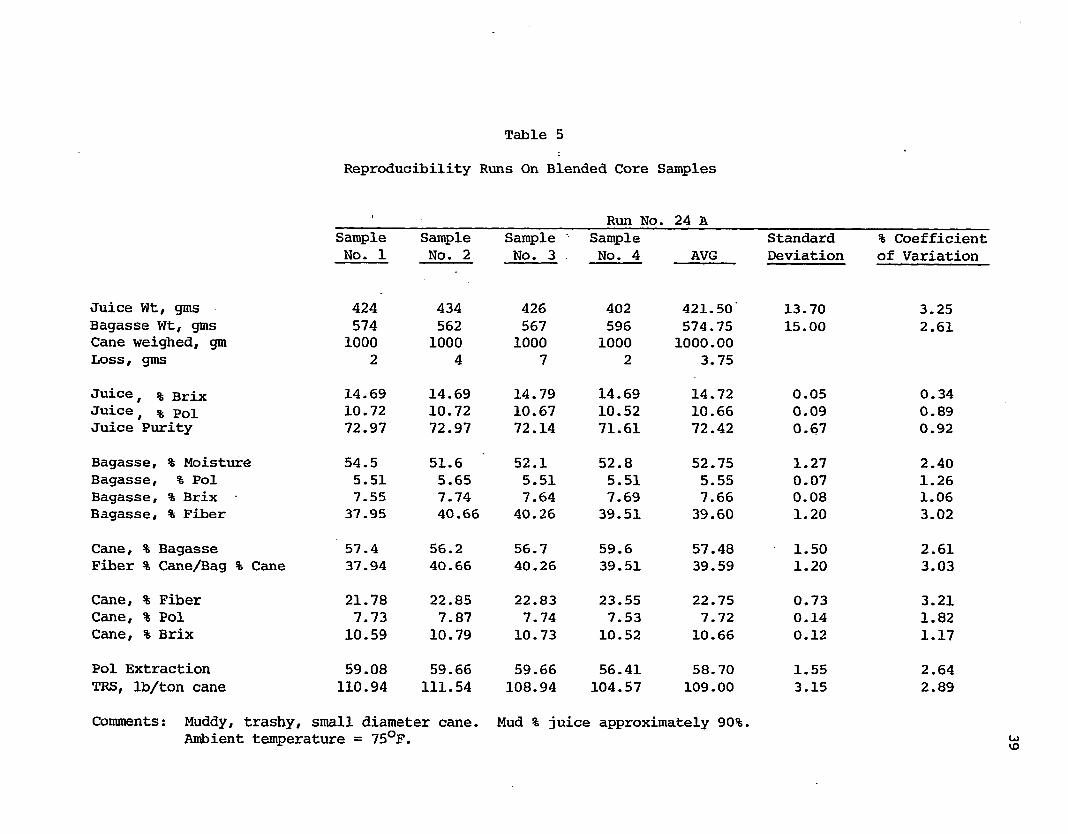
Table 5
Reproducibility Runs On Blended Core Samples
Sample No. 1
Juice Wt, gms Bagasse Wt, gms Cane weighed, gm Loss, gms
4245741000
2
Juice t % Brix Juice # % Pol Juice Purity
14.6910.7272.97
Bagasse, % Moisture Bagasse, % Pol Bagasse, % Brix Bagasse, % Fiber
54.55.517.55
37.95
Cane, % Bagasse Fiber % Cane/Bag % Came
57.437.94
Cane, % Fiber Cane, % Pol Cane, % Brix
21.787.73
10.59
Pol Extraction TRS, lb/ton cane
59.08110.94
Run No. 24 ASample Sample ' Sample Standard % CoefficientNo. 2 No. 3 No. 4 AVG Deviation of Variation
434 426 402 421.50 13.70 3.25562 567 596 574.75 15.00 2.611000 1000 1000 1000.00
4 7 2 3.75
14.69 14.79 14.69 14.72 0.05 0.3410.72 10.67 10.52 10.66 0.09 0.8972.97 72.14 71.61 72.42 0.67 0.92
51.6 52.1 52.8 52.75 1.27 2.405.65 5.51 5.51 5.55 0.07 1.267.74 7.64 7.69 7.66 0.08 1.0640.66 40.26 39.51 39.60 1.20 3.02
56.2 56.7 59.6 57.48 1.50 2.6140.66 40.26 39.51 39.59 1.20 3.03
22.85 22.83 23.55 22.75 0.73 3.217.87 7.74 7.53 7.72 0.14 1.82
10.79 10.73 10.52 10.66 0.12 1.17
59.66 59.66 56.41 58.70 1.55 2.64111.54 108.94 104.57 109.00 3.15 2.89
Comments: Muddy, trashy, small diameter cane. Mud % juice approximately 90%.Ambient temperature = 75°F.
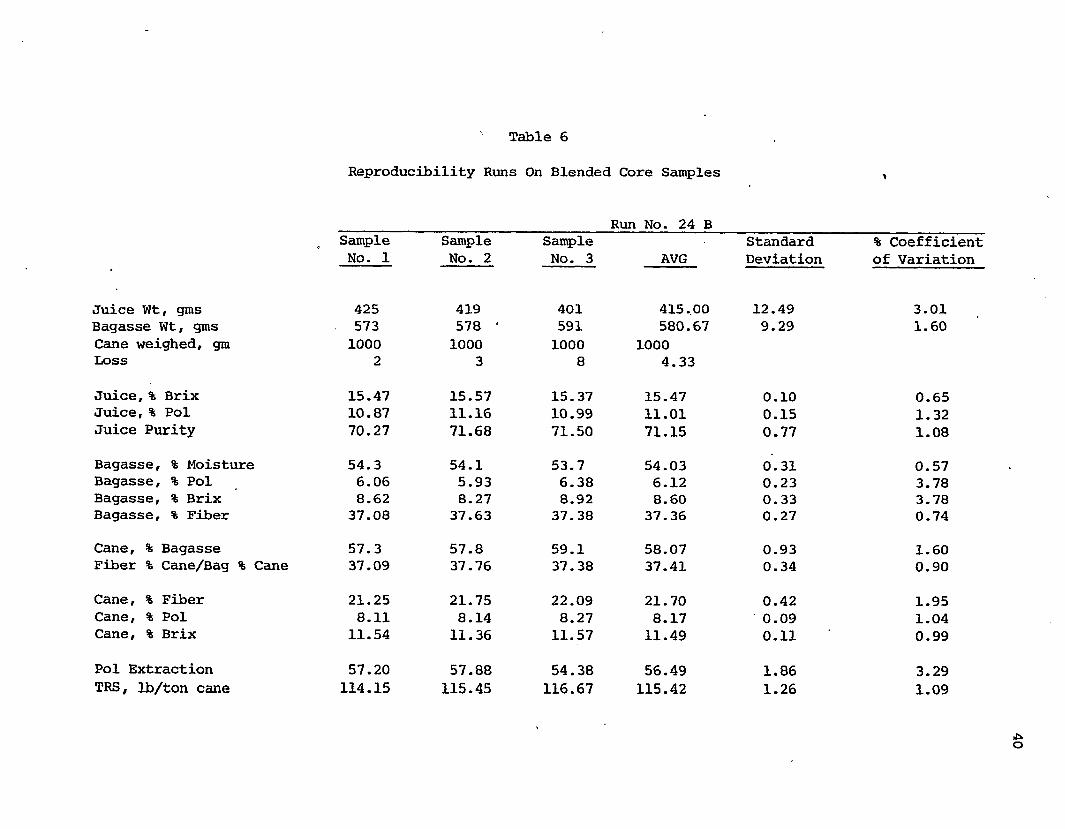
Table 6
Reproducibility Runs On Blended Core Samples
Run No- 24 BSample Sample Sample Standard % CoefficientNo. 1 No. 2 No. 3 AVG Deviation of Variation
Juice Wt, gms 425 419 401 415.00 12.49 3.01Bagasse Wt, gms 573 578 ' 591 580.67 9.29 1.60Cane weighed, gm 1000 1000 1000 1000Loss 2 3 8 4.33
Juice, % Brix 15.47 15.57 15.37 15.47 0.10 0.65Juice, % Pol 10.87 11.16 10.99 11.01 0.15 1.32Juice Purity 70.27 71.68 71.50 71.15 0.77 1.08Bagasse, % Moisture 54.3 54.1 53.7 54.03 0.31 0.57Bagasse, % Pol 6.06 5.93 6.38 6.12 0.23 3.78Bagasse, % Brix 8.62 8.27 8.92 8.60 0.33 3.78Bagasse, % Fiber 37.08 37.63 37.38 37.36 0.27 0.74
Cane, % Bagasse 57.3 57.8 59.1 58.07 0.93 1.60Fiber % Cane/Bag % Cane 37.09 37.76 37.38 37.41 0.34 0.90
Cane, % Fiber 21.25 21.75 22.09 21.70 0.42 1.95Cane, % Pol 8.11 8.14 8.27 8.17 0.09 1.04Cane, % Brix 11.54 11.36 11.57 11.49 0.11 0.99
Pol Extraction 57.20 57.88 54.38 56.49 1.86 3.29TRS, lb/ton cane 114.15 115.45 116.67 115.42 1.26 1.09
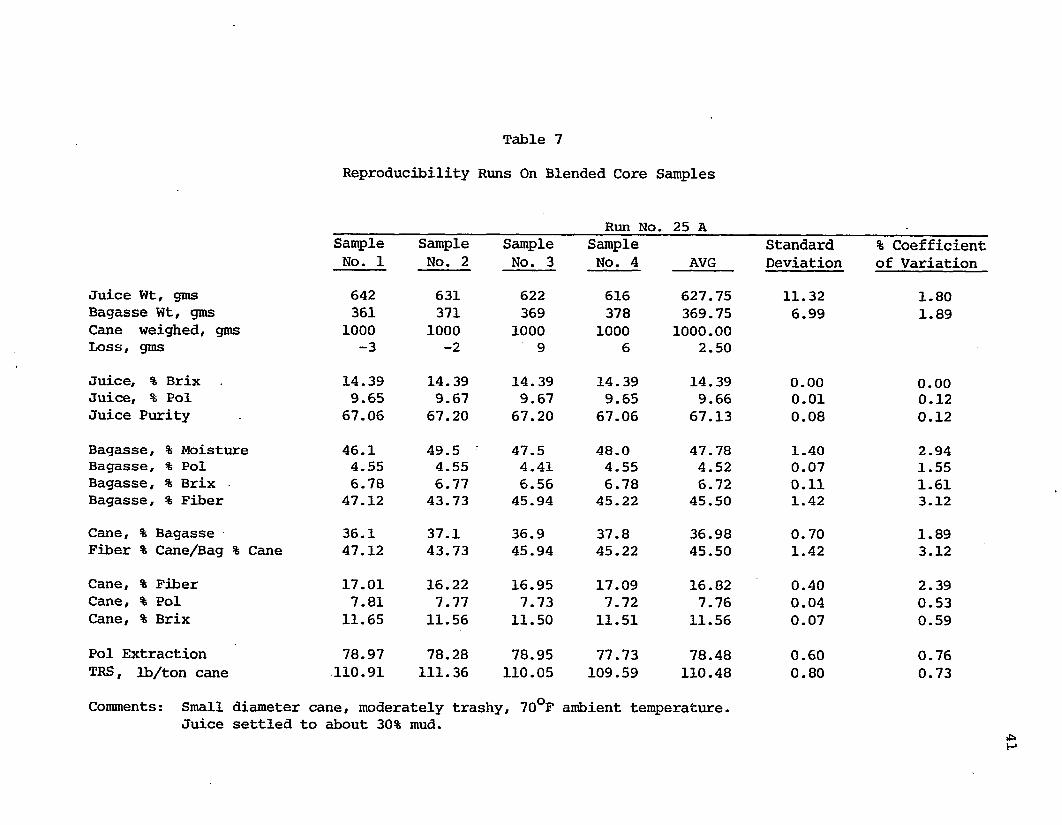
Table 7
Reproducibility Runs On Blended Core Samples
Run No. 25 ASample No. 1
Sample No. 2
Sample No. 3
Sample No. 4 AVG
StandardDeviatioi
Juice Wt, gms 642 631 622 616 627.75 11.32Bagasse Wt, gms 361 371 369 378 369.75 6.99Cane weighed, gms 1000 1000 1000 1000 1000.00Loss, gms -3 -2 9 6 2.50
Juice, % Brix 14.39 14.39 14.39 14.39 14.39 0.00Juice, % Pol 9.65 9.67 9.67 9.65 9.66 0.01Juice Purity 67.06 67.20 67.20 67.06 67.13 0.08
Bagasse, % Moisture 46.1 49.5 ' 47.5 48.0 47.78 1.40Bagasse, % Pol 4.55 4.55 4.41 4.55 4.52 0.07Bagasse, % Brix • 6.78 6.77 6.56 6.78 6.72 0.11Bagasse, % Fiber 47.12 43.73 45.94 45.22 45.50 1.42Cane, % Bagasse 36.1 37.1 36.9 37.8 36.98 0.70Fiber % Cane/Bag % Cane 47.12 43.73 45.94 45.22 45.50 1.42
Cane, % Fiber 17.01 16.22 16.95 17.09 16.82 0.40Cane, % Pol 7.81 7.77 7.73 7.72 7.76 0.04Cane, % Brix 11.65 11.56 11.50 11.51 11.56 0.07
Pol Extraction 78.97 78.28 78.95 77.73 78.48 0.60TRS, lb/ton cane 110.91 111.36 110.05 109.59 110.48 0.80
% Coefficient of Variation
1.801.89
0.000.120.122.941.551.613.12
1.893.12
2.390.530.59
0.760.73
Comments: Small diameter cane, moderately trashy, 70°F ambient temperature.Juice settled to about 30% mud.

Table 8
Reproducibility Runs On Blended Core Samples
Run No. 25 BSample Sample Sample Sample Standard % CoefficientNo. 1 No. 2 No. 3 No. 4 AVG Deviation of Variation
Juice Wt, gms 610 586 592 569 589.25 16.92 2.87Bagasse Wt, gms 393 398 409 430 407.50 16.42 4.03Cane weighed, gms 1000 1000 1000 1000 1000.00Loss, gms -3 16 -1 1 3.25Juice, % Brix 14.87 14.87 14.87 14.97 14.90 0.05 0.34Juice, % Pol 10.02 10.04 9.99 9.99 10.01 0.02 0.24Juice Purity 67.38 67.52 67.18 66.73 67.20 0.34 0.51Bagasse, % Moisture 46.4 48.3 47.7 50.2 48.15 1.58 3.28Bagasse, % Pol 5.24 5.24 5.10 5.24 5.21 0.07 1.34Bagasse, % Brix 7.78 7.76 7.59 7.85 7.75 0.11 1.42Bagasse, % Fiber • 45.82 43.94 44.71 41.95 44.11 1.63 3.70
Cane, % Bagasse 39.3 39.8 40.9 43.0 40.75 1.64 4.03Fiber % Cane/Bag % Cane 45.82 43.94 44.71 41.95 44.11 1.63 3.70Cane, % Fiber 18.01 17.49 18.29 18.04 17.96 0.34 1.87Cane, % Pol 8.14 8.13 7.99 7.95 8.05 0.10 1.20Cane, % Brix 12.08 12.04 11.89 11.91 11.98 0.09 0.79
Pol Extraction 74.71 74.35 73.89 71.65 73.65 1.37 1.87TRS, lb/ton cane 114.94 115.55 112.29 111.44 113.56 2.00 1.76
Comments: Small diameter cane, moderately trashy, 70°F ambient temperature.Juice settled to about 35% mud.
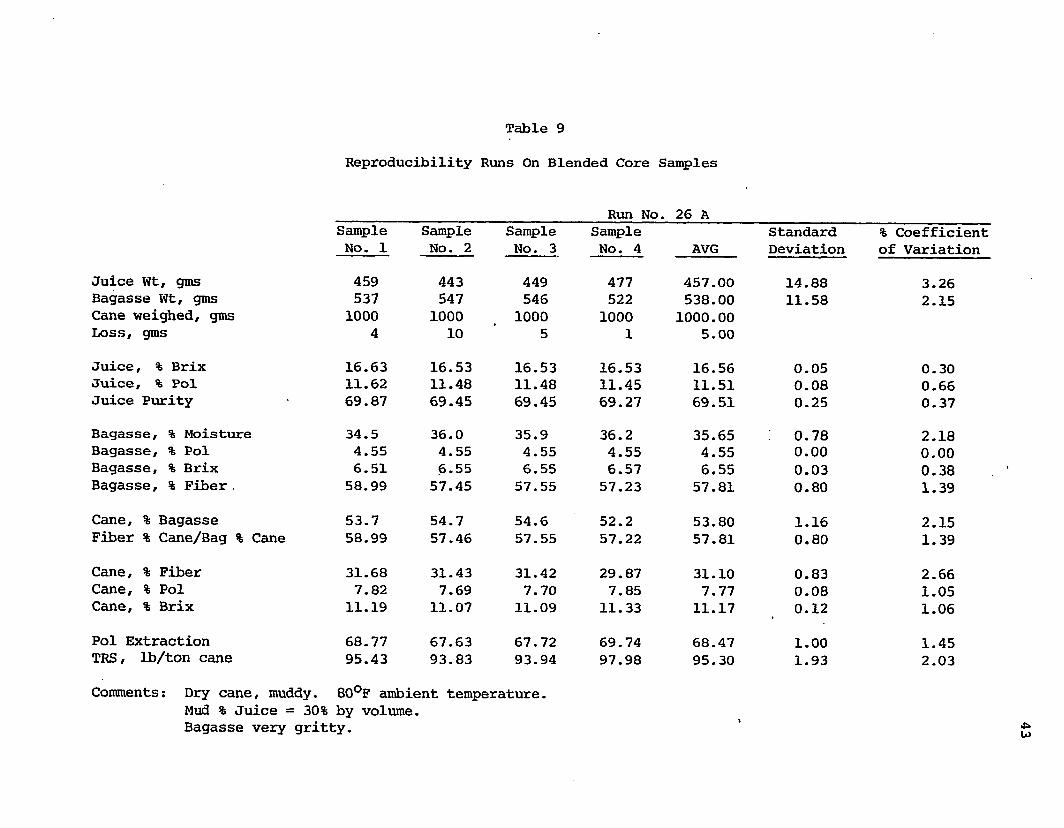
Table 9
Reproducibility Runs On Blended Core Samples
Run No. 26 ASample Sample Sample Sample Standard % CoefficientNo. 1 No. 2 No. 3 No. 4 AVG Deviation of Variation
Juice Wt, gms 459 443 449 477 457.00 14.88 3.26Bagasse Wt, gms 537 547 546 522 538.00 11.58 2.15Cane weighed, gms 1000 1000 1000 1000 1000.00Loss, gms 4 10 5 1 5.00Juice, % Brix 16.63 16.53 16.53 16.53 16.56 0.05 0.30Juice, % Pol 11.62 11.48 11.48 11.45 11.51 0.08 0.66Juice Purity 69.87 69.45 69.45 69.27 69.51 0.25 0.37Bagasse, % Moisture 34.5 36.0 35.9 36.2 35.65 0.78 2.18Bagasse, % Pol 4.55 4.55 4.55 4.55 4.55 0.00 0.00Bagasse, % Brix 6.51 6.55 6.55 6.57 6.55 0.03 0.38Bagasse, % Fiber . 58.99 57.45 57.55 57.23 57.81 0.80 1.39Cane, % Bagasse 53.7 54.7 54.6 52.2 53.80 1.16 2.15Fiber % Cane/Bag % Cane 58.99 57.46 57.55 57.22 57.81 0.80 1.39Cane, % Fiber 31.68 31.43 31.42 29.87 31.10 0.83 2.66Cane, % Pol 7.82 7.69 7.70 7.85 7.77 0.08 1.05Cane, % Brix 11.19 11.07 11.09 11.33 11.17 0.12 1.06Pol Extraction 68.77 67.63 67.72 69.74 68.47 1.00 1.45TRS, lb/ton cane 95.43 93.83 93.94 97.98 95.30 1.93 2.03
Comments: Dry cane, muddy. 80°F ambient temperature.Mud % Juice = 30% by volume.Bagasse very gritty.
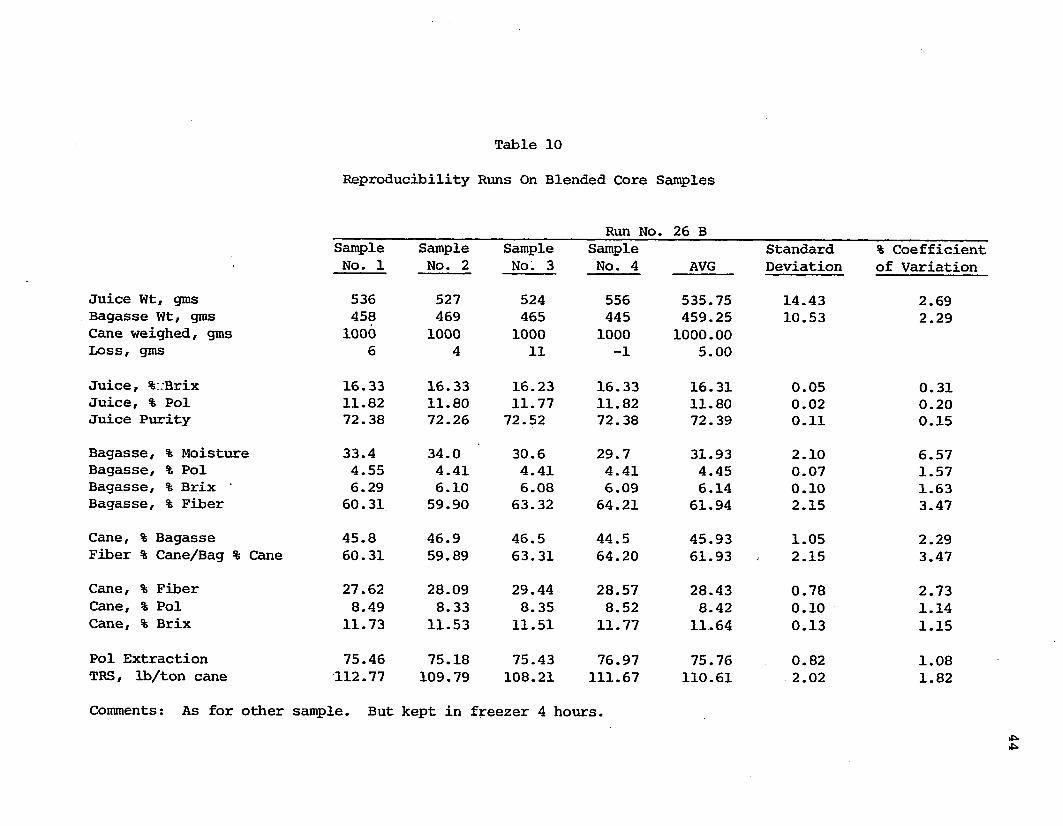
Table 10
Reproducibility Runs On Blended Core Samples
Run No. 26 BSample No. 1
Sample No. 2
Sample No '. 3
Sample No. 4 AVG
StandardDeviation
% Coefficient of Variation
Juice Wt, gms 536 527 524 556 535.75 14.43 2.69Bagasse Wt, gms 458 469 465 445 459.25 10.53 2.29Cane weighed, gms 1000 1000 1000 1000 1000.00Loss, gms 6 4 11 -1 5.00
Juice, %:.:Brix 16.33 16.33 16.23 16.33 16.31 0.05 0.31Juice, % Pol 11.82 11.80 11.77 11.82 11.80 0.02 0.20Juice Purity 72.38 72.26 72.52 72.38 72.39 0.11 0.15Bagasse, % Moisture 33.4 34.0 30.6 29.7 31.93 2.10 6.57Bagasse, % Pol 4.55 4.41 4.41 4.41 4.45 0.07 1.57Bagasse, % Brix 6.29 6.10 6.08 6.09 6.14 0.10 1.63Bagasse, % Fiber 60.31 59.90 63.32 64.21 61.94 2.15 3.47Cane, % Bagasse 45.8 46.9 46.5 44.5 45.93 1.05 2.29Fiber % Cane/Bag % Cane 60.31 59.89 63.31 64.20 61.93 2.15 3.47Cane, % Fiber 27.62 28.09 29.44 28.57 28.43 0.78 2.73Cane, % Pol 8.49 8.33 8.35 8.52 8.42 0.10 1.14Cane, % Brix 11.73 11.53 11.51 11.77 11.64 0.13 1.15
Pol Extraction 75.46 75.18 75.43 76.97 75.76 0.82 1.08TRS, lb/ton cane 112.77 109.79 108.21 111.67 110.61 2.02 1.82
Comments: As for other sample. But kept in freezer 4 hours.
45
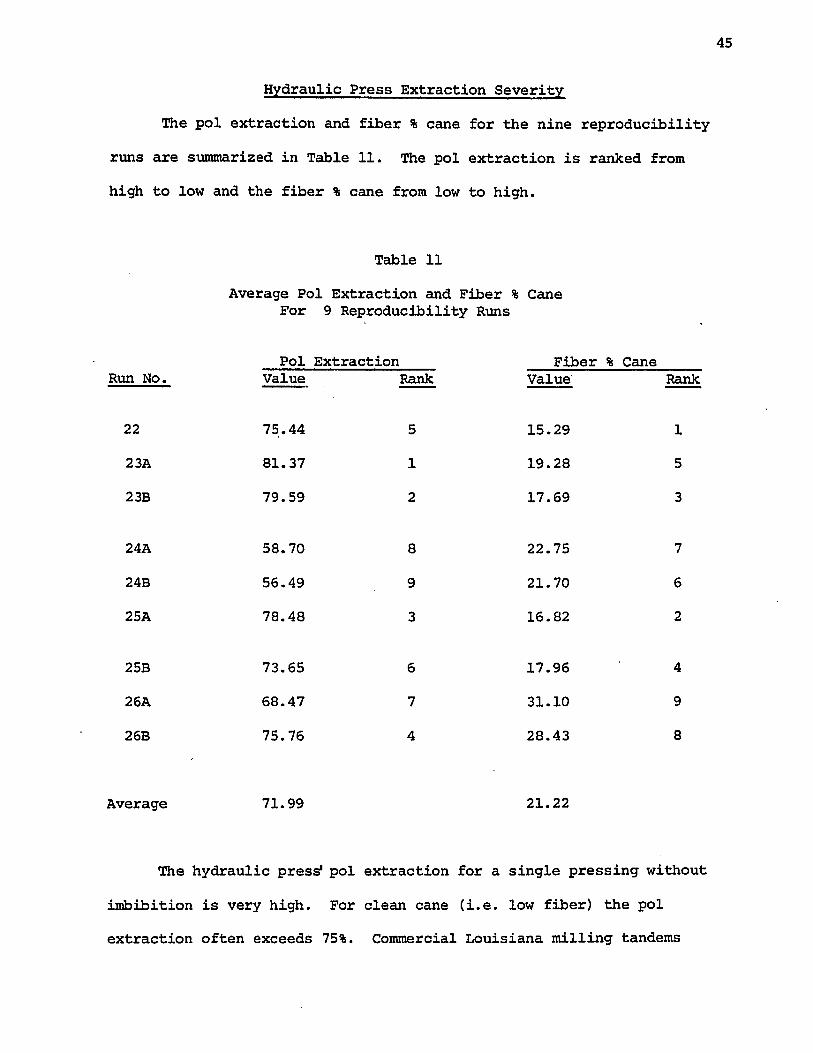
Hydraulic Press Extraction Severity
The pol extraction and fiber % cane for the nine reproducibility
runs are summarized in Table 11. The pol extraction is ranked from
high to low and the fiber % cane from low to high.
Table 11
Average Pol Extraction and Fiber % Cane For 9 Reproducibility Runs
Pol Extraction Fiber % CaneRun No. Value Rank Value Rank
22 75.44 5 15.29 1
23A 81.37 1 19.28 5
23B 79.59 2 17.69 3
24A 58.70 8 22.75 7
24B 56.49 9 21.70 6
25A 78.48 3 16.82 2
25B 73.65 6 17.96 4
26A 68.47 7 31.10 9
26B 75.76 4 28.43 8
Average 71.99 21.22
The hydraulic press^ pol extraction for a single pressing without
imbibition is very high. For clean cane (i.e. low fiber) the pol
extraction often exceeds 75%. Commercial Louisiana milling tandems
46
using 4 to 5 milling units and imbibition water achieve a pol
extraction of about 90. The pol extraction of conventional sample
mills used at Louisiana sugar factories varies widely depending on
size, grooving, hydraulic pressure used, and method of feeding, but
generally fall in the range of 30 - 50 per cent pol extraction.
The high fiber % cane values in some of the runs (particularly
Run 26A and 26B) are the result of large quantities of field soil in
the cane delivery. This effect of field soil on cane composition and
pol extraction is discussed in greater detail in Chapter VII.
The high pol extraction of the hydraulic press makes the
hydraulic press suitable as an extraction unit for cane samples. The
high pol extraction of the hydraulic press which closely approximates
that of commercial mills would be expected to yield juices whose
analyses are closer to those of commercial mills than the juice of
sample mills with substantially lower extractions. This expectation
is borne out by later studies.
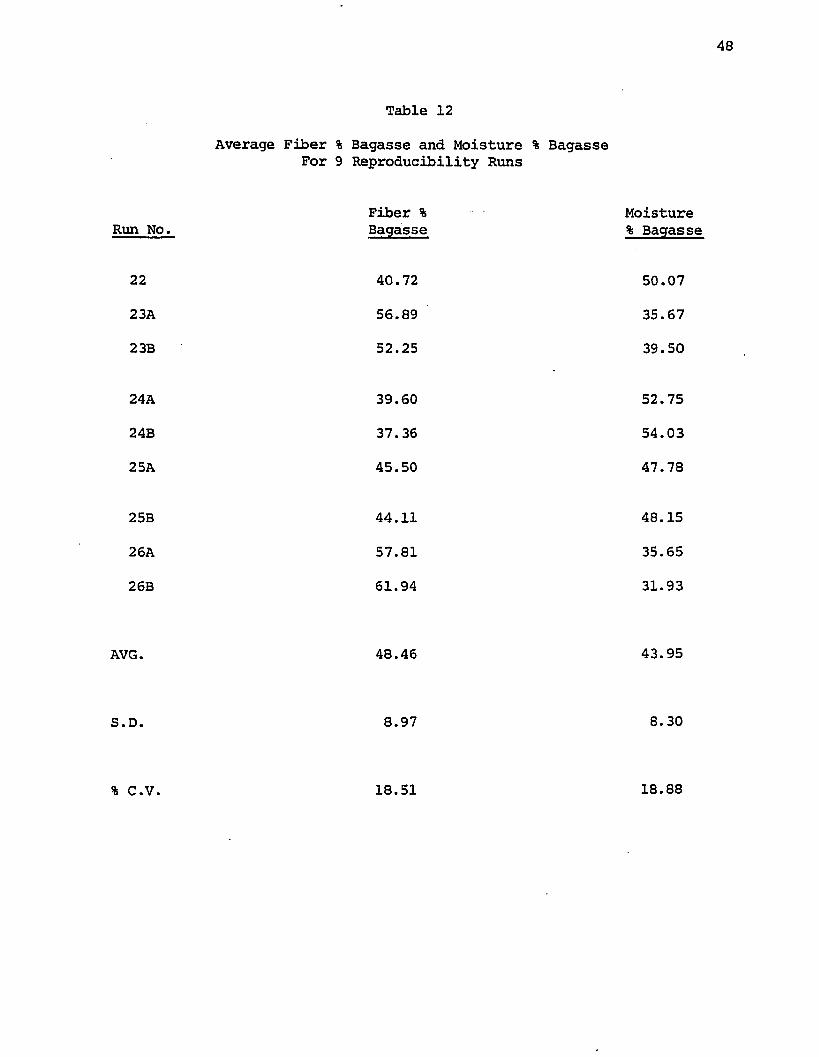
47Constancy of Bagasse Analysis
In these initial reproducibility studies it was observed that
although the moisture and fiber per cent bagasse were highly
reproducible between replicate runs (% C.V. of 2.44 and 2.23 respec
tively) , the variation of moisture and fiber % bagasse between runs
was great. The average values of fiber and moisture per cent bagasse
for the 9 reproducibility runs are summarized in Table 12. The per cent
coefficient of variation of the fiber % bagasse and moisture % bagasse
are 18.51 and 18.88 respectively.
Other investigators^concluded that fiber per cent bagasse could
be considered constant. These preliminary investigations together
with numerous subsequent investigations show that the assumption of
constant fiber % bagasse is not valid under Louisiana conditions,
primarily due to the different responses of different types of trash
as will be shown later (Chapter VII) .
1. Lemaire, Y (1971) Cane Sampling by Coring, Hydraulic Press, and Automatic
Saccharimetry. Proc. I.S.S.C.T., 13:1626-1636.
48
Table 12
Average Fiber % Bagasse and Moisture % Bagasse For 9 Reproducibility Runs
Fiber % MoistureRun No. Bagasse % Bagasse
22 40.72 50.07
23A 56.89 35.67
23B 52.25 39.50
24A 39.60 52.75
24B 37.36 54.03
25A 45.50 47.78
25B 44.11 48.15
26A 57.81 35.65
26B 61.94 31.93
AVG. 48.46 43.95
S.D. 8.97 8.30
% C.V. 18.51 18.88
49
Summary
The hydraulic press is highly reproducible, which is a pre
requisite for a sample extraction unit. The advantage of the hydraulic
press over a small sample mill is that it is a batch operation operated
at constant high pressure and allows adequate time for juice drainage
from the pressed cane.
Sample mills exert varying pressures as a result of the varying
fiber throughput during the milling of batch samples. In sample mills,
as in commercial mills, juice drainage and juice reabsorption are
encountered due to the very short time that the came is under pressure.
The pol extractions obtained by sample mills are considerably less
than that of the hydraulic press owing to the above problems.
In calculating the cane composition it is assumed that the juice
remaining in the bagasse has the same composition as the extracted
juice. This assumption is an approximation, thus the greater the
actual pol extraction the smaller is the quantity of juice remaining
in the bagasse that is subject to this approximation. The higher pol
extractions obtained by the hydraulic press thus result in more
accurate cane quality values. The hydraulic press is thus more suitable
than a sample mill as an extraction unit.
CHAPTER VI
CORE SAMPLING
In the evaluation of any material for composition or payment the
first requirement is that the sample be representative of the entire
consignment. In this chapter the suitability of the J & L Model X-2
core sampler in this respect is investigated.
The Core Sampler
The core sampler used throughout this study was the J & L Model
X-2 stationary unit. This unit is shown in Figure 6 . The coring unit
is mounted on an elevated structural steel platform having a ground
clearance of 14 feet. The coring unit itself is mounted on a guide
rail assembly inclined at an angle of 50 degrees to the platform.
In operation a hydraulic cylinder pushes the coring unit down the
track from its rest position at the top of the track. Once the unit
has been started and the core tube carriage cylinder starts to cause
the descent of the coring tube down the track two hydraulic orbit motors are engaged causing the core tube to rotate. The core tube is
fitted with a circular saw at the lower end. The rotating core tube
drills a hole through the load in the cane wagon or field cart parked
under the corer. At a preselected ground clearance the core tube
carriage cylinder reverses direction and the corer tube is returned to
its starting position. At this point a core sample of cane is packed
inside the coring tube and the cane truck or field cart can continue
on to the factory to be unloaded while the sample is being ejected
50
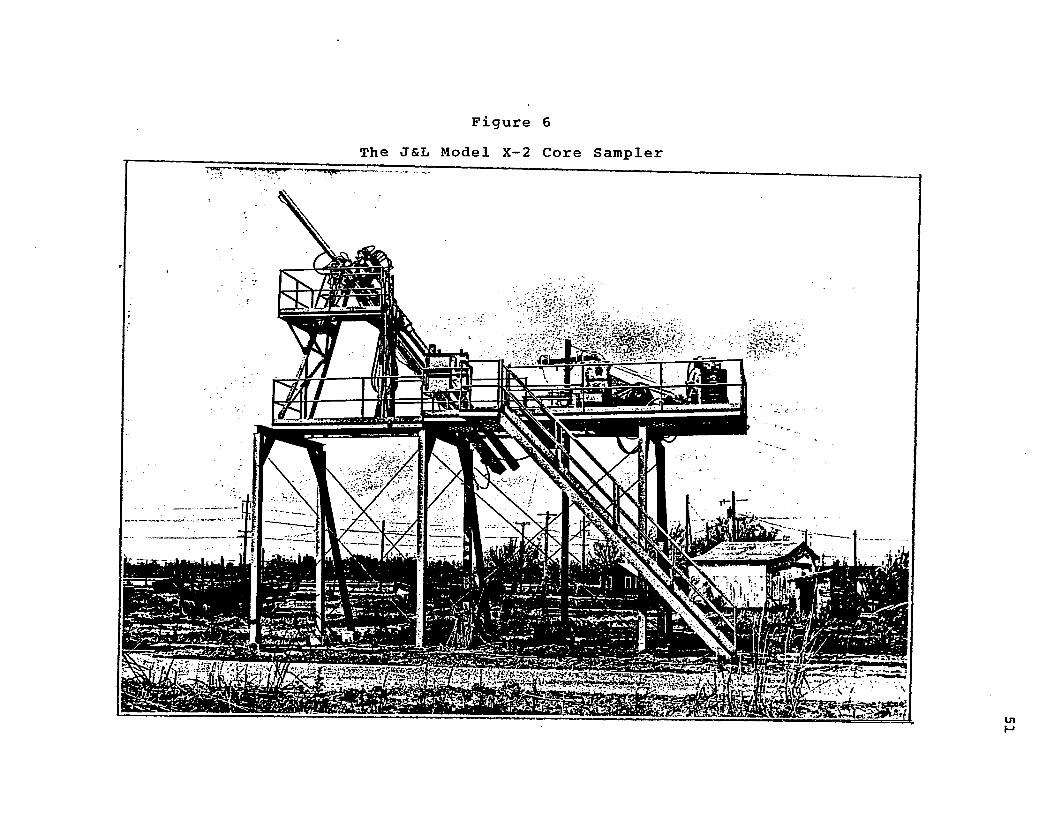
Figure 6 The J&L Model X-2 Core Sampler
52
and shredded.
The ejection of the sample takes place after the corer is
elevated to a more horizontal position by two core tube position
cylinders. At this point the tip of the core tube is positioned
directly in line with the mouth of a Rietz PB-10 pre-breaker. The core
tube ejection cylinder then starts its downward motion inside the core
tube forcing the cored cane sample out into the Rietz pre-breaker for
processing. After the cored cane sample has been ejected, the
ejection cylinder retracts the piston back to its rest position inside
the coring tube. When the ejection cylinder has fully returned the
core tube position cylinders return the core tube to its rest position.
The coring unit is then ready for another cycle.
During the ejection of the sample into the Rietz pre-breaker and
the subsequent retraction and return of the corer unit to its rest
position the ejected sample in the Rietz pre-breaker is being
concurrently processed. The pre-breaker fitted on the J & L Model X-2
corer was the Rietz Model PB-10 pre-breaker. This unit resembles a
meat grinder, consisting of a sample feed hopper into which the
sample is discharged, and a horizontal screw near the bottom of the
unit which moves the sample through the unit past several stationary
sharp edged plates that slice and shred the cane stalks. The unit is
shown in Figure 7. The unit is designed so that no juice is extracted
during this grinding operation. The prepared cane that- leaves the
pre-breaker is discharged onto a screw conveyer and dropped onto a
horizontal rotating sample table disc. The disc is fitted with a slot
through which a sub-sample is discharged into a sample container. The
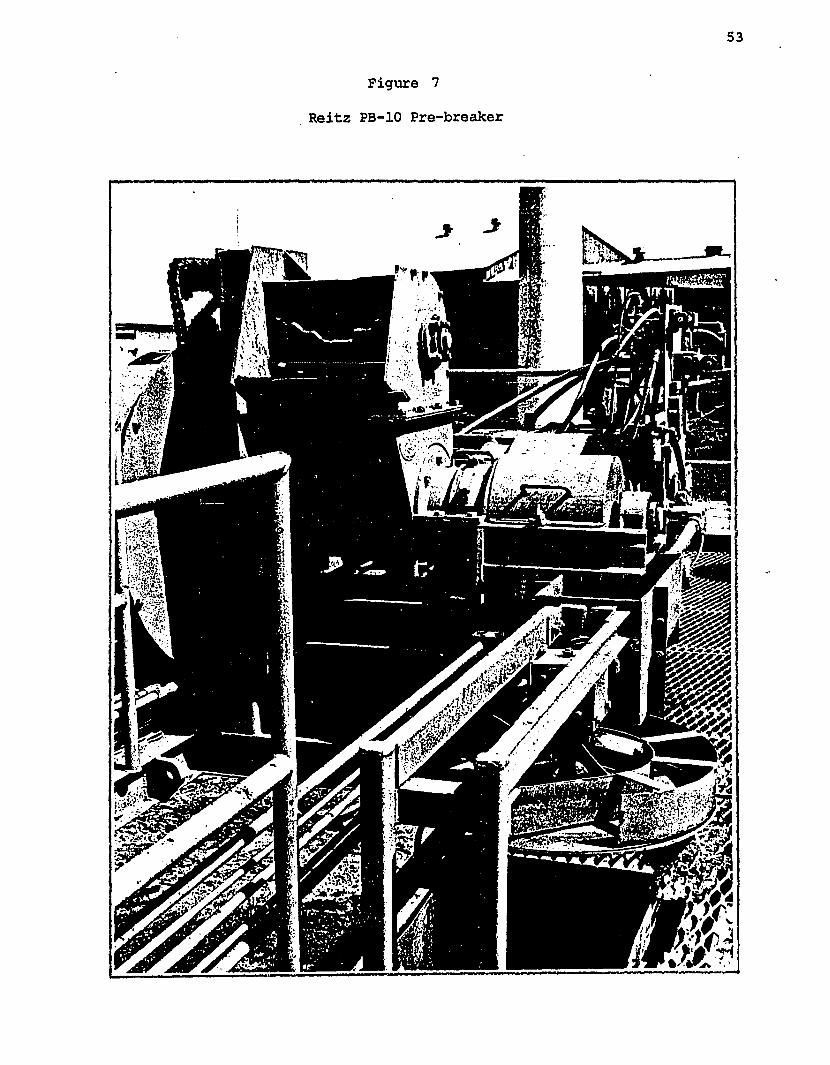
53
Figure 7
Reitz PB-10 Pre-breaker
54
major portion of the total sample is then returned to a container
where it is discharged into the next cane delivery to be sampled.
The total weight of cane sample obtained using an 8 inch diameter core
tube is about 25 to 30 pounds. The sub-sample of prepared cane
obtained by the sampler is about 3 to 5 pounds.
The entire coring operation is performed by oil pressure oper
ating pistons and hydraulic orbit motors. The pressurized oil
required is obtained from a compressor driven by a 50 H.P. electric
motor. The pre-breaker, sub-sampler and related screw conveyers are
operated from a V-belt drive connected to the 50 H.P. motor that
operates the oil compressor.
The entire sequence of events required are performed automati
cally by a sequence controller. The operator need only position the
cane truck or field cart in a suitable position, and then select the
appropriate stroke length for suitable coring. The higher ground
clearance of trucks necessitates selecting a shorter stroke length
than that required for field carts. The total time required for a
complete coring cycle is 70 seconds.
The Farrel Sample Mill
The Farrel sample mill used for processing samples by the conven
tional Louisiana method is a three-roller king-boltless unit equipped
with 12 inch x 12 inch rollers grooved with 3/8 inch pitch at 50°
angle. The Farrel mill is fitted with an Edwards hydraulic system
providing a maximum pressure of 40 tons on the top roll.
The Farrel sample mill was used for processing the core samples
obtained during the 1972 studies.
55
Experimental Procedure
These studies were conducted during the fall of 1972 at the
Audubon Sugar Factory. The Pinette-Emidecau hydraulic press was not
available during these studies, thus the processing of all the core
samples was performed on the hydraulically loaded Farrel sample mill.
The cane used for these studies was obtained from Cinclare
Central Factory. The cane was delivered to Cinclare by field cart
where the core sampler was located. The field cart was then cored in
three locations, the front, the middle, and the back. The three
samples were placed in separate plastic bags and returned to Audubon
Sugar Factory for processing.
The entire field cart delivery of 2 to 3 tons of cane was
transferred to a truck and also taken to Audubon Sugar Factory.
At the Audubon Sugar Factory the entire bundle was then sampled
by the conventional method. A single 100 lb sample was removed for
the trash determination, while three 30 lb sucrose samples were
removed and processed individually on the Farrel sample mill.
The remainder of the cane bundle was then processed on the
Audubon Sugar Factory Squier mill using about 20 % imbibition on cane.
All the conventional inspections were performed on the samples from
the commercial milling operations.
The processing of the core samples was performed on the hydrau
lically loaded Farrel sample mill. The cane and bagasse were passed
through the mill four times, with no imbibition being used. The juice
and bagasse were then analyzed.
From the above runs and analyses the cane analysis and key juice
56
quality factors were available for each of the three methods ( no
cane analysis in the case of the conventional method) used in evalu
ating the cane quality. The data can be used for:
1. Comparing the multiple samples from each load to determine
the variability among samples in a given consignment.
2. Comparing each of the sampling methods (conventional and
core-Parrel) with the Audubon Sugar Factory mill figures.
Variability of Cane Within the Consignment
The predicted sugar yield (lb. of sugar/gross ton cane) for each
of the three samples by the conventional method, and the three samples
by the core-Farrel method are shown in Table 13.
The average per cent coefficient of variation for all (9) the
conventional samples was 4.32%. The average per cent coefficient of
variation for all (8) core-Farrel runs was 7.14%.
The per cent coefficient of variation between the averages of the
samples was close to 1% for both methods.
The lower variability among the samples by the conventional method
is due to the fact that a single trash determination was used with each
of the three juice analyses obtained from the three conventional
sucrose samples. Thus the variability in the trash, which is the major
factor, is not reflected in the conventional samples. All the vari
ability in the conventional samples directly reflects only the vari
ability in the juice analyses. Viator1- has shown that the trash % cane
^D. P. Viator, "Trash Sampling Studies at Louisiana Sugarcane Mills".
Proceedings of 1973 ASSCT.
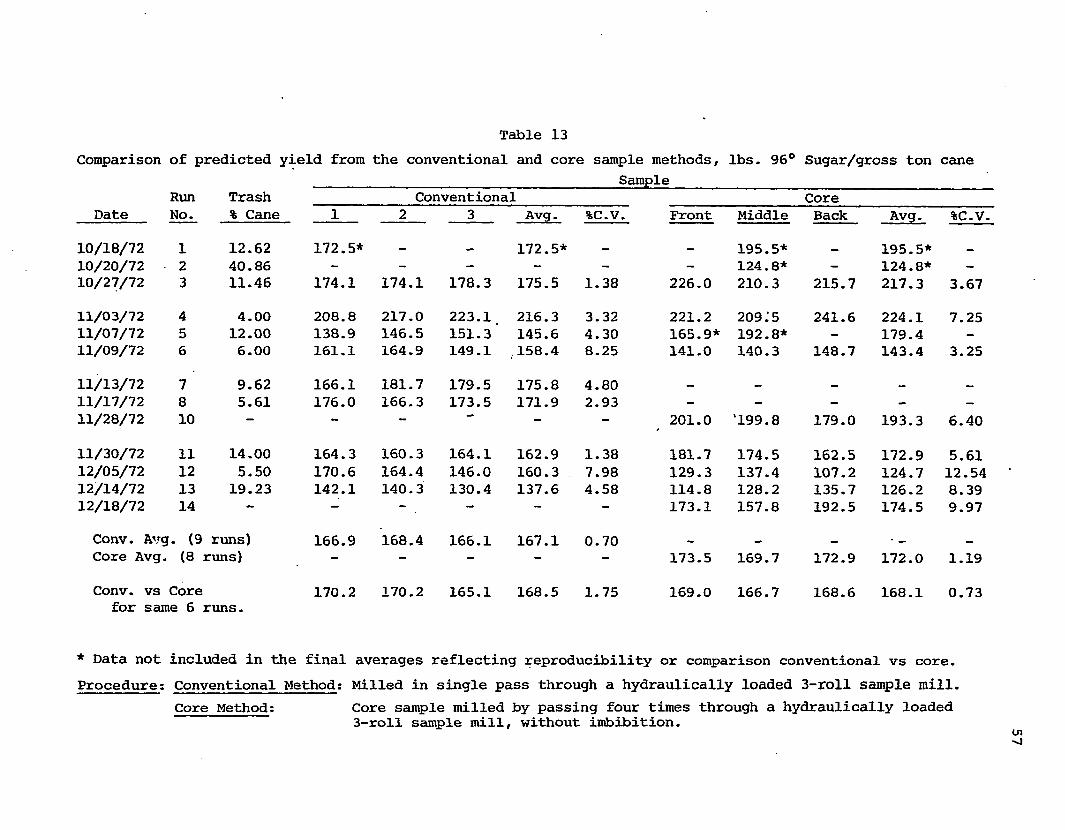
Table 13Comparison of predicted yield from the conventional and core sample methods, lbs- 96° Sugar/gross ton cane
______________________________________ Sample_____________________Run Trash Conventional Core
Date No. % Cane 1 2 3 Avg. %C.V. Front Middle Back Avg. %C.V.
10/18/72 1 12.62 172.5* _ 172.5* 195.5* 195.5*10/20/72 2 40.86 - - - - - - 124.8* - 124.8* -10/27/72 3 11.46 174.1 174.1 178.3 175.5 1.38 226.0 210.3 215.7 217.3 3.6711/03/72 4 4.00 208.8 217.0 223.1 , 216.3 3.32 221.2 209:5 241.6 224.1 7.2511/07/72 5 12.00 138.9 146.5 151.3’ 145.6 4.30 165.9* 192.8* - 179.4 —11/09/72 6 6.00 161.1 164.9 149.1 ,158.4 8.25 141.0 140.3 148.7 143.4 3.25
11/13/72 7 9.62 166.1 181.7 179.5 175.8 4.8011/17/72 8 5.61 176.0 166.3 173.5 171.9 2.93 - - - - -
11/28/72 10 — — — - - 201.0 '199.8 179.0 193.3 6.40
11/30/72 11 14.00 164.3 160.3 164.1 162.9 1.38 181.7 174.5 162.5 172.9 5.6112/05/72 12 5.50 170.6 164.4 146.0 160.3 7.98 129.3 137.4 107.2 124.7 12.5412/14/72 13 19.23 142.1 140.3 130.4 137.6 4.58 114.8 128.2 135.7 126.2 8.3912/18/72 14 — — — — - - 173.1 157.8 192.5 174.5 9.97Conv. Avg . (9 runs) 166.9 168.4 166.1 167.1 0.70 • —Core Avg. (8 :runs) - — — - - 173.5 169.7 172.9 172.0 1.19
Conv. vs Core 170.2 170.2 165.1 168.5 1.75 169.0 166.7 168.6 168.1 0.73for same 6 runs.
* Data not included in the final averages reflecting reproducibility or comparison conventional vs core. Procedure; Conventional Method; Milled in single pass through a hydraulically loaded 3-roll sample mill.
Core Method; Core sample milled by passing four times through a hydraulically loaded3-roll sample mill, without imbibition.
58
determination yields trash % cane values that vary greatly. In a test
where the average trash % cane was 8.0%, the 25 individual analyses
ranged from 2.44% to 20.41% trash with a per cent coefficient of
variation of 48.3%. In a second test where the average trash % cane
was 4.86%, the per cent coefficient of variation of the 35 individual
tests was 53.4%. In these tests the sample size was varied between
22.5 and 153.0 lbs and it was found that the trash % cane increases
with sample size.
By comparison, the core-Farrel figures for the sugar yield
represent the combined variability of both the juice quality and the
trash content, and would thus be expected to vary more. The vari
ability between the core-Farrel juices on the triplicate determination
was comparable to those of the conventional method. The variability
of cane quality parameters between three samples (back, middle, and
front) are shown individually in Table 14, and a summary of the average
standard deviations, and average per cent coefficient of variations is
given in Table 15. In the case of the core-Farrel tests the average
per cent coefficient of variation for the pol % juice and Brix % juice
were 4.06 and 3.20. The corresponding figures for the juice from the
conventional samples were 3.37 and 2.32.
The greater variability in the predicted sugar yield among the
three core-Farrel samples over the three conventional samples is
attributable to the application of a single trash % cane analysis in
calculating the conventional predicted sugar yield. If the complete
(separate trash and juice analysis) conventional determination was
performed, then the per cent coefficient of variation between either
the core-Farrel or conventional samples could be expected to be about
7%. However, in view of the variability within loads it is surprising
how little variation there is between the averages of the three
determinations by each method. This inherent non-homogeneity within
a given cane consignment has implications relevant to the sampling
frequency necessary to achieve a given degree of accuracy. The
standard deviation of the average of several samples is proportional to
the reciprocal of the square root of the number of samples. Thus with
a knowledge of the standard deviation, the number of samples required
to achieve any degree of accuracy can be calculated.
The per cent coefficient of variation for a single analysis can
be used to calculate the expected variability for the average of any
number of samples. The expected % coefficient of variation for daily,
weekly, and crop averages of the key cane quality parameters are given
below:
Expected Per Cent Coefficient of Variation of Cane Quality Parameters as a function of the number of analyses
Single Analysis Average for Week Average for Crop(21 analyses) (210 analyses)
Pol % Cane 4.81 1.05 0.33
Brix % Cane 4.16 0.91 0.29
Fiber % Cane 8.16 1.78 0.56
It is noted that the. expected per cent coefficient of variation
of the average for a single week (21 samples) approximates the accuracy
of the analytical procedure (See Table 1) , while the crop average shows
60
only a third of this variability.
An important consideration in the use of the corer is whether
there is any bias resulting from the point of coring, whether through
the back, the middle, or the front of the load. The corer was
specifically designed so that the 50° inclination of the coring tube
would cause both a downward and forward motion, so that during its
traverse it would include samples along the length of the cane stalks
assuming the ordered type of loading used in Louisiana at present with
the whole stalk harvesters (See Figure 8). Table 14 shows all the key
analyses on the three sampling points used for coring. From Table 14
it would appear that no bias is present. Furthermore, a rigorous
statistical analysis using the "t" test on the paired data points
showed that there is no justification for assuming that the means are
statistically different (i.e. the back, middle, and front samples are
drawn from the same population).
From Table 15 it is clear that the variability of all the cane
quality factors with the exception of fiber % cane and pol % bagasse
is of about the same order of magnitude, the coefficients of variation
falling within the range of 3.20 to 4.81%. The data scatter for Run 12
was generally greater than the others. Eliminating this run would
give a smaller magnitude for the coefficients.
Because the cane loaded into the cane transport vehicles is
ordered, it was thought that there might be a bias resulting from the
selection of the sampling location. However, Table 16 shows that the
variability between the average values of the three coring points (back,
middle, and front) is quite small, being roughly of the order of the
analytical error for the particular parameter. This bears out the
results of the rigorous "t" test that the location of the core sample
in the bundle is not significant. The absence of bias can be attributed
to the fact that the forward motion of the corer in the bundle
approximates the average cane stalk length, together with the fact that
the cane was packed top to bottom, rather than top to top or bottom to
bottom.
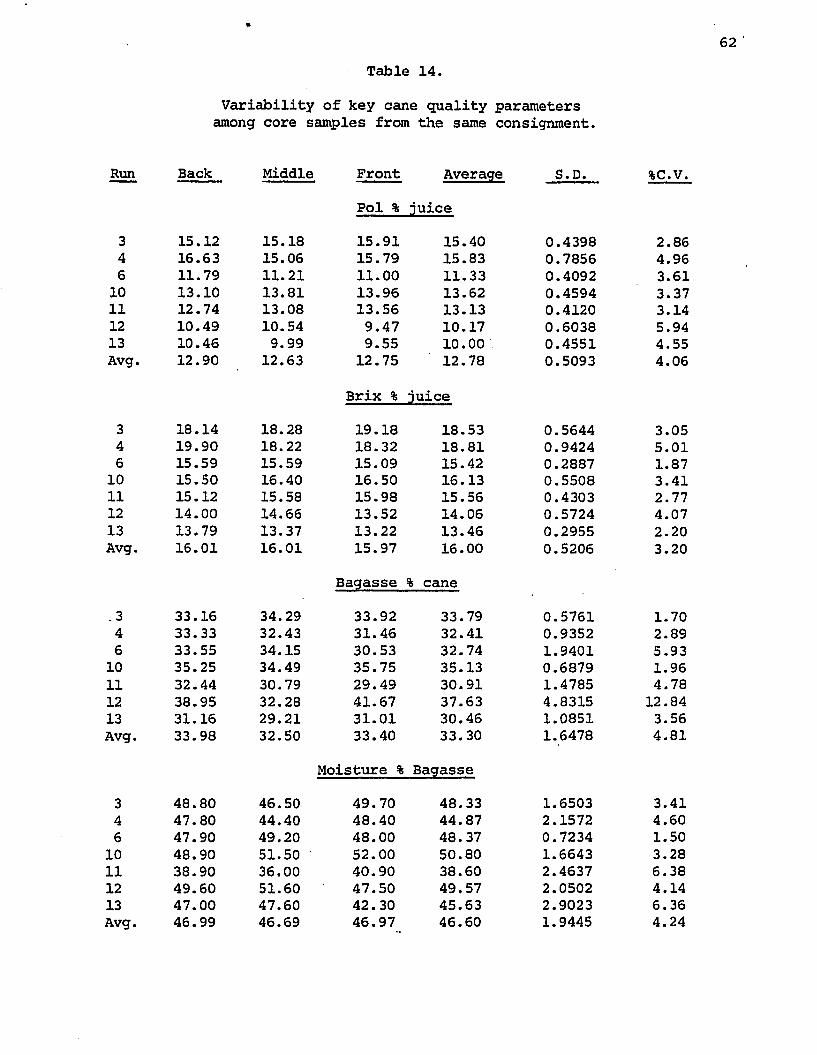
Table 14.62
Variability of key cane quality parameters among core samples from the same consignment.
Run Back Middle Front Average S.D. %C.V.
Pol % juice
3 15.12 15.18 15.91 15.40 0.4398 2.864 16.63 15.06 15.79 15.83 0.7856 4.966 11.79 11.21 11.00 11.33 0.4092 3.6110 13.10 13.81 13.96 13.62 0.4594 3.3711 12.74 13.08 13.56 13.13 0.4120 3.1412 10.49 10.54 9.47 10.17 0.6038 5.9413 10.46 9.99 9.55 10.00 0.4551 4.55Avg. 12.90 12.63 12.75 12.78 0.5093 4.06
Brix % juice
3 18.14 18.28 19.18 18.53 0.5644 3.054 19.90 18.22 18.32 18.81 0.9424 5.016 15.59 15.59 15.09 15.42 0.2887 1.87
10 15.50 16.40 16.50 16.13 0.5508 3.4111 15.12 15.58 15.98 15.56 0.4303 2.7712 14.00 14.66 13.52 14.06 0.5724 4.0713 13.79 13.37 13.22 13.46 0.2955 2.20Avg. 16.01 16.01 15.97 16.00 0.5206 3.20
Bagasse % cane
.3 33.16 34.29 33.92 33.79 0.5761 1.704 33.33 32.43 31.46 32.41 0.9352 2.896 33.55 34.15 30.53 32.74 1.9401 5.93
10 35.25 34.49 35.75 35.13 0.6879 1.9611 32.44 30.79 29.49 30.91 1.4785 4.7812 38.95 32.28 41.67 37.63 4.8315 12.8413 31.16 29.21 31.01 30.46 1.0851 3.56Avg. 33.98 32.50 33.40 33.30 1.6478 4.81
Moisture % Bagasse
3 48.80 46.50 49.70 48.33 1.6503 3.414 47.80 44.40 48.40 44.87 2.1572 4.606 47.90 49.20 48.00 48.37 0.7234 1.50
10 48.90 51.50 52.00 50.80 1.6643 3.2811 38.90 36.00 40.90 38.60 2.4637 6.3812 49.60 51.60 47.50 49.57 2.0502 4.1413 47.00 47.60 42.30 45.63 2.9023 6.36Avg. 46.99 46.69 46.97 46.60 1.9445 4.24
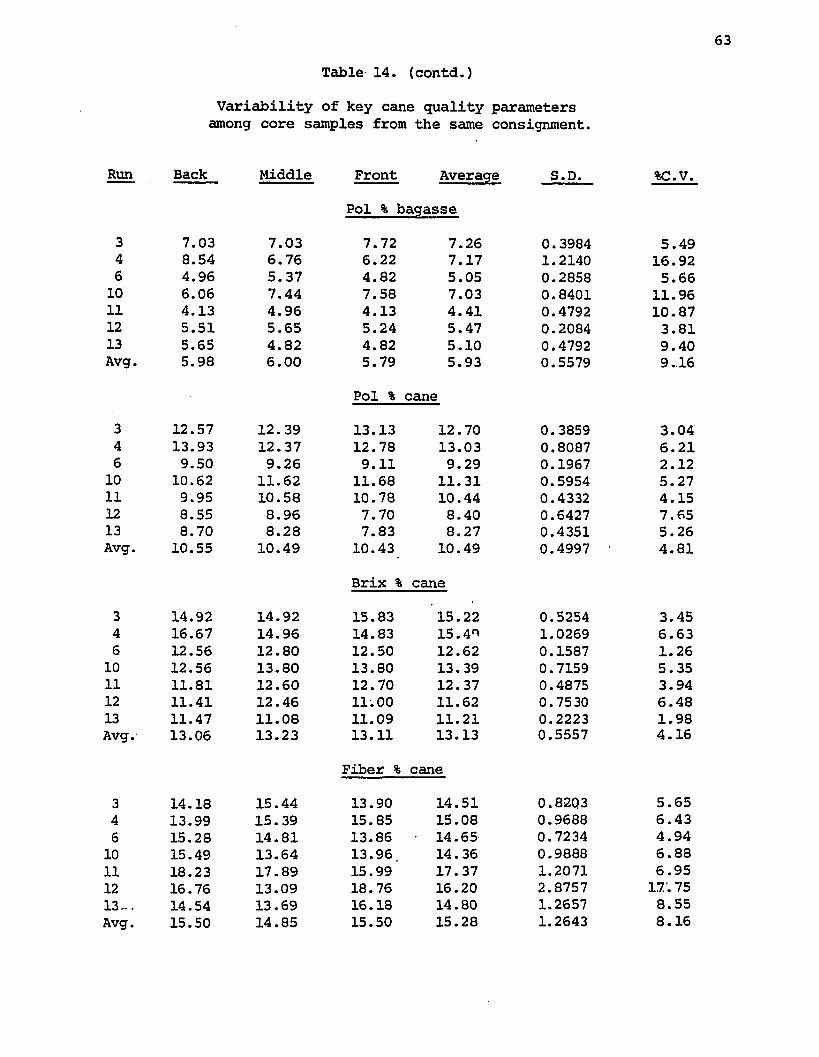
34610111213Av<
34610111213Avc
34610111213Avc
34610111213-
Table 14. (contd.)
Variability of key cane quality parameters among core samples from the same consignment.
Back Middle Front Average S.D.
Pol % bagasse
7.03 7.03 7.72 7.26 0.39848.54 6.76 6.22 7.17 1.21404.96 5.37 4.82 5.05 0.28586.06 7.44 7.58 7.03 0.84014.13 4.96 4.13 4.41 0.47925.51 5.65 5.24 5.47 0.20845.65 4.82 4.82 5.10 0.47925.98 6.00 5.79 5.93 0.5579
Pol % cane
12.57 12.39 13.13 12.70 0.385913.93 12.37 12.78 13.03 0.80879.50 9.26 9.11 9.29 0.1967
10.62 11.62 11.68 11.31 0.59549.95 10.58 10.78 10.44 0.43328.55 8.96 7.70 8.40 0.64278.70 8.28 7.83 8.27 0.4351
10.55 10.49 10.43 10.49 0.4997
Brix % cane
14.92 14.92 15.83 15.22 0.525416.67 14.96 14.83 15.4^ 1.026912.56 12.80 12.50 12.62 0.158712.56 13.80 13.80 13.39 0.715911.81 12.60 12.70 12.37 0.487511.41 12.46 11.00 11.62 0.753011.47 11.08 11.09 11.21 0.222313.06 13.23 13.11 13.13 0.5557
Fiber % cane
14.18 15.44 13.90 14.51 0.82Q313.99 15.39 15.85 15.08 0.968815.28 14.81 13.86 • 14.65 0.723415.49 13.64 13.96. 14.36 0.988818.23 17.89 15.99 17.37 1.207116.76 13.09 18.76 16.20 2.875714.54 13.69 16.18 14.80 1.265715.50 14.85 15.50 15.28 1.2643
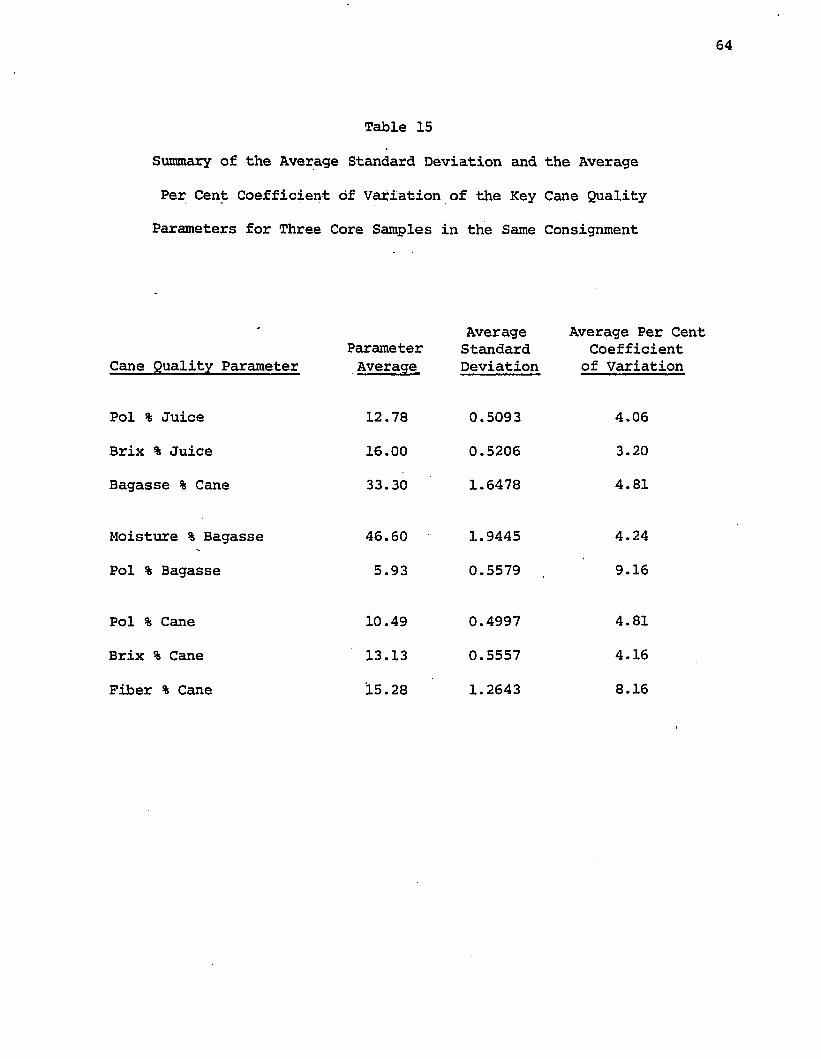
64
Table 15
Summary of the Average Standard Deviation and the Average
Per Gent Coefficient of Variation of the Key Cane Quality
Parameters for Three Core Samples in the Same Consignment
Cane Quality ParameterParameterAverage
AverageStandardDeviation
Average Per Cent Coefficient
of Variation
Pol % Juice
Brix % Juice
Bagasse % Cane
12.78
16.00
33.30
0.5093
0.5206
1.6478
4.06
3.20
4.81
Moisture % Bagasse
Pol % Bagasse
46.60
5.93
1.9445
0.5579
4.24
9.16
Pol % Cane
Brix % Cane
Fiber % Cane
10.49
13.13
15.28
0.4997
0.5557
1.2643
4.81
4.16
8.16
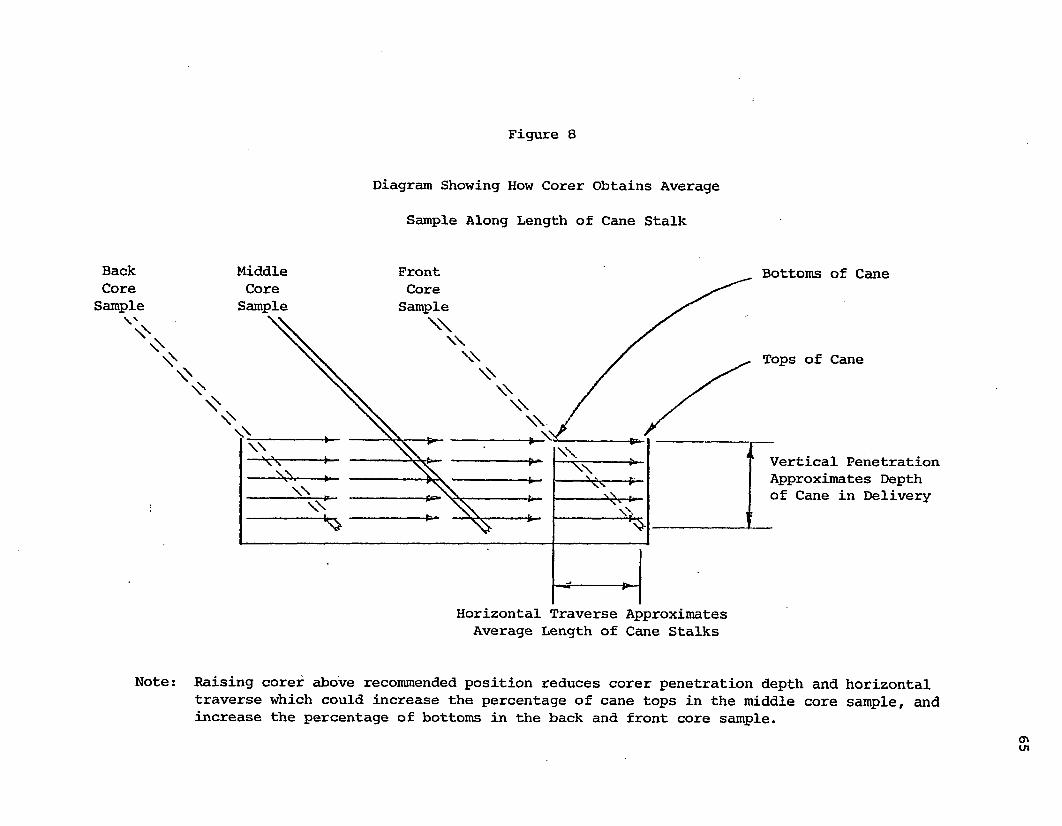
Figure 8
Diagram Showing How Corer Obtains Average
Sample Along Length of Cane Stalk
BackCoreSample
\ s
MiddleCoreSample
FrontCore
SampleW
Bottoms of Cane
\\\\ Tops of Cane
\\W
Vertical Penetration Approximates Depth of Cane in DeliveryW
W
Horizontal Traverse ApproximatesAverage Length of Cane Stalks
Note: Raising corer above recommended position reduces corer penetration depth and horizontaltraverse which could increase the percentage of cane tops in the middle core sample, and increase the percentage of bottoms in the back and front core sample.
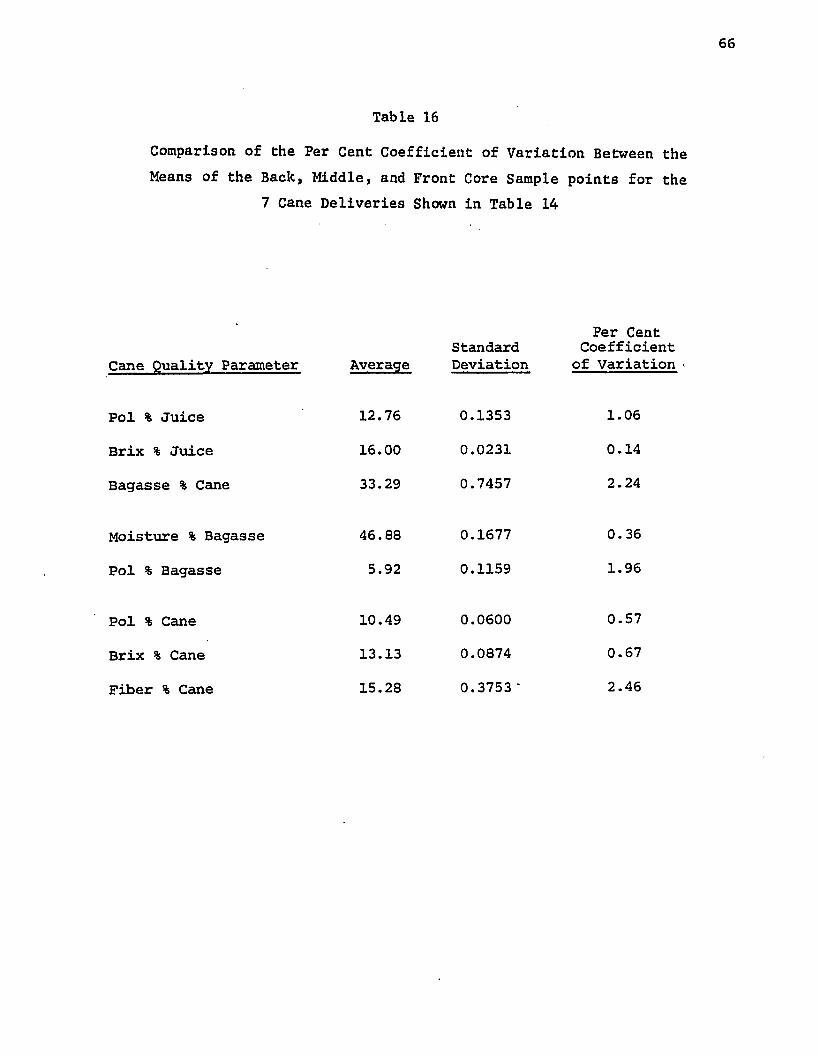
Table 16
Comparison of the Per Cent Coefficient of Variation Between the Means of the Back, Middle, and Front Core Sample points for the
7 Cane Deliveries Shown in Table 14
StandardCane Quality Parameter Average Deviation
Pol % Juice 12.76 0.1353
Brix % Juice 16.00 0.0231
Bagasse % Cane 33.29 0.7457
Moisture % Bagasse 46.88 0.1677
Pol % Bagasse 5.92 0.1159
Pol % Cane 10.49 0.0600
Brix % Cane 13.13 0.0874
Fiber % Cane 15.28 0.3753'
Per Cent Coefficient
of Variation
1.06
0.14
2.24
0.36
1.96
0.57
0.67
2.46
67
Comparison of the Conventional and Core-Farrel Sampling Methodswith Commercial Milling
Correlation of Sample with Factory Data: The factory mill analyses
are shown in Table 17. For each run, the average of the analyses of
the replicate core samples was compared with the corresponding cane
quality parameter from the mill. The following correlations compare
factory and core-Farrel sample juice quality. The sample mill juice
by the conventional method is also compared with the factory juice.
In the case of the factory figures, the crusher juice rather than the
mixed juice was used since the latter represents dilution due to
maceration. The correlation is in terms of a Brix factor relating
the factory to the sample data as factory/sample. Table 18 shows the
correlation between factory crusher juice Brix and that of the two
sampling methods. For comparison, the Brix from the average of the
three samples from each of the cane consignments is used. The
statistical correlation of the data is in terms of the standard
deviation and the per cent coefficient of variation.
The Brix factor (crusher juice Brix/sample mill juice Brix) is in
effect the dilution compensation factor (DCF). For factories which
wash their cane - resulting in a dilution of the crusher juice - the
DCF is a means of calculating an undiluted crusher juice Brix from the
corresponding 24-hour average sample mill Brix.
Numerous questions have been raised as to the reproducibility of
this factor. From the above data, the core sample factor shows only
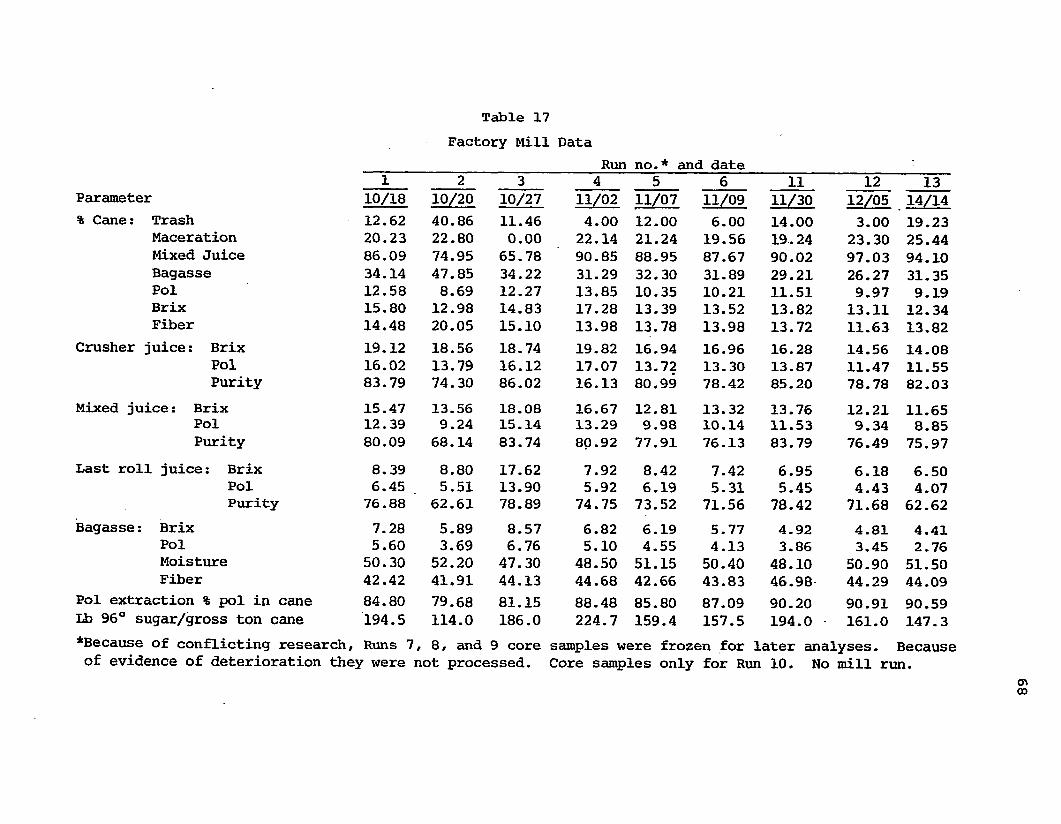
Table 17Factory Mill Data
Run no.* and date1 2 3 4 5 6 11 12 13
Parameter 10/18 10/20 10/27 11/02 11/07 11/09 11/30 12/05 14/14% Cane: Trash 12.62 40.86 11.46 4.00 12.00 6.00 14.00 3.00 19.23
Maceration 20.23 22.80 0.00 22.14 21.24 19.56 19.. 24 23.30 25.44Mixed Juice 86.09 74.95 65.78 90.85 88.95 87.67 90.02 97.03 94.10Bagasse 34.14 47.85 34.22 31.29 32.30 31.89 29.21 26.27 31.35Pol 12.58 8.69 12.27 13.85 10.35 10.21 11.51 9.97 9.19Brix 15.80 12.98 14.83 17.28 13.39 13.52 13.82 13.11 12.34Fiber 14.48 20.05 15.10 13.98 13.78 13.98 13.72 11.63 13.82
Crusher juice: Brix 19.12 18.56 18.74 19.82 16.94 16.96 16.28 14.56 14.08Pol 16.02 13.79 16.12 17.07 13.72 13.30 13.87 11.47 11.55Purity 83.79 74.30 86.02 16.13 80.99 78.42 85.20 78.78 82.03
Mixed juice: Brix 15.47 13.56 18.08 16.67 12.81 13.32 13.76 12.21 11.65Pol 12.39 9.24 15.14 13.29 9.98 10.14 11.53 9.34 8.85Purity 80.09 68.14 83.74 80.92 77.91 76.13 83.79 76.49 75.97
Last roll juice: Brix 8.39 8.80 17.62 7.92 8.42 7.42 6.95 6.18 6.50Pol 6.45 5.51 13.90 5.92 6.19 5.31 5.45 4.43 4.07Purity 76.88 62.61 78.89 74.75 73.52 71.56 78.42 71.68 62.62
Bagasse: Brix 7.28 5.89 8.57 6.82 6.19 5.77 4.92 4.81 4.41Pol 5.60 3.69 6.76 5.10 4.55 4.13 3.86 3.45 2.76Moisture 50.30 52.20 47.30 48.50 51.15 50.40 48.10 50.90 51.50Fiber 42.42 41.91 44.13 44.68 42.66 43.83 46.98 44.29 44.09
Pol extraction % pol in cane 84.80 79.68 81.15 88.48 85.80 87.09 90.20 90.91 90.59Lb 96° sugar/gross ton cane 194.5 114.0 186.0 224.7 159.4 157.5 194.0 161.0 147.3*Because of conflicting research, Runs 7, 8, and 9 core samples were frozen for later analyses. Becauseof evidence of deterioration they were not processed. Core samples only for Run 10. No mill run.
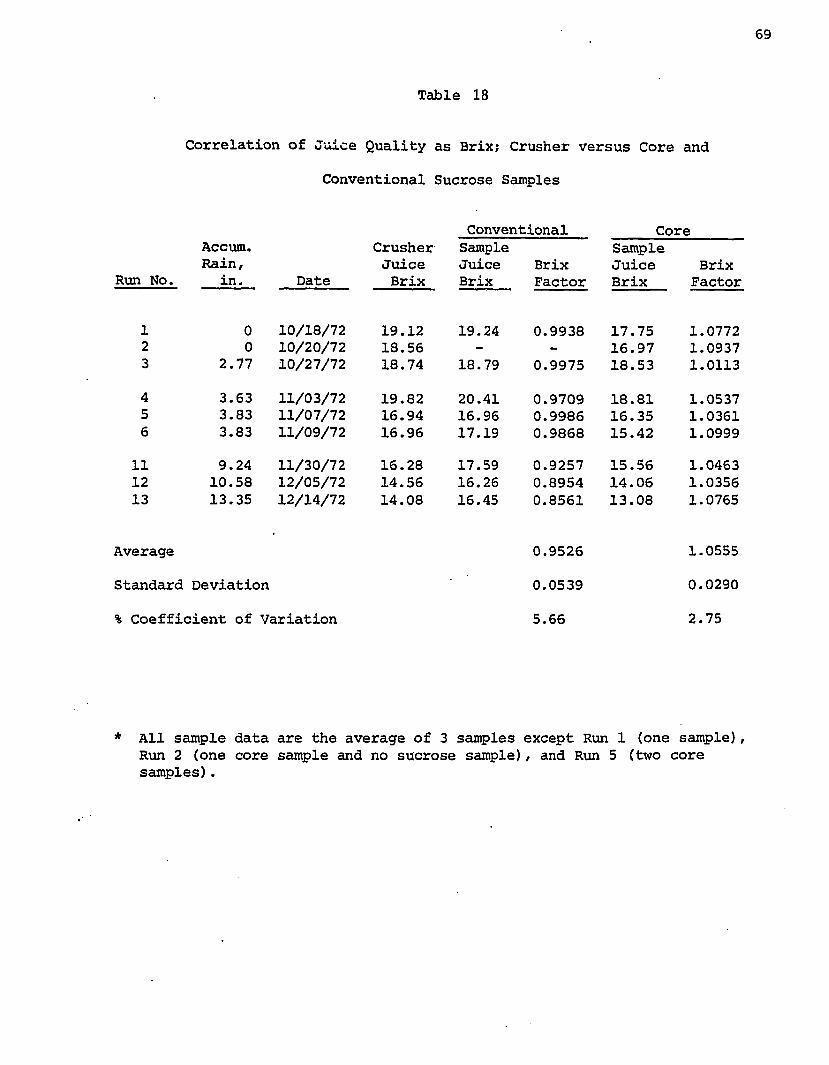
69
Table 18
Correlation of Juice Quality as Brix; Crusher versus Core and
Conventional Sucrose Samples
Run No.
Accum.Rain,
in. Date
CrusherJuiceBrix
ConventionalSampleJuice BrixBrix Factor
CoreSampleJuiceBrix
BrixFactor
1 0 10/18/72 19.122 0 10/20/72 18.563 2.77 10/27/72 18.74
4 3.63 11/03/72 19.825 3.83 11/07/72 16.946 3.83 11/09/72 16.96
11 9.24 11/30/72 16.2812 10.58 12/05/72 14.5613 13.35 12/14/72 14.08
Average
Standard Deviation
% Coefficient of Variation
19.24 0.9938 17.75 1.0772- - 16.97 1.0937
18.79 0.9975 18.53 1.0113
20.41 0.9709 18.81 1.053716.96 0.9986 16.35 1.036117.19 0.9868 15.42 1.099917.59 0.9257 15.56 1.046316.26 0.8954 14.06 1.035616.45 0.8561 13.08 1.0765
0.9526 1.0555
0.0539 0.0290
5.66 2.75
All sample data are the average of 3 samples except Run 1 (one sample), Run 2 (one core sample and no sucrose sample), and Run 5 (two core samples).
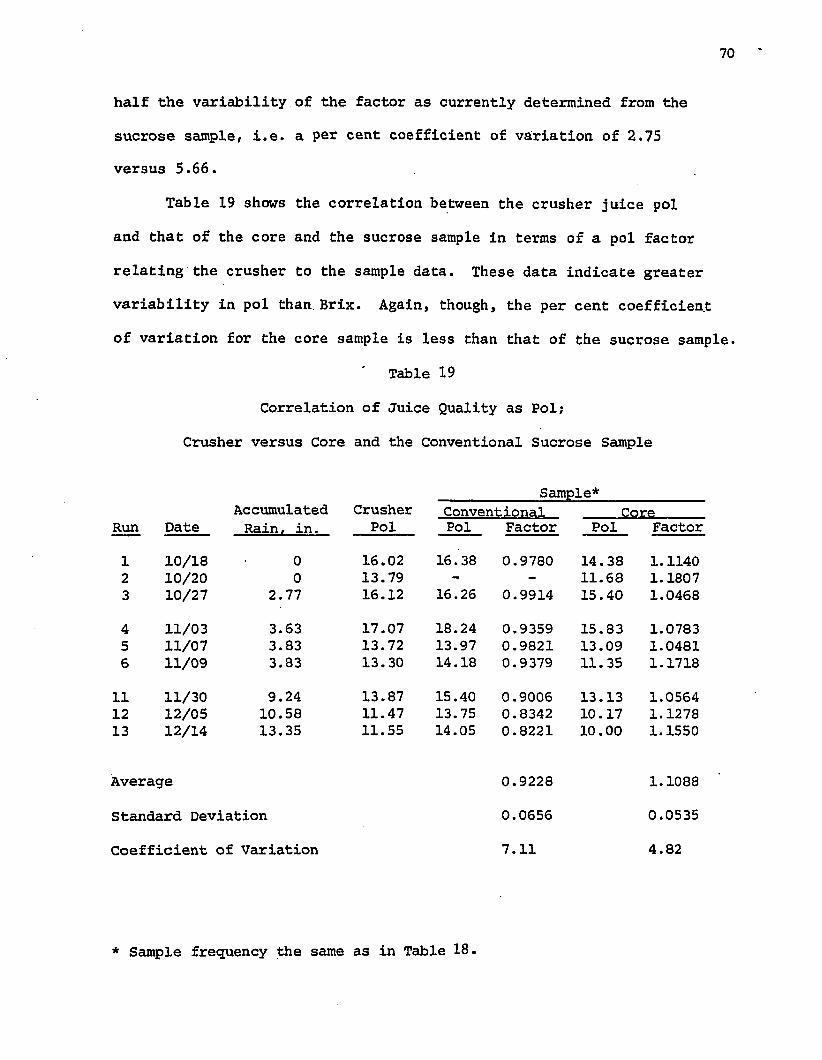
70
half the variability of the factor as currently determined from the
sucrose sample, i.e. a per cent coefficient of variation of 2.75
versus 5.66.
Table 19 shows the correlation between the crusher juice pol
and that of the core and the sucrose sample in terms of a pol factor
relating the crusher to the sample data. These data indicate greater
variability in pol than. Brix. Again, though, the per cent coefficient
of variation for the core sample is less than that of the sucrose sample.
Table 19
Correlation of Juice Quality as Pol;
Crusher versus Core and the Conventional Sucrose Sample
Sample*Accumulated Crusher Conventional Core
Run Date Rain, in. Pol Pol Factor Pol Factor
1 10/18 0 16.02 16.38 0.9780 14.38 1.11402 10/20 0 13.79 - - 11.68 1.18073 10/27 2.77 16.12 16.26 0.9914 15.40 1.0468
4 11/03 3.63 17.07 18.24 0.9359 15.83 1.07835 11/07 3.83 13.72 13.97 0.9821 13.09 1.04816 11/09 3.83 13.30 14.18 0.9379 11.35 1.1718
11 11/30 9.24 13.87 15.40 0.9006 13.13 1.056412 12/05 10.58 11.47 13.75 0.8342 10.17 1.127813 12/14 13.35 11.55 14.05 0.8221 10.00 1.1550
Average 0.9228 1.1088
Standard Deviation 0.0656 0.0535
Coefficient of Variation 7.11 4.82
* Sample frequency the same as in Table 18.
71
The fact that the Brix and pol factors are not unity is of no
consequence, since under the conventional system a daily Brix and pol
factor is calculated and applied to the individual sample juice Brix
and pol respectively. The result is that the average factored juice
pol and Brix closely approximate the factory juice analysis. However,
the greater the variability of the individual factors, the greater
is the inaccuracy of the estimate of the juice quality of individual
cane deliveries.
In the case of the core samples the variation in the Brix and pol
factors are respectively only 48.6, and 67.8 per cent of the variation
for the conventional samples. This indicates that the core juice
sample is more reproducible than the conventional juice sample. This
can be partly explained by the presence of trash in the core sample,
which also enters the crusher but ig present to a much lesser degree
in the conventional "sucrose" sample.
The core-press method of analysis is well suited to determining
directly the quantity of juice in the cane. However, since the Audubon
Sugar Factory mill was operated using imbibition while the Farrel mill
was not, it is preferable to compare bagasse per cent cane rather than
to compare the juice extraction applying a correction for the quantity
of imbibition entering the mixed juice.
The constancy of the ratio of the bagasse % cane from the Audubon
Sugar Factory run to that of the core-Farrel run was used as an
indication of the constancy of the juice extractions. The average
value of the factory bagasse % cane/core bagasse % cane was 0.8892 with
a standard deviation of 0.1139 and a per cent coefficient of variation
of 12.67%. The regression equation was
72
Factory Bagasse % Cane = 0.5631 (Core Bagasse % Cane) + 12.05
(r - 0.8580 )
The correlation between the factory bagasse % cane and that of
the core-Farrel is quite good. The lower values for the factory
bagasse % cane reflect the fact that the imbibition used in the factory
operations has resulted in some of the field soil in the cane being
washed out of the bagasse and into the juice. The leaching of field
soil also occurred with the core samples on the Farrel mill, though
to a lesser extent due to the absence of maceration water.
The results are shown in Table 20, together with trash % cane,
and the accumulated rainfall.
If the per cent coefficient of variation of 12.67% for the
bagasse factor is compared with the per cent coefficient of variation
for the juice Brix factor and juice pol factor (respectively 2.75 and
4.82), it will be noted that juice quantity is more difficult to
predict than juice quality. This would appear to reflect the volume
of field soil in the samples which as will be shown in Chapter VII
affects juice quantity to a greater extent than juice quality.
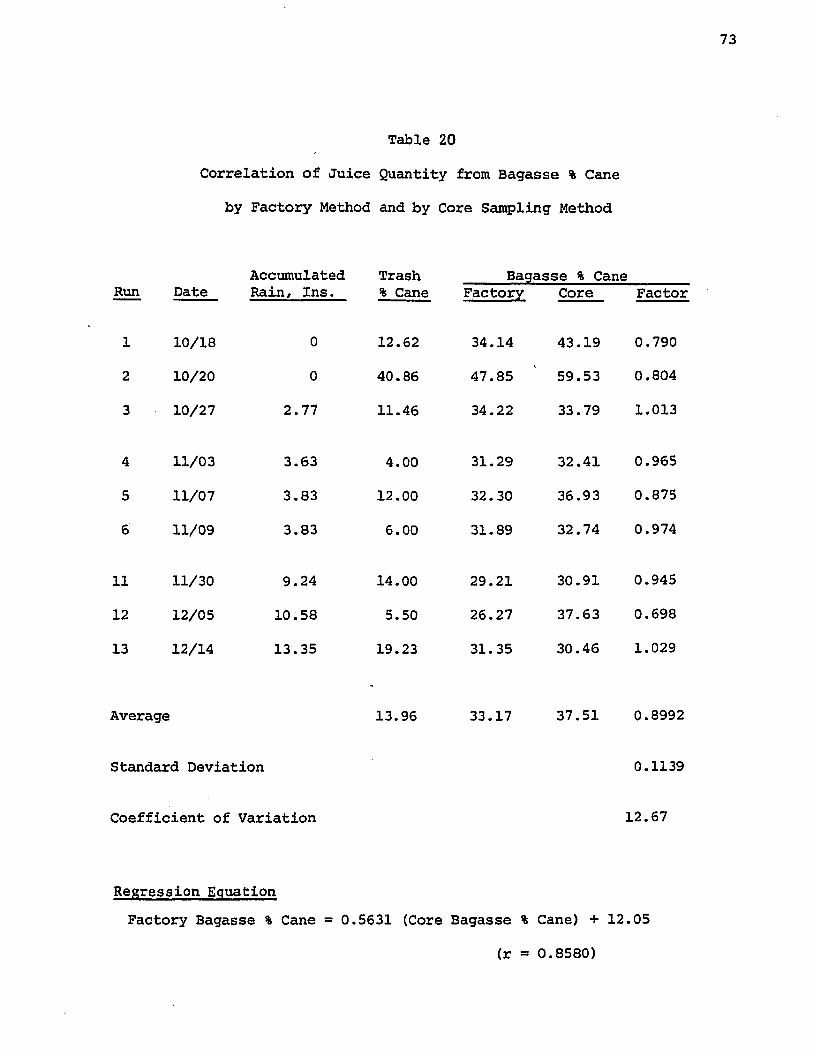
Table 20
Correlation of Juice Quantity from Bagasse % Cane
by Factory Method and by Core Sampling Method
Accumulated Trash Bagasse % CaneRun Date Rain, Ins. % Cane Factory Core Factor
1 10/18 0 12.62 34.14 43.19 0.790
2 10/20 0 40.86 47.85 59.53 0.804
3 10/27 2.77 11.46 34.22 33.79 1.013
4 11/03 3.63 4.00 31.29 32.41 0.965
5 11/07 3.83 12.00 32.30 36.93 0.875
6 11/09 3.83 6.00 31.89 32.74 0.974
11 11/30 9.24 14.00 29.21 30.91 0.945
12 12/05 10.58 5.50 26.27 37.63 0.698
13 12/14 13.35 19.23 31.35 30.46 1.029
Average 13.96 33.17 37.51 0.8992
Standard Deviation 0.1139
Coefficient of Variation 12.67
Regression Equation Factory Bagasse % Cane = 0.5631 (Core Bagasse % Cane) + 12.05
(r = 0.8580)
74
The 1973 Studies
These studies were conducted during the fall of 1973 at the
Audubon Sugar Factory. The Pinette-Emidecau hydraulic press was
available and used for the processing of all core samples.
The cane for these studies was obtained from Cinclare Central
Factory. As in the 1972 studies, the cane was delivered to Cinclare
by field cart where the core sampler was located. The field cart
was cored in three locations, the back, the middle, and the front.
The three samples were then placed in separate plastic bags and
returned to Audubon Sugar Factory for processing.
The entire field cart delivery of two to three tons of cane was
transferred to a truck and also taken to Audubon Sugar Factory. At
the Audubon Sugar Factory the entire bundle was then sampled by the
conventional method. A single 100 lb sample was removed for the trash
determination (more than one 100 lb sample was removed in a few
cases), while three 30 lb. sucrose samples were removed and processed
individually on the Farrel sample mill. In some of the cases the core
samples were also processed on the Farrel mill.
The entire bundle (after sampling) was then processed on the
Audubon Sugar Factory Squier mill using about 20 % imbibition on cane.
All the conventional inspections were performed on the samples from the
commercial milling operations.
The processing of the core samples was performed on the
Pinette-Emidecau hydraulic press. 1000 gins, of cane were pressed for
5 minutes at a pressure of 3500 psig (45 tons total force). The juice
and bagasse were then analyzed.
From the above runs and analyses the cane analysis and key juice
quality factors were available, for each of the three methods ( no cane
analysis in the case of the conventional method) used in evaluating the
cane quality. The data can be used for:
1. Comparing the multiple samples from each load to determine
the variability among samples in a given consignment.
2. Comparing each of the sampling methods (conventional and
core-press) with the Audubon Sugar factory's mill figures.
Variability of Cane Within the Consignment
For the 15 runs where cores were taken from the back, middle,
and front of the bundle, the standard deviation and the per cent
coefficient of variation was obtained. Table 21 shows a typical run,
together with the average per cent coefficient of variation for the 15
runs.
Table 22 shows the average values of the back middle, and front
cores together with their average, standard deviation and per cent
coefficient of variation.
If the 1973 core-press data in Table 21 is compared with the 1972
core-Farrel data (Table 15), several similarities will be noted. In
general, the juice analyses show less variation than the bagasse
related analyses. The Brix in cane shows less variation than the pol
in cane while the fiber in cane shows about twice the variation of
either the pol or Brix in cane.
In the hydraulic press reproducibility studies (Chapter V), it was
shown that the average per cent coefficient of variation in the replicate
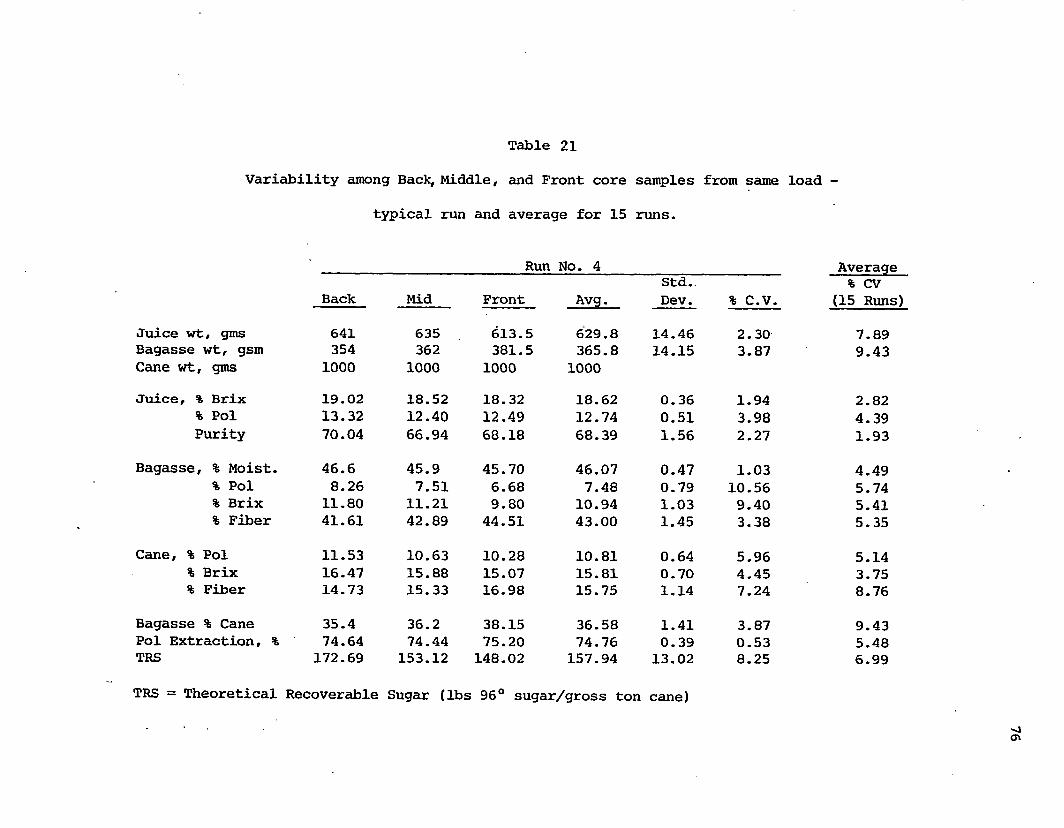
Table 21
Variability among Back, Middle, and Front core samples from same load -
typical run and average for 15 runs.
Run No. 4 AverageStd.. % cv
Back Mid Front Avg. Dev. % C.V. (15 Runs)
Juice wt, gins 641 635 613.5 629.8 14.46 2.30 7.89Bagasse wt, gsm 354 362 381.5 365.8 14.15 3.87 9.43Cane wt, guts 1000 1000 1000 1000Juice, % Brix 19.02 18.52 18.32 18.62 0.36 1.94 2.82
% Pol 13.32 12.40 12.49 12.74 0.51 3.98 4.39Purity 70.04 66.94 68.18 68.39 1.56 2.27 1.93
Bagasse, % Moist. 46.6 45.9 45.70 46.07 0.47 1.03 4.49% Pol 8.26 7.51 6.68 7.48 0.79 10.56 5.74% Brix 11.80 11.21 9.80 10.94 1.03 9.40 5.41% Fiber 41.61 42.89 44.51 43.00 1.45 3.38 5.35
Cane, % Pol 11.53 10.63 10.28 10.81 0.64 5.96 5.14% Brix 16.47 15.88 15.07 15.81 0.70 4.45 3.75% Fiber 14.73 15.33 16.98 15.75 1.14 7.24 8.76
Bagasse % Cane 35.4 36.2 38.15 36.58 1.41 3.87 9.43Pol Extraction, % 74.64 74.44 75.20 74.76 0.39 0.53 5.48TRS 172.69 153.12 148.02 157.94 13.02 8.25 6.99
TRS = Theoretical Recoverable Sugar (lbs 96° sugar/gross ton cane)
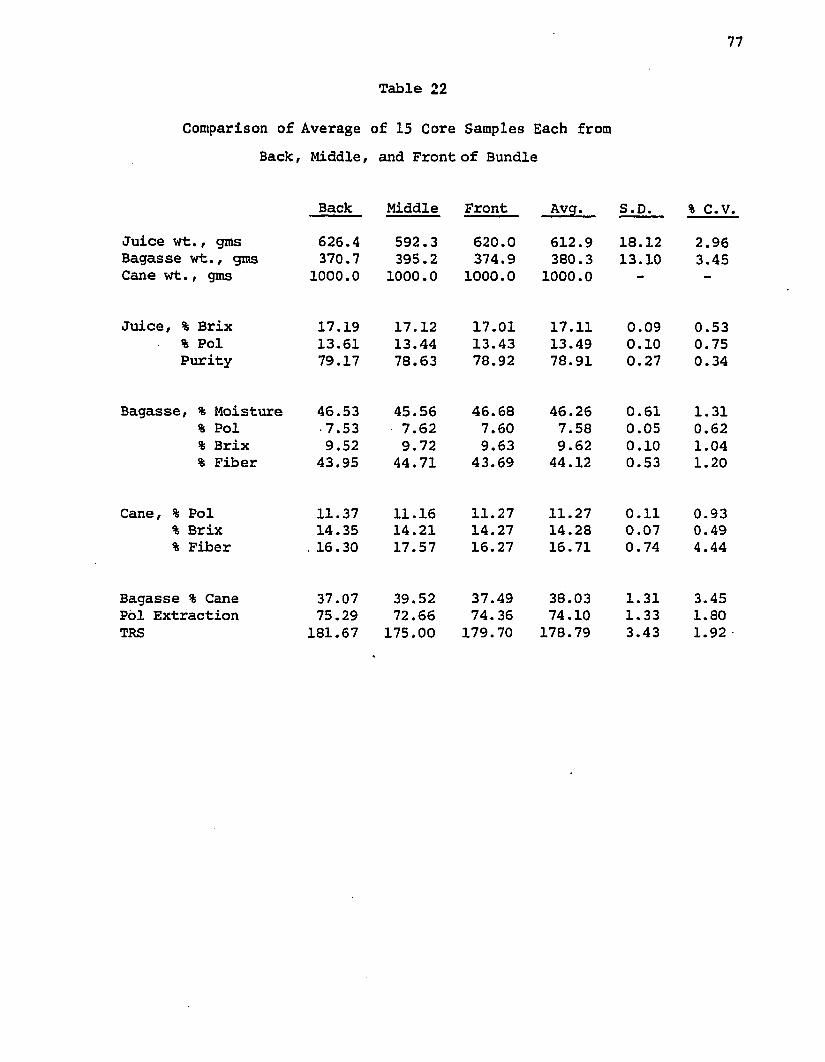
77
Table 22
Comparison of Average of 15 Core Samples Each from Back, Middle, and Front of Bundle
Back Middle Front Avg. S.D. % C.V,
Juice wt., gms Bagasse wt., gms Cane wt., gms
626.4370.7
1000.0
592.3395.2
1000.0
620.0374.9
1000.0
612.9380.3
1000.0
18.1213.10
2.963.45
Juice, % Brix % Pol Purity
17.1913.6179.17
17.1213.4478.63
17.0113.4378.92
17.1113.4978.91
0.090.100.27
0.530.750.34
Bagasse, % Moisture % Pol % Brix % Fiber
46.53 • 7.53 9.52
43.95
45.567.629.72
44.71
46.68 7.60 9.63
43.69
46.267.589.62
44.12
0.610.050.100.53
1.310.621.041.20
Cane, % Pol % Brix % Fiber
11.37 14.35
.16.30
11.1614.2117.57
11.2714.2716.27
11.2714.28 16.71
0.110.070.74
0.930.494.44
Bagasse % Cane Pol Extraction TRS
37.0775.29
181.67
39.5272.66
175.00
37.4974.36
179.70
38.0374.10
178.79
1.311.333.43
3.451.801.92
78
juice analyses was about 0.5%, for the bagasse analyses about 2%, and for
the cane it was less than 1% in the case of the pol and the Brix, and
about 2% for the fiber. Thus it is clear that the difference in fiber
% cane reported between the three cane sampling points (back, middle,
and front) are in fact due to real differences in the cane quality,
rather than errors introduced by the analytical techniques. However,
the fact that these differences were random was indicated by using the
"t" test to test the significance of the differences both as pooled
data or as paired data for the three possible combinations (back vs
middle, middle vs front, back vs front).
The result of the "t" test indicated that for all parameters
there was no significant difference due to core location even at the
0.10 level, except for the fiber % cane determination. There was no
significant difference between the back and front cores,however, there
was a significant difference in the fiber % cane (at the 0.02 level)
between the middle core and either the back or the front core. The
average of 15 samples for the fiber % cane for the middle core was
17.57, while the corresponding values for the back and front cores
were 16.30 and 16.27 respectively.
A possible explanation for the higher fiber % cane at the
middle sample point is that the quantity of tops was greater in the
middle sample. The corer was designed so that the forward motion into
the cane delivery would be approximately equal to the average length of
the cane stalks. However, many of the cane trucks were loaded above
the legal height, and the corer had to be raised about 2 feet to provide
adequate clearance. The raising of the entire core structure resulted
79
m less penetration of the corer tube in small cane deliveries with the
result that the forward travel of the corer was less than the average
cane stalk length. Thus in the case of the middle samples a larger
portion of the sample would be expected to be cane tops (see Figure 8).
Comparative Cane Quality by Press, Farrel Mill, and Cold Digestion
Ten samples of cored cane were used to compare the press with
the Farrel mill method of determining cane composition. In these runs
typically three core samples were obtained from a single commercial
delivery to Cinclare. Each of the samples was blended, pressed, and
analyzed separately by the press method, then all three remaining
samples were blended together and a fourth (average) subsample removed
for analysis by the press method. The entire blended core sample
remaining (typically about 40 lbs of cane) was then processed on the
Farrel mill. The Farrel mill run consisted of four passes of the cane
through the Farrel mill without imbibition. The juices and bagasse
from the press and the Farrel mill were then analyzed. The cane
composition was then calculated using a material balance.
In five of these ten comparisons, a blended sample of the cored
cane was used for the direct cold digestion to yield a direct pol %
cane value. This direct pol % cane digestion was performed in a
manner similiar to the conventional method for the bagasse analysis
except that 200 grams of cane were used instead of 100 grams of
bagasse with the 1000 grams of water. The dilution water results in
a dilute juice quantity about six times greater than the absolute
80
juice. This dilution greatly minimizes the error introducing effect
of field soil present in the cane sample. Thus for a cane with the
very large quantity of field soil of about 6% field soil by volume
(greater than 6% by weight), the error in the pol % cane value would
be reduced to about + 1 % (i.e. the field soil inflates the pol % cane
value). A one per cent error in the pol % cane is of the order of
magnitude of the accuracy of the analytical technique and can thus be
disregarded. Thus for all practical purposes the cold digestion
method's value for the pol % cane can be taken as the correct value.
The five runs for which the cold digestion was performed together
with the average for all ten runs are shown in Table 23. The complete
data on all runs is presented in the Appendix.
The results in Table 23 show that the press method yields cane
composition values for pol and Brix that are about 2% lower than the
corresponding values from the Farrel mill. On the other hand the
press method yields a fiber % cane value that is about 14% greater
than that obtained by the Farrel mill. Thes-? differences can be
readily explained by the fact that more of the field soil in the cane
finds its way into the juice in the case of the Farrel multiple milling
method than in the case of the press method where the juice is "strained"
through the bagasse pad. The presence of field soil in the extracted
juice does not alter the analysis of the juice for pol and Brix (where
it acts as an insoluble inert), but it does increase the apparent
quantity of juice leading to the higher calculated values for pol and
Brix per cent cane. The higher retention of field soil in the bagasse
in the case of the press method yields higher (more correct) values of

81
the "apparent" fiber in cane, where "apparent" fiber is defined as
insoluble solids in cane. In the case of the press method the error
introduced by the field soil on the pol, Brix, and fiber % cane values
is less than that in the case of the Farrel mill.
The actual error introduced by the field soil on the cane
analysis for the pol determination can be seen by comparing the press'
pol % cane value with the corresponding value obtained by the cold
digestion. The average pol % cane by the three methods for runs 8, 9,
19, 20, and 21 are as follows:
AverageMethod Average Pol % Cane % Error
Cold Digestion (Base) 11.95 0.00
Press 12.11 1.34
Farrel 12.23 2.34
In the case of the press the average per cent error is 1.34%,
while in the case of the Farrel it is 2.34%. The error in the pol %
cane increases with fiber % cane (r = 0.52 for the press data, and
r = 0.66 for the Farrel mill data), as would be expected. The fiber %
cane in Run 20 appears to be in error, and if this run is excluded
then the correlation coefficient between the fiber % cane and the error
in the pol % cane improves to 0.69 and 0.86 for the press and Farrel
mill data respectively.
Table 23 shows the average pol, Brix and fiber % cane for 10 runs
by the press and Farrel methods, together with the square of the
correlation coefficient relating each of the three cane quality para
meters by the two methods.
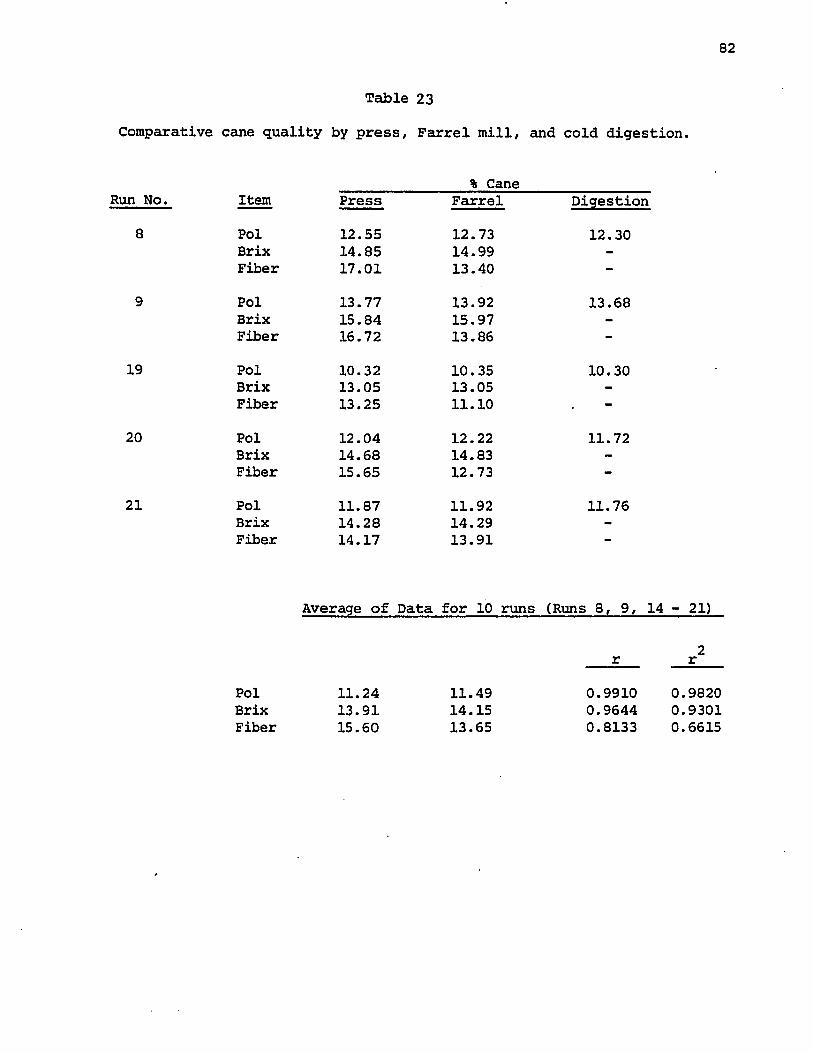
82
Table 23
Comparative cane quality by press, Parrel mill, and cold digestion.
% CaneRun No. Item Press Farrel Digestion
8 Pol 12.55 12.73 12.30Brix 14.85 14.99 -
Fiber 17.01 13.40 -
9 Pol 13.77 13.92 13.68Brix 15.84 15.97 -
Fiber 16.72 13.86 -
19 Pol 10.32 10.35 10.30Brix 13.05 13.05 -
Fiber 13.25 11.10 -
20 Pol 12.04 12.22 11.72Brix 14.68 14.83 -
Fiber 15.65 12.73 -
21 Pol 11.87 11.92 11.76Brix 14.28 14.29 -
Fiber 14.17 13.91 -
Average of Data for 10 runs (Runs 8, 9, 14 - 21)
2r r
PolBrixFiber
11.2413.9115.60
11.4914.1513.65
0.9910 0.98200.9644 0.93010.8133 0.6615
83
Comparison of Theoretically Recoverable Sugar from Core-Press Sample
With the Farrel Mill Predicted Yield (RS)
The data from the previous section can be used to compare
sugar yields by the two methods (press and Parrel) . The results are
shown in Table 24.
In this comparison between the press and the Parrel, the sugar
predicting methods chosen were different. Two methods were used for
the cane composition obtained from the press. Method 1 was the method
finally decided upon as derived and discussed in the Appendix.
Method 2 for handling the press data is essentially the same as that
of Method 1 with the effect of fiber % cane on the mill extraction
being neglected (i.e. to test whether the effect of fiber is
significant in improving the correlation).
To predict the sugar yield from the Parrel mill it was felt that
an independent method of predicting the pol extraction should be used,
so that the correlation would not be arbitrarily improved by the
predicting formula used. In handling the Farrel mill data the pol
extraction used was obtained by assuming a constant pol % fiber in
bagasse value. A pol % fiber in bagasse of 7.0% was used since this
is the state average value obtained by the commercially operating
mills.
In all cases the boiling house retention was obtained using the
Winter-Carp available pol method assuming a boiling house efficiency
of 96 (approximately the state average). The methods of calculation
are summarized below.
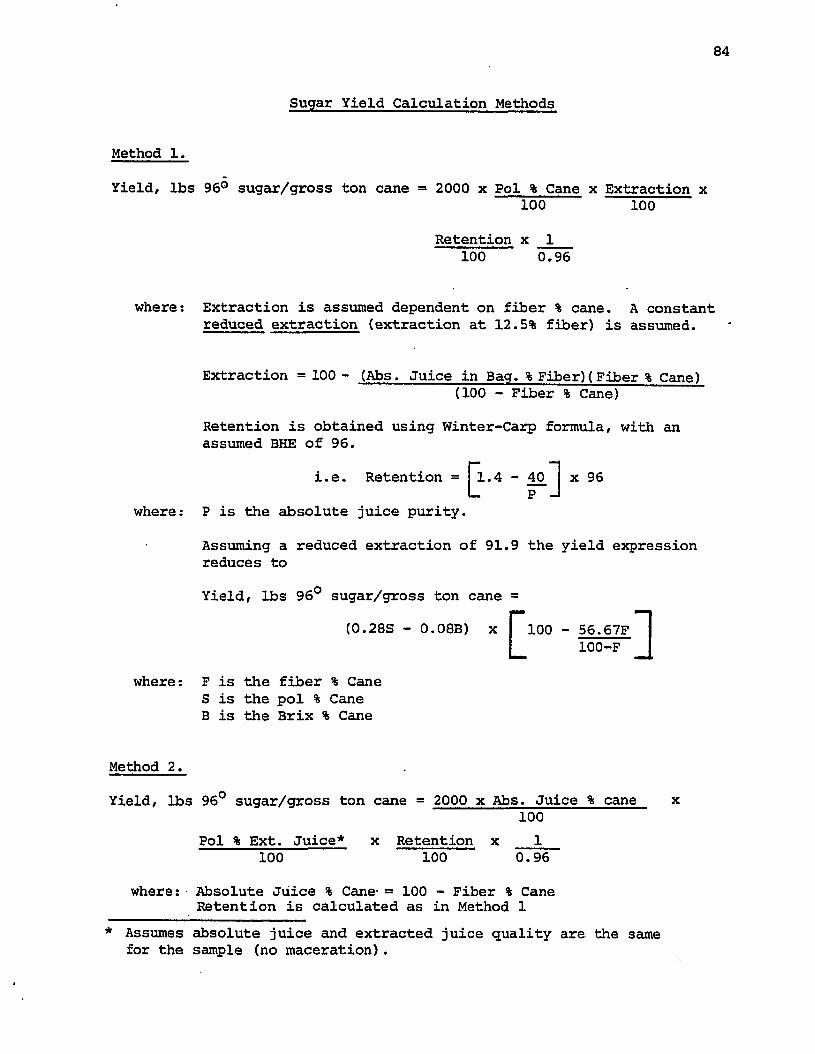
84
Sugar Yield Calculation Methods
Method 1.
Yield, lbs 96° sugar/gross ton cane = 2000 x Pol % Cane x Extraction x100 100
Retention x 1100 0.96
where: Extraction is assumed dependent on fiber % cane. A constantreduced extraction (extraction at 12.5% fiber) is assumed.
Extraction = 100 - (Abs. Juice in Bag. % Fiber)(Fiber % Cane)(100 - Fiber % Cane)
Retention is obtained using Winter-Carp formula, with an assumed BHE of 96.
■ - r ii.e. Retention = i 1 . 4 - 4 0 | x 96
where: P is the absolute juice purity.
Assuming a reduced extraction of 91.9 the yield expression reduces to
Yield, lbs 96° sugar/gross ton cane =
(0.28S - 0.08B) X | 100 - 56.67F I)-F Jn _L ioo-
where: F is the fiber % CaneS is the pol % Cane B is the Brix % Cane
Method 2.
Yield, lbs 96° sugar/gross ton cane = 2000 x Abs. Juice % cane x100
Pol % Ext. Juice* x Retention x 1 100 100 0.96
where: Absolute Juice % Cane- = 100 - Fiber % CaneRetention is calculated as in Method 1
* Assumes absolute juice and extracted juice quality are the same for the sample (no maceration).
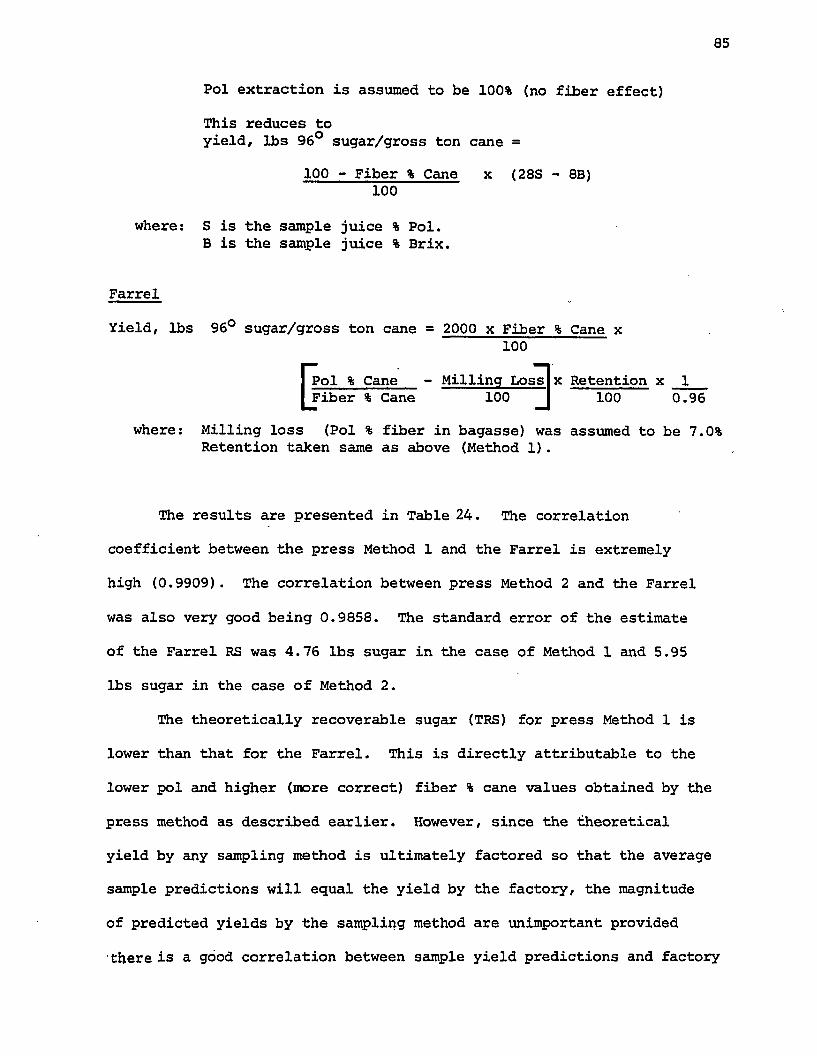
85
Pol extraction is assumed to be 100% (no fiber effect)
This reduces toyield, lbs 96° sugar/gross ton cane =
100 - Fiber % Cane x (28S - 8B) 100
where: S is the sample juice % Pol.B is the sample juice % Brix.
Farrel
Yield, lbs 96° sugar/gross ton cane = 2000 x Fiber % Cane x100
Pol % Cane Fiber % Cane
- Milling Loss x Retention x 1100 100 0.96
where: Milling loss (Pol % fiber in bagasse) was assumed to be 7.0%Retention taken same as above (Method 1).
The results are presented in Table 24. The correlation
coefficient between the press Method 1 and the Farrel is extremely
high (0.9909). The correlation between press Method 2 and the Farrel
was also very good being 0.9858. The standard error of the estimate
of the Farrel RS was 4.76 lbs sugar in the case of Method 1 and 5.95
lbs sugar in the case of Method 2.
The theoretically recoverable sugar (TRS) for press Method 1 is
lower than that for the Farrel. This is directly attributable to the
lower pol and higher (more correct) fiber % cane values obtained by the
press method as described earlier. However, since the theoretical
yield by any sampling method is ultimately factored so that the average
sample predictions will equal the yield by the factory, the magnitude
of predicted yields by the sampling method are unimportant provided
there is a good correlation between sample yield predictions and factory
yields. The result of factoring is seen in the CRS yields, where both
sampling methods show the same yield as that of the 'factory'.
Since the yields by press Method 1 correlate better than do the
yields by press Method 2 with the Farrel mill yields, this indicates
that the effect of the fiber in cane on the sugar yield is important,
and is being properly predicted by Press Method 1.
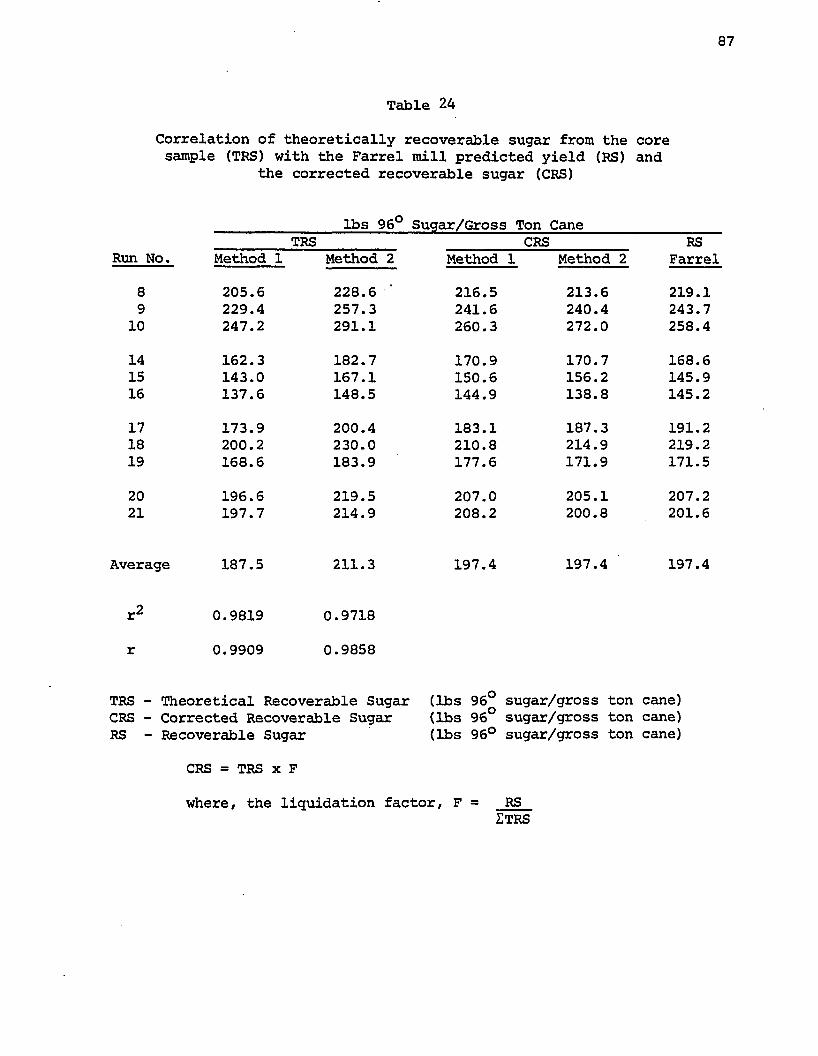
87
Table 24
Correlation of theoretically recoverable sugar from the core sample (TRS) with the Farrel mill predicted yield (RS) and
the corrected recoverable sugar (CRS)
lbs 96° Sugar/Gross Ton CaneTRS CRS RS
Run No. Method 1 Method 2 Method 1 Method 2 Farrel
8 205.6 228.6 ' 216.5 213.6 219.19 229.4 257.3 241.6 240.4 243.7
10 247.2 291.1 260.3 272.0 258.4
14 162.3 182.7 170.9 170.7 168.615 143.0 167.1 150.6 156.2 145.916 137.6 148.5 144.9 138.8 145.2
17 173.9 200.4 183.1 187.3 191.218 200.2 230.0 210.8 214.9 219.219 168.6 183.9 177.6 171.9 171.5
20 196.6 219.5 207.0 205.1 207.221 197.7 214.9 208.2 200.8 201.6
Average 187.5 211.3 197.4 197.4 197.4
r2 0.9819 0.9718
r 0.9909 0.9858
TRS - Theoretical Recoverable Sugar (lbs 96° sugar/gross ton cane)CRS - Corrected Recoverable Sugar (lbs 96° sugar/gross ton cane)RS - Recoverable Sugar (lbs 96° sugar/gross ton cane)
CRS = TRS x F
where, the liquidation factor, F = RSZTRS
Summary
The main conclusions reached in this chapter are that:
1. The core sampler obtains a representative and unbiased
sample of the cane in a delivery regardless of the sampling
point location.
2. The variability between multiple core samples from any given
cane delivery is small enough that the average error over a
weeks sampling is of the order of magnitude of reproducibility
of the methods employed ( + 1%).
3. The variability of the ratio of quality of the core-Farrel
juices to that of the corresponding factory values, is about
half that obtained by comparing the conventional sample
juices to the corresponding factory values.
4. The core-press method of cane quality evaluation yields
more accurate results than when the Farrel mill is used to
process the core samples.
5. The incorporation of the fiber content of the cane into the
method used for predicting the recoverable sugar yield
improves the accuracy of the prediction.
CHAPTER VII
PRESS RESPONSE TO TRASH
This chapter considers the effect of trash on the quality of
cane as determined by the hydraulic press.
Commercial experience has indicated that for a given quantity of
trash in gross cane, the depressing effect of the trash on the pol
extraction is greater for field soil than it is for green leaves.
This chapter shows how the press method reacts to various types
of trash in predicting the sugar yield. This predicted sugar yield
is compared with that expected by the constitution of the cane, and
also with what would be predicted by the conventional method.
Experimental Procedure
In these series of experiments the samples were prepared by
chipping clean hand-cut cane in a cane chipper. The cane chipper
consists of a steel hub which is machined to receive four knife
blades. An anvil bar is located with close tolerance to the revol
ving knife blades. A high degree of cane disintegration is achieved
by passing about three stalks of cane at a time through the chipper.
Sub-samples of this prepared cane were then mixed with varying
quantities of trash. Five types of trash were employed in these
studies, consisting of typical trash components normally encountered
under Louisiana conditions. The various types of trash studied
were:
89
90
1. Green cane leaves.
2. Dry cane leaves.
3. Mhoon soil.
4. Sharkey soil.
5. Commerce soil.
To prepare a homogeneous sample of cane intimately mixed with
trash, the green and dry leaves were prepared by chipping in a Wiley
mill, while the soil samples were prepared by breaking them up into
small particles by hand.
In the preparation of the samples for pressing, weighed quanti
ties of chipped cane and a weighed quantity of prepared trash were
blended together in a Y-blender for 10 minutes.
Each of the tests for a given type of trash were performed on
different days using a different cane sample. However, throughout
each test on a given type of trash the tests were performed in one
day using the same sample of prepared cane.
The processing method employed in these tests was the standard
method employed throughout.
Green leaves often accompany cane deliveries because of the
use of automated cane harvesters and the varying height of cane.
Dry leaves often accompany improperly burned cane, or unburned cane
following a freeze. Field soil often accompanies cane since cane
harvesters often cut below the soil. Another source of field soil
in cane deliveries results from the loading operations where a chain
roller or grab is used for loading the cane. Of the field soils
Commerce has the greatest proportion of sand. Sharkey soil is a
91
clay soil with a high organic matter content. Mhoon soil is a silt intermediate in texture between Commerce and Sharkey soils.
The analytical techniques used for the determination of field
soil and ash in juice, the ash per cent in the cane, bagasse, and
trash, are given in the Appendix.
The results of these tests are tabulated in Tables 25
to.29. In the discussion that follows the principal results are
presented in graphical form.
Bagasse 7® Cane
Table 30 shows the variation in bagasse % cane with increasing
trash levels in cane for the five types of trash studied. For any
given type of trash the quantity of bagasse is directly proportional
to the quantity of trash. All of the correlation coefficients were
high ranging from 0.9700 to 0.9976. In all cases the quantity of
bagasse increased with increasing trash levels.
The quantity of bagasse per cent cane is related to the fiber
7o trash, the moisture 7® bagasse and the fractional retention of
trash fiber in the bagasse. The increase in bagasse % cane for 107®
added trash is presented in Table 6 for the different types of trash,
together with the regression equation and correlation coefficient (r).
The results are plotted in Figure 9. The increase in bagasse
7o cane for the dry leaves and Sharkey soil follows material balance
predictions for these low moisture types of trash. The relatively
moderate increase in bagasse 7® cane in the case of the green leaves
can be accounted for by a material balance for this high moisture
(60.17®) type of trash.
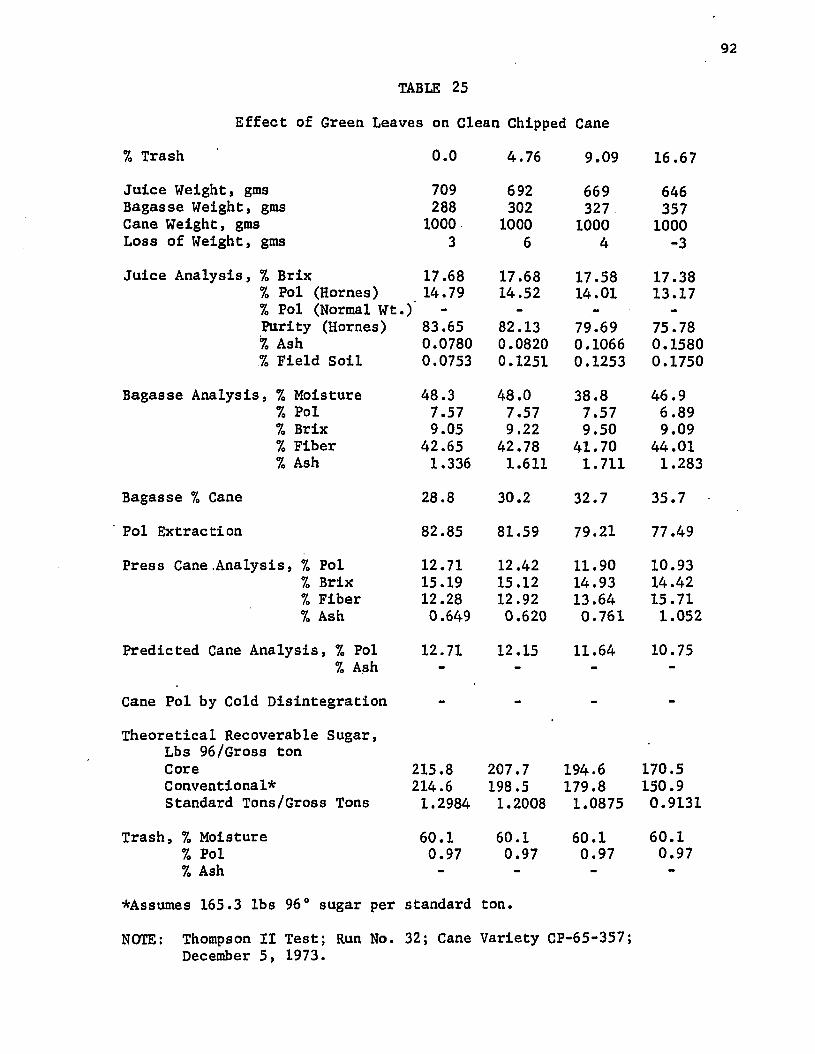
92
TABLE 25
Effect of Green Leaves on Clean Chipped Cane
% Trash 0.0 4.76 9.09 16.67Juice Weight, gms Bagasse Weight, gms Cane Weight, gms Loss of Weight, gms
709288
10003
6923021000
6
669327
10004
6463571000
-3Juice Analysis, % Brix
% Pol (Hornes)% Pol (Normal Wt Purity (Hornes)% Ash% Field Soil
17.68 14.79
• ) -83.650.07800.0753
17.6814.52
82.130.08200.1251
17.5814.01
79.690.10660.1253
17.3813.17
75.780.15800.1750
Bagasse Analysis, % Moisture70 Pol % Brix % Fiber 7» Ash
48.37.579.05
42.651.336
48.07.579.22
42.781.611
38.87.579.50
41.701.711
46.96.899.09
44.011.283
Bagasse % Cane 28.8 30.2 32.7 35.7
Pol Extraction 82.85 81.59 79.21 77.49
Press Cane.Analysis, % Pol7o Brix 7o Fiber 7o Ash
12.7115.1912.280.649
12.4215.1212.920.620
11.9014.9313.640.761
10.9314.4215.711.052
Predicted Cane Analysis, % Pol7o Ash
12.71 12.15 11.64 10.75
Cane Pol by Cold Disintegration - - - -
Theoretical Recoverable Sugar, Lbs 96/Gross ton CoreConventional*Standard Tons/Gross Tons
215.8214.61.2984
207.7198.51.2008
194.6179.81.0875
170.5150.90.9131
Trash, % Moisture 7o Pol 7o Ash
60.10.97
60.10.97
60.10.97
60.10.97
*Assumes 165.3 lbs 96° sugar per standard ton.
NOTE: Thompson II Test; Run No. December 5, 1973.
32; Cane Variety CP-65-357;
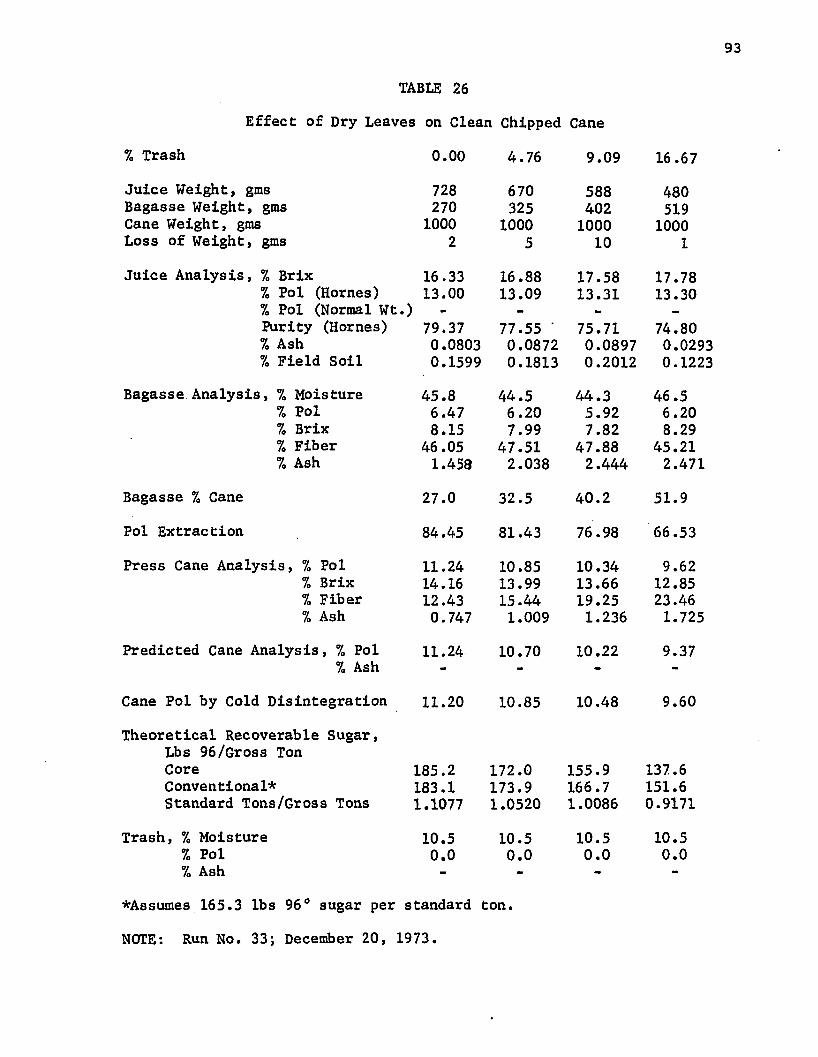
93
TABLE 26
Effect of Dry Leaves on Clean Chipped Cane
% Trash 0.00 4.76 9.09 16.67Juice Weight, gms 728 670 588 480Bagasse Weight, gms 270 325 402 519Cane Weight, gms 1000 1000 1000 1000Loss of Weight, gms 2 5 10 1Juice Analysis, % Brix 16.33 16.88 17.58 17.78
% Pol (Hornes) 13.00 13.09 13.31 13.30% Pol (Normal Wt.) - - -Purity (Hornes) 79.37 77.55 ‘ 75.71 74.807o Ash 0.0803 0.0872 0.0897 0.029:% Field Soil 0.1599 0.1813 0.2012 0.1222
Bagasse Analysis, % Moisture 45.8 44.5 44.3 46.57. Pol 6.47 6.20 5.92 6.20% Brix 8.15 7.99 7.82 8.29% Fiber 46.05 47.51 47.88 45.21% Ash 1.458 2.038 2.444 2.471
Bagasse % Cane 27.0 32.5 40.2 51.9
Pol Extraction 84.45 81.43 76.98 66.53
Press Cane Analysis, % Pol 11.24 10.85 10.34 9.62% Brix 14.16 13.99 13.66 12.857, Fiber 12.43 15.44 19.25 23.46% Ash 0.747 1.009 1.236 1.725
Predicted Cane Analysis, % Pol 11.24 10.70 10.22 9.377. Ash - - - -
Cane Pol by Cold Disintegration 11.20 10.85 10.48 9.60
Theoretical Recoverable Sugar, Lbs 96/Gross Ton Core 185.2 172.0 155.9 137.6Conventional* 183.1 173.9 166.7 151.6Standard Tons/Gross Tons 1.1077 1.0520 1.0086 0.9171
Trash, % Moisture 10.5 10.5 10.5 10.57. Pol 0.0 0.0 0.0 0.07o Ash - - - -
*Assumes 165.3 lbs 96° sugar per standard iton.
NOTE: Run No. 33; December 20, 1973.
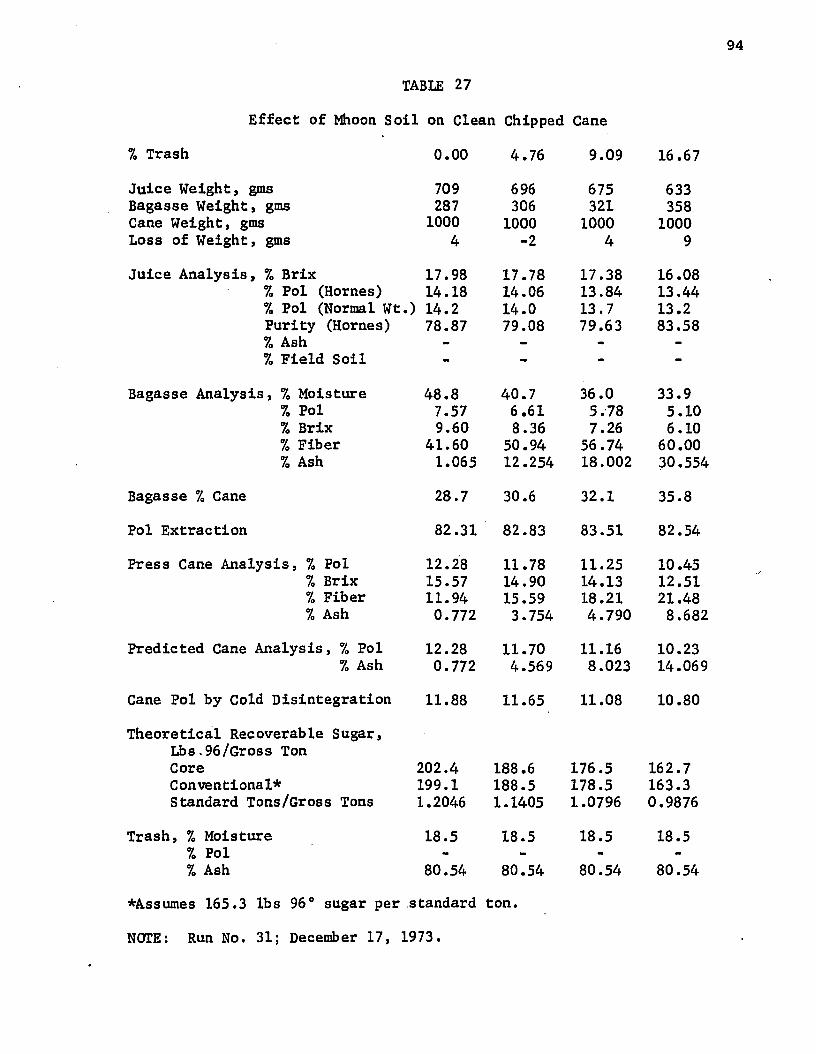
94
TABLE 27
Effect of Mhoon Soil on Clean Chipped Cane
% Trash 0.00 4.76 9.09 16.67
Juice Weight, gms 709 696 675 633Bagasse Weight, gms 287 306 321 358Cane Weight, gms 1000 1000 1000 1000Loss of Weight, gms 4 -2 4 9
Juice Analysis, 7> Brix 17.98 17.78 17.38 16.087> Pol (Hornes) 14.18 14.06 13.84 13.44% Pol (Normal Wt.) 14.2 14.0 13.7 13.2Purity (Hornes) 78.87 79.08 79.63 83.587o Ash - - - -7o Field Soil - - - -
Bagasse Analysis, % Moisture 48.8 40.7 36.0 33.97, Pol 7.57 6.61 5.78 5.107, Brix 9.60 8.36 7.26 6.10% Fiber 41.60 50.94 56.74 60.00% Ash 1.065 12.254 18.002 30.554
Bagasse 7, Cane 28.7 30.6 32.1 35.8
Pol Extraction 82.31 82.83 83.51 82.54
Press Cane Analysis, 7« Pol 12.28 11.78 11.25 10.457o Brix 15.57 14.90 14.13 12.517, Fiber 11.94 15.59 18.21 21.487o Ash 0.772 3.754 4.790 8.682
Predicted Cane Analysis, 7, Pol 12.28 11.70 11.16 10.237o Ash 0.772 4.569 8.023 14.069
Cane Pol by Cold Disintegration 11.88 11.65 11.08 10.80
Theoretical Recoverable Sugar, Lbs.96/Gross TonCore 202.4 188.6 176.5 162.7Conventional* 199.1 188.5 178.5 163.3Standard Tons/Gross Tons 1.2046 1.1405 1.0796 0.9876
Trash, % Moisture 18.5 18.5 18.5 18.5% Pol - - - -
% Ash 80.54 80.54 80.54 80.54
*Assumes 165.3 lbs 96° sugar per standard ton.
NOTE: Run No. 31; December 17, 1973.
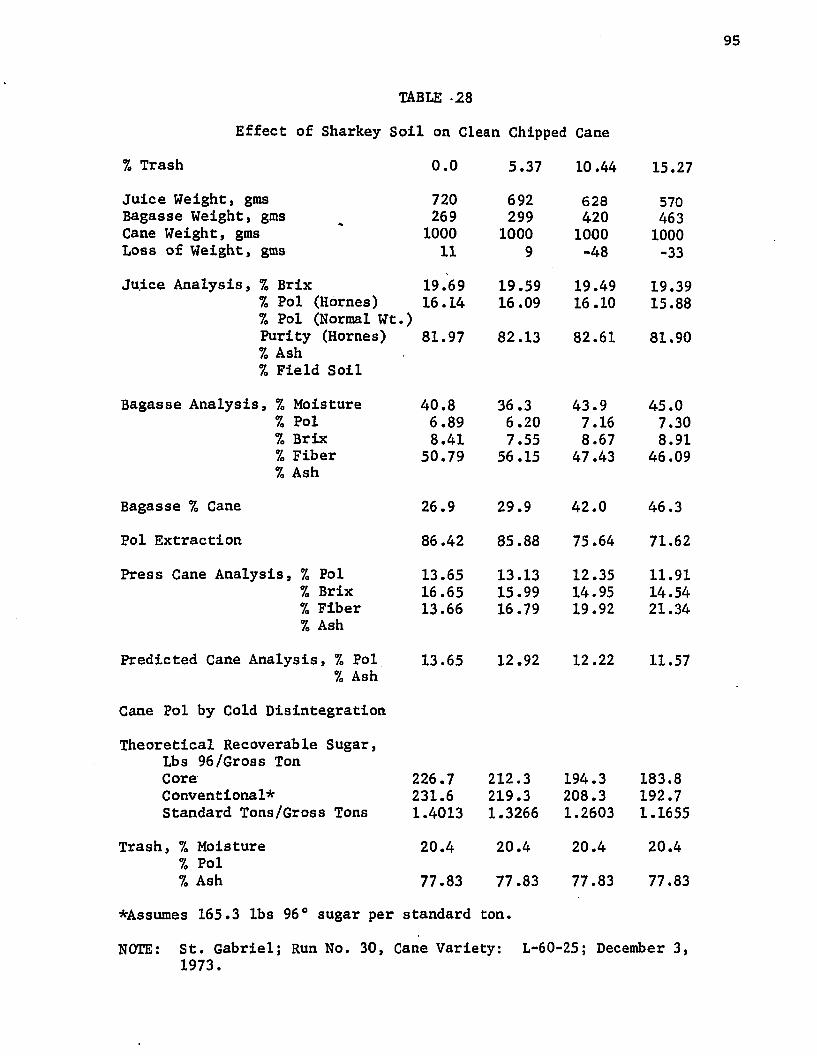
TABLE -28
Effect of Sharkey Soil on Clean Chipped Cane
7. Trash 0.0 5.37 10.44 15.27Juice Weight, gms Bagasse Weight, gms Cane Weight, gms Loss of Weight, gms
7202691000
11
692299
10009
6284201000-48
5704631000-33
Juice Analysis, % Brix% Pol (Hornes)% Pol (Normal Wt. Purity (Hornes)% Ash7. Field Soil
19.6916.14
)81.97
19.5916.09
82.13
19.4916.10
82.61
19.3915.88
81.90
Bagasse Analysis, % Moisture7. Pol 7. Brix 7. Fiber % Ash
40.86.898.41
50.79
36.36.207.55
56.15
43.97.168.67
47.43
45.07.308.91
46.09
Bagasse 7. Cane 26.9 29.9 42.0 46.3
Pol Extraction 86.42 85.88 75.64 71.62
Press Cane Analysis, 7« Pol70 Brix 7. Fiber 7. Ash
13.6516.6513.66
13.1315.9916.79
12.3514.9519.92
11.9114.5421.34
Predicted Cane Analysis, 7« Pol7. Ash
13.65 12.92 12.22 11.57
Cane Pol by Cold Disintegration
Theoretical Recoverable Sugar, Lbs 96/Gross Ton CoreConventional*Standard Tons/Gross Tons
226.7231.61.4013
212.3219.3 1.3266
194.3208.3 1.2603
183.8192.71.1655
Trash, 7. Moisture 7. Pol 7o Ash
20.4
77.83
20.4
77.83
20.4
77.83
20.4
77.83
*Assumes 165.3 lbs 96° sugar per standard ton.
NOTE: St. Gabriel; Run No. 30, Cane Variety: L-60-25; December 3,1973.
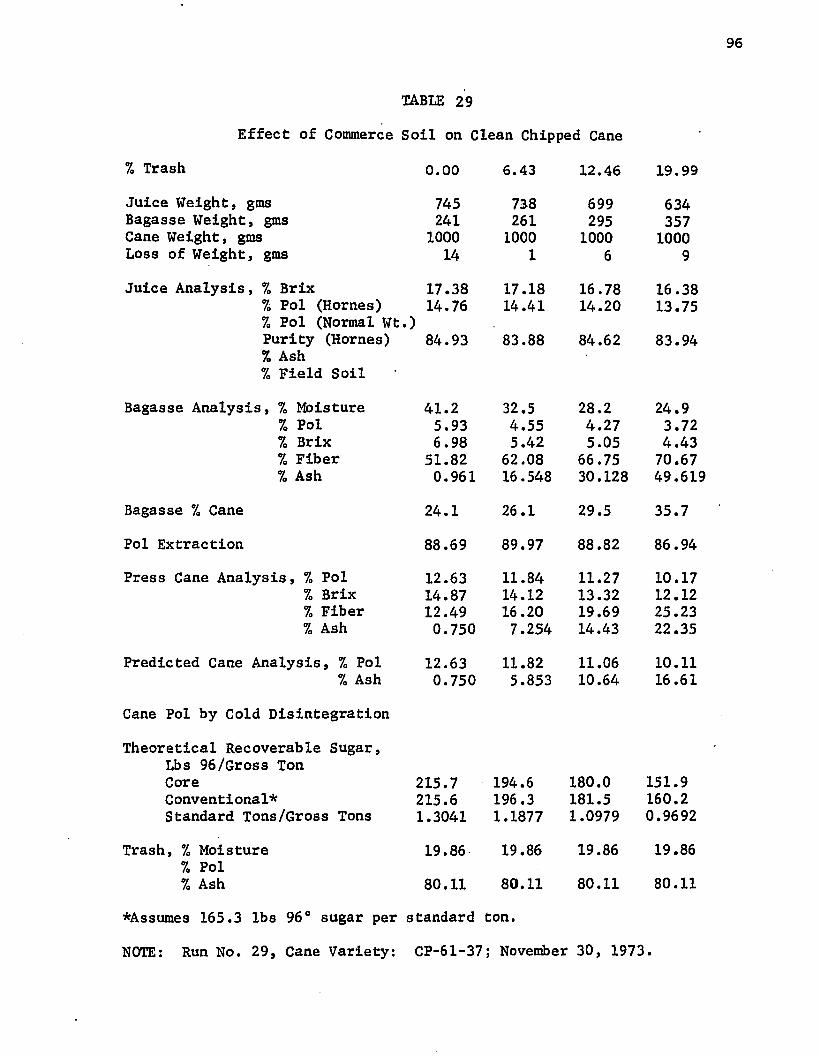
96
TABLE 29
Effect of Commerce Soil on Clean Chipped Cane
% Trash 0.00 6.43 12.46 19.99Juice Weight, gms Bagasse Weight, gms Cane Weight, gms Loss of Weight, gms
745241
100014
7382611000
1
6992951000
6
6343571000
9
Juice Analysis, 7. Brix% Pol (Hornes)% Pol (Normal Wt Purity (Hornes)% Ash7o Field Soil
17.3814.76
.)84.93
17.1814.41
83.88
16.7814.20
84.62
16.3813.75
83.94
Bagasse Analysis, 7o Moisture7, Pol 7o Brix 7o Fiber 7» Ash
41.25.936.98
51.820.961
32.54.555.42
62.0816.548
28.24.275.05
66.7530.128
24.93.724.4370.6749.619
Bagasse 7> Cane 24.1 26.1 29.5 35.7
Pol Extraction 88.69 89.97 88.82 86.94
Press Cane Analysis, 7. Pol7o Brix 70 Fiber 7o Ash
12.6314.8712.490.750
11.8414.1216.207.254
11.2713.3219.6914.43
10.1712.1225.2322.35
Predicted Cane Analysis, 7» Pol7o Ash
12.630.750
11.825.853
11.0610.64
10.1116.61
Cane Pol by Cold Disintegration
Theoretical Recoverable Sugar, Lbs 96/Gross Ton CoreConventional*Standard Tons/Gross Tons
215.7215.61.3041
194.6196.31.1877
180.0181.51.0979
151.9160.20.9692
Trash, % Moisture 7« Pol 7o Ash
19.86
80.11
19.86
80.11
19.86
80.11
19.86
80.11
*Assumes 165.3 lbs 96° sugar per standard ton.
NOTE: Run No. 29, Cane Variety: CP-61-37; November 30, 1973.
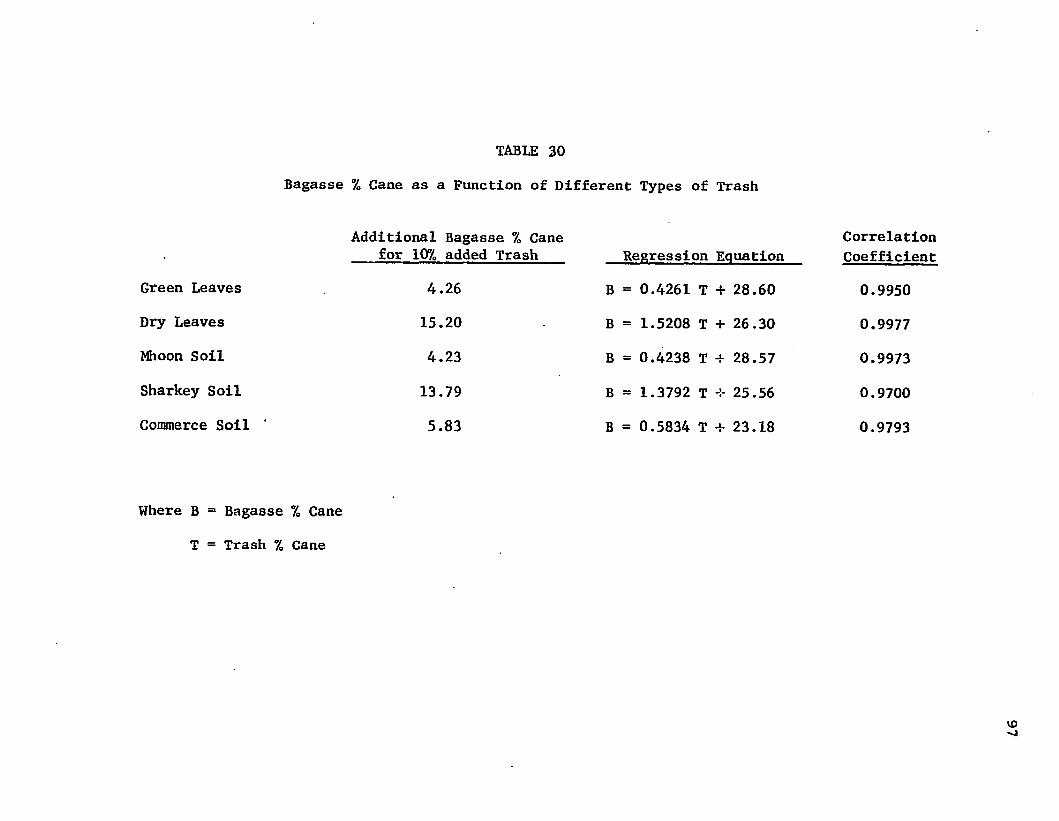
TABLE 30
Bagasse % Cane as a Function of Different Types of Trash
Correlation Coefficient
0.9950
0.9977
0.9973
0.9700
0.9793
Where B = Bagasse % Cane
T = Trash % Cane
Additional Bagasse % Canefor 10% added Trash Regression Equation
Green Leaves 4.26 B = 0.4261 T + 28.60Dry Leaves 15.20 B = 1.5208 T + 26.30Mhoon Soil 4.23 B = 0.4238 T + 28.57Sharkey Soil 13.79 B = 1.3792 T 25.56
Commerce Soil 5.83 B = 0.5834 T + 23.18
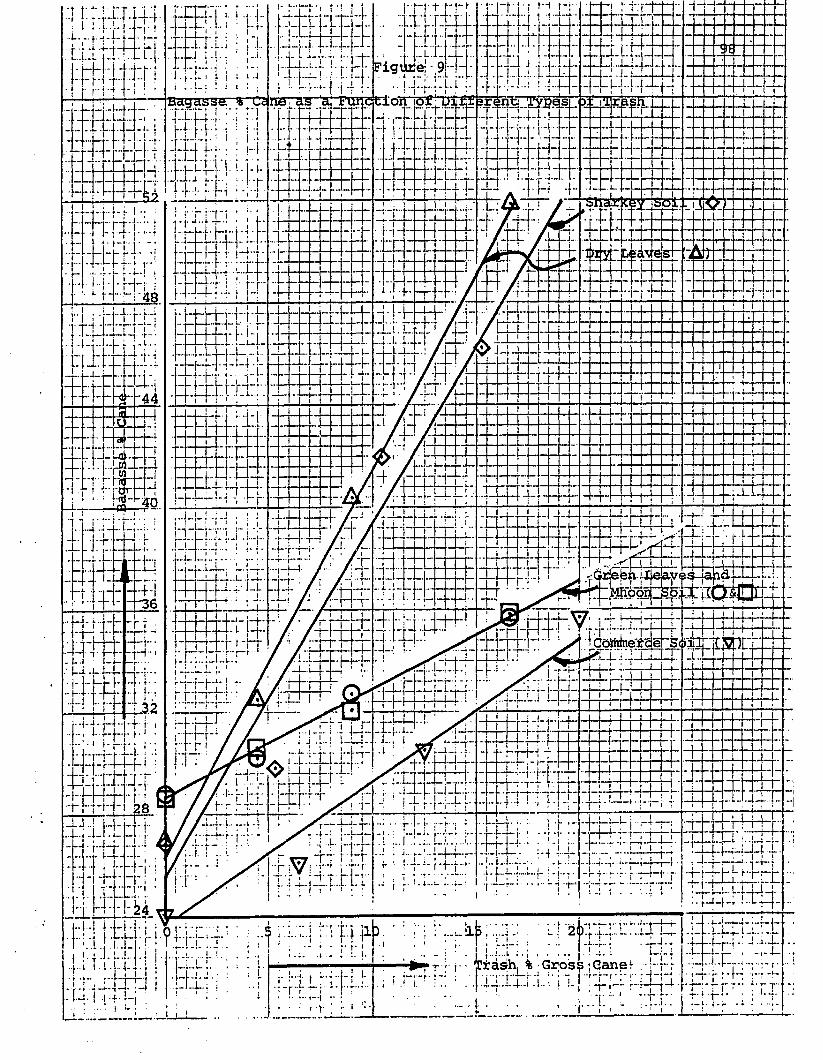
xrr.u - j: LFigure! 9 Irti:: I L.l .1
5TTDIBagasse. % ~Cs ngrag-g Eiorl
4I-TT-) l--Tk •}•• srrax
i
I l f * -
ffiPQri_SbiXi
ktepcrisDi:
T-i-i-; r i nrrq aid• i i T i
Trash, % Gross iGanet-j ’-vff-i r: U v O T T l
The moderate increase in bagasse % cane for the Mhoon and
Commerce soils was unexpected because of their high fiber content
and low moisture (18.5 and 19.86 respectively). However, they re
sulted in a much dryer bagasse with a higher percentage of fiber.
Fiber % Cane
Table 31 shows the variation in fiber % cane with increasing
trash levels in cane. For any given type of trash, the quantity of
fiber in cane is directly proportional to the trash % cane. The
correlation coefficients ranged from 0.9852 to 0.9978. In all
cases the quantity of fiber % cane increased with increasing trash
% cane. The increase in fiber % cane for 10% added trash is shown
in Table 31 for the different types of trash. The regression equa
tion and correlation coefficient is also given.
These results are plotted in Figure 10. The increase in fiber
per cent cane approximately doubles for the low moisture types of
trash for 20 per cent trash in cane. This result is expected from
the material balance assuming the trash to contain 20 per cent
moisture. The much lower increase in fiber for the green leaves
is directly attributable to the lower fiber content (high moisture)
of the green leaves.
Juice Purity
Table 32 and Figure 11 show the variation in juice purity as a
function of trash % cane for the five different types of trash.
It would be expected that since the trash contains no pol, the
only effect of the trash on the juice purity would be to lower the
juice purity in proportion to the quantity of soluble solids in the
trash that dissolve in the juice during the pressing operation.
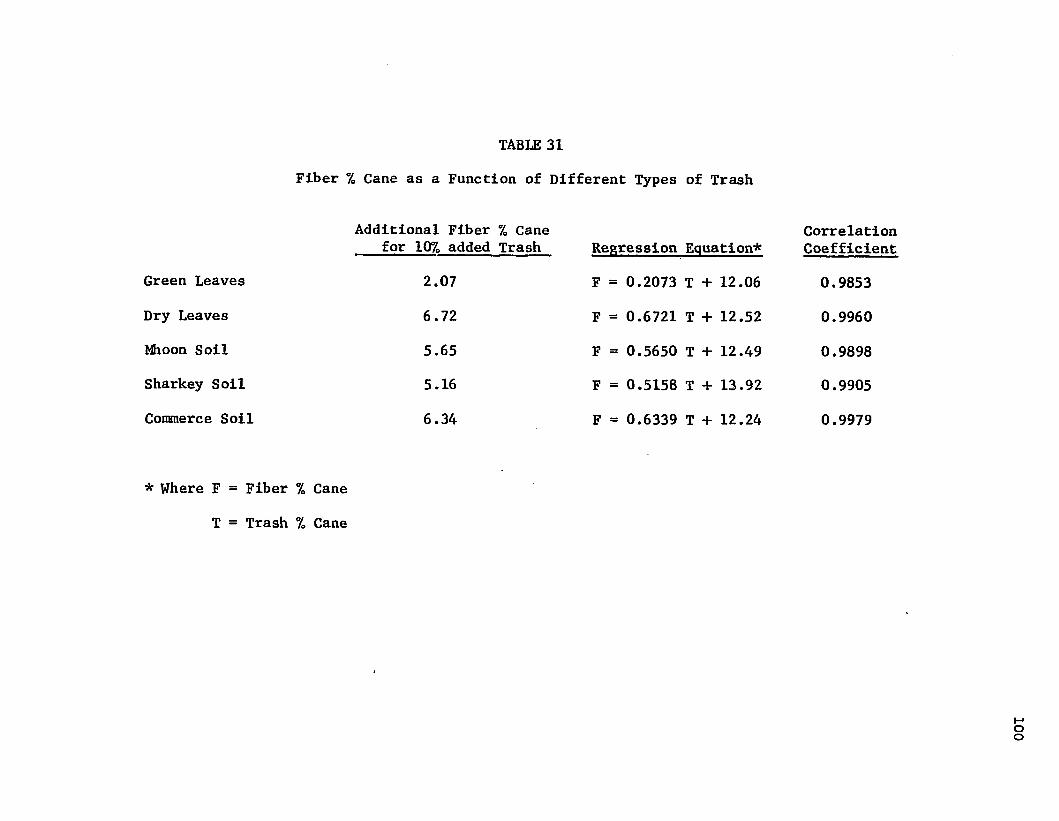
TABLE 31Fiber % Cane as a Function of Different Types of Trash
Additional Fiber % Cane Correlationfor 10% added Trash Regression Equation* Coefficient
Green Leaves 2.07 F = 0.2073 T + 12.06 0.9853
Dry Leaves 6.72 F = 0.6721 T + 12.52 0.9960
Mhoon Soil 5.65 F = 0.5650 T + 12.49 0.9898Sharkey Soil 5.16 F = 0.5158 T + 13.92 0.9905
Commerce Soil 6.34 F = 0.6339 T + 12.24 0.9979
* Where F = Fiber % Cane
T = Trash % Cane
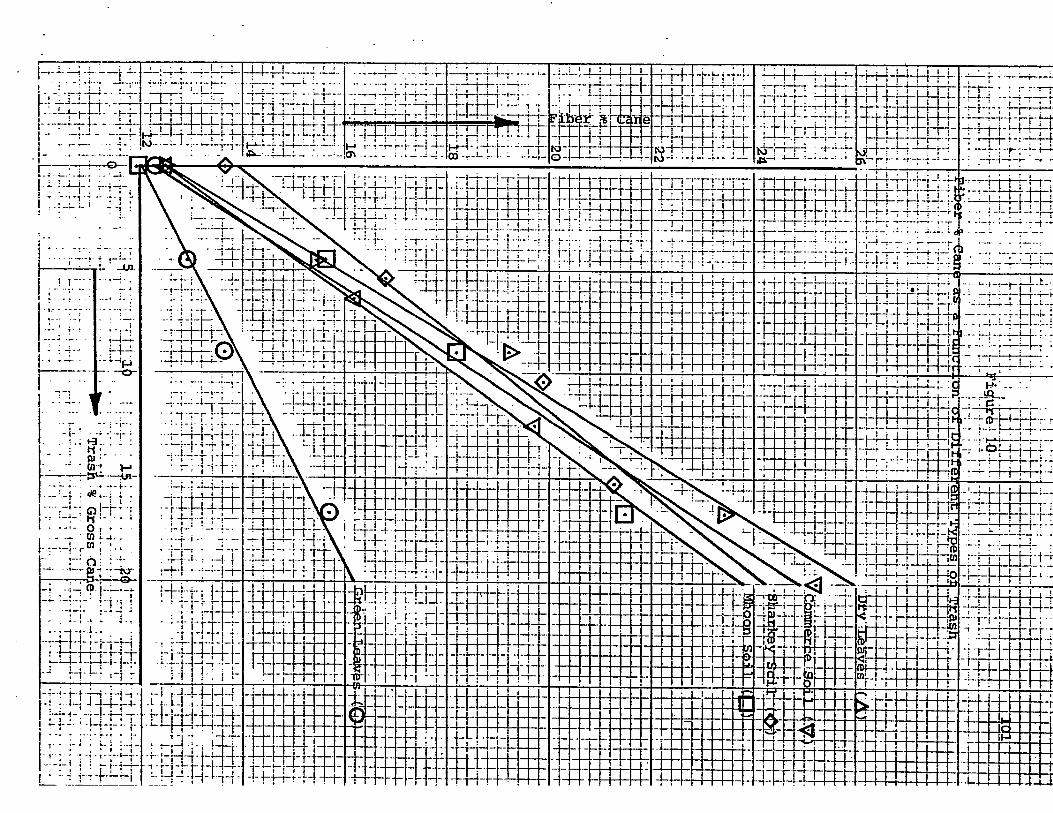
-1-f -!—I—i—r—j—I—!-Ki4--T— f-!i±tpr-uliq:
r Fiber- arte an r n r m
-H-H t-
4
t ti - j - h j - ; | -
3ftH + i - H - H
:■-H J-j+H--r::d:n-r
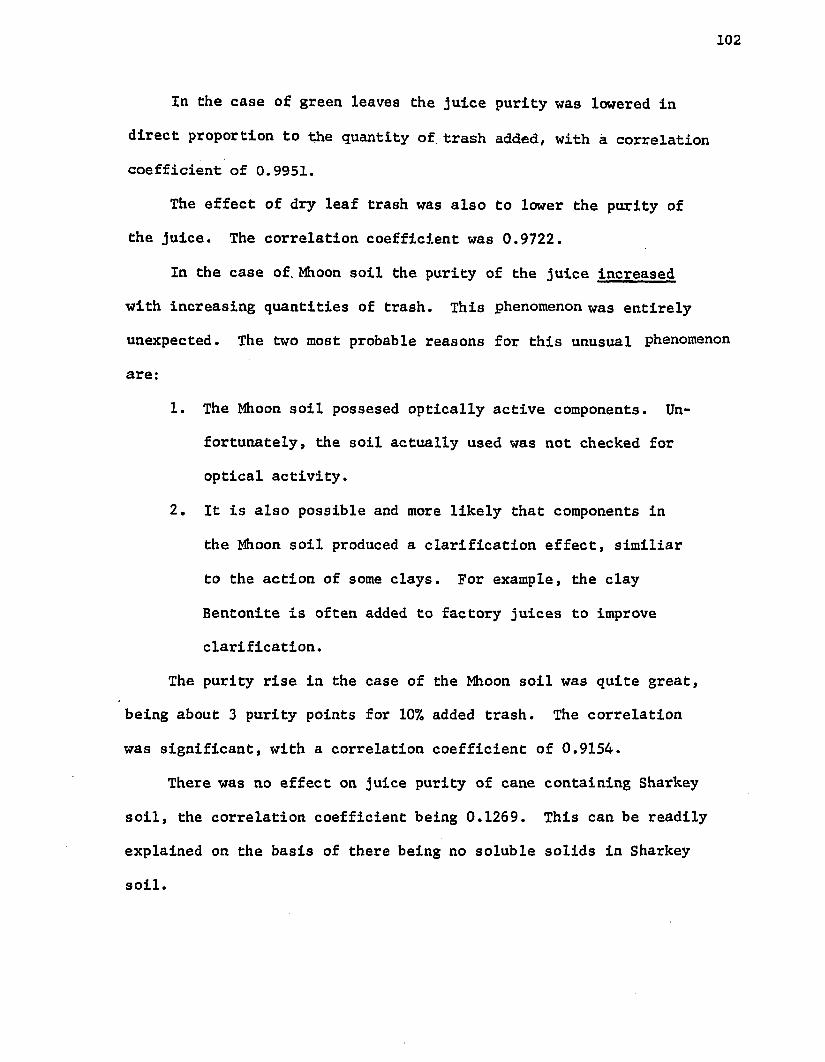
102
In the case of green leaves the juice purity was lowered in
direct proportion to the quantity of. trash added, with a correlation
coefficient of 0.9951.
The effect of dry leaf trash was also to lower the purity of
the juice. The correlation coefficient was 0.9722.
In the case of. Mhoon soil the purity of the juice increased
with increasing quantities of trash. This phenomenon was entirely
unexpected. The two most probable reasons for this unusual phenomenon
are:
1. The Mhoon soil possesed optically active components. Un
fortunately, the soil actually used was not checked for
optical activity.
2. It is also possible and more likely that components in
the Mhoon soil produced a clarification effect, similiar
to the action of some clays. For example, the clay
Bentonite is often added to factory juices to improve
clarification.
The purity rise in the case of the Mhoon soil was quite great,
being about 3 purity points for 10% added trash. The correlation
was significant, with a correlation coefficient of 0.9154.
There was no effect on juice purity of cane containing Sharkey
soil, the correlation coefficient being 0.1269. This can be readily
explained on the basis of there being no soluble solids in Sharkey
soil.
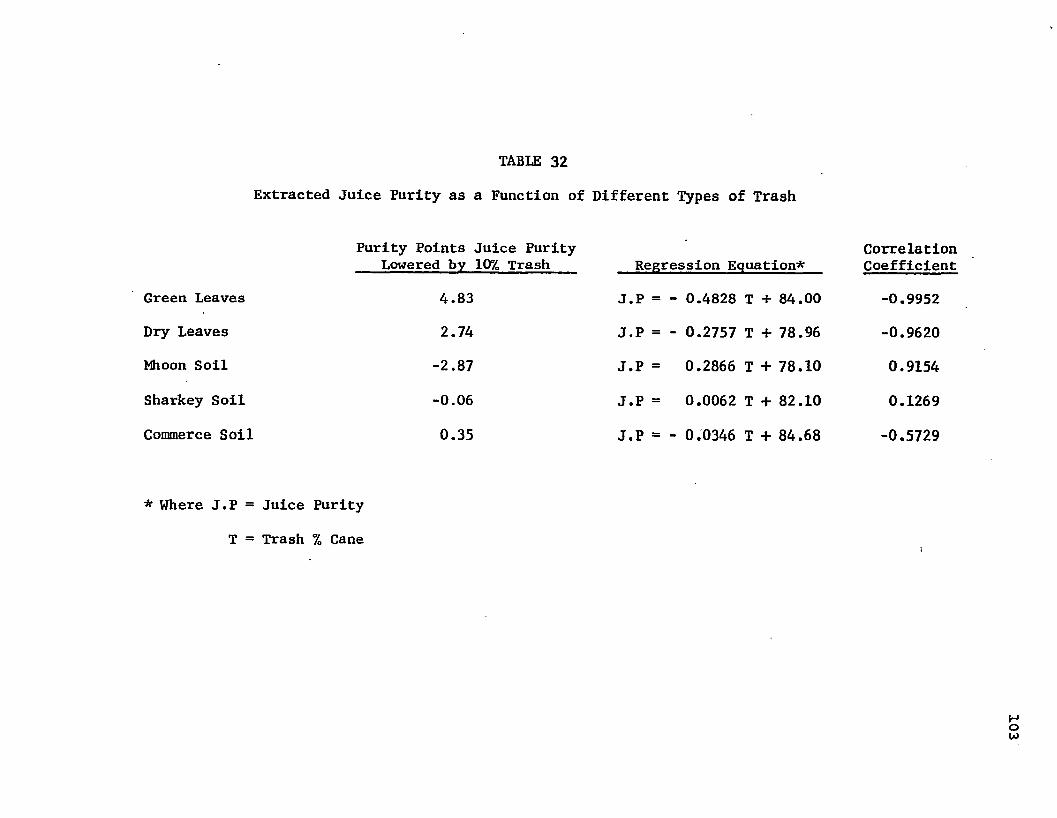
TABLE 32
Extracted Juice Purity as a Function of Different Types of Trash
Purity Points Juice Purity CorrelationLowered by 10% Trash Regression Equation* Coefficient
Green Leaves 4.83 J.P = - 0.4828 T + 84.00 -0.9952
Dry Leaves 2.74 J.P = - 0.2757 T + 78.96 -0.9620
Mhoon Soil -2.87 J.P = 0.2866 T + 78.10 0.9154
Sharkey Soil -0.06 J.P = 0.0062 T + 82.10 0.1269
Commerce Soil 0.35 J.P = - 0.0346 T + 84.68 -0.5729
* Where J.P = Juice Purity
T = Trash % Cane
103
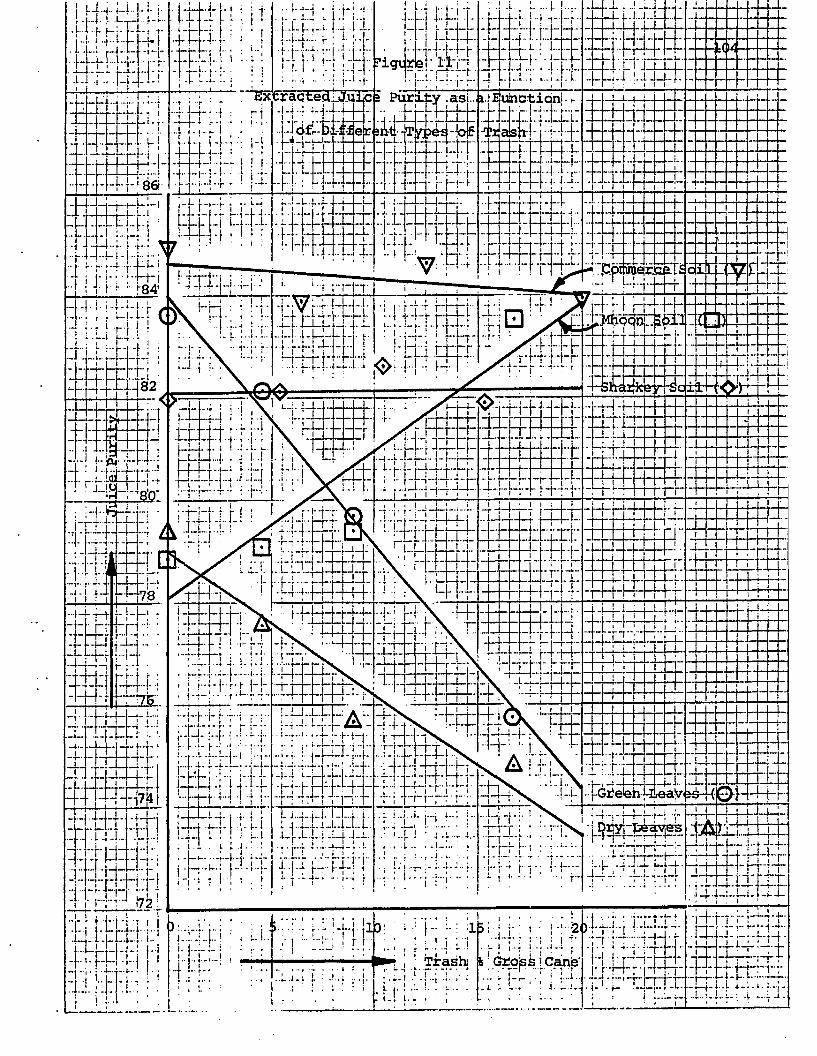
! f - 4 - i - i - i i-\ ,|... . I. . L _.1.1. '
■ r i g o j r t e i '
tjracteoi 2 Purxty .asLi.. Jp!nCtiqnjdft-Di-ffSeirre
t-Vh
I-’ 8v..! - L i - . i - ' '-1~ h r -
b t i
-'Ppiroe]:-r Lh-
a i c ^ m'444-h m -J ’ * ’84
.a&U .
_ L - 82
mmrZ U ~|.. i uB i v R I:;:.!
r— *-r- :
£
• r-; ri _L t.J. : . iT • ...i.. „.±».. .p. i_j.L’ '■; ; i ' ; '~l r j i Y " r r J u
-j i[y|-j3e'vjes' i ± t L u d . . L 4 f r M ± h; 1. i . I i i . : !
i _ p
Trashi fc; GKOjss [Cane"
I i , I ;:t:j i p . . , . . ,. -i—i—t .j_ nii—! -1--i-’- F H H 1i:,'; :'it
-i-U.'■ f f 4S + t-HH:p r- b t t t n n : ..4
105
The effect on juice purity of cane containing Commerce soil
trash was to slightly lower the juice purity. The correlation co
efficient was 0.5730, but this was not significant.
Pol 7» Cane
Table 33 and Figure 12show the variation in pol % cane as a func
tion of the trash % cane. In the case of all the types of trash the
pol-% cane was lowered in direct proportion to the quantity of trash
added. The correlation coefficients ranged from 0.9900 to 0.9996, all
highly significant.
The regression equation cane be used to obtain the smoothed
value for pol % clean cane by setting T = 0. Using this value of
the pol % cane, the pol % cane for various levels of trash can be
obtained assuming that trash contains no pol using a material balance.
This material balance value for the pol % cane can be compared with
the value from the regression equation. This comparison is shown
in Table 34 for a trash % cane of 10%.
Table 34 shows that the introduction of typical quantities of
trash introduce minor errors in the pol % cane values. In general
the trash added lowers the experimental value for pol % cane by
0.13 units less (1.22%) than would be expected from the material
balance. This can be considered to be very good agreement.
Pol Extraction
Table 35 and Figure 13 show the variation in pol extraction as a
function of trash % cane for various types of trash.
Table 35 shows the lowering of the pol extraction for 10% of
each type of trash added, together with the regression equation and
correlation coefficient.

TABLE 33
Pol % Cane as a Function of Different Types of Trash
Lowering of Pol % Cane by 10% added Trash
Green Leaves 1.09
Dry Leaves 0.99
Mhoon Soil 1.11
Sharkey Soil 1 18
Commerce Soil 1.21
* Where Pc = Pol % Cane
CorrelationRegression Equation* Coefficient
Pc = - 0.1094 T + 12.82 - 0.9900
Pc = - 0.0987 T + 11.27 - 0.9985
Pc = - 0.1105 T + 12.28 - 0.9996
Pc = - 0.1179 T + 13.68 - 0.9949
Pc = - 0.1209 T + 12.65 - 0.9967
T = Trash % Cane
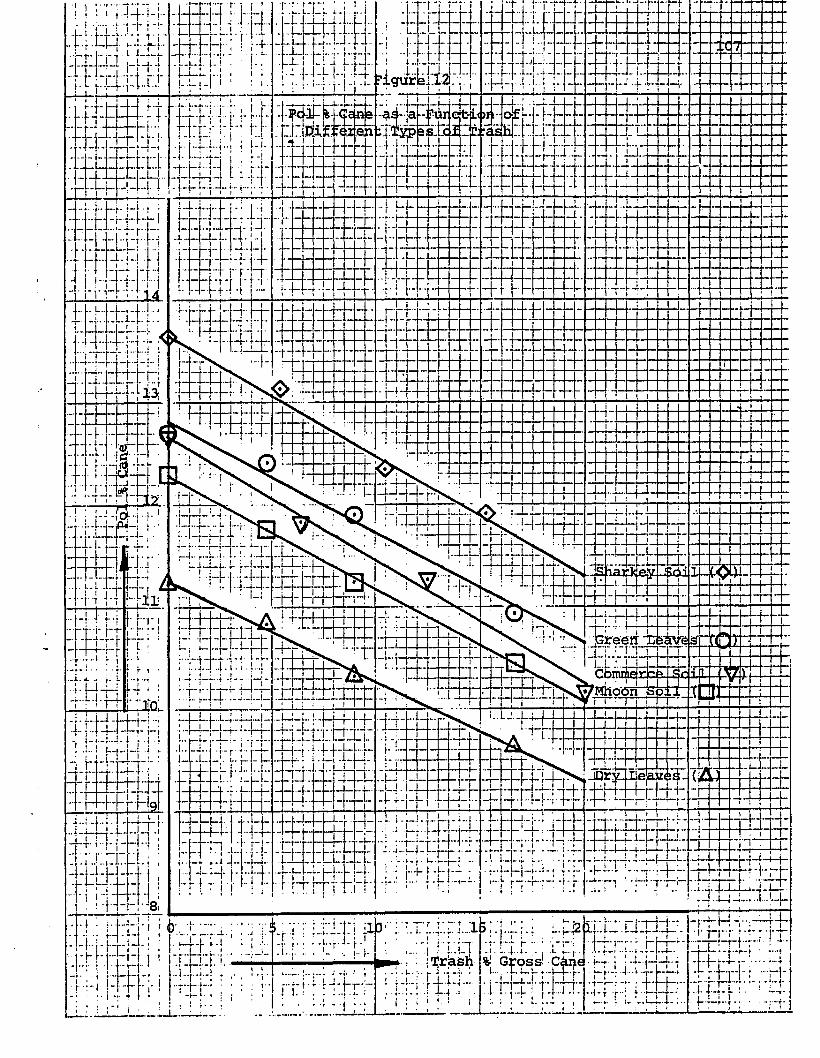
u .I ..I. ngure
- -
El IE
Tqxixr.p.iI ! > , i t I 1 , .
?T+ hr : . i X ! * U -
iptOW.Siaxk
brediT "Ceivej _ i : r n >L.J • i ICbmmejrlcfeMhoon
S
f
rq:rflT;I 1 • » ■ • : ir — _ ... . r .rrm
f—r-r-4 —L-1—rr j , i • . i xti:rix:.q_L-.i_.Hx_i.:. ...l
i i : : i r . r i x d : r.it .t t_*t-rrr:;.rn: 1 ± 0 ± !
± r -1-
f..4Gross' C^n<
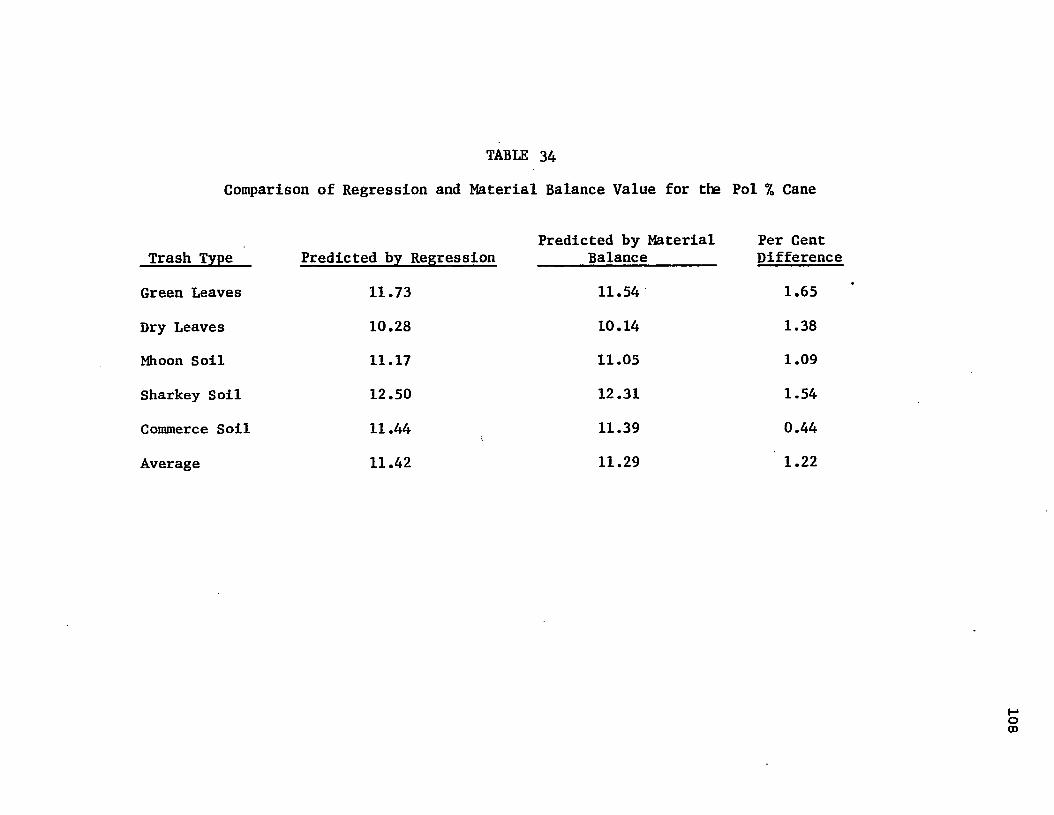
TABLE 34Comparison of Regression and Material Balance Value for the Pol % Cane
Predicted by Material Per Cent Trash Type Predicted by Regression Balance___________ Difference
Green Leaves 11.73 11.54 1.65
Dry Leaves 10.28 10.14 1.38
Mhoon Soil 11.17 11.05 1.09
Sharkey Soil 12.50 12.31 1.54
Commerce Soil 11.44 11.39 0.44
Average 11.42 11.29 1.22
108
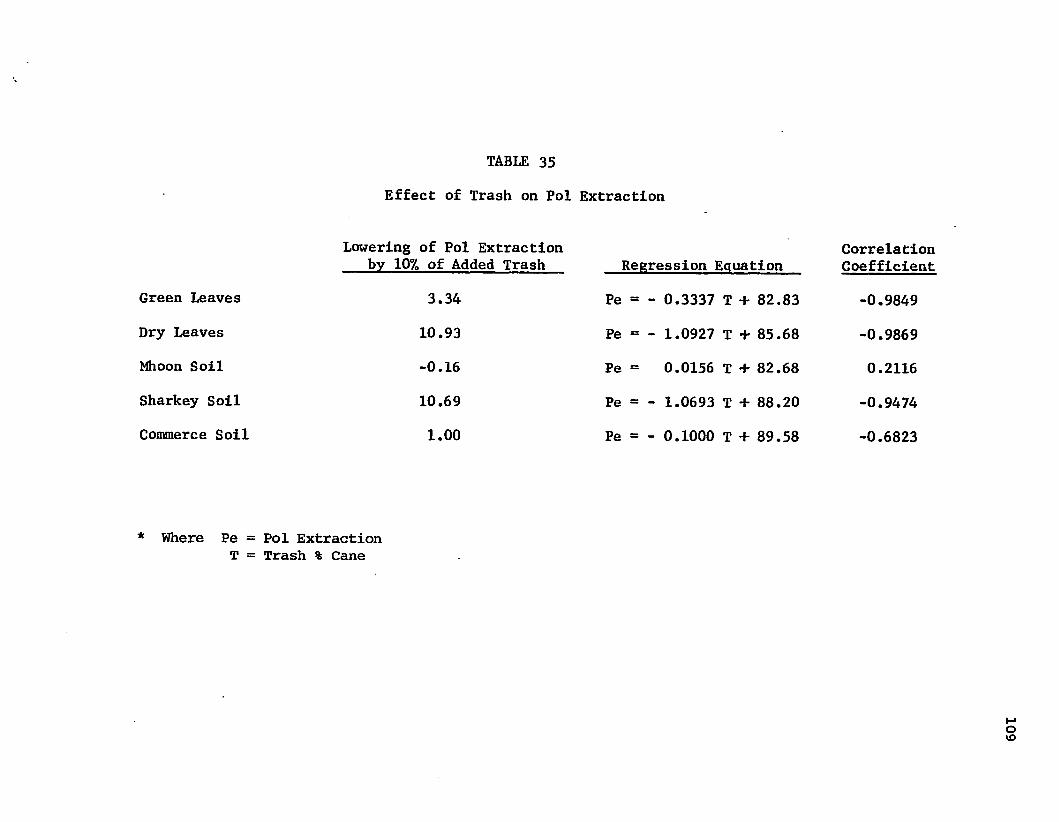
TABLE 35
Effect of Trash on Pol Extraction
Lowering of Pol Extraction Correlationby 10% of Added Trash Regression Equation Coefficient
Green Leaves 3.34 Pe = - 0.3337 T + 82.83 -0.9849Dry Leaves 10.93 Pe = - 1.0927 T + 85.68 -0.9869Mhoon Soil -0.16 Pe = 0.0156 T + 82.68 0.2116Sharkey Soil 10.69 Pe = - 1.0693 T + 88.20 -0.9474Commerce Soil 1.00 Pe = - 0.1000 T + 89.58 -0.6823
* Where Pe = Pol Extraction T = Trash % Cane
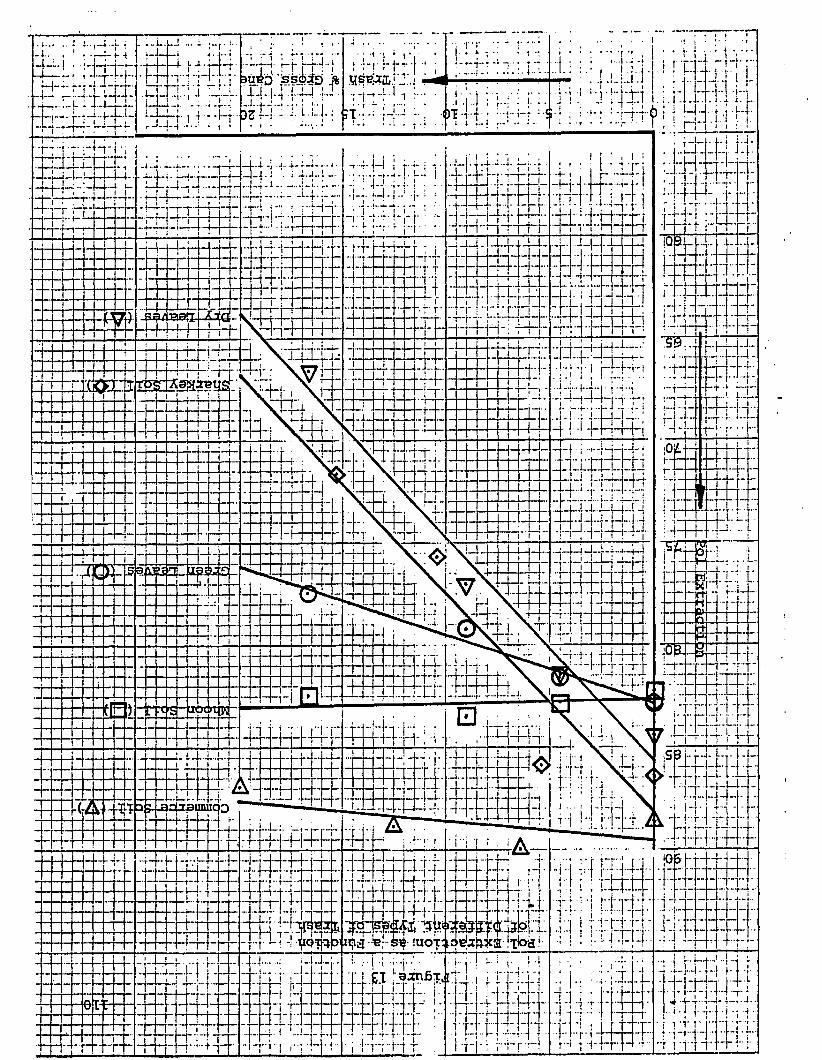
i ] ;-i-; i eui'D "s'fejjtfs j% 5 i ~ r . i j . i . • r i i i i
HSBJlL.' j".; «i . * t j l ; 1 i . i . ii . ' : i j. ‘ :
i ! i i i r i tr.J . 4 ”f -J- -i.— »■—+••••• i •
| \4 n * r ; : r : q - * “
t
-P^Laam-AJts-r H
3B59S
fTt LTOOUM"
I d:.i:j::i
-3p njis ■ar s- - iuot: *xk>a i
^Qjcnfix, [T i ■4-j— f- f -
- H t H. . , . 1 . . .41 » 1 * • • •
-r 1 "|"T
Ill
For a given quantity of trash, the pol extraction would be ex
pected to decrease in proportion to the fiber content of the trash
assuming constant moisture per cent bagasse. However, if moisture
per cent bagasse decreases then this would tend to increase the ex
traction by lowering the juice lost in the bagasse.
Dry leaves have the greatest effect on reducing the pol ex
traction, with Sharkey soil a very close second.
The effect on pol extraction of green leafy trash was only a
third that of the dry leaves and Sharkey soil.
Commerce soil has a small but insignificant effect on the pol
extraction— being only a tenth that of dry leaves and Sharkey soil.
Mhoon soil caused a very slight increase in the pol extraction,
but it was not significant. The reason for the small effect on pol
extraction of the Mhoon soil and Comnerce soils was that the pol ex
traction reducing effect of the higher fiber was offset by the
greatly reduced moisture in bagasse (and thus less juice) caused by
these types of soil.
Bagasse Moisture
Table 36 and Figure 14 show the variation in bagasse % moisture
as a function of trash % cane.
The effect of the three soils on the bagasse 7, moisture un
expected, and contrary to the expectations of many mill operators.
The regression equations and correlation coefficients for the
effect of type of trash is given in Table 36 together with the effect
on the moisture of 10% of each type of trash.
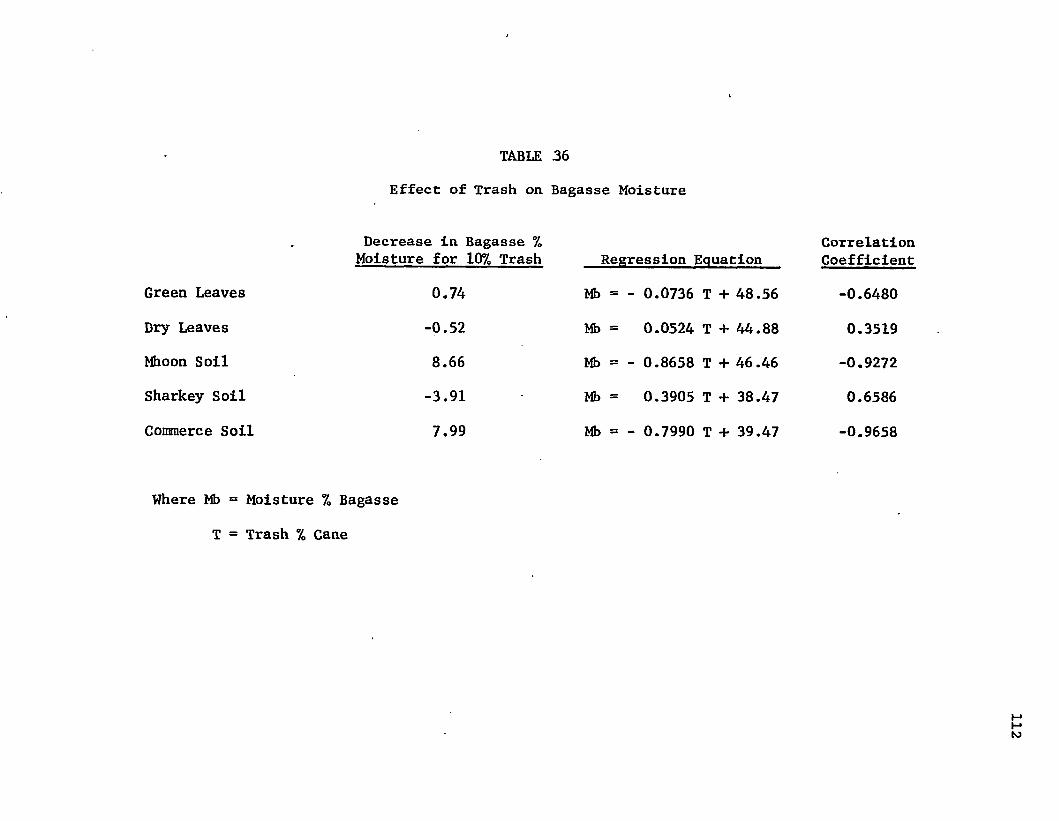
TABLE 36Effect of Trash on
Decrease in Bagasse % Moisture for 10% Trash
Green Leaves 0.74
Dry Leaves -0.52
Mhoon Soil 8.66
Sharkey Soil -3.91
Commerce Soil 7.99
Bagasse Moisture
CorrelationRegression Equation Coefficient
Mb = - 0.0736 T + 48.56 -0.6480
Mb = 0.0524 T + 44.88 0.3519
Mb = - 0.8658 T + 46.46 -0.9272
Mb = 0.3905 T + 38.47 0.6586
Mb = - 0.7990 T + 39.47 -0.9658
Where Mb = Moisture % Bagasse
T = Trash % Cane
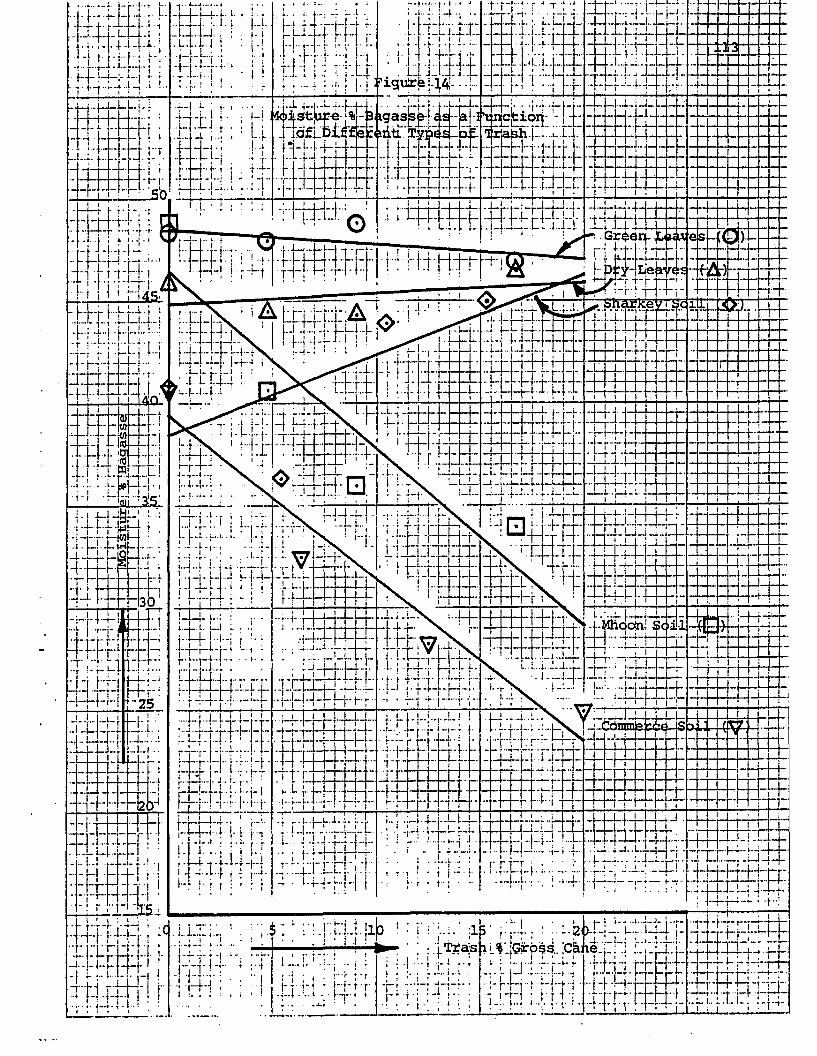
i ’ l l - l • . m . . ! ' | . J . ' . i . i 4 - _ u . - L..LLL-ll-.j ' -u..U : i . .4 U i X .|.u -L + U - i - X - ; X 4 < ! ; i - i P - H - r r r 1- ■*11 j-j-H
i li’igufc
- 3< igas 1'iuct1xtala
.1.
± l ± ; ’ii“i4 i;— }— r , - f t Gr$er^|L-wia es
r4 —r -r-r r-T-' ■ rrT-
. 1 1 1 4 5-j h ± S l- p i T 4 f i - a, r ^ p z [ - y L
n i aq
1 ' •“ImLils
4
Mhooin" H
r : | r ; :
4_j.-Li.a_T i Li_i. '7 ■ !--!-•--:—!—-I—
t " : 1 L 1 I il-7--| T P 1
udJrtfnUi:x.r.tUjiD- i ■ i j ~ : iTras
t - i i + p hi.. t14 i -i 1 H - r r1 - -•!— p.« •
1-2 )- . ,. j-U'---• i .-k a .._L; '...i-i— i %;Grpas.. .C iie.i- I I i i . i i
t - W ' F ■ i T F F ^ S
I I * j : I t I" T T ^ " ~Ti i i-' i F L*|_ — a p 7 — — (—
E E E 4 E Ei.. j-m-> . t > • »
114In the case of the green leafy trash the effect was a small but
insignificant decrease in the moisture % bagasse with increasing
trash levels. The effect of dry leafy trash on the bagasse moisture
was the opposite of that for green leaves but of the same magnitude,
and it too was not significant.
Mhoon soil trash produced a dramatic decrease in the bagasse
moisture. The bagasse moisture fell from 48.8% for clean cane to 33.9%
for 16.6% trash, giving a decrease of 8.66% in the bagasse moisture for
10% added trash. The correlation coefficient was 0.9272, but the plot
appeared quadratic rather than linear indicating an asymptotic approach
to the 18.5%.moisture in the soil.
This result can be explained by assuming that Mhoon soil consists
of small hard dry particles which are distributed throughout cane
bagasse of 'normal* moisture.
The effect on bagasse moisture of Commerce soil trash was very
similar to that of the Mhoon soil. Ten per cent of Commerce soil
caused a reduction in bagasse moisture of 7.99%. The correlation co
efficient was 0.9658. The explanation for this reduction is similar
to that for the Mhoon soil.
The effect on bagasse moisture of Sharkey soil was anomalous.
For low trash quantities (5% trash) the bagasse moisture decreased,
while at higher trash levels the bagasse moisture increased. Over the
trash range investigated the predominant effect was one of increasing
the bagasse moisture. In view of the apparently anomalous effect on
bagasse moisture of Sharkey soil, the test was repeated on a
different cane sample, with virtually identical results with the
minimum moisture occurring at the 5% trash level. On the average 10%
115
of Sharkey soil trash increased the bagasse moisture by 3.91%. The
correlation coefficient of 0.6586 was not significant.I
Discussion of Press Response to Trash
The preceding data and tabulations show that different types
of trash have a marked influence on several of the cane quality
parameters such as pal % cane, fiber % cane, and juice purity.
The different types of trash also exhibit an effect on the mill
performance other than those attributable to cane analysis, for
example the effect on the pol extraction and on the moisture per
cent bagasse.
The conventional cane payment method used in Louisiana is based
entirely on juice quality and per cent trash in the gross cane.
Since juice quantity (reflected by fiber % cane) and mill perfor
mance (also related to fiber % cane) are not considered in the
valuation of cane by the conventional method the question of how
good the present method is should be considered.
In comparing the core-press method with the conventional method,
the most suitable basis for comparison is recoverable sugar. Under
the Sugar Act a sample mill juice analysis and trash per cent gross
cane together with factors relating sample mill juice quality to
factory mill juice quality were used in calculating the standard
tons of cane per ton of gross cane. The payment for cane was then
based on a predetermined price for a standard ton of cane. The
average yield of 96° sugar per standard ton was used in developing
the cane payments. This yield of 96° sugar per standard ton was very
116
constant, and at the time of the demise of the Sugar Act in 1975, the
yield was 165.3 pounds per standard ton.
In comparing how the yields of 96° sugar per gross ton of cane
by core-press method and conventional method differ, the data from
Tables 25-29 is used. The core-press yield is calculated by the
Method I developed in Chapter VI. The conventional yield is calcu
lated by assuming that the core-press juice quality is equal to that of
the factory juice. These yields are shown in Tables 25-29.
The predicted yield of 96° sugar per gross ton of cane by the
core-press and conventional methods as a function of quantity of
trash is shown in Figure 15 for green leaf and dry leaf trash. The
data shows that for a given quantity of green leaf trash the re
duction in predicted sugar yield is greater for the conventional method
than for the core-press method, while the reverse is true for dry
leaf trash. The regression yield equations are summarized in Table
37.
The lowering of the sugar yield in the case of the conventional
method for dry leaves was 20.52%. If dry leaves contained no fiber
or purity lowering soluble solids the sugar yield would theoretically
fall by 20%. But since dry leaves do contain a very high percentage
of fiber and since they do lower the juice purity the yield for cane
containing 20% dry leaf trash should decline considerably more than
the 20.52% indicated by the conventional method. Similarly, the
lowering of the sugar yield for green leaf trash in the case of the
conventional method is higher than would be expected.
The yield of sugar (valuation of cane) by the conventional
method in the case of field soil type trash is similar to that of
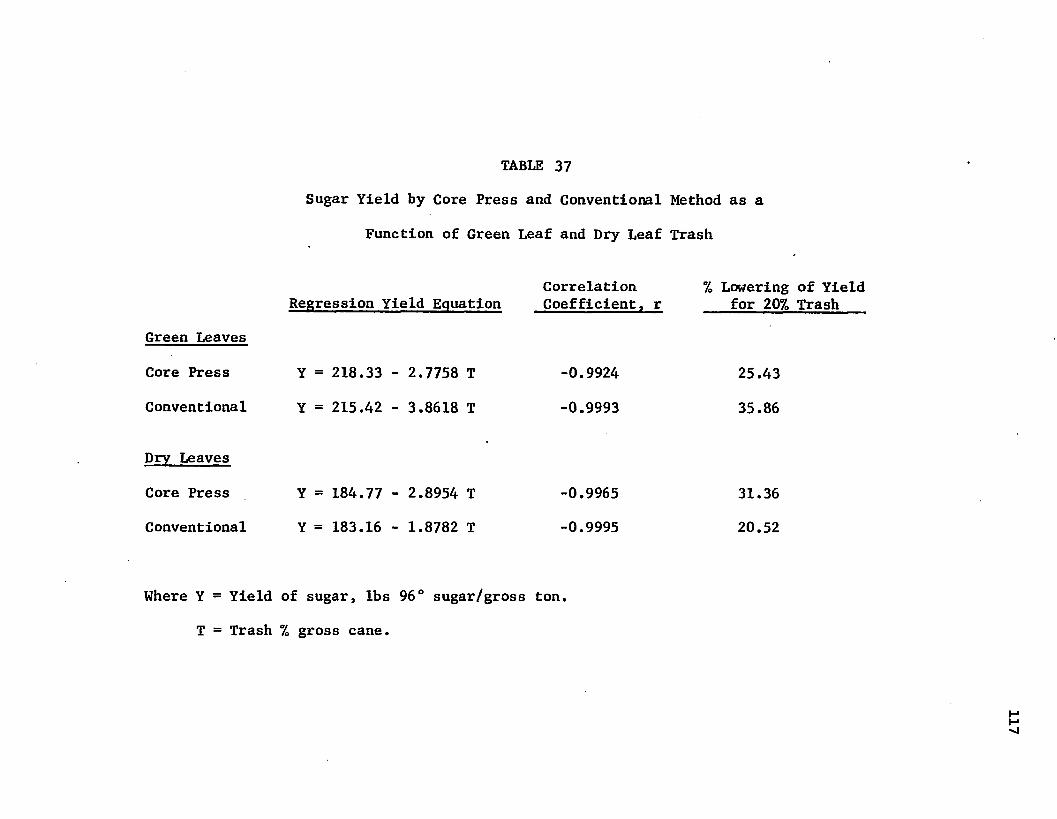
TABLE 37
Sugar Yield by Core Press and Conventional Method as a
Function of Green Leaf and Dry Leaf Trash
Green Leaves
Core Press
Conventional
Correlation % Lowering of YieldRegression Yield Equation Coefficient, r for 20% Trash
Y = 218.33 - 2.7758 T
Y = 215.42 - 3.8618 T
-0.9924
-0.9993
25.43
35.86
Dry Leaves
Core Press
Conventional
Y = 184.77 - 2.8954 T
Y = 183.16 - 1.8782 T
-0.9965
-0.9995
31.36
20.52
Where Y = Yield of sugar, lbs 96° sugar/gross ton.
T = Trash % gross cane.
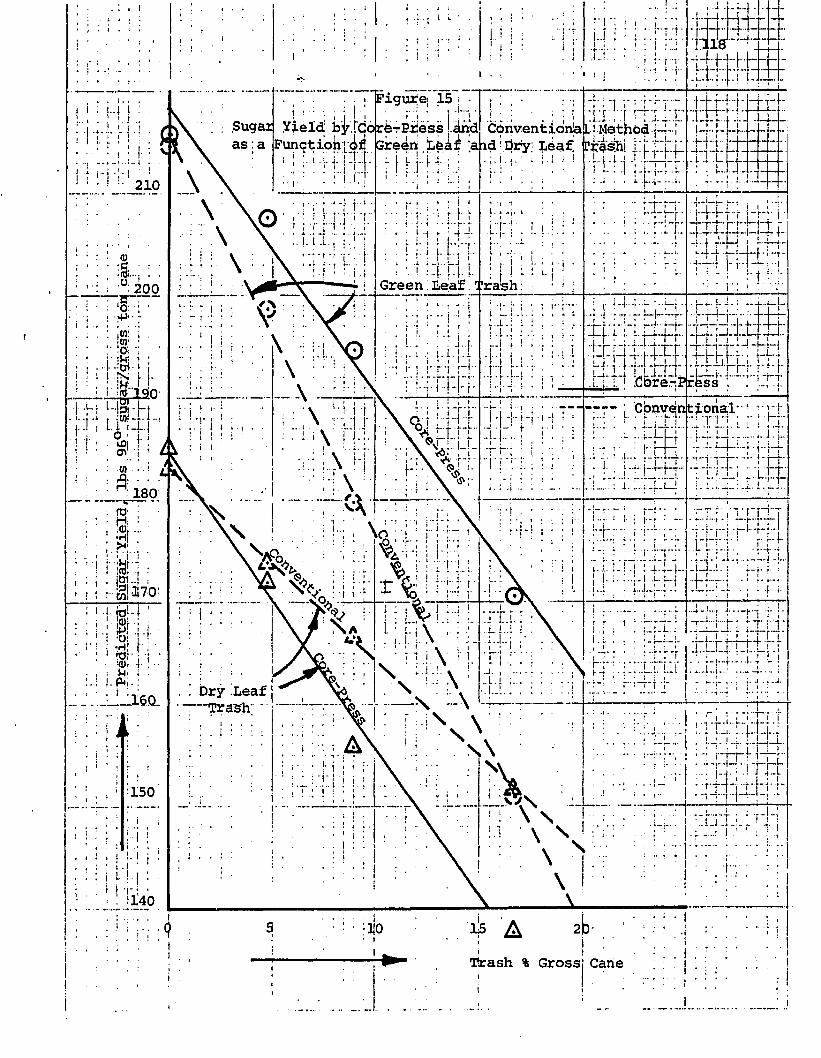
Figure 15; , : n . ; : v rri::.iCOnvent ioriajL• j Method {-I-!Yield; b’y.fCc
Function! L : .
u , . !.: : ~ + + J -
Li. '..lljXI--*-1-;-Xl.i i Li_i_LTP / H t H ' 1.1unitfflmu.'.;-.:-.I.!.1 .Core-.Prfess : .
(•-'B-i i
rr~ [ Cpnvejntional*-' •; r —rr j :. .. e-i.-•*i-i• r f - h ' - l i - H
■ " 1 1 4-H-
L. 1 I—L.{
: 180
I ! I i I ! Iitnv .q::r
I i-H"i S!017O:
r t ; r r n:<u:. ipi .jI U ! '
' : ' ■ 1 r [ ! ! I: :.”p":rn±t I 1 ’ • I I > I
;-4Trash % Gross! Cane
119
dry leaf trash, but the magnitude of the overvaluation is not as
great.
It should be pointed out that in these tests the trash was
weighed and added to prepared gross cane, and is thus accurate. In
the application of the conventional method trash is determined by
removal from gross cane, and it has been shown that this method
underestimates the true trash content. The effect of underestimation
of the trash results in overvaluation of the cane by the conventional
method.
120
Summary
The effect that trash has on cane quality parameters and on
sugar yield is highly dependent on the type of trash (green leaves,
dry leaves, or type of soil). The ability of the hydraulic press to
respond appropriately to the different types of trash make it superior
to the conventional system which considers all trash to have equal
detrimental effects.
The effects of the five different types of trash studied are
summarized below:
1. All types of trash increase the quantity of bagasse produced
(i.e. decrease the yield of juice). Dry leaves and Sharkey
soil showed about double the increase in bagasse % cane when
compared to the effect of green leaves, Mhoon soil and
Commerce soil.
2. All types of trash increased the 'fiber' intcane, with
green leaves showing about one third the increase when
compared with the other four types of trash.
3. Commerce and Sharkey soil exhibited no effect on the purity
of the juice. Green and dry leaves significantly lowered the
juice purity, while Mhoon soil significantly improved the
juice purity (presumably the effect of the clarifying action
of this clay).
4. All types of trash reduced the pol % cane in direct
proportion to the degree that would be expected by the
addition of an inert diluent material.
5. Dry leaves and Sharkey soil lowered the pol extraction in
121
direct proportion to the quantity of trash. The effect of
green leaves on the pol extraction was about one third that
of the dry leaves or Sharkey soil. Mhoon and Commerce soil
had no effect on the pol extraction.
6. Commerce and Mhoon soil significantly lowered the moisture
content of the bagasse. Green leaves, dry leaves and Sharkey
soil had only an insignificant effect on the bagasse moisture.
The effect of green and dry leaf trash on the predicted sugar
yield for the core-press and conventional methods is compared. The
comparison demonstrated that both methods accurately predict the sugar
yield for clean cane, but that in the case of the conventional sampling
method the trash introduces serious errors in the predicted sugar yield
for normal quantities of trash. In the case of green leaves the
conventional method under-predicted the sugar yield, while for dry
leaves the sugar yield was over-predicted.
CHAPTER VIII
COMMERCIAL SCALE CORE STUDIES
The 1972 and 1973 pilot-scale core sampling studies indicated
that the core method was superior to the present Louisiana cane
sampling system. In 1974 the United States Department of Agriculture
(which supervises the sampling and testing of sugar cane for payment)
representatives stated publicly that they wanted to go on record as
being in favor of the core method, but they requested that commercial
scale studies be performed in Louisiana against the present system
to obtain further data comparing the conventional and proposed core-
press system.
The American Sugar Cane League which represents both the growers
and processors expressed interest in core sampling. Both the United
States Department of Agriculture and the American Sugar Cane League
were in favor of having parallel commercial scale studies performed
to compare the core method with the conventional method at the same
time in the same factory under the same conditions. The objective
was to obtain data comparing both systems with actual factory per
formance, as well as to gather data comparing the returns to indivi
dual growers over an extended period of time by each of the two
methods.
To satisfy the requirements of the U. S. Department of Agriculture
(representing the government) and the American Sugar Cane League
(representing growers and processors) a commercial test program was
developed. The cost of the building and personnel required for the
122
123
commercial testing ($20,000) were to be borne by the American Sugar
Cane League, while the corer and equipment would be provided by a
corer manufacturer (J&L Engineering Co.). The management and growers
at Cinclare Central Factory agreed to Cinclare as the site for the
tests. The Audubon Sugar Factory at Louisiana State University made
available the laboratory equipment and technical assistance.
The testing started on November 4, 1974. The training of the
operating personnel, and a gear reducer failure on the coring machine
delayed full scale data collection until November 14, 1974. Testing,
continued until December 11, 1974.
Procedure
The Conventional Sample: ' The testing procedure consisted of obtaining
samples from the same deliveries that were used by Cinclare for their
standard cane quality evaluation. The trash per cent gross cane,
and the sample mill juice analyses were performed in the usual manner.
From the trash % gross cane and the juice analysis, and factors re
lating the sample mill juice to the factory normal juice the standard
to gross ton ratio was determined and used for payment of cane.
This method is given in the Appendix.
Because of the cane yard traffic flow problems at times, it
was not always possible to obtain samples from the same vehicle for
each sampling method.
The Core Sample: The sampling of each vehicle consisted of obtaining
a single core sample from a random position in the truck or cart.
Single samples were used for the core method since single samples
were being employed by Cinclare for the conventional method.
124
From the juice analysis, quantity of bagasse and bagasse moisture
the cane analysis was obtained by the core-press method as described
in the Appendix.
Discussion of Results
The data gathered in these investigations can be used to
1. Compare the predicted cane quality by each method
directly with factory cane quality parameters as
determined by the factory.
2. Compare the core method with the conventional
method.
In the comparison of the two methods of sampling with the
factory operations the primary areas for comparison are
1. The sugar yield.
2. The juice analysis
a. Comparison of Juice Pol.
b. Comparison of Juice Purity.
In the discussions that follow it will be shown that the core-
press. sampling method is superior to the conventional method in pre
dicting the commercial factory performance. Then, in view of these
results and those discussed in the preceeding chapters it will be
assumed that the core-press method is the more appropriate method for
cane quality evaluation. The core-press sampling method will then be
compared directly with the conventional sampling method on an overall
basis as well as on a grower by grower basis. The results of this
comparison will show that the conventional system under values high
quality cane and over values poor quality cane. The conventional
125
sampling method will thus be shown to operate as an inequitable semi
incentive system.
In reviewing the comparisons that follow, two points should be
mentioned.
a) The core sampling was not as comprehensive as the conven
tional sampling, since it was not possible to sample some
growers. In particular, one grower shipped cane in trucks
that had been widened so that they could not negotiate the
approach turn into the corer without hitting the corer
structure. Other shippers used trucks with a single rear
axle to haul very large loads, and the trucks had diffi
culty in leaving the corer after sampling. On several
occasions these trucks had to towed out, consequently on
days when the road conditions under the corer were bad
(rainy days) these trucks could not be sampled by the corer.
b) As applied commercially the conventional method utilizes
moving six day average sample mill factors which tend to
correct the average sample mill factors to the factory
results. This "feedback" control should tend to improve the
correlation between the factory and the conventional sample
method data.
Direct Comparison of the Gore and Conventional Sampling Methods
Comparison of the Core Yield with the Conventional Yield: The core
yield is expressed in the yield of 96° sugar per gross ton of cane,
while the conventional method's yield is expressed in terms of the
standard to gross ton ratio. The weighted daily average values for
126
each method are shown in Table 40. The regression equation is shown
in Table 38 and and the correlation coefficient is shown in Table 39,
where the correlation coefficient is given as 0.4851. Although this
represents rather poor agreement between the two methods, the
correlation is significant at the 0.02 level.
Comparison of Core Fiber % Cane with Trash % Gross Cane by the
Conventional Method: As shown earlier, the pol extraction of milling
tandems is related to the fiber % cane. In general, the pol lost in
the bagasse is directly proportional to the fiber % cane. Thus to
account for the effect of fiber % cane on the pol extraction and hence
on the predicted recoverable sugar some determinable quality factor
should permit this affect to be taken into account. In the conventional
method the testing procedure involves only the juice analysis (pol and
purity) and the trash % gross cane. From the results of the effect of
trash given in Chapter VII it is clear that the trash % cane cannot be
used to infer the fiber % cane.
The fiber % cane value obtained by the core method directly allows
the juice quantity to be obtained, since the juice, by definition,
is the cane minus the fiber. Further, the fiber % cane can be used to
predict the pol extraction.
A good correlation between the fiber % cane from the core method
with the trash % cane from the conventional method would indicate that,
in a devious manner, the conventional method was accounting for the
juice quantity. Such a correlation, however, would still not allow
the pol extraction to be predicted from the trash % cane.
The fiber % cane and the trash % gross cane are tabulated in
Table 40 on a daily basis (weighted average of individual daily
samples). The regression equation is given in Table 38. The
correlation coefficient for this data was 0.0788 (Table 39). This
very low value of the correlation coefficient indicates that there is
absolutely no relationship between the fiber % cane and the trash %
gross cane.
The same conclusion could have been reached by considering the
data in Chapter VII, where the increase in fiber % cane was directly
proportional to the trash % gross cane, but where the increase in
fiber % cane was a function of the type of trash. In Table 31 of
Chapter VII the increase in fiber % cane for each 10% trash in gross
cane for several different types of trash are as follows:
Type of Trash Increase in Fiber % Cane for 10% Trash
Green Leaves 2.07
Dry Leaves 6.72
Mhoon Soil 5.65
Sharkey Soil 5.16
Commerce Soil 6.34
Since the fraction of green leaves in the deliveries varies
greatly it is obvious that no relationship between trash % cane and
fiber %, cane should be expected.
The inability of the conventional method to allow the determina
tion of the quantity of juice in cane is a serious limitation.
The lack of any correlation between the trash per cent cane and
the fiber per cent cane indicates that inequities in the payment for
128
cane by the conventional method will result when the fiber in cane
varies.
Core Juice Pol versus Conventional Juice Pol: The average core juice
pol was 13.53, while the average conventional sample mill juice pol
was 15.96, by comparison the factory normal juice pol was 12.45.
The correlation coefficient between the core juice pol and the
conventional juice pol was 0.7240 which was significant at the 0.01
level. The regression equation is shown in Table 38.
Core Juice Purity versus Conventional Sample Mill Juice Purity: The
average core juice purity was 84.75, while the average conventional
sample mill juice purity was 86.40, by comparison the factory normal
juice purity was 78.52.
The correlation coefficient between the core juice purity and
the conventional juice purity was 0.3119 which was not significant.
Comparison of the Core and Conventional Sampling Methods with the
Factory Performance
The core and' conventional methods give sugar yield estimates
and juice analyses (pol and purity) which can be directly compared
with the factory performance. These relationships are presented in
Table 38, while the correlation coefficients are tabulated in Table 39.
With the exception of the juice pol relationship, the core-press
method consistently gave a more significant correlation.
129
Comparison of Core and Conventional Sampling Methods by Grower
Table 41 presents the average core yield and the average conven
tional yield by grower. In this table runs of fewer than four days
of cane delivery were excluded, and the deliveries by large growers
were broken down by area with each area being considered as a
separate "grower".
The regression analysis on the comparison of the yields by the
two methods yields:
Conventional Yield = 0.5934 (Core Yield) + 60.74
(r = 0.7024)
(Standard deviation of the estimate = 7.12 lb/ton cane)
The predicted conventional yields (CRS) for core yields between
100 lb/gross ton cane and 250 lb/gross ton cane are shown in Table 42.
The range in the core yields is much greater than the range in the
conventional yields. The conventional method gives yields of 59.34%
of the core yield plus 60.74 lbs sugar/gross ton cane. The conven-* •
tional method can be regarded as a combination of an incentive and a
"flat rate" payment system. The incentive part contributes 59.34%
of the grower's share of the sugar, while the "flat rate" part contri
butes a fixed yield of 60.74 lbs/gross ton. For average quality cane
(yielding 150.4 lbs sugar/gross ton cane) the incentive part contributes
89.25 lbs sugar/gross ton. It should be noted that for average cane
(actually cane yielding 149.4 lbs/gross ton cane) both methods predict
the same yield.
This means that high quality cane is not being adequately re
warded, while poor quality cane is being subsidized. This is an
unfortunate situation, since it inhibits efforts to improve cane quality.
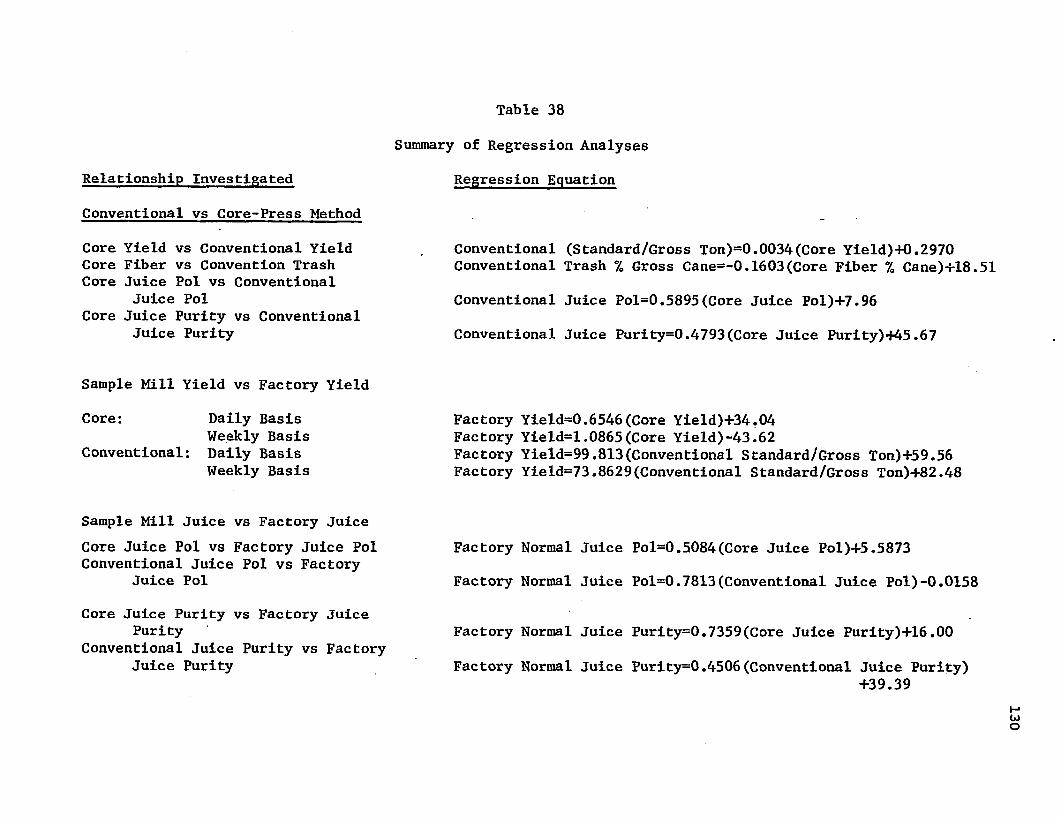
Table 38
Relationship Investigated
Conventional vs Core-Press Method
Core Yield vs Conventional Yield Core Fiber vs Convention Trash Core Juice Pol vs Conventional
Juice Pol Core Juice Purity vs Conventional
Juice Purity
Sample Mill Yield vs Factory Yield
Core:
Conventional:
Daily Basis Weekly Basis Daily Basis Weekly Basis
Summary of Regression Analyses
Regression Equation
Conventional (Standard/Gross Ton)=0.0034(Core Yield)40.2970 Conventional Trash % Gross Cane=-0.1603(Core Fiber % Cane)+18.51
Conventional Juice Pol=0.5895(Core Juice Pol)+7.96
Conventional Juice Purity=0.4793(Core Juice Purity)+45.67
Factory Yield=0.6546(Core Yield)+34.04 Factory Yield=l.0865(Core Yield)-43.62Factory Yield=99.813(Conventional Standard/Gross Ton)+59.56 Factory Yield=73.8629(Conventional Standard/Gross Ton)+82.48
Sample Mill Juice vs Factory JuiceCore Juice Pol vs Factory Juice Pol Conventional Juice Pol vs Factory
Juice Pol
Core Juice Purity vs Factory Juice Purity
Conventional Juice Purity vs Factory Juice Purity
Factory Normal Juice Pol=0.5084(Core Juice Pol)+5.5873
Factory Normal Juice Pol=0.7813(Conventional Juice Pol)-0.0158
Factory Normal Juice Purity=0.7359(Core Juice Purity)+16.00
Factory Normal Juice Purity=0.4506(Conventional Juice Purity)+39.39
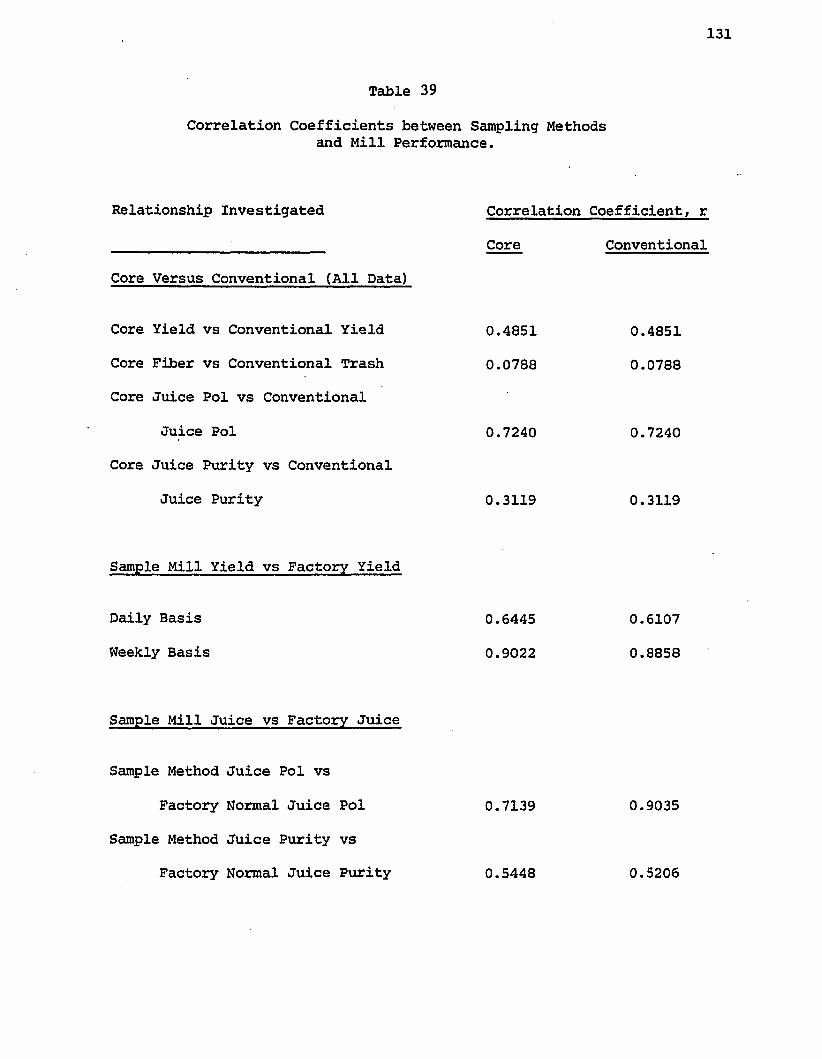
131
Table 39
Correlation Coefficients between Sampling Methods and Mill Performance.
Relationship Investigated
Core Versus Conventional (All Data)
Core Yield vs Conventional Yield
Core Fiber vs Conventional Trash
Core Juice Pol vs Conventional
Juice Pol
Core Juice Purity vs Conventional
Juice Purity
Correlation Coefficient, r
Core Conventional
0.4851
0.0788
0.7240
0.3119
0.4851
0.0788
0.7240
0.3119
Sample Mill Yield vs Factory Yield
Daily Basis
Weekly Basis
0.6445
0.9022
0.6107
0.8858
Sample Mill Juice vs Factory Juice
Sample Method Juice Pol vs
Factory Normal Juice Pol 0.7139 0.9035
Sample Method Juice Purity vs
Factory Normal Juice Purity 0.5448 0.5206
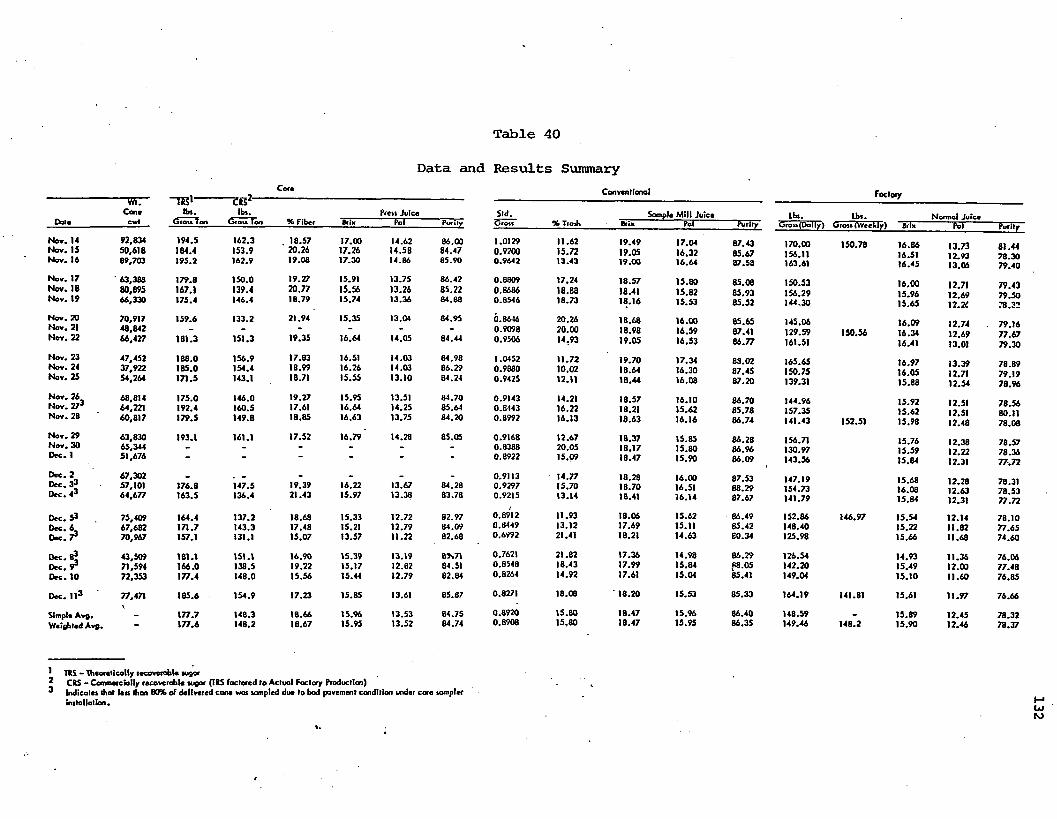
•»Core
Data a
to t.Cane Bn.
tito it I o n
C8Slb s . Press Juice
Dote Cwt 6 io u Ion % F ib e r Bri« Pol P u rity
Nov. 14 92.834 194.5 162.3 18.57 17.00 14.62 86.00Nov. 15 50,618 184.4 153.9 20.26 17.26 14.5B 84.47Nov. 16 89,703 195.2 162.9 19.08 17.30 14.86 85.90
Nov. 17 63,388 179.8 150.0 19.27 15.91 13.75 86.42Nov. 18 80,895 167.1 139.4 20.77 15.56 13.26 85.22Nov. 19 66,330 175.4 146.4 18.79 15.74 13.36 84.88
Nov. 20 70,917 159.6 133.2 21.94 15.3S 13.04 84.95Nov. 21 48,842 _ - - - - -Nov. 22 66,427 181.3 151.3 19.35 16.64 14.05 84.44
Nov. 23 47.452 188.0 156.9 17.83 16.51 14.03 84.98Nov. 24 37,922 185.0 154.4 18.99 16.26 14.03 86.29Nov. 25 54,264 171.5 143.1 18.71 15.55 13.10 84.24
Nov. 26 68,814 175.0 146.0 19.27 15.95 13.51 84.70Nov. 273 64,221 192.4 160.5 17.61 16.64 14.25 85.64Nov. 28 60,817 179.5 149.8 18.85 16.63 13.75 84.20
Nov. 29 63,830 193.1 161.1 17.52 16.79 14.28 85.05Nov. 30 65,344 _ . . _Dec. 1 51,676 - - - - - -
Dec. 2 67,302 __ _ _Dec. 33 57,101 176.8 147.5 19.39 16.22 13.67 84.28D ee.43 64,677 163.5 136.4 21.43 15.97 13.38 83.78
Dee. P 75,409 164.4 137.2 18.68 15.33 12.72 82.97Dee. 6 67,682 171.7 143.3 17.48 15.21 12.79 84.09Dec. r 70,967 157.1 131.1 15.07 13.57 11.22 82.68
Dec. 8* 43,509 181.1 151.1 16.90 15.39 13.19 85»7lDec. r 71,594 166.0 138.5 19.22 15.17 12.82 84.51Dec. 10 72,353 177.4 148.0 15.56 15.44 12.79 82.84
D m . I I 3 77,471 185.6 154.9 17.23 15.85 13.61 85.87
Simple Avg.\
177.7 148.3 18.66 15.96 13.53 84.75Weighted Avg. - 177.6 148.2 18.67 15.95 13.52 84.74
1 TRS - Iheortllcolly recoverable sugar^ CRS - Commercially recoverable sugar (IRS factored lo Actual Foclory Production)^ Indicates that lets than 80% of delivered cone was sampled due lo bod pavement condition under core sampler
installation.
Table 40
Results SummaryConventional
Sfd. Sample Mill JuiceG r o s s __________ % T ra s h ____________Brix Pol
1.0129 11.62 19.49 17.04 87.430.9200 15.72 19.05 16.32 85.670.9642 13.43 19.00 16.64 87.5a
0.8809 17.24 18.57 15.80 85.080.8686 18.88 18.41 15.82 85.930.8546 18.73 18.16 15.53 85.52
0.8646 20.26 18.68 16.00 85.650.9098 20.00 18.98 16.59 87.410.9506 14.93 19.05 16.53 86.77
1.0452 11.72 19.70 17.34 88.020.9880 10.02 18.64 16.30 87.450.9425 12.11 18.44 16.08 87.20
0.9143 14.21 18.57 16.10 86.700.8443 16.22 18.21 15.62 85.780.8992 16.13 18.63 16.16 86.74
0.9168 12.67 18.37 15.85 86.280.8388 20.05 18.17 15.80 86.960.8922 15.09 18.47 15.90 66.09
0.9113 14.77 18.28 16.00 87.530.9297 15.70 18.70 16.51 88.290.9215 13.14 18.41 16.14 87.67
0.8912 11.93 18.06 15.62 86.490.8449 13.12 17.69 15.11 85.420.6992 21.41 18.21 14.63 80.34
0.7621 21.82 17.36 14.98 86.290.8548 18.43 17.99 15.84 88.050.8264 14.92 17.61 15.04 85.41
0.8271 18.08 18.20 15.53 85.33
0.8920 15.80 18.47 15.96 86.400.8908 15,80 18.47 15.95 86.35
Foctory
Lbs. Lbs. Normal JuiceClross (Doily) dross (Weekly) Brttr Pol Purity
170.00 150.78 16.86 13.73 81.44156.11 16.51 12.93 78.30163.61 16.45 13.06 79.40
150.53 16.00 12.71 79.43156.29 15.96 12.69 79.50144.30 15.65 12.26 78.32
145.06 16.09 12.74 79.16129.59 150.56 16.34 12.69 77.67161.51 16.41 13.01 79.30
165.65 16.97 13.39 78.89150.75 16.05 12.71 79.19139.31 15.88 12.54 78.96
144.96 15.92 12.51 78.56157.35 15.62 12.51 80.11141.43 152.51 15.98 12.48 78.08
156.71 15.76 12.38 78.57130.97 15.59 12.22 78.36143.56 15.84 12.31 77.72
147.19 15.68 12.28 78.31154.73 16.08 12.63 78.53141.79 15.84 12.31 77.72
152.86 146.97 15.54 12.14 78.10148.40 15.22 11.82 77.65125.98 15.66 11.68 74.60
126.54 14.93 11.36 76.06142.20 15.49 12.00 77.48149.04 15.10 11.60 76.85
164.19 141.81 15.61 11.97 76.66
148.59 _ 15.89 12.45 78.32149.46 148.2 15.90 12.46 78.37
LJro
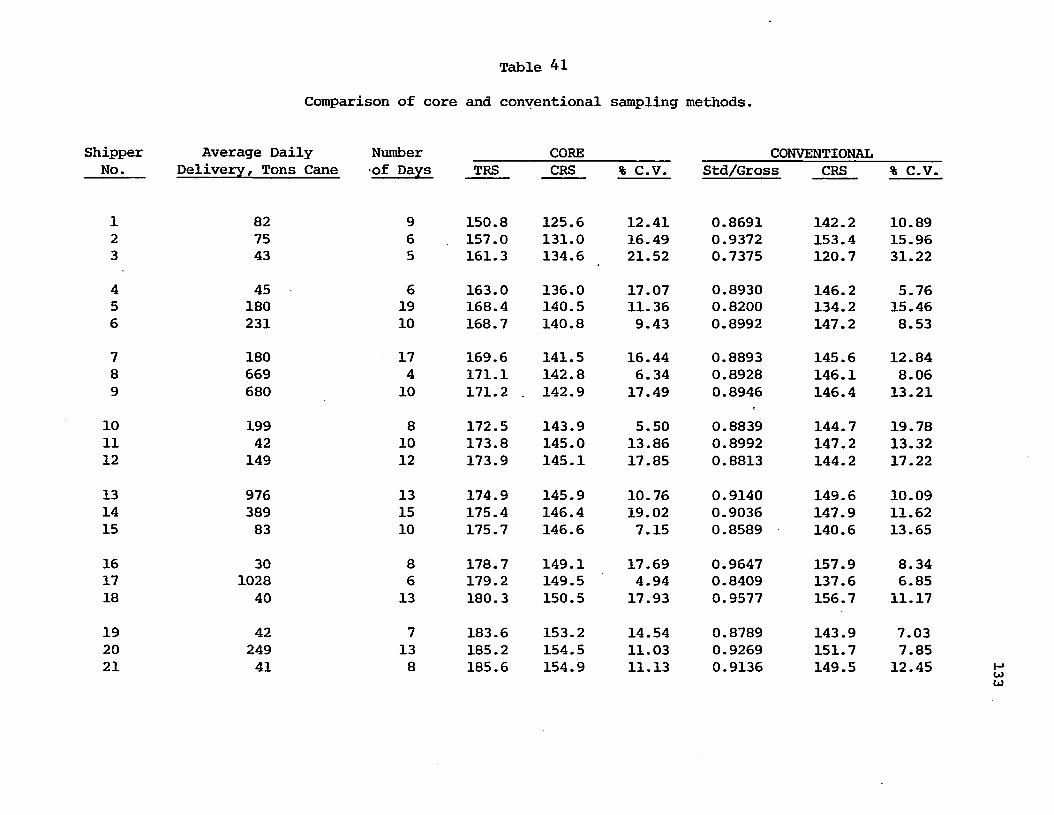
Table 41
Comparison of core and conventional sampling methods.
Shipper Average Daily Number CORE__________ CONVENTIONALNo. Delivery, Tons Cane of Days TRS
1 82 9 150.82 75 6 157.03 43 5 161.3
4 45 6 163.05 180 19 168.46 231 10 168.7
7 180 17 169.68 669 4 171.19 680 10 171.2
10 199 8 172.511 42 10 173.812 149 12 173.9
13 976 13 174.914 389 15 175.415 83 10 175.7
16 30 8 178.717 1028 6 179.218 40 13 180.3
19 42 7 183.620 249 13 185.221 41 8 185.6
CRS % C.V. Std/Gross CRS % C.V
125.6 12.41 0.8691 142.2 10.89131.0 16.49 0.9372 153.4 15.96134.6 21.52 0.7375 120.7 31.22
136.0 17.07 0.8930 146.2 5.76140.5 11.36 0.8200 134.2 15.46140.8 9.43 0.8992 147.2 8.53
141.5 16.44 0.8893 145.6 12.84142.8 6.34 0.8928 146.1 8.06142.9 17.49 0.8946 146.4 13.21
143.9 5.50 0.8839 144.7 19.78145.0 13.86 0.8992 147.2 13.32145.1 17.85 0.8813 144.2 17.22
145.9 10.76 0.9140 149.6 10.09146.4 19.02 0.9036 147.9 11.62146.6 7.15 0.8589 140.6 13.65
149.1 17.69 0.9647 157.9 8.34149.5 4.94 0.8409 137.6 6.85150.5 17.93 0.9577 156.7 11.17
153.2 14.54 0.8789 143.9 7.03154.5 11.03 0.9269 151.7 7.85154.9 11.13 0.9136 149.5 12.45 133
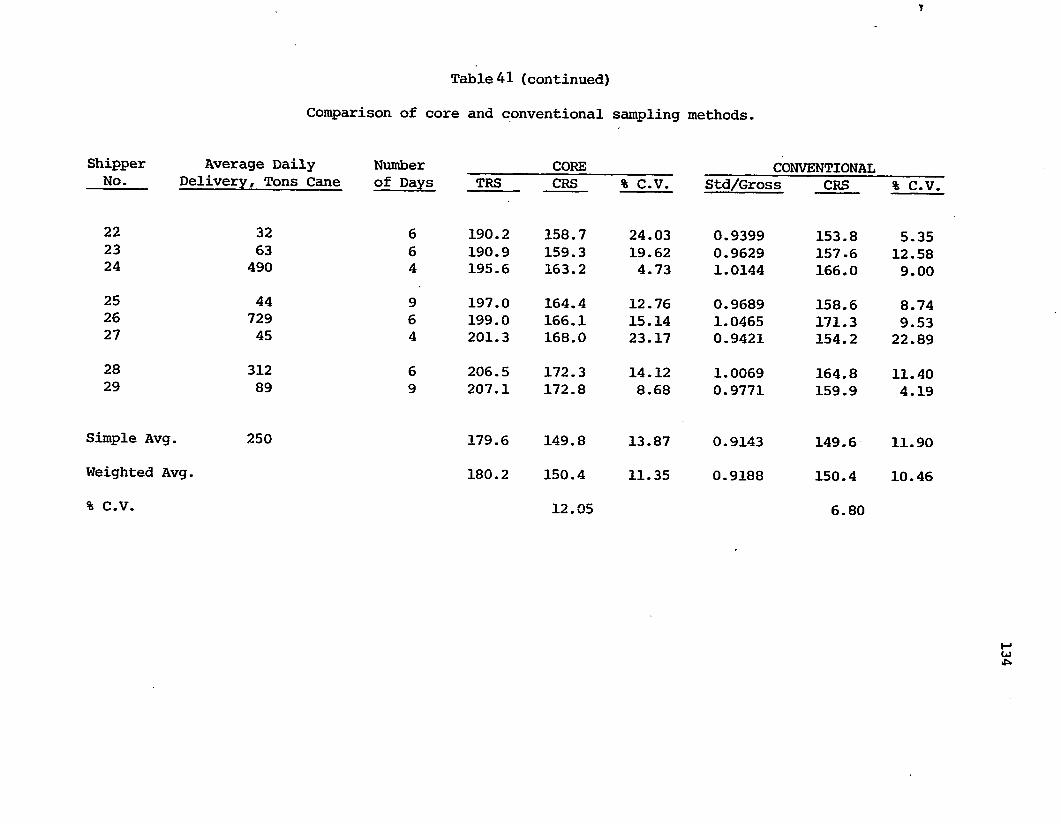
7
Table 41 (continued)
Comparison of core and conventional sampling methods.
Shipper Average Daily Number CORE_________ CONVENTIONALNo. Delivery, Tons Cane of Days TRS CRS % C.V. Std/Gross CRS
22 32 623 63 624 490 4
25 44 926 729 627 45 4
28 312 629 89 9
Simple Avg. 250
Weighted Avg.
% C.V.
190.2 158.7 24.03 0.9399 153.8190.9 159.3 19.62 0.9629 157.6195.6 163.2 4.73 1.0144 166.0
197.0 164.4 12.76 0.9689 158.6199.0 166.1 15.14 1.0465 171.3201.3 168.0 23.17 0.9421 154.2
206.5 172.3 14.12 1.0069 164.8207.1 172.8 8.68 0.9771 159.9
179.6 149.8 13.87 0.9143 149.6
180.2 150.4 11.35 0.9188 150.4
12.05 6.8(
% C.V.
5.3512.589.00
8.749.53
22.89
11.404.19
11.90
10.46
134
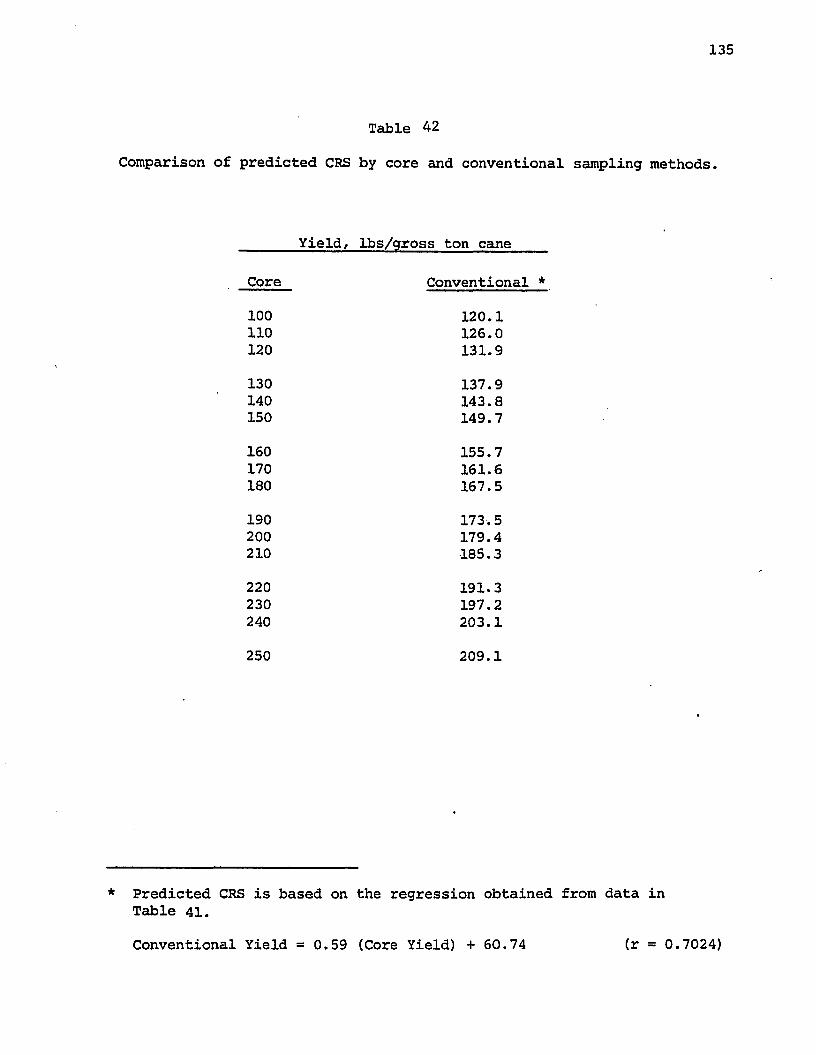
135
Table 42
Comparison of predicted CRS by core and conventional sampling methods.
Yield, lbs/gross ton cane
Core Conventional *
100 120.1110 126.0120 131.9
130 137.9140 143.8150 149.7
160 155.7170 161.6180 167.5
190 173.5200 179.4210 185.3
220 191.3230 197.2240 203.1
250 209.1
* Predicted CRS is based on the regression obtained from data in Table 41.
Conventional Yield = 0.59 (Core Yield) +60.74 (r = 0.7024)
136
For example, growers who could materially increase yields by
fertilizers, pesticides, growth promoters etc., are reluctant to do so
since they only receive 59% of what should be their portion of the
increased sugar value.
Comparison of Core and Conventional Yields
Table 43 presents grouped data on the yields of the core versus
the conventional method. It will be noted that the core yield range
is much greater than the range in the conventional method. This result
parallels the observation noted in the grower comparison above.
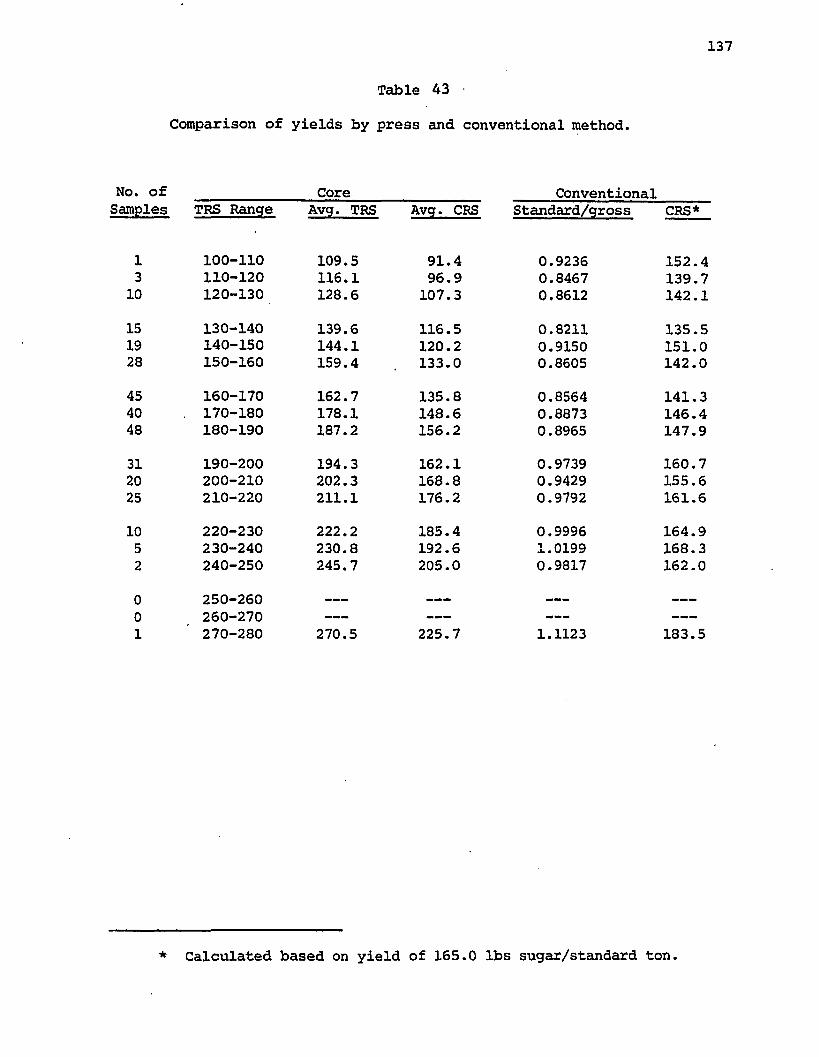
137
Table 43
Comparison of yields by press and conventional method.
No. of _______________ Core________________ Conventional______Samples TRS Range Avg. TRS Avg. CRS Standard/gross CRS*
1 100-110 109.5 91.4 0.9236 152.43 110-120 116.1 96.9 0.8467 139.710 120-130 128.6 107.3 0.8612 142.1
15 130-140 139.6 116.5 0.8211 135.519 140-150 144.1 120.2 0.9150 151.028 150-160 159.4 133.0 0.8605 142.0
45 160-170 162.7 135.8 0.8564 141.340 . 170-180 178.1 148.6 0.8873 146.448 180-190 187.2 156.2 0.8965 147.9
31 190-200 194.3 162.1 0.9739 160.720 200-210 202.3 168.8 0.9429 155.625 210-220 211.1 176.2 0.9792 161.6
10 220-230 222.2 185.4 0.9996 164.95 230-240 230.8 192.6 1.0199 168.32 240-250 245.7 205.0 0.9817 162.0
0 250-260 -- ___ -- ---0 260-270 -- --- -- ---1 270-280 270.5 225.7 1.1123 183.5
* Calculated based on yield of 165.0 lbs sugar/standard ton.
138
BIBLIOGRAPHY
Anderson, G. A. "The Juice Scales - Individual Fiber System for Determination of Cane Quality." Proceedings of the Tenth Congress of the International Society of Sugar Cane Technologists, (1959), pp. 182-187.
Arceneaux, George. "A Simplified Method of Making Theoretical Sugar Yield Calculations," International Sugar Journal, XXXVII (1935), 264-265.
Arceneaux, George and Hebert, L. P. "Calculation of Sugar Production from Sugar Cane Variety Tests," Sugar, (December, 1954), pp.50-52.
Behne, E. R. "The C.C.S. Formula," Cane Growers Quarterly Bulletin, (Queensland, Australia: April, 1948).
Besson-Guyard, M. "Sugar Cane Testing by Direct Analysis". Sugar y Azucar, (April, 1971).
Birkett, H. S. "Preliminary Report on the 1974 Factory Scale Core Studies". Proc. ASSCT 5(NS): 202-207.
Birkett, H. S. and Seip, J. J. "Core Sampling Studies - 1973".Proc. ASSCT 4 (MS): 163-177.
Birkett, H.S. and Seip, J. J. "Core Sampling of Louisiana Sugarcane - 1972 Studies". Proc. ASSCT 3(NS): 195-212.
Birkett, L. S., "The Deterioration of Cane After Burning", Tropical Agriculture, 1947, (24), pp. 28-31.
Birkett, L. S., "The Influence of Tops and Trash on the Economics of Sugar Production". Proc. ISSCT, 12: 1636-1642.
Buchanan, E. J. "Development of an Automatic Sampler and a System for Direct Analysis of Sugar cane Consignments." Proc. ISSCT,13: 1827-1841.
Buchanan, E. J. "Direct Sampling and Analysis of Individual Cane Consignments". S.M.R.I., Quart., Bull., 32: 117-131.
Christianson, W. 0. "Cane Testing with Particular Reference to the Use of the Java Ratio in Natal". Proc. 26th Congr.S.A.S.T.A. : 69-84.
Clayton J. L. "The Queensland System of Cane Payment," Proceedings of the Tenth Congress of the International Society of Sugar Cane Technologists. (1959), pp. 205-212.
139
Darroch, J. G., Dennison, F. C., and Rhodes, L. J. "The Application of the Pol Ratio Method of Cane Analysis," Proceedings of the Tenth Congress of the International Society of Sugar Cane Technologists, (1959), pp. 199-205.
Diecke, R. "Investigations with the Wet Disintegrator for the Direct Analysis of Cane," Proceedings of the Tenth Congress of the International Society of Sugar Cane Technologists, (1959) , pp. 168-174.
Douwes Dekker, K. "A Survey of the Work Done in S. A. on the Direct Analysis of Cane Consignments," Sugar Milling Research Institute,Quarterly Bulletin No. 7, (South Africa; August, 1958), pp. 23-25.
_____________. "The Determination of Certain Qualities of IndividualConsignments of Sugar Cane," Proceedings of the Ninth Congress of the International Society of Sugar Cane Technologists,II (1956), 722-723.
Establecimiento de un metodo de muestreo directo de las canas entregadas para molienda mediante el uso de la cala mecanica (core sampler) y para el calculo del rendimiento de las canas entregadas a las Centrales Fajardo y Cambalache. 1970. A Study conducted by the Junta Azucarera de Puerto Rico. Copy courtesy of Mr. Efrain Boneta-Garcia, President of the Board.
Follett-Smith, P. R. "The Java Ratio and the Fibre Content of Cane." Proc BWISA, 1966. pp. 397-399.
Goel, J. N. "Evaluation of a New Method of Sampling Sugar Cane Deliveries," M.S. Thesis in the Department of Chemical Engineering, Louisiana State University, (June, 1959).
Grayson, W. M., "A Study of the Factors Affecting Growers' Juice Samples," Proceedings American Society of Sugar Cane Technologists 1946-1950, (February, 1953), pp. 176-189.
Halliday, D. J., "The Manuring of Sugar Cane1, Published by the Centre D'Etude de L 1Azote, Geneva, p. 71.
Harris, S. R., Hanks, P. A., et alia. "Direct Analysis of CaneUsing a Wet Disintegrator," Proceedings of the Tenth Congress of the International Society of Sugar Cane Technologists. (1959), pp. 188-199.
Hebert, R. M., "Core Sampler St. Martin Sugar Cooperative, Inc."Proc. ASSCT 5(NS): In press.
140
Hoarau, M. "Etudes sur la methode d'analyse a la presse hydraulique, IRAT - Reunion Rapport, p. 87-89.
Hugot, E. "Cane Payment on a Quality Basis," The International Sugar Journal, LVII (1955), 187-190.
Keller, A. G. and Seip, J. J. "A Study of the Causes of the Declining Sugar Recovery in Louisiana," L.S.U. Engineering Experiment Station Circular No. 1 (1948).
Keller, A. G.- "Testing Cane Deliveries, for Trash A Comparative Study. Proc. ASSCT. 7A:205-213.
Keller, A. G. "The Determination of Trash in Sugar Cane," L.S.U. Engineering Experiment Station Circular No. 1 (1948).
Landry, Walter J. "Core Sampling Cane Deliveries in Louisiana,"Sugar J. 35 (2):27-29.
LeBlanc, Ridley J. "New Method of Sampling and Trash Testing at Raceland Factory," The Sugar Bulletin, XXXIV (1956), pp. 244-245.
Lemaire, Y. "Cane Sampling by Coring, Hydraulic Press, and Automatic Saccharimetry. Proc. ISSCT 14:1626-1636.
Locsin, Manuel V. "Influence of Fiber on Java Ratio," Proceedings of the Philippines Sugar Technologists, (1953), pp. 134-139.
L.S.U. Chemical Engineering Department. Final Report - A Study onSampling and Methods of Determining Sucrose, Purity, and Fiber Content of Sugar Cane, USDA Contract No. 12-25-010-558,(October 7, 1959).
Mayoral, J. E. and M. C. Vargas. "The Effects of Mechanically Loaded Cane on Sugar Factory Results." Proc. I.S.S.C.T.,12:1627-1635.
Meade, G. P., Spencer, G. L. Cane Sugar Handbook. Ninth Edition.New York: John Wiley and Sons, Inc., 1963.
Paul, Biraja Bilash. "Evaluation of Commercial Deliveries of Sugar Cane," Ph.D. Dissertation in the Department of Chemical Engineering, Louisiana State University, (August, 1960).
Paul, Biraja Bilash. "Sampling of Commercial Deliveries of Sugar Cane- A Comparative Study," M.S. Thesis in the Department of Chemical Engineering, Louisiana State University, (June, 1958).
141
Payne, J. H. and Mahon, H. J. "The Pol Ratio Method for EvaluatingCane Quality," Proceedings of the Ninth Congress of the International Society of Sugar Cane Technologists, 11(1956), 436- 447.
Payne, J. H. , and L. J. Rhodes. "Assaying cane deliveries by core sampling and direct analysis Proc. ISSCT, 12:1552-1560.
Saint, S. J., "Manurial Trials with Sugar Cane", Agricultural J.,Barbados, 1933, 2(4), 1-32? 1935, (4), 1-24; 129-164; 1937,(6), 20-41.
Saint Antoine, J. D. De R. "Cane Payment in Mauritius." Proceedings of the Tenth Congress of the International Society of Sugar Cane Technologists, (1959); pp. 163-167.
Shaw, M. R., "An International Glance at Sucrose Content of Cane", Proceedings ISSCT, 1953, pp. 283-291.
Seip, J. J., "A Method of Determining Sugar Cane Quality in Louisiana", Ph.D. Dissertation, LSU, January, 1963.
Stewart, P. N. "The Determination of Fibre in New Varieties of Cane." Proc. ISSCT, 13: 1006-1012.
Sugar Bulletin, No. 22 Dept, of Agriculture, Georgetown, British Guiana, 1954, pp. 41-54.
Tanimoto, T. "The Press Method of Cane Analysis". The Hawaiian Planters' Record. 57(2) :133-150.
Tilbury, R. H., "Dextran and Dextranase", Proc. ISSCT, 14:1445-1458.
U. S. Department of Agriculture. "Sampling Testing and Reporting",Short Reference 8-SU, (Issued annually through 1974), Washington, D.C.
Viator, D.P. "Trash Sampling Studies of Sugarcane Under Louisiana Conditions." Proc. ASSCT 3 (NS):158-163.
Waddell, C.W. "Effective Fiber Determination in Sugar Cane,"Proceedings of the Eighth Congress of the International Society of Sugar Cane Technologists, (1953), pp. 828-841.
Wang, Shwen-in. "Variance in Cane Quality - A Comparative Study,"M.S. Thesis in the Department of Chemical Engineering,Louisiana State University, (June, 1960).
Young, C. M. and Van der Pol, C. "Determination of Certain Qualities of Individual Cane Consignments," Sugar Milling Research Institute, Quarterly Bulletin No. 5, (South Africa; January, 1958), pp. 9-13.

APPENDIX
NOMENCLATURE
142
General
Absolute Juice: All the dissolved solids in the cane plus the total
water of the cane, i.e. cane less fiber.
Available Pol: The percentage of pol in a pol-containing product
(e.g. juice) that is expected to be recovered in the sugar.
The most common available pol formula is the Winter-Carp
formula:
Available Pol = (1.4 - 40/juice Purity) x 100
Boiling House Efficiency Number (BHE): The percentage relation between
the actual retention and the theoretical retention as
determined from an available sugar formula.
Brix: The per cent by weight of soluble solid matter as indicated by
a Brix spindle or other densimetric device.
(e.g. refractometer)
Crusher Juice: The juice expressed by the first two rollers of the
tandem.
Note: This is thus the juice from a two-roll crusher - or
the juice expressed by the cane and top roll of a
three-roll crusher or mill.
Corrected (Commercial) Recoverable Sugar (CRS): The product of the
theoretical Recoverable Sugar and the liquidation factor.
The corrected recoverable sugar thus represents the quantity
of sugar per ton of cane that the factory will recover.
Cush-cush: The material obtained by screening the mixed juice consist
ing of cane fiber and insoluble solids saturated with mixed
143
juice. This material is removed at the milling tandem and
recycled through the mills.
Dilution Compensation Factor: The quotient of the sample mill juice
Brix and the crusher juice Brix.
Dilute Juice: see mixed juice.
Extraction: see pol extraction and reduced extraction.
Fiber: The dry, water-insoluble matter in the cane. Normally, fiber
(true) refers only to fibrous residue of the clean cane. In
this study fiber (apparent) is taken as the dry water in
soluble matter in the gross cane, and thus also includes the
dry water insoluble matter of the trash in gross cane.
Gross Ton of Cane: The cane as delivered, comprising the net cane
(trash-free) and the trash.
Imbibition: The process in which water or juice is put on the bagasse
to mix with and dilute the juice present in the latter. The
water so used is termed imbibition water. In Louisiana,
maceration is used synonymously for imbibition.
Java Ratio: Pol (or sucrose) per cent cane divided by pol (or sucrose)
per cent first expressed juice, and the resultant multiplied
by 100.
Last Expressed Juice: The juice expressed by the last two rolls of
the tandem. (In the data tables - Appendix - the term
Last Roll Juice is used.)
Last Roll Juice: see last expressed juice.
Liquidation Factor (E): The quotient of the total recoverable sugar
and the sum for the crbp.of the individual daily grower's
theoretically predicted sugar. (F = RS/Z TPS)
144
Maceration: see Imbibition.
Milling Loss: The percentage ratio of pol (or sucrose) In bagasse
to fiber in bagasse. The ratio is often used as an indication
of the extraction efficiency.
Mixed Juice: The juice sent from the crushing plant to the boiling
house. In Louisiana, dilute juice and mixed juice are used
interchangeably.
Net Cane: Trash-free cane, i.e. gross cane minus trash.
Pol: The apparent percentage by weight of sucrose in a material. Pol
is determined by optical methods (rotation of light in a
saccharimeter). In the absence of other optically active
substances the pol and sucrose values are identical.
Pol Extraction: Pol in mixed juice as per cent of the pol in cane.
Purity: The percentage proportion of pol in the Brix solids.
Recoverable Sugar (RS): The sugar actually recovered in the processing
of cane, or the sugar expected to be made based on mill
performance and the mixed juice analysis.
Reduced Extraction: Pol (or sucrose) extraction reduced to a common
standard basis of 12.5 per cent fiber in cane.
Refractometer Brix: The per cent by weight of solids in solution as
indicated by the sugar refractometer - or as derived from
the refractive index and referred to tables of equivalent
per cent sucrose and refractive index.
Residual Juice: The juice left in the bagasse - bagasse minus fiber.
Retention: The percentage of pol (or sucrose) in the mixed juice that
is recoverable (or retained) in the commercial sugar.
Sample Mill Brix Factor (SMBF): The quotient of the factory normal
145
juice Brix and the average (weighted or simple) sample mill
juice Brix expressed as a percentage.
Sample Mill Sucrose (Pol) Factor (SM3F): The quotient of the factory
normal juice pol and the average (weighted or simple) sample
mill juice pol expressed as a percentage.
Standard Cane: The basis for cane payment in Louisiana by the
conventional system. Obtained from the delivered gross tons
by deducting trash and applying juice pol and purity factors.
Sucrose: The disaccharide known in chemistry as saccharose or cane
sugar, Cl2H22On .
Trash: The leaves, tops, dead stalks, roots, soil, etc, delivered at
the factory with the clean cane.
Theoretical Recoverable Sugar (TRS): The yield of sugar per ton of
cane predicted by a sampling method and yield model.
Yield: The commercially recovered sugar per unit of cane. The yield
is often expressed as Sugar per cent cane, or as the pounds
of sugar per ton (gross, net, or standard) of cane. In this
study the ratio of standard tons to gross tons is used in
indicating the yield of cane by the conventional method.
>
Statistical Data
146
Coefficient of Variation: The standard deviation divided by the
arithmetic average (mean) and the resultant multiplied by
100.Confidence Limits: A range of values that - on the basis of a given
sample - has a specific probability of including the true
mean.
Correlation: The degree of association between one variable and
another or between one variable and several others.
Correlation Coefficient, r: A measure of the correlation between two
variables.2Goodness of the Correlation, r : The ratio of the sum of the squares
removed by the correlation to the sum of the squares of the
original data.
Regression: The nature of the relation between variables.
Regression Coefficient: When two variables can be correlated linearly,
the regression coefficient is the slope of the line used to
correlate the variables.
Standard Deviation of the Estimate, s(y): A measure of the average
deviation of the data points from the estimated values ac
cording to the correlation line.
"t" statistic (Students ”t"): A tabulated statistical function useful
in calculating the probability of experimental observations,
and confidence limits.
147
THE LOUISIANA CANE SAMPLING AND TESTING METHOD (CONVENTIONAL METHOD)
The method of sampling and testing sugar cane in Louisiana for
cane payment until and including 1974 was prescribed by the Sugar
Division of the United States Department of Agriculture Agricultural
Stabilization and Conservation Service under authority granted under
the Sugar Act. The procedures to be used were issued annually.
The USDA sampling and testing procedure manual was both detailed
and voluminous. The essential elements of the method as applied in
this study are outlined below. The method involves the following
elements:
1. Trash Determination
2. Juice Extraction on a sanple mill
3. Juice Analysis (Pol and Purity)
4. Determination of the sample mill Brix factor
5. Determination of the sample mill sucrose (pol) factor.
6 . Determination of the Dilution Compensation Factor
(if cane washing or cush-cush return to the crusher is
practiced)
7. The conversion of gross tons cane to standard tons
(tons for payment) from the above data and factors using
a published table that converted net tons to standard tons.
The sampling frequency was required to be at least once every
65 tons, but not less than one sample per grower per day.
The trash determination was to be performed by detrashing a grab
sample of cane weighing approximately 100 lb. The detrashing operation
148
was performed manually.
The cane samples for juice analysis were to consist of at least
10 stalks of gross cane which were processed in a sample mill to yield
a juice sample. The juice sample was analyzed for Brix (by the Brix
hydrometer method) and for pol by the Hornes dry lead method.
The factory normal juice Brix was obtained by multiplying the
factory crusher juice Brix by a dry milling factor (normally assumed
to be 0.97, but which at the option of the factory could be determined
experimentally). The factory normal juice pol was obtained by
multiplying the normal juice Brix by the mixed juice purity and
dividing by 100.
The Sample Mill Brix Factor, (SMBF) was calculated on a daily
basis by dividing the factory normal juice by the average sample mill
juice Brix.
The Sample Mill Sucrose (pol) Factor (SMSF) was calculated on a
daily basis by dividing the factory normal juice pol by the average
sample mill juice pol.
The juice analysis on which payment was based was obtained by
multiplying the grower's sample mill Brix by a six-day moving average of
the Sample Mill Brix Factor (SMBF) to get a sample mill 'normal' juice
Brix. The pol of the grower's juice used for payment was obtained by
multiplying the grower's sample mill juice pol by a six-day moving
average of the Sample Mill Sucrose (pol) Factor (SMSF). The purity of
the juice used for payment was calculated as the percentage quotient
of the pol and Brix as determined above.
The factors for converting the net cane to standard cane were
obtained from tables published by the USDA. This table was based on a
149sample juice having a pol of 12 and a purity of 76.00 to 76.49 for
which the factor was unity. Juices having higher pols or purities
corresponded to higher standard/net ton ratios and vice versa.
In cases where the cane was washed or where cush-cush was
introduced ahead of the crusher this diluting effect on the crusher
juice was corrected by performing periodic Dilution Compensation
Factor (DCF) determinations. The Dilution Compensation Factor (DCF)
was determined periodically by operating the milling tandem for one
hour without cane washing and cush-cush return to the crusher, while
sampling the factory crusher juice and the cane being ground. The
cane samples were processed in the sample mill to obtain the juice
Brix, and the DCF factor calculated from the quotient of the factory's
crusher juice Brix and the sample mill juice Brix. The factory's
crusher juice Brix during normal operation with cane washing or cush-
cush return to the crusher was obtained from the product of the sample
mill juice Brix and a moving average of the three most recent DCF
determinations.
150
THE PRESS METHOD
In Chapter VI the representativeness and unbiased characteristics
of the core sample were investigated. This chapter assumes that a
good sample representative of the cane consignment has been obtained.
Several methods-for predicting the quality of the cane from the sample
will be discussed, leading to the development of the method adopted
in these studies. It is assumed that following the coring of the cane,
that the cane has been attrited and mixed so that small sub-samples
(500 - 1000 gm) can be obtained that are representative of the sample.
The Pol Ratio Method
This method was one of the earliest methods for the direct
determination of pol and fiber in sugarcane. The method was introduced
in Hawaii in 1953. The method encompassed the sampling of the cane,1 2the sample preparation, and the analytical methods ' . However, only
the analytical procedures for the determination of the cane analysis
will be considered here.
In this method, a 900 gm. sample of cane is placed in a
disintegrator and 2000 gm. of water added. After 10 to 15 minutes of
1. J. H. Payne and H. I. Mahon. "The Pol Ratio Method for Evaluating
Cane Quality". 9th ISSCT Congress, 1956. pp. 436-447.
2. J. G. Darroch, F.C. Denison, and L. J. Rhodes, "The Application of
the Pol Ratio Method of Cane Analysis". 10th ISSCT Congress, 1959.
pp. 199-205.
151
of disintegration a sample of the extract is removed for analysis.
The remainder of the contents of the disintegrator is then screened,
washed, pressed, dried, and weighed. The juice analysis consists of
a refractometric Brix reading using a precision refractometer, and
the determination of the pol in the extract by the conventional
polarimeter method (performed in a similar manner to bagasse
analyses).
The data obtained can be summarized as follows:
Weight of cane C
Weight of Water added W
Refractometer solids of extract R
Pol of extract P
Weight of fiber F
From these analyses the cane composition can be readily obtained,
as follows:
Weight of absolute juice C - F
Weight of extract C - F + W
Weight of pol in extract (C - F + W) x (P/100)
Pol % Cane (C - F + W) x (P/100) x (100/C)
Fiber % Cane (F/C) x 100
Juice Purity (P/R) x 100
The pol ratio method yields a pol % cane value that is very
accurate. However, the dilution of the juice (extract) requires the
use of a precision refractometer to obtain an accurate juice purity.
152
The primary disadvantage of the pol ratio method is the loss of
the field soil. During the digestion operation and the subsequent
screening and washing the field soil present in the sample is washed
out, the result is that the fiber value reported in the cane analysis
is the true (cane) fiber. In Chapter VII it was shown that the trash
present in cane can contribute substantially to the apparent fiber
(insoluble dry solids) in cane. In the commercial studies described
* in Chapter VIII the average apparent fiber in cane was 18.67%, while
for clean Louisiana cane the cane fiber (true fiber) is only about
11 to 13%. Thus the trash contribution to the apparent fiber is
about 50% of the cane 'fiber a substantial quantity that cannot be
neglected. The effect of the fiber, whether true or apparent, has a
direct influence on both the extraction and the quantity of juice in
the cane. In the case of Louisiana where the insoluble dry solids
due to trash are about 6%, this would if neglected, lead to the over
estimation of the juice in cane by about 9%, and an overestimation of
the pol extraction by about 3%.
The inability of the pol ratio method to account for the apparent
fiber in cane, together with the time consuming nature of the
analytical technique required were factors in eliminating this method
for consideration in Louisiana.
The Puerto Rico Disintegrator Method
The Puerto Rico disintegrator method is very similiar to the
Pol Ratio method. The analytical procedures consist of disintegrating
500 grams of cane in 1500 grams of water alkalized with 10 ml of 10%
sodium carbonate solution for 10 minutes. The disintegrated mass is
screened, and the fibrous matter pressed and weighed. The pol and
Brix of the extract are obtained, and the moisture of the pressed
residue is determined on a 25 gram sample of the residue. The
analytical results obtained are equivalent to those of the Pol Ratio
method, however, the cane analysis is calculated slightly differently
The data obtained can be summarized as follows:
From these analyses the cane composition is obtained as follows
Brix % Cane = 4Bs + 25BsBsRc - BsBsRcRs - RsRcBs
This method has the advantages and disadvantages of the Pol
Ratio method.
Wet Residue Weight Rc
Dry Residue Weight Rs
Brix (Refractometric) of Extract Bs
Pol of Extract P
12500 (100-Bs) 12500
Purity of Extract 26 PBs (0.00397 (Bs - 2) + 1.00495)
Pol % Cane = Brix % Cane x Purity of Extract/100
Insoluble Dry Solids % Cane x Rc 125
154
The Disintegrator/Moisture Method of Cane Analysis (Hawaii)
This method was developed and approved for cane analysis in
1973. The primary reason for the development of this method was to
eliminate the errors in the Pol Ratio method caused by the presence
of field soil as noted in the discussion of the Pol Ratio method.
In this method no distinction is made between the field soil
present in the cane and the true (cane) fiber. The total insoluble
dry solids is used in this method. The analytical procedures parallel
those of the Pol Ratio method except that the fiber determination is
eliminated, being replaced by a moisture % cane analysis.
The method consists of disintegrating a 900 gram sample of
shredded cane in 2000 grams of water. The extract obtained is
analyzed for pol and refractometric solids. A moisture determination
is performed on the shredded cane. From the refractometric solids
the Brix % Cane is calculated, and using the purity of the extract
the pol % cane is obtained.
The data obtained can be summarized as follows:
Weight of Cane ' C
Weight of Water added W
Refractometric Solids of Extract, % R
Pol % Extract P
Moisture % Cane M
From these analyses the cane composition can be obtained as
follows:
Brix % Cane = (Brix % Extract) x (Weight of Extract)/Cane Weight
155
= R x Extract Weight/C
= (R/C) x 100 x (W + C x M x 0.01)(100 - R)
Pol % Cane = Brix % Cane x Purity/100
= Brix % Cane x P/R
Fiber % Cane = 100 - Moisture % Cane - Brix % Cane
= 100 - M - Brix % Cane
The advantage of this method is that it gives accurate values
for the pol and Brix % Cane. The disadvantages of the disintegrator/
moisture method are:
1. The total insoluble dry solids are determined (true fiber
plus extraneous dry solids).
2. The moisture % cane determination takes 24 hours.
3. A precision refractometer is required since the cane juice
extract is dilute — about 5° Brix.
4. A disintegrator is required.
Core Press Method (Guadeloupe)
This method employs a FAPMO horizontal corer for the sample
extraction. The sample is shredded in a Jeffco cutter-grinder.
The analytical procedure consists of pressing a 500 gram
prepared cane sample for 1 minute under a pressure of 240 bars in a
Pinette-Emidecauhydraulic press. The residue (bagasse) is weighed
while the juice is analyzed for pol with an automatic saccharimeter
the Brix being determined by a precision refractometer.
In this method, the cane analysis is not reported directly,
rather a theoretical sugar yield is calculated. However, the cane
analysis implicitly used can be calculated from the data as follows
Data
Cane Weight C
Bagasse Weight B
Juice Pol P
Juice Brix (Refractometric) R
Calculated Cane Analysis
Fiber % Cane = 0.095 B + 0.4535
= B/10
Brix % Cane = R x (1 - F/100)
Pol % Cane = P x (1 - F/100) x c
where c = Pol % Absolute Juice Pol % Extracted Juice
3Lemaire indicates that studies in Reunion showed that at
constant fiber the coefficient c approaches unity with increasing
pressure, and that c decreases with increasing fiber % cane. For
3. Y. Lemaire, "Cane Sampling by coring, hydraulic press, and
automatic saccharimeter". ISSCT 1971.
157
high pressure, 240 bars, the relationship between c and fiber % cane
is linear and can be approximated by
c = -0.003 (Fiber % Cane) + 1.0165
In the Guadeloupe method the theoretical recoverable sugar, TRS,
is calculated from:
TRS = Z x c x Em x (1 - F/100)
where
Z = Pol in sugar % pol in extracted juice
Em = Theoretical mill pol extraction
F = Fiber % Cane
To obtain Z it is assumed that for each unit of so liable impurity
0.5 units of pol will be lost to the final molasses. Thus
Z = Pol - 0.5 (Brix - Pol)
where the pol and Brix are expressed per cent of expressed juice.
The theoretical pol extraction, Em, is obtained by assuming that
an ideal milling tandem will extract 97% of the pol in cane for cane
with a fiber content of 10%. It is further assumed that for each 1%
of fiber in cane above 10% an additional 0.6% of sucrose will be lost
to the bagasse. Thus
Em = 97 - (F - 10) (0.6)100
The yield expression (for TRS) is used for predicting the
tentative yield (TRS) of sugar for each grower. At the end of a
milling period, the total predicted sugar is compared with the sugar
actually made, and the weighted factor relating them calculated. This
factor is then used to convert the TRS values into actual sugar, which
158
then forms the basis for cane payment.
The analytical procedures associated with this method are quick
and simple. However, the direct factoring of the bagasse weight to
obtain the fiber % cane assumes that the fiber % bagasse is constant.
The validity of this assumption is good in Guadeloupe, however, in :
Louisiana where tests under similiar conditions were conducted, the
fiber % bagasse and the moisture % were very variable.
In the calculation of the pol retention of the factory the
soluble non-pol solids are assumed to cause half their weight in
loss of pol. The Winter-Carp and other sugar recovery formulas imply
losses due to the soluble non-pol solids of about 80% of this value.
The formula for the theoretical pol extraction, Em, reduces to
Em = 103 - 0.6(Fiber % Cane)
This expression predicts pol extractions not attained in
Louisiana. However, the liquidation factor would to a large extent
eliminate this bias.
Core-Press Method (Proposed for Louisiana)
In developing the method described below several factors were
considered, among them being that:
1. The method should be simple.
2. The method should be quick.
3. The method should measure the insoluble dry solids
rather than only the cane fiber.
The first requirement ruled out any digestion method. The
second requirement ruled out the Hawaiin Disintegrator/Moisture method.
159
The third requirement ruled out the Pol Ratio method and the Puerto
Rico method.
The Guadeloupe method thus formed the basis for the proposed
method. However, the method had to be modified to overcome the
difficulties inherent in the Guadeloupe method when applied to
Louisiana. Further, the method had to be modified to yield cane
analysis as well as a sugar yield.
The three points which make the direct application of the
Guadeloupe method unsuitable under Louisiana conditions are:
1. The assumption of constant fiber % bagasse in the press
residue.
2. The expression for the mill pol extraction as a function
of the fiber % cane.
3. The expression (factor Z) for obtaining the factory
retention from the press juice purity.
Under Louisiana conditions the fiber % bagasse in the press
residue varies greatly. Thus for the accurate determination of the
insoluble dry solids in cane the moisture % bagasse is required. The
moisture % bagasse of the press residue is a relatively quick (20
minutes of drying) and simple. The fiber % bagasse can be calculated
assuming that the press juice in the bagasse has the same composition
as the expressed juice, using the following equation
Fiber % Bagasse = 100 - ______ Moisture % Bagasse______(1 - Expressed Juice Brix/100)
The assumption that the residual juice has the same composition
as the expressed juice introduces a small error. If it was desired
160
to improve the accuracy, this could be accomplished by experimentally
obtaining the relationship between the absolute juice Brix and pol to
the expressed juice Brix and pol as a function of the extraction and
fiber % cane. However, it is felt that the added complexities of this
refinement would only slightly improve an already good value for the
fiber % cane.
The Guadeloupe method assumes the mill pol extraction, Em, to
be given by
Em = 103 - 0.6(Fiber % Cane)
This expression greatly overstates the extraction obtained in
Louisiana. The expression chosen for the proposed core-press method
for predicting the mill pol extraction as a function of the fiber %
cane is the reduced extraction concept of Noel Deer. This method
assumes that for a given mill efficiency, the absolute juice lost %
fiber is constant. Thus as the fiber % cane increases- the quantity
of absolute juice lost increases thus decreasing the pol extraction.
In Louisiana the average absolute juice lost % fiber is about
56.67, thus using this value in conjunction with Deer's reduced
extraction concept the mill pol extraction as a function of fiber can
be obtained. The resulting expression becomes
Pol Extraction = 100 - 56.67/(100 - Fiber % Cane)
For determining the boiling house retention the Guadeloupe
method assumes that each unit of Brix causes 0.5 pol units to be lost
in the final molasses. Under Louisiana conditions this method over
predicts the molasses loss. The method in general use in Louisiana is
based on the Winter-Carp formula. The Winter-Carp formula for the
161
boiling house retention is given by
Retention = 1.4 - 40/(P)
where P is the purity of the juice entering the boiling house.
The data required for the proposed Louisiana core-press method
is
Bagasse % Cane
Moisture % Bagasse
Extracted Juice Brix
Extracted Juice Pol
Assuming that the extracted juice and the residual juice have
the same composition the fiber % bagasse is given by
Fiber % Bagasse = 100 - _Bagasse % Moisture________( 1 - Extracted Juice Brix/100)
Thus the fiber % cane, F, is given by
Fiber % Cane = F = Fiber % Bagasse x Bagasse % Cane/100
and the absolute juice % cane is given by
Absolute Juice % Cane = 100 - Fiber % Cane
The Brix % Cane can be calculated as follows
Brix % Cane = B = Juice % Cane x Brix % Juice / 100
The Pol % Cane can be calculated as follows
Pol % Cane = P = Juice % Cane x Pol % Juice / 100
162
The above expressions allow the Brix, Pol and Fiber per cent
cane to be calculated. The sugar yield can be obtained from the cane
analysis assuming expressions for the pol extraction, boiling house
retention, and the boiling house efficiency, as follows
Theoretical Sugar Yield, lbs 96° sugar/gross ton of cane =
2000 x Pol % Cane x Extraction x Retention x 1 100 100 100 0.96
Substituting the reduced extraction expression developed above
for the pol extraction, the Winter-Carp formula for the boiling house
retention, and assuming a Boiling House Efficiency of 96, the sugar
yield expression reduces to
TRS, lbs 96° sugar/gross ton cane = (0.28S - 0.08B)(100 - 56.67 F)100-F
163
ANALYTICAL METHODS
The juice analyses (Brix and pol) and the bagasse analyses
(Pol and Moisture) were performed by the standard methods as described
in the Spencer-Meade Cane Sugar Handbook^-.
Field Soil in Juice
The field soil in juice was determined by separation of the
insoluble solids in the juice by centrifuging a 35 ml. juice sample
in a laboratory centrifugal for 10 minutes. The supernatant liquid
was discarded and the precipitate resuspended in 35 mis of distilled
water and centrifuged again. This process was repeated until the
supernatant liquid was sugar-free by the alpha-napthol test. The
precipitated solids were then transferred to a crucible using distilled
water and dried to constant wieght in a vacuum oven at 200°F. The
oven-dried residue was then expressed as a per cent of the initial
juice weight to give the dry field soil per cent juice.
The Cold Digestion Method for Pol per cent Cane
In this method a 200 gram sample of shredded cane is placed in a
Waring industrial blender with 1000 grams of water containing 0.25
grams of sodium carbonate to make the solution alkaline and reduce
deterioration by inversion. The mixture is homogenized for 10 minutes
and a sample of the cooled extract is clarified with Hornes dry lead
Meade, G.P. Cane Sugar Handbook. Ninth Edition. New York: John
Wiley and Sons, Inc., 1963.
164
and polarized in a saccharimeter. The extract weight is taken as the
weight of cane plus water less the weight of fiber in the cane. From
the weight of extract and pol % extract the pol in the extract is
calculated and expressed as a percentage of the initial cane weight to
give the pol % cane.
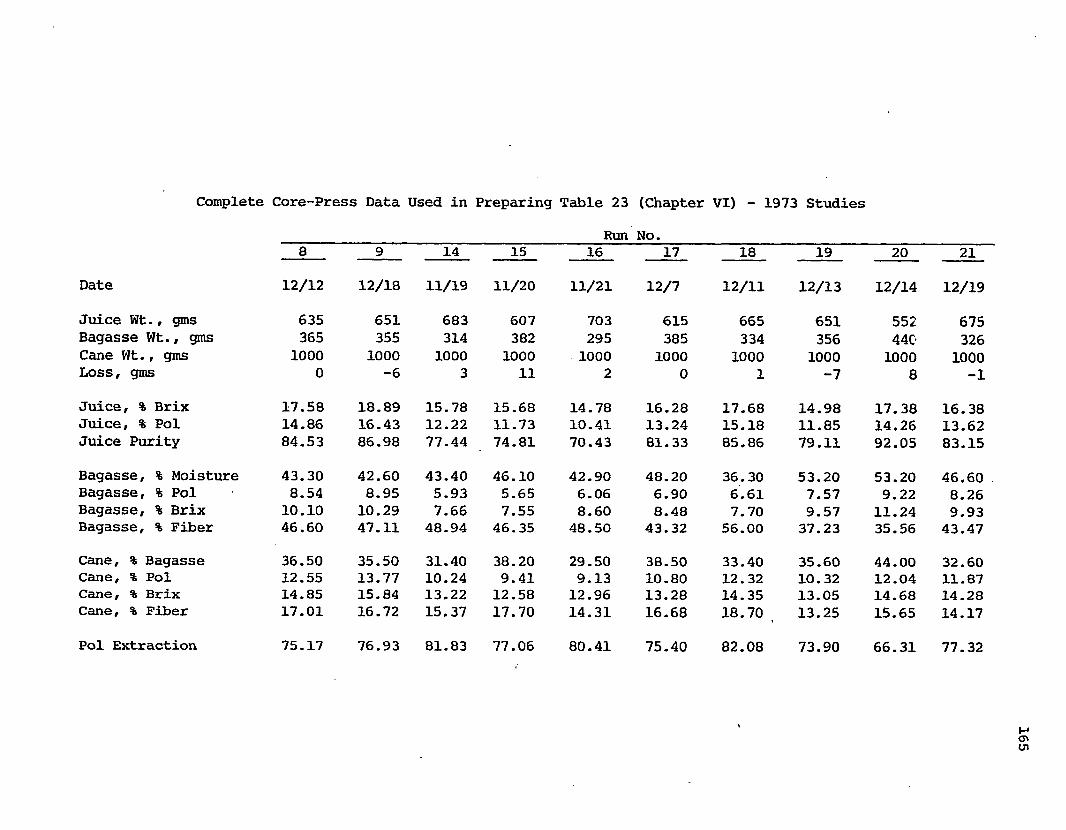
Complete Core-Press Data Used in Preparing Table 23 (Chapter VI) - 1973 Studies
8 9 14 15
Date 12/12 12/18 11/19 11/20
Juice Wt., gms Bagasse Wt., gms Cane Wt., gms Loss, gms
635365
10000
651355
1000-6
683314
10003
607382
100011
Juice, % Brix Juice, % Pol Juice Purity
17.5814.8684.53
18.8916.4386.98
15.7812.2277.44
15.6811.7374.81
Bagasse, % Moisture Bagasse, % Pol Bagasse, % Brix Bagasse, % Fiber
43.308.54
10.1046.60
42.608.95
10.2947.11
43.405.937.66
48.94
46.105.657.55
46.35
Cane, % Bagasse Cane, % Pol Cane, % Brix Cane, % Fiber
36.5012.5514.8517.01
35.5013.7715.8416.72
31.4010.2413.2215.37
38.209.4112.5817.70
Pol Extraction 75.17 76.93 81.83 77.06
Run No.16 17 18 19 20 21
11/21 12/7 12/11 12/13 12/14 12/19
703 615 665 651 552 675295 385 334 356 440 326
1000 1000 1000 1000 1000 10002 0 1 -7 8 -1
14.78 16.28 17.68 14.98 17.38 16.3810.41 13.24 15.18 11.85 14.26 13.6270.43 81.33 85.86 79.11 92.05 83.15
42.90 48.20 36.30 53.20 53.20 46.606.06 6.90 6.61 7.57 9.22 8.268.60 8.48 7.70 9.57 11.24 9.93
48.50 43.32 56.00 37.23 35.56 43.47
29.50 38.50 33.40 35.60 44.00 32.609.13 10.80 12.32 10.32 12.04 11.8712.96 13.28 14.35 13.05 14.68 14.2814.31 16.68 18.70 13.25 15.65 14.17
80.41 75.40 82.08 73.90 66.31 77.32
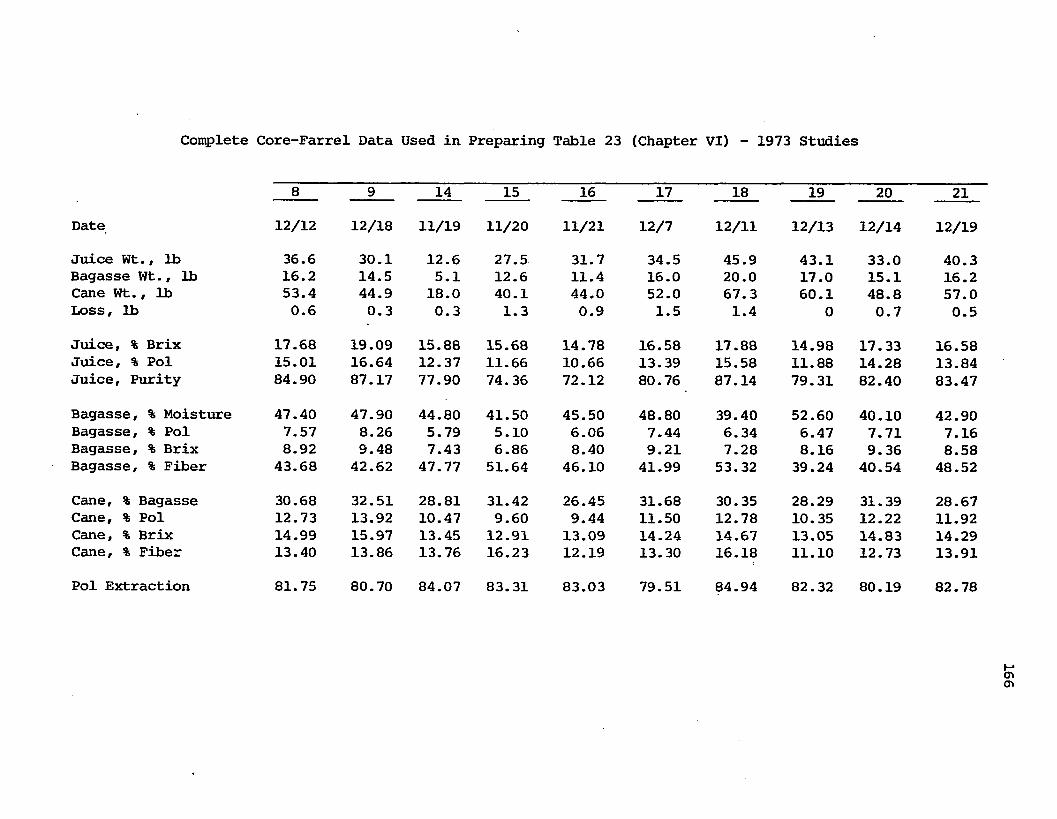
Complete Core-Farrel Data Used in Preparing Table 23 (Chapter VI) - 1973 Studies
8 9 14 15 16 17 18 19 20 21
Date 12/12 12/18 11/19 11/20 11/21 12/7 12/11 12/13 12/14 12/19Juice Wt., lb Bagasse Wt., lb Cane Wt., lb Loss, lb
36.616.253.40.6
30.114.544.90.3
12.65.118.00.3
27.512.6 40.11.3
31.711.444.00.9
34.516.052.01.5
45.920.067.31.4
43.117.060.1
0
33.015.1 48.80.7
40.316.257.00.5
Juice, % Brix Juice, % Pol Juice, Purity
17.6815.0184.90
19.0916.6487.17
15.8812.3777.90
15.6811.6674.36
14.7810.6672.12
16.5813.3980.76
17.8815.5887.14
14.9811.8879.31
17.3314.2882.40
16.5813.8483.47
Bagasse, % Moisture Bagasse, % Pol Bagasse, % Brix Bagasse, % Fiber
47.407.578.92
43.68
47.908.269.48
42.62
44.805.797.43
47.77
41.505.106.86
51.64
45.506.068.40
46.10
48.807.449.21
41.99
39.406.347.28
53.32
52.606.478.1639.24
40.107.719.36
40.54
42.907.168.58
48.52
Cane, % Bagasse Cane, % Pol Cane, % Brix Cane, % Fiber
30.6812.7314.9913.40
32.5113.9215.9713.86
28.8110.4713.4513.76
31.429.6012.9116.23
26.459.4413.0912.19
31.6811.5014.2413.30
30.3512.7814.6716.18
28.2910.3513.0511.10
31.3912.2214.8312.73
28.6711.9214.2913.91
Pol Extraction 81.75 80.70 84.07 83.31 83.03 79.51 84.94 82.32 80.19 82.78
167
VITA
Harold S. Birkett was born in New Amsterdam, Guyana, on
November 4, 1940. He received his high school education at Harrison
College, Barbados, and at Queen's College in Guyana. He attended
Louisiana State University from 1960 to 1964, receiving the B.S. degree
in Chemical Engineering in 1964. After working four years in the
Louisiana and Guyana sugar industries, he returned to Louisiana State
University to complete his M.S. degree in Chemical Engineering in 1971.
He is presently a candidate for the Ph.D degree in Chemical
Engineering at Louisiana State University, and is currently employed
as a. design engineer with F. C. Schaffer and Associates.