the determinants of turkey’s export...
TRANSCRIPT

THE DETERMINANTS OF TURKEY’S EXPORT PERFORMANCE: CONSTANT MARKET SHARE ANALYSIS1
Aydanur GACENER ATIŞ*
Fatih SAYGILI**
Ayten Ayşen KAYA***
ABSTRACT
The purpose of this paper is to investigate the export performance of Turkey by Constant
Market Share method for the period 1995-2011. Turkey’s trade with its major trading partners (the
first 20 countries with largest shares in Turkey’s export) is analysed by using SITC Rev.3 three
digit data. The evaluation of Turkey’s export performance was based on market share effect,
commodity composition effect and commodity adaptation effect. The results reveal that the incre-
ase in Turkey’s export performance stemmed from positive market share and commodity compo-
sition effects. The commodity adaptation effect was mostly negative during the same period.
These findings lead us to conclude that Turkey may improve its export performance further by
adapting its export commodity group to the changing demand structure of these markets.
Keywords: Turkey, Export Performance, Constant Market Share Analysis.
TÜRKİYE’NİN İHRACAT PERFORMANSININ BELİRLEYENLERİ:
SABİT PAZAR PAYI ANALİZİ
ÖZ
Bu çalışmanın amacı, Sabit Pazar Payı (SPP) yöntemini kullanarak Türkiye’nin 1995-2011
dönemindeki ihracat performansını incelemektir. Türkiye’nin ihracat performansı pazar payı
etkisi, mal bileşimi etkisi ve mal uyum etkisine dayanarak açıklanmıştır. Bu etkileri belirlemek
için, Türkiye’nin en büyük ticaret ortakları (ihracatta en büyük paya sahip ilk yirmi ülke) ile ger-
çekleştirdiği ihracatının gelişimi, SITC. Rev. 3 sınıflamasına dahil 3 basamaklı mal gruplarına
ilişkin veriler ile analiz edilmiştir. Analiz sonuçlarına göre, ele alınan dönemde ülkemizin ihracat
performansını artırdığı, bu artışın da büyük oranda pazar payı ve mal bileşimi etkisiyle ortaya
çıktığı söylenebilir. Ancak mal uyum etkisi açısından büyük ölçüde bir olumsuzluk söz konusu-
dur. Bulgularımız, Türkiye’nin ihracat performansını arttırması için bu pazarların değişen talep
yapısına uygun mal ihracatını artırması ve geliştirmesi yönündedir.
Anahtar Kavramlar: Türkiye, İhracat Performansı, Sabit Pazar Payı Analizi.
1An earlier version of this paper was presented on 19-21 June 2013 in EconAnadolu Conference in Eskişehir/Turkey. * Yrd. Doç. Dr., Ege Üniversitesi, İktisadi ve İdari Bilimler Fakültesi, İktisat Bölümü. ** Doç. Dr., Ege Üniversitesi, İktisadi ve İdari Bilimler Fakültesi, İktisat Bölümü. *** Prof. Dr., Ege Üniversitesi, İktisadi ve İdari Bilimler Fakültesi, İktisat Bölümü.
Makalenin kabul tarihi: Şubat 2014.
42
Erciyes Üniversitesi İktisadi ve İdari Bilimler Fakültesi Dergisi, Sayı: 42, Temmuz-Aralık 2013 ss. 41-66
INTRODUCTION
The concept of export performance is described as the relative success of a
country to sell domestically produced goods and services in other countries. It is
also regarded as an indicator of a nation’s competitiveness in global markets. In
a broader sense, the export performance notion also includes the combination of
various factors such as, access to international markets, increasing the market
share and the price competitiveness, diversifying the export goods and becom-
ing a brand. In the 1980s, the international trade pattern of Turkey changed and
an export-led economic development strategy was implemented. Hence, the
improvement in Turkey’s export performance became a crucial factor of eco-
nomic growth. Therefore, various studies have been carried out to determine
Turkey’s export performance and its competitiveness. Most of these studies
investigate the changes of Turkey’s market share in its major trading countries’
and in the world export market.
The objective of this paper is to analyze Turkey’s export performance with
its major trading partners2 (the first 20 countries with highest share in its total
exports) by using Standard International Trade Classification three digit data
(SITC Rev.3) over the 1995-2011 period. This period is divided into three sub-
periods by taking into consideration the effects of economic and financial crises.
The export performance of Turkey is evaluated with the Constant Market Share
(CMS) Analysis method. In this method, the increase in the market share of a
country in world exports in a particular time period is measured by three main
effects: Market Share Effect (MSE), Commodity Composition Effect (CCE) and
Commodity Adaptation Effect (CAE). This paper aims to determine how these
three effects contributed to Turkey’s export performance in the world market.
The contributions of this paper are twofold. First, it provides a more de-
tailed CMS analysis since SITC Rev.3 digit data is used. Second, in our analy-
sis, the three main effects are comparatively evaluated in 3 sub-periods.
This paper is organized as follows; following the introduction, the second
section explains the general structure of Turkey’s trade with its major trading
partners. A literature survey and some previous studies are presented in the third
section. Section four and five provide detailed information about the CMS
Analysis method, describe the data set and reveal the empirical results. Finally,
in the last section, Turkey’s export performance with its trading partners is eval-
uated and in the light of the findings, the potential sectors and commodity
groups that contribute to Turkey’s export performance are identified.
2All EU-27 members, 8 of first 20 countries represented, Azerbaijan, United Arab Emirates (UAE), China, Iraq, Iran, Israel,
Libya, Russian Federation, Saudi Arabia, United States of America (USA), Egypt, and Algeria.
43
The Determinants of Turkey’s Export Performance: Constant Market Share Analysis
I. THE GENERAL STRUCTURE OF TURKEY’S FOREIGN
TRADE WITH ITS MAJOR TRADING PARTNERS
In this section, firstly the rate of changes in Turkey’s and world exports are included for the period 1995-2011. Secondly, Turkey’s exports to its major trad-ing partner countries’ (and to groups of countries) in its total exports, and the market share of Turkey in these countries’ imports are examined.
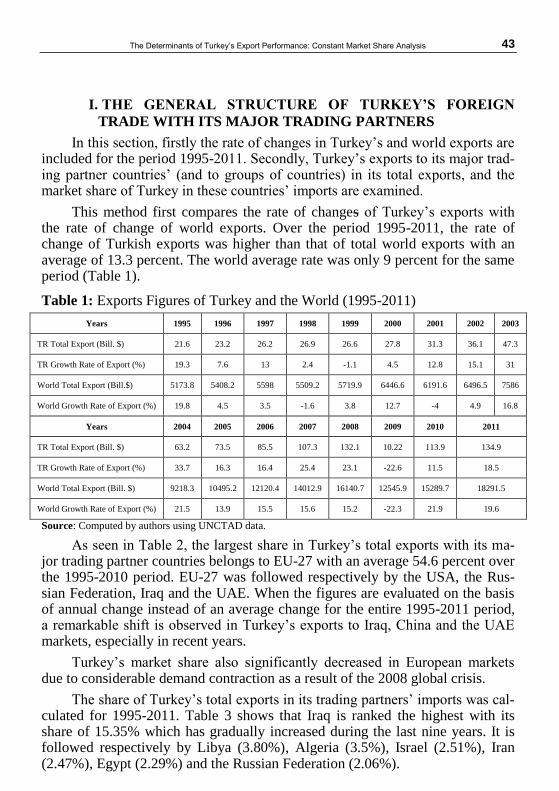
This method first compares the rate of changes of Turkey’s exports with the rate of change of world exports. Over the period 1995-2011, the rate of change of Turkish exports was higher than that of total world exports with an average of 13.3 percent. The world average rate was only 9 percent for the same period (Table 1).
Table 1: Exports Figures of Turkey and the World (1995-2011)
Years 1995 1996 1997 1998 1999 2000 2001 2002 2003
TR Total Export (Bill. $) 21.6 23.2 26.2 26.9 26.6 27.8 31.3 36.1 47.3
TR Growth Rate of Export (%) 19.3 7.6 13 2.4 -1.1 4.5 12.8 15.1 31
World Total Export (Bill.$) 5173.8 5408.2 5598 5509.2 5719.9 6446.6 6191.6 6496.5 7586
World Growth Rate of Export (%) 19.8 4.5 3.5 -1.6 3.8 12.7 -4 4.9 16.8
Years 2004 2005 2006 2007 2008 2009 2010 2011
TR Total Export (Bill. $) 63.2 73.5 85.5 107.3 132.1 10.22 113.9 134.9
TR Growth Rate of Export (%) 33.7 16.3 16.4 25.4 23.1 -22.6 11.5 18.5
World Total Export (Bill. $) 9218.3 10495.2 12120.4 14012.9 16140.7 12545.9 15289.7 18291.5
World Growth Rate of Export (%) 21.5 13.9 15.5 15.6 15.2 -22.3 21.9 19.6
Source: Computed by authors using UNCTAD data.
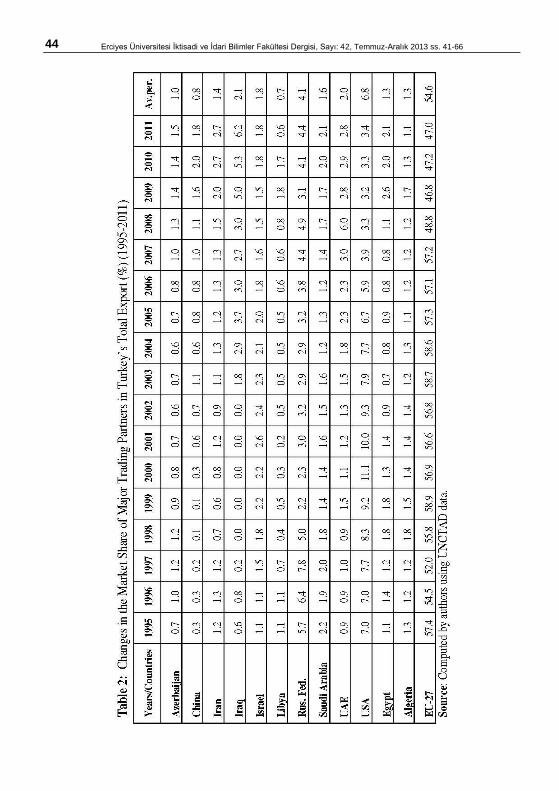
As seen in Table 2, the largest share in Turkey’s total exports with its ma-jor trading partner countries belongs to EU-27 with an average 54.6 percent over the 1995-2010 period. EU-27 was followed respectively by the USA, the Rus-sian Federation, Iraq and the UAE. When the figures are evaluated on the basis of annual change instead of an average change for the entire 1995-2011 period, a remarkable shift is observed in Turkey’s exports to Iraq, China and the UAE markets, especially in recent years.
Turkey’s market share also significantly decreased in European markets due to considerable demand contraction as a result of the 2008 global crisis.
The share of Turkey’s total exports in its trading partners’ imports was cal-culated for 1995-2011. Table 3 shows that Iraq is ranked the highest with its share of 15.35% which has gradually increased during the last nine years. It is followed respectively by Libya (3.80%), Algeria (3.5%), Israel (2.51%), Iran (2.47%), Egypt (2.29%) and the Russian Federation (2.06%).
44
Erciyes Üniversitesi İktisadi ve İdari Bilimler Fakültesi Dergisi, Sayı: 42, Temmuz-Aralık 2013 ss. 41-66

45
The Determinants of Turkey’s Export Performance: Constant Market Share Analysis
46
Erciyes Üniversitesi İktisadi ve İdari Bilimler Fakültesi Dergisi, Sayı: 42, Temmuz-Aralık 2013 ss. 41-66
II. LITERATURE SURVEY
The CMS analysis method was first used by Tyszynski (1951) to analyze
the changes of export performance of a country. Tyszynski analysed the changes
of exports of manufacturing industries of eleven countries with 16 commodity
groups for the period 1899-1950. In his model, he tried to explain the export
performance by the changes of the competitiveness effects of countries. This
model has been extended by adding the market share and the commodity effects
by Leamer and Stern (1970). Fagerberg and Sollie (1987) contributed to this
model by adding market share, commodity composition and commodity adapta-
tion effects (Tatater, 2004:3-4). In our study, we used the Fagerberg and Sollie
model (1987).
Othaman and Rashid (1993) used CMSA to measure ASEAN (Association
of Southeast Asian Nations) export growth performance relative to average
growth in the world export of wood products for the period 1979-1987. This
study’s findings revealed that both commodity and market effects were nega-
tive.
Drysdale and Lu (1996) analyzed the Australian export performance in the
East Asian market over 1980-1994 in terms of trade expansion, commodity
composition, geographic market structure and competitiveness effects by using
Richardson’s model (1971). The trade expansion effect indicated the potential
growth of Australia’s exports to East Asia if overall market share had remained
constant. This study was divided into the following two sub- periods: 1980-1985
and 1985-1994. In parallel with overall trade expansion in East Asia, Australia’s
exports substantially increased to this market, especially in the ten years after
1985. Since Australia specialized in commodities, for which the demand grew
relatively slowly in East Asia’s market, the commodity composition effect was
negative for both periods. In terms of the effect of geographic market structure,
a negative effect was found over 1980-1985, while the same effect was not sig-
nificant for the 1985-1994 period. The competitiveness effect was positive over
the period of 1980-1985, and Australia’s exports rose by 60 percent. Although
this effect was positive, Australia’s export growth remained at 9 percent for the
period 1985-1994.
Juswanto and Mulvanti (2003) used this method to identify the problems in
Indonesian manufacturing industries’ exports. They concluded that Indonesia,
while increasing its market share, could not achieve the same success in com-
modity diversification.
Ahmadi-Esfahani (2006) analysed the export performance of the Australian
processed food sector in the South-East Asian (SEA) region over the 1980–2003
period. He found that the export performance of Australia in SEA’s market has
47
The Determinants of Turkey’s Export Performance: Constant Market Share Analysis
been determined by market share effect but its export performance has been
different in sub-periods. The increase of the Australian processed food export
was quite low in the 1980-1985 period. In the two fast-growing periods, 1985–
1990 and 1990–1997, the scale effect played an important role. In 1985–1990,
Australia’s weighted market share did not change, but in 1990–1997, the
weighted market share improved significantly.
Batista (2008) investigated Brazil’s exports of manufactured products to
the US market, in comparison with twenty-five OECD countries over the 1992-
2004 period. Brazil lost its market share in the period between 1992-1999 and
relatively increased its competitiveness in the manufacturing industry in the
period between 1999-2004. While Brazil increased its market share vis-à-vis
industrialized countries in exports of non high tech products during both peri-
ods, its competitiveness was quite low in the world exports market. The gains
and losses of Brazil to OECD countries have been explained by changes in the
relative unit labour cost of these countries.
Nilsson, F.O.L., Lindberg E. and Surry Y. (2007), used the CMS method to
assess the fresh fruit and vegetable export performance of the Mediterranean
Countries. Two different measures were used: the competitiveness of these
countries both in world export markets and their competitiveness in European
markets (their major trading partner countries). The results demonstrated that
their competitiveness gradually got worse over time. The performance of some
countries, which increased the market share in both markets, derived from mar-
ket share effects.
Amador and Cabral (2008) examined the evolution of Portuguese market
shares in world exports over the 1968-2006 period, in comparison with other
Southern European countries and Ireland by taking into account the impact of
commodity and geographical composition. Overall, during this period, the mar-
ket share effect was negative due to Portuguese low-technology exports prod-
ucts in the world market. The impact of geographical composition of Portuguese
exports adversely affected its market share.
Skriner (2009) used CMS analysis to investigated the development of
competitiveness, market and product structure of the Austrian merchandise
exports from 1990 to 2006. The long term trend of the indicaters suggest that
Austrian foreign trade sector was able to maintain its market share in the world
market however, the market and product structure effects showed negative
trends after 2000.
Gilbert (2010) analyzed the export growth of ASEAN 6 economies (Indo-
nesia, Philippines, Singapore, Thailand, Malaysia and Vietnam) for the period
2000-2009, based on four different components: world trade effect, commodity
48
Erciyes Üniversitesi İktisadi ve İdari Bilimler Fakültesi Dergisi, Sayı: 42, Temmuz-Aralık 2013 ss. 41-66
effect, market effect and competitiveness effect. Four (Indonesia, Singapore,
Thailand, and Vietnam) of the economies displayed a higher export growth
than that of the world export. Indonesia’s and Vietnam’s contributions had been
sourced by commodity effect. Except for the Philippines, the market share ef-
fect was positive for the other countries. The competitiveness effect was only
positive in Singapore, Thailand and Vietnam.
Rahmaddi and Masaru (2012) investigated the evolution of export structure
and competitiveness in Indonesia’smanufacturing sectors from 1987 to 2008.
The findings of their CMS anaysis revealed that Indonesia export performance
was deteriorated by negative contributions of commodity composition, market
distribution, and competitiveness effects.
Various studies have also been carried out to analyze the export perfor-
mance of Turkey, using the CMS model. Erlat and Erlat (2004) analyzed the
export performance of Turkey to Middle East countries over the 1990-2000
period. Their results show that Turkey’s market share decreased due to negative
commodity adaptation effect. Even in the case of a rising market share, the
commodity adaptation effect contribution was negative. They concluded that
Turkey was not able to adapt its exports to changes of import composition of
these countries.
Tatarer (2004) examined Turkey’s manufacturing industry’s export per-
formance in the East-Asian countries over the 1992-2002 period. The composi-
tion effect was found positive for Malaysia and China and negative for Singa-
pore, South Korea and Japan. The opposite is true in terms of the market adapta-
tion effect, since it was negative for China and Malaysia and positive for the
other three countries. When three periods and five countries are considered alto-
gether, it is observed that except for Malaysia and Singapore, Turkey’s market
shares decreased before the Asian Crisis of 1997. After 1997, Turkey lost its
share even in the Malaysia and Singapore markets.
Klasra and Fidan (2005) investigated the competitiveness of major export-
ing countries and Turkey in the world Fishery Market by using CMS analysis
for the sample period (1980-2000) .Turkey benefited from the growth of world
export like other major exporters. The findings of their analysis of commodity
composition and market effects reveal that countries like Canada, the United
States, Iceland and Turkey were pursuing the product differentiation policy and
were penetrating in those markets, which have been growing relatively faster.
Aytemiz (2011) investigated the export performance of the Turkish Manu-
facturing Industry in the world export market over the 1995–2010 period. In this
period, Turkey's market share increased because of the positive competitiveness
effect. Commodity effect was negative over time. Her study concludes that the
49
The Determinants of Turkey’s Export Performance: Constant Market Share Analysis
main reason behind the increase of Turkey’s manufacturing industry exports
was price competitiveness. Furthermore, the increase in Turkey's exports was
relatively slow during this period, due to the high proportion of labor-intensive
sectors in Turkey's manufacturing industry export.
Şahan (2012) examined the source of changes of Turkey’s export market
share over 2003-2008. In this period, the structure of its export market signifi-
cantly changed because of positive structural market effect. In terms of technol-
ogies, the high tech industries contributed positively to these changes over the
2003-2008 period. He concluded that, although low technology industries still
have strong positive effects, Turkey’s export structure is changing towards high
tech and dynamic industries gradually.
III. METHODS AND DATA
In this study, Turkey’s trade with its major trading partners is analysed by
using SITC. Rev.3, three digit data covering 259 product groups for the period
1995-2011. This data was obtained from UNCTAD’s statistic database and
analysed using the CMS method3. CMS Analysis is used to explain the causes of
the change in the market shares of the exports of a certain country over time.
According to this method, the increase of a country’s market share in the world
exports for a given time period is mainly determined by three effects. These
are; the market share effect (MSE), commodity composition effect (CCE) and
commodity adaptation effect (CAE).
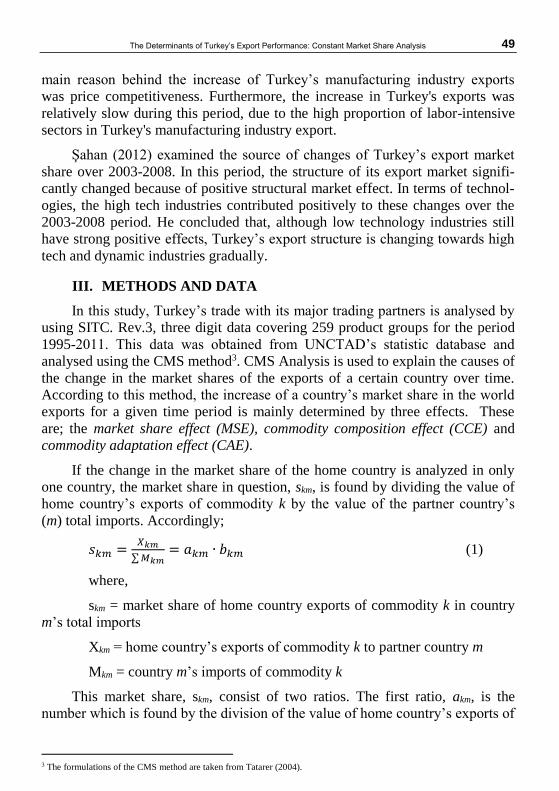
If the change in the market share of the home country is analyzed in only
one country, the market share in question, skm, is found by dividing the value of
home country’s exports of commodity k by the value of the partner country’s
(m) total imports. Accordingly;
𝑠𝑘𝑚 =𝑋𝑘𝑚
∑ 𝑀𝑘𝑚= 𝑎𝑘𝑚 ∙ 𝑏𝑘𝑚 (1)
where,
skm = market share of home country exports of commodity k in country
m’s total imports
Xkm = home country’s exports of commodity k to partner country m
Mkm = country m’s imports of commodity k
This market share, skm, consist of two ratios. The first ratio, akm, is the
number which is found by the division of the value of home country’s exports of
3 The formulations of the CMS method are taken from Tatarer (2004).
50
Erciyes Üniversitesi İktisadi ve İdari Bilimler Fakültesi Dergisi, Sayı: 42, Temmuz-Aralık 2013 ss. 41-66
commodity k(𝑋𝑘𝑚), to country m by the value of country m’s imports of com-
modity k (𝑀𝑘𝑚).
𝑎𝑘𝑚 =𝑋𝑘𝑚
𝑀𝑘𝑚 (2)
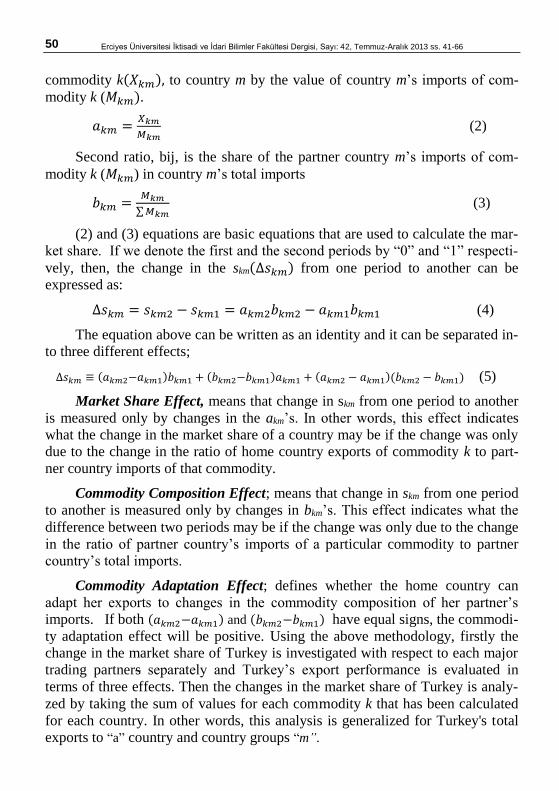
Second ratio, bij, is the share of the partner country m’s imports of com-
modity k (𝑀𝑘𝑚) in country m’s total imports
𝑏𝑘𝑚 =𝑀𝑘𝑚
∑ 𝑀𝑘𝑚 (3)
(2) and (3) equations are basic equations that are used to calculate the mar-
ket share. If we denote the first and the second periods by “0” and “1” respecti-
vely, then, the change in the skm(∆𝑠𝑘𝑚) from one period to another can be
expressed as:
∆𝑠𝑘𝑚 = 𝑠𝑘𝑚2 − 𝑠𝑘𝑚1 = 𝑎𝑘𝑚2𝑏𝑘𝑚2 − 𝑎𝑘𝑚1𝑏𝑘𝑚1 (4)
The equation above can be written as an identity and it can be separated in-
to three different effects;
∆𝑠𝑘𝑚 ≡ (𝑎𝑘𝑚2−𝑎𝑘𝑚1)𝑏𝑘𝑚1 + (𝑏𝑘𝑚2−𝑏𝑘𝑚1)𝑎𝑘𝑚1 + (𝑎𝑘𝑚2 − 𝑎𝑘𝑚1)(𝑏𝑘𝑚2 − 𝑏𝑘𝑚1) (5)
Market Share Effect, means that change in skm from one period to another
is measured only by changes in the akm’s. In other words, this effect indicates
what the change in the market share of a country may be if the change was only
due to the change in the ratio of home country exports of commodity k to part-
ner country imports of that commodity.
Commodity Composition Effect; means that change in skm from one period
to another is measured only by changes in bkm’s. This effect indicates what the
difference between two periods may be if the change was only due to the change
in the ratio of partner country’s imports of a particular commodity to partner
country’s total imports.
Commodity Adaptation Effect; defines whether the home country can
adapt her exports to changes in the commodity composition of her partner’s
imports. If both (𝑎𝑘𝑚2−𝑎𝑘𝑚1) and (𝑏𝑘𝑚2−𝑏𝑘𝑚1) have equal signs, the commodi-
ty adaptation effect will be positive. Using the above methodology, firstly the
change in the market share of Turkey is investigated with respect to each major
trading partners separately and Turkey’s export performance is evaluated in
terms of three effects. Then the changes in the market share of Turkey is analy-
zed by taking the sum of values for each commodity k that has been calculated
for each country. In other words, this analysis is generalized for Turkey's total
exports to “a” country and country groups “m”.
51
The Determinants of Turkey’s Export Performance: Constant Market Share Analysis
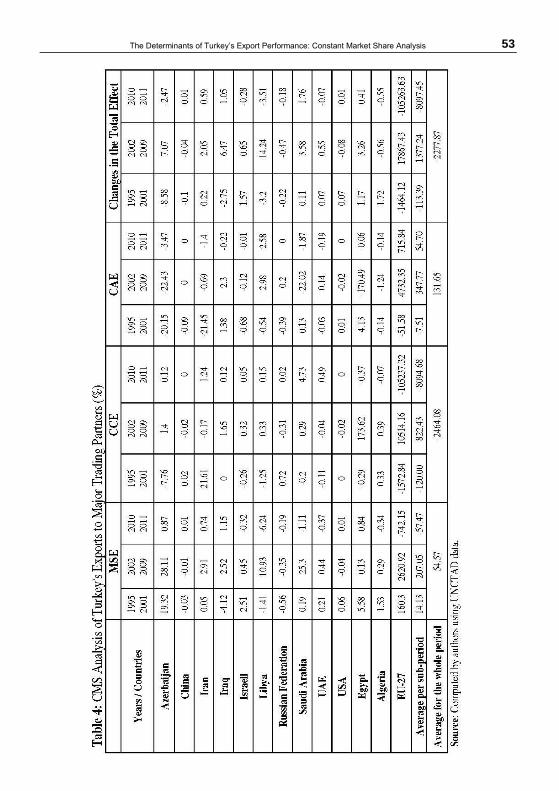
IV. THE FINDINGS OF CMS ANALYSIS
Considering the effects of financial crises (2000 November-2001 February
economic crises in Turkey and 2008 global financial crises), the 1995-2011
period is divided into 3 main sub-periods (1995-2001, 2002-2009 and 2010-
2011). The columns represent respectively market share effect, commodity com-
position effect and commodity adaptation effect. The last column shows the
changes in total effect of the first three columns (∆skm).
As stated earlier, by using SITC Rev 3 digit data the magnitude of export
figures of commodities are taken into account and the calculation is made for
each commodity (k) in these sectors. Finally by aggregating the data, the factors
that affect the changes in Turkey’s export performance with its trading partners
are determined.
The findings from Table 4 can be summarized as follows;
- In the first sub- period between 1995-2001, Turkey’s export performan-
ce decreased because of a decrease both in commodity composition effect
and commodity adaptation effect. In this period, an increase in market
share effect is observed, especially in Israel, Azerbaijan, Egypt and EU-
27 markets. Overall, the same result is found (as an average of all tra-
ding partners). Commodity composition effect was the main reason be-
hind the decline of Turkey’s export performance.
- In the second sub-period between 2002-2009, Turkey’s overall export
performance increased and all three effects contributed positively. This
mainly stemmed from a crucial contribution of EU-27 markets in all
three effects. There has been a slight decrease in market share effect in
China, Russian Federation and USA markets while a strong market sha-
re effect has been observed for Saudi Arabia, Libya, Azerbaijan and EU-
27 markets. In Egypt and EU-27 markets, commodity composition effect
was the most dominant effect. The negative effects of this period were
outweighed by the positive effects of EU-27 markets. The magnitude
and the positive contribution of EU-27 markets in all three effects was
the main reason behind the rising export performance of Turkey in this
period. Therefore, EU-27 markets can be regarded as the right market
where Turkey exported right goods. Moreover, Turkey was also able to
adapt its exports to the changing demand structure of EU-27 markets du-
ring this period.
During the last sub-period between 2010-11, Turkey’s foreign trade and
real sector were affected to a great extent by the global financial crisis. Especi-
ally in EU markets, the substantial contraction of demand lead to a decrease in
52
Erciyes Üniversitesi İktisadi ve İdari Bilimler Fakültesi Dergisi, Sayı: 42, Temmuz-Aralık 2013 ss. 41-66
Turkey’s export to this major trading partner. In this period, commodity compo-
sition effect and market share effect were negative in EU-27 markets, while the
commodity adaptation effect was positive. Although Turkey adapted its commo-
dity exports to the changing demand structure of EU markets, the positive com-
modity adaptation effect of this period could not compensate for the negative
impact of commodity composition effect and market share effect. On the other
hand, commodity composition effect was the most dominant negative effect whi-
le market share effect was positive in Azerbaijan, China, Iraq, Iran and Egypt. In
other trading partners’ market commodity composition effect was also positive
except Egypt, Algeria and EU-27 markets. The overall average of this period is
mainly determined by the negative effects (MSE and CCE) of EU-27 markets.
There has been at least one negative effect in all countries, except China, which
caused a decrease in Turkey’s export performance in this period.
53
The Determinants of Turkey’s Export Performance: Constant Market Share Analysis

54
Erciyes Üniversitesi İktisadi ve İdari Bilimler Fakültesi Dergisi, Sayı: 42, Temmuz-Aralık 2013 ss. 41-66
Table 5: The First 10 Commodities Contributing Turkey’s Export Performance
in the Major Trading Partners Market
Co
un
trie
s
Aze
rba
ija
n
Ch
ina
Ira
n
Ira
q
Isra
el
Lib
ya
Ru
s.F
ed.
Sa
u.A
rab
ia
UA
E
US
A
Eg
yp
t
Alg
eria
EU
-27
SITC
Rev.3, 3
Digits
Codes
061
691
782
897
723
773
661
679
351
821
793 652
764
611
653
273
579 898
278
613
676 634
792
784
821
775
737 653
057
061
676 431
046
057
012
691
773 025
048
421
676 793
773
775
893
662
334 842
642
682
046 676
581
659
042
048
012 073
893
334
057 655
054
653
781
334
793 581
897
728
659 672
773
771
676
783
057 048
661
625
971 334
897
335
771
681
811 821
773
772
792 781
661
714
679
659
793 784
897
621
676 334
672
041
841
679
652 673
697
842
679 723
773
691
728
041
655 771
741
811
263 278
621
713
812
665
775 784
657
581
Source: Computed by authors using UNCTAD data
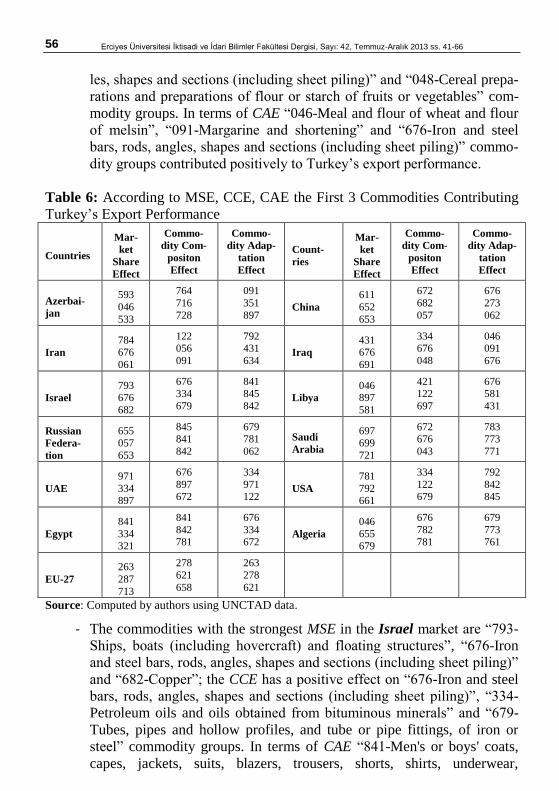
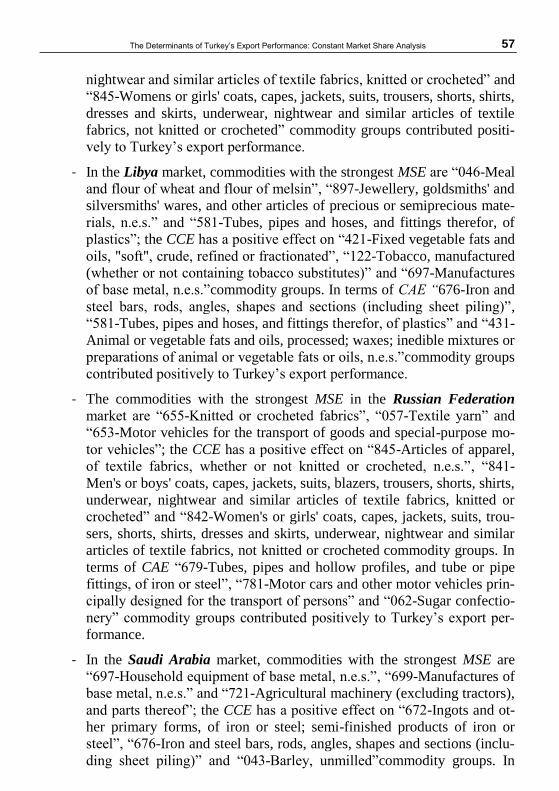
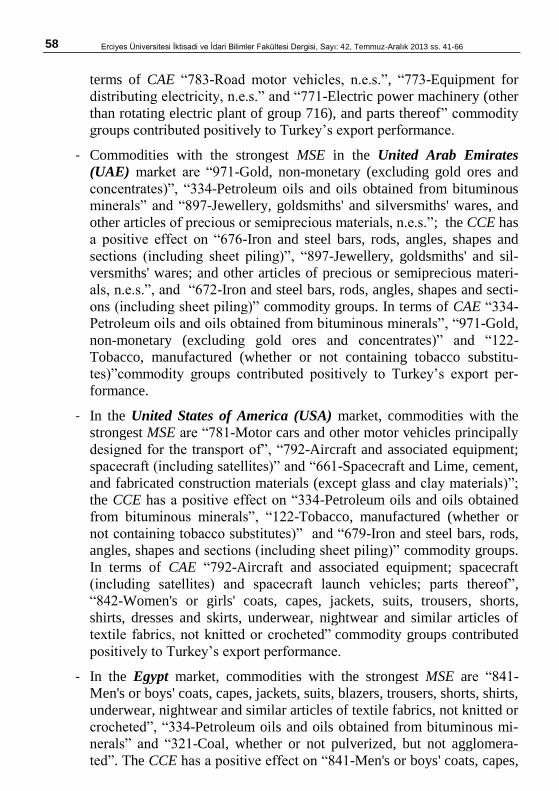
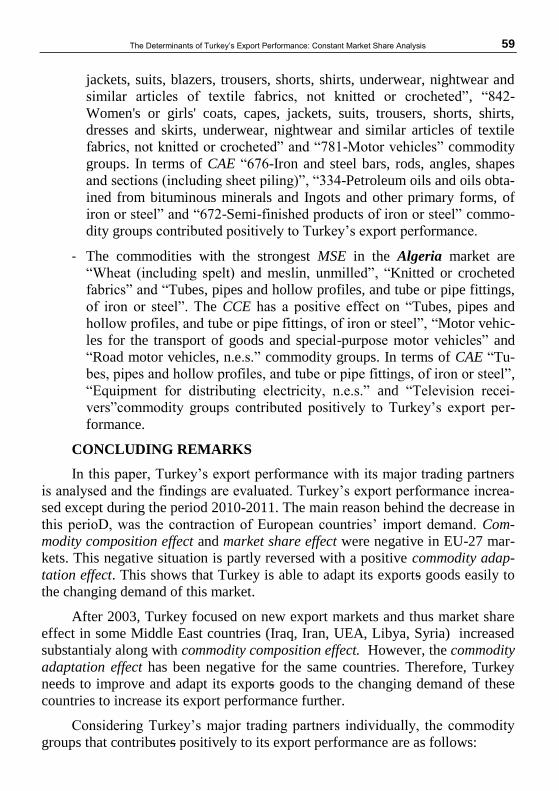
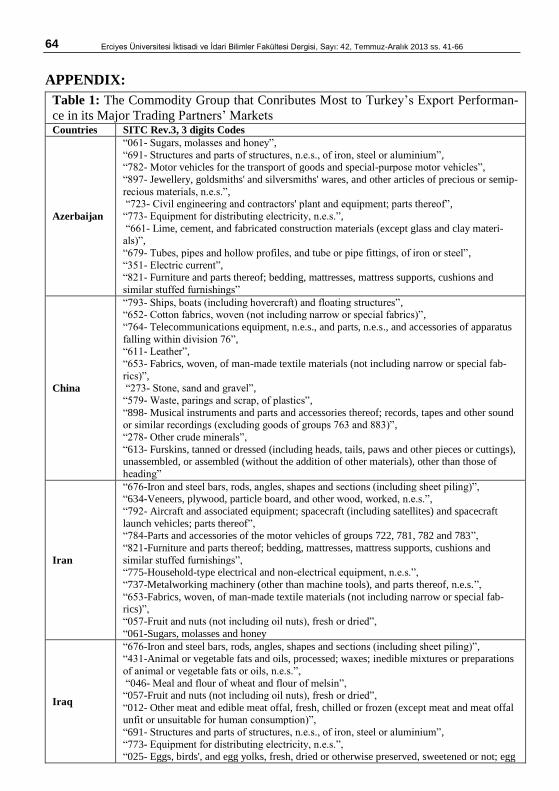
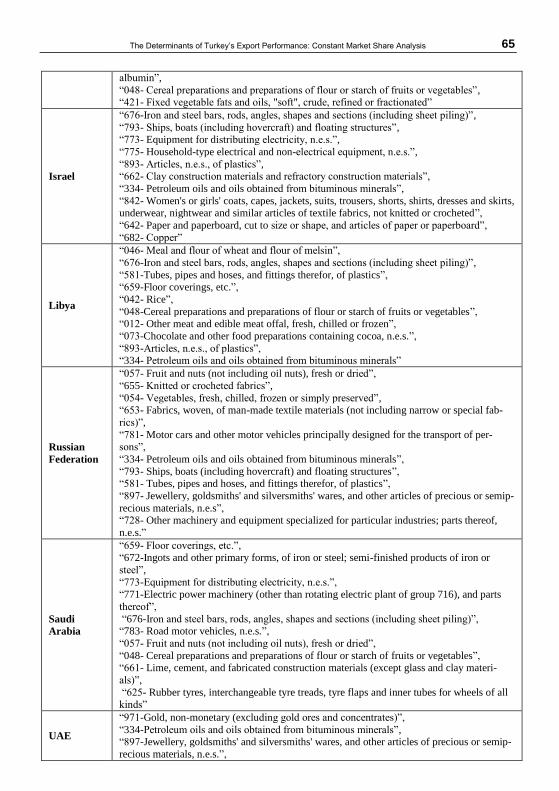
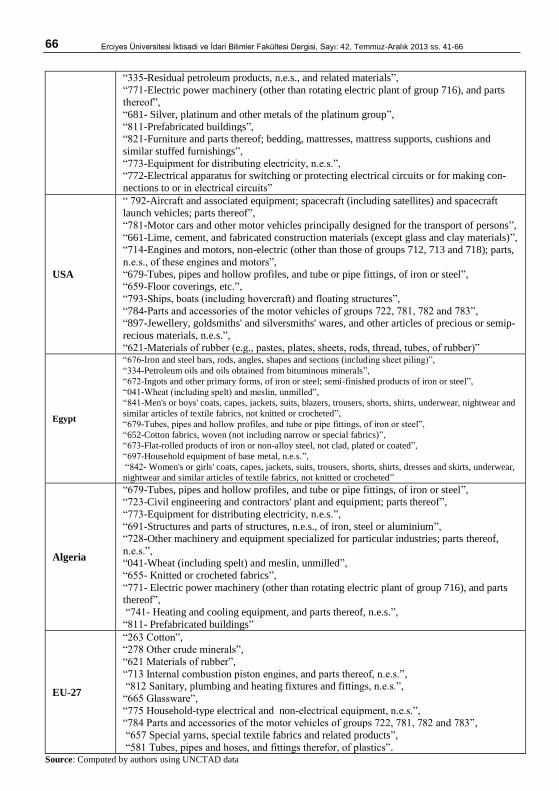
Table 5 is constructed with respect to SITC Rev.3, 3.digit commodity
groups. The findings are interpreted for each country considering the overall
average of the same period. The results helped us to determine the potential
sectors and commodity groups that may increase the competitiveness of Turkey.
For this purpose, the first 10 commodity groups4 that contribute the most to
Turkey’s exports are determined and the factors (MSE, CCE, CAE) that influ-
ence this performance are evaluated for the first three commodity groups.The
results are summarized and illustrated in Table 6 as follows:
- The commodity groups that contribute most to Turkey’s export perfor-
mance according to MSE in EU-27 markets are “263-Ores and concent-
rates of base metals, n.e.s.,”, “287-Cotton” and “713-Internal combus-
tion piston engines, and parts thereof, n.e.s.”; the CCE has a positive ef-
fect on “278-Other crude minerals”, “621-Materials of rubber (e.g., pas-
tes, plates, sheets, rods, thread, tubes, of rubber) and “678-Other textile
fabrics, woven” commodity groups. In terms of CAE “Ores and concent-
rates of base metals, n.e.s.”, “Materials of rubber” and “Other crude mi-
nerals” commodity groups contributed positively to Turkey’s export per-
formance.
- In the Azerbaijan market, commodities with the strongest MSE are “593-
Explosives and pyrotechnic products”, “046-Meal and flour of wheat
and flour of melsin” and “533-Pigments, paints, varnishes and related
materials”; the CCE has a positive effect on “764-Telecommunications
4 For more information see Appendix Table 1.
55
The Determinants of Turkey’s Export Performance: Constant Market Share Analysis
equipment, n.e.s., and parts, n.e.s. and accessories of apparatus falling
within division 76”, “716-Rotating electric plant, and parts thereof,
n.e.s.” and “728-Other machinery and equipment specialized for particu-
lar industries; parts thereof, n.e.s.” commodity groups. There is a positi-
ve effect in terms of CAE on “091-Margarine and shortening”, “351-
Electric current” and “897-Jewellery, goldsmiths' and silversmiths'
wares, and other articles of precious or semiprecious materials, n.e.s”
commodity groups contributed positively to Turkey’s export performan-
ce.
- Commodities with the strongest MSE in the China market are “611-
Cotton fabrics, woven (not including narrow or special fabrics), abrics,
woven, of man-made textile materials (not including narrow or special
fabrics)”, “Leather”; the CCE has a positive effect on “672-Ingots and
other primary forms, of iron or steel; semi-finished products of iron or
steel”, “682-Copper” and “057-Fruit and nuts (not including oil nuts),
fresh or dried” commodity groups. In terms of CAE “676-Iron and steel
bars, rods, angles, shapes and sections (including sheet piling)”, “273-
Stone, sand and gravel” and“062-Sugar confectionery” commodity gro-
ups contributed positively to Turkey’s export performance.
- The commodity groups with the strongest MSE in the Iran market are
“784-Parts and accessories of the motor vehicles of groups 722, 781, 782
and 783”, “676-Iron and steel bars, rods, angles, shapes and sections
(including sheet piling)” and “061-Sugars, molasses and honey”; the
CCE has a positive effect on “122-Tobacco, manufactured (whether or
not containing tobacco substitutes)”, “056-Vegetables, roots and tubers,
prepared or preserved, n.e.s”. and “091-Margarine and shortening”
commodity groups. In terms of CAE “792-Aircraft and associated
equipment; spacecraft (including satellites) and spacecraft launch vehic-
les; parts thereof”, “431-Animal or vegetable fats and oils, processed;
waxes; inedible mixtures or preparations of animal or vegetable fats or
oils, n.e.s.” and “634-Veneers, plywood, particle board, and other wood,
worked, n.e.s.” commodity groups contributed positively to Turkey’s
export performance.
- In the Iraq market, commodities with the strongest MSE are “431-
Animal or vegetable fats and oils, processed; waxes; inedible mixtures or
preparations of animal or vegetable fats or oils, n.e.s.”, “676-Iron and
steel bars, rods, angles, shapes and sections (including sheet piling)” and
“691-Structures and parts of structures, n.e.s., of iron, steel or alumi-
nium”; the CCE has a positive effect on“334-Petroleum oils and oils
obtained from bituminous minerals”, “676-Iron and steel bars, rods, ang-
56
Erciyes Üniversitesi İktisadi ve İdari Bilimler Fakültesi Dergisi, Sayı: 42, Temmuz-Aralık 2013 ss. 41-66
les, shapes and sections (including sheet piling)” and “048-Cereal prepa-
rations and preparations of flour or starch of fruits or vegetables” com-
modity groups. In terms of CAE “046-Meal and flour of wheat and flour
of melsin”, “091-Margarine and shortening” and “676-Iron and steel
bars, rods, angles, shapes and sections (including sheet piling)” commo-
dity groups contributed positively to Turkey’s export performance.
Table 6: According to MSE, CCE, CAE the First 3 Commodities Contributing
Turkey’s Export Performance
Countries
Mar-
ket
Share
Effect
Commo-
dity Com-
positon
Effect
Commo-
dity Adap-
tation
Effect
Count-
ries
Mar-
ket
Share
Effect
Commo-
dity Com-
positon
Effect
Commo-
dity Adap-
tation
Effect
Azerbai-
jan
593
046
533
764
716
728
091
351
897 China
611
652
653
672
682
057
676
273
062
Iran
784 676
061
122 056
091
792 431
634 Iraq
431 676
691
334 676
048
046 091
676
Israel
793 676
682
676 334
679
841 845
842 Libya
046 897
581
421 122
697
676 581
431
Russian
Federa-
tion
655 057
653
845 841
842
679 781
062
Saudi
Arabia
697 699
721
672 676
043
783 773
771
UAE
971
334 897
676
897 672
334
971 122
USA
781
792 661
334
122 679
792
842 845
Egypt
841
334 321
841
842 781
676
334 672
Algeria
046
655 679
676
782 781
679
773 761
EU-27
263
287
713
278
621
658
263
278
621
Source: Computed by authors using UNCTAD data.
- The commodities with the strongest MSE in the Israel market are “793-
Ships, boats (including hovercraft) and floating structures”, “676-Iron
and steel bars, rods, angles, shapes and sections (including sheet piling)”
and “682-Copper”; the CCE has a positive effect on “676-Iron and steel
bars, rods, angles, shapes and sections (including sheet piling)”, “334-
Petroleum oils and oils obtained from bituminous minerals” and “679-
Tubes, pipes and hollow profiles, and tube or pipe fittings, of iron or
steel” commodity groups. In terms of CAE “841-Men's or boys' coats,
capes, jackets, suits, blazers, trousers, shorts, shirts, underwear,
57
The Determinants of Turkey’s Export Performance: Constant Market Share Analysis
nightwear and similar articles of textile fabrics, knitted or crocheted” and
“845-Womens or girls' coats, capes, jackets, suits, trousers, shorts, shirts,
dresses and skirts, underwear, nightwear and similar articles of textile
fabrics, not knitted or crocheted” commodity groups contributed positi-
vely to Turkey’s export performance.
- In the Libya market, commodities with the strongest MSE are “046-Meal
and flour of wheat and flour of melsin”, “897-Jewellery, goldsmiths' and
silversmiths' wares, and other articles of precious or semiprecious mate-
rials, n.e.s.” and “581-Tubes, pipes and hoses, and fittings therefor, of
plastics”; the CCE has a positive effect on “421-Fixed vegetable fats and
oils, "soft", crude, refined or fractionated”, “122-Tobacco, manufactured
(whether or not containing tobacco substitutes)” and “697-Manufactures
of base metal, n.e.s.”commodity groups. In terms of CAE “676-Iron and
steel bars, rods, angles, shapes and sections (including sheet piling)”,
“581-Tubes, pipes and hoses, and fittings therefor, of plastics” and “431-
Animal or vegetable fats and oils, processed; waxes; inedible mixtures or
preparations of animal or vegetable fats or oils, n.e.s.”commodity groups
contributed positively to Turkey’s export performance.
- The commodities with the strongest MSE in the Russian Federation
market are “655-Knitted or crocheted fabrics”, “057-Textile yarn” and
“653-Motor vehicles for the transport of goods and special-purpose mo-
tor vehicles”; the CCE has a positive effect on “845-Articles of apparel,
of textile fabrics, whether or not knitted or crocheted, n.e.s.”, “841-
Men's or boys' coats, capes, jackets, suits, blazers, trousers, shorts, shirts,
underwear, nightwear and similar articles of textile fabrics, knitted or
crocheted” and “842-Women's or girls' coats, capes, jackets, suits, trou-
sers, shorts, shirts, dresses and skirts, underwear, nightwear and similar
articles of textile fabrics, not knitted or crocheted commodity groups. In
terms of CAE “679-Tubes, pipes and hollow profiles, and tube or pipe
fittings, of iron or steel”, “781-Motor cars and other motor vehicles prin-
cipally designed for the transport of persons” and “062-Sugar confectio-
nery” commodity groups contributed positively to Turkey’s export per-
formance.
- In the Saudi Arabia market, commodities with the strongest MSE are
“697-Household equipment of base metal, n.e.s.”, “699-Manufactures of
base metal, n.e.s.” and “721-Agricultural machinery (excluding tractors),
and parts thereof”; the CCE has a positive effect on “672-Ingots and ot-
her primary forms, of iron or steel; semi-finished products of iron or
steel”, “676-Iron and steel bars, rods, angles, shapes and sections (inclu-
ding sheet piling)” and “043-Barley, unmilled”commodity groups. In
58
Erciyes Üniversitesi İktisadi ve İdari Bilimler Fakültesi Dergisi, Sayı: 42, Temmuz-Aralık 2013 ss. 41-66
terms of CAE “783-Road motor vehicles, n.e.s.”, “773-Equipment for
distributing electricity, n.e.s.” and “771-Electric power machinery (other
than rotating electric plant of group 716), and parts thereof” commodity
groups contributed positively to Turkey’s export performance.
- Commodities with the strongest MSE in the United Arab Emirates
(UAE) market are “971-Gold, non-monetary (excluding gold ores and
concentrates)”, “334-Petroleum oils and oils obtained from bituminous
minerals” and “897-Jewellery, goldsmiths' and silversmiths' wares, and
other articles of precious or semiprecious materials, n.e.s.”; the CCE has
a positive effect on “676-Iron and steel bars, rods, angles, shapes and
sections (including sheet piling)”, “897-Jewellery, goldsmiths' and sil-
versmiths' wares; and other articles of precious or semiprecious materi-
als, n.e.s.”, and “672-Iron and steel bars, rods, angles, shapes and secti-
ons (including sheet piling)” commodity groups. In terms of CAE “334-
Petroleum oils and oils obtained from bituminous minerals”, “971-Gold,
non-monetary (excluding gold ores and concentrates)” and “122-
Tobacco, manufactured (whether or not containing tobacco substitu-
tes)”commodity groups contributed positively to Turkey’s export per-
formance.
- In the United States of America (USA) market, commodities with the
strongest MSE are “781-Motor cars and other motor vehicles principally
designed for the transport of”, “792-Aircraft and associated equipment;
spacecraft (including satellites)” and “661-Spacecraft and Lime, cement,
and fabricated construction materials (except glass and clay materials)”;
the CCE has a positive effect on “334-Petroleum oils and oils obtained
from bituminous minerals”, “122-Tobacco, manufactured (whether or
not containing tobacco substitutes)” and “679-Iron and steel bars, rods,
angles, shapes and sections (including sheet piling)” commodity groups.
In terms of CAE “792-Aircraft and associated equipment; spacecraft
(including satellites) and spacecraft launch vehicles; parts thereof”,
“842-Women's or girls' coats, capes, jackets, suits, trousers, shorts,
shirts, dresses and skirts, underwear, nightwear and similar articles of
textile fabrics, not knitted or crocheted” commodity groups contributed
positively to Turkey’s export performance.
- In the Egypt market, commodities with the strongest MSE are “841-
Men's or boys' coats, capes, jackets, suits, blazers, trousers, shorts, shirts,
underwear, nightwear and similar articles of textile fabrics, not knitted or
crocheted”, “334-Petroleum oils and oils obtained from bituminous mi-
nerals” and “321-Coal, whether or not pulverized, but not agglomera-
ted”. The CCE has a positive effect on “841-Men's or boys' coats, capes,
59
The Determinants of Turkey’s Export Performance: Constant Market Share Analysis
jackets, suits, blazers, trousers, shorts, shirts, underwear, nightwear and
similar articles of textile fabrics, not knitted or crocheted”, “842-
Women's or girls' coats, capes, jackets, suits, trousers, shorts, shirts,
dresses and skirts, underwear, nightwear and similar articles of textile
fabrics, not knitted or crocheted” and “781-Motor vehicles” commodity
groups. In terms of CAE “676-Iron and steel bars, rods, angles, shapes
and sections (including sheet piling)”, “334-Petroleum oils and oils obta-
ined from bituminous minerals and Ingots and other primary forms, of
iron or steel” and “672-Semi-finished products of iron or steel” commo-
dity groups contributed positively to Turkey’s export performance.
- The commodities with the strongest MSE in the Algeria market are
“Wheat (including spelt) and meslin, unmilled”, “Knitted or crocheted
fabrics” and “Tubes, pipes and hollow profiles, and tube or pipe fittings,
of iron or steel”. The CCE has a positive effect on “Tubes, pipes and
hollow profiles, and tube or pipe fittings, of iron or steel”, “Motor vehic-
les for the transport of goods and special-purpose motor vehicles” and
“Road motor vehicles, n.e.s.” commodity groups. In terms of CAE “Tu-
bes, pipes and hollow profiles, and tube or pipe fittings, of iron or steel”,
“Equipment for distributing electricity, n.e.s.” and “Television recei-
vers”commodity groups contributed positively to Turkey’s export per-
formance.
CONCLUDING REMARKS
In this paper, Turkey’s export performance with its major trading partners
is analysed and the findings are evaluated. Turkey’s export performance increa-
sed except during the period 2010-2011. The main reason behind the decrease in
this perioD, was the contraction of European countries’ import demand. Com-
modity composition effect and market share effect were negative in EU-27 mar-
kets. This negative situation is partly reversed with a positive commodity adap-
tation effect. This shows that Turkey is able to adapt its exports goods easily to
the changing demand of this market.
After 2003, Turkey focused on new export markets and thus market share
effect in some Middle East countries (Iraq, Iran, UEA, Libya, Syria) increased
substantialy along with commodity composition effect. However, the commodity
adaptation effect has been negative for the same countries. Therefore, Turkey
needs to improve and adapt its exports goods to the changing demand of these
countries to increase its export performance further.
Considering Turkey’s major trading partners individually, the commodity
groups that contributes positively to its export performance are as follows:
60
Erciyes Üniversitesi İktisadi ve İdari Bilimler Fakültesi Dergisi, Sayı: 42, Temmuz-Aralık 2013 ss. 41-66
057-Fruit and nuts (not including oil nuts), fresh or dried (Iran, Iraq,
Russian Federation, Saudi Arabia),
334-Petroleum oils and oils obtained from bituminous minerals (other
than crude); preparations, n.e.s., containing by weight 70% or more of
petroleum oils or of oils obtained from bituminous minerals, these oils
being the basic constituents of the preparations (Israel, Libya, Russsian
Federation, UAE, Egypt)
676-Iron and steel bars, rods, angles, shapes and sections (including
sheet piling) (Iran, Iraq, Saudi Arabia, Israel, Libya, Egypt)
773-Equipment for distributing electricity, n.e.s. (Iraq, Saudi Arabia, Is-
rael, UAE, Cezayir, Azerbaijan)
793-Ships, boats (including hovercraft) and floating structures (China,
Israel, USA, Russsian Federation)
897-Jewellery, goldsmiths' and silversmiths' wares, and other articles of
precious or semiprecious materials, n.e.s. (UAE, Azerbaijan, Russsian
Federation, USA)
Turkey’s s export performance is also analysed in these markets in terms of
three effects;
- when market share effect is considered, the main commodity groups that
contributes positively to its export performance are “Meal and flour of
wheat and flour of meslin”, “Iron and steel bars, rods, angles, shapes and
sections (including sheet piling)”, “Jewellery, goldsmiths' and silvers-
miths' wares, and other articles of precious or semiprecious materials,
n.e.s”. Generally, the market share effect is positive for the textile, iron
and steel and motor vehicles commodity groups.
- In terms of positive CCE, “Tobacco, manufactured (whether or not con-
taining tobacco substitutes)”, “Petroleum oils and oils obtained from bi-
tuminous minerals (other than crude); preparations, n.e.s., containing by
weight 70% or more of petroleum oils or of oils obtained from bitumi-
nous minerals, these oils being the basic constituents of the preparati-
ons”, “Iron and steel bars, rods, angles, shapes and sections (including
sheet piling)”, “Motor vehicles”, “Men’s/boys’ and women’s/girls’ co-
ats, capes, jackets, suits, blazers, trousers, shorts, shirts, underwear,
nightwear and similar articles of textile fabrics, not knitted or crocheted”
are the main commodity groups. Again, the textile, iron and steel and
motor vehicles commodity groups contributed positively to Turkey’s
export performance.
61
The Determinants of Turkey’s Export Performance: Constant Market Share Analysis
- Finally, there is a quite large group of sectors such as “Parts and acces-
sories of the motor vehicles of groups”, “Iron and steel”, “Electrical
machinery and apparatus” and “textile” with a positive CAE that enhan-
ces Turkey’s performance.
When the whole period and all the results of the CMS analysis are conside-
red, the most dominant effects that contribute positively to Turkey’s export per-
formance are market share effect and commodity adaptation effect. Turkey also
focused on new exports markets such as the Middle East and North Africa, in
order to overcome the negative effects of the global financial crisis and external
shocks. According to the Turkish Central Bank Report and the projection for
2030, it is expected that these countries will increase their share in Turkey’s
export market from 13% to 30%. Furthermore our exports to Asia-Pacific and to
Commonwealth of Independent States countries are expected to increase, and
exports to EU countries are expected to decline because of the demand contrac-
tion in EU markets.
Consequently, the main results of our CMS analysis indicate that Turkey’s
export performance is mainly determined by market share effect and commodity
adaptation effect, while the commodity composition effect needs to improve.
Turkey’s export competitiveness should also be enhanced by producing more
advanced technology-embedded products. Furthermore, Turkey’s exports pro-
ducts should also be diversified to meet the demand of new alternative markets.
Therefore, Turkish exporters need to be supported in their production, marke-
ting and financial process, to further improve their performance in world mar-
kets.
62
Erciyes Üniversitesi İktisadi ve İdari Bilimler Fakültesi Dergisi, Sayı: 42, Temmuz-Aralık 2013 ss. 41-66
REFERENCES
AHMADI-ESFAHANI, Fredoun Z.; (2006), “Constant Market Shares Analysis:
Uses, Limitations and Prospects”, The Australian Journal of Agricul-
tural and Resource Economics, 50, pp.510–526.
AYTEMIZ, Semiha; (2011),“Türkiye İhracatının Sabit Piyasa Yöntemi ile Ana-lizi”, Afyon Kocatepe Üniversitesi, İİBF Dergisi, 8(2), ss.181-201.
BATISTA, Jorge Chami; (2008), “Competition Between Brazil And Oth-
er Exporting Countries In The US Import Market: A New Exten-
sion Of Constant-Market-Shares Analysis”, Applied Economics,
40(19), pp.2477-2487.
DRYSDALE, Peter and Weiguo LU; (1996), “Australia’s Export Performance
in East Asia”, Pacific Economic Paper No:259, Canberra: Australia–
Japanese Research Centre.
EREN, Okan; (2013), “Pazar Büyüklüğü ve Pazar Payı Bileşenleri Kullanılarak
Türkiye’nin İhracat Büyümesi ve Dış Ticaret Açığı Projeksiyonları:
2013-2030”,TCMB Ekonomi Notları, Sayı: 2013-05, İnternet Adresi:
http://www.tcmb.gov.tr/ research/ekonominotlari/2013/tr/EN1305.pdf,
Erişim Tarihi:04.01.2013.
ERLAT, Güzin ve Haluk ERLAT; (2012),“Türkiye’nin Orta Doğu Ülkeleri ile Olan Ticareti, 1990-2002”, iç. Ercan UYGUR ve İrfan CİVCİR (Ed.), GAP Bölgesinde Dış Ticaret ve Tarım, Ankara: Türkiye Ekonomi Kurumu Tartışma Metni 2012/26, İnternet Adresi: http://www.tek.org.tr/dosyalar/gap2.pdf, Erişim Tarihi: 13.03.2013.
FAGERBERG, Jan and Carlton George SOLLIE; (1987), “The Method of Con-stant Market Share Analysis Reconsidered”, Applied Economics, 19, pp.1571-1583.
GILBERT, John; (2010), “Constant Market Share Analysis of the Pattern of
Southeast Asian Export Growth in the 2000s.”, Internet Address:
www.unescap.org/tid/artnet/mtg/tdgc_gilbert.pdf, Date of Access:
14.05.2013.
JOÃO, Amador and Sonia CABRAL; (2008), “The Portuguese Export Perfor-
mance in Perspective: A Constant Market Share Analysis”, Banco de
Portugal Economic Bulletin, Autumn, pp.201-221.
KLASRA, Mushtag Ahmad and Halil FİDAN; (2005), “Competitiveness of
Major exporting Countries and Turkey in the World Fishery Market: A
Constant Market Share Analysis”, Aquaculture Economics & Mana-
gement, 9(3), pp. 317-330.
63
The Determinants of Turkey’s Export Performance: Constant Market Share Analysis
LEAMER, Edward and Richard M. STERN; (1970), Quantitative Interna-
tional Economics, Boston: Allyn and Bacon.
OTHMAN, Shahwahid and Zakariah Abdul RASHID; (1993), "Constant Mar-
ket Share Analysis of The ASEAN Timber Trade", Pertanika Journal
of Social Sciences & Humanities, I/1, pp.71-80.
RAHMADDI, Rudy; ICHIHASHI Masaru; (2012), “The Changing Pattern of
Export Structure and Competitiveness in Indonesia’s Manufacturing
Sectors: an Overview and Assessment”, 2nd International Conference
on Economics, Trade and Development IPEDR, 7- 8April 2012,
Bangkok: Singapore International Economics Development and Rese-
arch Center (IEDRC), pp. 7-11, Internet Address:
http://www.ipedr.com/vol36/002-ICETD2012-D00003.pdf, Date of Ac-
cess: 14.05.2013.
RICHARDSON, J.David; (1971), “Constant Market Shares Analysis Of Export
Growth”, Journal of International Economics, 1, pp.227–239.
SKRINER, Edith; (2009), “Competitiveness and Specialisation of the Austrian
Export Sector -A Constant-Market-Shares Analysis”, FIW Working
Paper, No:32, Internet Address: http://www.fiw.ac.at/ filead-
min/Documents/Publikationen/Working_Paper/N_032-skrinerII.pdf,
Date of Access: 28.01.2013.
ŞAHAN, Fatih; (2012), “The Impact of Technology Level and Strucural Change
of Exports on The Dynamics of International Competitiveness: A Sec-
toral Disaggregated Analysis of Turkish Manufacturing Sector”, Yayın-
lanmamış Yüksek Lisans Tezi, Ankara: ODTÜ Sosyal Bilimler En-
stitüsü.
TATARER, Özge; (2004), “The Export Performance of The Turkish Manufac-
turing Industries with Respect to Selected Countries”, Yayınlanmamış
Yüksek Lisans Tezi, Ankara: ODTÜ Sosyal Bilimler Enstitüsü.
TYSZYNSKI, H.; (1951), “World Trade in Manufactured Commodities 1899-
1950”, The Manchester School of Economic Social Studies, 19, pp.
272–304.
64
Erciyes Üniversitesi İktisadi ve İdari Bilimler Fakültesi Dergisi, Sayı: 42, Temmuz-Aralık 2013 ss. 41-66
APPENDIX:
Table 1: The Commodity Group that Conributes Most to Turkey’s Export Performan-
ce in its Major Trading Partners’ Markets Countries SITC Rev.3, 3 digits Codes
Azerbaijan
“061- Sugars, molasses and honey”,
“691- Structures and parts of structures, n.e.s., of iron, steel or aluminium”, “782- Motor vehicles for the transport of goods and special-purpose motor vehicles”,
“897- Jewellery, goldsmiths' and silversmiths' wares, and other articles of precious or semip-
recious materials, n.e.s.”, “723- Civil engineering and contractors' plant and equipment; parts thereof”,
“773- Equipment for distributing electricity, n.e.s.”,
“661- Lime, cement, and fabricated construction materials (except glass and clay materi-als)”,
“679- Tubes, pipes and hollow profiles, and tube or pipe fittings, of iron or steel”,
“351- Electric current”, “821- Furniture and parts thereof; bedding, mattresses, mattress supports, cushions and
similar stuffed furnishings”
China
“793- Ships, boats (including hovercraft) and floating structures”, “652- Cotton fabrics, woven (not including narrow or special fabrics)”,
“764- Telecommunications equipment, n.e.s., and parts, n.e.s., and accessories of apparatus
falling within division 76”, “611- Leather”,
“653- Fabrics, woven, of man-made textile materials (not including narrow or special fab-
rics)”, “273- Stone, sand and gravel”,
“579- Waste, parings and scrap, of plastics”,
“898- Musical instruments and parts and accessories thereof; records, tapes and other sound
or similar recordings (excluding goods of groups 763 and 883)”,
“278- Other crude minerals”,
“613- Furskins, tanned or dressed (including heads, tails, paws and other pieces or cuttings), unassembled, or assembled (without the addition of other materials), other than those of
heading”
Iran
“676-Iron and steel bars, rods, angles, shapes and sections (including sheet piling)”, “634-Veneers, plywood, particle board, and other wood, worked, n.e.s.”,
“792- Aircraft and associated equipment; spacecraft (including satellites) and spacecraft
launch vehicles; parts thereof”, “784-Parts and accessories of the motor vehicles of groups 722, 781, 782 and 783”,
“821-Furniture and parts thereof; bedding, mattresses, mattress supports, cushions and
similar stuffed furnishings”, “775-Household-type electrical and non-electrical equipment, n.e.s.”,
“737-Metalworking machinery (other than machine tools), and parts thereof, n.e.s.”,
“653-Fabrics, woven, of man-made textile materials (not including narrow or special fab-rics)”,
“057-Fruit and nuts (not including oil nuts), fresh or dried”,
“061-Sugars, molasses and honey
Iraq
“676-Iron and steel bars, rods, angles, shapes and sections (including sheet piling)”, “431-Animal or vegetable fats and oils, processed; waxes; inedible mixtures or preparations
of animal or vegetable fats or oils, n.e.s.”,
“046- Meal and flour of wheat and flour of melsin”, “057-Fruit and nuts (not including oil nuts), fresh or dried”,
“012- Other meat and edible meat offal, fresh, chilled or frozen (except meat and meat offal unfit or unsuitable for human consumption)”,
“691- Structures and parts of structures, n.e.s., of iron, steel or aluminium”,
“773- Equipment for distributing electricity, n.e.s.”,
“025- Eggs, birds', and egg yolks, fresh, dried or otherwise preserved, sweetened or not; egg
65
The Determinants of Turkey’s Export Performance: Constant Market Share Analysis
albumin”,
“048- Cereal preparations and preparations of flour or starch of fruits or vegetables”, “421- Fixed vegetable fats and oils, "soft", crude, refined or fractionated”
Israel
“676-Iron and steel bars, rods, angles, shapes and sections (including sheet piling)”,
“793- Ships, boats (including hovercraft) and floating structures”, “773- Equipment for distributing electricity, n.e.s.”,
“775- Household-type electrical and non-electrical equipment, n.e.s.”,
“893- Articles, n.e.s., of plastics”, “662- Clay construction materials and refractory construction materials”,
“334- Petroleum oils and oils obtained from bituminous minerals”,
“842- Women's or girls' coats, capes, jackets, suits, trousers, shorts, shirts, dresses and skirts, underwear, nightwear and similar articles of textile fabrics, not knitted or crocheted”,
“642- Paper and paperboard, cut to size or shape, and articles of paper or paperboard”,
“682- Copper”
Libya
“046- Meal and flour of wheat and flour of melsin”,
“676-Iron and steel bars, rods, angles, shapes and sections (including sheet piling)”,
“581-Tubes, pipes and hoses, and fittings therefor, of plastics”, “659-Floor coverings, etc.”,
“042- Rice”,
“048-Cereal preparations and preparations of flour or starch of fruits or vegetables”, “012- Other meat and edible meat offal, fresh, chilled or frozen”,
“073-Chocolate and other food preparations containing cocoa, n.e.s.”,
“893-Articles, n.e.s., of plastics”, “334- Petroleum oils and oils obtained from bituminous minerals”
Russian
Federation
“057- Fruit and nuts (not including oil nuts), fresh or dried”,
“655- Knitted or crocheted fabrics”,
“054- Vegetables, fresh, chilled, frozen or simply preserved”, “653- Fabrics, woven, of man-made textile materials (not including narrow or special fab-
rics)”,
“781- Motor cars and other motor vehicles principally designed for the transport of per-sons”,
“334- Petroleum oils and oils obtained from bituminous minerals”,
“793- Ships, boats (including hovercraft) and floating structures”, “581- Tubes, pipes and hoses, and fittings therefor, of plastics”,
“897- Jewellery, goldsmiths' and silversmiths' wares, and other articles of precious or semip-
recious materials, n.e.s”, “728- Other machinery and equipment specialized for particular industries; parts thereof,
n.e.s.”
Saudi
Arabia
“659- Floor coverings, etc.”, “672-Ingots and other primary forms, of iron or steel; semi-finished products of iron or
steel”,
“773-Equipment for distributing electricity, n.e.s.”,
“771-Electric power machinery (other than rotating electric plant of group 716), and parts
thereof”,
“676-Iron and steel bars, rods, angles, shapes and sections (including sheet piling)”, “783- Road motor vehicles, n.e.s.”,
“057- Fruit and nuts (not including oil nuts), fresh or dried”,
“048- Cereal preparations and preparations of flour or starch of fruits or vegetables”, “661- Lime, cement, and fabricated construction materials (except glass and clay materi-
als)”,
“625- Rubber tyres, interchangeable tyre treads, tyre flaps and inner tubes for wheels of all kinds”
UAE
“971-Gold, non-monetary (excluding gold ores and concentrates)”,
“334-Petroleum oils and oils obtained from bituminous minerals”, “897-Jewellery, goldsmiths' and silversmiths' wares, and other articles of precious or semip-
recious materials, n.e.s.”,
66
Erciyes Üniversitesi İktisadi ve İdari Bilimler Fakültesi Dergisi, Sayı: 42, Temmuz-Aralık 2013 ss. 41-66
“335-Residual petroleum products, n.e.s., and related materials”,
“771-Electric power machinery (other than rotating electric plant of group 716), and parts thereof”,
“681- Silver, platinum and other metals of the platinum group”,
“811-Prefabricated buildings”, “821-Furniture and parts thereof; bedding, mattresses, mattress supports, cushions and
similar stuffed furnishings”,
“773-Equipment for distributing electricity, n.e.s.”, “772-Electrical apparatus for switching or protecting electrical circuits or for making con-
nections to or in electrical circuits”
USA
“ 792-Aircraft and associated equipment; spacecraft (including satellites) and spacecraft launch vehicles; parts thereof”,
“781-Motor cars and other motor vehicles principally designed for the transport of persons”,
“661-Lime, cement, and fabricated construction materials (except glass and clay materials)”,
“714-Engines and motors, non-electric (other than those of groups 712, 713 and 718); parts,
n.e.s., of these engines and motors”,
“679-Tubes, pipes and hollow profiles, and tube or pipe fittings, of iron or steel”, “659-Floor coverings, etc.”,
“793-Ships, boats (including hovercraft) and floating structures”,
“784-Parts and accessories of the motor vehicles of groups 722, 781, 782 and 783”, “897-Jewellery, goldsmiths' and silversmiths' wares, and other articles of precious or semip-
recious materials, n.e.s.”,
“621-Materials of rubber (e.g., pastes, plates, sheets, rods, thread, tubes, of rubber)”
Egypt
“676-Iron and steel bars, rods, angles, shapes and sections (including sheet piling)”,
“334-Petroleum oils and oils obtained from bituminous minerals”,
“672-Ingots and other primary forms, of iron or steel; semi-finished products of iron or steel”,
“041-Wheat (including spelt) and meslin, unmilled”,
“841-Men's or boys' coats, capes, jackets, suits, blazers, trousers, shorts, shirts, underwear, nightwear and
similar articles of textile fabrics, not knitted or crocheted”,
“679-Tubes, pipes and hollow profiles, and tube or pipe fittings, of iron or steel”,
“652-Cotton fabrics, woven (not including narrow or special fabrics)”,
“673-Flat-rolled products of iron or non-alloy steel, not clad, plated or coated”,
“697-Household equipment of base metal, n.e.s.”,
“842- Women's or girls' coats, capes, jackets, suits, trousers, shorts, shirts, dresses and skirts, underwear,
nightwear and similar articles of textile fabrics, not knitted or crocheted”
Algeria
“679-Tubes, pipes and hollow profiles, and tube or pipe fittings, of iron or steel”, “723-Civil engineering and contractors' plant and equipment; parts thereof”,
“773-Equipment for distributing electricity, n.e.s.”,
“691-Structures and parts of structures, n.e.s., of iron, steel or aluminium”, “728-Other machinery and equipment specialized for particular industries; parts thereof,
n.e.s.”, “041-Wheat (including spelt) and meslin, unmilled”,
“655- Knitted or crocheted fabrics”,
“771- Electric power machinery (other than rotating electric plant of group 716), and parts thereof”,
“741- Heating and cooling equipment, and parts thereof, n.e.s.”,
“811- Prefabricated buildings”
EU-27
“263 Cotton”, “278 Other crude minerals”,
“621 Materials of rubber”,
“713 Internal combustion piston engines, and parts thereof, n.e.s.”, “812 Sanitary, plumbing and heating fixtures and fittings, n.e.s.”,
“665 Glassware”,
“775 Household-type electrical and non-electrical equipment, n.e.s.”, “784 Parts and accessories of the motor vehicles of groups 722, 781, 782 and 783”,
“657 Special yarns, special textile fabrics and related products”,
“581 Tubes, pipes and hoses, and fittings therefor, of plastics”. Source: Computed by authors using UNCTAD data