the determinants and barriers of e-government adoption in ... thesis lidia noto.pdf · e-government...
TRANSCRIPT

University of Palermo
D.E.M.S.
The Determinants and Barriers of
e-Government Adoption
in the Municipality of Palermo PhD Candidate
Lidia Noto
Supervisor
Prof. Carmine Bianchi
A Dissertation Submitted in Partial Fulfillment of the Requirements for the Degree of Doctor of Philosophy Model Based Public Planning, Policy Design, and Management, SECS-P/07.
Session XXIV – 2013/2014


Another day, another dollar

II

III
Abstract
The pressing innovation in the Information & Communication
Technologies (ICT) generates new opportunities for creating networks
and for developing new businesses. Even the discipline of public
administration recognizes these opportunities in terms of improving tax
administration and government efficiency, reducing the regulatory cost
of citizen compliance, and avoiding overall frauds and errors.
This thesis explores the factors that influence the adoption of e-
services by citizens in the municipality of Palermo, Italy, distinguishing
the factors that are ascribed to the generalities of local government from
those that are linked to the territorial context. It also explores alternative
policies to overcome the criticalities that emerged from this analysis,
providing guidance for the municipality to benefit from the
implementation of e-Government.
In order to carry out this research, a multi-method approach was
applied to the case study of Palermo because the adoption of e-
government cannot be separated from its implementation. Therefore,
Institutional Theory serves to highlight the barriers hidden behind the
strategic choices and the adaptation of the Technology Acceptance
Model (TAM) helps to identify the determinants of adoption.
The municipality of Palermo must overcome two major challenges
in order to advance the adoption of e-services by citizens, which were

IV
identified from a survey of 389 respondents. They are the lack of a real
awareness of the e-services provided by the municipal administration and
the lack of a substantial relative advantage in using the digital channels in
place of the traditional ones.
System Dynamics, a particular kind of dynamic simulation, is then
used to provide the necessary feedback structure for identify the
determinants. As a result, this thesis concludes by recommending the
implementation of selected policies aimed to expand the adoption of e-
services in the municipality of Palermo.

V
Acknowledgements
The writing of this dissertation would have not been possible if not with
the help of several people that supported me during this period.
First of all, I would like to express my gratitude to my advisor Prof.
Carmine Bianchi that with his experience and wisdom introduced me to
the research activity and guided me in these years.
I am thankful to Prof. William C. Rivenbark for the time spent in long
conversations that contributed to my work and the precious suggestions
during the review of this thesis.
My gratitude also goes to Dr. Enzo Bivona for the invaluable support and
to Dr. Federico Cosenz, because a PhD program is much easier if
someone shows you how to survive. I thank all my colleagues of PhD
course that shared this incredible experience.
This thesis project involved many institutions and agencies of the
municipality of Palermo. In particular, I would like to thank Assessor
Giuseppe Barbera, Assessor Giusto Catania, Dr. Bohuslav Basile (chief
of Development Policies Area of the municipality of Palermo), Dr.
Ignazio Messina (manager of Strategic Planning and Control of the
municipality of Palermo), Dr. Salvatore Morreale (engineer and manager
of SISPI SPA), Dr. Vincenza Simonte (manager of Information System

VI
Department of the municipality of Palermo) and her department, Dr.
Salvatore Meli (Webmaster).
A special thanks goes to my family. Words cannot express how grateful I
am to my mother, and father for all of the sacrifices they’ve made on my
behalf.
Thanks to Giovanni that with his enthusiasm and love incented me to
strive towards my goal.
I would also like to thank my friend Giulia who supported me in writing
and widened my horizons.
And finally thanks to my brother Guido, who has always been there for
me offering sharp critics, support or silent company at the right moment.
To him this thesis is dedicated.

VII
List of contents
Abstract....................................................................................................III Acknowledgements ..................................................................................V
List of contents ...................................................................................... VII List of figures ..........................................................................................IX
List of tables ............................................................................................IX
Introduction ...............................................................................................1
Objectives and Research Questions...........................................................4 1. Background and Boundaries of the Research........................................7
1.1. e-Government Studies: Looking for a Common Framework ................... 7 1.2. Drawing the Research Boundaries: e-Services Adoption and Citizens’ Perspective..................................................................................................... 15 1.3. Technological Innovation is Not Enough…........................................... 18 1.4. The Improvement of Public Management through Policy Learning ...... 20 1.5. Trust: A Controversial Factor Influencing e-Government Adoption ..... 23
2. Research Design & Methodology .......................................................27 2.1. A Multi-Method Approach to e-Government......................................... 27 2.2. How a System of Rules Influences Social Behavior: Insights from Institutional Theory ....................................................................................... 29 2.3. Research Hypotheses .............................................................................. 31 2.4. Introducing the Model: System Dynamics basic tools. .......................... 37
3. e-Government Adoption in Palermo: State-of-the-Art and Forgotten Promises ..................................................................................................47
3.1. Building the System of Rules: the Italian Regulatory Framework......... 47 3.2. Presenting the Case- Study: e-Government Projects Implemented in the Municipality of Palermo................................................................................ 51 3.3. Testing the Key-Determinants of e-Government Adoption using Technology Acceptance Model (TAM). ....................................................... 57 3.4. Fixing the Feedback Structure: System Dynamics Modeling and Policy Design ............................................................................................................ 66 3.5. Results and Discussion ........................................................................... 77 3.6. Trust and the Effect of the Latest Financial Crisis ................................. 78 3.7. Limitations.............................................................................................. 80
Conclusion...............................................................................................82
Recommendations for Research ..............................................................84 References ...............................................................................................85
Normative References (chronological order) ..........................................93 Web References.......................................................................................93

VIII
Appendix A. Survey ................................................................................95
Appendix B. Equations of the System Dynamics model ........................99 Appendix C. Equations of the System Dynamics model with policies .101

IX
List of figures
Fig. 1 Conceptual model for measuring e-Gov (Luna-Reyes et al., 2012)..................... 14
Fig. 2 Technology Acceptance Model (Davis, 1989)..................................................... 32
Fig. 3 TAM adaptation ................................................................................................... 33
Fig. 4 Representation of SD elements ............................................................................ 40
Fig. 5 Example of Bass Model (CLD)............................................................................ 42 Fig. 6 Example of goal-seeking behavior ....................................................................... 43
Fig. 7 Example of exponential growth ........................................................................... 43
Fig. 8 Example of S-shaped growth ............................................................................... 44
Fig. 9 Example of Bass Model (SFD) ............................................................................ 45
Fig. 10 Information delay (SFD) .................................................................................... 45
Fig. 11 TAM adaptation as modified after the analysis.................................................. 64
Fig. 12 Reference Mode ................................................................................................. 66
Fig. 13 CLD of the e-Gov adoption in Palermo ............................................................. 67 Fig. 14 SFD of e-Gov adoption in Palermo (explanatory model) .................................. 70
Fig. 15 Simulation of the explanatory model ................................................................. 72
Fig. 16 A critical feedback of the model ........................................................................ 72
Fig. 17 Implementation of a communication policy (SFD)............................................ 74
Fig. 18 Perceived Workload (CLD)................................................................................ 75
Fig. 19 SFD of e-Gov adoption in Palermo with policies .............................................. 76
Fig. 20 Potential effect of policies implementation........................................................ 76
List of tables Tab. 1 Demographic characteristics of respondents………………………….. ……….36
Tab. 2 Active users per age, gender and geographic area (September Report
AUDIWEB)…………………………………………………………………………… 37
Tab. 3 Reasons for using the mnicipal website or not………………………………… 58
Tab. 4 List of constructs and items in the survey………………………………….….. 60
Tab. 5 Characteristics of registered users………………………………………….….. 62
Tab. 6 Correlation table……………………………………………………………….. 65
Tab. 7 TIT & TIG per age categories…………………………………………………. 80

X

1
Introduction
The pressing innovation in the ICTs generates lots of new
opportunities for creating networks and for developing new businesses.
Even the Public Administration (PA) sees new opportunities in term of
reducing the cost of regulatory compliance for government customers,
improving efficiency and tax administration and avoiding frauds and
errors. Moreover, citizens and businesses could now improve their
capacity of solving their own bureaucratic problems online.
Notwithstanding these positive effects, recent literature started
recognizing that innovation in the ICTs also implies new challenges and
hindrances for each public institution with peculiar features depending on
the governmental level of the institution and on the socio-economic
environment of the intended target population.
Another element of complexity is the lack of resources. e-
Government strategies can reduce administrative costs in the long term
but needs conspicuous investments for the implementation. Assuring the
essential amount of resources (material but also human) for the whole
length of the project is not always easy.
Last but not least, the introduction of e-Government services has
a remarkable impact on performance and public policy design. Not only
because of the technological innovation per se, but because the role of all

2
the actors involved has changed. Decision-makers (both politicians and
managers) as well as the users must accept their new responsibilities in
contributing to development of new sustainable policies. The process of
integration is never easy and will be given the deserved attention in the
pages of this thesis.
Abstracting from the public sector, it is possible to observe that,
in general, the model of rational behavior has changed, has evolved
toward networks. On average, people can easily access more information
(now the problem is to select the relevant information!) and, above all,
access the reaction of other people to the same information. This
phenomenon affects the creation of their judgment. The preference of an
individual cannot be the one he would have come to with his own
reasoning if he assumes that the majority of people, who already
expressed another preference, were better informed.
According to Ormerod (2012), the impact of incentives, of the
assessment of costs and benefits of different actions, on individuals, has
been overtaken by the effect of social interaction across network and
“network effects require policy makers, whether in the public or
corporate spheres, to change radically their view of how the world
operates.”
As a direct consequence, policy learning and performance
management must evolve and gain in flexibility. The participation of the

3
users (citizens, businesses and other stakeholders) appears to be crucial
for the success of e-government implementation. In fact, it is not helpful
to provide a digital tool if the population is not using it.
The involvement of other actors in the design of new policies and
in the introduction of innovations may turn out to be a possible source of
creativity and deeper understanding of a complex system through the
amalgamation of different underlying learning.
But decision-makers could deal (and this probably happened and
still happens most of the times) with a different situation where only a
small portion of the population is running ahead innovating and going
global while most of the community is not ready to switch to new
technologies.
Of course, there is not a universal receipt for the success of an e-
Government project. The “ingredients” may vary due to different
context. However is possible to identify common factors influencing the
adoption although with different intensity.
This thesis aims to understand the determinants and the barriers to
the adoption of the e-services in the Municipality of Palermo, a mid-size
municipality (650.000 inhabitants, www.anci.it) located in southern Italy.
The focus will be placed on the adoption process from the citizens’
perspective.

4
The presented case study will show how an e-Government project
had been already started in the Municipality of Palermo in 2002 but the
population was not aware of the ongoing process. In January 2013, after
a difficult moment for the city (the occurrence of the effects of the latest
economic crisis and a period of compulsory administration due to the
resignation of the major), a new website and a new portal have been
released. So it is a crucial moment to understand what direction the
municipality will take with regard to e-Government. It is a good
opportunity to test how the citizens perceived the change and what
problems have not been solved yet.
Objectives and Research Questions
Measuring e-Government in order to evaluate different policies is
not easy because of all the immaterial values involved. Nonetheless it is
important to capture the feedbacks underlying given e-Government
systems. The empirical data show that, from January 2013 (when the new
website and e-services portal became available to the users) the website
did not registered a sensible increase of visitors, and the portal recorded
only 10.000 certified users (September 2013) over a estimated catchment
area of about 200.000 potential users.

5
In order to explore citizens’ perception, a survey was developed,
uploaded on the official municipal website and disseminated trough the
social networks (Facebook, Twitter). 389 answers provided this study
with a representative sample of the attitudes of people toward the digital
interaction with the municipal administration.
In a nutshell, this study attempts to answer three main research’s
questions:
RQ 1. What are the implementation strategies used by the city of
Palermo to develop, implement, and expand its e-Government portal for
offering cost-effective e-services to its citizens?
RQ 2. What are the specific barriers to citizen use of the current
e-services being offered by the city of Palermo, responding to the low
rate of certification on the e-Government portal?
RQ 3. What are the areas of improvement for identifying
suggestions and strategies for increasing the rate of adoption?
The present dissertation is developed in four chapters. The area of
investigation is defined in Chapter 1, where a literature background is
also provided. Particular interest was dedicated to the determinants of e-
Government adoption in the literature. Above all, trust. It is always
important to outline the content of a research but it is even more
important in a field where a shared framework is missing like in the case

6
of e-Government studies. The first chapter also focuses on the paradigm
shift of Public Management and on the fundamentals of policy learning.
Chapter 2 introduces the methodologies used. The analysis is
conducted with a multi-method approach that combines: Institutional
Theory, Technology Acceptance Model Analysis (TAM) and System
Dynamics (SD).
The case- study is analyzed in Chapter 3 where, first of all, the
Italian regulatory framework is depicted and the two projects described:
“if we are to understand e-government, we need to see it as being
embedded within the context of the changes that are affecting public
management more widely” (Worrall, 2011). Afterwards, all the analyses
are carried out. The results of the survey are included in the TAM. The
hypotheses confirmed by the TAM, are consolidated in the structure of
the SD model.
The final chapter draws together the analyses and the results of
this research. It places them back into the general context of e-
Government studies and demonstrates the valuable new insights that this
work has developed. It also suggests ways in which this research can be
continued in the future.

7
1. Background and Boundaries of the Research
1.1. e-Government Studies: Looking for a Common
Framework
In 2003, the European Commission defined e-Government as the
use in public administration of information and communication
technologies (ICT) teamed with organizational change and introduction
of new skills, aimed at improving both public services and democratic
processes and strengthening public policy support.
The term e-government became a sort of “umbrella term” including
several declinations of it such as citizen participation and e-procurement,
smart cities and interoperability. Nowadays, the fast rate of innovative
changes implies the need to better define the subject of every study.
e- Government is fully recognized as a new field of research. A
growing body of research is interested in e-Government and its multiple
facets, trying to build a common framework of analysis. Even though
researchers have already been focusing on the subject for more than a
decade, this last challenging purpose of building a unique framework has
not been fully achieved yet.
In order to define the boundaries of this research, it is important to
understand what is going under the e-Government “umbrella”. First of
all, it is essential to clarify that three aspects of the discipline must be

8
distinguished in its development: implementation, adoption and use.
Later in the work, it will be evident why this premise is important. In the
process of building a common framework, at the beginning, the attention
was focused on the implementation, on the role of the administration in
drawing up and making available the services. The effort of the
administration tended to assume a bureaucratic profile.
The real purpose of e-Government, instead, is to improve the
administration, to involve the citizen and allow them to propose their
own solutions. The adoption happens if citizens are enough Internet-
skilled, if they perceive a convenience in using digital channels in place
of the traditional ones and if they feel secure in using e-services
(Belanger & Carter, 2008).
The adoption of e-services is not the ultimate goal. Governments
must create the conditions for the continuance of use. These concepts that
appear obvious are the result of years of experience around the world.
These achievements are now developed in the second and third
generation e-Government projects. Therefore, the reader must be aware
of the complex identification of the role of e-government in the society
when examining the background of the present research.
Some of the causes of the difficult categorization of the discipline
can be found in the variety of activities and processes of public
administration at different level and in different context. The processes
9
are critical due to “the extraordinarily complex goal structure of public
administration; the high degree of legal structuring of administrative
work; (and the fact that a big) amount of work that can only be
performed in cooperation with other agencies is rather high” (Wimmer,
2002; Lenk et al. 2002).
It is clear that the need for a framework is driven by the need to
measure, the need to compare different strategies to understand which
one is the best in order “to maximize the acceptability of results, rankings
should be based on well understood and supported frameworks and
indices, and sound computational procedures” (Rorissa, Demissie, Pardo,
2011).
Many authors and international organizations (United Nations,
World Bank), at the beginning of the last decade (while e-Government
was rising as an independent topic) tried to build their frameworks
according to the stages of development. Jayashree & Marthandan (2010)
and Rorissa, Demissie & Pardo (2011) list and analyze the most cited.
For the purpose of this thesis (since also the first project of the
municipality of Palermo followed the same categorization for the
planning of its services), it is useful to review the one of the United
Nations (UN, 2001) and the one of Hiller & Belanger (2001). Both of
them include five stages.

10
The starting point is similar: both of them basically refer to the
function of simple information delivery through a website. The main
difference is that the model of the UN is oriented to the integration of the
e-services toward a one-stop portal. On the other hand, Hiller & Belanger
(2001) are focused on the users and the goal is to allow them to
participate in political issue online (voting, participating in surveys, etc.).
The following reproductions of the two models are adapted from
Jayashree & Marthandan (2010). The United Nations and American
Society for Public Administration (UNASPA, 2001) model is structured
as follows:
1) Emerging presence: institution of government websites that
provide formal but limited and static information;
2) Enhanced presence: the websites become dynamic and updated;
3) Interactive presence: government websites act as a portal to
connect users and service providers;
4) Transactional presence: users have the capability to conduct
complete and secure transactions, such as renewing visas, obtaining
passports and updating birth and death records through a single
government web site;
5) Fully integrated presence: governments utilize a single and
universal website to provide a one-stop portal in which users can
immediately and conveniently access all kinds of available services.

11
On the other hand, Hiller & Belanger (2001) identified:
1) Simple information dissemination: this first step is not different
from the UN’s one, it is about providing simple information on
institutional websites;
2) Two-way communication: this second step contemplates an
interaction between governments and users, but it is about
communication and forms not about transactions;
3) Service and financial transaction: the government is ready for
completing transactions online both with citizens and businesses;
4) Vertical and horizontal integration: this step expresses the
concept of interoperability among the institutions of different level and
areas in order to provide the users with a unique front- office;
5) Political participation: the last step is about the promotion of
political participation through services such as online voting and surveys.
More recently, several authors (Bannister, 2007; Sørum et al.,
2009; Andersen et al., 2011) criticized the maturity stage model asserting
that it is valid just to measure the effort of central governments without
considering the impact, the actual benefits on the population. After
almost two decades of e-Government implementation, the stage of
development is not a relevant categorization anymore. It can be helpful in
the planning of new services but it does not make the difference at the

12
national level since most of the countries, especially in Europe and in the
US, have already reached the fifth stage.
Different is the approach of Wimmer (2002) that tries to look at the
multi-disciplinary nature of e-government integrating all the features of
different subjects. She imagined her framework as “hodgepodge” of
different views of e-Government, abstraction layers, and progress of
public service (Rabiaiah & Vandijck, 2009). Her holistic approach
considers e-Government as “socio-technical systems” integrating four
perspectives namely: strategic framework; public services, processes and
workflow; interaction and Information Technology.
Some years later, Moon and Norris (2005) proposed an explanatory
theoretical framework for e-Government in which its adoption is
determined by (i) an institutional variable, (ii) government capacity, and
(iii) a managerial innovation orientation (Garcia- Sanchez et al., 2012).
Rabiaiah & Vandijck (2009) criticized all the previous frameworks
because of the lack of the aim of “developing a framework that abstracts
the e-Government strategy”. So in their work, they chose to offer “a
comprehensive view of the e-Government program”. They included both
the front- office and back-office perspectives in a modularized
framework that allows “flexibility, estensibilities and customizability”.

13
A new approach was recently designed by Luna-Reyes, Gil-Garcia,
& Romero (2012). It considers the specific functions of e-Government
and it is applicable at all the institutional levels.
Their approach (fig.1) distinguishes determinants, characteristics
and results in a cause-effect relationship. Among the determinants, they
list the quality of information, the technological infrastructure, as well as
legal and organizational features so to underline the all-round
development necessary to the success of a project implementation. It
must be noted, though, that the list includes only implementation
determinants. The user perspective is implicit in the variable “potential
demand” but without deeper analysis on people’s perceptions.
The characteristics “provide a way of measuring the success of
initiatives in terms of how they meet technical requirements such as
usability, quality of information, privacy, or security” (Luna-Reyes, Gil-
Garcia, & Romero, 2012). The characteristics also indicate the level of
sophistication achieved. They are divided in four main areas: e-services,
e-management, e-democracy and e-public policy.

14
Fig. 1 Conceptual model for measuring e-Gov (Luna-Reyes et al., 2012)
And, finally, the outcome of the process is outlined: “the results
represent the benefits that have been identified as effects of electronic
government. They provide a simplified indication of the impact of
electronic government and the value created by these initiatives. This
value could be measured by assessing multiple results” (Luna-Reyes,
Gil-Garcia, & Romero, 2012).
However, basically, the benefits of e-government can mainly be
brought back to time’s savings and fraud and errors’ reduction. Time is
an indicator of responsiveness (Andersen et al., 2011; Scott et al., 2009).
Its net benefit can be measured calculating time’s savings for retrieving
information (personal contact vs. web browsing) also considering a
better- integrated information system (Andersen et al., 2011; Scott et al.,
2009). The same authors identified a reciprocal time’s savings problem

15
where for both, businesses and government, time is positively correlated
with cost: the more time spent, the more costly the delivery (of services)/
retrieval of information.
1.2. Drawing the Research Boundaries: e-Services Adoption
and Citizens’ Perspective
After the listing of different frameworks, it is possible to highlight
some issue to face when analyzing e-Government.
First of all, it is important to define the institutional level of
analysis: national, regional or local. These three levels (that can assume
different name according to the systems of law) face different needs and
expectations.
At the national level, the main issues regard democracy and
national citizenship. The national level gave governments the input to
start the process of digitalization and to change the systems of rules; but
it is still to far from citizens’ perception, from their every-day life.
Some are skeptical about indexes and rankings of nations arguing
that they “tend to be meaningless and serve the sole purpose of
enhancing governments’ chances of achieving high international
rankings” (Bannister, 2007; Andersen et al., 2011).
At the regional level, the focus is shifted to interoperability:
connecting the levels, standardizing the services. The regional level

16
serves as a bridge to link the standardized national guidelines to the
territorial peculiar context.
At the local level, and here the reference is to the municipalities,
the citizen finds its first institutional interlocutor that must be able to
solve its primary and most practical needs. Obtaining certificates and
licenses, paying taxes, enrolling their children in school. When
formulating and expressing their perception on e-Government, citizens
mostly consider this third level.
Second of all, it is important to define the specific functions to
analyze. It is important to distinguish between e-services and e-
participation (so if it is a matter of e-Government or e-Governance).
As a third point is necessary to define the perspective assumed. The
choice is between supply and demand sides, Public Administration or
users’ perspective (Reddick, 2005).
The PA perspective focuses on the implementation of the services
without considering that “in the public sector, particularly in the case of
e-Government initiatives, at least two parties will be involved in the
system design: public managers as suppliers, and citizens, businesses,
and other stakeholders as demanders. This characteristic transforms the
goal-definition problem in the design of systems of rules from a single-
designer problem to a multi-designer problem” (Gil-Garcia & Martinez-
Moyano, 2007).

17
In a nutshell, referring to the three issues listed above, it is
appropriate to remark that the definition of the area of investigation of
this thesis will characterized in the following way:
1) the institutional level will be the local level;
2) the focus will be placed on the e-services adoption;
3) the perspective assumed will be the one of the users (citizens,
businesses and other stakeholder) with the ultimate goal of providing the
decision-makers with insights on the perception and expectation of their
territory. In this way they will be able to redesign their role according to
the new need of the society.
The importance of e-Government at the local level and of users’
perspective has often been underestimated. The adoption of e-services by
citizens, in particular, is a main issue on which researcher are focusing to
identify the key-determinants of the phenomenon of adoption and in
order to find out what can make the difference between a successful and
an unsuccessful e-government project. However, as there is not a unique
framework, also a unique model to assess every project is missing.
Most of the authors agreed on the main factors of the adoption but
the empirical evidence showed that these factors have a different impact
in different contexts.
18
1.3. Technological Innovation is Not Enough…
The introduction of ICT in Public Administration does not
automatically imply a correct implementation of e-Government services.
It is already clear in the literature that ICTs are basically tools and that a
managerial vision of the implementation strategies is essential for the
success of e-Government projects.
That notwithstanding, ICTs are often introduced without a good
strategic plan with the result that some employees do not exploit the
potential advantages of the innovation (because they are not skilled or
simply because they had no instructions) and the investments go lost.
And this can happen everywhere. If, on the one hand, it is true that
the bigger municipalities should be advantaged because of scale
economies, it is even true that the recent financial crisis determined a
severe lack of resources, so the coordination may be better in little towns
where all the offices are in the same building or in a neighborhood.
West (2004) argues that e-government “has fallen short of its
potential to transform government” in the area of service delivery
(D’Agostino et al., 2011, West, 2004).
As already mentioned, the case study will show how an e-
Government project had been already started in the Municipality of
Palermo in 2002 but the population was not aware of the ongoing
process. This experience is consistent with the study of Corradini et al.

19
(2010) stating: “that often services are available but ignored by citizens.
In our hypothesis this situation can be justified since defined service
delivery processes do not sufficiently take into account social aspects and
mainly focus just on technical aspects.” They add: “Our opinion here is
that, in the development of GDSs, the focus has been put too much on
technological aspects, where requirements coming from social and
anthropological domains have been too often ignored. As a result
services are available and often they rely on advanced technologies,
nevertheless they are not used since citizens do not grasp the advantage
of using it, and in particular in less urbanized areas, they feel more
comfortable in accessing services via traditional channels.”
Also van Veenstra & Janssen, when analyzing different migration
strategies from traditional to digital channels, fear that the population
may remain unaware of the implementation of new services.
The choice of changing the technology before than the organization
could help in forcing the employees in adopting the new channels
abandoning their hold habits. The pitfall, however, is that “it may be
costly to implement new technology first without training employees to
use IT, which may result in a slow process with high costs, in which
clients do not notice any of the changes” (van Veenstra & Janssen, 2011).
Bannister & Connolly (2011) cite Heintze and Bretschneider
(2000) and their intuitive findings that ICT in the public arena merely

20
improves efficiencies, but does not lead to meaningful organizational
change or to increased democratic participation.
1.4. The Improvement of Public Management through Policy
Learning
Innovation in the public sector cannot be the result of casual
change. As already mentioned, the introduction of new technologies does
not mean to innovate an institution.
Innovation in the public sector should be the result of a reasoned
introduction of new procedures, activities or responsibilities that may or
may not be linked to the introduction of a new technology.
For this reason, it is important to introduce the concept of policy
learning. The birth of e-Government raised many managerial questions
that should have been solved before the implementation of its technical
tools.
Policy learning refers to “a change in thinking”, not any change in
thinking but a structured, conscious change in thinking about a specific
policy issue (Kemp & Weehuizen, 2003).
“Policy learning is a form of collective learning, since policy is
designed and implemented by a range of organizations” (Kemp &
Weehuizen, 2003). The same authors specify that policy learning is a
complex kind of collective learning since it usually involves several

21
organizations.
Sabatier (1993) distinguished three types of policy learning:
instrumental, which is about new technical tools; conceptual, that implies
a change of perspective on critical issue and leads to the development of
new concepts or principles; and social, this last type being about values,
missions, goal, responsibilities, etc (Kemp & Weehuizen, 2003; Sabatier,
1993).
e-Government is a deep change that requires instrumental learning
but also conceptual and social learning.
Interacting with citizens, businesses and other governments and
providing digital services requires new infrastructures and tools as well
as it requires a new managerial approach: “Some argue that e-
government could change the paradigm of public service delivery at the
local level (Ho, 2002), indicating a potential relationship between e-
government initiatives and local managerial innovations” (Moon &
Norris, 2005).
Last but not least, a social environment ready to accept this change
in thinking is needed. This issue is stressed in Codagnone, Wimmer
(2007): “on the one hand changing public values might result in higher
level of transparency and accountability of governmental processes and
on the other hand it means people are more likely to lean toward
something that is immediately tangible and valuable to them
22
(convenience) rather than something that may be more fundamentally
important but is only conceptual until something goes wrong (privacy)”.
But, above all, they reveal a crucial point: changing public values
results in new roles of the individuals in the society. All stakeholders
possess knowledge and expertise that can provide valuable input when
developing e-services (Kamal et al., 2011).
This phenomenon is emphasized at the local level, if local
governments are more sensitive to citizens’ needs as devolution scholars
argue, the situation described above may imply a change from self-
imposed initiatives searching for solutions (administration-performance),
to externally imposed requirements by citizens, their representatives, and
other stakeholders (politics-accountability) (Gil-Garcia & Martinez-
Moyano, 2007).
Some stakeholder groups are more affected by the e-service in their
activities than others. This is important to consider when deciding how to
involve different stakeholder groups, making best use of their knowledge
and expertise within an efficient e-service development process
(Axelsson et al.).
Bannister & Connolly (2011) recognize the broadness of the
concept of transformational government (change of process, structure,
responsibilities, etc.) so that the question becomes “how much
transformation and of what type?”

23
1.5. Trust: A Controversial Factor Influencing e-Government
Adoption
Trust has been generally defined as “a set of expectations shared
by all those in an exchange” (Zucker, 1986; Srivastava & Teo, 2009).
This first definition describes the concept with reference to the relations
among people or organizations or institutions. But trust can also be
referred to an object of use and so it would be defined: “a set of
expectations that tasks will be accomplished reliably” (Sitkin and Roth,
1993; Srivastava et al., 2008).
The concept of trust in the context of the PA is even more complex
to define. It does not usually refer to a personal risk but, as remarked by
Bannister & Connelly (2011) “it is more likely that they are judging the
competence of the government to do something right or to do the right
thing”. The concept increases its complexity when considering the
financial crisis depending on how much citizens consider the government
responsible for the crisis and its effects on the economy.
Worrall (2011) focused on the approach toward e-Government,
highlighting the absolute need of trust (declined in different facets such
as technology, identity and time-savings issues) when adopting the e-
services: “citizens are not likely to use e-Government provided services
unless they have trust in the systems, unless they feel that their privacy

24
and security are not at risk and unless the feel that there is some
compelling reasons for them to do so”.
Common factors affecting trust have been identified but “there is
no agreement in the literature as to the characteristics that influence the
generation of a trust response” (Bannister & Connelly, 2011).
Srivastava & Teo (2009) studied the nature of trust in e-
government, coming to the identification of two dimensions of the
phenomenon:
- Trust in government (TIG);
- Trust in Internet technology (TIT).
According to Zucker (1986) trust in government emerges from
three factors: 1) Characteristics of the individual (i.e. his or her social–
cultural background); 2) Professional standards and public statements of
ethical standards (institutional trust); and 3) Experience (process trust).
[…] Process trust emerges from continual satisfactory experiences.
(Belanger & Carter, 2008).
Belanger & Carter (2008) conclude that both TIG and TIT are
influencing adoption of e-services. Srivastava et al. 2009 conclude that
TIG is influencing e-government success but not TIT.
Detlor et al. (2013) did not find supporting evidence for the
“influential effect of trust on end user uptake of electronic government
services and websites”. However, they suggest that one possible

25
explanation may be the nature of the community municipal portal (CMP)
investigated.
Until this moment, the analysis of trust has been done starting from
the assumption that trust (or different trust categories) is influencing the
use of e-government.
And, among many others, Srivastava & Teo (2009) as well as
Belanger & Carter (2008) get to the conclusion that trust is a necessary
ingredient in order to achieve the desired objective in the e-government
implementation. “As technology continues to become ingrained in
society, citizens’ perceptions of the accuracy and reliability of e-services
will increase in importance. If government agencies expect citizens to
provide sensitive information and complete personal transactions online,
they must acknowledge and enhance citizens’ views concerning the
credibility of e-government services” (Belanger & Carter, 2008).
But, on the other hand, Morgeson sees the potential of e-
government in building trust in government. He considers an inverse
influence: “e-Government is seen as a potentially transformational
medium, a mode of contact that could dramatically improve citizen
perceptions of government service delivery and possibly reverse the
long-running decline in citizen trust in government […] Put differently,
this causal mechanism suggests that the use of government Web sites
may lead to positive attitudes toward e-government, which, in turn, may

26
encourage improve trust or confidence in government generally (Tolbert
and Mossberger, 2006; Morgeson).
Both theories are strongly supported by empirical studies, both of
them are valid but provide a partial view of the structure of the
phenomenon. The literature mainly observes the impact of trust on e-
government use or e-government on trust while both impacts should be
simultaneously considered.
With the help of System Dynamic (a dynamic simulation
methodology that will be better explained in the third chapter) this thesis
will explore the two-ways relationship linking the variables of the
phenomenon.
Same reasoning can be done in reference to the relationship
between trust and users’ satisfaction, which is another important issue
when studying the process of e-services adoption.
Srivastava et al. (2009) reports controversial argument in literature.
Satisfaction has been regarded as an antecedent of trust, shaped by
previous experiences of the users. Other authors described satisfaction as
an output of trust.
In this study’s hypotheses, there is not a unique cause and a unique
effect. Both variables are acting as cause and effect creating a feedback
loop with strong implications on policy making.

27
2. Research Design & Methodology
2.1. A Multi-Method Approach to e-Government
Several methodologies are used in the literature to analyze the
adoption of e-Government in different contexts. AlAwadhi & Morris
(2009) listed some of the most used methodologies of technology
acceptance, namely, the Theory of Reasoned Action (TRA- Fishbein &
Ajzen, 1975), the Theory of Planned Behavior (TPB- Ajzen, 1991), the
Technology Acceptance Model (TAM- Davis, 1989), the Diffusion of
Innovation (DOI- Rogers, 1995) and the Unified Theory of Acceptance
and Use of Technology (UTAUT- Venkatesh et al., 2003). All these
methodologies share an attention to the attitude of the user that can
determine the success or the failure of a project.
Moreover, Structural Equation Modeling (SEM) is widely used in the e-
Government context e.g. Belanger & Carter (2008) but also Verdegem &
Verleye (2009).
Gil-Garcia & Pardo (2006) suggested that a multi-method approach
should be preferred. In fact, they wrote: “Using multiple methods has the
potential of gaining knowledge about different aspects of a phenomenon
under study, and therefore, an overall better and more complete
explanation.”

28
And a multi-method approach was indeed chosen to develop the
present work.
First of all, Institutional Theory is utilized to present the case study
and to serve as a general framework.
In order to allow a comparison with other works (e.g.
Wangpipatwong et al., 2008; Srivastava et al., 2008; Carter &
Weerakkody, 2005) and to understand in depth the correlation among the
involved variables the thesis includes a TAM analysis with a survey to
the population.
Finally these data are integrated in a dynamic model.
It is possible to find several similar approaches to e-Government
studies in the literature (although the perspectives assumed are rather
different).
Institutional Theory and System Dynamics are used together by
Luna Reyes & Gil Garcia (2011). They chose this combined approach in
order to mix a strong theoretical basis with an innovative research
method that allows the researchers to analyze the problem in a dynamic
perspective. On the one hand, institutionalism helps in investigating the
relationships among technology, organizational factors, institutional
arrangements, and the socio-economic context in which they are
embedded. They argued: “studies with this view propose that there is a
recursive and complex relationship between information technologies

29
and social structures and, as a consequence, the results of ICT projects
are highly uncertain and cannot be easily predicted”. On the other hand
system dynamics helps dealing with this uncertainty proposing
alternative dynamic projections of the results.
Another useful example of multi-method approach to e-government
studies is the one of Aloraia et al. (2011). These authors studied the
acceptance of technologies in Iran. Their starting point was the
traditional TAM but they decided to extend the model in order to
perceive the continuity in the usage of these technologies. According to
the authors was “also important to consider the simultaneous habit to
new and old systems of technologies […]. It is significant to note that
technology acceptance does not occur at a single point of time but rather
it happens in the process of time”.
For these reasons they introduced a System Dynamics model that
was built on the basis of the TAM and its variables.
2.2. How a System of Rules Influences Social Behavior: Insights
from Institutional Theory
The phenomenon of e-services adoption is complex and dependent
on different strategies of implementation, on peculiar regulatory
frameworks and socio-economic environment and cultural profiles of
potential users in the territory.

30
For this reason, it is relevant to present the case study of the
municipality of Palermo with a 360° overview on the normative, social
and economic background. The choice of Institutional Theory as a
framework answers this need of completeness.
In fact, “Institutional Theory attends to the deeper and more
resilient aspects of social structure. It considers the processes by which
structures, including schemas; rules, norms, and routines, become
established as authoritative guidelines for social behavior. It inquires into
how these elements are created, diffused, adopted, and adapted over
space and time; and how they fall into decline and disuse.” Scott (2004).
Luna- Reyes & Gil-Garcia (2011) applied this method to e-
government studies (studies of e-portals in Mexico) because institutional
theory is a strong integrative approaches that recognize the importance of
the context in which ICTs are embedded. By concentrating on higher
levels of analysis when using institutional theory, IT researchers would
be able to better understand and to explain: “how regulative processes,
normative systems, and cultural frameworks shape the design and use of
technical systems” (Mignerat & Rivad, 2005; Orlikowski and Barley,
2001).
Of course, it is always easier to investigate on the regulatory and
normative profiles since most of the data come from written document.
Moving toward the cultural profile, the interpretation is based on

31
informal mental models, schemas and beliefs. Morecroft defines mental
models as a “dynamic pattern of connections comprising a core network
of "familiar" facts and concepts, and a vast matrix of potential
connections that are stimulated by thinking and by the flow of
conversation” (Morecroft, 1994, p. 7). The cultural profile, especially the
mental models, is more difficult to be depicted since often created
without a real awareness of the individual.
2.3. Research Hypotheses
TAM analysis will be then introduced. This methodology is ideal
for the municipal context and in order to make the results comparable
with similar studies. Correlation tables out of TAM analysis are easy to
read and can communicate very well even to people who are not at ease
with calculations.
The grounding of TAM is that two specific beliefs, namely
perceived ease of use and perceived usefulness, influence the users’
behavioral intention to adopt a technology (Venkatesh, 2000).
Davis defined the perceived ease of use (PEOU) as “the degree to
which a person believes that using a particular system would be free from
effort”, meaning the perception of how easy is to learn to use a new
technology, (Davis, 1989).

32
The perceived usefulness (PU) is a different concept defined as
“the degree to which a person believes that using a particular system
would enhance his or her job performance”, (Davis, 1989). This second
belief is formed after the adoption of the technology and expresses the
perceived advantage in using the new technology in place of the older
one. This variable is also influenced by the perceived ease of use that
contributes to build the relative advantage in using the new technology.
In Davis’ model, these two beliefs (influenced by external
variables) determine the attitude toward using the new technology and
consequently the actual use of it, (Fig. 2).
Fig. 2 Technology Acceptance Model (Davis, 1989)
For the purpose of this study, the model was modified according to
implicit suggestions from the reviewed literature (see fig.3). As Detlor et
al. (2012) suggested in their work, the choice was “to investigate the
impact of the model constructs on individual self-reports of actual use,
rather than a person's intention to use”.

33
The survey tested the actual use. The idea was to make the survey
brief and to let the people surveyed focus on what they could experience.
“This decision was consistent with previous TAM-based studies which
contend that a variety of measures of system use are all acceptable
proxies for use, and employ only one of these as a means to simplify
already complex research models” (Detlor et al., 2012; Petter et al.,
2008).
The variables to be tested were obtained from an adaptation and
integration of the models of Belanger & Carter (2005), Carter &
Weerakkody (2008) and Teo et al. (2008).
Fig. 3 TAM adaptation

34
Important in the research model are the feedbacks. Not only the
model considers the effect of the key variables on the System Use, it also
assesses the effect of the use (and that means the adoption of e-services
by the population) back on its determinants.
In fact, the more people adopting e-services, the more positive
externalities in terms of knowledge, experience, trust and satisfaction are
spread out.
The hypotheses underlying to the described model can be made
explicit as follows:
H1: Perceived usefulness of e-Government websites will positively
influence citizen’s use of e-Government websites. PU =>USE
H2: Perceived Ease of Use of e-Government websites will
positively influence citizen’s use of e-Government websites. PEOU
=>USE
H3: Users’ satisfaction of e-Government websites will positively
influence citizen’s use of e-Government websites. SA=>USE
H4: Trust in Government will positively influence citizen’s use of e-
Government websites. TIG => USE
H5: Trust in Internet Technology will positively influence citizen’s
use of e-Government websites. TIT => USE
H6: Perceived ease of use and perceived usefulness of e-
Government websites are strongly related. PEOU =>PU

35
H7: Trust in government will positively influence users’
satisfaction of e-Government websites. TIG=>SA
H8: Trust in technology will positively influence users’ satisfaction
of e-Government websites. TIT=>SA
H9: Perceived Usefulness and Satisfaction are strongly related.
PU=>SA
H10: Perceived Ease of Use and Satisfaction are strongly related.
PEOU=>SA
In order to identify the significant determinants affecting the
adoption in the peculiar context of the municipality of Palermo a survey
was delivered through the official website of the municipality1.
The survey (Appendix A) was prepared with reference to the work
of Wangpipatwong et al. (2008), Elling et al. (2012) and Detlor et al.
(2012).
It was published on the official homepage of the municipality of
Palermo in June 2013 and spread out with the help of social networks. In
September 2013, after three months online, 389 respondents had filled
the questionnaire. The sample (Tab.1) appears to be quite representative
including all the age groups and a good representative of all the kind of
occupations (unemployed included).
1 It can still be found online: http://www.comune.palermo.it/questionario_e-gov.php.

36
Characteristics Frequency Percent
Gender Female 251 64.52%
Male 138 35.48%
Age 18-24 31 7.97% 24-35 163 41.90% 35-60 165 42.42% >60 30 7.71%
Highest Level of Education Junior High School 5 1.29%
Senior High School 150 38.56%
Bachelor’s Degree 234 60.15%
Occupation Student 67 17.22%
Private Sector
Employee 65 16.71%
Government Employee 80 20.57%
Self Employment 93 23.91%
Unemployed 47 12.08%
Other (Retired) 37 9.51%
Tab. 1 Demographic characteristics of respondents
More than the 80% of the respondents are aged between 24 and 60
years and most of them earned a bachelor’s degree. Age categories are
consistent with AUDIWEB September 2013 report
(www.audiweb.it/dati/index.php) in Tab.2 except for a greater presence
of the 24-35 categories that is explained by the spreading of the survey
through social network as Facebook and Twitter. There is a higher
presence of women in the sample compare to the statistics.

37
Internet Active Users in Southern Italy and Islands (.000) AGE GENDER TOTAL % MEN % WOMEN % 2-10 47 2.03% 34 1.86% 81 1.96% 11-17 115 4.97% 85 4.65% 200 4.83% 18-24 287 12.41% 218 11.92% 505 12.19% 25-34 428 18.50% 427 23.35% 855 20.64% 35-54 1009 43.62% 882 48.22% 1891 45.65% 55-74 419 18.12% 177 9.68% 596 14.39% >74 8 0.35% 6 0.33% 14 0.34% All 2313 55.84% 1829 44.16% 4142 100.00%
Tab. 2 Active users per age, gender and geographic area (September Report
AUDIWEB)
All the occupational categories are well represented with a slight
majority of self-employees and government employees.
2.4. Introducing the Model: System Dynamics basic tools.
Finally, the variables used in TAM are transferred to a System
Dynamics Model in order to explore alternative future scenarios and
design effective policies.
System dynamics (SD) was developed as a method for designing
policy solutions based on computer simulation of problematic
endogenous feedback structures (Wheat, 2010).
The founder of the theory, Jay W. Forrester, an electrical engineer,
initially conceived SD as a business management tool. But the SD
methodology was soon applied to public sector issues (Wheat, 2010).

38
In general people analyze their problems looking at them as the
direct consequence of a previous action without considering the possible
delays. Most of the time, this bias is overcome with the help of rules of
thumb.
A simple (almost trivial) example is the one of an “unknown”
shower. When regulating the temperature of the water, people get hurt or
freeze before finding the right regulation. This happens because they are
not conscious of the delay between the order sent turning the handle and
the regulation inside the tubes.
Likewise, when implementing a strategy in a complex system, both
in private and public organizations something puzzling happens: often
new strategies are put in place before the previous one had given its
results, generating a misperception (if not a big confusion) in the minds
of the decision-makers.
Traditional perspectives fail to describe the interaction processes
and resulting emergent properties, in which the state and its novelties
change over time (Lin & Lee, 2006).
Therefore, whereas the human brain does not perceive the process
of accumulation (Bianchi, 2009), and tends to recognize problems as a
direct series of events, this methodology can help providing a dynamic
view of all the forces acting in the system at the same time.

39
This methodology is therefore appropriate in order to solve
problems in complex systems characterized by the following features
(Bianchi, 2009):
1. A structure characterized by counterintuitive dynamics;
2. Levers that can be use by the decision-makers in order to
influence the results toward the desired objectives;
3. Sensitivity of the results to the effect of exogenous variables;
4. A frequent opposite behavior of the variables in the short versus
the long run;
5. Relevant delays of the system to the deliberated policies.
The first thing a System Dynamics student learns is that given behaviors
(reference mode of the problem in object) are related to given structures.
System Dynamics offers two kinds of representation: causal loop
diagrams (CLD) and stock and flow diagrams (SFD). The first one is
qualitative and is aimed to focus on the causal relationship among the
variables. The other one is quantitative and is aimed to emphasize the
physical structure of the system in object.
The models are realized with softwares ad hoc (iThink, PowerSim,
Vensim, etc.). While the concept of causal loop diagram is very
immediate and easy to be understood (see fig.5), the stock and flow
diagram requires a brief description of the elements included:
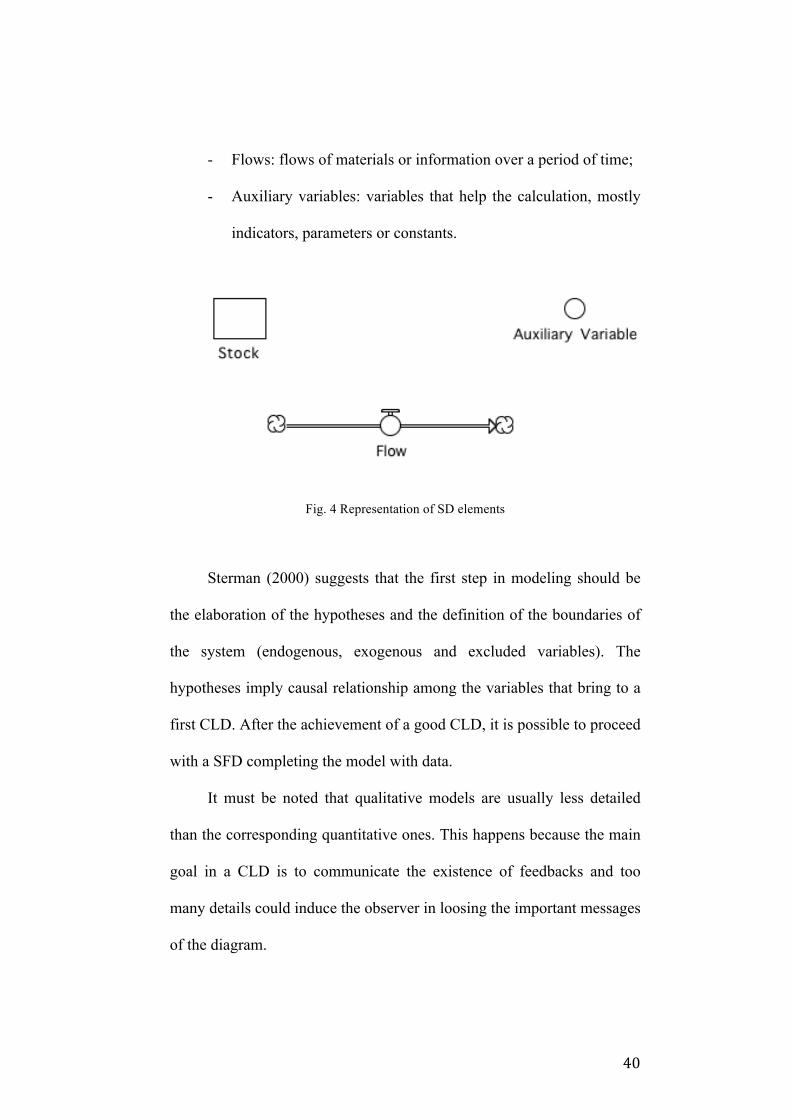
- Stocks: availability of resources at a given moment in time,
40
- Flows: flows of materials or information over a period of time;
- Auxiliary variables: variables that help the calculation, mostly
indicators, parameters or constants.
Fig. 4 Representation of SD elements
Sterman (2000) suggests that the first step in modeling should be
the elaboration of the hypotheses and the definition of the boundaries of
the system (endogenous, exogenous and excluded variables). The
hypotheses imply causal relationship among the variables that bring to a
first CLD. After the achievement of a good CLD, it is possible to proceed
with a SFD completing the model with data.
It must be noted that qualitative models are usually less detailed
than the corresponding quantitative ones. This happens because the main
goal in a CLD is to communicate the existence of feedbacks and too
many details could induce the observer in loosing the important messages
of the diagram.

41
It is important to start testing the hypotheses and relationships from
the beginning and to keep testing them over the all period of modeling.
This is the process that has been followed for the present research.
The hypotheses are those among the ones listed in the previous paragraph
that will have been confirmed by the TAM analysis in the next chapter.
The key element is the adoption of e-Government and in particular, the
adoption of the e-services that is possible to complete online.
The subjects are therefore the Users (those who already adopted
the e-services) and the Potential Users (those who are active on the
Internet and perform purchases online but do not interact with the PA).
The objective of the PA is to make Potential Users become Users. In
order to achieve the object, it is important to understand the combined
effect of the variables in the system.
By analogy with the other study of spreading of innovation (or
disease) the key figure of the simulation is an adaptation of the Bass
Model.
In fig. 5, two feedback loops can be observed. The one on the left is
marked with a B which stands for Balancig Loop. The one on the right is
marked with a R which stands for Reinforcing Loop. The attributes of
reinforcing and balancing are not synonimuos of positive and negative. A
reinforcing loop is a loop that is feeding itself, a balancing loop is a loop
that is draining itself.

42
Likewise the + and – marking are not standing for good or bad but
for direct and indirect relationship.
Fig. 5 Example of Bass Model (CLD)
Fig. 5 must be read as follows. The balancing loop on the left tells
the observer that the more is the potential users, the more the adoption
rate will be but the more the adoption rate the less the potential users. In
fact, if, on the one hand, more people ready to adopt could assure a big
flow toward the stock of users; on the other hand, the flow adoption rate
is draining the stock of potential users that will tend to 0, a steady-state,
an equilibrium point. This is what is called a “goal-seeking behavior” and
is typical of a balancing loop. Isolating the effect of the balancing loop
on the stock of potential users, the result would be the curve in fig. 6 that
tends in an asympthotic way to X-axis.

43
Fig. 6 Example of goal-seeking behavior
Different is the behavior of the reinforcing loop (marked with “R”
in fig.5). A high adoption rate implies more users and more users imply
an higher adoption rate generating the an “exponential growth” curve as
shown in fig. 7. This cycle will boost itself until the emergence of a limit
to growth (in this case, the complete depletion of the potential users
because all of them became users).
Fig. 7 Example of exponential growth
The combined effect of the two loops together depends on which
loop is dominating over the simulation period. Since the stock of

44
potential users is full at the beginning of the simulation, the draining
effect is not evident and the reinforcing loop is dominating. But when the
stock of users start filling up, the strenght of it is reduced and the
draining effect reduces the flow. The result is a S-shaped growth curve
(fig.8).
Fig. 8 Example of S-shaped growth
Of course, in order to obtain the curves, is necessary to translate the
qualitative model into a quantitative one. Fig. 9 shows the Stock and
Flow Diagram (SFD) corresponding to the structure described above in
the CLD in fig.5. And, as previously explained, containes more details to
allow a correct calculation of the behavior of the variables.
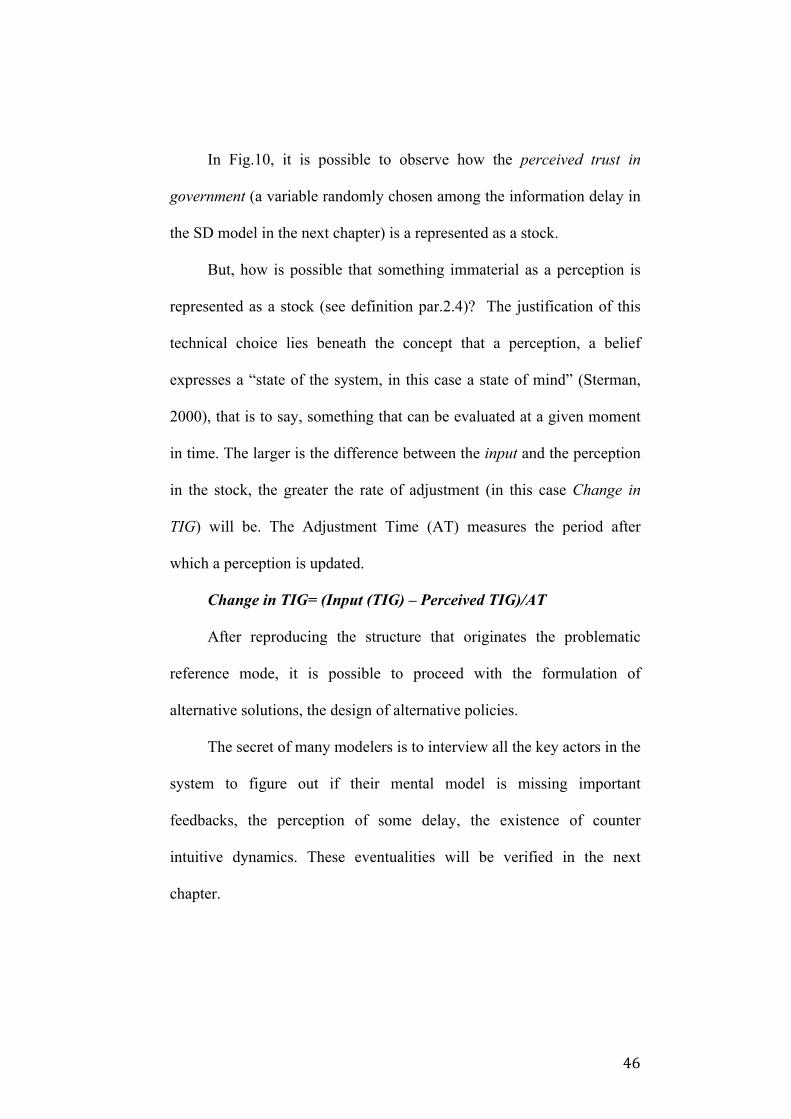
Before going in depth into the modeling process, there is another
element, a typical SD structure (that will be often recurring in the model)
that must be explained: the information delay represented in the Stock
and Flow Diagram in Fig. 10.

45
Fig. 9 Example of Bass Model (SFD)
Fig. 10 Information delay (SFD)
The structure of information delay expresses the time that takes “to
gather the information needed to form judgments, and people do not
change their minds immediately on the receipt of new information.
Reflection and deliberation often take considerable time. We often need
still more time to adjust emotionally to a new situation before our beliefs
and behavior can change” (Sterman, 2000).
46
In Fig.10, it is possible to observe how the perceived trust in
government (a variable randomly chosen among the information delay in
the SD model in the next chapter) is a represented as a stock.
But, how is possible that something immaterial as a perception is
represented as a stock (see definition par.2.4)? The justification of this
technical choice lies beneath the concept that a perception, a belief
expresses a “state of the system, in this case a state of mind” (Sterman,
2000), that is to say, something that can be evaluated at a given moment
in time. The larger is the difference between the input and the perception
in the stock, the greater the rate of adjustment (in this case Change in
TIG) will be. The Adjustment Time (AT) measures the period after
which a perception is updated.
Change in TIG= (Input (TIG) – Perceived TIG)/AT
After reproducing the structure that originates the problematic
reference mode, it is possible to proceed with the formulation of
alternative solutions, the design of alternative policies.
The secret of many modelers is to interview all the key actors in the
system to figure out if their mental model is missing important
feedbacks, the perception of some delay, the existence of counter
intuitive dynamics. These eventualities will be verified in the next
chapter.
47
3. e-Government Adoption in Palermo: State-of-
the-Art and Forgotten Promises
3.1. Building the System of Rules: the Italian Regulatory
Framework
Every system of rules should evolve within the society. It should
even anticipate the possible evolution of the society in terms of culture,
habits and, of course, technology.
Over the last decade, mainly due the regulations provided by the
EU, the Italian regulatory framework has been reviewed and integrated in
order to improve communication between government and citizens of the
country. Although in Italy the issue of information from the Public
Administration (PA) toward citizens had already been raised in the early
‘90s, Lisbon Strategy gave new impulse to the process of improvement
and development in this field.
Law n.150/2000 recognized information and communication as
key tools for obtaining legitimacy in government actions. The aim of this
law was to innovate the means of information and communication
through the adoption of new technologies. It mandated the existence of
Citizen Relation Offices (“URP”) in order for the Local Authorities to be
closer to the citizens; it also required internal Press Agencies to
guarantee the constitutional right to information. The birth of URP

48
expressed a clear intention to bring PA closer to the citizens and to listen
to their problems and suggestions.
In 2004, the Parliament enacted law n.4, better known as Stanca’s
Law, in order to break down the existing virtual barriers. Stanca’s Law
introduced the concept of accessibility2 and increased control over it. But
the focus was placed on human equality (and equity) and not on the right
to information. In its essence Stanca’s Law provides instructions for the
design of the web sites of the PA, particularly for application of
predefined rules among the public managers, paying attention to the law
requirements more than to the underlying idea of progress and efficiency.
A complete code regulating the subject, the Code of Digital
Administration (Decree No.82/2005), was finally issued in 2005. It is a
“constitution” of digital world stating rights and duties of users. It
includes and reorganizes the entire discipline and provides with the legal
basis for the actions.
CAD was renewed for the first time in 2010 (with Decree
No.150/2009 better known as Brunetta’s Decree) after the introduction of
transparency and performance evaluation, which led to accepting this
system as a winning practice for the progress in public administration. It 2 Accessibility is defined by law as “the ability of the computer systems, in the forms
and in the limits allowed by the technological knowledge, to disburse services and to
furnish usable information, without discriminations, also from those people that need
assistive technologies or particular configurations because of their disability” (Law
n.4/2004, art.2 c.1 lett.a).

49
was also emphasized that transparency should be achieved through a
total accessibility to public documents.
It must be noted that Italian regulatory framework (together with its
executive documents) is the result of a top-down approach, which
appears to be in contradiction with the e-government assumptions. The
listed laws prescribe a compulsory content for public web sites and
require implementation of ICT tools in order to assure the availability of
online public service. The focus is on the service delivered, namely on
what the institution should provide the society with.
On the other hand, little attention is paid to the citizens’ actual use
of the content that is tremendously low. Businesses and citizens are often
unaware or highly confused regarding their role in this new digital civil
society. While in the past they were just asked for political consensus, the
progress in the public administration required them first for control over
the administration performance and now they are even called to
participate in shaping the services and participating in the decision-
making process. The question is: are they willing to participate?
Moreover, are they enough skilled to participate? Would not this
participation involve just those who propose themselves, “active
citizens”? These questions are even more relevant at the local level and
manager should deal with these issues. Clearly, policy learning assumes
different profiles.

50
Recent literature put emphasis on the need for a more user-centric
approach. In fact, the logic of E-Government suggests a partial shift of
control to the citizens that with their feedback can contribute to
improving the system and completing the actions of the government.
This shift of control cannot happen unless the citizens feel comfortable
with the provided tools. Therefore after assuring accessibility, it is
compulsory to work on usability. The improvement in usability should be
carried on as a result of the interaction with the users.
As suggested by the European Commission (2010), users should be
“helped to become self-sufficient, to become a part of the solution, or
even a provider of it”. Moreover they should perceive an added value (or
relative advantage) in using these tools and contribute to the adoption
process encouraging others to do the same.
In 2012, the technocrat government led by Prime Minister Monti
put in place some regulatory actions aimed to foster development and
growth after the financial crisis. These actions focus on the need for
simplification and transparency to be achieved also through digital
solutions. Common goals are the reduction of administrative cost,
simplification of authorization procedures and rationalization of
procedures.
The Decree no. 5/2012 issued the National Digital Agenda that
recalls the objectives of the European Digital Agenda. The Decree no.

51
83/2012 suppressed DigitPa (the previous institutional body in charge of
digitalization) and issued an autonomous agency, Agency for a Digital
Italy, which covers DigitPa’s functions of control and coordination but is
also responsible for the diffusion of use of ICT, for the process of editing
technical rules to standardize the language (interoperability) and for
service quality control. Moreover, an increasing interest in educating
people to operate in a digital world, demonstrates the awareness of the
role of the society in achieving the desired results.
3.2. Presenting the Case- Study: e-Government Projects
Implemented in the Municipality of Palermo
While elaborating this thesis, the author witnessed the
implementation of the second e-Government project of the municipality
of Palermo and the new institutional website. The present paragraph
describes both of the projects with their peculiarities to assure a good
understanding of the strategies implemented and of the hindrances met
by the decision-makers.
This moment of change can be considered a big opportunity for
testing the improvement in the implementation and, as a consequence,
adoption of the e-services.
The first e-Government project for the municipality of Palermo was
presented in June 2002 to take part to the notice of funding issued in

52
2001 for e-Government implementation by the Italian Department of
Technological Innovation. It was called “M.A.I.A.”, Italian acronym for
“Miglioramento delle Applicazioni e delle Infrastrutture Applicative per
il governo della città di Palermo” (the name refers to the improvement of
tools and infrastructure of the municipality of Palermo but is not
intuitively bringing back to the imagine of a web portal and this obstacles
the adoption) and was shaped as a web portal to allow an easier access to
the municipal services for citizens and businesses. The project was
approved in November 2002 and co-funded by the Department of
Technological Innovation with 340.000 euro. The General
Administration of the municipality allocated 1.221.000 euro for the
project execution.
The project was committed to the Information System Department
of the municipality with the technical support of an ICT company,
Sistema Palermo Informatica S.p.A. (SISPI) in February 2004. At that
time, SISPI was a subsidiary of the municipality of Palermo that owned
51% of the shares.
It was clear to the national Department of Technological
Innovation (presently enclosed in the Department of Public
Administration and Innovation) that infrastructures and human resources
were not ready to support a complete digitalization of public services and
the failure of the national project for electronic ID cards (mainly because

53
of a lack of funding) implied the need for new investments on the digital
identification process. What the Department actually expected was a first
move toward the achievement of local digital administrations in terms of
infrastructures, ICT facilities and culture.
This is the reason why MAIA’s objectives, in this first attempt,
were downsized to three main goals:
1) Arrangement of ICT facilities;
2) Coordination of the back-office to provide a unique front-end;
3) Delivery of a municipal web portal.
First of all, it was necessary to build the infrastructures (networks)
and to purchase the facilities (servers, storage, etc.) needed in order to
offer a new service model.
The second goal consisted in providing citizens a one-stop shop, a
unique front-end. It was not important how the process was executed in
the back-office (traditional or digitalized) but the service had to be
delivered on time.
A unique front office was a big challenge for an administration of a
large size municipality as Palermo, where each sector used to have its
own documents recording system. Presidential Decree 445/2000
prescribed a single document recording system, a unique Protocol
Identifier, but has not been realized yet. Moreover, even though it was
not required to set up a digital back office, it was necessary to improve

54
the communication among the offices in order to guarantee the
possibility for the citizens to be allowed to follow their own procedures.
In order to answer this need, SISPI S.p.A. realized an intranet called
Intr@com where all the public employees could register and work .
As a third goal, Sispi SpA started the implementation of a web
portal available to citizens and businesses. The portal included all the
major “ingredients” of e-Government strategies. The choice to maintain
the traditional channels alive was present and clear in including the
Intr@com. However, it is not clear which institutions were included in
this Intranet and what kind of relationship was undertaken with the
external ones.
The portal also provided a brief description for each of the 53
services toward businesses and citizens that were classified in the portal
according to the life-event approach. The following municipal reports
acknowledged that works were proceeding and defined the content of the
portal in detail. In spite of that, MAIA was not complete yet and only
limited available areas were reproduced in the website
www.comune.palermo.it. Curiously, the website was independent from
the Information System Department of the municipality and from Sispi
Spa and presented different version of the available forms creating
confusion among the users. The creation of the website had been

55
assigned of a Webmaster directly depending on the Vice President of
Cabinet to the Mayor of Palermo: the lack of coordination was evident.
In 2004, MAIA Executive Plan, namely “Rapporto Esecutivo B1”
(Information Systems Department of the Municipality of Palermo, 2004)
defined the main operational measures to be undertaken: specific training
for 184 employees, a weekly monitoring of user satisfaction, a
classification of the 53 available e-services among the 4 interactivity
levels on basis of the ones suggested by the European Commission
(information, unidirectional interaction, bidirectional interaction, trans-
activity).
In 2011, the City Council approved a new project described in the
municipal resolution of the 31st of May 2011 as the “natural prosecution
of M.A.I.A. portal [...] that place itself inside a dynamic planning
strongly oriented towards evolutionary strategies of the Municipal
Department of Information System fostering direct services supply to
citizens, businesses and other administrations”.
The new project consists of the realization of a new web portal
“Portale dei servizi on-line – Sistema di autenticazione e servizi on-line
di livello 4”. As the name suggests, this new plan aims to improve the
authentication process and to make all the services to achieve Level 4 in
the interactivity scale (fulfillment of the procedure online).

56
It was again put in charge of SISPI SPA (from 2009 totally hold by
the municipality of Palermo). The funds, an amount of 1.199.000 euro,
will be provided by the Regional Department of Family and Social
Policy to rely on the European intervention strategy 6.1.4.1. PO FESR
Sicilia 2007/2013. The implementation should be completed by the end
of 2013.
The Webmaster, though, is still independent and this could
generate confusion in the division of the responsibilities and lack of
coordination in the answer to the citizen.
Some interviews to managers of Sispi Spa and of the Information
System Department of the Municipality of Palermo confirmed also the
existence of two important critical points in the innovation of the
administration.
First of all, a big issue is the acceptance of the new channels of
interaction within the organization: every single agency fears an overload
of inquiries that would not be able to face the first days of
implementation of a new service with bad consequences for the
reputation of the office.
Moreover, and this is maybe the worse problem, there is a cultural
resistance of the employees who perceive the digital channels as an
increase of their workload in the short-term.

57
It is maybe too early to decree the success or failure of the second-
generation project but monitoring the perception of individuals with
respect to the change could allow important strategic adjustments.
Measuring e-Government in order to evaluate different policies is
not easy because of all the immaterial values involved. Nonetheless it is
important to capture the feedbacks underlying given e-Government
system.
3.3. Testing the Key-Determinants of e-Government Adoption
using Technology Acceptance Model (TAM).
The hypotheses for the TAM (see par. 2.3) were tested via a survey
on the official website of the municipality of Palermo that was completed
by 389 respondents between June and August 2013.
Having already seen the composition of the sample, it is possible to
proceed analyzing the usage behavior of the respondents.
Tab. 3 makes explicit the percentage of use and the reasons that
enhance or hinder the use of the e-government municipal website. More
than 60% of the respondents use the website but only a 10 % completes
procedures online. Most of the respondents only look for information.

58
Frequency Percent
Do you use the website to interact with
the municipality?
Yes 250 64.27%
No 139 35.73%
If yes, what for?
1) Find information 228 58.61%
2) Download form 163 41.90%
3) Complete the procedures online
(Registered Users) 63 16.20%
4) Other 41 10.54%
If no, why?
1) I do not trust the instrument 17 4.37%
2) The information I find are not
updated nor reliable 33 8.48%
3) I need to go to the office anyway 59 15.17%
4) I do not feel the need to interact 46 11.83%
5) Other 19 4.88%
Tab. 3 Reasons for using the mnicipal website or not
A low use rate is not alarming per se. “By their very nature,
community municipal portals, as well as traditional local government

59
websites, may always experience low frequency of use. After all, how
reasonable is to expect citizen to utilize such sites on a daily or even
frequent basis?” (Detlor et al., 2013). The problematic issue rises, on the
other hand, when low use rates are associated with a low users’
satisfaction.
The main reason that hinder the use of the website is the fact that
the users need to complete their procedures in a municipal office anyway,
so they do not perceive a relative advantage in using the digital channel
in place of the traditional one.
A second reason is that some users do not feel the need to interact
with the public administration.
It is crucial to understand if people do not need to interact because
someone else carries out their activities and they prefer to get the
information elsewhere or for other deeper reasons. In fact, as stated by
the European Commission (2012) “an expressed lack of interest could
relate to a number of things: lack of knowledge and skills, a genuine lack
of interest, lack of an appropriate offer or not wanting to report financial
reasons”.
The constructs included in the survey are listed in table 4. This
table also provides important information on the variation of trust in
government and trust in technology in the last years to get a perception of
the evolution of trust.

60
As it is possible to observe, there was a sensible increase of trust in
technology (now accepted in people every-day life for information and e-
purchases).
Construct Items Mean Modal Value
Standard Deviation
Trust in Technology (old) TT1 I trusted using the Internet
in the last 5-3 years 1.56 1.00 0.87
Trust in Technology (new) TT2 I trust using the Internet at
present 7.43 8.00 1.88
Trust in Goverment (old) TG1 I trusted the government in
the last 5-3 years 2.10 2.00 0.63
Trust in Goverment (new) TG2 I trust the government 3.48 1.00 2.14
Perceived Usefulness (PU) PU1 The website provides useful
information 5.73 6.00 2.24
PU2 The website provides reliable information 5.84 6.00 2.29
PU3 The new website is better than the older one 6.41 6.00 2.43
Perceived Ease of Use (PEOU) PEOU1 The website is easy to
navigate 4.65 6.00 2.34
PEOU2 The homepage is visually appealing (easy on the eyes)
4.86 6.00 2.52
Interest in Interacting with PA
IPA1 It is important to interact with the PA 7.11 10.00 2.71
IPA2 It is important to interact with the municipality 5.84 6.00 0.80
Security SE1 I feel protected in the use of the website 5.53 6.00 2.50
Satisfaction SA1 I am satisfied with the services provided on the website
5.01 6.00 2.29
Tab. 4 List of constructs and items in the survey
61
On the other hand, the table reports a slight increase of trust, which
could be good signal in a period of crisis. But the value is still too low
with a mean of 3.48 and a modal value of 1 in a scale from 1 to 10.
It must be noted that, while the mean of the constructs of perceived
usefulness assume values close to 6.00, the constructs of perceived ease
of use do not. Despite the design of a new website, the citizens are not
comfortable with the homepage and the navigation tools.
In general, citizens do not feel fully secure and are not fully
satisfied.
The choice of analyzing the “actual use” in place of the “intention
to continue using” the e-Government website (see par. 2.3) allows to
obtain data that are based on the current situation and that are less
influenced from the feelings of the moment. But the answer can just be
“yes” or “no” without any indication on the continuity of the use.
However, analyzing the mean values of the preferences of the
respondents that are users (registered users – see tab.2- that can
complete procedure online) and comparing it to the preferences of the
total population of respondents, it is possible to verify how the users are
characterized from higher degrees of perceived usefulness, perceived
ease of use, satisfaction, interest in interacting with the PA and perceived
security (Tab.5). This is consistent with hypotheses H1, H2, H3.

62
Item
Mean of all
respondents
(A)
Mean of
registered
users (B)
B-A
TIG(new) 3.4758 3.9206 0.4448
TIT(new) 7.4275 7.7778 0.3503
PU1 5.7328 6.8254 1.0925
PU2 5.8499 6.9523 1.1025
PU3 6.4071 7.2698 0.8627
PEOU1 4.6539 5.5397 0.8857
PEOU2 4.8651 6.1270 1.2618
IPA1 7.1196 8.3175 1.1979
SE1 5.5318 6.5556 1.0237
SA1 5.0153 6.1905 1.1752
Tab. 5 Characteristics of registered users
Trust in government assumes a slightly higher value in the group of
the registered users compared to the total of the respondents. For trust in
technology the difference is not that relevant. These results do not
surprise with reference to trust in technology since the mastery of the
Internet is now widespread, pervasive among the citizens even in
63
Palermo. On the other hand, the low value of trust in government among
the registered users was not expected since most of the previous literature
tested trust and found it to be crucial for the adoption of e-Government.
As already seen in paragraph 1.5, Worrall (2011) excludes the adoption
of the users “unless they have trust in the system”. Belanger & Carter
(2008) and Srivastava & Teo (2009) also conclude that trust is an
essential factor of adoption. The possible causes of this result were
investigated more in depth and will be discussed in paragraph 3.6.
Therefore, H4 is partially confirmed, H5 do not find confirmation.
As it is possible to observe in the Correlation Table (Tab. 6), there
is a consistency in the data with regard to perceived usefulness and
perceived ease of use. PU1, PU2 and PU3 are strongly correlated among
each other as well as PEOU1 and PEOU2.
The strong correlation between perceived usefulness and perceived
ease is consistent with hypothesis H6.
H7 and H8 do not find confirmation. In fact, it seems that trust in
government and trust in technology are not correlated to users’
satisfaction.
On the other hand, perceived usefulness and perceived ease of use
appear to be strongly correlated to users’ satisfaction, consistently with
H9 and H10.
The survey also provided some additional information.
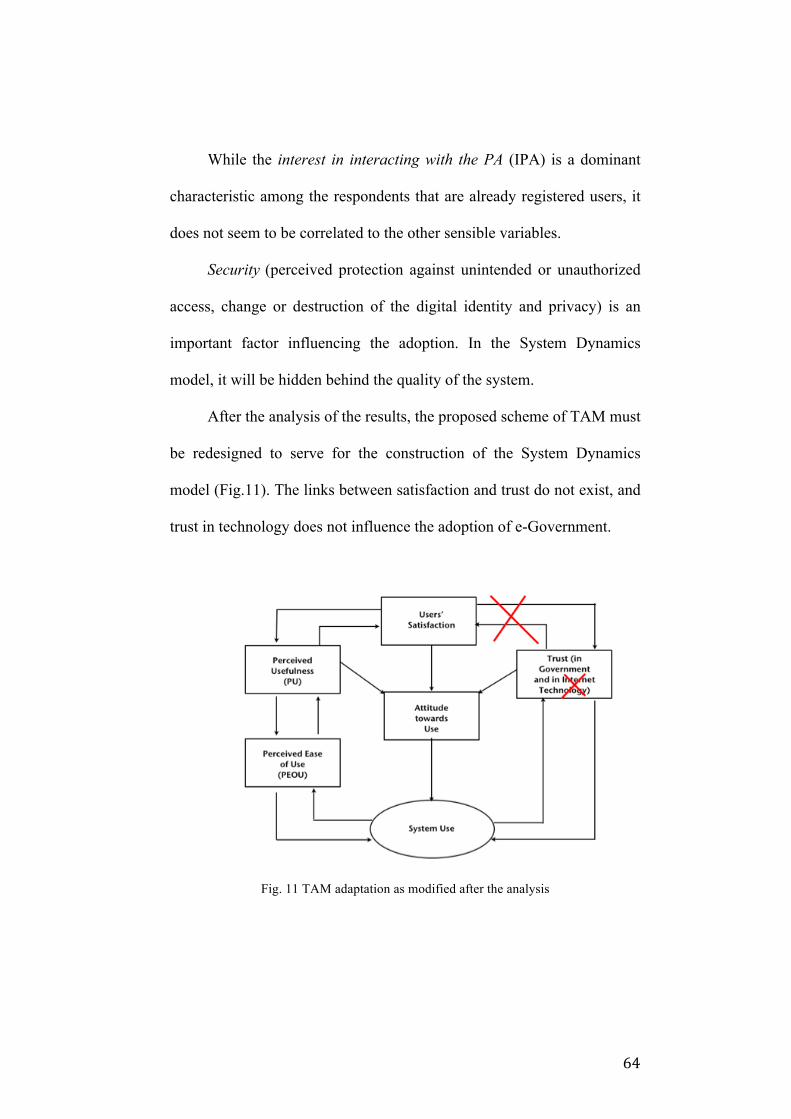
64
While the interest in interacting with the PA (IPA) is a dominant
characteristic among the respondents that are already registered users, it
does not seem to be correlated to the other sensible variables.
Security (perceived protection against unintended or unauthorized
access, change or destruction of the digital identity and privacy) is an
important factor influencing the adoption. In the System Dynamics
model, it will be hidden behind the quality of the system.
After the analysis of the results, the proposed scheme of TAM must
be redesigned to serve for the construction of the System Dynamics
model (Fig.11). The links between satisfaction and trust do not exist, and
trust in technology does not influence the adoption of e-Government.
Fig. 11 TAM adaptation as modified after the analysis

65
Tab. 6 Correlation table
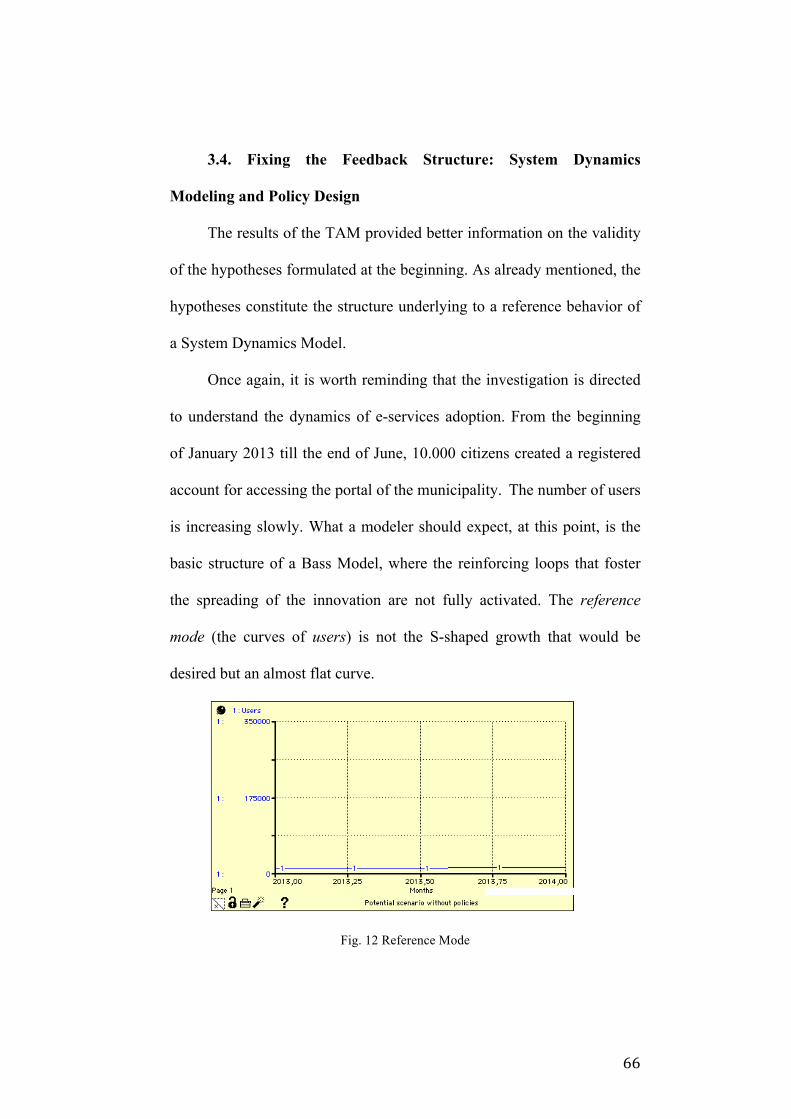
66
3.4. Fixing the Feedback Structure: System Dynamics
Modeling and Policy Design
The results of the TAM provided better information on the validity
of the hypotheses formulated at the beginning. As already mentioned, the
hypotheses constitute the structure underlying to a reference behavior of
a System Dynamics Model.
Once again, it is worth reminding that the investigation is directed
to understand the dynamics of e-services adoption. From the beginning
of January 2013 till the end of June, 10.000 citizens created a registered
account for accessing the portal of the municipality. The number of users
is increasing slowly. What a modeler should expect, at this point, is the
basic structure of a Bass Model, where the reinforcing loops that foster
the spreading of the innovation are not fully activated. The reference
mode (the curves of users) is not the S-shaped growth that would be
desired but an almost flat curve.
Fig. 12 Reference Mode

67
Since the boundaries of the research had already been outlined for
the TAM analysis, the process of modeling started from the design of a
CLD on the basis of the known relationship among the variables.
The spreading of an innovation (as well as the spreading of a
disease) can be represented with a Bass Model, widely used by hi-tech
firms. This basic structure has already been explained in the previous
chapter. The Bass Model is constituted by the loops B1 and R1 in the
CLD in Fig.13.
Fig. 13 CLD of the e-Gov adoption in Palermo

68
The Adoption Rate is driven by the Attitude toward Use that is a
result of Perceived Usefulness, Users’ Satisfaction and Trust, key
elements in the other three reinforcing loops of the model. Each loop will
be now analyzed in detail here below.
R2 is a loop driven by the perception of the quality of the system in
terms of usability and relative advantage in using the digital channels in
place of the traditional ones. It is a reinforcing loop that must be read in
the following way:
+PEOU => +PU => +Attitude toward Use => +Adoption Rate =>
+ Users => +PEOU.
Perceived Ease of Use (PEOU) is the result of the perception of the
completeness of the content developed and available, of the tools for
navigating the website and easily find the information needed, and of the
accessibility to the portal for the registration. PEOU is also influenced by
the number of users. The reason for this relationship is simple: the more
people use the website and register to the portal, the more people learn to
do it, acquire the skills and teach other potential users.
Following in the analysis of the loop, the higher is PEOU, the
higher is PU. It is worth reminding again Davis’ definition of PU: “the
degree to which a person believes that using a particular system would
enhance his or her job performance” (Davis, 1989). This belief is built on

69
PEOU (in order to enhance performance the system must also be easy to
use) and on the relative advantage.
Relative advantage is a measure of the perception of the
convenience of using the digital in place of the traditional channels. It is
an index calculated as complementary of the need to complete the
procedure at the office.
Relative advantage= 1 – Need to complete the procedure at the office
The index need to complete the procedure at the office expresses
the percentage of procedures started online that must be completed at the
front- office nullifying the convenience of the digital interaction.
Finally PU influences the attitude toward use, which influence the
adoption rate and, intuitively, the users. The users, as already mentioned,
will influence PEOU back.
R3 goes through the same path of R2 but it also includes the
boosting effect of users’ satisfaction on the attitude toward use. The
magnitude of this expansive effect is calibrated consistently with the
results of TAM analysis-
Last but not least, R4 is the loop of Trust in Government. On the
basis of the findings of TAM it is possible to write:
+TIG => +Attitude toward Use => +Adoption Rate => +Users =>
+TIG.

70
Now that the feedback of the system are clear, it is possible to
proceed with the construction of the stock and flow diagram. The starting
point is again the Bass Model.
The number of the registered users was known: about 10.000
people (end of August). The number of the potential users have been
estimated with the help of the webmaster and the reports from Audiweb
(www.audiweb.it). It has been set at 340.000 people. The total population
(potential users + users) has been assumed to be constant.
Fig. 14 SFD of e-Gov adoption in Palermo (explanatory model)

71
The Adoption Rate is determined by the WOM (Word of Mouth)
effect. WOM is calculated as:
WOM= contacts*attitude toward use* potential users*users/ total population
where contacts are the number of people directly inducted to the
registration by other people. The number of contacts has been set to 2
according to the average number of components of italian families
(www.anci.it).
Attitude toward use is a combination of PU, users’ satisfaction and
TIG. All of these components are structured as information delays. All
the variables have been weighted 1 while waiting for further analysis on
their individual effect on the attitude toward use.
The adjustment times have been set equal to 2 years.
Running the simulation, the projection of the current condition
shows a scenario where the goal of the adoption process is achieved in
2024, in ten years. Of course, System Dynamics is not magic and does
not predict the future. Moreover, many radical innovations or other
events could occur in the meanwhile so this graph has just the claim to
suggest an indication of a possible scenario.

72
Fig. 15 Simulation of the explanatory model
After a careful analysis and with the help of the comments of the
respondents to the survey, the weakness of the system has been
recognized in three critical points.
The first one lies behind the relative advantage, which is low
because of the high rate of procedures that need to be completed going to
the office personally.
Fig. 16 A critical feedback of the model

73
A high need to complete the procedure at the office gives life to an
erosive phenomenon, a reinforcing loop acting in the opposite way and
quickly draining the resources dedicated to the innovation. As described
in the CLD in fig. 16, the higher the need to complete the procedure at
the office, the more front- office duties in terms of human resources and
administrative costs. The amount of front- office duties is indirectly
linked to the available budget, budget that would be dedicated to
investments for digital innovation. The lack of a constant investment may
stop the process of content development increasing the need to complete
the procedure at the office.
But the solution does not lay in a simple cut of the services at the
front desk. This is because also the service at front desk has an impact on
trust and on satisfaction. The decision makers should be aware of this
important trade-off.
The magnitude of these effects has not been measured because of
their complexity so the analysis was stopped at the qualitative step.
The simulation in fig. 19 has been run considering an achieved
decrease of the rate of the need to complete the procedure at the office.
The second point of weakness was envisaged in the lack of an
appropriate communication campaign. “Bass solved the startup problem
by assuming that potential adopters become aware of the innovation

74
through external information sources whose magnitude and
persuasiveness are roughly constant over time” (Sterman, 2000, p.332).
Fig. 17 Implementation of a communication policy (SFD)
The impact of a communication campaign (fig.17) is the result of
the communication effectiveness of the campaign multiplied by the
number of the potential users. Communication effectiveness is the
fractional adoption rate from the activity of communication. It has been
estimated that the achievement of a communication effectiveness of 0.10
(combined to the relative advantage policy seen above) would be enough
to reduce the adoption process of 5 years (see fig. 20). This impact is
then added to the Word of Mouth (WOM) effect to obtain the final
adoption rate.
The third point of weakness has been introduced in paragraph 3.2
and lies on the implementation side. It is the cultural resistance of the

75
employees who perceived the digital channels as an increase of their
workload in the short term.
Fig. 18 Perceived Workload (CLD)
This phenomenon is represented in fig.18. The completeness of e-
services increases the effectiveness of the administration in the long term
reducing the effective workload. But, in the short term, the employees
perceive an increase in workload due to the duplication of channels. In
fact, the traditional channel cannot be canceled because many people are
not ready to use digital instruments. So the traditional and the digital
channels will be coexisting as long as the digital divide will not be
bridged.
Fig. 19 represents the SD model that includes both policies while
fig. 20 shows the big improvements the policies would lead to. The
results will be discussed in the next paragraph.

76
Fig. 19 SFD of e-Gov adoption in Palermo with policies
Fig. 20 Potential effect of policies implementation

77
3.5. Results and Discussion
The analysis of the case- study shed light on the state-of-the-art of
the process of e-Government adoption in the municipality of Palermo.
The evidence showed that the implementation of the e-services has been
fragmented and the focus was on the availability of the services more
than on the real capacity of the citizens to use them.
The survey confirmed that most of the determinants of the adoption
are consistent with what the literature suggests. The adoption is fostered
by high degrees of perceived usefulness, perceived ease of use,
satisfaction and security.
These perceptions can be deteriorated from the occurrence of
barriers that hinder the adoption of e-services.
The first barrier is a low relative advantage in the use of the portal
in place of the traditional channels that is usually determined by a high
rate of the need to go back to the offices to complete a procedure started
online.
This barrier can be overcome with investments in the quality of the
system in terms of training of human resources and arrangement of
adequate facilities. The model shows that the investments cannot be
performed cutting the traditional service on which the population still
relies because the disappointment can influence the very same variables.

78
The SD model stresses the importance of the continuity of any
deliberate policy. A quick action would not lead to the desired goal. The
system takes a long time to register the improvements. Moreover, the
ICT is constantly evolving and the administration must be able to follow
in order to sustain the economic system.
Another barrier is the lack of awareness of the digital opportunities
offered to the population. Promoting the portal can boost the system.
The issue of trust (both in government and in technology) will be
discussed in paragraph 3.6.
3.6. Trust and the Effect of the Latest Financial Crisis
Trust in government has an impact on the adoption as well but its
magnitude is less intense. It would be interesting to investigate this
variable more in depth. The deviation of this value from the other
variables combined with the analysis of the free comments of the
respondents suggests that the recent financial crisis had a strong impact
on the territory and on people trust.
The latest financial crisis hit Sicily later but harder than the rest of
Italy in spite of the fact that the economic system was less financial.
According to “38th Report Sicilia” edited by Di.Ste Consulting for
Fondazione Curella, during the past year, Sicily lost 3% of its GDP (Italy
about 1,7%). The cumulative rate (2008-2012) reports a loss of 10% of

79
GDP against an Italian average of 6,5%. Significant decreases were
recorded also by the employment rate (-2,2%), consumption (-4,1%) and
investments in industrial equipments (-12,8%).
The data about the shortfalls of consumption and investments are
probably the most alarming. Household and businesses cut their expenses
under the effective decline of their purchasing power. Moreover, the
adoption of a strong contractionary fiscal policy worsened their
perception of the reality, and their expectation for the future is still
pessimistic.
The Municipality of Palermo, as most areas of southern Italy, was
hardly hit by the financial crisis though its economy is not based on the
financial sector but real. The crisis was indeed mainly driven by fear and
loss of trust in government with consequent aversion of citizen and
businesses towards consumption and investment. This approach
generated a feedback that made harder and harder for the government to
gain trust again.
Tab. 7 shows average TIT and TIG how they were perceived in the
past (old) and how they are perceived now (new). As it possible to
observe TIT increased over the last few years after the crisis, TIG
increased as well, but it is still low. The lower values are registered for
the categories 24-35 and 35-60 those that are active in the job market. In

80
particular, the category 24-35 seems to be discouraged for its difficulties
in entering the job market.
AGE TIT (OLD) TIT (NEW) TIG (OLD) TIG (NEW)
18-24 1.51613 7.87097 2.00000 3.80645
24-35 1.52147 7.87730 2.18405 3.34356
35-60 1.63030 7.18788 2.09697 3.51515
>60 1.60000 6.83333 2.10000 4.10000
Tab. 7 TIT & TIG per age categories
On the other hand, trust in technology does not have an influence
on the adoption, most likely because technology has been integrated in
everyone every-day life independently from the will to interact with the
administration.
3.7. Limitations
Most of the limitations of the study concern the selection of the
respondents to the online survey.
On the one hand, an online survey allows the participation of users
with several kinds of backgrounds, the number of online respondents can
be larger and the selection cheaper. The respondents work in a totally
natural environment. Moreover, their attention is dedicated to what they
actually consider relevant (Elling et al., 2012).

81
On the other hand, though, online respondents base their judgment
on different experience of the website (looking for information such as
transportation time tables, obtaining a birth certificate or paying a fine).
There is an high risk of sampling error (not all users have the same
chance of participating in the survey) and non response error (not every
user wants to participate in the survey (Elling et al., 2012). Answers may
be of lower quality if respondents interpret the items in the survey in a
wrong way since there is not a facilitator assisting them. There is actually
a discrepancy between the survey percentage and the Audiweb data for
southern Italy (see tab.2, p.32).
Despite these risks and discrepancies, an online survey appeared to
be the more effective for the purpose of this study and it helped to collect
several comments that would not have be raised in a laboratory setting.
Other limitations are related to the System Dynamics model. The
studies of e-Government by their very nature include a lot of immaterial
elements. The effects of all the citizens’ perceptions included in the
survey are represented with graph functions. Those functions were built
on the basis of the experience of the experts interviewed during the
project but of course maintain a subjective profile.

82
Conclusion
This dissertation has aimed to provide a contribution to the field of
e-Government adoption in a local government. The interest in the local
level is due to the evidence that a local government, in this case a
municipality, is the first reference point for the citizen and, for this
reason, more sensitive to the dynamics of adoption.
The case- study has examined the municipality of Palermo with its
cultural and socio-economic peculiarities. Palermo is experiencing the
implementation of a second- generation e-Government project started in
January 2013. Therefore it is a crucial moment to investigate the
potential problems that could hinder the success of the project.
The survey administered to the citizens through the official website
of the municipality provided important insights that were afterwards
tested with the help of a TAM analysis.
There is a strong connection between those that are the
determinants favorable to the adoption and the barriers that hinder the
adoption. Since perceive usefulness and perceived ease of use have been
confirmed to be the most significant determinants of adoption also in
Palermo’s context (in line with the previous reviewed literature), the
municipal government should continue developing the website and
portal’s contents to provide the citizens with a user-friendly navigation

83
and to assure them the benefit of a concrete relative advantage in terms
of time saving and transparency.
As seen in par. 3.6, the results of this study differ from the
reference literature for the impact of trust on adoption. Trust in
government is really low and does not seem to be strongly correlated to
the adoption. This should not be ascribed to the methodology but to the
social and economic context.
It is worth remarking that e-Government requires efforts in terms
of money and human skills. It can help in saving time and money in the
long term but it will not unless the necessary investments are constantly
assured to the departments in charge of the implementation.
The System Dynamics model helped in simulating the possible
evolution of the current situation and in proposing the implementation of
policies that, acting on the feedback structure of the system, could
improve the process of e-Government adoption.
One of the strength of this methodology, that is possible to
appreciate in this work, consists in providing a systemic view including
all of the determinants of adoption in the same analysis, allowing the
reader to perceive the combined effect of all the determinants and
barriers.
System Dynamics highlights the existing trade-off between
traditional and digital service since they intervene on common variable.

84
The development of digital services cannot disregard the maintenance of
traditional service wherever they are needed. In fact, a decrease of the
quality of digital services influences citizen satisfaction, variable that
influences also digital services generating a prejudice in the citizens.
It is important to underline that System Dynamics has not a
predictive power. Its most valuable contribution consists in the extension
of the mental model of managers so to include counterintuitive feedbacks
that were hidden and not considered during the policy design process.
Recommendations for Research
Further research should investigate in depth the reasons of the lack
of interest in interacting with the government online of a relevant
percentage of the population to find out if those people simply do not
need to interact or have been discouraged by prior bad experiences.
The research should also be extended in order to integrate
implementation and adoption issues in the very same model for a
complete view of the system and the opportunity to verify the
externalities arising from a targeted action.

85
References
Ajzen, I. (1991) “The theory of planned behavior” Organizational Behavior and
Human Decision Processes (50:2), pp.179-211.
AlAwadhi, S. & Morris, A. (2009) “Factors Influencing the Adoption of E-
government Services”. Journal of Software, Vol. 4 (6), pp.584–590.
Alroaia, Y.V., Hemati, M. & Shahabi, A. (2011) “Modeling of technology
acceptance model based on system dynamics approach” JM International
Journal of IT, Vol.1(1).
Andersen, K.N. et al. (2011) “The forgotten promise of e-government maturity:
Assessing responsiveness in the digital public sector” Government
Information Quarterly, 28(4), pp.439–445.
Axelsson, K., Melin, U., & Lindgren, I. (2010) “Developing public e-services
for several stakeholders. A multifaceted view of the needs for an e-
service” in S. Newell, E. Whitley, N. Pouloudi, J.Wareham, &
L.Mathiassen (Eds.), Proceeding of the 17th European Conference on
Information Systems, Verona, Italy (pp. 2804–2815).
Bannister, F. (2007) The curse of the benchmark: An assessment of the validity
and value of e-government comparison, International Review of
Administrative Sciences, Vol.73 Issue 2, pp.171- 188.
Bannister, F. & Connolly, R. (2011) “Trust and transformational government: a
proposed framework for research” Government Information Quarterly,
Vol. 28, pp.137-147
Bélanger, F. & Carter, L. (2008) “Trust and risk in e-government adoption” The
Journal of Strategic Information Systems, 17(2), pp.165–176.

86
Bianchi, C. (2009) Modelli di system dynamics per il miglioramento della
performance aziendale. Verso un sistema di programmazione e controllo
per lo sviluppo sostenibile, Management, IPSOA.
Carter, L., & Bélanger, F. (2005) “The utilization of e-government services:
Citizen trust, innovation and acceptance factors” Information Systems
Journal, Vol. 15(1), pp. 5–25.
Carter L., Weerakkody V. (2008) “E-government adoption: a cultural
comparison” Inf Syst Front, n.10, pp.473-482.
Codagnone, C. and Wimmer, M. (eds., 2007) Roadmapping eGovernment:
Research Visions and Measures towards Innovative Governments in 2020,
www.egovrtd2020.org.
Cordella, A. & Bonina, C.M. (2012) “A public value perspective for ICT
enabled public sector reforms: A theoretical reflection” Government
Information Quarterly, 29(4), pp.512–520.
Corradini, F., Falcioni, D., Polini, A., Polzonetti, A., & Re, B. (2010)
“Designing Quality Business Processes for e-Government Digital
Services” IFIP EGOV 2010 conference, Lausanne (Switzerland), LNCS of
Springer, pp 424 -435, September 2010.
D’Agostino, M.J. et al. (2011) “A Study of E-Government and E-Governance:
An Empirical Examination of Municipal Websites” Public Administration
Quarterly, Vol.35 (1), Spring.
Davis, F. (1989) “Perceived usefulness, perceived ease of use, and user
acceptance of information technology” MIS Quarterly, (13:3), pp.319-339.

87
Detlor, B. et al. (2012) “Information quality and community municipal portal
use” Government Information Quarterly, 30(1), pp.23–32.
Elling, S. et al. (2012). Measuring the quality of governmental websites in a
controlled versus an online setting with the “Website Evaluation
Questionnaire”. Government Information Quarterly, Vol. 29(3), pp.383–
393.
European Commission (2003) The role of E-Government for Europe's future.
http://eurlex.europa.eu/LexUriServ/LexUriServ.do?uri=COM:2003:0567:F
IN:EN:PDF.
European Commission (2012) “Digital Competence in the Digital Agenda”
Document of the Digital Agenda Available at: https://ec.europa.eu/digital-
agenda/sites/digital-agenda/files/scoreboard_digital_skills.pdf
Fishbein, M., & Ajzen, I. (1975). Belief, Attitude, Intention, and Behavior: An
Introduction to Theory and Research. Reading, MA: Addison-Wesley.
García-Sánchez, I.-M., Cuadrado-Ballesteros, B. & Frías-Aceituno, J.-V. (2012)
“Determinants of E-Government Development: Some Methodological
Issues” Journal of Management and Strategy, 3(3), pp.11–21.
Gil-Garcia, J.R., & Martinez-Moyano, I. J. (2007) “Understanding the evolution
of e-Government: The influence of systems of rules on public sector
dynamics” Government Information Quarterly, Vol 24, pp.266–290.
Gil-Garcia, J.R. & Pardo, T. (2006) “Multi-Method Approaches to
Understanding the Complexity of e-Government” International Journal of
Computers, Systems and Signals, Vol.7, No.2.

88
Ho, A.T.K. (2002) “Reinventing Local Governments and the E-Government
Initiative” Public Administration Review 62(4) pp.434–44.
Information Systems Department, Municipality of Palermo (2004) “Rapporto
Esecutivo B1” February 2004.
Jayashree, S. & Marthandan, G. (2010) “Government to e-Government to e-
Society” Journal of Applied Sciences, 10(19), pp.2205–2210.
Kamal, M., Weerakkody, V., & Irani, Z. (2011). “Analyzing the role of
stakeholders in the adoption of technology integration solutions in UK
local government: An exploratory study” Government Information
Quarterly, 28(2), pp. 200–210.
Kemp, R. and R.Weehuizen (2003) “Policy learning, what does it mean and
how can we study it?” Publin Report No. D15 Prepared as part of
PUBLIN, project under the 5th EU Framework Programme,
http://survey.nifu.no/step/publin/reports/d15policylearning.pdf.
Lenk, K., Traunmu ̈ller, R. and Wimmer, M. (2002) ‘The Significance of Law
and Knowledge for Electronic Government’, in A. Gronlund (ed.),
Electronic Government– Design, Applications and Management, New
York: Idea Group Publishing, pp. 61–77.
Lin, H.F & Lee, G.G. (2006) “Determinants of success for online communities:
an empirical study” Behaviour & IT,Vol. 25(6), pp. 479-488.

89
Luna-Reyes L. F., Gil-Garcia J.R. (2011) “Using Institutional Theory and
Dynamic Simulation to Understand Complex E-Government Phenomena”
Government Information Quarterly, Vol. 28 (3) pp.329-345.
Luna-Reyes, L.F., Gil-Garcia, J.R. & Romero, G., (2012) “Towards a
multidimensional model for evaluating electronic government: Proposing a
more comprehensive and integrative perspective” Government Information
Quarterly, 29(3), pp.324–334.
Mignerat, M. & Rivard S. (2005) “Positioning the Institutional Perspective in
Information Technology Research” HEC Montreal. Available at:
http://neumann.hec.ca/chairegestionti/cahiers/cahier0501.pdf
Moon, M.J. & Norris, D.F. (2005) “Does managerial orientation matter? The
adoption of reinventing government and e-government at the municipal
level” Information System Journal , 15, pp.43-60.
Morgeson, F.V., Van Amburg, D. & Mithas, S. (2010) “Misplaced Trust?
Exploring the Structure of the E-Government-Citizen Trust Relationship”
Journal of Public Administration Research and Theory Vol.21 pp. 257-
283.
Orlikowski, W.J., and Barley, S.R. (2001) “Technology and Institutions: What
can Research on Information Technology and Research on Organizations
Learn from Each Other?” MIS Quarterly, Vol. 25(2), 145-165.
Ormerod, P. (2012) Positive Linking: How Networks Can Revolutionise the
World Faber & Faber, London, UK.

90
Petter, S., DeLone, W., & McLean, E. (2008) “Measuring information systems
success: Models, dimensions, measures, and interrelationships” European
Journal of Information Systems, Vol. 17(3), pp. 236–263.
Rabaiah, A. & Vandijck, E. (2009) “A Strategic Framework of e-Government :
Generic and Best Practice” Electronic Journal of e-Government (EJEG),
7(3), pp.241–258.
Reddick, C.G., (2005) “Citizen interaction with e-government : From the streets
to servers?” Government Information Quarterly, 22, pp.38–57.
Rogers, E. M. (1995) Diffusion of innovations (4th ed.), New York: Free Press.
Rorissa, A., Demissie, D. & Pardo, T. (2011) “Benchmarking e-Government: A
comparison of frameworks for computing e-Government index and
ranking” Government Information Quarterly, 28(3), pp.354–362.
Sabatier, Paul. A. (1993) “Policy Change over a Decade or More” in Paul A.
Sabatier and Hank Jenkins-Smith (eds.) Policy Change and Learning. An
Advocacy Coalition Approach, Boulder: Westview Press, 13-39.
Scott, W.R. (2004) “Institutional Theory: Contributing to a Theoretical
Research Program” Chapter prepared for Great Minds in Management:
The Process of Theory Development, Ken G. Smith and Michael A. Hitt,
eds. Oxford UK: Oxford University Press.
Sitkin, S.B., and Roth, N.L. “Exploring the limited effectiveness of legalistic
remedies for trust/distrust.” Organization Science, 4, 3 (1993), pp.367–
392.
Srivastava, Shirish C. & Teo, Thompson S.H. (2008) "The Relationship
between E-Government and National Competitiveness: The Moderating

91
Influence of Environmental Factors" Communications of the Association
for Information Systems Vol. 23, Article 5.
Srivastava, S. C., Teo, T. S. H. & Jiang, L. (2008–9) “Trust and electronic
government success: An empirical study” Journal of Management
Information Systems, 25(3), pp.99–131.
Sterman, J. D. (2000) Business Dynamics: Systems Thinking and Modeling for a
Complex World, Irwin/McGraw-Hill, Boston (USA), p. 982.
Tolbert, C. J. & Mossberger, K. (2006) “The Effects of E -Government on Trust
and Confidence in Government” Public Administration Review Vol. 66(3),
pp. 354-369.
United Nations and American Society for Public Administration (UNASPA,
2001) Global survey of e-government, Asia Oceania E-business
Marketplace Alliance.
Venkatesh, V. (2000) “Determinants of perceived ease of use: Integrating
control, intrinsic motivation, and emotion into the technology acceptance
model” Information systems research, pp.342–365.
Venkatesh, V. et al. (2003) “User acceptance of information technology:
Toward a unified view” MIS Quarterly, 27, pp.425–478.
Veenstra, A.F. van & Janssen, M. (2010) “Migration Strategies for Multi-
Channel Service Provisioning in Public Agencies” in Worrall (ed.)
Leading Issues in e-Government Research (2011) Academic Publishing
International.

92
Verdegem, P. & Verleye, G. (2009) “User-centered E-Government in practice:
A comprehensive model for measuring user satisfaction” Government
Information Quarterly, 26(3), pp.487–497.
Wangpipatwong, S. Chutimaskul, W. and Papasratorn, B (2008)
“Understanding Citizen’s Continuance Intention to Use e-Government
Website: a Composite View of Technology Acceptance Model and
Computer Self-Efficacy” The Electronic Journal of e-Government Vol. 6
(1), pp. 55 – 64.
West, D. M. (2004) “E -Government and the Transformation of Service
Delivery and Citizen Attitudes” PublicAdministration Review 64(1), pp.
15-27
Wheat, D. (2010) “What Can System Dynamics Learn from the Public Policy
Implementation Literature? ” Systems Research and Behavioral Science,
Vol. 27(4)s.
Wimmer, M.A. (2002) “Integrated Service Modelling for Online One-stop
Government”, Electronic Markets Volume 12 Issue 3 pp.149-156,
www.electronicmarkets.org.
Worrall, L. (2011) “Introduction to Leading Issues in e-Government Research”,
in Worrall (ed.) Leading Issues in e-Government Research, Volume One,
Academic Publishing International Ltd, Reading, UK.
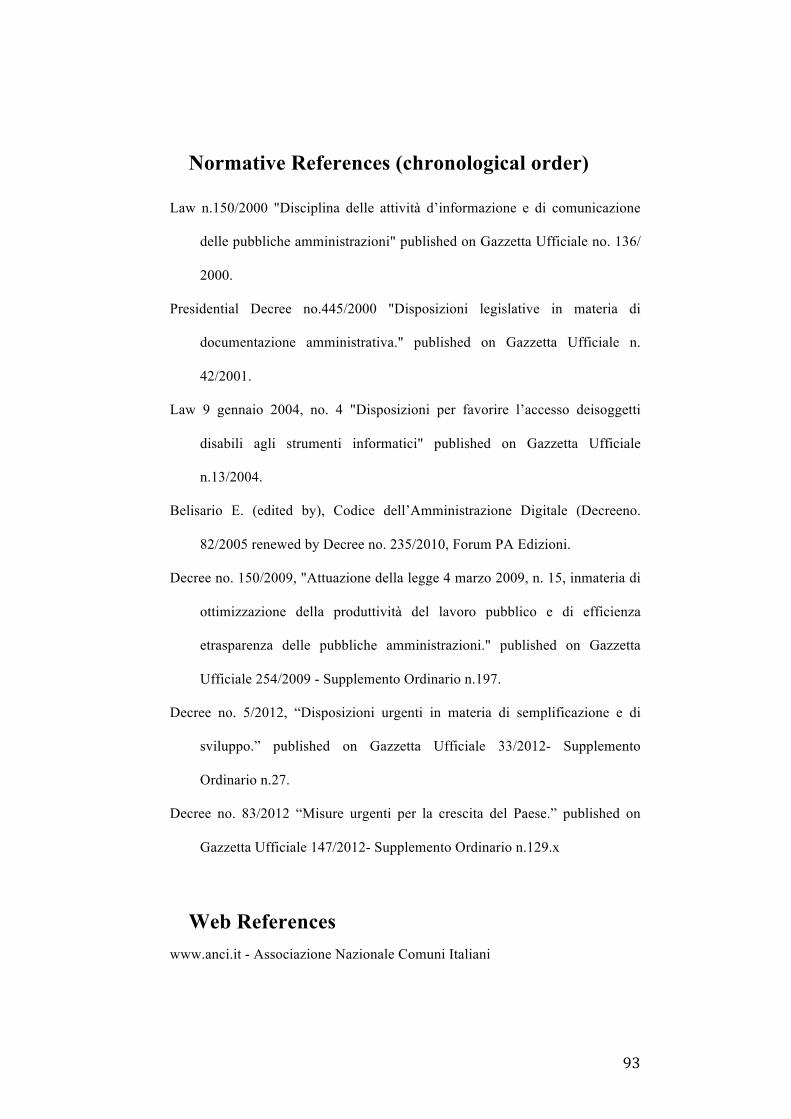
93
Normative References (chronological order)
Law n.150/2000 "Disciplina delle attività d’informazione e di comunicazione
delle pubbliche amministrazioni" published on Gazzetta Ufficiale no. 136/
2000.
Presidential Decree no.445/2000 "Disposizioni legislative in materia di
documentazione amministrativa." published on Gazzetta Ufficiale n.
42/2001.
Law 9 gennaio 2004, no. 4 "Disposizioni per favorire l’accesso deisoggetti
disabili agli strumenti informatici" published on Gazzetta Ufficiale
n.13/2004.
Belisario E. (edited by), Codice dell’Amministrazione Digitale (Decreeno.
82/2005 renewed by Decree no. 235/2010, Forum PA Edizioni.
Decree no. 150/2009, "Attuazione della legge 4 marzo 2009, n. 15, inmateria di
ottimizzazione della produttività del lavoro pubblico e di efficienza
etrasparenza delle pubbliche amministrazioni." published on Gazzetta
Ufficiale 254/2009 - Supplemento Ordinario n.197.
Decree no. 5/2012, “Disposizioni urgenti in materia di semplificazione e di
sviluppo.” published on Gazzetta Ufficiale 33/2012- Supplemento
Ordinario n.27.
Decree no. 83/2012 “Misure urgenti per la crescita del Paese.” published on
Gazzetta Ufficiale 147/2012- Supplemento Ordinario n.129.x
Web References www.anci.it - Associazione Nazionale Comuni Italiani

94
www.audiweb.it - Institution “super partes” monitoring the Italian websites.
Milano.
www.comune.palermo.it - Official Municipal Website.
http://www.comune.palermo.it/questionario_e-gov.php – survey on the Official
Municipal Website.
https://servizionline.comune.palermo.it/portcitt/jsp/home.do?sportello=portcitt
– Official Municipal e-services Portal

95
Appendix A. Survey
Age:
1. 18-24;
2. 24-35;
3. 35-60;
4. >60
Gender:
1. M;
2. F
Education:
1. Middle high school
2. High school
3. Bachelor or higher
Occupation:
1. Student
2. Employee in the private sector
3. Employee in the public sector
4. Entrepreneur
5. Professional
6. Unemployed
7. Others
Are you an Internet user? Y/N

96
What is your current level of trust in using the Internet? (1-10)
What was your level of trust five to three years ago? (1-10)
What is your current level of trust in the government? (1-10)
What was your level of trust in the government five to three years ago? (1-10)
Do you use the Internet to interact with the Public Administration?
If yes, how:
1. To gather information
2. To download forms
3. To complete procedures online
4. Other
If yes, what entities are you interacting with:
1. Central administration
2. Regional administration
3. Municipal administration
4. Others
If no, why:
1. I do not trust the instrument
2. The information I find are wrong/ the websites are not updated
3. I must go personally to the office anyway to complete the procedure
4. I do not feel the need of interacting online with the Public
Administration
5. Other
Do you use the Internet to interact with the municipality trough the website
www.comunedipalermo.it?
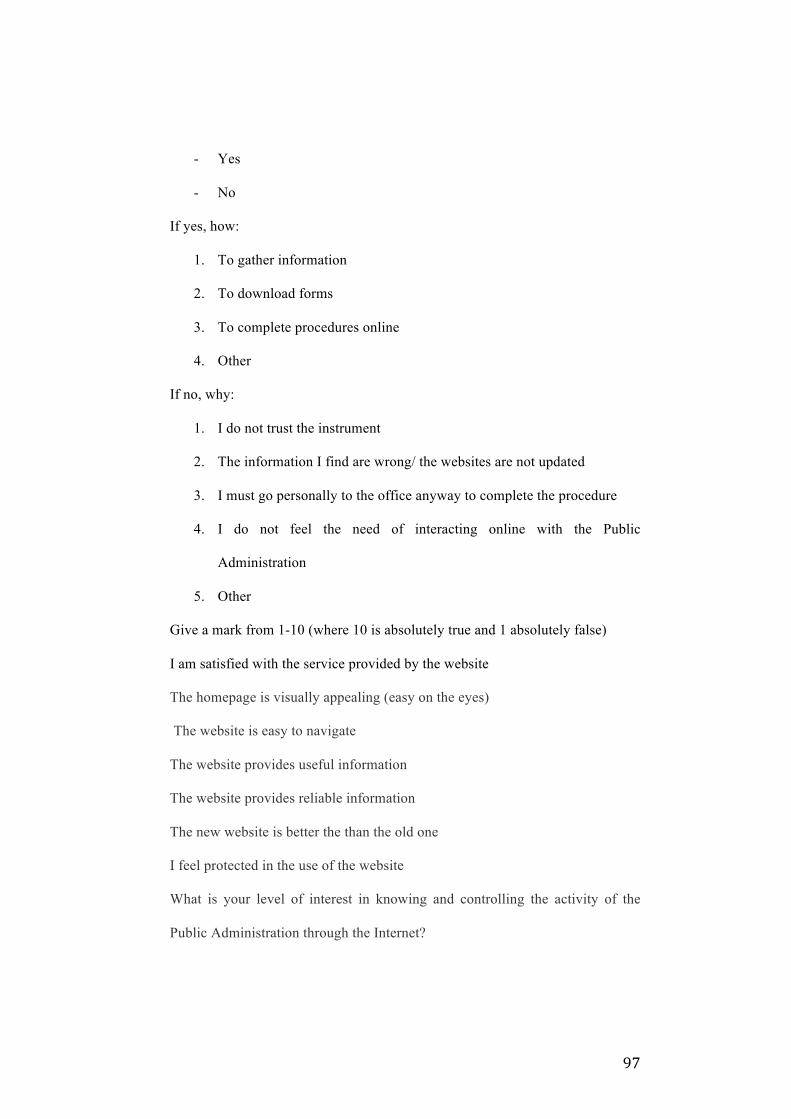
97
- Yes
- No
If yes, how:
1. To gather information
2. To download forms
3. To complete procedures online
4. Other
If no, why:
1. I do not trust the instrument
2. The information I find are wrong/ the websites are not updated
3. I must go personally to the office anyway to complete the procedure
4. I do not feel the need of interacting online with the Public
Administration
5. Other
Give a mark from 1-10 (where 10 is absolutely true and 1 absolutely false)
I am satisfied with the service provided by the website
The homepage is visually appealing (easy on the eyes)
The website is easy to navigate
The website provides useful information
The website provides reliable information
The new website is better the than the old one
I feel protected in the use of the website
What is your level of interest in knowing and controlling the activity of the
Public Administration through the Internet?

98
Have you ever heard about “e-Government”?
- Yes
- No
Have you ever heard about “Portale dei servizi online”?
- Yes
- No
Have you ever heard about “Linea Amica”?
- Yes
- No
Do you use the social network?
- Yes
- No
If yes, which one?
Do you think the public administration should use the social networks as a
communication channel?
- Yes
- No
Have you ever heard about the Digital Agenda?
- Yes
- No
How much 1 being the minimum and 5 the maximum do you think is important
to interact online with the municipality of Palermo?
Comments:

99
Appendix B. Equations of the System Dynamics
model Perceived__TIG(t) = Perceived__TIG(t - dt) + (Change__in_TIG) * dt
INIT Perceived__TIG = 0
INFLOWS:
Change__in_TIG = TIG_Gap/AT3
Perceived__Usefulness_PU(t) = Perceived__Usefulness_PU(t - dt) +
(Change__in_PU) * dt
INIT Perceived__Usefulness_PU = 0
INFLOWS:
Change__in_PU = Gap__PU/AT1
Potential__Users(t) = Potential__Users(t - dt) + (- Adoption__Rate) * dt
INIT Potential__Users = 340000
OUTFLOWS:
Adoption__Rate = WOM
Users(t) = Users(t - dt) + (Adoption__Rate) * dt
INIT Users = 10000
INFLOWS:
Adoption__Rate = WOM
Users__Satisfaction(t) = Users__Satisfaction(t - dt) +
(Change_in___Users__Satisfaction) * dt
INIT Users__Satisfaction = 0
INFLOWS:
Change_in___Users__Satisfaction = (Effect_of_PU_on__Satisfaction-
Users__Satisfaction)/AT2
AT1 = 2
AT2 = 2
AT3 = 2
Attitude__toward_Using_eServices =
(Users__Satisfaction+Perceived__Usefulness_PU+Perceived__TIG)/3
Contacts = 2

100
Gap__PU = (Relative__Advantage)-Perceived__Usefulness_PU
Need_to_complete_the__procedure_at_the_office = 0.8
Perceived__Ease_of_Use_PEOU =
Reported__Value_PEOU*Effect_of_no__of_Users__on_PEOU
Relative__Advantage = 1-
Need_to_complete_the__procedure_at_the_office+Effect_of_PEOU__on_PU
Reported_Value__TIG = 0.2
Reported__Value_PEOU = 0.6
TIG_Gap = Trust_in__Government_TIG-Perceived__TIG
Trust_in__Government_TIG =
Reported_Value__TIG*Effect_of_no__of_Users__on_TIG
WOM =
Contacts*Attitude__toward_Using_eServices*Potential__Users*Users/(Potenti
al__Users+Users)
Effect_of_no__of_Users__on_PEOU = GRAPH(Users)
(0.00, 0.03), (35000, 0.172), (70000, 0.315), (105000, 0.457), (140000, 0.57),
(175000, 0.66), (210000, 0.757), (245000, 0.877), (280000, 0.975), (315000,
1.09), (350000, 1.27)
Effect_of_no__of_Users__on_TIG = GRAPH(Users)
(0.00, 0.08), (35000, 0.11), (70000, 0.145), (105000, 0.185), (140000, 0.225),
(175000, 0.29), (210000, 0.375), (245000, 0.445), (280000, 0.58), (315000,
0.665), (350000, 0.89)
Effect_of_PEOU__on_PU = GRAPH(Perceived__Ease_of_Use_PEOU)
(0.00, 0.015), (0.1, 0.21), (0.2, 0.337), (0.3, 0.48), (0.4, 0.6), (0.5, 0.698), (0.6,
0.772), (0.7, 0.847), (0.8, 0.892), (0.9, 0.938), (1, 0.982)
Effect_of_PU_on__Satisfaction = GRAPH(Perceived__Usefulness_PU)
(0.00, 0.00), (0.1, 0.26), (0.2, 0.45), (0.3, 0.61), (0.4, 0.74), (0.5, 0.85), (0.6,
0.95), (0.7, 1.04), (0.8, 1.12), (0.9, 1.18), (1, 1.26)

101
Appendix C. Equations of the System Dynamics
model with policies Perceived__TIG(t) = Perceived__TIG(t - dt) + (Change__in_TIG) * dt
INIT Perceived__TIG = 0
INFLOWS:
Change__in_TIG = TIG_Gap/AT3
Perceived__Usefulness_PU(t) = Perceived__Usefulness_PU(t - dt) +
(Change__in_PU) * dt
INIT Perceived__Usefulness_PU = 0
INFLOWS:
Change__in_PU = Gap__PU/AT1
Potential__Users(t) = Potential__Users(t - dt) + (- Adoption__Rate) * dt
INIT Potential__Users = 340000
OUTFLOWS:
Adoption__Rate = WOM+Communication
Users(t) = Users(t - dt) + (Adoption__Rate) * dt
INIT Users = 10000
INFLOWS:
Adoption__Rate = WOM+Communication
Users__Satisfaction(t) = Users__Satisfaction(t - dt) +
(Change_in___Users__Satisfaction) * dt
INIT Users__Satisfaction = 0
INFLOWS:
Change_in___Users__Satisfaction = (Effect_of_PU_on__Satisfaction-
Users__Satisfaction)/AT2
AT1 = 2
AT2 = 2
AT3 = 2
Attitude__toward_Using_eServices =
(Users__Satisfaction+Perceived__Usefulness_PU+Perceived__TIG)/3
Communication = Potential__Users*Communication__Effectiveness

102
Communication__Effectiveness = 0.1
Contacts = 2
Gap__PU = (Relative__Advantage)-Perceived__Usefulness_PU
Need_to_complete_the__procedure_at_the_office = 0.3
Perceived_Ease__of_UsePEOU =
Reported__Value_PEOU*Effect_of_no__of_Users__on_PEOU
Relative__Advantage = 1-
Need_to_complete_the__procedure_at_the_office+Effect_of_PEOU__on_PU
Reported_Value__TIG = 0.2
Reported__Value_PEOU = 0.6
TIG_Gap = Trust_in__Government_TIG-Perceived__TIG
Trust_in__Government_TIG =
Reported_Value__TIG*Effect_of_no__of_Users__on_TIG
WOM =
Contacts*Attitude__toward_Using_eServices*Potential__Users*Users/(Potenti
al__Users+Users)
Effect_of_no__of_Users__on_PEOU = GRAPH(Users)
(0.00, 0.03), (35000, 0.172), (70000, 0.315), (105000, 0.457), (140000, 0.57),
(175000, 0.66), (210000, 0.757), (245000, 0.877), (280000, 0.975), (315000,
1.09), (350000, 1.27)
Effect_of_no__of_Users__on_TIG = GRAPH(Users)
(0.00, 0.08), (35000, 0.11), (70000, 0.145), (105000, 0.185), (140000, 0.225),
(175000, 0.29), (210000, 0.375), (245000, 0.445), (280000, 0.58), (315000,
0.665), (350000, 0.89)
Effect_of_PEOU__on_PU = GRAPH(Perceived_Ease__of_UsePEOU)
(0.00, 0.015), (0.1, 0.21), (0.2, 0.337), (0.3, 0.48), (0.4, 0.6), (0.5, 0.698), (0.6,
0.772), (0.7, 0.847), (0.8, 0.892), (0.9, 0.938), (1, 0.982)
Effect_of_PU_on__Satisfaction = GRAPH(Perceived__Usefulness_PU)
(0.00, 0.00), (0.1, 0.26), (0.2, 0.45), (0.3, 0.61), (0.4, 0.74), (0.5, 0.85), (0.6,
0.95), (0.7, 1.04), (0.8, 1.12), (0.9, 1.18), (1, 1.26)