customers adoption of e-government services
TRANSCRIPT

CUSTOMERS ADOPTION OF E-GOVERNMENT
SERVICES
BETHLEHEM FEYISA HAILU

CUSTOMERS ADOPTION OF E-GOVERNMENT
SERVICES
Bethlehem Feyisa

ADDIS ABABA UNIVERSITY
COLLGE OF NATURAL SCIENCE
SCHOOL OF INFORMATION SCIENCE
CUSTOMERS ADOPTION OF E-GOVERNMENT
SERVICES
A Thesis
Submitted to School of Graduates at Addis Ababa University in Partial
Fulfillment of the Requirements for the Degree of Master of Science in
Information Science
By
Bethlehem Feyisa
Supervisor
Dereje Teferi (Ph.D.)
January 2020

Declaration
I, Bethlehem Feyisa Hailu, declare that this thesis, entitled: “Customers Adoption of E-
Government Services”, submitted in partial fulfillment of the degree of Master of Science in
Information Science, from School of Information Science of Addis Ababa University is my
original work and the document hasn’t been submitted for the award of any other qualifications of
any other university or academic institution.
Name: Bethlehem Feyisa
Signature: _______________.
This thesis has been presented for examination with my approval,as an advisor, of its originality
with the required level of an accepted standard.
Name: Dereje Teferi (PhD)
Signature: _______________.

Approval of Examination
This thesis work entitled “Customers’ Adoption of E-Government Services” has been
examined and approved for the award of the degree of Master of Science in Information Science
from Addis Ababa University, College of Natural and Computational Sciences, School of
Information Science.
Name and Signature of Members of the Examining Board
Name Title Signature Date
Dereje Teferi (PhD) Advisor ________________ _________________
______________ Examiner ________________ _________________
______________ Examiner ________________ _________________

Acknowledgment
I thank Holy Trinity who gave me life, opportunity, ability, and patience to complete this thesis
work. Then, I would like to thank to my thesis advisor, Dr. Dereje Teferi, for his constructive
comments and feedback during this thesis work. You were always available to reply to my emails
and my phone calls to provide feedback and advice throughout the journey of this thesis work.
I want to express gratitude to a woman who was my first teacher at home and continues to inspire
me in so many ways my mom Workitu Bedhaso: thank you for giving me life, for the sacrifice
you made to make me where I am today and for believing in me. My Dad Feyisa Hailu: you mean
so much to me. You give me advice and comfort whenever I needed, and thank you so much for
the emotional and financial support. Siblings: Lily, Temu, and Dave thank you for staying some
night with me during this thesis work.
Then, I take this opportunity to acknowledge Ato. Balcha Reba, General Director of the Ethiopian
Communication Authority (ECA) who supported my study and allowed me to take days off work
whenever I needed time for study, assignment, and presentation purposes.
Colleagues: Helina, Eyerusalem, Selam, and Meski, E-Services case team in the Ethiopian
Communication Authority (ECA), thank you for covering my role during my absence from work.
Aseged, Yehualashet, and Solomon thank you for your moral support.
Classmates: Neba you are the funniest person I know, Axum, Mekdi, kiyu, Bad, Meazi, Lamia,
and Amex we have wonderful memories together.
Bethlehem Feyisa Hailu

Dedication
“I can do all things through Christ who strengthens me”. Philippians 4:13. I dedicated this thesis
work to the Almighty God! And my Parents.

Abstract
E-government involves extensive use of ICT to deliver government information and services to
citizens. In Ethiopia, online electronic government services have been launched and implemented
for nearly a decade now. Yet, it has not reached the point where it is fully adopted and utilized by
customers. Therefore, it is important to identify significant factors that could encourage customers
to adopt e-government and its services. This research is the first of its kind to widely study the
factors influencing the adoption of e-government services on the customers of three different
Ethiopian government offices. The study employed a quantitative, cross-sectional survey and used
printed questionnaire to collect data from study participants and total of 294 usable responses
were returned. The proposed model for identifying influential factors on e-government adoption
was tested using the structural equation modeling partial least square technique. The finding
revealed performance expectancy, effort expectancy, awareness, website quality, and trust in the
government are confirmed to influence customers’ behavioral intention to use e-government
services. Whereas, facilitating condition and behavioral intention determines customers’ use
behavior. However, the impact of social influence and trust in the internet constructs were not
found to be significant. Accordingly, the study produced several recommendations the
government of Ethiopian should consider to enhance customers' adoption of e-government
services. The government should focus on improving the functionality of the national e-services
portal into an efficient, easy to use, and available system that needs no personal visit. The
government must make awareness campaign about e-government, its services and benefits
associated with the use of these services. Governemnt employees’ ability to offer quality services
should be improved through offering different workshops, seminars, and other self-development
training programs to get the technical skills necessary to execute and secure e-government
systems. Moreover, the government should work on the formulation of laws, rules,and regulations
that can make customers feel safe and secure to use e-services and support the use of these
services by enabling other technical, infrastructure, and technological support.
Keywords: e-government adoption, PLS-SEM, partial least square, structural equation modeling,
UTAUT, unified theory of acceptance and use of technology

I
Table of Contents
Declaration .................................................................................................................................... III
Approval of Examination .............................................................................................................. IV
Acknowledgment ............................................................................................................................ V
Dedication ..................................................................................................................................... VI
Abstract ....................................................................................................................................... VII
List of Tables ................................................................................................................................. IV
List of Figures ................................................................................................................................ V
List of Abbreviation and Acronyms .............................................................................................. VI
Chapter One ..................................................................................................................................... 1
I. Introduction .............................................................................................................................. 1
1.1 Background of the Study ................................................................................................... 1
1.2 Statement of the Problem ................................................................................................... 2
1.3 Research Questions ............................................................................................................ 4
1.4. Objective of the Study ...................................................................................................... 5
1.5 Significance of the Study ................................................................................................... 5
1.6 Scope of the Study ............................................................................................................. 6
1.7 Organization of the Thesis ................................................................................................. 7
Chapter Two .................................................................................................................................... 8
II. Literature Review and Related Works .................................................................................... 8
2.1 Literature Review .................................................................................................................. 8
2.1.1 Overview of E-Government ............................................................................................ 8
2.1.2 Definitions of E-Government ......................................................................................... 9
2.1.3 Benefits of E-Government .............................................................................................. 9
2.1.4 E-Government Delivery Models ................................................................................... 10
2.1.5 Concept of E-Services ................................................................................................... 11
2.1.6 Challenges in Adoption and Implementation of E-Government .................................. 12
2.2 E-Government in Ethiopia ................................................................................................... 13
2.2.1 Major E-Government Initiatives in Ethiopia ................................................................ 13
2.2.3 Ethiopian E-Government Survey Report ...................................................................... 15

II
2.3 Technology Adoption Models and Theories ....................................................................... 17
2.3.1 Diffusion of Innovation ................................................................................................. 17
2.3.2 The Theory of Planned Behaviour ................................................................................ 19
2.3.3 Technology Acceptance Model .................................................................................... 20
2.3.4 The Unified Theory of Acceptance and Use of Technology ........................................ 21
2.4 Related Works...................................................................................................................... 24
2.5 Justification for Conducting this Study ............................................................................... 27
Chapter Three ................................................................................................................................ 28
III. Research Model and Methodology ...................................................................................... 28
3.1 Research Model ................................................................................................................... 28
3.1.1 Model Construct and Hypothesis Development ........................................................... 28
3.2 Proposed Model for E-Government Services Adoption in Ethiopia ............................... 37
3.3 Research Methodology ........................................................................................................ 38
3.4 Sampling Design and Target population ............................................................................. 39
3.5 Instrument Development...................................................................................................... 41
3.6 Pilot Test .............................................................................................................................. 45
3.7 Data Analysis Tools and Techniques................................................................................... 46
Chapter Four .................................................................................................................................. 47
IV. Data Analysis and Discussion ............................................................................................. 47
4.1 Preparation of Survey Data for Statistical Analysis ........................................................ 47
4.2 Descriptive Statistics............................................................................................................ 48
4.2.1 Response Rate and Respondent’s Profile ..................................................................... 48
4.3 The Concept of Structural Equation Modeling (SEM) ........................................................ 51
4.4 Structural and Measurement Model ..................................................................................... 53
4.4.1 Measurement Model Assessment ................................................................................. 55
4.4.2 Structural Model Assessment ....................................................................................... 66
4.5 Refined Study Model ....................................................................................................... 76
Chapter Five .................................................................................................................................. 78
V. Conclusion and Recommendations ....................................................................................... 78
5.1 Overview of the Study ......................................................................................................... 78
5.2 Discussion and Answering the Research Questions ........................................................ 81

III
5.3 Recommendation for Ethiopian Government ...................................................................... 83
5.4 Research Contributions ........................................................................................................ 85
5.4.1Theoretical Contributions .............................................................................................. 85
5.4.2 Practical Contributions .................................................................................................. 86
5.5 Recommendations for Future Research ............................................................................... 86
References ..................................................................................................................................... 88
Appendices .................................................................................................................................... 97
Appendix i. Letter of Approval from Federal Transport Authority ........................................... 97
Appendix ii. Letter of Approval from the Ministry of Water and Irrigation ............................. 98
Appendix iii. Survey Questionnaire in English ......................................................................... 99
Appendix iv. Survey questionnaire in Amharic....................................................................... 103

IV
List of Tables
Table 1: Ethiopian E-Government Development Status ................................................................ 16
Table 2: Research Construct and their Items ................................................................................. 42
Table 3: Respondents frequency per Gender ................................................................................ 49
Table 4: Respondents frequency per Age ....................................................................................... 49
Table 5: Respondents frequency per Educational Level ................................................................ 50
Table 6: Composite Reliability and Cronbach's α Measures ......................................................... 56
Table 7 : Reliability and Validity measures with Factor loadings for reflective indicators .......... 57
Table 8: AVE, Correlations and Square root of AVE's .................................................................. 60
Table 9: Loadings and Cross-loadings for the reflective model .................................................... 61
Table 10: outer model weights with corresponding T-Values ....................................................... 63
Table 11: Collinearity (VIF/Tolerance) for formative indicators .................................................. 64
Table 12: Collinearity (VIF/Tolerance) for the inner model** ..................................................... 64
Table 13: Collinearity (VIF/Tolerance) for the inner model*** ................................................... 65
Table 14: Path coefficients T-values, and hypothesis testing ........................................................ 68
Table 15: Effect Size for individual exogenous LVs change on endogenous LVs .......................... 75

V
List of Figures
Figure 1: Diffusion of Innovation Theory (DOI) ........................................................................... 19
Figure 2: The Theory of Planned Behaviour (TPB ) ...................................................................... 20
Figure 3: The Original Technology Acceptance Model (TAM) ..................................................... 21
Figure 4: The Unified Technology of Acceptance and Use of Technology Model (UTAUT) ........ 22
Figure 5:The Unified Technology of Acceptance and Use of Technology Model2 (UTAUT2) .... 23
Figure 6: E-Government Services Adoption Model ....................................................................... 38
Figure 7: Structural Model and Measurement Model ................................................................... 54
Figure 8: Structural and Measurement Model for the Proposed Research Model ........................ 67
Figure 9: Refined Research Model ................................................................................................ 77

VI
List of Abbreviation and Acronyms
AVE Average Variance Extracted
AW Awareness
BI Behavioral Intention
CSC Community Service Centers
DOI Diffusion of Innovations
EE Effort Expectancy
FC Facilitating Condition
FDRE Federal Democratic Republic of Ethiopia
FTA Federal Transport Authority
G2B Government to Business
G2C Government to Customers/Citizens
G2E Government to Employees
G2G Government to Government
GTP Growth and Transformation Plan
LV Latent Variable
MCIT Ministry of Communication and Information Technology
MInT Ministry of Innovation and Technology
OECD Organization for Economic Cooperation and Development
PE Performance Expectancy
PLS-SEM Partial Least Square Structural Equation Modeling
SI Social Influence
SPSS Statistical Package for Social Sciences
TAM Technology Acceptance Model
TGOV Trust in the Government
TNET Trust in the Internet
TPB Theory of Planned Behavior
TRA Theory of Reasonable Action
UN United Nations
UTAUT Unified Theory of Acceptance and Use of Technology
VIF Variance Inflation Factor
WQ Website Quality

Page 1
Chapter One
I. Introduction 1.1 Background of the Study
Globally, the journey of making government organizations shift from the traditional, paper-
based, and face to face interaction into modernized and digital way of the interaction through the
implementation of e-government and its services have been practical for nearly three decades
now.In this case, citizens particularly customers of government offices can access government
services more effectively and efficiently by utilizing government electronic channels or e-
government services.
The electronic government or in short form e-Gov refers to the application of all information and
communication technologies (ICT) platforms and applications by the public sector to deliver
government information and services to its citizens (UN, 2002).
Exploring customers’ opinions regarding influential factors behind the adoption or refusal
ofonlinee-governmentservicesis considered as one of the most well-explored areas in information
technology disciplines (Venkatesh et al., 2003). Whereas, Ahlemann (2011) added, human,
technological, cultural, and other factors that could determine the acceptance, adoption, and
success of information systems can also be addressed through information science studies.
In the e-government context, Warkentin et al. (2002), defined e-government adoption as the
customers' intention to use e-government services to request information and services from
different departments of the government. While, Kumar et al. (2007) indicated, the adoption of e-
government is an individual’s choice either to use or not to use e-government services.
E-government implementation is believed to benefit both developing and developed countries. In
a developing country such as Ethiopia, e-government greatly benefitsthe government and
citizens. By realizing this, the Ethiopian government established formerly the Ministry of
communication and Information Technology (MCIT), currently the Ministry of Innovation and
Technology (MInT) in 2010. The Ministry has undertaken several initiatives. However, the first
official effort was made on November 22, 2012, by launching 49 e-service portals to enable 7
government ministries, agencies, and authorities to make customers access public services. A
report by FDRE (2016) denotes, by the end of the first phase implementation of e-government
which lasted for 5 years from 2010-2015, 125 informational electronic services and 152

Page 2
transactional electronics services were developed for 34 government authorities, agencies and
ministries of the country, by the end of 2018, the number of transactional services has increased
to 160 (Tolla, 2018).
Researchers investigated several factors associated with the low-level response to e-government
services. These problems can be categorized as technical, cultural, political, social,
organizational, and/or economical (Alshehri & Drew, 2010; Colesca & Dobrica, 2008).
Awareness about the services, computer literacy, digital divide, demographic factors, website
design, language, and security issues are among the main inhibiting factors identified and
investigated to influence customers’ adoption of online government services (Carter & Belanger,
2003; ElKheshin, 2016; Mansoori, 2017; Talib, Imarah, Abdulameer, Zwain, & Al-hakim,
2013).
The introduction of new technology in an environment always faces several challenges. E-
government utilization and implementation is relatively a new concept to Ethiopia that needs to
be studied from different perspectives. Thus this study will find out the main factors on
customers' adoption of e-government services through one of the e-government services, the
Ethiopian national e-services portal from customers’ perspective.
1.2 Statement of the Problem
One of the major inspirations for the Ethiopian government to implement e-government was to
ensure better service delivery to its citizens (Haile, 2013). Yet, e-government systems are still in
the early stages of implementation and face many issues related to customers’ adoption. Shareef
(2016) noticed many developing countries around the worldare still suffering from the lack of
customers' participation in the utilization of e-government. The issue is particularly noticeable in
Ethiopia, where customers’ intention to engage in e-government to interact with the government
is very poor.
Scholar’s depicted e-government is of vital importance for the government, citizens, and
businesses. Alshehri & Drew (2010), indicated the most obvious benefits from e-government
systems include customers get the ability to access online information and services without
geographical and time limitations. Besides, customers save effort, money, and time by utilizing
electronic government services (Al-shafi, 2010). However, realizing the benefits of e-
government services requires customers' active participation in utilizing those services. To do so,
factors influencing customers’ intention to use electronic government services need to be studied

Page 3
(Ahmad, Markkula, & Oivo, 2012; Kumar et al., 2007). Thus, this study aims to identify and
examine factors influencing the adoption of e-government services through the Ethiopian
national e-services portal by focusing on customers’ perspectives.
Even though e-services have been launched and implemented for nearly a decade now, it has not
reachedthe point where it is fully adopted and utilized by customers. As evidenced in Ethiopian
electronic government strategic implementation plan II, e-gov (2016), the government noticed
low-level usage of government web portals compared to other electronic services delivery
channels. To get public information and services, customers in Ethiopia still prefer to visit
government offices and use paper-based interaction to execute their transactions. As a result,
instead of e-government services, traditional, face to face interaction between government and
customers is still the dominant means of communication.
A global survey conducted by the UN (2018) used two measures to assess the development of e-
government in member countries: the Electronic Government Development Index (EGDI) and E-
Participation Index (EPI). In the EGDI index, Ethiopia scored 0.34 and ranked 151 while, inthe
E-participation index, scored 0.5 and ranked 101out of 193 countries. These statistics show e-
government is in its early stage of implementation and there is low-rate of response to already
established electronic government services by customers. Yet, identifying factors that can
motivate customers to utilize established online services in Ethiopia will be a valuable input for
the government to take measures that can enhance the rate of adoption.
E-government projects require a large investment. For example, the budget for the first electronic
government implementation plan e-gov (2013) was estimated to be approximately $201.46M.
With this large investment, if the intended groups or customers are not using it, the system will
no longer be functional and leads to post-implementation failure. Developing countries could
have used the money to solve poverty issues in society. Thus adoption becomes an important
aspect for the successful implementation and continued use of e-government services. This study
will try to answer how the Ethiopian government can deliver an effective and efficient online
service that meets customers’ expectations.
E-government is relatively new concept to Ethiopia; therefore, this study noticed lack of
sufficient studies in the past that explored factors influencing e-government adoption and
implementation. A master's thesis by Tadesse (2015), assessed the practices and challenges of e-
government implementation at Ethiopian revenues and customs authority large taxpayers’ office.

Page 4
Lemma (2015) in his Ph.D. work designed a sustainability framework for one of the e-
government projects, WoredaNet. Tsegaye (2018) researched public values of e-government on
the customers of the federal supreme court. Haile (2013) worked on the opportunities and
challenges of e-governance in Ethiopia. Worku (2016) focused on the role of e-government to
enhance service quality and promote good governance. A study that has a similar context with
the current study was conducted by Adefris (2018) on the adoption of e-government in the case
of Ethiopian revenues and customs authority large taxpayers.
Looking at the studies above, one can notice several limitations. First, most of these studies
focused on identifying challenges from an implementation perspective not from an adoption
perspective. Second, Adefris (2018) study focused on the adoption of e-government. However, it
was a case study andlimited to online service provided by Ethiopian Revenue and Customs
Authority large taxpayers’ case. Moreover, this study fails to include trust as a major predictor of
e-government. Studies including (Alomari, 2010; Carter & Weerakkody, 2008; ElKheshin, 2016;
Mansoori, 2017) indicated, customers’ trust in the provider and channel of delivery is a
significant determinant of customers’ intention to adopt e-government services.
Thus this study will identify factors influencing customers’ adoption of e-government services
through the Ethiopian national e-services portal which is designed to provide a common platform
for online transactional services from government departments to citizens, non-citizens,
businesses, and governmental and non-governmental organizations.
The current study argues that for e-government servicesto succeed and bring changes to how
customers interact with different departments of the Ethiopian government, it greatly depends on
customers' adoption of online services such as the national e-services portal. Thus, grounded in
the unified theory of acceptance and use of technology (UTAUT) modeland by integrating
constructs from different studies inthee-government area this study will try to study factors
influencing customers’ adoption of e-government and its services in Ethiopia.
1.3 Research Questions
The study will try to address the following research questions:
1. Why are online e-government services less adopted by customers in Ethiopia?
2. How can the findings of this study assist the Ethiopian government to enhance
customers’ adoption of e-government in Ethiopia?

Page 5
1.4. Objective of the Study
General Objective
The general objective of this study is to identify factors that could influence the adoption of e-
government services in Ethiopia from the customer’s perspective.
Specific Objectives
The following specific objectives follow from the general objective
1. To study the existing nature of e-government services and its progress made so far in
Ethiopia;
2. To review related literature regarding factors influencing customer’s adoption of e-
government services;
3. To adopt and modify a conceptual model that represents the factors influencing the
adoption of e-government services from the customers’ perspective;
4. To examine the influence of performance expectancy, effort expectancy, social
influence, facilitating condition, website design, awareness, trust in the internet and
trust in government on behavioral intention and use of e-government services;
5. To forward useful insights on factors influencing customers adoption of e-
government services in Ethiopia for government, practitioners, and academicians;
6. To draw conclusions and forward recommendations for future study.
1.5 Significance of the Study
The majority of studies on e-government are conducted in developed countries (Alawadhi &
Morris, 2009; Rabaa, Zogheib, Alshatti, & Jamal, 2016). However, most recently researchers are
actively investigating factors influencing customers’ adoption of e-government services in
developing countries too; these studies recommend the need for additional researches to deeply
explore other factors.
In a developing countrysuch as Ethiopia, where there is lack of research on e-government area,
this study will benefit academicians and researchers on e-government to have a better
understanding of the factors influencing customers’ adoption of e-government services by
employing the modified unified theory of acceptance and use of technology incorporating
awareness, website quality, and two trust constructs.

Page 6
Tolla (2018) indicated, on the implementation of e-government strategy plan II, the Ethiopian
government is prioritizing the expansion of electronic services (e-services) into other ministries
and agencies that have not been implemented before. Thus, this study is of great help to the
government as it plans to identify the main factors in the adoption of e-government services
based on customers' opinions and provide recommendations for the government to that could
increase the likelihood of customers who make use of e-government and its services.
E-government projects need a large amount of money for implementation. A report by the World
Development Report (2016), the UNDP budget allocated for e-government projects globally was
$216.45 million. In Ethiopia, the total budget for the e-government strategic implementation plan
e-gov (2013), was estimated to be approximately $201.46 million, thus, failures of these projects
waste large amounts of money. This study will, therefore, provide several significant
recommendations and suggestions for the Ethiopian government that will support the
improvement in the delivery of e-services to encourage customers to adopt online government
services.
1.6 Scope of the Study
Even if there are studies that cover e-government adoption from both the government and
customers’ side, this study investigates one of the most important stakeholders in e-government,
which is customers’ adoption of the Ethiopian national e-services portal.
The study model will be validated by respondents from customers of the Ministry of innovation
and technology (MInT), the Federal transport authority (FTA), and the Ministry of water and
irrigation. The capital city Addis Ababa is selected to be the location to conduct the study
because Addis Ababa is home for lots of federal government offices and the city has all kinds of
people from all over the country.

Page 7
1.7 Organization of the Thesis
This thesis is organized into five chapters. Chapter 1 presents the background of the study,
statement of the problem, research questions with the objective, significance, and scope of the
study. Chapter 2 provides a critical review of the existing literature in e-government and e-
service topics. The chapter also contains detailed information on e-government initiatives in
Ethiopia and the progress made so far. Finally, a brief explanation of technology adoption
theories and models with related works in the area are presented. Chapter 3 presents the
proposed research model along with a research method Chapter 4 presents demographic
analysis and structural model assessment result along with hypothesis testing. Chapter 5, the
final chapter discusses the main finding of the study and presents some recommendations for the
government of Ethiopian.

Page 8
Chapter Two
II. Literature Review and Related Works
Introduction
This chapter intends to review the existing literature and to identify models that have been used
in various e-government and e-services adoption studies. The chapter is organized as follows: the
first section presents an overview of e-government, e-services, and benefits associated with the
adoption of e-government services. Then, it provides detailed informationon e-government
initiatives in Ethiopia, and its progress made so far. then, it discusses the most widely used
technology adoption models used in various e-government works to find the most appropriate
model for this study. Finally, the chapter concludes with a detailed review of related works with
their limitation and justification for the need to conduct the current study.
2.1 Literature Review
2.1.1 Overview of E-Government
The emergence of e-government roots its background in the United States of America during the
time of President Clinton and vice president Algore in 1991 (Kamensky, 1999)1. while some
argue its origin traced back to the year where internet technology was first invented (Oseni,
Dingley, & Hart, 2015). President Clinton and his colleaguepredicted the potential of using
internet technology to reform how the government works. Thus, they created an initiative by the
name “National Partnership for Reinventing Government Clinton-Gore Administration's
initiative”. Since its inception, the implementation and utilization of e-government have been
growing widely for the past three decades. Ethiopia is one of those countries who recognized the
potential of e-government in making reforms on how government works and facilitate
sustainable economic development by enabling the citizen to use modern technologies such as
online government services.1
Warkentin et al. (2002) mentioned three features of e-government asthe extensive use of ICT, the
impersonal nature ofthe environment, and effortlessness that makes it different from traditional
communication.
1: https://govinfo.library.unt.edu/npr/whoweare/history2.html (Accessed on Jan 17, 2019),

Page 9
2.1.2 Definitions of E-Government
E-government services are considered a paradigm shift over the traditional ways of interaction
between customers, service requester, and service providers, different governmental entities.
Haider & Shuwen (2015), named this new paradigm “Electronic government”, “e-government”
or in short “e-Gov”. The term is also referred to as “digital government”, “online government”
and sometimes “transformational government” (Akbar, 2017; Lemma, 2015).
The term e-government has been described by various researchers and organizations at different
times and in various contexts. Misra (2006), claims e-government means different things to
different people. Alateyah, Crowder, & Wills(2012), further strengthen this idea by implying
defining e-government by focusing on a single perspective can be easy, however, it is
challenging to provide a comprehensive definition that can satisfy everyone’s view. Some of the
widely used e-government definitions include World Bank (2002) definition that states e-
government is government-owned or operated systems of information and communications
technologies (ICTs) that transform relations with citizens, the private sector and/or other
government agencies to promote citizen empowerment, improve service delivery, strengthen
accountability, increase transparency, or improve government efficiency.
Another international organization, United Nation (2002), refers to the term as the use of
electronic channels such as the internet and the world wide webbythe government to provide
information and services to customers. The organization for economic cooperation and
development (OECD) defines e-government as the application of ICT particularlythe internet to
achieve better government (OECD, 2003). E-government services are online public services
delivered by a government or semi-government organization to citizens following the laws and
regulations of a nation-state describing rights and duties (Dijk, Ebbers, & Wijngaert, 2015 ). On
one of the earlier researchers by Carter & Bélanger(2005), e-government involves the use of
ICTs to improve governments' efficiency during interaction with other public agencies, their
employees, businesses, and citizens.
2.1.3 Benefits of E-Government
E-government adoption and utilization benefit both the implementer: the government and
customers. The role of e-government is not only limited to the provision of online government
services. Besides, e-government has a great role in achieving democratization and assist

Page 10
countries' development (Oseni et al., 2015). E-government enables governmental bodies to be
more accountable and transparent (Hien, 2014) and helps to build relationships and connections
between different public organizations with their respective departments (Ebrahim & Irani,
2005).
Colesca & Dobrica(2008) mentioned the reasonsfor the adoption of e-government could be
political, economic, social, and managerial. From a political point of view, e-government
provides customers with public information and services to boost citizens participation in
political and decision-making process, increases transparency, strengthens the accountability of
the government, promotes openness of government, facilitates citizens engagement in the policy-
making process, eliminate bureaucracy and helps to prevent corruption (Colesca & Dobrica,
2008; UN & OECD, 2003; Ndou, 2004). Economically, e-government enables the public or
customers to access information and services 24/7, it reduces time, effort and costs, improves the
quality of services government offices offer to their customers,leads to growth in revenues. The
more citizens adopt e-government, the more operation, and management costs are reduced
(Kumar et al., 2007; Oseni, Dingley, & Hart, 2013).
E-government improves customers' knowledge of internet and computer use, modernizes public
services delivery which results in customer satisfaction. Moreover, e-government results in the
creation of new businesses and work opportunities (Alateyah, Crowder, & Wills, 2012; Alshehri
& Drew, 2010). Moreover, e-government plays a great role in organizational change, facilitates
greater teamwork, and enhances knowledge management practices within the organization
(OECD, 2003).
2.1.4 E-Government Delivery Models
According to (AlFawwaz et al., 2013; Alshehri & Drew, 2010; Carter & Belanger, 2003; Nusir
& Bell, 2013), there are four types of e-government: Government to Citizen (G2C), Government
to Business (G2B), Government to Employees (G2E) and Government to Government (G2G).
Government to citizens (G2C) is a type of e-government designed to facilitate interaction
between citizens and the government, in which the current study is concerned with. G2C model
enables citizens to get public services and information online. Some of the services offered by
the Ethiopian government to citizens through the national e-services portal includes but not
limited to, issuance of driving license, issuance of diplomatic ID card, issuance of ICT

Page 11
competency certificate, registration for social security services, issuance of the trade registration
certificate and others.Thenational open data portral and customers complaint portal are also good
examples of government to citizens type of interaction where citizens/customers can access
information and directly interact with the Ethiopian governemnt.
Government to Employees (G2E) this type of communication focuses on communication
between governmental offices with their employees Carter & Belanger (2005).While,
Government to Government (G2G) type of e-government involves interaction between different
government institutions (Alshehri& Drew, 2010). In the Ethiopian context, WoredaNet can be a
good example of this type of e-government.
Government to businesses (G2B) is called the government to business type of e-government. It
allows government organizations to interact with private sectors and vice versa. This type of
communication works by minimizing operational costs and time and collect better information
about businesses (Nusir & Bell, 2013). A good example of this kind of communication can be
the Ethiopian e-Procurement portal, which allows businesses to interact with the government.
2.1.5 Concept of E-Services
E-government is a wider concept and e-services are considered one of the domains of e-
government (Ogurlu, 2014; Ndou, 2004). The adoption of e-servicesis one of the excessively
discussed areas in the e-government domain. E-services are the type of service that is provided
and consumed online and it represents two concepts aligned together, “electronic” and
“services”. Sara (2013) noticed studies on e-services are growing to have similar implications
with e-government studies in information science studies. According to (Scupola & Nicolajsen,
2014; Sara, 2013), there is no universally accepted definition of electronic services. Lindgren &
Jansson (2017) use the term to refer to services that are mediated electronically.
Ruyter, Wetzels, & Kleijnen (2001) provides a similar but more comprehensive definition of the
term e-services as an interactive, content-centered and internet-based customer service, driven by
the customer and integrated with related organizational customer support processes and
technologies to strengthen the customer-service provider relationship. While, Wang et al. (2005),
outlined e-services as “information and services that are provided to the public through
government websites”.

Page 12
2.1.6 Challenges in Adoption and Implementation of E-Government
E-government adoption refers to customers' intention to use e-government and its services to
receive information and request services from the government (Warkentin et al., 2002). Gilbert
(2004), explained e-government adoptionas “customers willingness to use e-government
services”. while Kumar et al. (2007) indicated adoption is a multi-dimensional construct and
defines it as a decision of the customer to either make or not make use of online public services.
For this study, e-government service adoption is defined as the customers' intention to use the
national e-service portal to receive information and request services from the Ethiopian
government.
Even though e-governmentis a relatively newer concept, most countries around the world
implemented several e-government initiatives motivated by its potential to make changes to how
the government operates and communicates with its citizens. Like any new technology, adoption
of e-government faces several challenges from both the implementer (government) and the users
(customer’s) side.
The majority of peoples in African countries are unable to benefit from e-government due to
poor internet connectivity, high cost of access, and lack of necessary resources and skills by the
users of these systems (UN, 2018). Also, Alhujran (2009) indicates developing countries face
lots of challenges including the digital divide, lack of capable human capacity, financial
constraints, low ICT infrastructure, and issues related to legislation and policy.
Even though much research not conducted in Ethiopian case, Mekuria(2009)thesis on the
challenges and practices of e-government implementation in Ethiopian federal civil service
organizations revealed that federal government offices face the same problems that have been
noticed in other developing countries such as limited ICT penetration, limited enabling
environment, lack of competent IT professionals and low website quality. Similarly, Belachew
(2010) indicated financial constraints, qualified human capital resources, low level working
culture, high resistance to change, weak private sector, low level of collaboration between
private and public sectors are major barriers in the implementation of e-government in Ethiopia.
In Ethiopian e-government strategic implementation plan I, the government planned to make a
national awareness campaign on advantages and benefits e-government and its systems for the
citizens of the country and intended around 70% of its citizens to be aware of e-government.

Page 13
However, as indicated in e-gov (2016),lack of public awareness about electronic government
services was identified as one of the causes of low-level adoption in Ethiopia.
Zeleke (2018), emphasized government web portals in Ethiopia violates web usability and
accessibility guidelines by web content accessibility guidelines (WCAG) and world wide web
consortium(W3C). The finding of his study also confirmed most government web portals content
is not regularly updated, difficult to navigate through, and has a poor appearance.
2.2 E-Government in Ethiopia
According to FDRE (2016), during the implementation of growth and transformation plan1
(GTP1) lasted from 2010-2015, 47 government institutions were enabled to have online services,
35 community service centers were established by Federal offices,125 informational electronic
services and 152 transactional electronics services have been developed for 34 government
authorities, agencies and ministries in the country, 19 community radio stations, and 230 public
information desks have been established during the plan period. In the e-government
implementation strategy plan II, the government plans to prioritize the expansion of electronic
services into different government departments (Tolla, 2018).Therefore, from the year 2015-
2020, the government has plans for another 219 e-services across 13 ministries and 11 agencies.
2.2.1 Major E-Government Initiatives in Ethiopia
WoredaNet: WoredaNet is a government network infrastructure that links 700+ woredas
(districts) in the country. Woreda is an Amharic word that stands for districts having an average
of 100,000 people (Belachew, 2010). The infrastructure has a role in making the Ethiopian
government accountable and transparent. Every district in the country uses WoredaNet to
interact with the federal and regional governments using video conferencing, messaging, voice
and internet connectivity, directory, email, and other services(Belachew, 2010; Haile, 2013;
Negash & Lessa, 2011). For more than 700+ woredas are connected through 11 regional
datacenters and one national data center.
SchoolNet: SchoolNet is another infrastructure that links about 756+ primary, middle and
secondary schools found in different regions of the country. This infrastructure enables students
to get a quality education with students sharing the same age as them and located on the other

Page 14
side of the country, as it provides the same content for each school in the country(Belachew,
2010; Haile, 2013).
Ethiopian Educational & Research Network (EthERNet): currently, there are around 43
higher educational institutes located inside the country. EthERNet is an infrastructure that links
these universities. Ethiopian Masters and Ph.D. students are attending courses and video-enabled
training with other universities that are found outside Ethiopia.
The Ethiopian 888 Toll-free call center: call centers are one of the communication channels for
e-governmentservice delivery in Ethiopia. Ethiopian toll-free 888 call center currently serves
around 200, 000 customer calls monthly and is considered one of the most actively used channels
of communication by customers. It is accessible in both fixed-line and mobile phones. the call
center enables citizens to get information about regional offices and federal ministries, agencies
courts other public institutions in the country, customers can get the information in three widely
spoken languages in the country: Amharic, Afan Oromo, and Tigrigna.
Mobile Applications: mobile technologies are now accessible to most peoples in the
world.Although when compared to developed countries, mobile coverage in developing
countries is lower with 98.7 per 100 residents while it is 127.3per 100 residents for developed
nations. Developing country governments as well saw this as a great opportunity to interact with
citizens. Currently, more 34+ mobile applications are developed for Ethiopian ministries and
government agencies. These applications are found in the Ethiopian government application
store on Google plays store and app store. These applications are grouped into eleven categories,
business which is the most downloaded category, health, sport, entertainment, good governance,
education transportation, travel, weather, news, and social.
Ethiopian National Portal www.ethiopia.gov.etis a one-stop-shop multi-lingual national
government portal for online services that provide information, interactive and transactional
services. This portal provides information and services which are created and maintained by
various government organizations. Users of this kind of portal do not need to remember various
ministries and agency's websites; instead,theymightgo to one point of access for all government
services (Kumar et al., 2007).

Page 15
Ethiopian Customer Compliant Portal www.ecompliant.gov.et is a new system that system
provides governmental institutions and citizens with a common platform to interact with each
other regarding the state of public service provisions.
Electronic Government Procurement System www.eprocurement.gov.et is developed in
compliance with the Ethiopian Government Procurement Legislative Framework and B2G and
G2G best practices. The e-Procurement system provides the ministry with a platform to transact
with suppliers as well as within its organizational departments.
The Ethiopian government has taken a step in making all public information’s available to the
community by introducing a new Ethiopian open data portal ethiopia.opendataforafrica.org. The
open data portal has a big role in making the Ethiopian government transparent. Citizens have
the right to easily access information, which has its positive effects.
One of the major provisions of e-government is e-services (Ogurlu, 2014). On November 22,
2012, the Ethiopian Ministry of Communication and Information Technology (MCIT)
introduced 49 e-service portals developed. to enable seven governmental institutions to give
online services to their customers, the number of e-services and e-service providers has been
growing each year and reached 72+ online services and the service providers' number also
increased from seven to fifteen ministries and agencies.
The Ethiopian National e-Service Portal found on www.e-services.gov.et is designed to
provide a common platform and generic tools for online transactional services. Using the system,
government organizations render electronic public services to citizens, non-citizens, businesses,
and governmental and non-governmental organizations. Regional offices and federal institutions
give effective information and services to citizens, business diplomats, and others. 34+ federal
and regional government offices are using the Ethiopian e-services portal to provide 72+ services
to the citizen and residents on the country.
2.2.3 Ethiopian E-Government Survey Report
The United Nations performs a regular assessment on e-governmentdevelopment in 193 member
countries, every 2 years. In this assessment two indexes are used to measure the state of member
country development in e-government using E-government development index (EGDI) and E-
Participation Index (EPI). E-government development index (EGDI) consists of 3 basic measures
on the country’s ability in the provision of online services (OSI), telecommunication

Page 16
infrastructure (TII), and human capacity (HCI). The result of the EGDI index assessment shows
the relative performance of one country to other countries in the development of e-government
implementation and utilization at a national level. E-Participation Index (EPI) is a supplementary
index which shows the utilization of online services by member countries to enable access to
information and services to the public or (“e-Participation”), interaction with stakeholders or (“e-
Consultation”) and engagement in the decision-making process or (“e-decision making “).
In 2018, there are no African countries to make it into a very high e-government development
index list. However, Ghana, Tunisia, South Africa, Seychelles, and Mauritius are African
countries that are able to be included in the high e-government development index list. The
majority of countries including Ethiopia are part of the middle e-government development index
list and 15 countries belong to the low e-government development index.
Back in 2003 Ethiopia scored 0.128 in the EGDI index and ranked 166 while scored 0.035 in EPI
and ranked 102. After 15 years, in 2018 the country scored 0.35 in EGDI, ranked 151 and 0.57 in
EPI, ranked 101. Even if the statistics are not satisfactory yet, over the years the country is
making progress in both measures. The following table shows the Ethiopian score in the United
Nations e-government index from 2003 to 2018.
Table 1: Ethiopian E-Government Development Status
Year EGDI score Rank EPI score Rank
2003 0.12 166 0.03 102
2004 0.13 170 0.00 151
2005 0.13 171 0.00 151
2008 0.18 172 0.00 170
2010 0.20 172 0.04 135
2012 0.23 172 0.34 45
2014 0.25 157 0.25 122
2016 0.26 157 0.49 91
2018 0.34 151 0.57 101

Page 17
2.3 Technology Adoption Models and Theories
This century is considered as the period of major technological innovations in Information
communication technology, these include, computers, smartphone technologies, social media,
etc. Due to these innovations, studies in information science have long been conducted on how
these technologies can be accepted and utilized by the target users. Venkatesh (2003) discussed
user acceptance of new technology is one of the well-researched areas in information science.
Many theories and models have been proposed over the past decades to understand factors
behind acceptance or rejection of any new technology by customers, including, but not limited to
the diffusion of innovation (DOI), the theory of reasoned action (TRA), the theory of planned
behavior (TPB), Technology Acceptance Model (TAM) and unified theory of acceptance and
use of technology (UTAUT).
2.3.1 Diffusion of Innovation
The diffusion of innovation model is one of the earliest models of its kind. Rogers(2003)
explained diffusion as “the process by which an innovation (technology) is communicated
through certain channels over time among the members of a social system”. Rate of diffusion is
a central point in the diffusion of innovation theory; he explained, the rate of diffusion is the
relative speed where the society requires to makes use of the innovation or technology. From the
definition above, one can notice, diffusion of innovation is made up of four elements, the
technology or innovation, the communication channel, the time, and the society (Rogers, 2003).
An innovation might be an idea, practice, or project that an individual views as new. The second
component, communication channel refers to the communication between message sources, or in
other words, it refers to the communication between message source to the message receiver.
The source and receiver in this case could be an individual or an organization. An innovation
then can be communicated through mass media such as TV, radios, newspaper, magazines, etc.
and through interpersonal communication that involves interaction between individuals.Timein
the diffusion of innovation indicates, the period the society need to learn and use the innovation.
The time needed to learn an innovation could be long or short. The last component is the social
system, it is commutative of different units that are connected to solve a problem.

Page 18
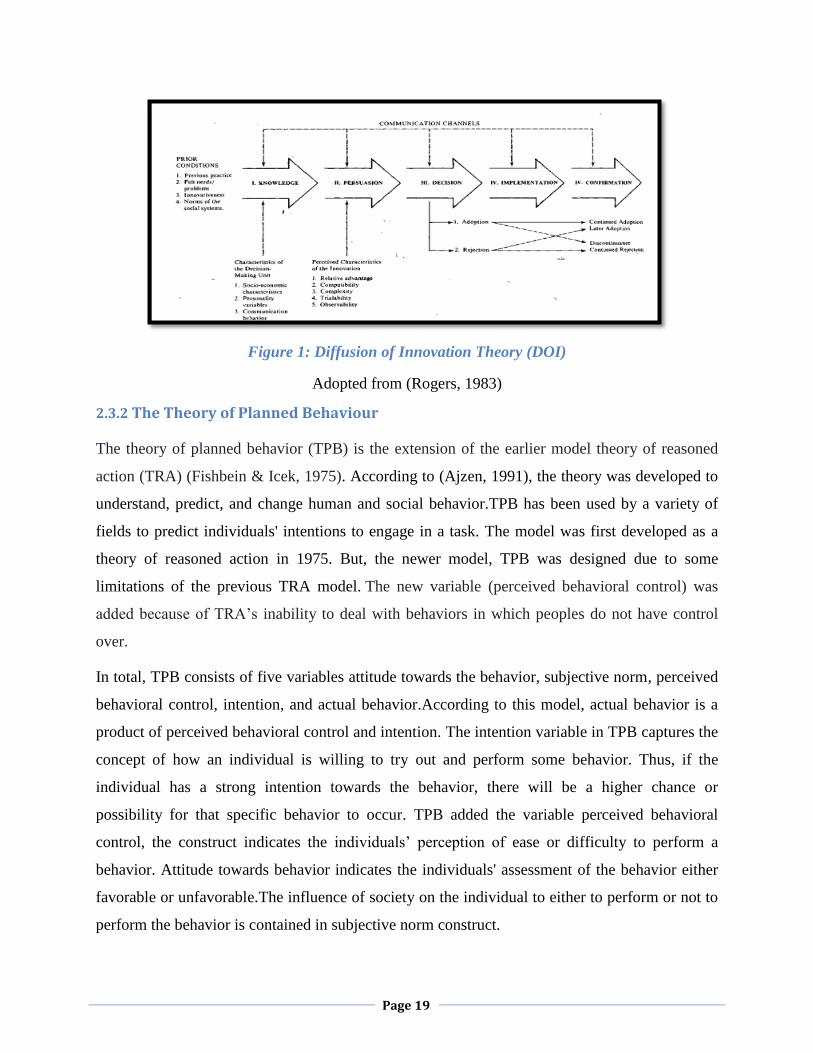
According to Rogers, the rate of adoption of any innovation or technology can be affected by
five factors, relative advantage, compatibility, complexity, trialability, and observability.
1. Relative advantage refers to the degree to which technology in our case e-
government servicesare perceived as better and efficient when compared to the
traditional means of interaction. Rogers indicated the rate of adoption is strongly
predicted by relative advantage.
2. Compatibility showse-government services could have a high adoption rate when it
goes along with adopters' past experiences and values.
3. Complexity indicates how e-government services are perceived to be difficult to use
by the member of the society.
4. Trialability shows e-government systems have been tried by the society and found to
be beneficial. Thus an innovation that has been triedbeforehas a higher chance to be
adopted.
5. Observability indicates e-government services can be adopted if the result is visible
to others.
Rogers’s model of diffusion consists of a five-step decision model including Knowledge,
persuasion, decision, implementation, and confirmation.The knowledge step occurs when the
individual has awareness ofthe existence of an innovation (e-government services) and get some
understanding of how to use it. In the persuasion stages, as the individual becomes aware of the
innovation he/she decides whether to use or not to use it. In the decision stage, an individual get
engaged in some activities that lead to using the technology thus gets an opportunity to either
adopt or reject that technology. In the implementationphase,the individual decides to make use of
an innovation or technology. Finally, it comes to the innovation that comes to the stage where it
is adopted or rejected (Rogers, 1983).
Page 19
Figure 1: Diffusion of Innovation Theory (DOI)
Adopted from (Rogers, 1983)
2.3.2 The Theory of Planned Behaviour
The theory of planned behavior (TPB) is the extension of the earlier model theory of reasoned
action (TRA) (Fishbein & Icek, 1975). According to (Ajzen, 1991), the theory was developed to
understand, predict, and change human and social behavior.TPB has been used by a variety of
fields to predict individuals' intentions to engage in a task. The model was first developed as a
theory of reasoned action in 1975. But, the newer model, TPB was designed due to some
limitations of the previous TRA model. The new variable (perceived behavioral control) was
added because of TRA’s inability to deal with behaviors in which peoples do not have control
over.
In total, TPB consists of five variables attitude towards the behavior, subjective norm, perceived
behavioral control, intention, and actual behavior.According to this model, actual behavior is a
product of perceived behavioral control and intention. The intention variable in TPB captures the
concept of how an individual is willing to try out and perform some behavior. Thus, if the
individual has a strong intention towards the behavior, there will be a higher chance or
possibility for that specific behavior to occur. TPB added the variable perceived behavioral
control, the construct indicates the individuals’ perception of ease or difficulty to perform a
behavior. Attitude towards behavior indicates the individuals' assessment of the behavior either
favorable or unfavorable.The influence of society on the individual to either to perform or not to
perform the behavior is contained in subjective norm construct.

Page 20
Figure 2: The Theory of Planned Behaviour (TPB )
Adopted from (Ajzen, 1991, p. 182)
2.3.3 Technology Acceptance Model
The technology acceptance model was developed originally by (Davis, 1989). TAM is one of the
most popular research models to explain the acceptance use and of an information system and
technology by individual users. The original TAM model consists of two most important
constructs: perceived ease of use and perceived usefulness that influences an individual’s
behavioral intention. The concept of perceived usefulness focuses on individuals’ perception of
using that particular system that could enhance their job performance. Whereas, perceivedease of
use is associated with how easy or effortless the system is to be used by customers. In his result
Davis (1989) showed perceived usefulness has a greater correlation with an individual's use
behavior. Several modifications have been made on the original model, which includes work
by(Taylor & Todd, 1995),(Venkatesh & Davis, 2000) and several others. TAM validation
continues to be part of masters and Ph.D. thesis either using the original model or by using the
modified version of TAM.

Page 21
Figure 3: The Original Technology Acceptance Model(TAM)
Adopted from (Adeyinka, 2015)
2.3.4 The Unified Theory of Acceptance and Use of Technology
The unified theory of acceptance and use of technology model is the result of the integration of
previously used models. Venkatesh et al., (2003) and his colleagues reviewed eight previously
developed models and combine the main features of each model to come up with a unified model
that has more power in explaining individuals’ intention to adopt new technology than any of the
previous models. The model was first developed in 2003 by integrating;
1. Theory of Reasoned Action (TRA)
2. Technology Acceptance Model (TAM)
3. Motivational Model (MM)
4. Theory of Planned Behavior (TPB)
5. Combined TAM and TPB(C-TAM-TPB)
6. Model of PC Utilization (MPCU)
7. Innovation Diffusion Theory (IDT)
8. Social Cognitive Theory (SCT)
This model consists of 4 determinants of behavioral intention, performance expectancy, effort
expectancy, social influence and facilitating condition, 2 determinants of usage, behavioral
intention, and facilitating condition. As well as four demographic variables or moderator
variables: gender, age, experience, and voluntariness. This model found to explain around 70%
variance in an individual's behavioral intention and 53% of the variance in user behavior.

Page 22
1. Performance expectancy is defined as “the degree to which an individual believes that
using the system will help him or her to attain gains in the job”. This construct is found to
be the strongest predictor of customers’ intention towards using new technology.
2. Effort expectancy is defined as “the degree of ease associated with the use of the system”.
In (Venkatesh et al., 2003) result, Effort expectancy variable was found to be
significantin both voluntary and mandatory contexts. However, the result remained true
for only the first phase of training and becomes insignificant over time.
3. Social influence is defined as “the degree to which an individual perceives that important
others believe he or she should use the system”. Social influence is perceived as peoples
who are close to the customer, such as family, friendsor work colleagues influence on the
customer to adopt e-governmentservices. Social influence construct in (Venkatesh et al.,
2003) study indicated social influence was notsignificant in voluntary contexts. But
becomes significant in mandatory context.
4. Facilitating condition is defined as “the degree to which an individual believes that an
organizational and technical infrastructure exists to support the use of the system”. In this
model facilitating condition has two direct links with behavioral intention and usage
behavior.All these relations are moderated by gender, age, experience, and voluntariness.
Figure 4: The Unified Technology of Acceptance and Use of Technology Model (UTAUT)
Adopted from (Venkatesh et al., 2003)

Page 23
Its extension UTAUT 2 was developed later in 2012. The first model UTAUT was studied to
examine the use of IT in an organizational context. However, UTAUT 2 model examines the use
of information technology from consumers perspective. The new model added three constructs
price value, hedonic motivation, and habit. In consumer technology,the hedonic motivation
construct in UTAUT2 indicates pleasure or excitement an individual gets by using the
technology. The second construct price is also an important construct to be added to UTAUT 2.
the cost associated with the use of technology has a strong impact on customers behavior. Habit,
in UTAUT, is modeled to have an influenceon both dependent constructs behavioral intention
and use behavior. It is an important construct that is added to UTAUT 2. The construct habits
refer to an automatic decision where the individual performs some behavior as a result of
learning (Venkatesh et al., 2012).
Figure 5: The Unified Technology of Acceptance and Use of Technology Model2 (UTAUT2)
Adopted from (Venkatesh et al., 2012)

Page 24
2.4 Related Works
This study reviewed existing works consisting of keywords “e-government adoption”, “adoption
of e-services”, ”e-services implementation” and “Acceptance of e-services” from different
journal articles, master’s thesis and Ph.D. dissertation works.
A prior study by Warkentin et al., (2002), examined the effect of citizen trust on customers who
intend to use the online system to file for tax returns.A population of size 1000 was surveyed
from different countries to collect data about variables that are considered to have an impact on
the adoption of online service, including the United States, Latin America, Africa, and others.
The population was diverse to conduct the study as it includes different socioeconomic classes,
urbanization, and national culture.Based on the findings, for new users, characteristic based and
cognitive-based backgrounds were found to be crucial. On the other hand, for experienced users,
it was suggested that their previous interaction with the system determines their level of trust.
The study concludes by emphasizing how trust is an important aspect of the adoption of any e-
government service.
Carter & Belanger (2003), emphasized e-government successis highly dependent on the adoption
of e-services by the targeted customers.In their study, a survey questionnaire that was designed
based on diffusion of innovation or DOI factors was administered to 140 undergraduate students,
136 complete answers were returned. The reliability of study constructs was evaluated through
the use of Cronbach's alpha and factor analysis was employed to check construct validity. The
research hypothesis were tested using multiple regression techniques. The study concludes
perceived relative advantage, perceived image, and perceived compatibility werefound to be
factors that could enhance citizens’ intentions to use e-government services.However, the other
construct in the model, ease of use werenot found significant to enhance the intention to use e-
government services by the students.
Jyoti & Yogesh (2005) aimed to examine citizens' awareness and the effect of demographic
characteristics on citizens' adoption of e-government initiatives in the United Kingdom.To fulfill
the purpose of the study, a survey questionnaire contained of multiple-choice questions that
addressed demographic variables and two yes/no questions were delivered to e-government
adopters and non-adopters. Grounded in the stratified sampling technique, a total of 358 usable
responses were received out of 1600 distributed questionnaires. Based on the findings, citizens
Page 25
who use the internet tend to be more aware of e-government initiatives. Moreover, demographic
variables successfully differentiated adopters and non-adopters group.
AlAwadhi & Morris (2008) used the UTAUT model to determine the adoption of e-government
services in Kuwait. To meet the research aim, the research employed quantitative research in the
form of a survey method. Overall, 880 completed questionnaires were returned out of 1013
distributed questionnaire with a response rate of 86.8%. Based on the finding, facilitating
conditions, effort expectancy, peer influence (social influence), and performance expectancy
were found to be significant in the use and adoption of e-government services.
Colesca & Dobrica (2008), in their study on the adoption and use of e-government services in
Romania, used an extended version of TAM model. A survey questionnaire was administered to
530 citizens from different districts, 481 usable responses were analyzedafter eliminating
incomplete responses. The study finding revealed usefulness, ease of use, quality, and trust in e-
government determines the rate of adoption. while, demographic variables, educational
background, and age variables were found significant in the model.
Alshehri, Drew, & Alfarraj, (2012), studied the challenges and barriers citizens face to adopt e-
government in Saudi Arabia. An online survey questionnaire was used as a primary data
collection instrument. The population was taken from both IT employees and members of the
general public and 400 citizens’ responses were finally used.The finding of this research
confirmed some systemic barriers including ICT infrastructural weakness, lack of awareness,
lack of trust, and lack of qualified IT experts. Finally, the study has generated a list of possible
recommendations that can help the public sector and policymakers to move towards the
successful adoption of e-government services.
Alomari (2014), studied e-government adoption on the customers of two Jordanian departments:
The Jordan government income and sales tax department and thedriver and vehicle licenses
department, which aimed at providing insight and evaluation into the factors that could influence
e-government effective functioning in the Jordan social community through its interaction with
citizens. The study was based on two well-known theoretical frameworks, diffusion of
innovation theory (DOI) and technology acceptance model (TAM). The study collected data
from 356 citizens via a survey, to discover their understanding of 10 predetermined factors. The
outcome of the research indicated that trust in the internet; website design, religious beliefs,

Page 26
resistance to change, perceived usefulness, relative advantage, and complexity are the main
factors that affect citizen's acceptance and usage of e-government services.
Samsudeen (2013), adopted a unified theory of acceptance and use of technology (UTAUT)
model to understand factors that could influence citizens'adoption of electronic services provided
by the Sri Lankan government. The research employed survey method and questionnaires were
delivered to respondents in an online and printed form. Responses from study participants were
analyzed using regression analysis. Performance expectancy, effort expectancy, and social
influence were found to influence customers' intention to use e-government services. However,
the facilitating condition construct was found to haveno impact on customers' intention.
Mansoori (2017), in his Ph.D. work, investigated citizens' adoption of e-government services in
the United Arab Emirates Abu Dhabi region. In this study, the unified theory of acceptance and
use of technology model was modified by adding 2 trust constructs: trust in the internet and
government trust along with the original UTAUT variables. The research population tried to
include different kinds of Abu Dhabi’s residents. Overall, 638 survey questionnaires were
analyzed using regression and structural equation modeling (SEM) techniques. Performance
expectancy, effort expectancy, trust in e-government,and trust in the internet were found to
influence customers' behavioral intentions. While social influence construct doesn’t have a
significant impact on the use of online e-government services.
In her Ph.D. dissertation, ElKheshin, (2016) employed an extended version of the theory of
acceptance model (TAM) to study determinants of e-government services adoption in Egypt. The
study employed a multi-method approach. Survey questionnaires were distributed to 1500
participants, 897 were qualified to be used for analysis purposes. Chi-square test used to find if
there is any difference between adopters/non-adopters group, Cronbach's alpha was employed to
check for reliability of measures.
The analysis result from both survey and interview method discovered, perceived usefulness,
perceived ease of use, and attitude positively influence Egyptian behavioral intention. External
factors, trust in government, trust in the internet, website design, the perceived public value had
also a positive impact on the use of e-government services.
A master's thesis by Adefris (2018), focused on the adoption of e-government in Ethiopia, in the
case of Ethiopian revenues and customs authority (ERCA) large taxpayers. This study is the first

Page 27
of its kind to study customers’ perceptions of factors influencing online public service in
Ethiopia. The researcher utilized a multi-method approach by combining quantitative surveys
and qualitative interviews. The study revealed a significant and positive relationship between
most of the research hypotheses except for social influence construct. Moreover, one of the
demographic variables, gender was found to be significant in determining customer adoption
while age has no effect.
2.5 Justification for Conducting this Study
From the literature review above, the researcher was able to identify gaps in studies that were
conducted previously in Ethiopia and other countries. According to the researcher's knowledge,
in Ethiopia, there is only a single study that had focused on e-governmentadoption from
customers' perspectives. The study modified UTAUT by adding two constructs awareness and
website quality, However, this study was a case study and focused on customers of Ethiopian
Revenues and Customs Authority large taxpayers. Even if this study can be categorized under
the same domain as the previous one, it is unique for three reasons.
1. This study is the first to include a vast amount of customers’ opinions on the factors that
could influence e-government services adoption in Ethiopia. Therefore, the study tried to
sample customers of 34 online services provided by two ministries and one authority.
2. The study modified the UTAUT model by incorporating website quality, awareness, and
two trust constructs into the original UTAUT model to get a comprehensive view of
factors in e-government adoption. A previous study by Adefris (2018) recommended
future studies to include the influence of trust variables in the model and this study
included trust in the internet and trust in government construct variables and investigated
their influence on Ethiopian customers.
3. Finally, contrary to Adefris (2018) research, the proposed model in this study identified
use behavior and behavioral intention both as an outcome variable.

Page 28
Chapter Three
III. Research Model and Methodology
Introduction
This chapter, chapter 3 intends to present the general research methodology. The first section
provides a detailed explanation of the research model,study construct, and the proposed model
for Ethiopian e-government adoption. Then, it explains the research paradigm that will guide the
research, study design, and general research methodology. Followed by,detailed description
ofthestudy population, sampling techniques, and sample size are covered. The final section gives
an overview of the data analysis and presentation method including the pilot test.
3.1 Research Model
3.1.1 Model Construct and Hypothesis Development
As discussed earlier in chapter 2,TAM, TPB, DOI, and UTAUT1 and 2 are amongst the most
widely used models to examine the rate of acceptance and adoption of e-government technology
in different works. The UTAUT model is the result of the integration of eight previously used
models. Thus, it consists of constructs that possess the ability to explain higher variance.By
taking the fact that UTAUT was designed in 2003 and its modified version, UTAUT 2 made in
2012, it is can be considered a new model. Except for UTAUT, which explains around 70% of
the variance in usage intention, all the other models are blamed to have less explanatory power
that ranges from 30-50%. Accordingly, the UTAUT model is adopted because of its ability to
predict the variance in behavioral intention and use behaviore than any other model. Also, the
newness of the model makes it suitable for further validation.
Therefore, this study makes use oftheUTAUT model and modified the model by adding four
constructs trust, awareness, and website quality. These constructs are believed to be relevant for
e-government services adoption in the case of Ethiopian as several other studies confirmes the
impact of the constructs in their studies, which will be discussed later in this section. Trust
concept is represented by two constructs: trust in the internet (TNET) and trust in government
(TGOV) and two other constructs: awareness (AW) and website quality (WQ).

Page 29
Intheoriginal UTAUT model, there are six main variables, performance expectancy, effort
expectancy, social influence, facilitating condition, behavioral intention, and use behavior. Four
independent variables, performance expectancy, effort expectancy, social influence, and
facilitating condition are modeled tohavea direct influenceondependent variable behavioral
intention.While facilitating condition and behavioral intention have a direct influence on use
behavior.
Integrating constructs into the UTAUT or other models has become common practice in most of
the studies conducted in the e-government area. For example, ElKheshin (2016) integrated trust
constructs and website design with original TAM constructs. Mansoori (2017) modified UTAUT
by adding two trust constructs. Alshehri, Drew, & Alghamdi, (2012)also used UTAUT by adding
website quality construct. Bwalya (2009) guaranteed trust constructs andwebsite quality
constructs are of much importance for studies in an e-government area.
Venkatesh et al., (2003) used UTAUT to examine employees' technology acceptance and use.
However, the justification for using additional constructs in the current study model could go
along with Venkatesh's recommendation, that future research can add other constructs that can
enhance the model prediction ability in explaining behavioral intention and use behavior. Also,
this study considers e-government as a new technology that needs to be studied in a different
country having a different cultural setting, and in a different type of service, which is online
public services.
Performance Expectancy
Venkatesh et al., (2003) define performance expectancy as “… the degree to which an individual
believes that using the e-government system will help him or her to attain gains in the job”. To
make it more suitable for the e-government context, this study uses a definition by Alshehri
(2012) which provides a more detailed definition as“the degree to which the customer believes
that using e-government services will help him or her to facilitate communication with the
government in terms of benefits such as: saving time and money, improving the quality of
government services, and increasing the equity between all citizens.”
Performance expectancy in UTAUT is formed from five constructs of previous models.
perceived usefulnessfrom TAM, job fit from MM,extrinsic motivation from TPB, relative
advantage from MPCU, and outcome expectations from IDT. In this study, PE construct can be

Page 30
measured through how e-government systems benefit customers’in saving time, money, effort,
and enable them to get quality service from government offices.A web portal that enables
customers to save resources can be adopted easily.
The analysis result of Venkatesh et al., (2003) revealed, performance expectancy is one of the
strongest predictors of behavioral intention. Similarily, Rabaa et a.,l (2016), found perceived
usefulnessas the strongest predictor of e-government adoption. Adefris (2018) confirmed PE has
a direct and significant effect on customers BI in the case of Ethiopian large taxpayers. Thus, the
following hypothesis is formulated for this study:
H1: Performance expectancy will have a positive influence on customers’ behavioral intention
to use e-government services.
Effort Expectancy
Effort expectancy is “…the degree of ease associated with the use of the e-government system”
(Venkatesh et al., 2003). Effort expectancy in UTAUT is made up ofthree constructs named
perceived ease of use from TAM, complexity from MPCU, and ease of use from IDT models.
There is a saying that “ complexity is the enemy”, complex systems are hard to follow and
difficult to use. Where as, simplicity or easy to use is favored or desirable functionality of any
system. Talib et al., (2013) indicated that e-government systems that are perceived to be
effortless have a higher chance to be adopted. Ahmad et al., (2012) strengthen this idea by
indicating, it is more favorable for e-government systems designed to be easy to useto increase
the likelihood of customers which makes use of the system.
The findings of a study by Carter & Bélanger (2005) showed that perceived ease of use from
TAM model was a significant determinant of behavioral intention. The analysis of a study on the
evaluation of e-government services quality in Nigeria by Hien (2014) indicated that perceived
ease of use is an important dimension for the adoption of public e-services. In addition,
regression analysis result from Mansoori (2017) study confirmed EE to be significant. Thus, the
following hypothesis is formulated for this study:
H2: Effort expectancy will have a positive influence on customers’ behavioral intention to use
e-government services.

Page 31
Social Influence
Social influence is “….the degree to which an individual perceives that important others believe
that he or she should use e-government systems ” (Venkatesh et al., 2003). The social influence
construct is a component of three constructs from different models. subjective norm from
TRA/TPB/TAM2, social factors from MPCU, and image from IDT models. Social influence
construct is perceived as the influence of important peoplessuch as family, friends, and work
colleagues on the customers' intention to use e-government services.
The impact of social influence on individuals’ behavioral intention is somehow a controversial
issue. Some argue social influence is amongst the main factors to influence BI including, a study
by Al-shafi (2010) in Qatar and Samsudeen (2013) in Srilanka. On the other hand, Adefris
(2018) found out that social influence is insignificant to influence e-government adoption. On
another study on e-banking adoption in Ethiopia by Desta (2018), social influence construct was
insignificant in three datasets including ATM users, Mobile making users, and Internet banking
users. Similarily Venkatesh et al., (2003) found out the impact of social influence was only in
mandatory contexts. Thus, the following hypothesis is formulated for this study,
H3: Social influence will have a positive influence on customers’ behavioral intention to use
e-government services.
Facilitating Condition
Facilitating condition is definedas “…the degree to which an individual believes that
organizational supportand technical infrastructure exists to support the use of e-government
systems” (Venkatesh et al., 2003). Facilitating condition is made up of perceived behavioral
control from TPB/DTPB and C-TAM-TPB models, facilitating conditions from MPCU and
compatibility from the IDT model. The response of customers on the customers' ability to access
online government services, the availability of technical staff to serve customers requests,
availability of necessary resources such as reliable internet connection, and other enabling
conditionsare used to measure facilitating condition construct.
The analysis of Venkatesh et al., (2003) showed, facilitating conditions to be insignificant due to
the presence of effort expectancy construct. If an e-government system is designed to be easy to
use, then, it reduces the need for help and assistance from government staff. However, in the
modified UTAUT 2 Venkatesh et al., (2012), facilitating conditions construct was found to be
significant, even though it was moderated by gender and age. (Adefris, 2018; Samsudeen, 2013)

Page 32
were unable to confirm the positive and significant relation between FC and BI. Therefore, this
study formulated the following hypothesis:
H4: Facilitating condition will have a positive influence on customers’ behavioral intention to
use e-government services.
In the proposed model, the facilitating condition is modeled to haverelationships with two
dependent variables behavioral intention and use behavior. Alshehri (2012) confirmed
facilitating conditions has a significant effect on the customers' use behavior. Similarly,
(AlAwadhi & Morris, 2008; Mansoori, 2017) and the analysis result of (Adefris, 2018) showed a
significant and positive relationship between facilitating condition and use behavior. Thus, this
study comesup with the following hypothesis,
H5: Facilitating conditions have a positive influence on the use of e-government services.
Trust
Trust construct has not been part of the original UTAUT model. However,many suggested trust
in an online serviceis relevant for e-government adoption (Albesher, 2015; Alomari, 2010;
ElKheshin, 2016; Mansoori, 2017; Mutawa, 2013). The adoption of online government services
relies on customers' trust in the electronic channel the service delivered through and the provider
of the services or the government. The role of trust in e-services adoption has been studied by
incorporating the variable with different models including UTAUT (Alshehri, 2012; Gupta &
Bhaskar, 2016; Mansoori, 2017), TAM (Alomari, 2010; Carter & Weerakkody, 2008;
ElKheshin, 2016) and some others.
The feeling of being monitored by the internet and the fear of losing personal information and
documents as well as the lack of assurance in the capability of the government to meet citizens'
needs regarding e-government aresome of the hindering issues to adopt e-government. The
assurance of trust in online government services could encourage customers to make use of e-
government systems. Thus, it is necessary to make sure customers’ information, documents and
privacy are secured enough.
Studyon trust and risk in e-government by Carter& Bélanger (2005), suggested trustworthiness is
a potential predictor of customers' intention to use e-government. similarily Balmi (2016),
studied the impact of quality antecedents on individual tax payer’s adoption of E-Filing in India,
he found out trust as one of the constructs that influence the adoption of the e-Filling system.

Page 33
This study categorized trust into two constructs: trust in the internet (TNET) and trust in
government (TGOV). Trust in government represents customers' trust in the entity providing the
service. While trust in the internet represents customers' trust in the channel through which the
service is delivered. According to Al-khattab (2015) and Carter & Belanger (2008), trust in the
governmentis“the integrity and competence of the government departments and agencies
perceived by its customers”. TGOV construct measures customers' perception ofthe capability of
government departments to provide quality services that could fulfill customers' needs. Mansoori
(2017), in his thesis work confirmes trust in the government is significant to predict e-
government adoption in UAE. The analysis of a Ph.D. work by ElKheshin (2016) in Egypt,
confirmed government trust determines the rate of adoption from responses of Egyptian society.
Trust in the internetis defined as “An individual’s perception of the institutional environment,
including the parameters and directives that make an environment feel safein sharing personal
information and documents” (McKnight, 2002). The TNET construct is constructed with
questions that capture customers' opinions on how they feel whenever they send information,
document, and other sensitive personal files to the Ethiopian national e-services portal. In a study
by Mansoori(2017) which modified UTAUT by adding two trust constructs indicated, trust in the
internet is an influential factor for e-government services adoption in the UAE. In another
research by ElKheshin (2016), supported the relationship between trust in the internet and e-
government adoption is positive and significant. Ethiopia is one of those countries who face
several challenges to develop and implement laws, rules, and regulations for governing issues
related to ICT legal and regulatory framework, public key infrastructure (PKI), cybersecurity,
etc. therefore this study hypothesizes:
H6: Trust in the government will have a positive influence on customers’ behavioral intention
to use e-government services.
H7: Trust in the internet will have a positive influence on customers’ behavioral intention to
use e-government services.
Website Quality
Government web portals allow the government to interact with its citizens. Website quality is
defined as“theuser’s evaluation of the website’s features that meet the user’s needs and reflects
the overall excellence of the website”.

Page 34
In this study, website quality construct is designed to capture the concept of web portal
availability, information quality, content quality, and design. Availability shows the probability
of the system is ready to respond to customers' needs and requests at a specific time (Alateyah,
Crowder, & Wills, 2013). Their study also revealed system availability positively influences
customers' intention. System quality is also another important aspect of government web portal
adoption and success. In Thailand e-government portal adoption research by (Wang et al., 2005),
identified four characteristics of system quality: functionality, reliability, usability, and
efficiency. The analysis result later confirmed all of the characteristics of system quality are the
determinant factor of e-government adoption.
ElKheshin (2016) analysis proved, a government web portal which contains well-presented
information and content possesses a higher chance to be utilized by customers for future
interaction. Kumar et al., (2007) emphasized the design of the government web portal should be
given priority. Manhas (2015) analyzed the website design of 10 government websites in India
by taking page size, composition, and download time evaluation parameters. He noticed
customers get satisfaction in their actual interaction with the government web portal, the
government has to make websites that are easy to use and accessible to all customers. Further, a
good website design enables users to get information and services quickly, with good
presentation, and easy navigation.
In (Alshehri, 2012; Hanna & Zawaideh, 2017) study, the finding showed the relationship
between website quality and customer intention was strong and its influence was the strongest
compared to other constructs in the model. Alomari (2014), in the adoption of e-government by
Jordanian citizens, website design was a significant factor. Similarily, (Alateyah, Crowder, &
Wills, 2012) in their research identified website design affects the intention of Saudi citizens to
adopt e-government services. Gilbert & Balestrini (2004) argues, attractive website design
enhances consumers’ willingness to accept and adopt e-government services. A survey on trends
and developments in the use of electronic services for taxpayers' service delivery by (OECD,
2010), participants suggested the online system to have the look and feel like the paper they fill
manually and the content should use the same language as the paper form.
Zeleke (2018), in his study,come across three usability features: content, appearance, and
navigation to ask users if the Ethiopian e-government portal meets their expectation. The overall

Page 35
response from participants of the study indicated the majority of the respondents are not satisfied
with the current Ethiopian government web portal's content, look, and appearance. Based on
evaluation using web content accessibility guidelines (WCAG) and world wide web consortium
(W3C), the finding of the research showed government web portals in Ethiopia have many
accessibilities and usability issues. These websites’ didn’t follow standardized e-government
website design procedures. The researcher also reported Ethiopia's e-government websites to
have a poor appearance and holds content and information that needs a regular update.
It was found that Saudi Arabians struggle to adopt e-services as the portals are designed
predominately in English to satisfy the demands of users from other western countries (Mutawa,
2013). In similar research by Bwalya (2009), most of the Zambian government web portals are
designed and presented with the English language thus leads to Zambia and pointed out as the
main barrier for low rate adoption.
This study argues, for customers to make continual use of online services, the government web
portal should meet the different attributes of web portal quality such as availability, system
quality, information, and content quality and design. Thus research hypothesizes:
H8: Website quality will have a positive influence on customers’ behavioral intention to use e-
government services.
Awareness
Awareness factor can be defined as “the degree to which users are aware of e-government
services and its potential” (Alghamdi, 2016). In a developing country like Ethiopia, where e-
government is in the early stage of implementation, Jaruwachirathanakul & Fink (2006)
suggested information and knowledge about services that are provided online and the benefits of
using these systems has great potential to enhance customers motivation to use e-government.
During the first e-government implementation plan, the Ethiopian government intended around
70% of its citizens to be aware of e-government (e-gov, 2013). However, as indicated in a
document in electronic government implementation plan II, e-gov (2016), lack of public
awareness is identified as one of the reasons for the low-level adoption of e-services in Ethiopia.
Customers who are aware of e-government, its benefits and advantages are more likely to use
and adopt e-government systems. Extant literature reported a lack of awareness as the major
reasons for the low rate of adoption (Alghamdi, 2016; Alshehri, 2012; Gupta & Bhaskar, 2016).

Page 36
It has been suggested that awareness created by the government to the general public would
enhance the likelihood of online services adoption. Besides, benefit all government ministries
and agencies and contributes to successful implementation.
Alsaif (2013), amended UTAUT by adding awareness construct as one of the variables that
affect customers' behavioral intention to adopt e-government services and later confirmed its
impact through responses from research participants'. Gupta& Bhaskar (2016) indicated
awareness is the challenge the Indian government face to make successful implementation of e-
government. Adefris (2018) discovered awareness of online services as a significant determinant
of adoption in Ethiopia. Thus, this study hypothesizes:
H9: Awareness will positively influence the behavioral intention of customers’ to use e-
government services.
Behavioral Intention
Behavioral intention refers to “a person’s subjective probability that he/she will perform some
behavior” (MartinFishbein& Icek, 1975). According to the technology acceptance model, TAM,
behavioral intention shows the actual use of a given IS system and therefore determines
technology acceptance and adoption. Ajzen (1991), states the intention variable captures the
motivational factor that influences an individual’s actual behavior. Intentions indicate
theindividuals' willingness to tryout the technology and how much effort they put on to perform
a specific behavior.
Venkatesh et al., (2003) theorized individual intention has a significant and positive effect on use
behavior. In TPB,intentionis determined by the attitude of usage, perceived behavioral control,
and subjective norm. While in the TAM model, attitude towards use determines behavioral
intention. A higher degree of individuals behavioral intention indicates a greater probabilityofthe
individual to perform a specific task. in the proposed model, performance expectancy, effort
expectancy, social influence, and facilitating conditionsare designed to predict an individual’s
behavioral intention. Whereas, BI also is modeled to have a direct effect on use behavior.
H10: Behavioral intention will have a positive influence on the use of e-government services.

Page 37
3.2 Proposed Model for E-Government Services Adoption in Ethiopia
In a country like Ethiopia where e-government and its services are considered new technology,
to examine reasons behind the low-level response to e-government and its services are very
important. Thus, the current study aims to adapt and modify a conceptual model to investigate
factors influencing the customers’ adoption of e-government services in Ethiopia. To do so, the
original UTAUT model is modified by incorporating four constructs.
The UTAUT model consists of 4 independent variables, performance expectancy, effort
expectancy, social influence, and facilitating condition. Behavioral intention and use behavior
are dependent variables. However, the proposed model consists of eight independent variables
which include four variables from the original UTAUT and the other four variables: website
quality, awareness, trust in the internet, and trust in government.
Venkatesh et al., (2003) model consist of four moderate variables gender, age, experience, and
voluntariness. The proposed model in this study doesn’t include the influence of moderator
factors. Therefore, PE, EE, SI, FC, WQ, AW, TNET, and TGOV are hypothesized to directly
influence customer BI. FC and BI are modeled to have a direct influence on customers' use
behavior USE. Generally, from the proposed model, ten hypotheses are generated and are
summarised as follow:
H1: Performance expectancy will have a positive influence on behavioral intention to use e-
government services.
H2: Effort expectancy will have a positive influence on customers’ behavioral intention to use
e-government services.
H3: Social influence will have a positive influence on customers’ behavioral intention to use
e-government services.
H4: Facilitating condition will have a positive influence on customers’ behavioral intention to
use e-government services.
H5:Facilitating condition will have a positive influence on the use of e-government services.
H6: Trust in the internet will have a positive influence on customers’ behavioral intention to
use e-government services.

Page 38
H7: Trust in government will have a positive influence on customers’ behavioral intention to
use e-government services.
H8: Website quality will have a positive influence on customers’ behavioral intention to use e-
government services.
H9:Awareness will have a positive influence on customers’ behavioral intention to use e-
government services.
H10: Behavioral intention will have a positive influence on the use of e-government services.
Figure 6: E-Government Services Adoption Model
Adopted from (Venkatesh et al., 2003)
3.3 Research Methodology
The objective of this study is to test the research model based on responses from selected
customers of three governmental offices and come up with influential factors.To achieve its
objective, the researcher needs to gather customers’ opinions on factors influencing the adoption

Page 39
of the national e-services portal, and analyze the data to find out the main influential factors
based on constructs relationship. In this case, quantitative research is more favorable. According
to Creswell (2014), quantitative research test theories by examining the relationship among
research variables. Accordingly, this study uses a quantitative method to test the modified
UTAUT by examining the relationships between study constructs and find out the main
influential factors that influence customers’ adoption in Ethiopia.
Studies conducted based on the positivist world view focuses on numerical data analysis,
measurement and are mostly hypothesis-driven. Positivists use deductive reasoning to find out
causes for an effect or outcome as they assume reality is objective therefore they study from
general to specific (Creswell, 2014). Based on the narrative above, as the main driver of this
study is hypothesis testing, this study can be categorized under the positive paradigm.
Surveys are touted to be desirable when the researcher deals with the collection of information
that reflects an individual's attitudes, behaviors, opinions, and beliefs that cannot be observed
directly (Avedian, 2014). Most of the studies in the adoption of e-governmentare filled with
survey design (Peter, Huff, & Munro, 1998). This study considers a large number of customers
from three Ethiopian governmental offices. Therefore in such cases survey designs are more
favorable as it allows the researcher to collect multiple answers at the same time from different
participants, cross-sectional survey design is selected for the studyas it allows the researcher to
collect multiple information at a specific time.
3.4 Sampling Design and Target population
The overall population of this study includes all customers who make use of the national e-
services portal to request services from 34 governmental offices. However, due to time
constraints, this study purposively selected customers of 3 government offices that make use of
the national e-services portal to interact with the Ethiopian government. The capital city Addis
Ababa is used as the setting of this study.Most of the Ethiopian government ministries and
agencies are found in the capital city. Therefore, high concentration of customers for e-
government services is found in this city.The study carefully chooses customers of the ministry
of innovation and technology, the federal transport authority, and the ministry of water and
irrigation, these offices of the Ethiopian government collectively provide more than 34 online
services to their customers.

Page 40
Even though, the overall population for conducting this study are all customers that belong to 34
Ethiopian governmental offices that utilize the national e-services portal. Most of the time
studying the whole population is difficult in terms of time constraint and manageability issues. In
such cases, sampling becomes important where a subset of units from a sample population is
studied.
The reasons for choosing three offices are described below.
1. Ministry of Innovation and Technology (MInT) is a pioneer organization responsible
for activities related to the implementation of e-government. There is a directorate by
the name “E-Government Directorate” responsible for e-government related tasks all
over the country. The ministry is the lead in service transformation activities from all
other ministries. Currently, the ministry has been fully utilizing the national e-
services portal to provide its customers with more than 5 online services including
the provision of licensing services for installation and maintenance of cable, wireless
local loop exchange and maintenance of terminal equipment in telecommunication
service, issuance of ICT company certificate for professional competency, provision
of telecommunication resale services, provision of telecommunication value-added
services license (VAS) and provision of satellite television receive-only (TVRO)
license.
2. Federal Transport Authority (FTA) is another government office that made more
than 18 services online including the issuance of the vehicle import permit,issuance
of the cross border for freight trucks, issuance of competency assurance for garage
service, public transport competence assurance licensing, and others. This office is
the most crowded office that serves a significant number of visitors who apply for
various services daily that makes it worthy to be included in this study.
3. Ministry of Water and Irrigation is the third government office that is selected for
this study. The ministry uses a national e-services portal to reach customers who
need its services related to registration, renewal, upgrading and returning of
professional and company license competency certificate. The ministry made more
than 11 online services available to its customers.

Page 41
For the current study, three Ethiopian governmental offices are selected for the above-mentioned
reason, while, survey participants are selected based on their availability in selected offices
during the specified period of data collection. Thus depending on the nature of the research, the
study employed a convenient sampling technique where customers’ availability is taken as the
major criteria to collect customers’ opinions on influential factors in e-governmentadoption.Even
if the current study assesses customers’ opinions through 3 governmental offices due to the
similar nature of the services, findings of this research are likely to represent other customers
from other Ethiopian government offices which are not directly included in this study.
Smart-PLS is appreciated for its ability to handle smaller sample size however, in most cases
small sample sizes raises the question on the research generalizability. Therefore, the estimation
of a sufficient sample size is key to make the research findings generalizable to the whole
population and in other contexts too. (Chin, 1998; Henseler & Ringle, 2009), suggested minimal
sample size must be 10 times larger than blocks with the largest number of formative indicators
in the model or the maximum number of independent (exogenous) LVs directed towards
(impacting) the dependent (endogenous) LV. in this study model there is one block
oftheformative construct (Use) containing four formative indicators and an endogenous variable
BI impacted by eight exogenous LVs. Thus by taking the maximum of the two, we can get 8
multiplied by 10 which gives 80 sample sizes as the minimum sample size for this study.
3.5 Instrument Development The study adopted questionnaire items from different researches. Most of the research constructs
are adopted from Venkatesh’s study (Venkatesh et al., 2003). However, the other four constructs
which are not part of the original UTAUT are adopted form several works of literature including
Mansoori (2017) for trust in government and trust in internet constructs, awareness construct
questions were adopted from Alghamdi (2016) work,and website quality is adopted from
Alshehri et al., (2012). Some modification has been made on the questionnaire item to capture
the context of the study. The study tried to keep the ethical consideration of research as much as
possible. The respondents are informed that participation in the research is completely voluntary.
During the design of the survey questionnaire, the demographic section is designed not to
contain questions that are too personal such as: the respondents’ income and marital status.

Page 42
The survey questionnaire design contains two sections. The first section is designed to capture
the respondent’s demographic characteristics such as age, sex, and educational level. The second
section contains questions that capture the concept of construct and used to measure the factors
influencing the adoption of e-government services with a five-point Likert scale. The survey
questions are divided as follow: (1) multiple-choice questions for the demographic variables with
a single answer such as age, gender, education level, and internet experiences and e-government
experience (2) close-ended questions using a five-point Likert scale with endpoints that ranges
from “strongly disagree” to “strongly agree” and with a midpoint “neutral” to address
respondents' opinion on each question. In most studies, a five-point Likert scale and seven-point
Likert scale are mostly used. This study decided to make use of a five-point liker scale. The
justification for using a five-point Likert scales is for its ability to reduces respondents'
frustration (Joshi, Kale, Chandel, & Pal, 2015), this scale was also used by other e-government
researchers such as (ElKheshin, 2016; Mansoori, 2017). The questionnaire was initially
developed using the English language. However, by considering the respondents' request, the
Amharic version of the questionnaire was also prepared.
Table 2: Research Construct and their Items
# Performance Expectancy Adopted from
1 Using e-Services enables me to access government services (Venkatesh et al., 2003)
2 Using e-Services enables me to get government services
more quickly.
3 If I use e-Services, I will increase my ability to get
government services
4 Overall, using e-Services portal would increase my overall
productivity.
Effort Expectancy (Venkatesh et al., 2003)
5 By using the e-Services portal I am able to obtain
government services more easily.
6 Learning to use e-Services portal is easy.

Page 43
7 My interaction with e-Services portal is clear and
understandable.
8 Overall, I found e-Services portal easy to use.
Social Influence (Venkatesh et al., 2003)
9 My family and friends think that I should use e-Government
services to get government services
10 I will use e-Government services if the people who are
important to me used it
11 Overall, people who influence my behavior think I should
use the e-Government services
Facilitating Condition (Venkatesh et al., 2003)
12 I have the resources necessary to use e-Services portal
13 I have the knowledge necessary to use e-Services portal
14 I can get help from others when I have difficulties using e-
Services portal
15 There is a specific person or team available for help and
assistance whenever I encounter technical difficulty while
using e-Services
Behavioral Intention (Venkatesh et al., 2003)
16 I intend to continue using e-services portal to get
government services in the future
17 I will always try to use e-Services portal to get government
services.
18 Overall, I plan to continue using e- Services portal
Trust of the Internet (Mansoori, 2017)

Page 44
19 The Internet has enough safeguards to make me feel
comfortable to use e-Services.
20 I feel assured that legal and technological structures
adequately protect me from problems on the Internet.
21 I feel secure to send personal information and documents
over e-Services portal.
22 Overall, the Internet is robust and safe to use e-Government
services.
Trust of the Government (Mansoori, 2017)
23 I believe that government departments have the ability to
meet citizens needs in regards to e-Government services
24 The government can be trusted to carryout faithful online
interaction
25 I am confident that the forms I submit through e-Services
portal will be processed and not ignored
26 Overall. I trust the government
Website Quality (Alshehri et al., 2012)
27 e-Services portal looks attractive and use fonts and colors
properly
28 e-Services portal contains important content about the
services provided
29 e-Services portal has multiple language options
30 Overall, e-Services portal is always working and do not
crush
Awareness (Alghamdi, 2016)
31 I have a good knowledge of e-Government services and

Page 45
their benefits
32 The customers receiveሰ training from their government to
make the best use of e-Government services
33 Offering workshops and visual presentations about e-
Government would encourage me to attend and know more
34 Overall, I am satisfied with the current awareness
campaigns and advertisement about e-Government and its
services
Use behavior of E-Government Services (Alshehri et al., 2012)
35 I want to use e-Government services to perform my
government requests
36 I frequently use e-Government services
37 I use e-Government services regularly
38 Overall, most of my government requests are done through
e-Government services
3.6 Pilot Test
Even if there is no commonly agreed upon the sample size for pilot testing, the research
questionnaire was pre-tested through responses from 12 respondents that completed the overall
survey questionnaire. These responses were not used as part of the main analysis rather used to
check: 1) whether each survey item can be clearly understood by research participants and to
gather respondents’ feedback on items that are difficult to understand and make the proper
modification. 2) to estimate the average time required to fill the entire questionnaire. An example
of a modified survey item based on customers response is Trust in internet item 3which states “I
feel confident that encryption and other technological advancements in internet make me feel
secure to send personal information over e-Services portal” have been modified to “I feel secure
in sending personal information and documents over e-services portal”.

Page 46
3.7 Data Analysis Tools and Techniques
In the quantitative method, the researcher begins by collecting relevant data based on the
conceptual framework or model. The data collected are then going to be analyzed with the
application of statistical analysis software. This study uses two statistical analysis techniques that
are mostly employed in adoption studies: SPSS version 20 and Smart-PLS version 3 statistical
analysis software package. Respondents answer for section 1 which contains questions for
demographic variables are coded into SPSS version 20 and further analysis of these variables are
also conducted.
For hypothesis testing researchers use the most widely used analysis technique: AMOS or Smart-
PLS based on the study aim either prediction or explanation. Smart-PLS is considered an
appropriate statistical analysis tool that allows estimating models that are complex and for
studies that aim at producing predictive results (Sarstedt et al., 2017). Therefore this method is
employed to test the causal relationship between LVs in this study.

Page 47
Chapter Four
IV. Data Analysis and Discussion
Introduction
In this chapter, chapter four, the data collected from study participants are analyzed to answer
research questions presented in chapter one to provide influential factors on the adoption of e-
government service in Ethiopia from the customer’s perspective.Thus, this chapter presents a
result of demographic analysis and a detailed discussion of hypothesis testing based on the
structural equation modeling technique. The first section depicts the preparation of survey data
for statistical analysis, response rate, and respondents profile for three demographic
characteristics: gender, age, and educational background. Followed by, a brief explanation of the
concept of structural equation modeling SEM and the justification for employing the PLS-SEM
technique in this study. Then, detailed analysis of the measurement model: reliability and
validity assessment, multicollinearity test are reported. Hypothesis testing results and discussion
of the findings are presented at last.
4.1 Preparation of Survey Data for Statistical Analysis
The survey questionnaire was prepared to have two sections. The first section is dedicated to
collect respondents’demographic characteristics such as gender, age, educational background,
and e-government experience. The second section consists of questions from the modified
UTAUT model. However, before filling out the questionnaire, participants were informed about
the purpose of the study and the approximate time needed to fill the questionnaire. The contact
address of the researcher was also included in case if the respondent finds difficulties during
filling out the questionnaire paper and to communicate with the respondents who needed further
explanation. Printed questionnaire paper that consists 38 close-ended items for ten constructs
were distributed to400 customers from 3 government offices: the Ministry of innovation and
technology (MInT), Ethiopian Federal transport authority (FTA) and the Ministry of water and
irrigation.with five-point Likert scale measurement from 1 = strongly disagree; 2 = disagree; 3 =
neutral; 4 = agree to 5 = strongly agree. Overall, the questionnaire took 30 consecutive working
days or 6 weeks that starts from March 11 and ended on April 22.
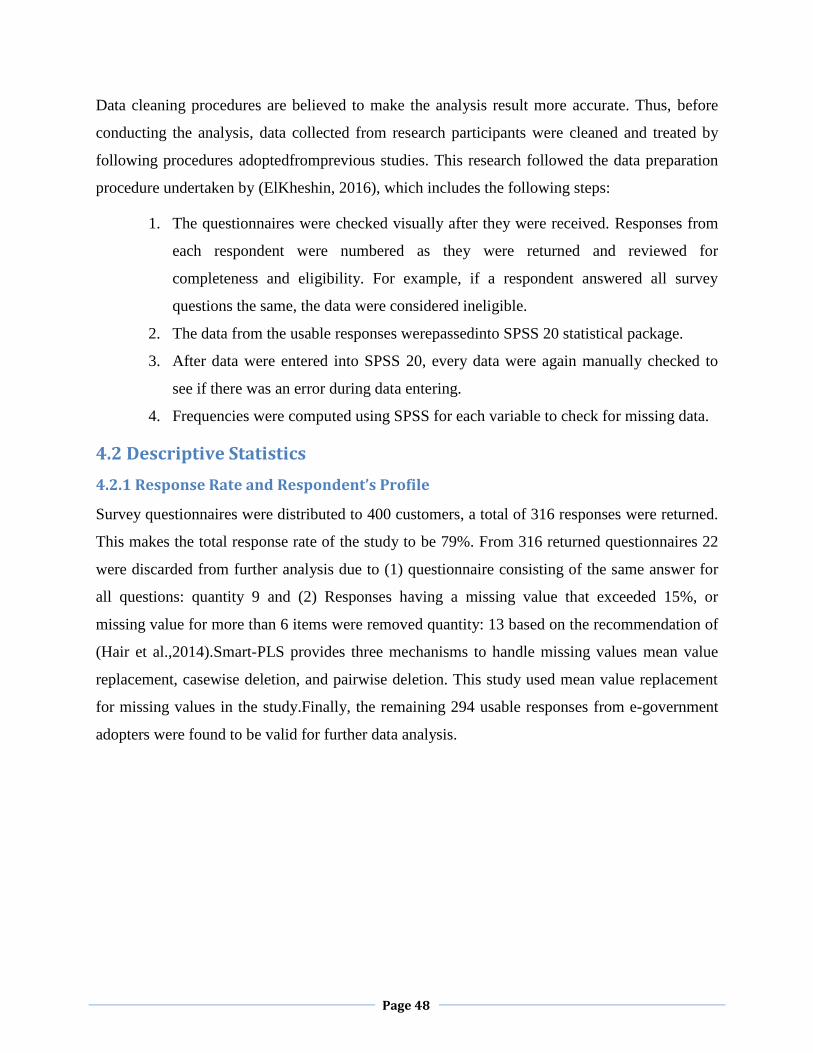
Page 48
Data cleaning procedures are believed to make the analysis result more accurate. Thus, before
conducting the analysis, data collected from research participants were cleaned and treated by
following procedures adoptedfromprevious studies. This research followed the data preparation
procedure undertaken by (ElKheshin, 2016), which includes the following steps:
1. The questionnaires were checked visually after they were received. Responses from
each respondent were numbered as they were returned and reviewed for
completeness and eligibility. For example, if a respondent answered all survey
questions the same, the data were considered ineligible.
2. The data from the usable responses werepassedinto SPSS 20 statistical package.
3. After data were entered into SPSS 20, every data were again manually checked to
see if there was an error during data entering.
4. Frequencies were computed using SPSS for each variable to check for missing data.
4.2 Descriptive Statistics
4.2.1 Response Rate and Respondent’s Profile
Survey questionnaires were distributed to 400 customers, a total of 316 responses were returned.
This makes the total response rate of the study to be 79%. From 316 returned questionnaires 22
were discarded from further analysis due to (1) questionnaire consisting of the same answer for
all questions: quantity 9 and (2) Responses having a missing value that exceeded 15%, or
missing value for more than 6 items were removed quantity: 13 based on the recommendation of
(Hair et al.,2014).Smart-PLS provides three mechanisms to handle missing values mean value
replacement, casewise deletion, and pairwise deletion. This study used mean value replacement
for missing values in the study.Finally, the remaining 294 usable responses from e-government
adopters were found to be valid for further data analysis.

Page 49
Respondents ‘Gender
Table 3: Respondents frequency per Gender
Respondents Gender
Frequency Percent Valid Percent Cumulative Percent
Valid Male 198 67.3 67.3 67.3
Female 96 32.7 32.7 100.0
Total 294 100.0 100.0
The study respondents’ gender values were represented by a value of 1 and 2 for “Male” and
“Female” respectively. As observed from Table 3, from 294 respondents, 198 (67.3%) of them
were males while 96 (32.7%) were females. This result clearly shows in Ethiopia, males utilize
e-government services more than females do. The analysis result is no surprise. Even if there is
an impressive change in women's educational participation, reports indicated that Ethiopian is a
country where women didn’t get equal opportunity to schools, and only half of the girls who
enroll in primary schools ever make it to grade 5 (Mengesha, 2001).
Respondents ‘Age
Table 4: Respondents frequency per Age
Respondents Age
Frequency Percent Valid Percent Cumulative Percent
Valid 18-29 59 20.1 20.1 20.1
30-39 133 45.2 45.2 65.3
40-49 76 25.9 25.9 91.2
over 50 26 8.8 8.8 100.0
Total 294 100.0 100.0
The study respondents’ age were categorized into four groups which ranges from [18-29], [30-
39], [40-49], and [over 50], represented by 1, 2, 3 and 4 respectively. As shown in Table 4, most
of the e-government adopters are aged between [30-39] and contribute 45.2% of the total
respondents, followed by the age group [40-49] with 25.9% and age group[18-29] with 20%.

Page 50
Respondents who are aged over 50 contribute to only 8.8% of the total respondents ‘population.
Here we can conclude that in Ethiopia, youngsters between age 18 to 39(65.3% in this study)
tend to more interact with the government using the e-services portal,
Respondents’ Educational Level
Table 5: Respondents frequency per Educational Level
Respondents Educational level
Frequency Percent Valid Percent Cumulative Percent
Valid High school or less 18 6.1 6.1 6.1
Diploma 37 12.6 12.6 18.7
Bachelor’s degree 196 66.7 66.7 85.4
Master’s degree and more 43 14.6 14.6 100.0
Total 294 100.0 100.0
Educational level is another demographic variable that is included in this study. Educational
level indicates the highest academic achievement by study participants’. Four educational levels
categories: [high school or less], [diploma], [bachelor’s degree], and [master’s degree and more]
are included in the study questionnaire and represented by values of 1, 2, 3, and4. As Table 5
shows a majority of respondents196 (66.7%) completed university 1stdegree. While 43 (14.6%)
of the respondents indicated they had completed 2nd degree or/and more. Whereas, 37 (12.6%) of
the participants completed diploma programs. Out of 294 respondents, 0nly 18 were found to
have the least educational qualification which is high school complete or less. This result
indicated e-government services are more adopted by individuals who achieved a higher
educational qualification. Individuals’ who got a chance to learn in higher educational
institutions do havemore possibility to be familiar with computers and internet technology.
At the end of the first section, respondents were asked if they have any experience in using e-
government services such as the national e-services portal to get online Ethiopian government
services. For those individuals who answered yes to the question are informed to proceed to the
next section. While for those participants who have never experienced e-government are
informed to leave the questionnaire.
Page 51
4.3 The Concept of Structural Equation Modeling (SEM)
Structural equation modeling (SEM) analysis works by integrating path analysis and factor
analysis in the analysis of a single model. In supporting this idea, Hox (1999) describes SEM as
a combination of factor analysis and regression or path analysis. SEM is an important tool to
estimate a network of causal relationships between latent variables in the research model
(Civelek, 2018). The analysis conducted based on SEM can be used to test a model, to test
formulated hypotheses, to modify the examined model, and/or to examine a set of related models
(Bollen, 2005).
Many researchers including (Hair et al., 2016; Kante, Chepken, & Oboko, 2018; Urbach &
Ahlemann, 2010), witnessed wide use of SEM techniques in information technology researches.
Venkatesh et al., (2003) used SEM particularly (PLS-SEM) to test the relationship between the
latent variable (LVs) in his research model.
The complete SEM model consists of two components: the measurement model and the
structural model. The measurement part of the model creates and examines the relationships
between the indicators or observed items and unobserved variables. While, the structural model,
create and examine a set of hypothesized relationships between more than two or more
constructs. Thus the relationships among indicators and LVs and between latent variables (LVs)
constitute the overall structural equation model.
Several techniques are out there that allow researchers to evaluate their research models. These
models are but not limited to, factor analysis, correlation analysis, regression analysis, ANOVA,
structural equation modeling, and others. However, among the other techniques, SEM becomes
most desirable due to the feature that allows it to outperform other models, which are listed
below.
1. One of the most important reasons for the widespread of SEM is its ability to be used
to test direct and indirect relationships among LVs in a single model (Civelek, 2018).
2. SEM is considered a convenient statistical analysis tool that allows simultaneous and
complete examinations of relationships when the model is complex (Sarstedt et al.,
2017). A complex model consists of relationships that a construct might act as both
dependent and independent variables according to the relationship the construct has
with other constructs in the model.

Page 52
3. SEM can be used to examine the causal relationships between latent constructs that
are measured by multiple indicators (Lei & Wu, 2007).
In this study model, the behavioral intention (BI) construct acts as dependent on itsrelationship
with PE, EE, SI, FC, WQ, AW, TNET, and TGOV. While it also acts as an independent variable
in another relationship with facilitating condition (FC) and Use behavior (USE). The facilitating
condition (FC) construct has an arrow towards both BI and USE constructs and the proposed
model consists of a total of ten where eight of them are independent and two dependent
variables.
Structural equation modeling has two techniques (1) partial least square (PLS-SEM) and (2)
covariance-based (CB-SEM). However, PLS-SEM or partialleast square SEM is regarded as the
most fully developed system (Hair et al., 2016).As a result, many researchers in information
science and system disciplines used this method to perform their analysis including (AL
Mansoori, 2017; ElKheshin, 2016; Alsheri et al.,2012).
Justifications for using PLS-SEM in this study are:
1. PLS-SEM can best analyze non-parametric data or non-normal distribution (Hair et
al., 2014).
2. PLS-SEM can be used if the model is complex with a large number of constructs and
indicators (Urbach& Ahlemann, 2010).
3. PLS-SEM can handle both reflective and formative constructs (Hair et al., 2016).
4. Formative indicators can only be analyzed using PLS-SEM (Henseler& Ringle,
2009).
5. PLS-SEM can be used when the researchers’ primary objective is prediction (Urbach
& Ahlemann, 2010; Wong, 2013).
The PLS-SEM technique is appreciated for its high performance with a smaller sample size.
(Hair et al., 2012). Chin (1998) indicated, in PLS-SEM, a minimum sample size for a model
containing an endogenous variable is ten times the number of arrows pointing towards it from an
exogenous variable or ten times the maximum number of formative indicators per construct. In
the current study, the proposed model consists of 8 exogenous variables pointing towards an
endogenous variable behavioral intention (BI) therefore a minimum of 80 samples size is
required. Even if PLS performs well with small-sized data, adequate estimation of the sample

Page 53
size is required to improve the overall estimation of the model, and to reduce standard errors
(Akter et al., 2011). Based on Wong (2013) a minimum sample size of 91 is required for a
model consisting of 10 constructs. Thus, this study exceeds the minimum requirement set by
(Hair et al., 2012; Wong, 2013).
Generally, PLS-SEM is found to be a convenient method to be used in the current study due to
(1) The study involves the use of Likert scale data that are non-parametric. (2) The proposed
model consists of ten constructs that make the model larger. (3) The model consists of both
formative and reflective indicators and formative indicators can only be analyzed using PLS-
SEM. (4) this research aims to predict the main factors influencing the adoption of e-
governmentin Ethiopia.
4.4 Structural and Measurement Model
The complete structural equation model consists of two sub-components the measurement model
and the structural model. Thus, model validation in PLS-SEM is a two-step process:
measurement model and structural model assessment. Measurement models are called outer
models, whereas structural models are called inner models. SEM consists of multiple indicators.
These indicators are either reflective or formative. The measurement model (outer model)
specifies the relationship between latent variables and their indicators, while the structural model
(inner model) specifies the relationship between latent variables (LV) (Urbach & Ahlemann,
2010).
In PLS-SEM, a variable is either exogenous or endogenous. An exogenous variable is the one
that has path or arrows pointing outwards and none leading to it and an endogenous variable has
at least one path leading to it and represents the effect of variables (Wong, 2013). In the current
study, Performance expectancy (PE), effort expectancy (EE), social influence (SI), facilitating
conditions (FC), awareness (AW), website quality (WQ), trust in the internet (TNET), and trust
in government (TGOV) are exogenous variables. while behavioral intention (BI) and use
behavior (USE) are endogenous variables. Moreover,in PLS-SEM measurement model consists
of formative and reflective indicators. All constructs in the study model are modeled with
reflective indicators except for the USE construct that is modeled with four formative indicators.
Model validation in SEM involves evaluating whether data collected from respondents support
research hypotheses in the structural model as well as in the measurement model (Urbach

Page 54
&Ahlemann, 2010). PLS-SEM doesn’t report goodness of fit as that of CB-SEM, therefore
(Chin, 1998) proposed assessment of both structural and measurement models to validate the
research model (Henseler et al., 2009; Urbach & Ahlemann, 2010; Wong, 2013).
The figure below, figure 7 is adopted from adopted (Urbach & Ahlemann, 2010), which shows
components of both the inner model (structural) and outer model (measurement). Indicators of
the latent variables are directly measured items on the questionnaire andare represented by
rectangular boxes, whilecircles in the model show latent variables.
• A Greece letter λ indicated numerical values that quantify the relationship between
indicators and their latent variables.
• A Greece letter β indicates numerical values of path coefficient that quantify the
relationship between two LVs respectively or in other words, β value indicates the
strength of the relationship between variables.
• The numbers in the circle indicate by how much the variance of the latent variable is
being explained by the other latent variables.
Figure 7: Structural Model and Measurement Model
Adopted from (Urbach & Ahlemann, 2010).

Page 55
4.4.1 Measurement Model Assessment
The measurement model determines the relationship between the observable indicator variables
and the LVs (Urbach & Ahlemann, 2010). In the measurement model indicators are either
formative or reflective. Formative indicators are the one which forms the construct. These
indicators are considered “cause” of the latent variables. While, reflective indicators are
considered as the “effect” of the latent variables, as these variables are caused by LVs. The
measurement model employs an assessment of reflective and formative measurement models.
The proposed model in this study consists of both reflective and formative models. Following
guidelines developed by (Wong, 2013), this study reports indicator reliability, internal
consistency reliability (ICR), convergent validity and discriminant validityfor reflective
measurement model and convergent validity, collinearity and significance, and relevance of
indicator weights for formatively measured constructs.
4.4.1.1 Measurement Models for Reflective Model
In the outer (measurement) model, it is essential to assess the reliability and validity of the
research construct and its indicators. Following the guideline developed by (Wong, 2013), this
section report results of internal consistency reliability (ICR), indicators reliability, construct
validity, discriminant validity for the reflective measurement model. All the values reported are
found from the report of SmartPLS after running the PLS algorithm with the initial setting of the
Path weighting scheme, Data metric mean= 0, Var=1, Maximum iterations= 1000, with 1.0E-5
stop criterion and initial weight of 1.0.
Internal Consistency Reliability (ICR)
Internal consistency is examined by using the most widely applied measures:Composite validity
and Cronbach's alpha (α). Internal consistency reliability shows how well the indicators for
construct measures what it intends to measure. Cronbach’s alpha is explained to be the most
widely used internal consistency measure. However, it is limited by its assumption that all
indicators are equally reliable (Urbach& Ahlemann, 2010). Whereas, composite reliability
assumes all indicator loadings are not equally reliable. Therefore, it is believed to provide a more
appropriate measure of internal consistency reliability.
The rule of thumb for a construct to be reliable should beat least 0.70 in both measures (Henseler
et al., 2009; Urbach & Ahlemann, 2010; Wong, 2013). Further, Hilton et al., (2004) have

Page 56
suggested four different categories of reliability: value between (0.50 and below) indicates low
reliability, high moderate reliability (0.50-0.70), values in between (0.70- 0.90) shows high
reliability and value of (0.90 and above) shows excellent reliability. However, Sarstedt et al.,
(2017) implied higher values don’t always mean high reliability, in some cases values larger than
0.95 might be problematic, which indicates the item is redundant and identical. As can be shown
in Table 6, the research questionnaire is reliable, as both measure values for all constructs are
above the desirable value 0.7.
Table 6: Composite Reliability and Cronbach's αMeasures
Cronbach's Alpha Composite Reliability
AW 0.81 0.87
BI 0.73 0.85
EE 0.71 0.82
FC 0.88 0.92
PE 0.81 0.87
SI 0.79 0.85
TGOV 0.79 0.87
TNET 0.82 0.86
WQ 0.87 0.91
Indicator Reliability
Urbach & Ahlemann (2010), explained indicator reliability shows the extent to which a variable
or set of variables is consistent regarding what it intends to measure. In PLS-SEM indicators
reliability is reported using indicators loading or outer loadings ( Hair et al., 2011; Wong, 2013).
Indicator loadings are values that show a correlation between the indicators and LV.
A Greece letter λ indicates numerical values that quantify the relationship between indicators and
their latent variables. Generally, it is postulated that an LV should explain at least 50 percent of
each indicator’s variance. Thus, indicator loadings are significant at a minimum value of λ= 0.50
and with a preferred value of λ > 0.70 (Hair et al., 2016; Wong, 2013).

Page 57
As shown in Table 7 below, most of the indicator items outer loading have individual indicator
reliability values that are higher than the preferred value of 0.7, except for two indicators: the
third item of effort expectancy (EE03) with 0.46 and the first item of trust in internet construct
(TNET01) with 0.55. Accordingly, (Hair et al., 2018) recommends an indicator with loading
below 0.5 should be discarded. Thus EE03 has been removed from further analysis due to low
loading value that is far below the desired 0.70 value.dings for reflective indicators
Table 7 : Reliability and Validity measures with Factor loadings for reflective indicators
Latent
variable
Indicators Outer
loading (λ)
Composite
reliability (ICR)
Convergent
validity (AVE)
Discriminant
validity
(square root
of AVE)
AW AW01 0.79
AW02 0.85
AW03 0.79
AW04 0.74 0.87 0.63 0.79
BI BI01 0.76
BI02 0.82
BI03 0.84 0.85 0.65 0.81
EE EE01 0.82
EE02 0.83
EE03 0.46*
EE04 0.78 0.82 0.54**(0.68) 0.74
FC FC01 0.87
FC02 0.90
FC03 0.88
FC04 0.79 0.92 0.74 0.86

Page 58
PE PE01 0.81
PE02 0.86
PE03 0.80
PE04 0.71 0.87 0.63 0.80
SI SI01 0.86
SI02 0.71
SI03 0.85 0.85 0.65 0.81
TGOV TGOV01 0.85
TGOV02 0.79
TGOV03 0.78
TGOV04 0.72 0.86 0.62 0.79
TNET TNET01 0.55*
TNET02 0.74
TNET03 0.91
TNET04 0.88 0.86 0.62 0.78
WQ WQ01 0.80
WQ02 0.93
WQ03 0.90
WQ04 0.77 0.91 0.73 0.85
*Shows a low loading factor below the preferred value (0.7) and ** show AVE score below 0.6.
Convergent validity
Convergent validity involves the degree to which individual items reflecting a construct
converge in comparison to items measuring different constructs (Urbach & Ahlemann, 2010).
The most commonly applied criterion for convergent validity is the average variance extracted
(AVE). On average, the latent variable isexpected to explain more than half of the variance in its

Page 59
indicators (Henseler et al., 2009; Wong, 2013). In this study, most of the indicators were
borrowed from previous studies that have already been tested for theirvalidity.The third item of
effort expectancy is found to be thereason for the lowest AVE scores of 0.54. Thus it was
removed from further analysis.After removing the indicator EE03, AVE values for effort
expectancy construct show substantial improvement to 0.68. Henseler et al (2009) indicated
researchers should be careful towards eliminating an indicator from a construct and stated an
indicator should be eliminated if the elimination of that indicator could bring significant change
invalues of composite reliability and average variance extracted. Even if TNET01 has a loading
of 0.55, it was kept in the model due to the AVE score of 0.62 and its indicator reliability 0.86 is
significantly above threshold values for both measures.
Discriminant Validity
Discriminant validity assessment becomes essential and common practice for validity
examination in structural equation modeling (SEM). It involves the degree to which the measures
of different constructs differ from one another (Urbach & Ahlemann, 2010).Thus it makes sure
an item does not unintentionally measure another construct. There are two methods to ensure the
existence of discriminant validity in a research model.
The first method for assessing the existence of discriminant validity is throughFornell and
Larcker (1981) criterion as cited in (Urbach & Ahlemann, 2010; Wong, 2013). Fornell–Larcker
method assesses discriminant validity at the construct level(Henseler et al., 2009).In this method,
discriminant validity is examined by comparing the square root of AVE with correlation values
between corresponding LVs. Thus a construct should have the square root of AVE greater than
the correlation between any of the corresponding latent variables. Wong (2013) explained the
square root of AVE should be greater than all correlation values for the construct. As shown in
Tables 8below,all AVE values for each construct are greater than correlation values (values in
bold). Therefore it confirms the existence of discriminant validity.

Page 60
Table 8: AVE, Correlations and Square root of AVE's
AVE AW BI EE FC PE SI TGOV TNET USE WQ
AW 0.63 0.79
BI 0.65 0.58 0.81
EE 0.68 0.42 0.54 0.82
FC 0.74 0.36 0.43 0.46 0.86
PE 0.63 0.15 0.44 0.25 0.31 0.80
SI 0.65 0.21 0.12 0.01 -0.13 0.00 0.81
TGOV 0.62 0.42 0.54 0.55 0.52 0.36 0.00 0.79
TNET 0.62 0.42 0.23 0.32 0.13 0.22 0.15 0.27 0.78
USE 0.00 0.31 0.41 0.46 0.57 0.36 0.02 0.52 0.16
WQ 0.73 0.39 0.66 0.38 0.24 0.28 0.11 0.36 0.08 0.24 0.85
The second method to assure the existence of discriminant validity is a cross-loading method.
Cross-loading is an alternative method to examine discriminant validity at an indicator level
(Henseler et al., 2009). In the cross-loadings method, an indicator is expected to have the highest
score for its latent variable than any other construct. Smart-PLS reports all the correlation results.
Thus the highest correlation, in this case loading above 0.70 for each indicator is highlighted for
display purpose.
As Table 9 shows, the heading of the table column contains the name of the construct and the
row contains items for each construct. The result (highlighted cells) indicated that most of the
items load the highest to their expected construct than any other construct which confirmed
discriminant validity is also achieved at the level of an indicator. Overall, it can be said that
discriminant validity was assured in this study at the construct level with Fornell–Larcker
method and indicators level with cross-loadings.

Page 61
Table 9: Loadings and Cross-loadings for the reflective model
AW BI EE FC PE SI TGOV TNET WQ
AW01 0.79 0.27 0.28 0.21 0.06 0.24 0.21 0.34 0.16
AW02 0.85 0.39 0.22 0.27 -0.02 0.2 0.22 0.38 0.17
AW03 0.79 0.4 0.26 0.2 0.08 0.26 0.18 0.33 0.19
AW04 0.74 0.61 0.47 0.39 0.26 0.05 0.56 0.28 0.54
BI01 0.35 0.76 0.42 0.26 0.26 0.1 0.36 0.08 0.7
BI02 0.48 0.82 0.45 0.46 0.39 0.01 0.49 0.12 0.39
BI03 0.56 0.84 0.45 0.3 0.41 0.19 0.47 0.33 0.53
EE01 0.31 0.49 0.83 0.41 0.15 -0.05 0.55 0.22 0.33
EE02 0.4 0.39 0.85 0.27 0.16 -0.01 0.39 0.28 0.29
EE04 0.34 0.45 0.79 0.45 0.29 0.08 0.4 0.29 0.31
FC01 0.28 0.33 0.4 0.87 0.33 -0.02 0.43 0.05 0.19
FC02 0.32 0.35 0.38 0.9 0.31 -0.03 0.5 0.18 0.19
FC03 0.33 0.46 0.38 0.88 0.27 -0.25 0.48 0.09 0.25
FC04 0.32 0.33 0.44 0.79 0.15 -0.14 0.37 0.13 0.18
PE01 0.1 0.35 0.25 0.27 0.81 -0.02 0.31 0.18 0.28
PE02 0.2 0.41 0.23 0.28 0.86 0.06 0.32 0.27 0.22
PE03 0.1 0.34 0.15 0.12 0.8 -0.01 0.25 0.1 0.2
PE04 0.07 0.28 0.14 0.33 0.71 -0.07 0.25 0.13 0.18
SI01 0.24 0.1 -0.03 0.06 0.08 0.86 0.04 0.18 0.06
SI02 0.04 0 -0.02 -0.2 0.06 0.71 -0.07 -0.01 -0.03
Si03 0.13 0.1 0.04 -0.28 -0.09 0.85 -0.04 0.08 0.13
TGOV01 0.37 0.5 0.49 0.45 0.31 0.04 0.85 0.25 0.29
TGOV02 0.24 0.4 0.46 0.27 0.27 -0.02 0.79 0.15 0.24
TGOV03 0.45 0.41 0.32 0.33 0.23 0.01 0.78 0.24 0.34
TGOV04 0.27 0.39 0.45 0.59 0.32 -0.06 0.72 0.18 0.27
TNET01 0.07 0.01 0.15 -0.04 0.3 0.03 0.1 0.55 -0.05
TNET02 0.27 0.09 0.22 0.1 0.17 0.06 0.22 0.74 0.08
TNET03 0.43 0.24 0.22 0.07 0.16 0.2 0.2 0.91 0.07
TNET04 0.32 0.2 0.38 0.18 0.22 0.08 0.28 0.88 0.07
WQ01 0.34 0.58 0.41 0.22 0.25 0.16 0.41 0.16 0.8
WQ02 0.39 0.62 0.33 0.21 0.22 0.07 0.29 0.12 0.93
WQ03 0.37 0.14 0.36 0.21 0.2 0.11 0.29 0.04 0.9
WQ04 0.19 0.46 0.15 0.15 0.31 0.02 0.24 -0.09 0.77

Page 62
4.4.1.2 Measurement Models for Formative Model
One of the major reasons for the application of Smart-PLS in this study is its ability to deal with
formative construct and its indicators. Several researchers agree formative models should be
treated differently than that ofareflective model (Henseler et al., 2009; Urbach & Ahlemann,
2010; Wong, 2013). In contrast to the reflective model, in a formativemodel, the causal
relationship is directed from the formative indicator to the LV. As a result, any change in the
indicator can impact the latent variable.
A formative construct is a collective result of its indicators (Urbach & Ahlemann, 2010). Thus,
indicators in a formative construct are not expected to correlate. Therefore, assessing ordinary
reliability and convergent validity for an LV made of uncorrelated items is meaningless(Wong,
2013). Most commonly reported measures forformative indicator validity areouter weights and
their significance through bootstrapping, construct validity, and multicollinearity (Garson, 2016;
Henseler et al., 2009; Urbach & Ahlemann, 2010; Wong, 2013).
Outer Model Weights and Significance
Formative indicators validity needs to be examined to check whether a particular indicator is
relevant for the construction of an LV. Henseler et al (2009), recommends a researcher should
assess the validity of the formative model at the indicator and construct level. To check for
indicators' significance, bootstrapping is applied in most cases. The weight of an outer
modelissignificantatat-value of 1.96 at a significance level of 95%. while the value of 1.65 is for
a 90% significance level. Therefore, bootstrapping algorithm was run for a factor weighting
scheme with no significant changes, 294 cases, and 1000 re-samples settings. As shown in Table
10, t-values for USE01 and USE04 except USE02 and USE03 are found to be significant. Wong
(2013), recommends one should check for indicators loading before removing formative
indicators. Thus a value of 10.4 and 5.04 respectively, allows them to be kept in the model.

Page 63
Table 10: outer model weights with corresponding T-Values
Original
Sample (O)
Sample Mean
(M)
Standard
Deviation
(STDEV)
T Statistics
(|O/STDEV|)
USE01 -> USE 0.38 0.36 0.17 *2.30
USE02 -> USE 0.12 0.13 0.13 **0.91(10.4)
USE03 -> USE -0.02 -0.03 0.07 **0.33(5.04)
USE04 -> USE 0.66 0.66 0.12 **5.30
* Significance at 0.05 and ** significance at 0.001.
Construct Validity
Construct validity for the formative model can be examined through discriminant validity.
Mackenzie et al. as cited in (Urbach & Ahlemann, 2010) stated the correlation between the
formative and all other constructs should be less than 0.70. As shown in Table 8, the correlation
between formative construct and other constructs in the study are much less than the
recommended value and ranges from 0.02 – 0.57, which shows that the constructs differ
sufficiently from one another.
Multicollinearity
Multicollinearity exists when two or more variables are inter-correlated (Garson, 2016).
Variance inflation factor (VIF) or/and tolerance values are used to assess the degree of
multicollinearity among formative indicators (Henseler et al., 2009). The VIF values indicate
how much of an indicator's variance is explained by the other indicators of the same construct
(Urbach & Ahlemann, 2010). Collinearity assessment involves using regression to compute the
variance inflation factor (VIF) for each indicator in the formative model. (Wong,
2013)recommends VIF values < 5 and tolerance value > 0.2 are desirable to indicate the
indicator doesn’t contain redundant information. This study used the SPSS software regression
method to report the variance inflation factor (VIF) and tolerance values. As it can be seen from
Table 11, the VIF value for formative indicators ranges from 1.25-2.36 and the corresponding
tolerance values for all indicators are also above 0.2, which ranges from 0.42- 0.79. Indicating no
collinearity problem is found between formative indicators.

Page 64
Table 11: Collinearity (VIF/Tolerance) for formative indicators
Coefficients*
Model Unstandardized
Coefficients
Standardized
Coefficients
T Sig. Collinearity
Statistics
B Std. Error Beta Tolerance VIF
1 (Constant) 1.935 .215 9.003 .000
USE01 .148 .074 .162 1.998 .047 .423 2.366
USE02 .183 .067 .218 2.729 .007 .433 2.308
USE03 -.090 .045 -.118 1.991 .047 .795 1.257
USE04 .175 .063 .182 2.765 .006 .639 1.566
*. Dependent Variable: BI
Furthermore, a similar multicollinearity test was conducted for all constructs in the model. As
shown in Table 11 and 12, VIF values of all endogenous and exogenous constructs, the result
indicates no collinearity issue for all constructs in the model as their VIF value is below 5 and
tolerance is well above 0.2.
Table 12: Collinearity (VIF/Tolerance) for the inner model**
Coefficients**

Page 65
Model Unstandardized
Coefficients
Standardized
Coefficients
T Sig. Collinearity Statistics
B Std. Error Beta Tolerance VIF
1 (Constant) -.388 .204 -1.89 .059
PE .195 .037 .207 5.26 .000 .762 1.31
EE .188 .050 .169 3.76 .000 .588 1.70
SI .028 .034 .030 .840 .402 .898 1.11
FC .041 .042 .044 .988 .324 .605 1.65
WQ .409 .038 .425 10.77 .000 .758 1.31
AW .252 .044 .243 5.77 .000 .663 1.50
TNET -.087 .040 -.085 -2.17 .030 .766 1.30
TGOV .130 .045 .132 2.90 .004 .571 1.75
**. Dependent Variable: BI
Table 13: Collinearity (VIF/Tolerance) for the inner model***
Coefficients***
Model Unstandardized
Coefficients
Standardized
Coefficients
T Sig. Collinearity
Statistics
B Std. Error Beta Tolerance VIF
1 (Constant) 1.77 0.18 9.76 0.00
FC 0.36 0.47 0.42 7.68 0.00 0.82 1.21
BI 0.18 0.50 0.19 3.63 0.00 0.82 1.21
***. Dependent Variable: USE

Page 66
4.4.2 Structural Model Assessment
Once a researcher successfully completed the assessment of the outer or measurement model, the
next step is to evaluate the structural model,thestructural model evaluation focuses on testing the
relationship between research constructs. In this study, the main emphasis of structural model
assessment focuses on path testing between exogenous and endogenous variables inorderto make
decisions about hypotheses presented earlier in chapter 3. In figure 8 below, rectangular boxes,
colored yellow: represent observable indicators and is part of the outer model. While, circles,
colored blue are study constructs and are part of the inner model.
Determination coefficient (R2)
The first step in PLS-SEM structural or inner model assessment is to analyze the coefficient of
determination R2. To check how well the proposed model performed, the causal relationship
between the endogenous and exogenous LVs was measured using R2. Chin (1998), specified
three categories for R2 value of 0.67 and above categorized as substantial, value round 0.33 as
average or moderate 0.19, and below as weak. R2 result shows how much does an endogenous
variable is explained by its exogenous variable. Thus the higher R2 values, the more desirable it
is. As is shown in figure 8 below, R2 for behavioral intention (BI) is 0.67, while it is 0.35 for the
other endogenous LV Use.
This result indicates 67% of the variance in BI is explained by eight exogenous variables
included in the research model. based on Chin (1998), this result can be categorized under
“substantial” or (significant) level. While two variables BI and FC explains around 35% of the
variance in endogenous latent variable USE, this result can be categorized under “average” or
moderate range.Generally, it can be said that the proposed model containing eight exogenous
(predictor) variables performed well in explaining the variance in Behavioral Intention (BI) with
R2 of 67%, this result is very near to Venkatesh et al., (2003) study, who had foundR2 value of
70% for behavioral intention. However, the proposed model was found to moderately explain
variance in user behavior with 35%.

Page 67
Figure 8: Structural and Measurement Model for the Proposed Research Model
Path coefficient Assessment
Estimation of path coefficient β is used to test the strength of the relationship or connection
between exogenous and endogenous variables. Path coefficients of the PLS structural model can
be interpreted as standardized beta coefficients of ordinary least squares regressions (Henseler et
al., 2009).AsUrbach& Ahlemann (2010) stated, path coefficient β result should be checked for
its algebraic sign, magnitude, and significance. While the algebraic signs of path coefficient
indicate the agreement between the initial theoretical assumption of the study and the actual
empirical result. The magnitude of path coefficient β shows the strength of the causal
relationship between variables; this value ranges between -1 to 1. A value closer to 1 shows a
strong relationship between LVs, while a value closer to 0 indicates weak relation. Moreover, for
the hypothesized relationships to be supported,using a two-tailed t-test with a significance result
at 0.05 level, a t-value of 1.96 is acceptable (Henseler et al., 2009; Wong, 2013).

Page 68
P-Value
The use of p-value for hypothesis testing has become a common approach in diverse fields. Kock
(2015), confirmed use of p-value and confidence interval brings similar results for hypothesis
testing. P-value is a value between 0-1 and it is employed to determine the significance of the
hypothesis. An independent variable having a smaller p-value tends to more influence the
dependent variable or in other words, if a variable has a larger p-value, implies lower
significance but smaller p-values imply higher significance. P-value of 0.001 shows strong
significance, p-values in between 0.001 – 0.01 shows moderate effect, and p-value between 0.01
– 0.05 show weaker significant effect between LVs. lastly, the p-value above 0.05 shows an
insignificant effect (ElKheshin, 2016). Table 14, below presents hypothesis testing results based
on t-statistics and path coefficient from the analysis result of bootstrapping.
Table 14: Path coefficients T-values, and hypothesis testing
Hypothesis Original
Sample
(O)
Sample
Mean
(M)
Standard
Deviation
(STDEV)
Path
coefficients
T Statistics
(|O/STDEV|)
P Values Hypothesis
testing
AW -> BI 0.29 0.28 0.04 0.28 7.38 0.000 Supported
BI -> USE 0.23 0.23 0.07 0.21 3.30 0.001 Supported
EE -> BI 0.17 0.16 0.04 0.17 4.05 0.000 Supported
FC -> BI 0.04 0.05 0.05 0.05 0.87 0.384 Not
supported
FC -> USE 0.46 0.47 0.07 0.48 6.29 0.000 Supported
PE -> BI 0.21 0.21 0.05 0.21 4.41 0.000 Supported
SI -> BI 0.03 0.04 0.04 0.03 0.80 0.423 Not
supported
TGOV -> BI 0.12 0.12 0.05 0.11 2.46 0.04 Supported
TNET -> BI -0.06 -0.05 0.05 -0.06 1.28 0.202 Not
supported
WQ -> BI 0.37 0.37 0.04 0.38 9.18 0.000 supported

Page 69
PE -> BI
Performance expectancy is defined as“the degree to which the customer believes that using e-
government services will help him or her to facilitate communication with the government in
terms of benefits such as: saving time and money, improving the quality of government services,
and increasing the equity between all citizens” (Alshehri et al.,2012). In the survey
questionnaire, PE was represented through four inquiries focused on customers' opinion
regarding the usefulness of the Ethiopian national e-services portal to save time, money, and
increase the overall productivity of the customer.
H1: Performance Expectancy will have a positive influence on customers’ behavioral
intention to use e-government services.
The validity of the first hypothesis has been supported with (β=0.21, p<0.001). Accordingly,
customers’ behavioral intention to use and adopt e-government services increases whenever they
perceive that online government services are useful to perform effective and efficient interaction
with the government. Thus, a customer who experiences the benefits associated with the
adoption of e-government services such as: saving time, money, and effort as well as quality
service, favors the use of online services than traditional communication. The analysis result
supports the proposed hypothesis and proved that performance expectancy is influential factor in
customers’ behavioral intention to adopt e-government services.
This result is consistent with previous local research by Adefris (2018)and international studies
including Venkatesh et al., (2003), an empirical study by Mansoori (2017), Alshehri (2012),
Alsaif (2013), and Talib et al., (2013) inIraq. Moreover, Wang et al., (2005) found out an e-
government portal that can save customers money and time and energy positively influence
adoption.
EE -> BI
Effort expectancy is“the degree of ease associated with the use of the system” (Venkatesh et al.,
2003). In the survey questionnaire, effort expectancy was represented with four items having the
concept of ease of use, learnability, and related concept of the national e-services portal.
H2: Effort Expectancy will have a positive influence on customers’ behavioral intention to use
e-government services.

Page 70
The validity of the second hypothesis was supported with (β=0.17, p<0.001). The result
indicates, if customers perceive that e-government services such as the national e-services portal
are userfriendly and less complex, motivates customers' behavioral intention to adopt e-
government. This result is in agreement with Venkatesh et al., (2003) finding that effort
expectancy variable has a positive and significant relationship with an individual's behavioral
intention to use technology. Similarly, (Gupta & Bhaskar, 2016; Mutawa, 2013) reported a lack
of user-friendliness is a major issue for low-level adoption of e-government websites. Carter &
Bélanger (2005) showed that perceived ease of use, which is one of the elements of effort
expectancy construct in UTAUT was the significant determinant of intention. Another study on
the evaluation of e-government services quality in Nigeria by Hien (2014) indicated perceived
ease of use as an important dimension for the adoption of public e-services.
SI -> BI
The social influence (SI) construct in this study is defined as “ the degree to which an individual
perceives that important others believe he or she should use e-government services” (Venkatesh
et al., 2003). Unlike other constructs in this study, social influence was represented by three
questions on customers' opinions towards the influence of their family, friends, and work
colleagues' to use e-government services.
H3: Social influence will have a positive influence on customers’ behavioral intention to use
e-government services.
The empirical result of the third hypothesis was not supported by (β=0.03, p>0.05). The result
shows that customers in Ethiopia are not influenced by their social interaction with their family,
friends, and colleagues. One possible explanation for this result could go in accordance with
Mansoori (2017) justification that the adoption of e-government services in the Ethiopian
customers is not at a high enough level that could allow information regarding the benefits and
advantages of e-government services to be diffused from e-government adopter to non-adopter.
Moreover, another explanation could be the respondents' educational background. As indicated
in Table 4 above, more than 80% of respondents possess either bachelor's, masters, or more
degree. Related justification can also found in Desta (2018) work that explains users of e-
government systems might rely on the characteristics of the system such as usefulness or ease of
use than their family, friends, and/or colleagues influence.

Page 71
Adefris (2018) found similar results on customers of ERCA online services. Talib et al., (2013)
also confirmed social influence does not affect customers' intention to use e-government
services. Moreover (Alshehri, Drew, & Alfarraj, 2012) reported social influence was found to be
non-significant to predict customers BI,
FC -> BI and FC -> USE
Facilitating condition is defined as “the degree to which an individual believes that
organizational, governmental assistance and technical infrastructure exists to support the use of
e-government services” (Venkatesh et al., 2003). In the context of this study,
customers’perception of facilitating condition construct was measured through four inquiries
focused on the customers' ability to access online government services, the availability of
technical staff to serve customers' needs, and the accessibility of necessary resources. In the
proposed model, facilitating condition is modeled to have two relations with two dependent
variables behavioral intention and use of e-government.
H4: Facilitating conditions will have a positive influence on behavioral intention to use e-
government services.
The statistical analysis result (β=0.05, p>0.05) revealed that there is no significant relationship
between FC and BI. A similar result was reported by Venkatesh et al., (2003) that facilitating
conditions was not a significant determinant of customers' behavioral intention. As a
justification, he indicated the ease of use of technology reduced the need for help and assistance
from others. In this study, most of the respondents are educated and are able to use modern
technology. Thus, these reasons could reduce their intention to request support from
governments staffs. Also (Samsudeen, 2013), confirmed the relationship between FC and BI
was not significant in his study in Sri Lanka.
H5: Facilitating conditions will have a positive influence on the use of e-government services.
For the second hypothesis, the study confirmed facilitating condition is the strongest significant
determinant of customer's use behavior with (β=0.48, p<0.001). The influence of facilitating
condition construct is found to be stronger than any other construct in the study. The result
indicates the availability of facilitating condition ssuch as the accessibility of necessary
resources, an essential skill, and the availability of assistance from the government strongly

Page 72
encourage customers to use and adopt e-government services. Similar findings are found in
Alsaif (2013), Adefris (2018), and Venkatesh et al., (2003) work indicated e-government
adoption is highly influenced by the availability of resources, skill, and other infrastructure,
technical, and technological facilitating conditions.
WQ -> BI
Web quality is “the user’s evaluation of a website’s features that meets the user’s needs and
reflects the overall excellence of the website” (Aladwani& Palvia, 2002). The website quality
variable is added to the original UTAUT model to understand its influence on Ethiopian
customer’s behavioral intention to adopt government services. Four website quality
characteristics including appearance, availability, information, and content quality and design are
used to measure website quality construct in the survey questionnaire.
H6: Website quality will have a positive influence on behavioral intention to use e-government
services.
Smart-PLS result confirmed website quality is the first major significant construct that influences
Ethiopian customers' behavioral intention to adopt e-government services with (β=0.38,
p<0.001). In this study, website quality is found to be the first strongest predictor of behavioral
intention and its impact is greater than any other construct in the proposed model except for the
facilitating condition construct. Study by Zeleke (2018), reported government websites in
Ethiopia lacks attractive appearance, and most of e-government portals content needs regular
updates. Adefris (2018), provides evidence for a positive and significant relationship between
website quality and customers' behavioral intention. Moreover, Alshehri et al. (2012) also
supported website quality plays an important role in the acceptance and adoption of e-
government services in Saudi Arabia.
AW-> BI
The Awareness construct is defined as “the degree to which users are aware of e-government
services and its potential” (Alghamdi, 2016). Customers' satisfaction from utilizing e-
government, the government effort to make customers aware of e-government and its services
and related matters are contained within the survey questionnaire.
Page 73
H7: Awareness will have a positive influence on behavioral intention to use e-government
services.
The validity of hypothesis testing using Smart-PLS shows that awareness construct is one of the
strongest determinant of e-government services adoption with (β=0.28, p<0.001). This result
suggests, once customers become aware of e-government, it's potential, and the benefits of using
online government services, there is a higher chance of adopting e-government and its services.
Alshehri (2012) suggests, awareness programs area foundation stone for the successful use of
online government services. (Adefris, 2018) confirmed, adoption of e-government services is
highly influenced by awareness construct.
TGOV-> BI
Trust in government refers to “ the integrity and competence of the government department and
agencies perceived by customers’”(Al-khattab, 2015). Trust in government construct were
represented by four items that cover the government’s trustworthiness and competency in
carrying out online transactions faithfully.
H8: Trust in government will have a positive and significant influence on customers’
behavioral intention to use e-government services.
The statistical analysis of trust in government-related questions revealed a positive and
significant result with (β=0.11, p<0.05). Grounded on customers’ responses, customers who
believe that the government department can meet their needs in online services, as well as the
trustworthiness of the government to keep their best interest are more likely to adopt online
government services. Gupta & Bhaskar (2016) find out Indians are influenced by trust in
government construct from their study on e-government services adoption in India. Similarly,
(Alghamdi, 2016b; Alsaif, 2013; ElKheshin, 2016; Mansoori, 2017) also confirmed trust in the
government to be an influential factor in customers' behavioral intention in their particular
countries.
TNET-> BI
Trust in the internet refers to“an individual’s perceptions of the institutional environment,
including the parameters and directives that make an environment feel safe to share their
personal information and documents (Mc Knight, 2002). Trust in internet construct was

Page 74
represented by four items that portray the conceptson how customers believe that technological,
legal infrastructure, encryption, and other more advanced techniques can protect their privacy
from problems on the internet.
H9: Trust in the internet will have a positive and significant influence on customers’
behavioral intention to use e-government services.
The statistical analysis result exposed trust in the internet doesn’t influence customers'
behavioral intention with (β=-0.06, p>0.05). The negative path coefficient result clash with the
initial research assumption where trust in the internet and behavioral intention has a positive and
significant relationship. Even if some studies revealed trust in the internet to beaninfluential
variable in e-government adoption, in this study, both path analysis and t-value are not strong
enough to support the research hypothesis.
Similar findings by Carter & Belanger (2004) can be used as a possible justification for the
result. Currently, most of the online government services provided by the Ethiopian government
are tasks related to issuance, renewal, and application for individual competency certificates,
value-added services, and related tasks, these activities can be completed regardless of the level
of trust the customers have on the government.
BI-> USE
Behavioral intention (BI) refers to “a person’s subjective probability that he/she will perform
some behavior” (Fishbein & Icek, 1975). In UTAUT model validation, Venkatesh et al., (2003),
discovered behavioral intention is a determinant of user behavior. In the current study, unlike
other constructs behavioral intention was measured with three questions that capture customers’
decision to utilize the e-services portal based on their previous interaction.
H10: Behavioral intention will have a significant positive influence on the use of e-
government services.
Smart-PLS statistical analysis indicated behavioral intention construct predicts the use of e-
government services with (β=0.21, p>0.001). A Ph.D. dissertation by Mansoori (2017)
confirmed the same result with the current study. Based on the analysis result, if customers had
previous experience with the national e-services portal, it impliesthatthe customer has a higher
chance to perform future transactions utilizing e-services.

Page 75
Adjusted R2, Effect size (f2), and Q-square effect (Q2)
Even if the predictor variable may have an irrelevant correlation with an endogenous latent
variable, adding a predictor exogenous variable might tend to increase the prediction ability of
theproposedmodel. Therefore, Garson(2016) suggested adjusted R2can be used to correct such
bias.
As previously described,thecoefficient of determination R2 value 0.668 was found by eight
variables that have a direct impact on BI and 0.354 for use construct found from two constructs
BI and FC. However, the adjusted R2 for behavioral intention and use behavior is0.658 and0.349
respectively, which doesn’t show a significant change from the original R2 values.
One method to assess the accuracy of the predictive model is Chone’s f2.The effect size f2 is
calculated as the increase in R2 relative to the proportion of variance of the endogenous latent
variable that remains unexplained. The f2 value of 0.02 is categorized as a small effect, 0.15 as
moderate, and over 0.35 as a strong effect (Henseler et al., 2009, Cohen, 2998). The result shown
in Table15 below, the effect size f2 values ranged from lowest 0.00 to highest 0.31, these can be
categorized from small to strong effect. Therefore, it can be concluded that dropping WQ and FC
variables from the model could bring significant change.
Table 15: Effect Size for individual exogenous LVs change on endogenous LVs
Omitting exogenous LV Original R2 value New R2 value Effect size f2
BI USE BI USE BI USE
AW 0.67 0.35 0.62 0.35 0.14 0.00
EE 0.67 0.35 0.65 0.35 0.05 0.00
FC 0.67 0.35 0.67 0.20 0.00 0.29
PE 0.67 0.35 0.64 0.35 0.10 0.00
SI 0.67 0.35 0.67 0.35 0.00 0.00
TGOV 0.67 0.35 0.66 0.35 0.02 0.00
TNET 0.67 0.35 0.67 0.35 0.01 0.00
WQ 0.67 0.35 0.57 0.35 0.31 0.00

Page 76
Another means to examine the accuracy of the predictive model is to useStone-Geisser's Q²
Sarstedt et al., (2017), Stone-Geisser'sQ² omits single points in the data matrix, imputes the
omitted elements, and estimates the model parameters using the blindfolding algorithm. The
process also continues until each data point omitted and the model is re-estimated. An omission
distance of D from 5 to 10 is recommended (Akter & Ray, 2011; Sarstedt et al., 2017).
In PLS, models predictive relevance Q2 can be calculated in two ways: cross-validated
communality and cross-validated redundancy. However, (Akter & Ray, 2011) recommend the
use of cross-validated redundancy for large models. Therefore, after running the blindfolding
algorithm with cross-validated redundancy and an arbitrary setting of omission distance 9, Q2
has been found 0.42 degree of predictive relevance regarding the endogenous LV BI. (Sarstedt et
al., 2017), indicating a value of Q² larger than zero for a particular endogenous construct
indicates that the path model’s predictive accuracy is acceptable for this particular construct.
4.5 Refined Study Model
Asitcan be seen from the findings of hypothesis testing above, behavioral intention is dependent
on performance expectancy, effort expectancy, behavioral intention, and facilitating condition
from the original UTAUT model and trust in the government, website quality, and awareness
constructs from the proposed model. However, social influence, facilitating condition, and trust
in the internet variables were found to not influence Ethiopian customers’ behavioral intention to
use e-government. The actual use of the e-government services construct is confirmed to be
influenced by both behavioral intention and facilitating condition.
The new refined model consists of a relationship between seven LVs: PE with BI, EE with BI,
TGOV with BI, WQ with BI, AW with BI, FC with Use,and BI with Use are kept in the refined
study model.

Page 77
Figure 9: Refined Research Model

Page 78
Chapter Five
V. Conclusion and Recommendations
Introduction
In the previous chapter, chapter 4 accomplished the analysis phase and identified the main
factors that influence customers' behavioral intention and use behavior to adopt e-government
services in Ethiopia. This final chapter, chapter 5, summarizes the overall finding of the study
along with study recommendations. The first section of this chapter presents a review of the
overall findings of the study, followed by answersto the research questions presented earlier in
chapter 1. Then, recommendations based on research findings are briefly discussed, next, the
study's theoretical and practical contribution follows and finally, limitations of the study together
with future research areas in e-government are discussed.
5.1 Overview of the Study
The Ethiopian government introduced e-government by 2010. Ethiopian customers have been
part of this opportunity for some years now. However, it is not reached to the point where
customers are satisfied with the current national e-services portal. Thus, this study identified
factors that influence customers' adoption of the nationale-services portal.
Even if the first initial efforts were made in 2013 by launching 49 e-services,by the end of 1st
phase implementation plan period 125 informational and 152 transactional e-services were
developed for some of the country ministries, agencies, and other governmental offices (FDRE,
2016). However, currently, customers’ participation in adopting these services is reported below.
Therefore, this study aimed to identify and discuss the main factors that influence customers'
intention to adopt public electronic services.
Extant works of the literature revealed lack of awareness about the services, computer literacy,
culture, digital divide, demographic factors, website design, service quality, language, and
security issues are among the main inhibiting factors identified and investigated to influence
customers’ adoption of e-government services (Carter & Belanger, 2003; ElKheshin, 2016;
Mansoori, 2017; Talib, Imarah, Abdulameer, Zwain, & Al-hakim, 2013b). Generally, studies on
e-government implementation, adoption, and success are few in Ethiopia. The study was able to
Page 79
get only one study by (Adefris, 2018), where he studied e-government adoption on Ethiopian
custom and revenue authority large taxpayers customers.
The current study adopted, modified, and tested a conceptual model for the adoption of e-
government services mainly based on UTAUT constructs and other adoption factors briefly
described in previous chapters (chapters 2 and 3). The conceptual model consists of (PE),
effort expectancy (EE), social influence (SI), facilitating condition (FC),and behavioral intention
(BI) from the UTAUT model. Additional four constructs are added based on a detailed study of
literature on e-government areas which are website quality (WQ), awareness (AW), trust in the
internet (TNET), and trust in government (TGOV).
The choices that are made for survey research designwere related to the study’s aim to find out
factors influencing the adoption of e-government services from a vast amount of customers to
develop a conceptual model consisting of influential variables. Thus, to achieve the aim of the
research, the study employed a quantitative method based on survey design. Overall, 400
questionnaires were distributed and 316 usable responses were returned. While22 were discarded
from further analysis due to (1) questionnaire consisting of the same answer for all questions and
(2) Responses having a missing value that exceeded 15%.
Detailed analysis of both the demographic and structural model was also conducted and reported
in chapter 4. In the case of demographic analysis, SPSS version 20 was used to report the
analysis. The result shows, more males are engaged in e-governmentthan females do in Ethiopia.
Most of the e-government adopters are aged from 30 to 49 from the total population. Research
participants reported the majority of them have a minimum ofabachelor's degree. For hypothesis
testing, Smart-PLS was employed. In this study, an evaluation of the proposed model was
conducted using structural and measurement model assessment. For the measurement model,the
reliability of the study was assessed through composite reliability and Cronbach's alpha, the
result for all constructs is above the recommended value 0.7. Construct validity is assured
through the assessment of both convergent and discriminant validity, most of these values are all
above the recommended value 0.5. Additionally, the research encountered no multicollinearity
problem.
The hypothesis presented in chapter 3 were tested if they are either supported or rejected by
customers' responses. Therefore, from a total of 10 hypotheses, 7 were confirmed to be

Page 80
significant to predict e-government adoption. performance expectancy, effort expectancy,
facilitating condition, awareness, website quality, and trust in the government determines
customers’ behavioral intention to use e-government. Whereas, from two constructs that are
hypothesized to influence customers use behavior, both facilitating condition and behavioral
intention were confirmed to determine adoption. The proposed model predicting power was
tested through the coefficient of determination R2. The proposed model has a strong influence in
predicting customers’ behavioral intentions with 67%, whereas the model moderately explains
the change in use behavior (USE) with 35%.
Therefore, a refined model consisting of seven constructs performance expectancy, effort
expectancy, facilitating condition, awareness, website quality, trust in government, and
behavioral intention was used as a final model to explain factors that influence Ethiopian
customers' behavioral intention and use behavior to adopt e-government services.
Here is the finallist of the supported hypothesis:
H1: PE has a positive influence on Ethiopian customers’ behavioral intention to use e-
government services.
H2: EE has a positive influence on Ethiopian customers’ behavioral intention to use e-
government services.
H3: FC has a positive influence on Ethiopian customers use behavior.
H4: TGOV has a positive influence on Ethiopian customers’ behavioral intention to use e-
government services.
H5: AW has a positive influence on Ethiopian customers’ behavioral intention to use e-
government services
H6: WQ has a positive influence on Ethiopian customers’ behavioral intention to use e-
government services
H7:BI has a positive influence on Ethiopian customers use behavior.
Here are the final lists of the hypothesis that ar not supported.
H8: SI has a positive influence on Ethiopian customer’s behavioral intention to adopt e-
government services.

Page 81
H9: FC has a positive influence on Ethiopian customers’ behavioral intention to use e-
government services. and
H10: TNET has a positive influence on Ethiopian customers’ behavioral intention to use e-
government services
Out of 10 hypotheses, only 3 hypotheses were not supported by the study finding. These
relationships were removed from the refined model. Generally, even if the current study assessed
customers' opinions through 3 governmental offices due to the similar nature of the services, the
study believes, findings of this research are likely to represent other customers from other
Ethiopian government offices which are not directly included in this study.
5.2 Discussion and Answering the Research Questions
1. Why are online e-government servicesare less adopted by customers in Ethiopia?
Initially, the study basis its assumption on low-level responses to the established electronic
government services. The national e-services portal is one of the e-government services, which is
designed to provide a common platform and generic tools for online transactional services from
government departments to citizens, non-citizens, businesses, and governmental and non-
governmental organizations. To identify factors that could influence customers’ intention, this
study reviewed several works of literature and studies conducted in local, regional, and
international contexts.
Theories and models have long been developed to identify factors that cause users to adopt
different types of technologies. These models include a DOI (Diffusion of Innovation) which
was developed by (Rogers, 1962), TPB (Theory of Planned Behaviour) model by (Ajzen, 1991),
TAM (Technology Acceptance Model) by (Davis, 1989), and UTAUT`1 &2 (Unified Theory of
Acceptance and Use of Technology) by Venkatesh et al., (2003) & (2012)
According to Venkatesh et al., (2003), the unified theory of acceptance and use of technology
(UTAUT) was found to explain around 70% of the variance in behavioral intention and the
model explains 53% of the variance in usage behavior. As well as, the adjusted R2 result of the
model implied, the model explains 69% of the variance in behavioral intention. This makes the
UTAUT model have high explanatory power in predicting the variance of both behavioral
intention and usage behaviormore than any other model. Also, UTAUT is the most recent model,
Page 82
as the time of its development was in 2003, the modified version of this model was then formed
in 2012.
This model consists of 4 determinants of behavioral intention namely, performance expectancy,
effort expectancy, social influence, and facilitating condition. 2 determinants of usage behavioral
intention and facilitating condition as well as four moderators gender, age, experience, and
voluntariness. However, in recent years, researchers began to add some variables to the original
model due to several reasons. One of these causes can be the nature of the technology being
studied, in services such as e-government services, trust in the services provider (trust in
government), trust in the medium of communication (trust in the internet), quality of services
provided through website or web portal (website quality) and awareness about the services
provided online (awareness) are important aspects. Thus, are added to the original UTAUT
model to examine influential factors in customers' intention to use e-government services.
Researchers who included and later confirmed the influence of some of these variables in their
study model includes (Alghamdi, 2016; Alsaif, 2013; Carter & Bélanger, 2005; ElKheshin, 2016;
Mansoori, 2017, Alsheri et al.2012).
The analysis result from Smart-PLS support modified UTAUT produces that performance
expectancy (PE), effort expectancy (EE), facilitating condition (FC), trust in government
(TGOV), awareness (AW), and website quality (WQ) are influential factors in e-government
adoption in Ethiopia. Besides, the finding revealed social influence and facilitating condition
doesn’t necessarily influence customers’ behavioral intention. Thus, it can be concluded that lack
of human, telecom infrastructure and technical support from the government, the web portal that
disregards many website quality features, lack of customers knowledge on e-government and its
services, lack of competence in providing online services by the government are found to be the
reasons why Ethiopian customers less use established online services in Ethiopia.
Out of eight exogenous LVs, facilitating conditions, website quality, and awareness are found to
influence the customer's behavioral intention to adopt e-government services more than any
other construct in the study. Moreover, it is found that behavioral intention and facilitating
condition construct has a significant and positive relationship with the use of e-government
services. The results of this study revealed that the research model explained 67% of the variance

Page 83
in customers' behavioral intention and explained 35% of the variance in the use of e-government
services.
2. How can the findings of this study assist the Ethiopian government to enhance customers’
adoption of e-government in Ethiopia?
The list of recommendations in the following section has detail on how the finding of this study
could help the Ethiopian government to have a clear picture of what and how to improve the rate
of adoption. Further, it will contribute to the successful implementation of e-government.
5.3 Recommendation for Ethiopian Government
1. Recommendations related to Performance expectancy
Currently, most of the implemented e-services are partially electronic. Thus, most customers
need multiple visits to government offices to complete their transactions. Moreover, in some
cases, customers need to travel to the capital city Addis Ababa to get information and services
from other regional areas.
This study recommends the Ethiopian government:
• To provide online government services that are delivered fast by reducing
unnecessary procedures that are needed to complete a single transaction.
• To implement an e-services delivery framework that is completely electronic and
needs no personal visit to government offices.
• Currently, the national e-services portal lacks an online payment option. therefore, to
make customers satisfied with what the government offers, the government should
update the design of the current national e-services portal to have an online payment
option.
2. Recommendation related to Effort expectancy
Ease of use or less complexity is the desired feature in website design. Therefore, one of the
practical recommendations from this study to the Ethiopian government is to update the design
of the current national e-services portal to include videos, images, and texts which can help users
of the system to easily utilize the national e-services portal and related systems.
3. Recommendation related to Facilitating condition

Page 84
Reliable, fast, and affordable internet connection is an important facilitating condition that can
arouse customers' intention to engage in an electronic environment. These days, there is an
improvement in the internet service provided by ethio-telecom. However, it is difficult to
conclude the users are satisfied with the quality of service. Therefore, the government of
Ethiopia shall solve such kinds of problems by allowing other service providers to join the
untouched market. As a country where more than half of its population is illiterate, it's beneficial
to have an appointed customer service officer that is well educated and trained to handle
customers’ requests whenever customers face difficulty.
4. Recommendation related to Website quality
The government of Ethiopia needs to make the national e-services portal and other related
services reliable, available, and secure systems. To make this, the architecture of the national
data center requires enhancement including aspects related to scalability, reliability, and security.
The current portal Help and Support feature needs enhancement. Many indicated the availability
of chat room features on the government portal is of greatest help to assist customers in difficulty
during application for services. Therefore, the Ethiopian government should make the current
national e-services portal interactive by adding online chat room features.Further, a document
containing instructions on how to apply for services should be placed in a place easily visible for
customers to avoid customers’ confusion and frustration.
The design of the national e-services portal currently allows the customer to fill their information
using one full form. The current design shall be improved from one full form to wizards due to
wizards' simplicity for userstoinput their information and documents easily. Additionally, the
Ethiopian national e-services web portal lacks multiple language options. It presents the contents
in two languages in Amharic, which is the country’s official working language, and in English.
The portal content should also need to be presented using two or more other mostly spoken local
languages such as Afan Oromo and Tigrigna.
5. Recommendation related to Awareness
During the first e-government implementation plan, the Ethiopian government intended around
70% of its citizens to be aware of e-government. However, the lack of public awareness is
identified as one of the reasons for the low-level adoption of e-services in Ethiopia. For future

Page 85
implementation, this issue needs to be addressed by enabling customers to be informed about e-
government, e-services, and their benefits and advantages through public awareness programs.
The Ethiopian government owns several reachable media such as television, radios and
newspapers, and social media channels. Therefore, public awareness campaigns can be done
using various communication platforms including newspapers, magazines, television, radio
programs, and social media.
Furthermore, mobile penetration has reached more than 60% in the country. The Ethiopian
government can also take this opportunity to enable its ministries and agencies to send short code
messages to inform the public about the services these organizations provide and the benefits of
using the system, to promote the use of established e-services to the public. Moreover, Even
though initial promotion and advertisement were done during the launching of e-services back in
2013, continual promotion is highly required to draw customer’s attention towards online
government services.
6. Recommendation related to Trust in government
Different departments of the Ethiopian government need to work hard on organizational culture
to possess the ability to provide customers with effective and efficient online services. To do so,
government employees’ ability to offer customers quality services should be improved through
offering different workshops, seminars, and other self-development training programs to get the
technical skills necessary to execute and secure e-government systems. Lastly, the government of
Ethiopia should establish transactions that are free from risks and protect customers’ information
and documents privacy through the application of data security and privacy law and regulations.
5.4 Research Contributions
This study is an important step in identifying, examining, and discussing factors influencing the
adoption of e-government services from Ethiopian customers’ perspective. This section discusses
research contribution into two parts: theoretical contribution and practical contribution.
5.4.1 Theoretical Contributions
• One of the study theoretical contributions of this study is a critical review that is
presented in chapter 2. This study provided a broad review of the concept of e-

Page 86
government, e-services, benefits, and challenges as well as detailed information one-
governmentinitiatives and its improvement that have been made so far in Ethiopia.
• E-governmentis a relatively new concept. This kind of studies helps the current gap
in the literature on the evolving field of online public services, e-government and e-
government adoption in Ethiopia.
• Further, one of the most important contributions of this study is that it empirically
examined the proposed research model modified UTAUT through the application of
the Smart-PLS technique. From the hypothesis testing section, it has been found out
constructs that were added on original UTAUT model awareness, website quality,
and trust in government found to be significant influencers of adoption of e-
governmentservices from consumers’ perspective.
• Finally, the UTAUT model was validated in a new type of technology (e-services),
in a country like Ethiopia with different populations.
5.4.2 Practical Contributions
• Thus one of the practical contributions of this study is to contribute to the current
body of knowledge one-government adoption in Ethiopia by focusing on customers’
points of view.
• The revised e-government services adoption model can be used as a useful document
for government and policymakers to improve customers’ participation in already
established online services and to be developed in the future for achieving successful
e-government.
• This study provided some useful recommendation that needs to be improved to
enhance customers to adopt online e-government services for different Ethiopian
government departments, ministries, and agencies.
5.5 Recommendations for Future Research
Ethiopia is relatively new to e-government implementation and adoption. While conducting this
study; there is a lack of studies regarding e-governmentas a whole. Thus, different areas of
Ethiopian e-government implementation, adoption, challenges, and opportunities,etc. need to be
explored deeply in future researches. Some areas that needed further work includes

Page 87
Population: This study included only customers of three government ministries and agencies but
the study recommends future research to explore other government department customers'
opinions on factors influencing the adoption of online services.
Methodology:This study suggests future study to use qualitative method to add further insightin
to Ethiopian e-government area.
The current study doesn’t include moderate factors influence in the UTAUT model. Therefore,
future research can address the impact of age, gender, educational level, and experience
variables.
The present study only focused on the adoption of e-government services from the customers’
perspectives. However, e-government adoption in Ethiopia also needs to be further studied from
the government perspective.

Page 88
References
Adefris, A. (2018). Factors affecting Adoption of E-Government : The case of Ethiopian Revenue and
Customs Authority Large Taxpayers Office.
Adeyinka, T. (2015). Predicting Users ’ Continuance Intention Toward E-payment System : An Extension
of the Technology Acceptance Model. International Journal of Information Systems and Social
Change, (March 2014). https://doi.org/10.4018/ijissc.2014010104
Ahlemann, N. U. &Frederik. (2011). Structural Equation Modeling in Information Systems Research
Using Partial Least Squares. Journal of Information Technology Theory and Application, 11(2).
Ahmad, M. O., Markkula, J., & Oivo, M. (2012). Factors Influencing the Adoption of E-Governemnt
Services in Pakistan, (November 2014).
Ajzen, I. (1991). The Theory of Planned Behavior. Organizational Behavior and Human Decision
Processes, 5978(December 1991). https://doi.org/10.1016/0749-5978(91)90020-T
Akbar, H. (2017). A Conceptual Framework for Citizens’ Adoption of E-Government, 1171–1183.
Akter, S., & Ray, P. (2011). An evaluation of PLS based complex models : the roles of power analysis ,
predictive relevance and GoF index. In Proceedings of the 17th Americas Conference on
Information Systems (AMCIS2011) (pp. 1–7).
Al-hawary, S. I. S., & Al-menhaly, S. M. (2016). The Quality of E-governmentServices and its Role on
Achieving Beneficiaries Satisfaction, 16(11).
Al-khattab, K. (2015). The Effect of Trust and Risk Perception on Citizen ’ s Intention to Adopt and Use
E-governmentServices in Jordan. Journal of Service Science and Management, (June), 279–290.
Al-shafi, S. (2010).Factors Affecting E-Governemnt in the State of Qatar. In European and
Mediterranean Conference on Information Systems 2010 (Vol. 2010, pp. 1–23).
Aladwani, A. M., & Palvia, P. C. (2002). Developing and validating an instrument for measuring user-
perceived web quality. Information & Management, 39, 467–476.
Alateyah, S. A., Crowder, R. M., & Wills, G. B. (2012). Towards an Integrated Model for Citizen
Adoption of E-government Services in Developing Countries : A Saudi Arabia Case Study, 3(3).
Alateyah, S. A., Crowder, R. M., & Wills, G. B. (2013a). An Exploratory study of proposed factorsto
Adopt e- government Services Saudi Arabia as a case study. International Journal of Advanced
Computer Science and Applications (IJACSA), 4(11), 57–66.

Page 89
Alateyah, S. A., Crowder, R. M., & Wills, G. B. (2013b). Factors Affecting the Citizen ’ s Intention to
Adopt E-governmentin Saudi Arabia. International Journal of Humanities and Social Sciences,
7(9), 2559–2564.
Alawadhi, S., & Morris, A. (2009a). Factors Influencing the Adoption of E-governmentServices. Journal
of Software, 4(6), 584–590.
AlAwadhi, S., & Morris, A. (2008). The Use of the UTAUT Model in the Adoption of E-
governmentServices in Kuwait. In Proceedings of the 41st Hawaii International Conference on
System Science. https://doi.org/10.1109/HICSS.2008.452
Albesher, A. (2015). Trust as a source of long-term adoption of e-government .2016 , (September).
Retrieved from http://dspace.brunel.ac.uk/handle/2438/12368
AlFawwaz, B. M., ALShatnawi, A. M., Hunaiti, Z., Harfoushi, O., Obiedat, R., & Nawafleh, S. (2013). e-
Government: evolving relationship of citizens, government and domestic development – case of
Jordan.Contemporary Engineering Sciences, 6(January), 285–295.
https://doi.org/10.12988/ces.2013.3530
Alghamdi, S. A. (2016b). Key Factors Influencing the Adoption and Utilisation of E-governmentSystems
and Services in Saudi Arabia. University of Sussex. Retrieved from http://sro.sussex.ac.uk/
Alhujran, O. (2009). Determinants of e-governmentservices adoption in developing countries : a field
survey and a case study.
Alomari, M. K. (2010). Predictors for Successful E-governmentAdoption in the Hashemite Kingdom of
Jordan : The Deployment of an Empirical Evaluation Based on Citizen- Centric Perspectives.
Alomari, M. K. (2014). Discovering Citizens Reaction Towards E-Governemnt: Factors in E-Governent
Adoption. Journal of Information Systems and Technology Management, 11(1), 5–20.
https://doi.org/10.4301/S1807-17752014000100001
Alsaif, M. (2013). Factors Affecting Citizens’ Adoption of E -government Moderated by Socio-cultural
Values in Saudi Arabia.
Alshehri, M. (2012). Using the UTAUT Model to Determine Factors Affecting Acceptance and Use of E-
governmentServices in the Kingdom of Saudi Arabia.
Alshehri, M., & Drew, S. (2010). E-governmentfundamentals. International Conference ICT, Society and
Human Beings.
Alshehri, M., Drew, S., & Alfarraj, O. (2012). A Comprehensive Analysis of E-governmentservices

Page 90
adoption in Saudi Arabia : Obstacles and Challenges, 3(2), 1–6.
Alshehri, M., Drew, S., & Alghamdi, R. (2012). E-Governemnt Services: Applying the UTAUT model,
69–76.
Alshehri, M., Drew, S., Alhussain, T., & Alghamdi, R. (2012). The Effects of Website Quality on
Adoption of E-governmentService : An Empirical Study Applying UTAUT Model Using SEM. In
23rd Australasian Conference On Information Systems.
Balmi, M. C. (2016). A Study on the Impact of Quality Antecedents on Individual Tax Payer’s Adoption
of E-Filing in India. International Journal of Engineering and Management Research, 6(2), 178–
186.
Bank, W. (2002). The World Bank New-Economy Sector Study Electronic Government and Governance :
Lessons for Argentina.
Belachew, M. (2010). e-governmentinitiatives in Ethiopia. Proceedings of the 4th International
Conference on Theory and Practice of Electronic Governance - ICEGOV ’10, (May), 49.
https://doi.org/10.1145/1930321.1930332
Belanger, F., & Carter, L. (2005). Trust and Risk in e-Government Adoption. In Americans Conference
on Information Systems(AMCIS).
Bwalya, K. J. (2009). Factors Affecting Adoption of E-Government in Zambia. The Electronic Journal on
Information Systems in Developing Countries, 1–13. https://doi.org/10.1002/j.1681-
4835.2009.tb00267.x
Cardoso, J. (2015). Electronic Services. Switzerland. https://doi.org/10.1007/978-3-319-23195-2
Carter, L., & Belanger, F. (2003). The Influence of Perceived Characteristics of Innovating on e-
governmentAdoption. Electronic Journal of E-government, 2(September), 11–20.
https://doi.org/10.1504/IJMC.2011.040606
Carter, L., & Bélanger, F. (2005). The utilization of e-governmentservices: citizen trust, innovation and
acceptance factors. Journal of Information Systems, 5–25.
Carter, L., & Weerakkody, V. (2008). E-governmentadoption : A cultural comparison. Information
Systems Frontiers, (February 2014). https://doi.org/10.1007/s10796-008-9103-6
Chin, W. W. (1998). The Partial Least Squares Approach to Structural Equation Modeling. In modern
method for business research.
Civelek, M. E. (2018). Essentials of Structural Equation Modeling Essentials of Structural Equation

Page 91
Modeling.
Colesca, S. E., & Dobrica, L. Adoption of E-Governemnt: the case of Romania, 6 Research Centre in
Public Administration and Public Services (2008).
Creswell, J. (2014). Research Design:Quantitative, Qualitative and Mixed methods Approaches.
Davis, F. D. (1989). Perceived Usefulness , Perceived Ease of Use , and User Acceptance of Information
Technology. Management Information Systems, 13(January 2015). https://doi.org/10.2307/249008
Desta, Y. (2018). Customers ’ E-Banking Adoptionin Ethiopia.
Ebrahim, Z., & Irani, Z. (2005). E-governmentadoption: Architecture and barriers. Business Process
Management Journal, 11(5), 589–611. https://doi.org/10.1108/14637150510619902
ElKheshin, S. A. (2016). Determinants of e-governmentservices adoption in developing countries
(Egypt). Middlesex University London. Retrieved from http://eprints.mdx.ac.uk/21306/
Garson, G. D. (2016). Partial Least Square: Regression and Structural Equation Modls.
Gilbert, D. and P. B. (2004). Barriers and benefits in the adoption of e-government. ‘International
Journal of Public Sector Management,’17(4). https://doi.org/10.1108/09513550410539794
Gupta, K. P., & Bhaskar, P. (2016). Citizen adoption of e-government : A literature review and
conceptual framework Citizen adoption of e-government, (June).
https://doi.org/10.1504/EG.2016.076134
Haider, Z., & Shuwen, C. (2015). Adoption of e-governmentin Pakistan : Supply Perspective.
Nternational Journal of Advanced Computer Science and Applications, 6(6), 55–63.
Haile, A. A. (2013). The Opportunitiesand Challengesof E-Governancein Ethiopia The Caseof Toll Free
888 Call Center.
Hair, J. F., Risher, J. J., Sarstedt, M., & Ringle, C. M. (2018). When to use and how to report the results
of PLS-SEM. European Business Review, (December). https://doi.org/10.1108/EBR-11-2018-0203
Hair, J. F., Sarstedt, M., && C. M. R., & Jeannette A. Mena. (2012). An assessment of the use of partial
least squares structural equation modeling in marketing research. Journal of Academy of Marketing
Science, (23 December 2010), 414–433. https://doi.org/10.1007/s11747-011-0261-6
Hair, J., Randolph, C. L. H. and A. B., & Chong, A. Y. L. (2016). An updated and expanded assessment
of PLS-SEM in information systems research. Industrial Management & Data Systems, 117.
https://doi.org/10.1108/IMDS-04-2016-0130
Page 92
Hanna, F., & Zawaideh, A. L. (2017). Web - Based For Successful E - Government Adoption: The Jordan
National E - Government Portal, 320–330.
Henseler, J., & Ringle, C. M. (2009). The Use of Partial Least Squares Path Modeling in International
Marketing. New Challenges to International Marketing Advances in International Marketing,
20(January). https://doi.org/10.1108/S1474-7979(2009)0000020014
Hien, N. M. (2014). A Study on Evaluation of E-governmentService Quality. World Academy of Science,
Engineering and Technology International Journal of Humanities and Social Sciences, 2011(1), 16–
19.
Hilton, N. Z., Harris, G. T., Rice, M. E., Lang, C., Cormier, C. A., & Lines, K. J. (2004). A Brief
Actuarial Assessment for the Prediction of Wife Assault Recidivism : The Ontario Domestic Assault
Risk Assessment. The American Psycological Association, 16(June 2005).
https://doi.org/10.1037/1040-3590.17.2.131
Hox, J. J. (1999). An Introduction to Structural Equation Modeling 1. In introduction structural equation
modeling (pp. 1–17).
Implementation, E.-G. (2013). Executive Summary of the E-governmentStrategy.
Jaruwachirathanakul, B., & Fink, D. (2006). Internet banking adoption strategies for a developing
country: the case of Thailand. Emerald Group Publishing Limited, Vol. 15 No, 295–311.
Joshi, A., Kale, S., Chandel, S., & Pal, D. K. (2015). Likert Scale : Explored and Explained, 7(4), 396–
403. https://doi.org/10.9734/BJAST/2015/14975
Jr, J. F. H., Sarstedt, M., Hopkins, L., & Volker G. Kuppelwieser. (2014). Partial least squares structural
equation modeling ( PLS-SEM ) An emerging tool in business research. European Business Review,
(February). https://doi.org/10.1108/EBR-10-2013-0128
Jyoti, C., & Yogesh, D. A Survey of Citizens’ Awarenessand AdoptionofE-Governemnt Initiatives.
(2005).
Kante, M., Chepken, C. K., & Oboko, R. (2018). Partial Least Square Structural Equation Modelling ’ use
in Information Systems : an updated guideline of practices in exploratory settings Partial Least
Square. Kabarak Journal of Research & Innovation, 6(January).
Kock, N. (2015). Hypothesis testing with confidence intervals and P values Hypothesis testing with
confidence intervals and P values, (December), 1–7.
KPMG. (2016). Ethiopian e-government Strategic Implementation Plan.

Page 93
Kumar, V., Mukerji, B., Butt, I., & Persaud, A. (2007). Factors for Successful E-governmentAdoption : A
Conceptual Framework, (January).
Lei, P., & Wu, Q. (2007). Introduction to Structural Equation Modeling: Issues and Practical
Considerations. Educational Measurement Issues and Practice, (September 2007).
https://doi.org/10.1111/j.1745-3992.2007.00099.x
Lessa, L. (2015). Sustainability FrameworkforE-government Success: the Caseof Woredanet Servicesin
Ethiopia.
Lindgren, I., & Jansson, G. (2017). Electronic services in the public sector : A conceptual framework,
(November). https://doi.org/10.1016/j.giq.2012.10.005
Manhas, J. (2015). Analysis on Design Issues of E-governmentWebsites of India. International Journal of
Advanced Research in Computer Science and Software Engineering, 4(March 2014).
Mansoori, K. A. Al. (2017). Use of a modified UTAUT model to investigate Emirati Citizens ’ adoption of
e-governmentin Abu Dhabi.
Mengesha, S. M. (2001). Participation of Ethiopian Women in Education and Development.
Misra, D. C. (2006). Defining e-government: a citizen-centric criteria- based approach. 10th National
Conferenceon E-Governance, 1–11. Retrieved
fromhttp://unpan1.un.org/intradoc/groups/public/documents/UNPAN/UNPAN025373.pdf
Modeling, S. E., Henseler, J., Ringle, C. M., & Sarstedt, M. (2014). A New Criterion for Assessing
Discriminant Validity in Variance-based. Journal of the Academy of Marketing Science, (January).
https://doi.org/10.1007/s11747-014-0403-8
Mutawa, S. S. al. (2013). Factors That Impact the Acceptance of E-services in the Public Sector in the
United Arab Emirates Case Study: The General Directorate of Residency and Foreigners Affairs
(GDRFA) - UAE.
Nations, U. (2002). Benchmarking E-government : A Global Perspective.
Nations, U. (2003). World Public Sector Report 2003.
Negash, S., & Lessa, L. (2011). Acceptance of WoredaNet E-governmentServices in Ethiopia : Applying
the UTAUT Model. Association for Information Systems: AMSCIS-2011 Proceedings, (July 2015),
12. https://doi.org/10.1109/HICSS.2008.452
Nusir, M., & Bell, D. (2013). Systematic Literature Review : Taxonomy Of Services In E-government.
Ogurlu, Y. (2014). E-Government Portal” andE-Servicesin Turkey. Epiphany Journal of
Page 94
Transdisciplinary Studies, 7(2).
Oseni, K. O., Dingley, K., & Hart, P. (2013). Barriers Facing E-Service Technology in Developing
Countries : A Structured Literature Review with Nigeria as a Case Study, (2006).
Peter, R., Huff, S. L., & Munro, C. (1998). Survey Instruments in Information Systems. MIS Quarterly,
(December), 553–554.
Rabaa, A. A., Zogheib, B., Alshatti, A., & Jamal, E. Al. (2016). Adoption of e-governmentin Developing
Countries : The Case of the State of Kuwait. Journal of Emerging Trends in Computing and
Information Sciences, 7(June).
Report, W. development. (2016). World Development Report 2016 : Internet for Development
Framework for e-governance in UNDP. berlin, germany.
Rogers, E. M. (1983). The Key Factors InfluencingE-Governemnt Acceptance : in the Caseof Vietnam
(Vol. 5).
Rogers, E. M. (2003). Diffusionof Innovation Third Edition.
Ruyter, K. De, Wetzels, M., & Kleijnen, M. (2001). Customer adoption of e-service : an experimental
study, (May). https://doi.org/10.1108/09564230110387542
Samsudeen, S. N. (2013). Evaluatingthe AdoptionofE-Government in Srilanka : A Citizens ’ Perspective.
https://doi.org/10.13140/RG.2.2.24652.67202
Sarstedt, M., Ringle, C. M., & Hair, J. F. (2017). Partial Least Squares Structural Equation Modeling.
https://doi.org/10.1007/978-3-319-05542-8
Scupola, A., & Nicolajsen, H. W. (2014). I nternatIonal J ournal of e-S ervIceS and M obIle, (August).
https://doi.org/10.1007/978-3-7908-2739-2
Shareef, S. M. (2016). Enhancing Security of Information in E-government. Journal of Emerging Trends
in Computing and Information Sciences, 7(May).
Tadesse, S. E. (2015). The Practice , Challenges , and Prospects of e-government : The case of Ethiopian
Revenue and Customs Authority ( ERCA ) Large Taxpayers Office.
Talib, A. A., Imarah, A., Abdulameer, A., Zwain, A., & Al-hakim, L. A. Y. (2013). The Adoption of E-
governmentServices in the Iraqi Higher Education Context: An application of the UTAUT Model,
(August 2015).

Page 95
Taylor, S., Kl, O. C., & Todd, P. A. (1995). Understanding Information Technology Usage : A Test of
Competing Models. Information Systems Research, 6(2), 144–176.
Tolla, S. (2018). Ethiopian Government commitment to achieve the 2030 SDG. Retrieved from
http://workspace.unpan.org/sites/Internet/Documents/ICT experiance.pptx.pdf
Tsegaye, A. (2018). Evaluationofthe Public ValueofE-Government Servicesin Ethiopia: Caseof Court
Case Management System (CCMS).
UN. (2018). United NationsE-Governemnt Survey 2018. New York. https://doi.org/e-ISBN: 978-92-1-
055353-7
UN, & OECD. (2003). The e-governmentimperative: main findings. OECD E-government Studies, 203 p.
https://doi.org/10.1787/9789264101197-en
Urbach, N., & Ahlemann, F. (2010). Structural Equation Modeling in Information Systems Research
Using Partial Least Squares. Journal of Information Technology Theory and Application, 11(2), 5–
40.
Valentina (Dardha) Ndou. (2004). E-Governemnt for Deveoping countries : opportunities and challenges,
1–24.
Venkatesh, V. (2003). User Acceptanceof Information Technology : Towardsn a Unified View. MIS
Quarterly, 27(3), 425–478.
Venkatesh, V. (2012). Consumers Acceptanceand Useof Information Technology : Extending the Unified
Theory. MIS Quarterly, 36(1), 157–178.
Venkatesh, V., & Davis, F. D. (2000). A Theoretical Extension of the Technology Acceptance Model :
Four Longitudinal Field Studies. Management Science, (January 2015).
https://doi.org/10.1287/mnsc.46.2.186.11926
Wang, S., Chutimaskul, W., & Papasratorn, B. (2005). Factors Influencing the Adoption of Thai e-
Government Websites : Information Quality and System Quality Approach. In Proceedings of the
Fourth International Conference on eBusines.
Warkentin, M., Gefen, D., Pavlou, P. A., & Rose, G. M. (2002). Encouraging Citizen Adoption of e-
governmentby Building Trust. Electronic Markets, 12(3), 157–162.
https://doi.org/10.1080/101967802320245929
Wong, K. K. (2013). Partial Least Squares Structural Equation Modeling ( PLS-SEM ) Techniques Using
SmartPLS. Marketing Bulletin, (November).

Page 96
Worku, K. (2016). The Role of E-governmentin Enhancing Performances of Public Service Qualities and
Promoting Good Governance.
Zeleke, Y. (2018). Usability and Accessibility Model for E-government Websites in Ethiopia.

Page 97
Appendices
Appendix i. Letter of Approval fromFederal Transport Authority

Page 98
Appendix ii. Letter of Approval from the Ministry of Water and Irrigation

Page 99
Appendix iii. Survey Questionnaire in English
# Performance Expectancy Strongly
disagree
Disagree Neutral Agree Strongly
agree
1 Using e-Services enables me to access
government services
2 Using e-Services enables me to get government
services more quickly.
3 If I use e-Services, I will increase my ability to
get government services
4 Overall, using e-Services portal would increase
my overall productivity.
Effort Expectancy Strongly
disagree
Disagree Neutral Agree Strongly
agree
5 By using the e-Services portal I am able to
obtain government services more easily.
6 Learning to use e-Services portal is easy.
7 My interaction with e-Services portal is clear
and understandable.
8 Overall, I found e-Services portal easy to use.
Social Influence Strongly
disagree
Disagree Neutral Agree Strongly
agree
9 My family and friends think that I should use e-
Government services to get government
services
10 I will use e-Government services if the people
who are important to me used it

Page 100
11 Overall, people who influence my behavior
think I should use the e-Government Services
Facilitating Condition Strongly
disagree
Disagree Neutral Agree Strongly
agree
12 I have the resources necessary to use e-Services
portal
13 I have the knowledge necessary to use e-
Services portal
14 I can get help from others when I have
difficulties using e-Services portal
15 There is a specific person or team available for
help and assistance whenever I encounter
technical difficulty while using e-Services
Behavioral Intention Strongly
disagree
Disagree Neutral Agree Strongly
agree
16 I intend to continue using e-Services portal to
get government services in the future
17 I will always try to use e-Services portal to get
government services.
18 Overall, I plan to continue using e- Services
portal
Trust of the Internet Strongly
disagree
Disagree Neutral Agree Strongly
agree
19 The Internet has enough safeguards to make me
feel comfortable to use e-Services.
20 I feel assured that legal and technological
structures adequately protect me from problems

Page 101
on the Internet.
21 I feel secure to send personal information and
documents over e-Services portal.
22 Overall, the Internet is robust and safe to use e-
Government services.
Trust of the Government Strongly
disagree
Disagree Neutral Agree Strongly
agree
23 I believe that government departments have the
ability to meet citizens needs in regards to e-
Government services
24 The government can be trusted to carryout
faithful online interaction
25 I am confident that the forms I submit through
e-Services portal will be processed and not
ignored
26 Overall. I trust the government
Website Quality Strongly
disagree
Disagree Neutral Agree Strongly
agree
27 e-Services portal looks attractive and use fonts
and colors properly
28 e-Services portal contains important content
about the services provided
29 e-Services portal has multiple language options
30 Overall, e-Services portal is always working
and do not crush
Awareness Strongly Disagree Neutral Agree Strongly

Page 102
disagree agree
31 I have a good knowledge of e-Government
services and their benefits
32 The customers receiveሰ training from their
government to make the best use of e-
Government services
33 Offering workshops and visual presentations
about e-Government would encourage me to
attend and know more
34 Overall, I am satisfied with the current
awareness campaigns and advertisement about
e-Government and its services
Use behavior of E-Government Services Strongly
disagree
Disagree Neutral Agree Strongly
agree
35 I want to use e-Government services to perform
my government requests
36 I frequently use e-Government services
37 I use e-Government services regularly
38 Overall, most of my government requests are
done through e-Government services

Page 103
Appendix iv. Survey questionnaire in Amharic
# በውጤታማነትረገድ
በፍጹም አልስማማም
አልስማማም ለመወሰን እቸገራለሁ
እስማማለሁ በጣም አስማማለሁ
1 ኢ-ሰርቪስድረ ገጽን መጠቀም የመንግስት አገልግሎቶችን ለማግኘት ይረዳኛል፡፡
2 ኢ-ሰርቪስድረ-ገጽን መጠቀም የመንግስት አገልግሎቶችን በፍጥነት ለማግኘት ይረዳኛል
3 ኢ-ሰርቪስድረ-ገጽን መጠቀም የመንግስት አገልግሎቶችን የማግኘት እድል ይጨምርልኛል፡፡
4 በአጠቃላይ፣ኢ-ሰርቪስ ድረ-ገጽን መጠቀም አጠቃላይ ውጠታማነቴ እንዲጨምር ያደርጋል፡፡
በጥረትረገድ በፍጹም አልስማማም
አልስማማም ለመወሰን እቸገራለሁ
እስማማለሁ በጣም አስማማለሁ
5 ኢ-ሰርቪስድረ-ገጽን መጠቀም በመንግስት ተቋማት የሚሰጡ አገልግሎቶችን በቀላሉ እንዳገኝ ይረዳኛል፡፡
6 ኢ-ሰርቪስ ድረ-ገጽን መጠቀም ቀላል ነው፡፡ ፡
7 ኢ-ሰርቪስ ድረ-ገጽ አጠቃቀም ግልጽ እና ለመረዳት የሚቻል ነው፡፡
8 በአጠቃላይ፣ ኢ-ሰርቪስ ድረ-ገጽን ለመጠቀም ቀላል ሆኖ አግኝቼዋለሁ፡፡
የማህበረሰብ ተጽእኖ በፍጹም አልስማማም
አልስማማም ለመወሰንእቸገራለሁ
እስማማለሁ በጣም አስማማለሁ
9 ቤተሰቦቼ እና ጓደኞቼ የመንግሥት አገልግሎቶችን ለማግኘት የኤ-መንግስት አገልግሎቶችን መጠቀምእንዳለብኝ ያስባሉ፡፡
10 ለእኔ አስፈላጊ የሆኑ ሰዎች የኤ-መንግስት አገልግሎቶችን የሚጠቀሙ ከሆነ እኔም እጠቀማለሁ
11 በአጠቃላይ፣ በባህሪዬ ላይ ተጽዕኖ የሚያሳድሩ ሰዎች የኤ-መንግስት አገልግሎቶችን መጠቀም እንዳለብኝ ያስባሉ፡፡
ምቹ ሁኔታዎች በፍጹም አልስማማም
አልስማማም ለመወሰንእቸገራለሁ
እስማማለሁ በጣም አስማማለሁ
12 ኢ-ሰርቪስ ድረ-ገጽን ለመጠቀም የሚያስፈልጉ ግብአቶች አሉኝ፡፡
13 ኢ-ሰርቪስ ድረ-ገጽን ለመጠቀም አስፈላጊ እውቀት አለኝ፡፡

Page 104
14 የኢ-ሰርቪስ ድረ-ገጽ አገልግሎቶችን መጠቀም በሚያስቸግረኝ
ጊዜ ከሌሎች ሰዎች እርዳታን ማግኘት እችላለሁ፡፡
15 ኢ-ሰርቪስ ድረ-ገጽን በምጠቀምበት ጊዜ ለሚያጋጥመኝ የቴክኒክ ችግር እርዳታ የሚሰጥ አንድ የተወሰነ ግለሰብ ወይም ቡድን አለ፡፡
ባህሪያዊ ዝንባሌዎች በፍጹም አልስማማም
አልስማማም ለመወሰንእቸገራለሁ
እስማማለሁ በጣም አስማማለሁ
16 ለወደፊቱ የመንግስት አገልግሎቶችን ለማግኘት ኢ-ሰርቪስ ድረ-ገጽን መጠቀም እቀጥላለሁ፡፡
17 የመንግስት አገልግሎቶችን ለማግኘት ኢ-ሰርቪስ ድረ-ገጽን ሁሌ ለመጠቀም እሞክራለሁ፡፡
18 በአጠቃላይ፣ ኢ-ሰርቪስ ድረ-ገጽን መጠቀም ለመቀጠል አቅድ አለኝ፡፡
በኢንተርኔት ቴክኖሎጂ ላይ ያለ እምነት
19 ኢንተርኔት የኢ-ሰርቪስ አገልግሎቶችን ለመጠቀም ምቾት እንዲሰማኝ ለማድረግ የሚያስችል በቂ ጥበቃዎች አሉት፡፡
20 የህግ እናየ ቴክኖሎጂ መዋቅሮች በኢንተርኔት ላይ ከሚከሰቱ ችግሮች በበቂ ሁኔታ እንደሚጠብቁኝ እርግጠኛ ነኝ፡፡
21 የግል መረጃዎቼን እና ሰነዶቼን በኢ-ሰርቪስ ድረ-ገጽ ላይ ለመላክ ደህንነት ይሰማገኛል፡፡
22 በአጠቃላይ፣ ኢንተርኔት የኤ-መንግስት አገልግሎቶችን ለመጠቀም ምቹ እና አስተማማኝ ነው፡፡
በመንግስት ላይ ያለ እምነት በፍጹም አልስማማም
አልስማማም ለመወሰንእቸገራለሁ
እስማማለሁ በጣም አስማማለሁ
23 የመንግሥት ዲፓርትመንቶች ከኤ-መንግስት አገልግሎቶች ጋር በተያያዘ የዜጎችን ፍላጎት የማሟላት ችሎታ አላቸው ብዬ አምናለሁ፡፡
24 መንግሥት በኢንተርኔት በኩል የሚደረጉ ግንኙነቶችን በታማኝነት
እንደሚያከናውን እምነት ሊጣልበት ይችላል፡፡
25 በኢ-ሰርቪስ ድረ-ገጽ በኩል የምልካቸው ቅጾች ችላ ሳይባሉ ምላሽ እንደሚሰጠኝ እርግጠኛ ነኝ፡፡
26 በአጠቃላይ፣ በመንግስት ላይ እምነት አለኝ፡፡
የዌብሳይት ጥራት በፍጹም አልስማማም
አልስማማም ለመወሰንእቸገራለሁ
እስማማለሁ በጣም አስማማለሁ

Page 105
27 የኢ-ሰርቪስ ድረ-ገጽ ለዕይታ ሳቢነው፡፡
28 የኢ-ሰርቪስ ድረ-ገጽ ስለሚሰጣቸው አገልግሎቶች አስፈላጊ መረጃ ይዟል፡፡
29 የኢ-ሰርቪስ ድረ-ገጽ ብዙ የሀገር ውስጥ ቋንቋ አማራጮች አሉት፡፡
30 በአጠቃላይ፣ ኢ-ሰርቪስ ድረ-ገጽ ሁልጊዜ የሚሰራና የማይቋረጥ ነው፡፡
ግንዛቤ በፍጹም አልስማማም
አልስማማም ለመወሰንእቸገራለሁ
እስማማለሁ በጣም አስማማለሁ
31 በኤ-መንግስት ጥቅሞች እና አገልግሎቶች ላይ ጥሩ ዕውቀት አለኝ፡፡
32 ደንበኞች የኤ-መንግስት አገልግሎቶችን በጥሩ ሁኔታ ለመጠቀም እንዲችሉ ከመንግስት ስልጠና ያገኛሉ፡፡
33 ስለ ኤ-መንግሰት አገልግሎቶች የሚቀርቡ አውደጥናቶች እና መግለጫዎች አገልግሎቱን በይበልጥ እንድጠቀም ያበረታቱኛል፡፡
34 በአጠቃላይ፣በኤ-መንግስት አገልግሎቶች ላይ የሚሰጡ የግንዛቤ ማስጨበጫና ዘመቻ ሥራዎች ደስተኛ ነኝ፡፡
የኤ-መንግስት አገልግሎቶችን የመጠቀም ባህሪይ
በፍጹም አልስማማም
አልስማማም ለመወሰን እቸገራለሁ
እስማማለሁ በጣም አስማማለሁ
35 የመንግስት ተቋማት የሚሰጡት ንአገልግሎቶች ለማግኘት የኤ-መንግስት አገልግሎቶችን ለመጠቀም እፈልጋለሁ፡፡
36 በአብዛኛው የኤ-መንግስት አገልግሎቶችን አጠቀማለሁ፡፡
37 የኤ-መንግስት አገልግሎቶችን በመደበኛነት እጠቀማለሁ፡፡
38 በአጠቃላይ ፣ አብዛኛዎቹ የመንግስት ጥያቄዎቼ የሚስተናገዱት በኤ-
መንግስት አገልግሎቶች በኩል ነው፡፡

Page 106

Page 107