the dependence of the proton-triton thermo-nuclear fusion reaction
TRANSCRIPT
provisionally accepted for publication in Nuclear Fusion Letters, April 2009
1
The dependence of the proton-triton thermo-nuclear fusion reaction rate
on the temperature and total energy content
of the high-energy proton distribution function
D.Testa1, M.Cecconello2, C.Schlatter1, and JET-EFDA contributors∗
[1] CRPP, Association EURATOM – Confédération Suisse, EPFL, Lausanne, Suisse
[2] Division of Fusion Plasma Physics (Association EURATOM/VR), Alfvén Laboratory, Royal
Institute of Technology, Stockholm, Sweden
The endothermic nuclear reaction between thermal tritons and high energy protons can represent an
important contribution to the total neutron yield in tokamak plasmas heated by radio-frequency waves,
as the first JET experiments have demonstrated [M.Mantsinen et al., Nucl. Fusion 41 (2001), 1815]. A
further study based on more recent JET experiments was reported in [M.Santala et al., Plasma Phys.
Control. Fusion 48 (2006), 1233]. In this Letter we supplement and complete the previous analysis by
reporting the first systematic measurement of the scaling of the proton-triton (pT) thermo-nuclear
fusion reaction rate as a function of the total energy content and perpendicular tail temperature of the
fast protons heated by radio-frequency waves. It is found that the pT neutron rate increases almost
linearly with the fast proton temperature and the total energy content.
PACS numbers: 52.35-g, 52.55.Fa
∗ See annex 1 of J.Pamela et al., “Overview of Recent JET Results”, OV-1/1, IAEA Fusion Energy Conference 2004, Nucl. Fusion 45 (2005), S63-S85.
provisionally accepted for publication in Nuclear Fusion Letters, April 2009
2
One of the nuclear reactions that can give rise to a significant source of neutrons in fusion plasmas is
the endothermic T(p,n)3He one [1]1: T+p+764keV → n+3He. This proton-triton (pT) thermo-nuclear
fusion reaction requires a proton with energy in excess of EpCM=764keV in the centre-of-mass
reference frame. The detailed kinematics of the pT neutron production has been described in [2]. The
high energy protons required for the pT fusion are produced in the JET tokamak [3] via Ion Cyclotron
Radio Frequency (ICRF) heating of the background minority hydrogen population. Due to broad
energy range of the fast protons produced by ICRF heating, the pT neutrons have also a very broad
energy spectrum, each neutron being produced at the energy En=0.75×(EpCM-764keV). As shown in
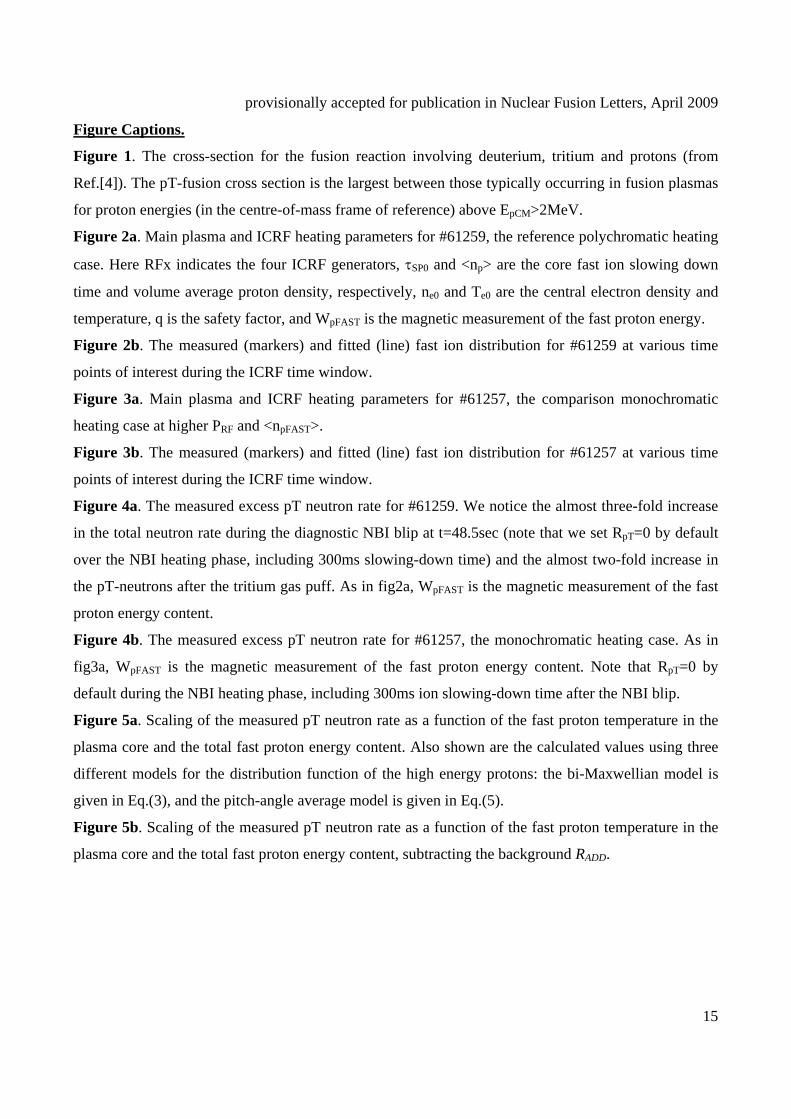
fig1 (extracted from [4]), for proton energies EpCM>2MeV, this reaction has by far the highest cross-
section between those typically occurring in magnetically confined thermo-nuclear fusion plasmas, i.e.
those involving hydrogen isotope ions [1].
The interest in studying the pT thermo-nuclear fusion reaction stems from the fact that a background
hydrogen population is an unavoidable feature of tokamak plasmas with a first wall covered with
carbon tiles, due to the structural properties of the CFC material [5]. In ITER, ICRF heating of the
deuterium population is essentially considered as a tool to increase the ion temperature on the road to
ignition [5]. However, the presence of a minority hydrogen population will also contribute to the total
neutron rate through the pT nuclear reaction, and this needs to be properly considered when evaluating
the various neutron production mechanisms as a tool to assess the plasma performance or infer
background and fast ion plasma parameters such as the ion temperature and toroidal rotation [6-8].
Furthermore, the pT nuclear reaction has also been tentatively proposed as a possible tool for
measuring the temperature of ICRF-driven protons in energy ranges where conventional methods, such
as neutral particle analysis or γ-rays spectroscopy, are not available [2]. Hence it is important to derive
a scaling for the pT neutron rate RpT as function of the main features of the distribution function of the
ICRF-driven high-energy protons fpFAST(E), such as their perpendicular tail temperature T⊥pFAST and
total energy content WpFAST.
The first JET experiments have demonstrated the role of the pT nuclear reaction during ICRF heating
of the minority proton distribution function in tritium-rich plasmas, nT/ne≈0.9 [10]. However, at that
time it had not been possible to perform a systematic scan of the dependence of the pT neutron yield on
fpFAST(E). A more systematic experimental study of the pT-neutrons in purely ICRF-heated plasmas
with low tritium density (typically nT/ne<0.01) was performed in 2003 in JET during the Trace Tritium
Experiments (TTE) [10, 11], with the main results reported in [2]. Here we supplement the analysis of
1 see also http://www-nds.iaea.org/ for table reporting data on the endothermic fusion reaction T(p,n)3He.
provisionally accepted for publication in Nuclear Fusion Letters, April 2009
3
Ref.[2] by concentrating on the scaling of the excess pT-neutron rate RpT as function of the core fast
proton perpendicular temperature T⊥pFAST,0 and total energy content WpFAST in such plasmas.
The excess pT-neutron rate RpT(t) is defined as RpT=RTOT–(RDT+RDD)-RADD, where RTOT is the total
(measured) neutron rate, RDT is the (measured) 14MeV neutron rate from the DT fusion reactions, RDD
is the (measured) 2.5MeV neutron rate from the DD fusion reactions, and RADD indicates possible
(computed/measured) additional sources of neutrons in the energy range of the JET neutron detectors.
Examples of possible contributions to RADD have been described in Ref.[2], and these could introduce a
large error in the inferred RpT. However, as the background plasma parameters are almost constant over
the various discharges that constitute our database, this error would only be of a systematic nature,
hence by its very nature of no consequence for establishing the scaling laws which are the purpose of
our experimental work. This is further demonstrated in a later section of this Letter.
Different detectors with often different time resolution were used to obtain the individually calibrated
data RTOT, RDT and RDD for the TTE experiments considered here. The total neutron rate RTOT was
measured with three sets of fission chambers located around the Torus. Each set comprises a U235 and a
U238 chamber operating in pulse-counting and current mode. The 2.5MeV neutron emission RDD was
determined by the neutron profile monitor equipped with NE213 liquid scintillators and pulse shape
discrimination hardware. Only neutron events within the energy range 1.8÷3.5MeV were detected, and
a background subtraction was performed to eliminate events associated with higher energy neutrons
(for instance, 14MeV DT-neutrons) that had slowed down, possibly due to scattering in the instrument
itself. Two independent measurements of RDT were performed: with silicon diodes, using the threshold
reactions Si(n,p) and Si(n,α), applied routinely at JET as 14MeV neutron monitor; and with the newly
installed Bicron scintillators, sensitive only to neutrons with En>9MeV, within the neutron profile
monitor diagnostic system. A comprehensive and detailed overview of the various neutron diagnostics
employed during the TTE experiments in JET is given in Refs.[12-17] and the references therein.
In order to combine the data coming from the different neutron detectors used for these experiments,
hence deduce RpT(t), we have devised the procedure described below, which relies upon Gaussian
propagation of the errors to track as accurately as possible the time evolution of the uncertainty on the
computed RpT(t). First, we have integrated the calibrated data from each individual neutron detector
over the longest time window between them all (typically 0.1s÷0.3s depending on the neutron counts)
that was necessary to reduce the relative statistical error on each detector measurement (indicated by
the subscript “NX”) to less than σNX<10%. Such error σNX was evaluated using the Poisson statistics
on the neutron count: σ=1/√N, N being the total neutron count in the chosen time interval. Second, we
provisionally accepted for publication in Nuclear Fusion Letters, April 2009
4
have resampled these data over a 50ms-long time base (i.e., the typical time resolution of the T⊥pFAST
measurements) using linear fitting routines for the steady-state phase of the discharge. This time base is
now common to all neutron detectors. The error on each resulting time point was then determined by
adding the 10% base error to the normalised ratio of the difference between the total neutron count on
the short time interval (C50ms) to the expectation value (CEXP) which was obtained from averaging over
the long time interval: σNX=[0.01+(C50ms-CEXP)2/CEXP2]1/2. As a practical example to clarify this error
propagation process, for an “original” 150ms-long time window used to obtain σNX<10%, with the total
neutron count over the 150ms-long time window CTOT, we have CEXP=CTOT/3. Third, we supplemented
this steady-state analysis for transients such as the ICRF heating switch-on/off phases using guidance
from available modelling for a set of similar discharges, such as that provided by the JETTO [18] and
TRANSP [19] codes. This approach is useful to determine an empirical dependence of RDD(t) and
RDT(t) during these transients as function of various plasma parameters such as the ion temperature,
density, heating power and effective charge. This showed that the expected 2.5MeV DD neutron rate
with ICRF-only heating and low ion temperature Ti<10keV scales linearly with the ICRF heating
power PRF, RDD∝ne2*PRF/ZEFF, where ne is the electron density and ZEFF is the effective charge. On the
other hand, the 14MeV DT neutron rate depends essentially on nT and on the presence of supra-thermal
deuterons, as those obtained via Neutral Beam Injection (NBI): RDT(t)∝nenT*PNBI/ZEFF, where PNBI is
the NBI power. Therefore, to simplify our analysis, we have decided to ignore the NBI heating phase of
all the discharges considered here, including a 300ms time window after the NBI switch-off to allow
for the slowing-down of the high-energy NBI deuterons. Over this phase, we have therefore set RpT=0
by default. We also note that RpT is typically very low at the start (end) of the ICRF heating phase,
before (after) a steady-state fpFAST(E) is established (has decayed) over a few fast proton slowing-down
times. Therefore even large statistical errors on the analysis of these transients do not actually affect the
overall scaling derived here, for which the bulk of the data is obtained during steady-state phases.
It is also important to point out here that, due to the lack of accurate time-resolved measurement of the
tritium concentration, we assumed a constant nT/ne, averaged over the steady-state ICRF heating phase
of each individual discharge. Hence, nT was separately estimated by (a) time-integrating the tritium gas
puff, (b) using the results of the JETTO and TRANSP simulations (when available), and (c) using the
“operational” formula nT/nD≈RDT/(RTOT-RDT)/300, which was used throughout the TTE experimental
campaign to estimate the tritium concentration from the 14MeV neutron rate for an estimated ion
temperature Ti=10keV. Note that Ti(keV)≈3÷5 for the experiments reported here, therefore the estimate
(c) is in principle inaccurate, and it is mainly used here to provide a further constraint on the ratio nT/nD.
provisionally accepted for publication in Nuclear Fusion Letters, April 2009
5
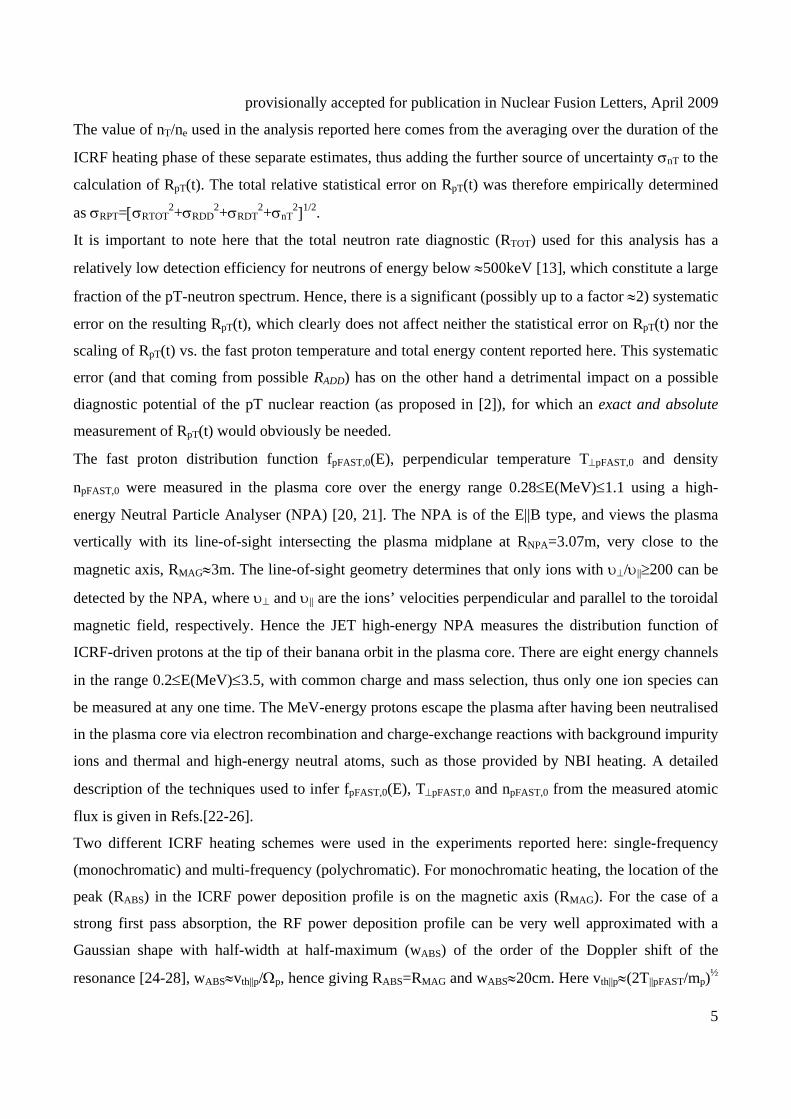
The value of nT/ne used in the analysis reported here comes from the averaging over the duration of the
ICRF heating phase of these separate estimates, thus adding the further source of uncertainty σnT to the
calculation of RpT(t). The total relative statistical error on RpT(t) was therefore empirically determined
as σRPT=[σRTOT2+σRDD
2+σRDT2+σnT
2]1/2.
It is important to note here that the total neutron rate diagnostic (RTOT) used for this analysis has a
relatively low detection efficiency for neutrons of energy below ≈500keV [13], which constitute a large
fraction of the pT-neutron spectrum. Hence, there is a significant (possibly up to a factor ≈2) systematic
error on the resulting RpT(t), which clearly does not affect neither the statistical error on RpT(t) nor the
scaling of RpT(t) vs. the fast proton temperature and total energy content reported here. This systematic
error (and that coming from possible RADD) has on the other hand a detrimental impact on a possible
diagnostic potential of the pT nuclear reaction (as proposed in [2]), for which an exact and absolute
measurement of RpT(t) would obviously be needed.
The fast proton distribution function fpFAST,0(E), perpendicular temperature T⊥pFAST,0 and density
npFAST,0 were measured in the plasma core over the energy range 0.28≤E(MeV)≤1.1 using a high-
energy Neutral Particle Analyser (NPA) [20, 21]. The NPA is of the E||B type, and views the plasma
vertically with its line-of-sight intersecting the plasma midplane at RNPA=3.07m, very close to the
magnetic axis, RMAG≈3m. The line-of-sight geometry determines that only ions with υ⊥/υ||≥200 can be
detected by the NPA, where υ⊥ and υ|| are the ions’ velocities perpendicular and parallel to the toroidal
magnetic field, respectively. Hence the JET high-energy NPA measures the distribution function of
ICRF-driven protons at the tip of their banana orbit in the plasma core. There are eight energy channels
in the range 0.2≤E(MeV)≤3.5, with common charge and mass selection, thus only one ion species can
be measured at any one time. The MeV-energy protons escape the plasma after having been neutralised
in the plasma core via electron recombination and charge-exchange reactions with background impurity
ions and thermal and high-energy neutral atoms, such as those provided by NBI heating. A detailed
description of the techniques used to infer fpFAST,0(E), T⊥pFAST,0 and npFAST,0 from the measured atomic
flux is given in Refs.[22-26].
Two different ICRF heating schemes were used in the experiments reported here: single-frequency
(monochromatic) and multi-frequency (polychromatic). For monochromatic heating, the location of the
peak (RABS) in the ICRF power deposition profile is on the magnetic axis (RMAG). For the case of a
strong first pass absorption, the RF power deposition profile can be very well approximated with a
Gaussian shape with half-width at half-maximum (wABS) of the order of the Doppler shift of the
resonance [24-28], wABS≈vth||p/Ωp, hence giving RABS=RMAG and wABS≈20cm. Here vth||p≈(2T||pFAST/mp)½
provisionally accepted for publication in Nuclear Fusion Letters, April 2009
6
is the parallel thermal velocity of the MeV-energy protons, with T||pFAST≈T⊥pFAST/10, Ωp is the 1st
harmonic cyclotron angular frequency for the protons. Using a similar argument for polychromatic
heating, the total power deposition profile is given by the convolution of those obtained at each
individual ICRF antenna frequency. The width of the power deposition profile can then be empirically
approximated by the geometric mean of the sum of the Doppler width wABS and the position of each
RABS weighted over the relative power density absorbed at the various location [28], giving the value
wABS≈35cm for the cases considered here. Hence, for the same proton density and ICRF power, the
polychromatic heating scheme gives rise, in general, to a lower T⊥pFAST in the plasma core [28-30].
This can be understood by considering the Stix’s scaling T⊥FAST∝ρABS/nFAST [27], where ρABS is the
absorbed ICRF power density.
As typical examples of our measurements, we consider #61259 for the polychromatic heating case, and
#61257 for the monochromatic heating case, respectively. Figure 2a shows the main plasma and ICRF
heating parameters, and fig2b shows the measured and fitted log10(fpFAST,0(E)) at various time points of
interest for #61259. Figures 3a and 3b show the same data for #61257. The NPA measurements were
performed with a 4ms time resolution: the raw data were then integrated over 20-50ms, depending on
the ion count rate, to obtain fpFAST,0(E) with a statistical error below <50%, hence a maximum error on
the inferred T⊥pFAST,0 not exceeding ≈15% [23]. By integrating fpFAST,0(E) over the energy range of the
measurements, one then obtains npFAST,0. We have also verified the value of npFAST,0 using the magnetic
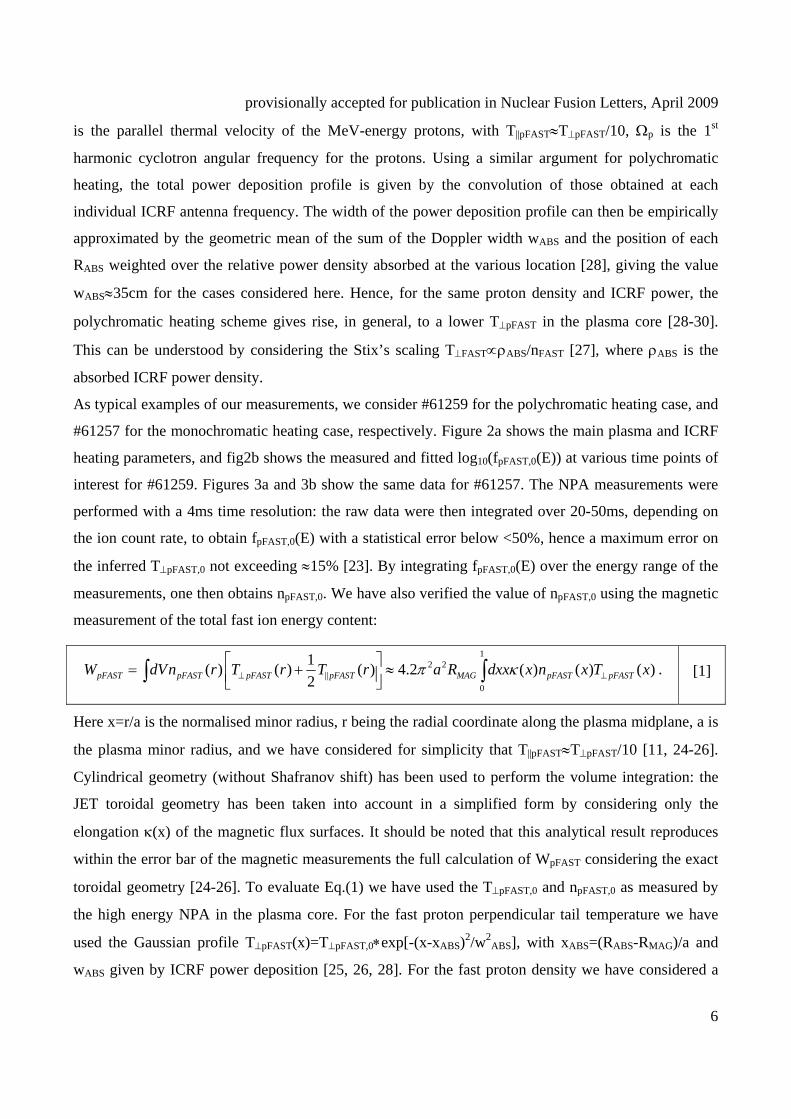
measurement of the total fast ion energy content:
12 2
||0
1( ) ( ) ( ) 4.2 ( ) ( ) ( )2pFAST pFAST pFAST pFAST MAG pFAST pFASTW dVn r T r T r a R dxx x n x T xπ κ⊥ ⊥
⎡ ⎤= + ≈⎢ ⎥⎣ ⎦∫ ∫ . [1]
Here x=r/a is the normalised minor radius, r being the radial coordinate along the plasma midplane, a is
the plasma minor radius, and we have considered for simplicity that T||pFAST≈T⊥pFAST/10 [11, 24-26].
Cylindrical geometry (without Shafranov shift) has been used to perform the volume integration: the
JET toroidal geometry has been taken into account in a simplified form by considering only the
elongation κ(x) of the magnetic flux surfaces. It should be noted that this analytical result reproduces
within the error bar of the magnetic measurements the full calculation of WpFAST considering the exact
toroidal geometry [24-26]. To evaluate Eq.(1) we have used the T⊥pFAST,0 and npFAST,0 as measured by
the high energy NPA in the plasma core. For the fast proton perpendicular tail temperature we have
used the Gaussian profile T⊥pFAST(x)=T⊥pFAST,0∗exp[-(x-xABS)2/w2ABS], with xABS=(RABS-RMAG)/a and
wABS given by ICRF power deposition [25, 26, 28]. For the fast proton density we have considered a
provisionally accepted for publication in Nuclear Fusion Letters, April 2009
7
parabolic profile: npFAST(x)=npFAST,0∗[0.05+0.95∗(1-x2)] [23, 24]. With this approach, and considering
that the error on the magnetic measurement of WpFAST is of the order of 20%, we estimate the error on
npFAST to be of the order of 30%. For the polychromatic heating case (#61259) we have that
T⊥pFAST,0≈430keV during the steady-state ICRF heating phase (PRF=5.5MW, with a volume-average
proton density <npFAST>≈1.4×10¹⁷m-3), compared to T⊥pFAST,0≈490keV for #61257, the monochromatic
heating case with higher PRF=7.5MW and <npFAST>≈5×10¹⁷m-3. This is clearly consistent with the
expected lower T⊥pFAST,0 for polychromatic heating for the same PRF and <npFAST>.
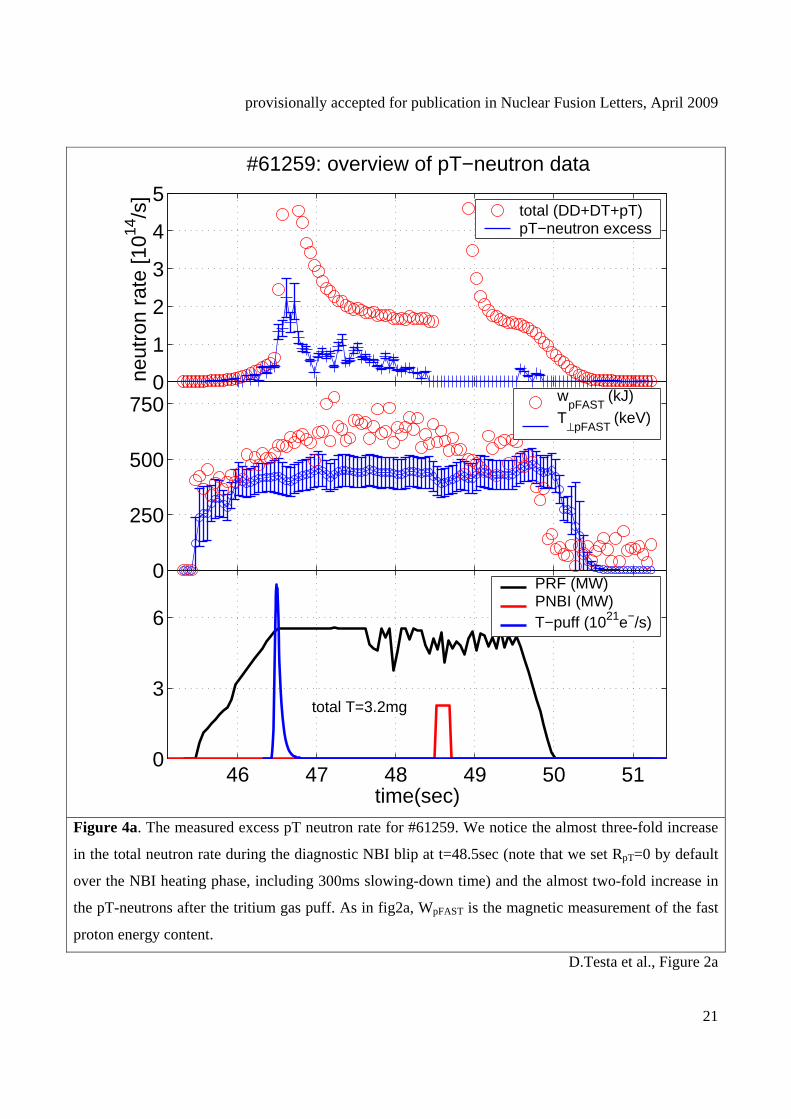
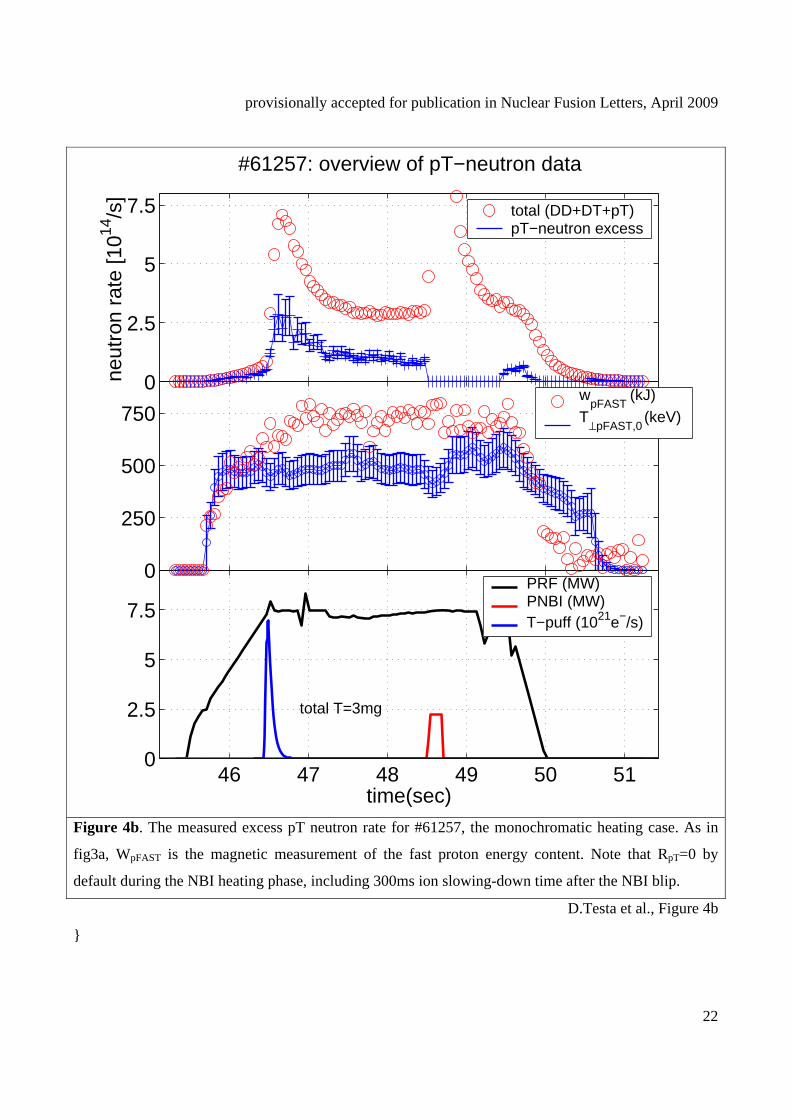
Figures 4a and 4b show the measurements of the pT neutron rate for #61259 and #61257, respectively.
In both these discharges approximately 3mg of tritium were puffed at the beginning of the ICRF
heating phase, with some additional tritium from previous discharges due to recycling from the walls.
We notice that the short 200ms blip of diagnostic NBI around t=48.5sec causes an approximately three-
fold increase in RTOT, due to the DT reactions.
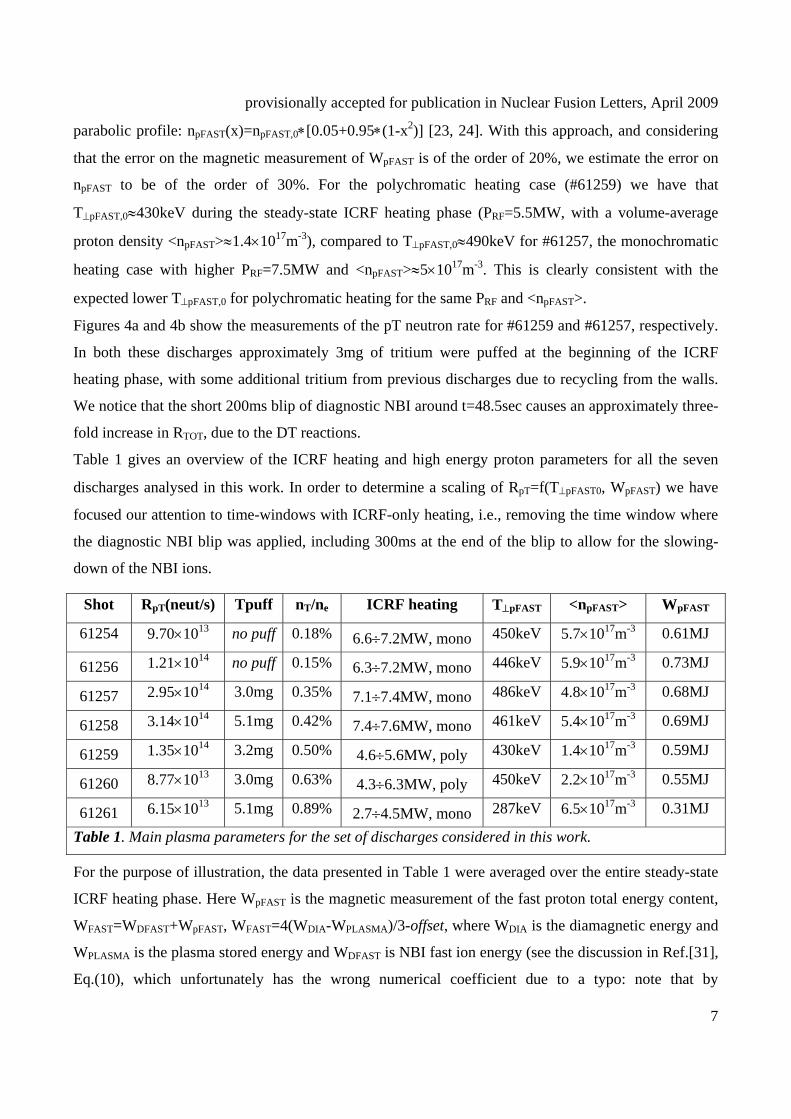
Table 1 gives an overview of the ICRF heating and high energy proton parameters for all the seven
discharges analysed in this work. In order to determine a scaling of RpT=f(T⊥pFAST0, WpFAST) we have
focused our attention to time-windows with ICRF-only heating, i.e., removing the time window where
the diagnostic NBI blip was applied, including 300ms at the end of the blip to allow for the slowing-
down of the NBI ions.
Shot RpT(neut/s) Tpuff nT/ne ICRF heating T⊥pFAST <npFAST> WpFAST
61254 9.70×10¹³ no puff 0.18% 6.6÷7.2MW, mono 450keV 5.7×10¹⁷m-3 0.61MJ
61256 1.21×10¹⁴ no puff 0.15% 6.3÷7.2MW, mono 446keV 5.9×10¹⁷m-3 0.73MJ
61257 2.95×10¹⁴ 3.0mg 0.35% 7.1÷7.4MW, mono 486keV 4.8×10¹⁷m-3 0.68MJ
61258 3.14×10¹⁴ 5.1mg 0.42% 7.4÷7.6MW, mono 461keV 5.4×10¹⁷m-3 0.69MJ
61259 1.35×10¹⁴ 3.2mg 0.50% 4.6÷5.6MW, poly 430keV 1.4×10¹⁷m-3 0.59MJ
61260 8.77×10¹³ 3.0mg 0.63% 4.3÷6.3MW, poly 450keV 2.2×10¹⁷m-3 0.55MJ
61261 6.15×10¹³ 5.1mg 0.89% 2.7÷4.5MW, mono 287keV 6.5×10¹⁷m-3 0.31MJ
Table 1. Main plasma parameters for the set of discharges considered in this work.
For the purpose of illustration, the data presented in Table 1 were averaged over the entire steady-state
ICRF heating phase. Here WpFAST is the magnetic measurement of the fast proton total energy content,
WFAST=WDFAST+WpFAST, WFAST=4(WDIA-WPLASMA)/3-offset, where WDIA is the diamagnetic energy and
WPLASMA is the plasma stored energy and WDFAST is NBI fast ion energy (see the discussion in Ref.[31],
Eq.(10), which unfortunately has the wrong numerical coefficient due to a typo: note that by
provisionally accepted for publication in Nuclear Fusion Letters, April 2009
8
eliminating the NBI time window, no contribution to WFAST from the NBI high energy deuterons is
expected, hence WFAST=WpFAST). Note also that we have set RpT=0 over the NBI heating phase by
default.
We notice from the comparison between fig4a and fig4b that the effect of the different heating scheme
is mainly to change the fast proton temperature and energy content for a given PRF and <npFAST>.
Hence, it is possible to combine the data from these two different experimental scenarios into one
single database and compare the value of RpT simply as function of the fast ion temperature and energy
content. Moreover, an exact analytical model of the dependence of RpT on the measured T⊥pFAST,0 and
WpFAST can be obtained by considering that the JET high-energy NPA measures the distribution
function of ICRF-driven protons at the tip of their banana orbit in the plasma centre.
Although the precision of this model calculation is somewhat hampered by the limited knowledge of
the actual distribution function of the fast protons, this analysis provides however a clear demonstration
that the inferred absolute values of RpT are indeed reasonable and in sufficiently good agreement with
the direct RpT measurements, which in turns considerably strengthens our overall conclusions about the
dependence of RpT on the fast proton temperature and total energy content. This analytical calculation
also provides upper bounds for the errors associated with our models for the fast proton distribution
function, as it will be shown in fig5a by comparing the different estimates obtained for RpT by using
different models for the fast proton distribution functions.
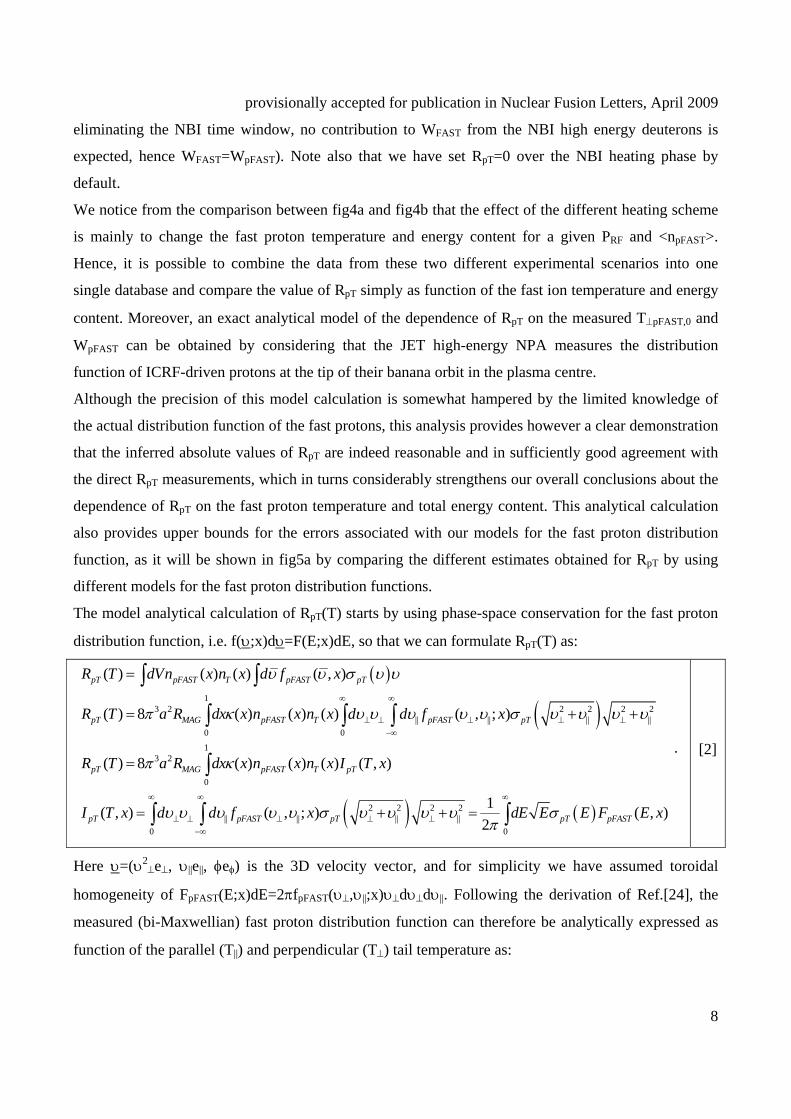
The model analytical calculation of RpT(T) starts by using phase-space conservation for the fast proton
distribution function, i.e. f(υ;x)dυ=F(E;x)dE, so that we can formulate RpT(T) as:
( )
( )1
3 2 2 2 2 2|| || || ||
0 01
3 2
0
|0
( ) ( ) ( ) ( , )
( ) 8 ( ) ( ) ( ) ( , ; )
( ) 8 ( ) ( ) ( ) ( , )
( , )
pT pFAST T pFAST pT
pT MAG pFAST T pFAST pT
pT MAG pFAST T pT
pT
R T dVn x n x d f x
R T a R dx x n x n x d d f x
R T a R dx x n x n x I T x
I T x d d
υ υ σ υ υ
π κ υ υ υ υ υ σ υ υ υ υ
π κ
υ υ υ
∞ ∞
⊥ ⊥ ⊥ ⊥ ⊥−∞
∞
⊥ ⊥
=
= + +
=
=
∫ ∫
∫ ∫ ∫
∫
∫ ( ) ( )2 2 2 2| || || ||
0
1( , ; ) ( , )2pFAST pT pT pFASTf x dE E E F E xυ υ σ υ υ υ υ σπ
∞ ∞
⊥ ⊥ ⊥−∞
+ + =∫ ∫
. [2]
Here υ=(υ2⊥e⊥, υ||e||, φeφ) is the 3D velocity vector, and for simplicity we have assumed toroidal
homogeneity of FpFAST(E;x)dE=2πfpFAST(υ⊥,υ||;x)υ⊥dυ⊥dυ||. Following the derivation of Ref.[24], the
measured (bi-Maxwellian) fast proton distribution function can therefore be analytically expressed as
function of the parallel (T||) and perpendicular (T⊥) tail temperature as:
provisionally accepted for publication in Nuclear Fusion Letters, April 2009
9
( ) ( )2
1,1 2
||
2 ( , ) 1( , ) exp 1( ) ( ) ( ) ( )1 1 3 1 / 2pFAST
EFF
C E x E E EF E xT x T x T x T x
απ α α α ⊥ ⊥
⎛ ⎞ ⎡ ⎤= − −⎜ ⎟ ⎢ ⎥⎡ ⎤− − − ⎝ ⎠ ⎣ ⎦⎣ ⎦
. [3]
Here C1(E,x) is a normalisation constant such that ∫FpFAST,1(E)dE=1, α(x)=[T⊥(x)-TEFF(x)]/T⊥(x) and
TEFF(x) is the overall effective temperature of the bi-Maxwellian distribution function f(υ⊥,υ||) defined
as TEFF=[T(E*)/G(E)]×[dG(E)/dE](E=E*), where E* is the median energy of F(E), G(E)=F(E)/√E and
T(E*) is the temperature deduced from the leading order Maxwellian term of Eq.(3). A practical
analytical model for TEFF(x) can be derived from the analysis presented in Refs.[24-26] as:
)(54
)()(
1)(/)(1)()(4
52)( )()(
||
||
2||
2
||xT
xTxT
erfxTxTxTxT
xT xTxTEFF ⊥<<⊥⊥
⊥ ⎯⎯⎯⎯ →⎯⎟⎟⎠
⎞⎜⎜⎝
⎛−
−
+=
⊥
π . [4]
Note that this derivation would conserve the isotropy of the distribution function in the cases where
T||=T⊥=T, since it then gives TEFF=T. Note however that these specific cases are not those dealt with in
this work, as for ICRF heating we do have indeed a strong anisotropy, T||<<T⊥, hence TEFF≈T⊥.
Alternatively, following the derivation of Refs.[25, 26], a model pitch-angle-averaged distribution
function for the high-energy protons can be obtained for T||≠T⊥ as:
( ) ||2,2
||||
( ),( , ) exp 1
( ) ( ) ( )( ) 1 ( ) / ( )pFASTEFFEFF
T xC E x E EF E x erfT x T x T xT x T x T x ⊥⊥
⎛ ⎞⎛ ⎞= − −⎜ ⎟⎜ ⎟ ⎜ ⎟− ⎝ ⎠ ⎝ ⎠
, [5]
where C2(E,x) is, again, a normalisation constant such that ∫FpFAST,2(E)dE=1, and we used the definition
of the error function erf(z).
The averaging of <σpT(υ)υ> over FpFAST(E;x) or fpFAST(υ,x), i.e. the integral IpT(T,x) entering Eq.(2),
can be performed numerically using the two analytic model distribution functions of Eq.(3) and Eq.(5),
which are rather different from the single-Maxwellian model fpFAST(E)=C0exp(-E/T)/T of Refs.[2, 32].
In particular, we note that the energy (or velocity) and space integration required to compute RpT(T) are
now heavily convoluted due to the dependence of T⊥=T⊥(x). This analytic treatment for IpT(T,x) can be
taken further by considering the local normalised energy t=E/TEFF(x)=(E/T0)∗exp(z(x)2)/(1-α(x))=t(x),
where z=(x-x0)/Δ, and expanding exp[-exp(z2)]=exp(-Σnzn/n!). The full series expansion leads to the
exact but rather cumbersome expression IpT(x,T0)=∑nCnz(x)nK(2n+1)/4(z(x),T0)/(1-α(x))n, where the
functions K’s are modified Bessel functions of rational order. This series expansion is primarily useful
to separate the x and T0 variables in the energy integral giving IpT(T,x). Considering now only a 2nd
provisionally accepted for publication in Nuclear Fusion Letters, April 2009
10
order z-expansion, redefining the variable t=E/TEFF(x=0), using α0=α(x=0) and β(x)=T||(x)/T⊥(x), with
β0=β(x=0), we finally obtain for IpT(T0,x) the much more manageable expressions:
( )( ) ( )
22
,1 0 0 1 0 020
2 1 ( ) ( )( , ) exp ( , ) 1 121 3 ( ) 1 ( ) / 2
tpT
x z xI x T T dt t C t x te tx x
ασ α α
π α α
∞−⎛ ⎞−⎡ ⎤= − − −⎜ ⎟ ⎣ ⎦⎡ ⎤− − ⎝ ⎠⎣ ⎦
∫ , [6a]
( )
( )( )
2||
,2 0 0 2||0||
20
,2 0 0 2 000
( )1 ( ) ( )( )( , ) exp ( , ) 12 ( ) ( )1 ( ) / ( )
1 ( ) 1( )( , ) exp ( , ) 121 ( ) / ( )
t EFFpT
tpT
T xx T xz xI x T T dtC t x t te erf tT x T xT x T x
x z xI x T T dtC t x t te erf tx x
ασ
α βσ αββ β
∞−
⊥⊥
∞−
⎛ ⎞⎛ ⎞−= − −⎜ ⎟⎜ ⎟ ⎜ ⎟− ⎝ ⎠ ⎝ ⎠
⎛ ⎞⎛ ⎞− −= − −⎜ ⎟⎜ ⎟ ⎜ ⎟− ⎝ ⎠ ⎝ ⎠
∫
∫. [6b]
To perform this analytical computation of RpT, we consider Gaussian-type radial profiles for the fast
proton perpendicular and parallel temperatures, as given by ICRF physics: T⊥(x)=T0∗exp[-(x-x0)2/Δ2]
and T||(x)=Te(x)+0.1∗[T⊥(x)]0.8. We also assume the following model parabolic radial profiles for the
fast proton and thermal triton density, the electron temperature and the plasma elongation:
( )( )[ ]12110 11)( γxaanxn pp −−+= , a1=0.05, γ1=1; [7a]
( )( )[ ]22220 11)( γxaanxn TT −−+= , a2=0.1, γ2=1; [7b]
( )( )[ ]32330 11)( γxaaTxT ee −−+= , a3=0.1, γ3=1.5; [7c]
42
210)( xxx κκκκ ++= , κ0=1.2, κ1=0.25, κ2=0.2. [7d]
For illustration purposes, we have taken x0=0.05, Δ=0.2 to determine the profile of T⊥(x), i.e., here we
consider explicitly only the case of monochromatic heating.
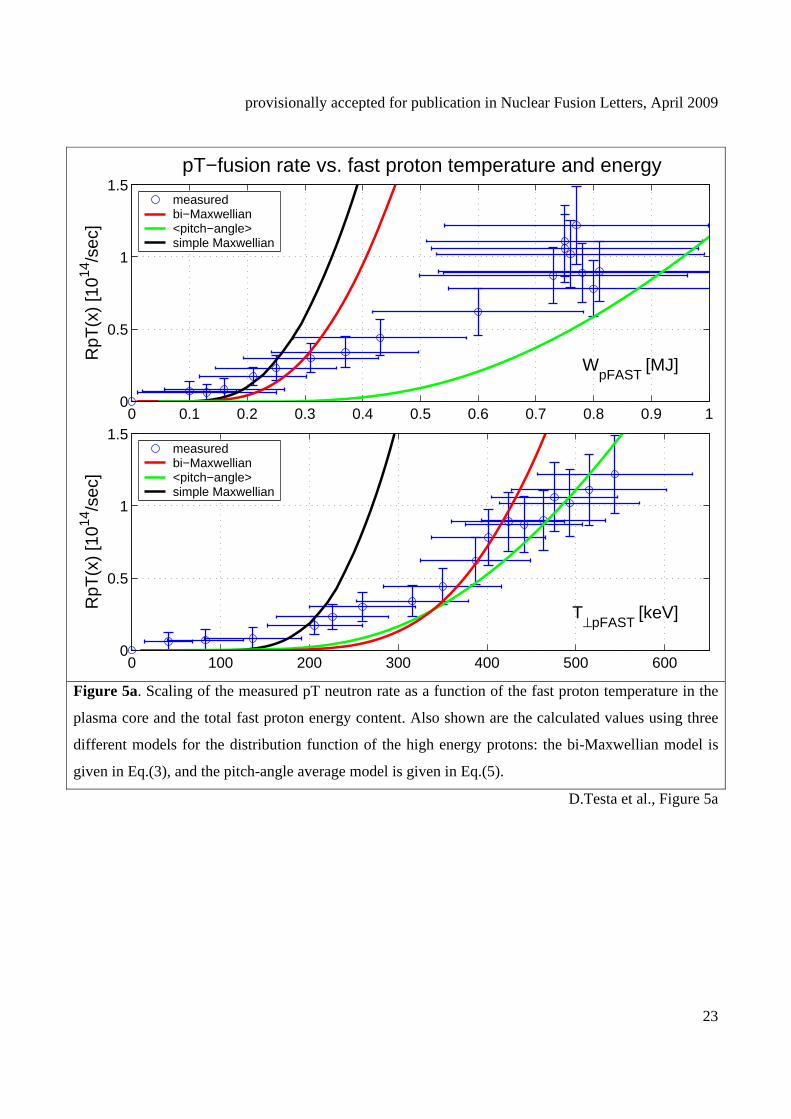
Figure 5a presents the scaling of the measured RpT as function of T⊥pFAST,0 and WpFAST for the data
points obtained during the ICRF-only heating phase of the discharges indicated in Table 1, together
with the calculated values using different approximations for the distribution function of the high-
energy protons. We have focused our attention primarily to the data points collected over the steady-
state heating phase, where we typically have that T⊥pFAST,0(keV)=250÷550. In addition to these points,
which constitute the bulk of our data, we have also considered data points collected during the transient
phases (ICRF power switch on/off) to provide boundary values for the RpT scaling at low T⊥pFAST,0 and
WpFAST. In fig5a we have normalised the measured and computed RpT with respect to the tritium
concentration nT/ne and the fast proton concentration <npFAST/ne> (as given in Table 1) to take into
account the changing (p, T) ion densities over the various discharges considered in this work. This
provisionally accepted for publication in Nuclear Fusion Letters, April 2009
11
removes from our database the obvious density dependency RpT∝nTnpFAST. We have then integrated the
time-resolved measurements of RpT(t) over a sufficiently long time window (typically 50-100ms) to
reduce the maximum statistical error on RpT(t) to no more than 30%. Finally, to remove some cluttering
from fig5a, we have reduced the number of points by clustering the individual RpT=f(T⊥pFAST,0, WpFAST)
data points over a smaller number of close-by values of T⊥pFAST,0 and WpFAST, since values of RpT±σRPT
are obtained for values of T⊥pFAST,0 and WpFAST within their respective statistical error. Note that this
approach conserves the database marginals, i.e. the global probability function in the “reduced”
database for the measured RpT to be in a certain range of T⊥pFAST,0 and WpFAST does not change by more
than σRPT/2 in the original database. Therefore, the error bars shown in fig5a are the sum of the
uncertainties in the measurements together with the scatter in the “original” data, which was implicitly
smoothed out through this clustering process.
The variations between the calculated RpT are related to the differences in the radial profiles of the fast
proton distribution functions used for this calculations. The qualitative and quantitative agreement
between the measured and computed values of RpT is strikingly remarkable considering the very simple
analytical models we have used for the fast proton distribution function, the plasma geometry and the
background plasma parameters. This further confirms that the detailed kinematics of the pT-neutron
production does not affect this scaling, as we are not considering the precise details of the neutron
energy spectra (for instance: the number of pT-neutrons per unit solid angle in different energy ranges),
but only the total number of measured pT-neutrons (i.e., the value integrated over the full energy range
of the measurements made with the JET neutron detectors). Moreover, this agreement gives rise to
some optimism towards possible future uses of the pT-fusion reactions for diagnostic purposes, as
proposed in [2], provided an exact absolute calibration of the measured RpT data can be routinely
achieved.
Figure 5a shows that RpT increases almost linearly with T⊥pFAST,0 for T⊥pFAST,0>200keV, being very
small and almost constant for T⊥pFAST,0<200keV, consistent with the much lower number of protons
with high energy EpCM>764keV for lower T⊥pFAST,0. The almost linear dependence RpT∝T⊥pFAST,0 is not
a trivial result: RpT∝nTnpFAST×<σpT(v)υpFAST>, averaged over the fast proton distribution function and
integrated over the plasma volume. Similarly, RpT increases almost linearly with WpFAST up to
WpFAST≈700kJ, and then shows some indication of possible saturation at higher WpFAST, where many
RPT points are bunched together for WpFAST(kJ)=700 810. This is particularly clear when comparing
the measurements with the calculated values. However, since the range of the WpFAST measurements
for the discharges considered here does not exceed WpFAST≈810kJ, it is not possible to substantiate this
provisionally accepted for publication in Nuclear Fusion Letters, April 2009
12
experimental result more systematically. The saturation of RpT at high WpFAST could be due to radial
diffusion of the high energy protons induced by the magneto-hydrodynamic instabilities observed in
the discharges considered here, such as Alfvén Eigenmodes and fishbones.
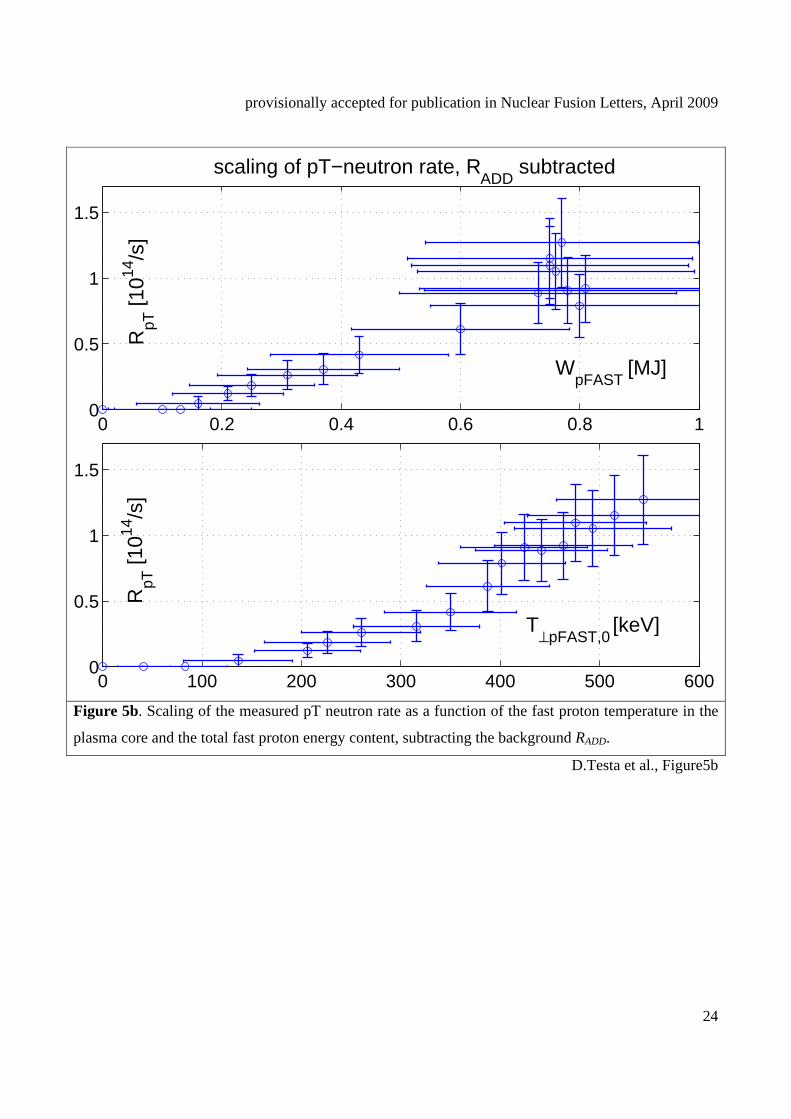
Considering now the role of additional neutron producing mechanisms, summed up in the general RADD
term described earlier, we note that, when neglecting recycling from the walls, the first two discharges
in our database should have RpT=0 as there was no tritium gas puff. Hence, as a pessimistic estimate for
such RADD, we can consider that all supposed pT neutrons for these two discharges must actually be
accounted for by RADD, hence subtract this value from the other discharges as a background, and repeat
the procedure used to obtain fig5a which was described above. Figure 5b then shows the result of this
further analysis: we note that the approximately linear scaling of RpT=f(T⊥pFAST,0, WpFAST) determined
from fig5a is maintained but now with a different offset. This confirms that even in the worst case, the
various RADD mechanisms are only introducing a systematic error in the analysis reported here.
In summary, the dependence of the pT neutron rate RpT has been analysed as a function of the core
perpendicular fast proton temperature T⊥pFAST,0 and proton energy content WpFAST for monochromatic
and polychromatic ICRF heating. It is found that RpT increases almost linearly with T⊥pFAST,0 in the
range 200<T⊥pFAST,0(keV)<600. This scaling is non-trivial, as we have demonstrated using two distinct
analytic formulations for the fast proton distribution function. No appreciable difference can be related
to the different ICRF heating scheme, their main effect being that of producing a different T⊥pFAST(x).
Similarly, RpT increases almost linearly with WpFAST. At the largest values of WpFAST>700kJ, the error
bars prevent us from drawing strong conclusions regarding a possible saturation of RpT at these values
of WpFAST which could be expected if the fast protons were to be depleted from the plasma core at
higher fast proton temperature due to radial transport induced by magneto-hydrodynamic instabilities.
The authors would like to acknowledge the contribution of the whole JET experimental team, and in
particular M.de Baar, P.Beaumont, J.Brzozowski and M.Santala for the preparation of the experimental
schedule and M.Adams, L.Bertalot, S.Conroy, S.Popovichev and V.Kiptily for providing the neutron
data used for this analysis.
This work has been conducted under the European Fusion Development Agreement. D.Testa was
partly supported by the Fond National Suisse pour la Recherche Scientifique, Grant 620-062924.

provisionally accepted for publication in Nuclear Fusion Letters, April 2009
13
References.
1. H.Liskien and A.Paulsen, Nucl. Data Tables 11 (1973), 569.
2. M.Santala et al., Plasma Phys. Control. Fusion 48 (2006), 1233.
3. J.Wesson, Tokamaks, 3rd edition, (Oxford Science Publication, Oxford, 2003), p.617.
4. G.Kaye and T.Laby, Tables of Physical and Chemical Constants, Longman Publishing, London
(1995), page 546 and following.
5. Progress in the ITER Physics Basis, Nucl. Fusion 47 (2007).
6. H.Henriksson et al., Plasma Phys. Control. Fusion 44 (2002), 1253.
7. M.Tardocchi et al., Nucl. Fus. 42 (2002), 1273.
8. H.Henriksson et al., Plasma Phys. Control. Fusion 47 (2005), 1763.
9. M.Mantsinen et al., Nucl. Fusion 41 (2001), 1815.
10. K.-D.Zastrow et al., Plasma Phys. Control. Fusion 46 (2004), B255.
11. D.Stork et al., Nucl. Fusion 45 (2005), S181.
12. L.Bertalot et al., Fusion Engineering and Design 74 (2005), 835.
13. M.Swinhoe and O.Jarvis, Nucl. Instrum. Meth. 221 (1984), 460.
14. M.Loughlin et al., Rev. Sci. Instrum. 70 (1999), 1123.
15. B.Esposito et al., Rev. Sci. Instrum. 75 (2004), 3350.
16. S.Popovichev et al., Performance of neutron measurements during JET trace tritium experiments,
Proceedings 31st EPS Conference on Controlled Fusion and Plasma Physics, London (UK), 2004,
see http://epsppd.epfl.ch/London/pdf/P5_173.pdf.
17. Y.Kaschuck et al., Neutron measurements during trace tritium experiments at JET using a stilbene
detector, Proceedings 31st EPS Conference on Controlled Fusion and Plasma Physics, London
(UK), 2004, see http://epsppd.epfl.ch/London/pdf/P5_174.pdf.
18. G.Cenacchi, A.Taroni, JETTO: a free-boundary plasma transport code, Report ENEA-RT-T113-
88-5, 1988.
19. R.Budny et al., Phys. of Plasmas 7 (2000), 5038.
20. A.Korotkov and A.Gondhalekar, 21st European Physical Society Conference on Controlled Fusion
and Plasma Physics, Europhysics Conference Abstract 18-B(1994), I-266.
21. K.McClements et al., Nucl. Fusion 37 (1997), 473.
22. A.Korotkov et al., Nucl. Fusion 37 (1997), 35.
23. C.Schlatter et al., Rev. Sci. Instrum. 75 (2004), 3547.
24. D.Testa, A.Gondhalekar, Nucl. Fusion 40 (2000), 975.
25. D.Testa et al., Phys. Plasmas 6 (1999), 3489.

provisionally accepted for publication in Nuclear Fusion Letters, April 2009
14
26. D.Testa et al., Phys. Plasmas 6 (1999), 3498.
27. T.Stix, Waves in Plasmas, (American Institute of Physics, New York, USA, 1992), chapter 17.
28. D.Testa et al., Plasma Phys. Control. Fusion 46 (2004), S59.
29. D.Testa et al., Nucl. Fusion 45 (2005), 907.
30. M.Mantsinen et al., Comparison of monochromatic and polychromatic heating in JET, Proceedings
15th Topical Conference on Radio Frequency Power in Plasmas, Moran (USA) , edited by Cary B.
Forest, Springer-Verlag publication, Plasma Physics Series, vol.694, 2003.
31. L.-G.Eriksson et al., Nucl. Fus. 33 (1993), 1037.
32. M.Santala et al., pT fusion by RF-heated protons in JET trace tritium discharges, Proceedings 31st
EPS Conference on Controlled Fusion and Plasma Physics, London (UK), 2004, see
http://epsppd.epfl.ch/London/pdf/P5_163.pdf.
provisionally accepted for publication in Nuclear Fusion Letters, April 2009
15
Figure Captions.
Figure 1. The cross-section for the fusion reaction involving deuterium, tritium and protons (from
Ref.[4]). The pT-fusion cross section is the largest between those typically occurring in fusion plasmas
for proton energies (in the centre-of-mass frame of reference) above EpCM>2MeV.
Figure 2a. Main plasma and ICRF heating parameters for #61259, the reference polychromatic heating
case. Here RFx indicates the four ICRF generators, τSP0 and <np> are the core fast ion slowing down
time and volume average proton density, respectively, ne0 and Te0 are the central electron density and
temperature, q is the safety factor, and WpFAST is the magnetic measurement of the fast proton energy.
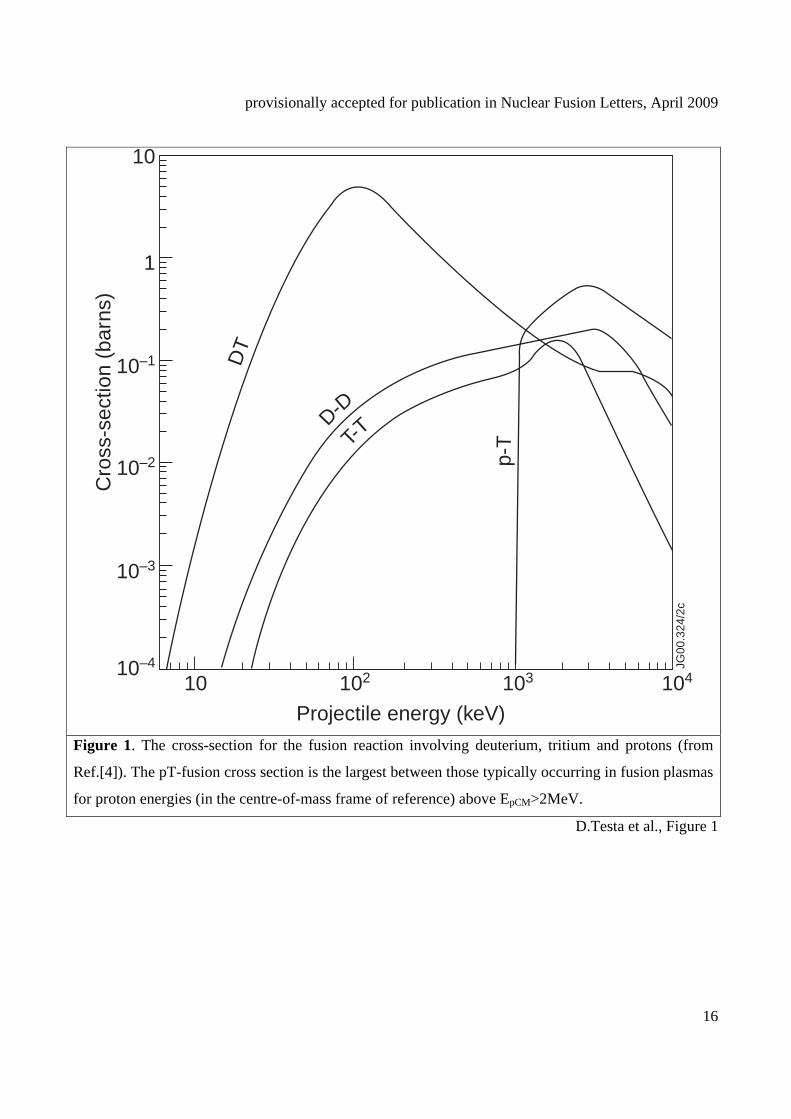
Figure 2b. The measured (markers) and fitted (line) fast ion distribution for #61259 at various time
points of interest during the ICRF time window.
Figure 3a. Main plasma and ICRF heating parameters for #61257, the comparison monochromatic
heating case at higher PRF and <npFAST>.
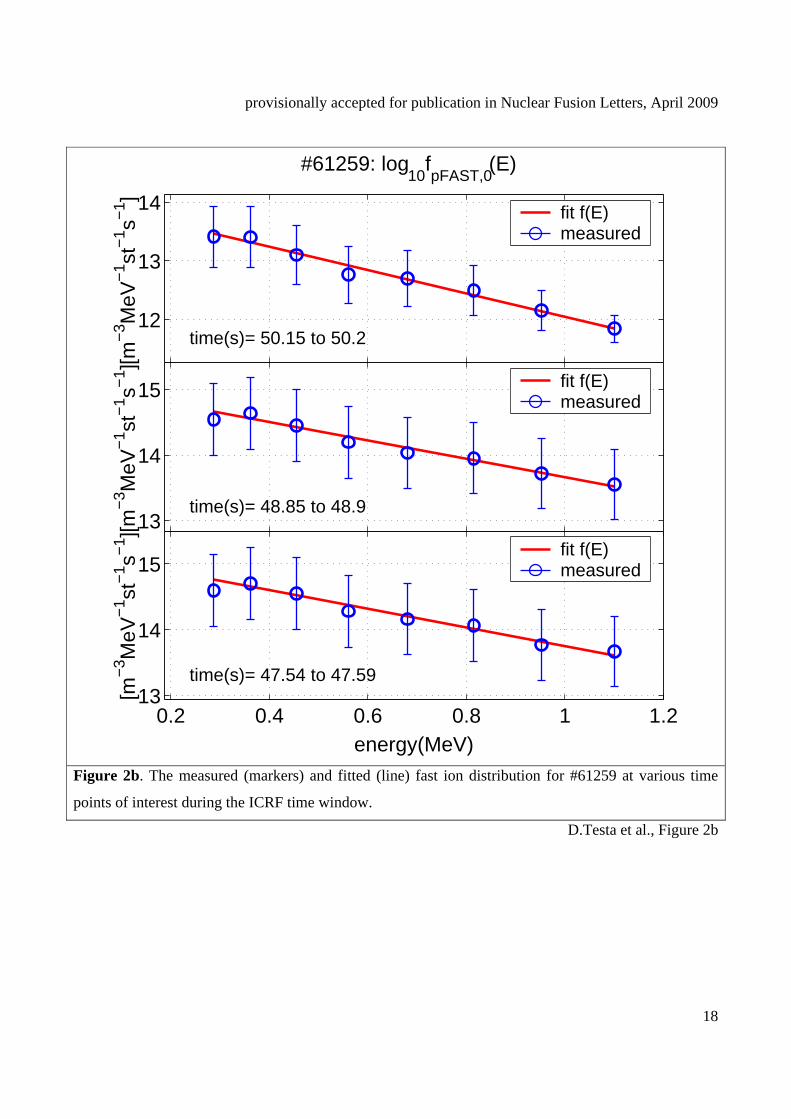
Figure 3b. The measured (markers) and fitted (line) fast ion distribution for #61257 at various time
points of interest during the ICRF time window.
Figure 4a. The measured excess pT neutron rate for #61259. We notice the almost three-fold increase
in the total neutron rate during the diagnostic NBI blip at t=48.5sec (note that we set RpT=0 by default
over the NBI heating phase, including 300ms slowing-down time) and the almost two-fold increase in
the pT-neutrons after the tritium gas puff. As in fig2a, WpFAST is the magnetic measurement of the fast
proton energy content.
Figure 4b. The measured excess pT neutron rate for #61257, the monochromatic heating case. As in
fig3a, WpFAST is the magnetic measurement of the fast proton energy content. Note that RpT=0 by
default during the NBI heating phase, including 300ms ion slowing-down time after the NBI blip.
Figure 5a. Scaling of the measured pT neutron rate as a function of the fast proton temperature in the
plasma core and the total fast proton energy content. Also shown are the calculated values using three
different models for the distribution function of the high energy protons: the bi-Maxwellian model is
given in Eq.(3), and the pitch-angle average model is given in Eq.(5).
Figure 5b. Scaling of the measured pT neutron rate as a function of the fast proton temperature in the
plasma core and the total fast proton energy content, subtracting the background RADD.
provisionally accepted for publication in Nuclear Fusion Letters, April 2009
16
10
1
10–1
10–2
10–3
10–4
10 102 103 104JG
00.3
24/2
c
Projectile energy (keV)
Cro
ss-s
ectio
n (b
arns
)
DT
D-D
T-T
p-T
Figure 1. The cross-section for the fusion reaction involving deuterium, tritium and protons (from
Ref.[4]). The pT-fusion cross section is the largest between those typically occurring in fusion plasmas
for proton energies (in the centre-of-mass frame of reference) above EpCM>2MeV.
D.Testa et al., Figure 1

provisionally accepted for publication in Nuclear Fusion Letters, April 2009
17
46 47 48 49 50 5102468
time(sec)
ne0(1019m−3)Te0(keV)q(r/a=0)q(r/a=0.95)PNBI(MW)
2
4
6PRF(MW)<np>(1017m−3)τSP0(sec)
3
3.15
3.3
Res
.Pos
.(m
)
RFARFBRFCRFD<mean>
0
1
2
3
PR
F(M
W)
RFARFBRFCRFD
0200400600800
61259: overview of fast proton data
WpFAST
(kJ)T
⊥pFAST,0(keV)
Figure 2a. Main plasma and ICRF heating parameters for #61259, the reference polychromatic heating
case. Here RFx indicates the four ICRF generators, τSP0 and <np> are the core fast ion slowing down
time and volume average proton density, respectively, ne0 and Te0 are the central electron density and
temperature, q is the safety factor, and WpFAST is the magnetic measurement of the fast proton energy.
D.Testa et al., Figure 2a
provisionally accepted for publication in Nuclear Fusion Letters, April 2009
18
0.2 0.4 0.6 0.8 1 1.213
14
15
energy(MeV)
[m−
3 MeV
−1 st
−1 s−
1 ]
time(s)= 47.54 to 47.59
fit f(E)measured
13
14
15
[m−
3 MeV
−1 st
−1 s−
1 ]
time(s)= 48.85 to 48.9
fit f(E)measured
12
13
14
[m−
3 MeV
−1 st
−1 s−
1 ]
#61259: log10
fpFAST,0
(E)
time(s)= 50.15 to 50.2
fit f(E)measured
Figure 2b. The measured (markers) and fitted (line) fast ion distribution for #61259 at various time
points of interest during the ICRF time window.
D.Testa et al., Figure 2b

provisionally accepted for publication in Nuclear Fusion Letters, April 2009
19
46 47 48 49 50 510
2.5
5
7.5
time(sec)
ne0(1019m−3)Te0(keV)q(r/a=0)q(r/a=0.95)PNBI(MW)
0
2.5
5
7.5PRF(MW)<np>(1017m−3)τSP0(sec)
2.98
3.02
Res
.Pos
.(m
)
RFARFBRFCRFD<mean>
0
1.5
3
PR
F(M
W) RFA
RFBRFCRFD
0
250
500
750
#61257: overview of fast proton data
wpFAST
(kJ)T
⊥pFAST,0(keV)
Figure 3a. Main plasma and ICRF heating parameters for #61257, the comparison monochromatic
heating case at higher PRF and <np>.
D.Testa et al., Figure 3a
provisionally accepted for publication in Nuclear Fusion Letters, April 2009
20
0.2 0.4 0.6 0.8 1 1.2
13.5
14
14.5
15
15.5
energy(MeV)
[m−
3 MeV
−1 st
−1 s−
1 ]
time(s)= 47.54 to 47.59
measuredfit f(E)
13.5
14
14.5
15
15.5
[m−
3 MeV
−1 st
−1 s−
1 ]
time(s)= 48.85 to 48.9
measuredfit f(E)
12.5
13
13.5
14
14.5
[m−
3 MeV
−1 st
−1 s−
1 ]
#61257: log10
fpFAST,0
(E)
time(s)= 50.15 to 50.2
measuredfit f(E)
Figure 3b. The measured (markers) and fitted (line) fast ion distribution for #61257 at various time
points of interest during the ICRF time window.
D.Testa et al., Figure 3b
provisionally accepted for publication in Nuclear Fusion Letters, April 2009
21
46 47 48 49 50 510
3
6
time(sec)
total T=3.2mg
PRF (MW)PNBI (MW)T−puff (1021e−/s)
0
250
500
750 wpFAST
(kJ)T
⊥pFAST (keV)
0
1
2
3
4
5
neut
ron
rate
[1014
/s]
#61259: overview of pT−neutron data
total (DD+DT+pT)pT−neutron excess
Figure 4a. The measured excess pT neutron rate for #61259. We notice the almost three-fold increase
in the total neutron rate during the diagnostic NBI blip at t=48.5sec (note that we set RpT=0 by default
over the NBI heating phase, including 300ms slowing-down time) and the almost two-fold increase in
the pT-neutrons after the tritium gas puff. As in fig2a, WpFAST is the magnetic measurement of the fast
proton energy content.
D.Testa et al., Figure 2a
provisionally accepted for publication in Nuclear Fusion Letters, April 2009
22
46 47 48 49 50 510
2.5
5
7.5
time(sec)
total T=3mg
PRF (MW)PNBI (MW)T−puff (1021e−/s)
0
250
500
750w
pFAST (kJ)
T⊥pFAST,0
(keV)
0
2.5
5
7.5
neut
ron
rate
[1014
/s]
#61257: overview of pT−neutron data
total (DD+DT+pT)pT−neutron excess
Figure 4b. The measured excess pT neutron rate for #61257, the monochromatic heating case. As in
fig3a, WpFAST is the magnetic measurement of the fast proton energy content. Note that RpT=0 by
default during the NBI heating phase, including 300ms ion slowing-down time after the NBI blip.
D.Testa et al., Figure 4b
}
provisionally accepted for publication in Nuclear Fusion Letters, April 2009
23
0 100 200 300 400 500 6000
0.5
1
1.5
T⊥pFAST [keV]R
pT(x
) [1
014/s
ec]
0 0.1 0.2 0.3 0.4 0.5 0.6 0.7 0.8 0.9 10
0.5
1
1.5
RpT
(x)
[1014
/sec
]
WpFAST
[MJ]
pT−fusion rate vs. fast proton temperature and energy
measuredbi−Maxwellian<pitch−angle>simple Maxwellian
measuredbi−Maxwellian<pitch−angle>simple Maxwellian
Figure 5a. Scaling of the measured pT neutron rate as a function of the fast proton temperature in the
plasma core and the total fast proton energy content. Also shown are the calculated values using three
different models for the distribution function of the high energy protons: the bi-Maxwellian model is
given in Eq.(3), and the pitch-angle average model is given in Eq.(5).
D.Testa et al., Figure 5a
provisionally accepted for publication in Nuclear Fusion Letters, April 2009
24
0 100 200 300 400 500 6000
0.5
1
1.5
T⊥pFAST,0
[keV]
RpT
[1014
/s]
0 0.2 0.4 0.6 0.8 10
0.5
1
1.5
WpFAST
[MJ]
RpT
[1014
/s]
scaling of pT−neutron rate, RADD
subtracted
Figure 5b. Scaling of the measured pT neutron rate as a function of the fast proton temperature in the
plasma core and the total fast proton energy content, subtracting the background RADD.
D.Testa et al., Figure5b