the demographic transition model (dtm) population changes the total population of an area depends...
TRANSCRIPT

The Demographic Transition Model (DTM)

Population Changes
• The total population of an area depends upon changes in the natural increase and migration.
• The natural increase (or decrease) is the difference between the birth rate and the death rate.
• The birth rate is the number of live births in a year for every 1000 people in the total population.
• The death rate is the number of people in every 1000 who die in a year.
• If the birth rate is higher then the total population will increase. If the death rate is higher then the total population will decrease.

The Demographic Transition Model
• The DTM describes a sequence of changes in the relationship between birth rates and death rates.
• The model was produced using changes in the natural increase in several industrialised countries in western Europe and North America.
• It suggests that the population growth rates for all countries can be divided into four stages
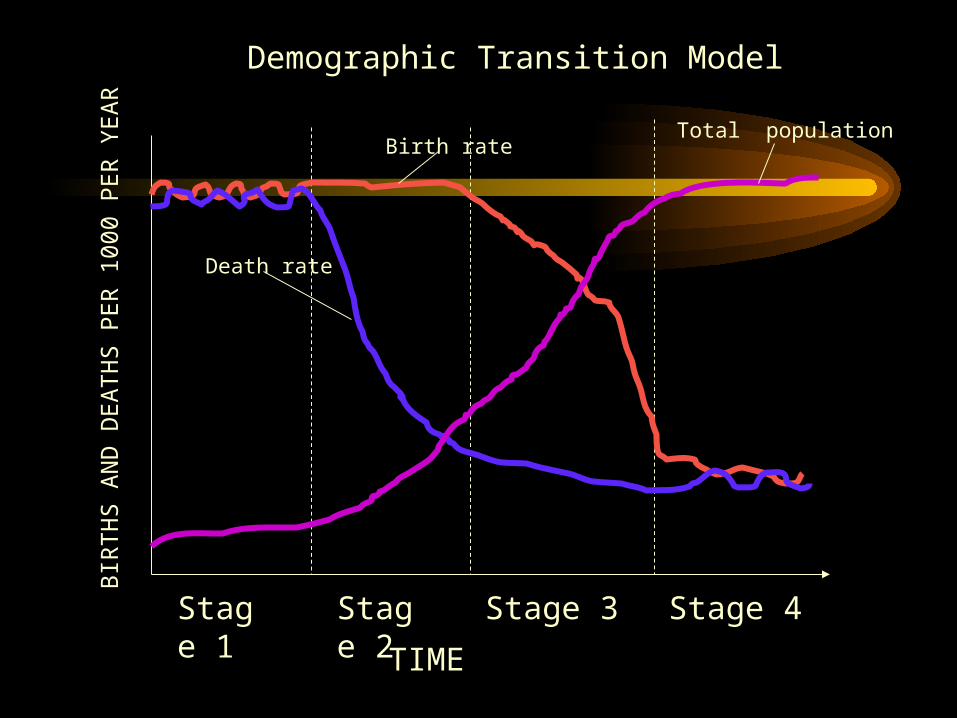
Demographic Transition Model
Stage 1 Stage 2 Stage 3 Stage 4
TIME
BIR
TH
S A
ND
DE
AT
HS
PE
R 1
000
PE
R Y
EA
R
Birth rate
Death rate
Total population

Demographic Transition Model
Stage 1 Stage 2 Stage 3 Stage 4
TIME
BIR
TH
S A
ND
DE
AT
HS
PE
R 1
000
PE
R Y
EA
R
Birth rate
Death rate
Total population

Stage 1High Fluctuating
Total Population
Birth Rate
Death Rate
Stage 1 • Low population– Increasing very
slowly
• High birth rate
• High death rate
• Ethiopia/Niger
• UK: pre-1780

Stage 2Early Expanding
Total Population
Birth Rate
Death Rate
Stage 2 • Population growing at faster rate
• High but decreasing birth rate
• Decreasing death rate
• Sri Lanka/Bolivia
• UK: 1780-1880

Stage 3Late Expanding
Total Population
Birth RateDeath Rate
Stage 3 • Population still increasing, but rate of increase slowing down
• Decreasing birth rate
• Low death rate
• Uruguay/China
• UK: 1880-1940

Stage 4Low Fluctuating
Total Population
Birth RateDeath Rate
Stage 4• High population,
almost stable
• Low birth rate
• Low death rate
• Canada/USA
• UK: post-1940

Reasons
What do you think the reasons are for the changes at each stage?

Reasons for Stage 1High Fluctuating
Total Population
Birth Rate
Death Rate
Stage 1 • Little access to birth control• Many children die in infancy
so parents have more to compensate
• Children are needed to work on the land
• Some religions encourage large families
• Death rates are high due to disease, famine, poor diet, poor hygiene, little medical science

Reasons for Stage 2Early Expanding
Total Population
Birth Rate
Death Rate
Stage 2 • Improvements in medical care• Improvements in sanitation and
water supply• Quality and quantity of food
produced improves• Transport and communications
improve movements of food and medical supplies
• Decrease in infant mortality

Reasons for Stage 3Late Expanding
Total Population
Birth RateDeath Rate
Stage 3 • Increased access to contraception
• Lower infant mortality rates so less need for bigger families
• Industrialisation and mechanisation means fewer labourers required
• As wealth increases, desire for material possessions takes over the desire for large families
• Equality of women means they can follow a career rather than just staying at home

Reasons for Stage 4Low Fluctuating
Total Population
Birth RateDeath Rate
Stage 4• Rates fluctuate with ‘baby booms’
and epidemics of illnesses and diseases
• Reasons for Stage 4 have improved and it stabilises

Is there a Stage 5?
?
??
Stage 5: Depleting Population
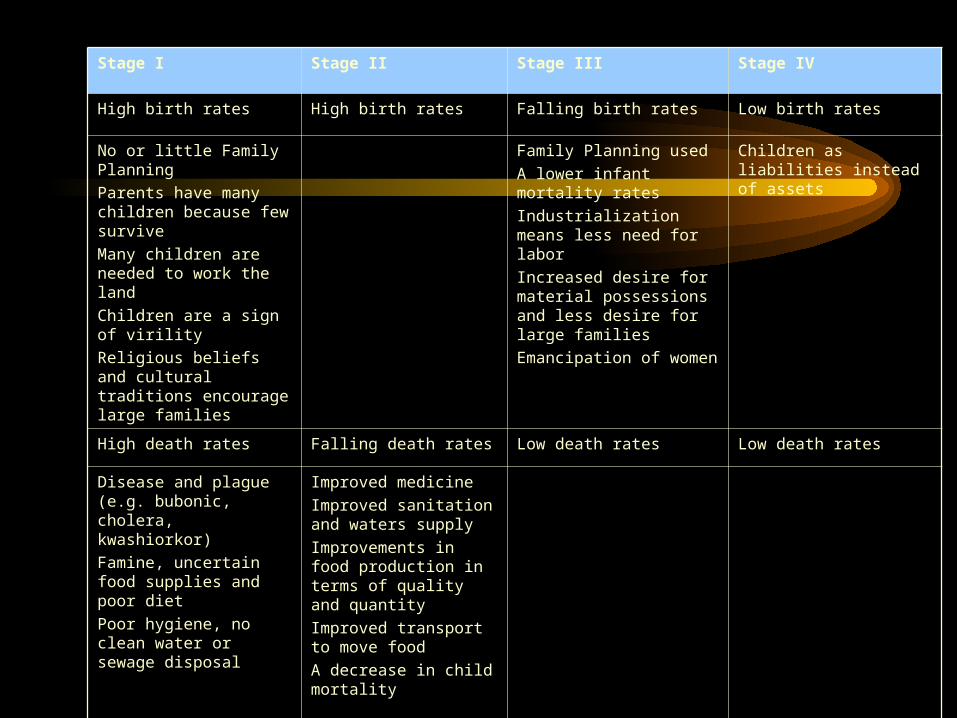
Stage I Stage II Stage III Stage IV
High birth rates High birth rates Falling birth rates Low birth rates
No or little Family Planning
Parents have many children because few survive
Many children are needed to work the land
Children are a sign of virility
Religious beliefs and cultural traditions encourage large families
Family Planning used
A lower infant mortality rates
Industrialization means less need for labor
Increased desire for material possessions and less desire for large families
Emancipation of women
Children as liabilities instead of assets
High death rates Falling death rates Low death rates Low death rates
Disease and plague (e.g. bubonic, cholera, kwashiorkor)
Famine, uncertain food supplies and poor diet
Poor hygiene, no clean water or sewage disposal
Improved medicine
Improved sanitation and waters supply
Improvements in food production in terms of quality and quantity
Improved transport to move food
A decrease in child mortality

Geographical Variations
• Developed countries– Took 250 years for most developed economies to go through their own
demographic transition (from 1750 to 2000).– Population growth never surpassed the capacity of these economies to
accommodate it.• Developing countries
– Demographic transition started in the 20th century:• The most advanced segment after WWI.• The least advanced segment after WWII.
– Very few have went trough the transitory mutation.– Most of them have a type III demographic transition.– By the time they reach type IV, a huge amount a population will be
added to their populations.

Geographical Variations• Will demographic transition occur all around the world?
– Model based upon the Western experience.– Evidence underline that the process is likely.– Problems:
• The base population in the developing world is large.• Low percentages of population increase will result in
large numbers of additional people.• Limited possibilities for immigration (Unlike Europe at
the end of the 19th century and early during the 20th century).
• Religious and cultural influences.
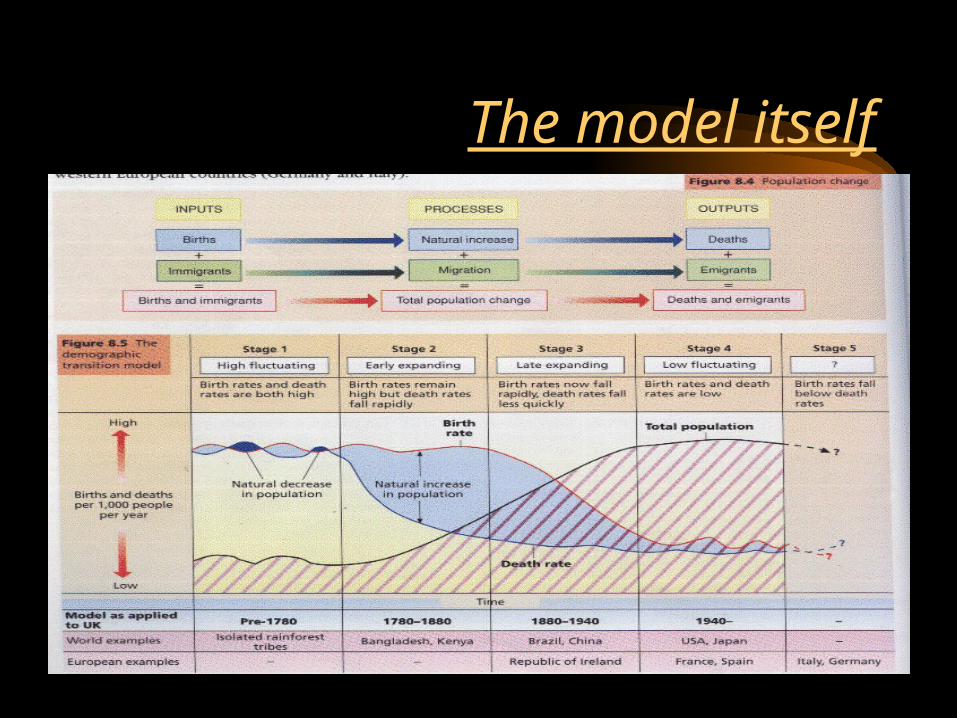
The model itself

Population structures
• The rates of natural increase, births, deaths, infant mortality and life expectancy all affect the population structure of a country.
• The population structure of a country can be shown by a population or age-sex pyramid.
Population pyramids show
• The total population divided into five-year age groups
• the percentage of people in each of those age groups
• the percentage of males and females in each age group

Population pyramids are useful because they show:
• Trends in the birth rate, death rate, infant mortality rate and life expectancy - these trends can help a country to plan its future services, e.g. more homes for the elderly if there is an ageing population or fewer schools if there is a declining birth rate.
• The effects of people migrating into or out of a region or country.
• The proportion of the population who are economically active and the proportion who are dependent upon them (dependency ratio).

Population pyramids