libya | idp & returnee report...about dtm libya funded by the european union the displacement...
TRANSCRIPT
Libya | IDP & Returnee Report Round 14 | September - October 2017
DISPLACEMENT TRACKING MATRIX
2
About DTM Libya
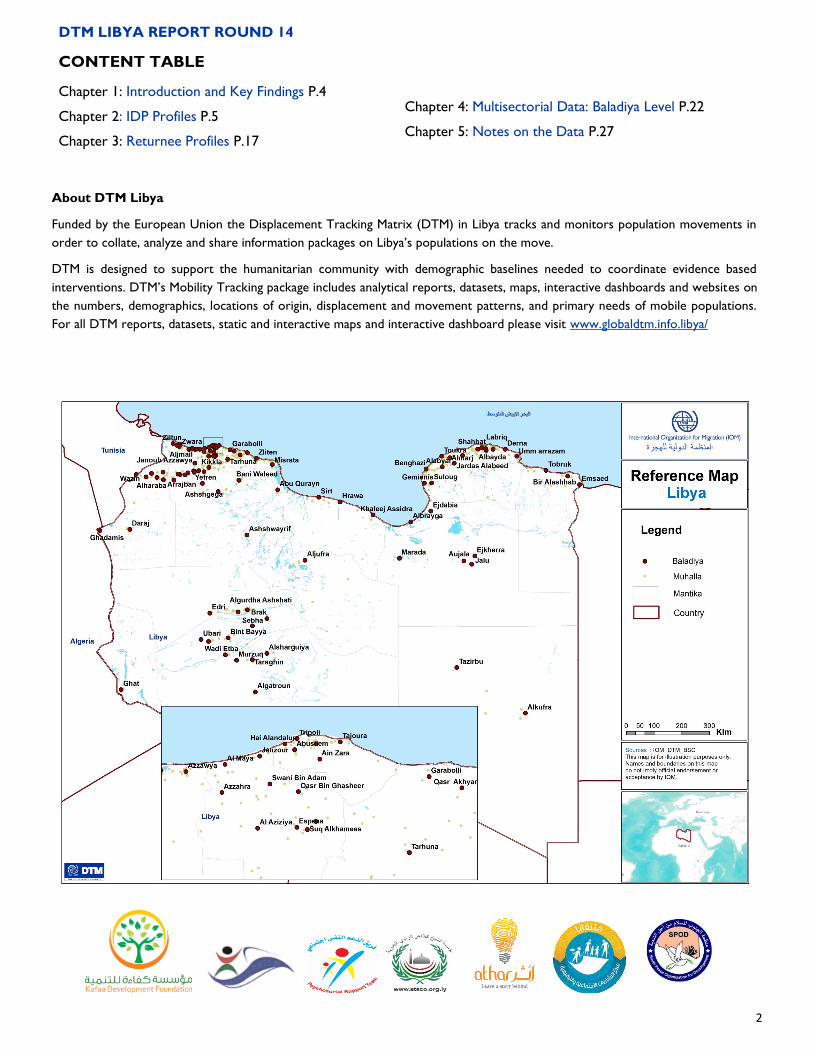
Funded by the European Union the Displacement Tracking Matrix (DTM) in Libya tracks and monitors population movements in
order to collate, analyze and share information packages on Libya’s populations on the move.
DTM is designed to support the humanitarian community with demographic baselines needed to coordinate evidence based
interventions. DTM’s Mobility Tracking package includes analytical reports, datasets, maps, interactive dashboards and websites on
the numbers, demographics, locations of origin, displacement and movement patterns, and primary needs of mobile populations.
For all DTM reports, datasets, static and interactive maps and interactive dashboard please visit www.globaldtm.info.libya/
DTM LIBYA REPORT ROUND 14
CONTENT TABLE
Chapter 1: Introduction and Key Findings P.4
Chapter 2: IDP Profiles P.5
Chapter 3: Returnee Profiles P.17
Chapter 4: Multisectorial Data: Baladiya Level P.22
Chapter 5: Notes on the Data P.27
3
4
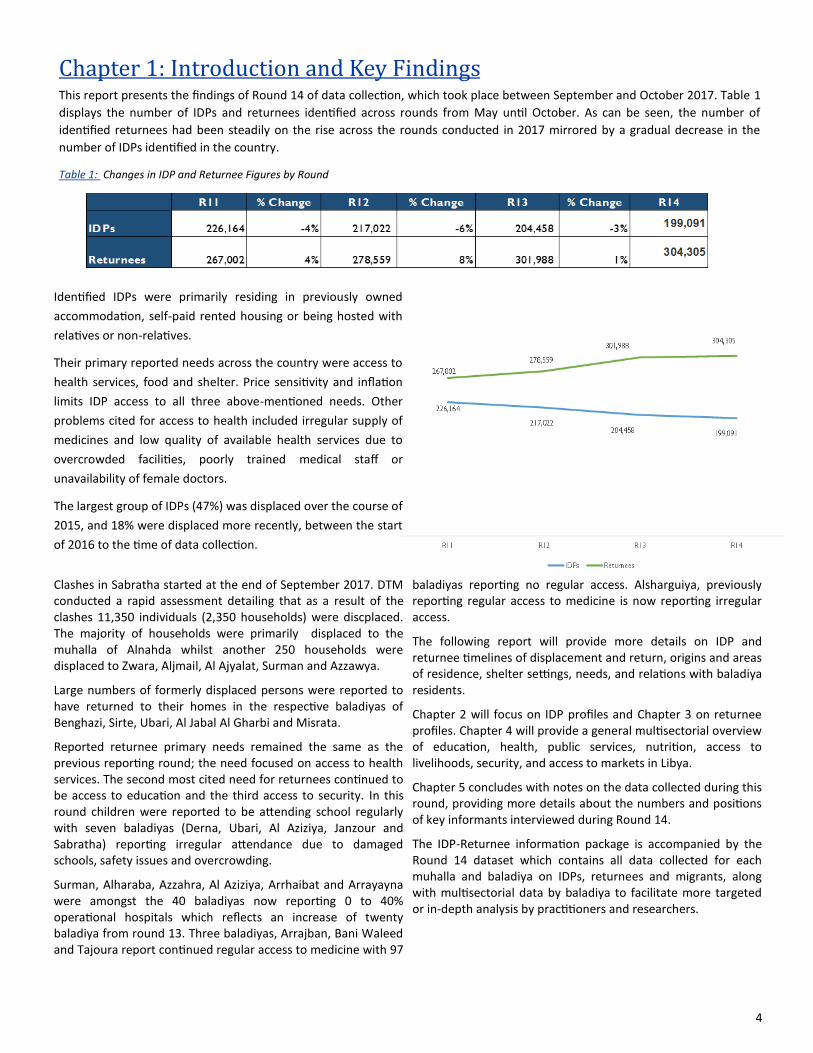
Chapter 1: Introduction and Key Findings This report presents the findings of Round 14 of data collection, which took place between September and October 2017. Table 1
displays the number of IDPs and returnees identified across rounds from May until October. As can be seen, the number of
identified returnees had been steadily on the rise across the rounds conducted in 2017 mirrored by a gradual decrease in the
number of IDPs identified in the country.
Table 1: Changes in IDP and Returnee Figures by Round
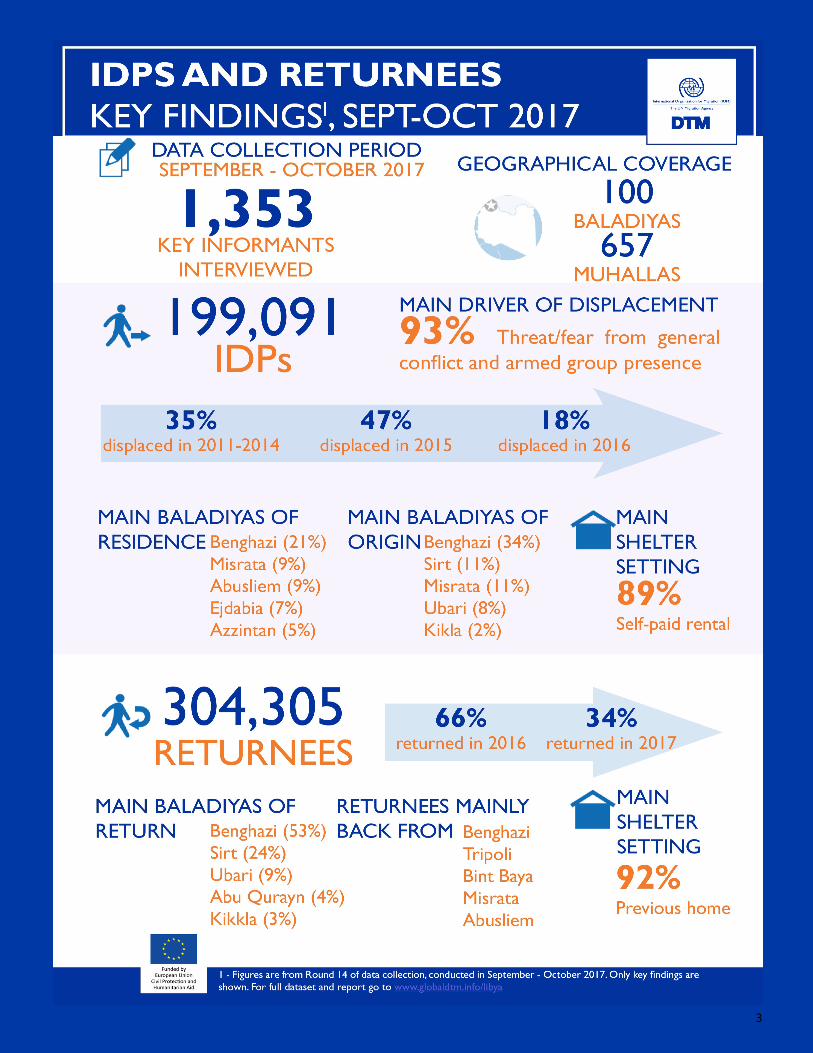
Clashes in Sabratha started at the end of September 2017. DTM conducted a rapid assessment detailing that as a result of the clashes 11,350 individuals (2,350 households) were discplaced. The majority of households were primarily displaced to the muhalla of Alnahda whilst another 250 households were displaced to Zwara, Aljmail, Al Ajyalat, Surman and Azzawya.
Large numbers of formerly displaced persons were reported to have returned to their homes in the respective baladiyas of Benghazi, Sirte, Ubari, Al Jabal Al Gharbi and Misrata.
Reported returnee primary needs remained the same as the previous reporting round; the need focused on access to health services. The second most cited need for returnees continued to be access to education and the third access to security. In this round children were reported to be attending school regularly with seven baladiyas (Derna, Ubari, Al Aziziya, Janzour and Sabratha) reporting irregular attendance due to damaged schools, safety issues and overcrowding.
Surman, Alharaba, Azzahra, Al Aziziya, Arrhaibat and Arrayayna were amongst the 40 baladiyas now reporting 0 to 40% operational hospitals which reflects an increase of twenty baladiya from round 13. Three baladiyas, Arrajban, Bani Waleed and Tajoura report continued regular access to medicine with 97
baladiyas reporting no regular access. Alsharguiya, previously reporting regular access to medicine is now reporting irregular access.
The following report will provide more details on IDP and returnee timelines of displacement and return, origins and areas of residence, shelter settings, needs, and relations with baladiya residents.
Chapter 2 will focus on IDP profiles and Chapter 3 on returnee profiles. Chapter 4 will provide a general multisectorial overview of education, health, public services, nutrition, access to livelihoods, security, and access to markets in Libya.
Chapter 5 concludes with notes on the data collected during this round, providing more details about the numbers and positions of key informants interviewed during Round 14.
The IDP-Returnee information package is accompanied by the Round 14 dataset which contains all data collected for each muhalla and baladiya on IDPs, returnees and migrants, along with multisectorial data by baladiya to facilitate more targeted or in-depth analysis by practitioners and researchers.
Identified IDPs were primarily residing in previously owned
accommodation, self-paid rented housing or being hosted with
relatives or non-relatives.
Their primary reported needs across the country were access to
health services, food and shelter. Price sensitivity and inflation
limits IDP access to all three above-mentioned needs. Other
problems cited for access to health included irregular supply of
medicines and low quality of available health services due to
overcrowded facilities, poorly trained medical staff or
unavailability of female doctors.
The largest group of IDPs (47%) was displaced over the course of
2015, and 18% were displaced more recently, between the start
of 2016 to the time of data collection.
5
Chapter 2: IDP Profiles Overview
DTM identified and located 199,091 IDP individuals (39,793 households) across 84 baladiyas in Libya. This represents a decrease of
3% IDPs identified in round 14.
The largest decreases in the number of IDPs took place in the baladiyas of Janoub Azzawya, Alghrayfa and Espeaa as shown in Table
2. These decreases were mainly the result of IDPs returning to their homes during the data collection period.
Table 2: Baladiyas with largest changes in IDP population figures
IDPs are categorized by the time during which they were initially displaced. The three periods of displacement considered are
as follows: 2011 -2014, 2015, and 2016 to the time of reporting.
Round 14 results indicate that 35% of all identified IDPs had been displaced between 2011 and 2014 (see Figure 1). 47% of IDPs
had been displaced during 2015, at the peak of civil conflict in Libya, and 18% had been displaced between the start of 2016
and the time of data collection.
Timeline of Displacement
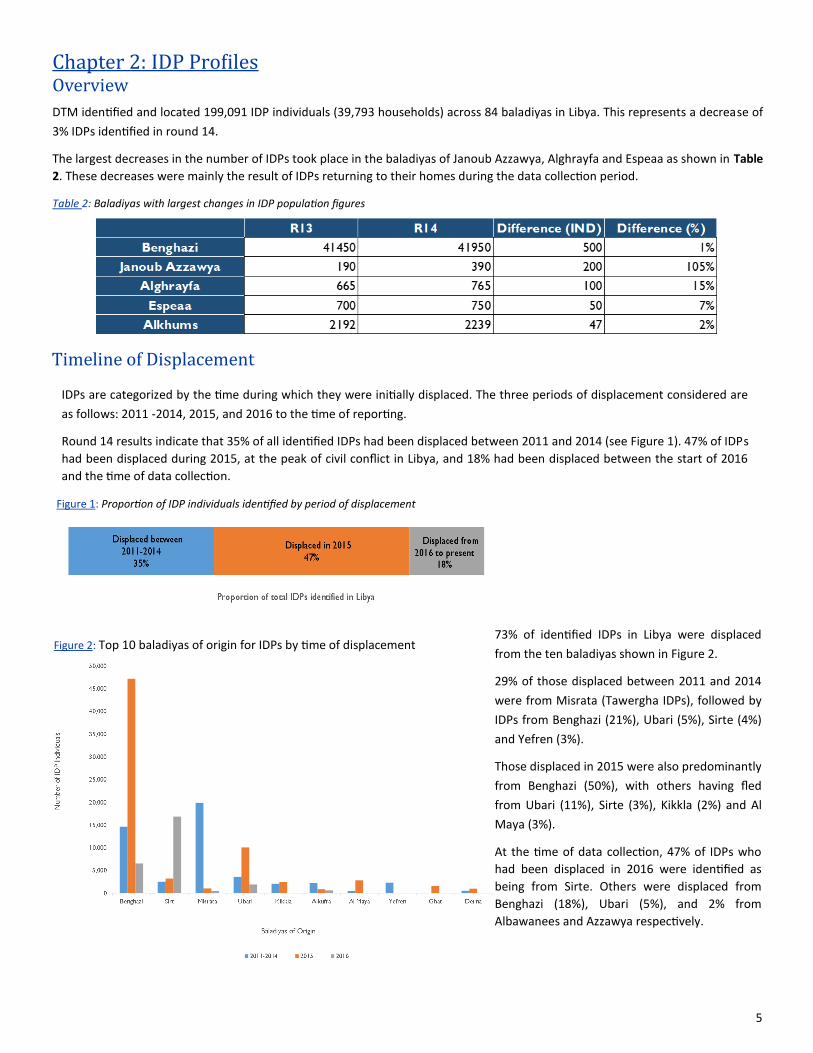
Figure 2: Top 10 baladiyas of origin for IDPs by time of displacement
Figure 1: Proportion of IDP individuals identified by period of displacement
73% of identified IDPs in Libya were displaced
from the ten baladiyas shown in Figure 2.
29% of those displaced between 2011 and 2014
were from Misrata (Tawergha IDPs), followed by
IDPs from Benghazi (21%), Ubari (5%), Sirte (4%)
and Yefren (3%).
Those displaced in 2015 were also predominantly
from Benghazi (50%), with others having fled
from Ubari (11%), Sirte (3%), Kikkla (2%) and Al
Maya (3%).
At the time of data collection, 47% of IDPs who
had been displaced in 2016 were identified as
being from Sirte. Others were displaced from
Benghazi (18%), Ubari (5%), and 2% from
Albawanees and Azzawya respectively.
6
Drivers of Internal Displacement
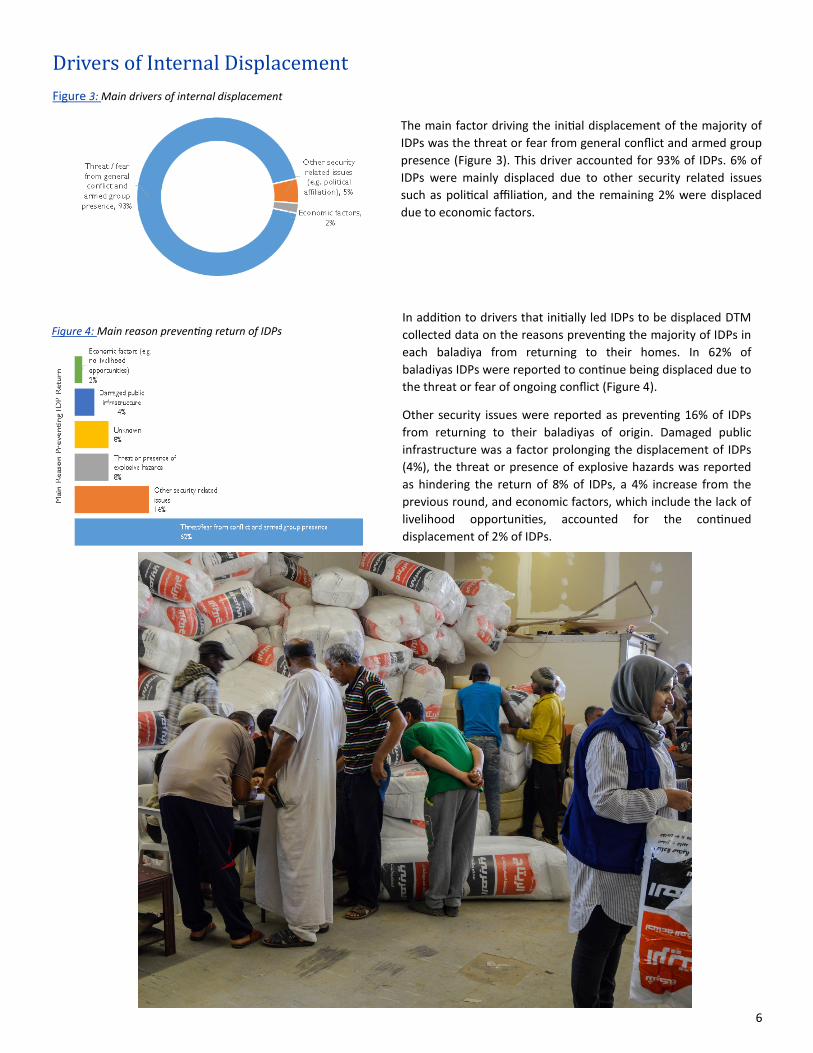
Figure 3: Main drivers of internal displacement
The main factor driving the initial displacement of the majority of
IDPs was the threat or fear from general conflict and armed group
presence (Figure 3). This driver accounted for 93% of IDPs. 6% of
IDPs were mainly displaced due to other security related issues
such as political affiliation, and the remaining 2% were displaced
due to economic factors.
Figure 4: Main reason preventing return of IDPs In addition to drivers that initially led IDPs to be displaced DTM
collected data on the reasons preventing the majority of IDPs in
each baladiya from returning to their homes. In 62% of
baladiyas IDPs were reported to continue being displaced due to
the threat or fear of ongoing conflict (Figure 4).
Other security issues were reported as preventing 16% of IDPs
from returning to their baladiyas of origin. Damaged public
infrastructure was a factor prolonging the displacement of IDPs
(4%), the threat or presence of explosive hazards was reported
as hindering the return of 8% of IDPs, a 4% increase from the
previous round, and economic factors, which include the lack of
livelihood opportunities, accounted for the continued
displacement of 2% of IDPs.
7
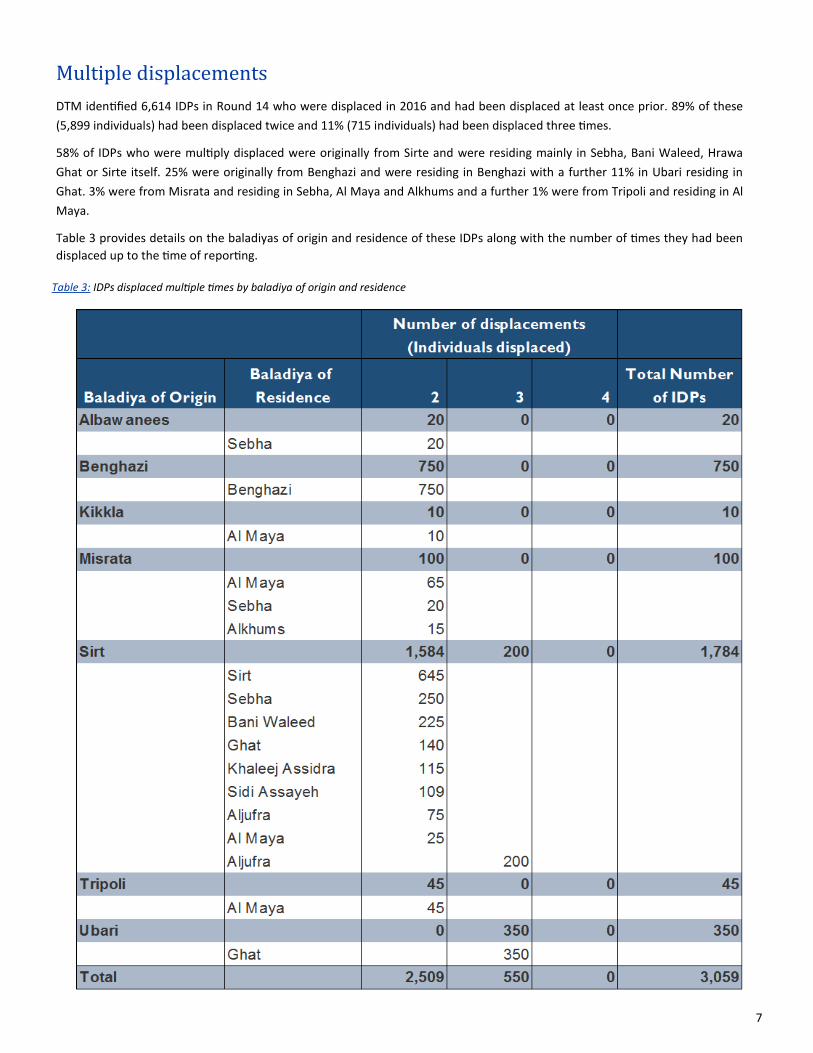
Multiple displacements
DTM identified 6,614 IDPs in Round 14 who were displaced in 2016 and had been displaced at least once prior. 89% of these
(5,899 individuals) had been displaced twice and 11% (715 individuals) had been displaced three times.
58% of IDPs who were multiply displaced were originally from Sirte and were residing mainly in Sebha, Bani Waleed, Hrawa
Ghat or Sirte itself. 25% were originally from Benghazi and were residing in Benghazi with a further 11% in Ubari residing in
Ghat. 3% were from Misrata and residing in Sebha, Al Maya and Alkhums and a further 1% were from Tripoli and residing in Al
Maya.
Table 3 provides details on the baladiyas of origin and residence of these IDPs along with the number of times they had been
displaced up to the time of reporting.
Table 3: IDPs displaced multiple times by baladiya of origin and residence
8
IDP Regions and Baladiyas of Residence
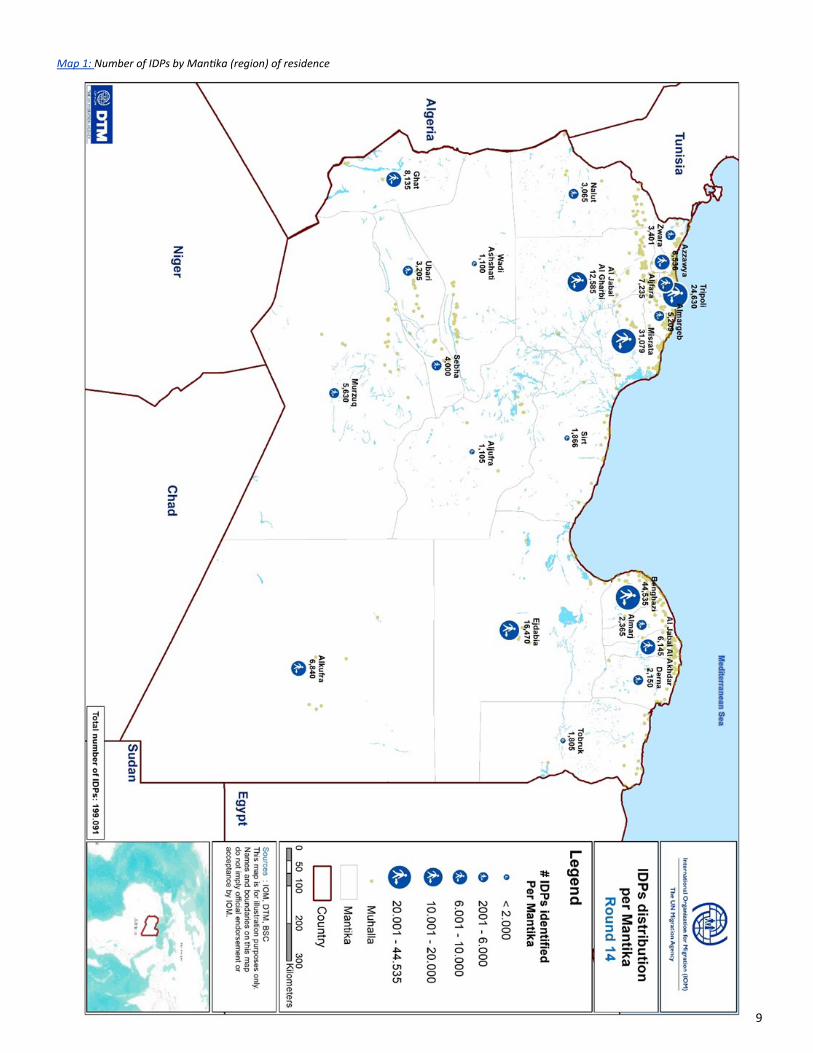
60% of identified IDPs were in the West of Libya. 27% were in the East and the remaining 16% were in the South during this round.
The mantikas (regions) with the highest reported presence of IDPs were Benghazi (44,535 individuals which represents an increase
of 1% from the previous round), Misrata (31,079 individuals which represents a decrease of 10%) and Tripoli (24,630 individuals, a
decrease of 11%). See Map 1 for the number of IDPs identified disaggregated by region.
In Benghazi region 94% of IDPs identified were residing in Benghazi baladiya and the rest were in Alabyar (2%), Gemienis (1%),
Toukra (1%) and Suloug (1%) baladiyas.
In Misrata region IDPs were reported to be residing mainly in Misrata baladiya (58%) and Bani Waleed (30%), with smaller
numbers identified in Zliten (10%) and Abu Qurayn (2%) baladiyas.
In Tripoli region the majority of IDPs were reported to be residing in Abusliem (71%) with smaller numbers in Ain Zara (7%),
Tajoura (8%), Suq Aljumaa (6%) Tripoli (4%) and Hai Alandalus (4%).
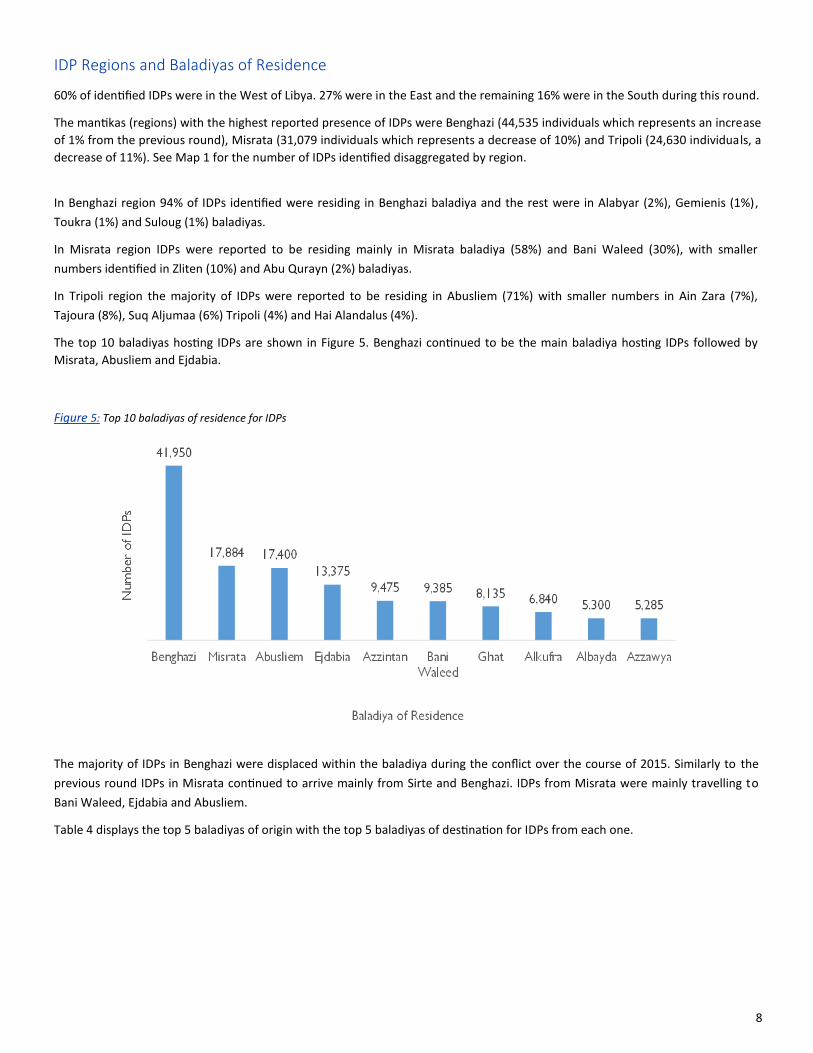
The top 10 baladiyas hosting IDPs are shown in Figure 5. Benghazi continued to be the main baladiya hosting IDPs followed by
Misrata, Abusliem and Ejdabia.
Figure 5: Top 10 baladiyas of residence for IDPs
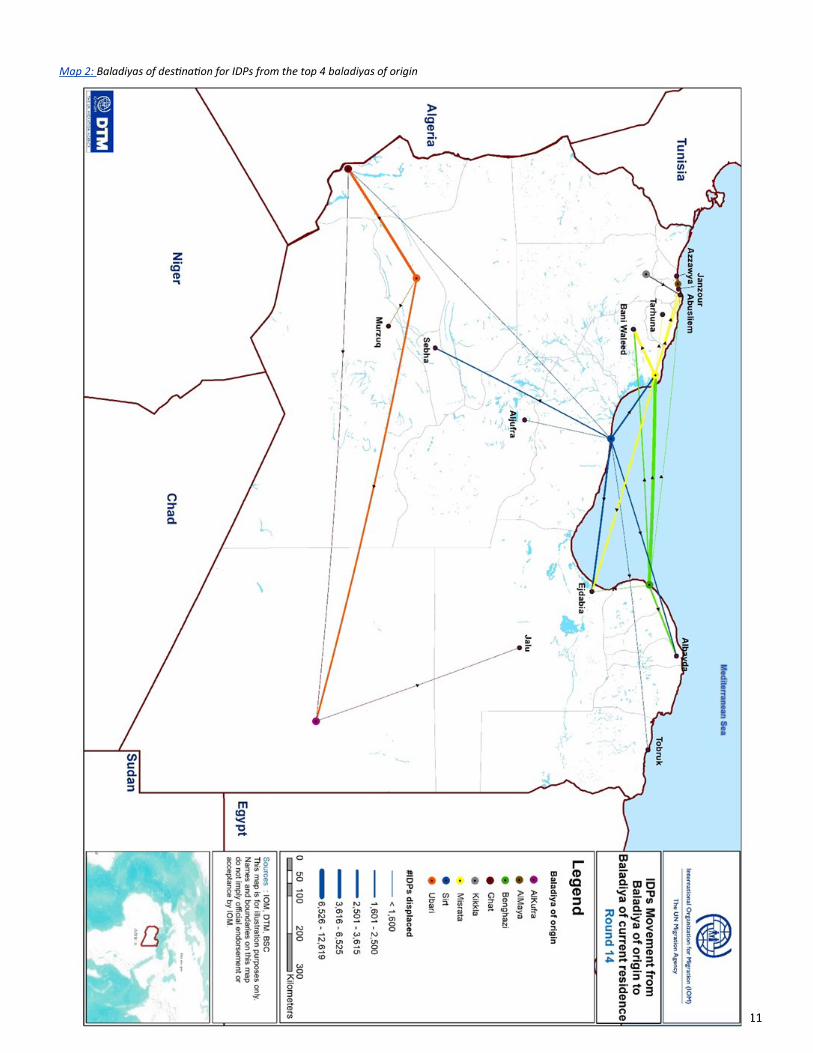
The majority of IDPs in Benghazi were displaced within the baladiya during the conflict over the course of 2015. Similarly to the
previous round IDPs in Misrata continued to arrive mainly from Sirte and Benghazi. IDPs from Misrata were mainly travelling to
Bani Waleed, Ejdabia and Abusliem.
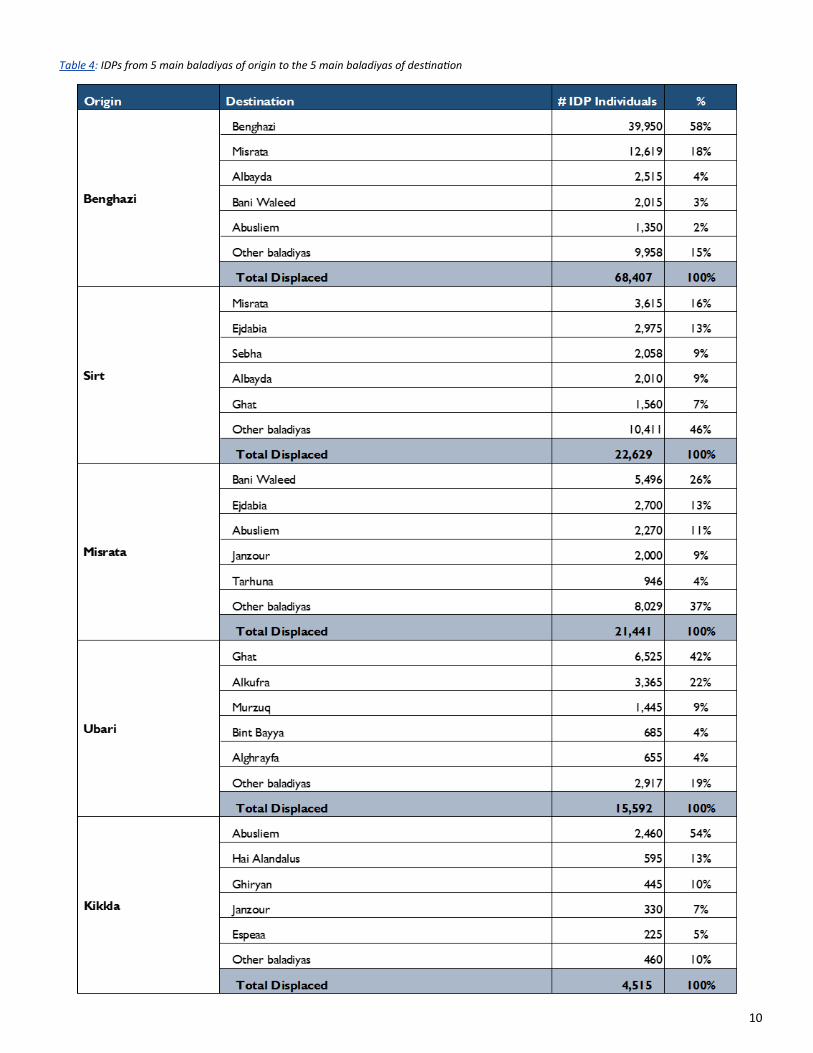
Table 4 displays the top 5 baladiyas of origin with the top 5 baladiyas of destination for IDPs from each one.
9
Map 1: Number of IDPs by Mantika (region) of residence
10
Table 4: IDPs from 5 main baladiyas of origin to the 5 main baladiyas of destination
11
Map 2: Baladiyas of destination for IDPs from the top 4 baladiyas of origin
12
Figure 7: IDP male-female ratio by age group
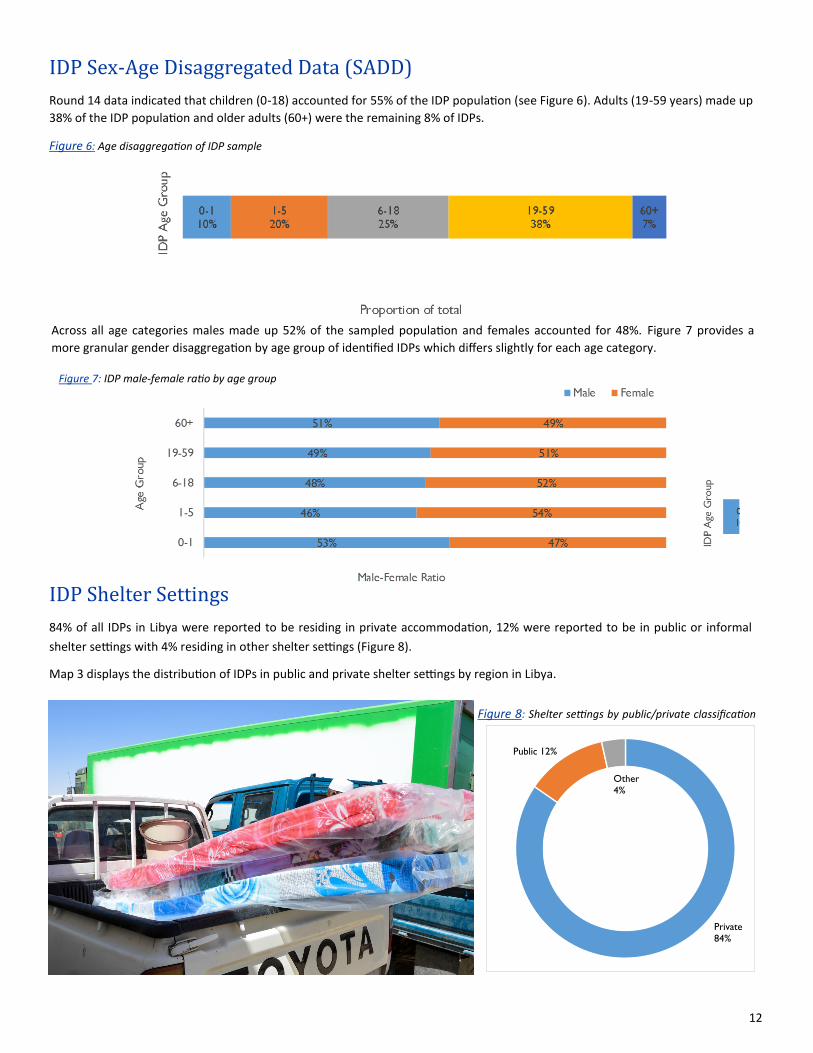
IDP Sex-Age Disaggregated Data (SADD)
Round 14 data indicated that children (0-18) accounted for 55% of the IDP population (see Figure 6). Adults (19-59 years) made up
38% of the IDP population and older adults (60+) were the remaining 8% of IDPs.
Figure 6: Age disaggregation of IDP sample
IDP Shelter Settings
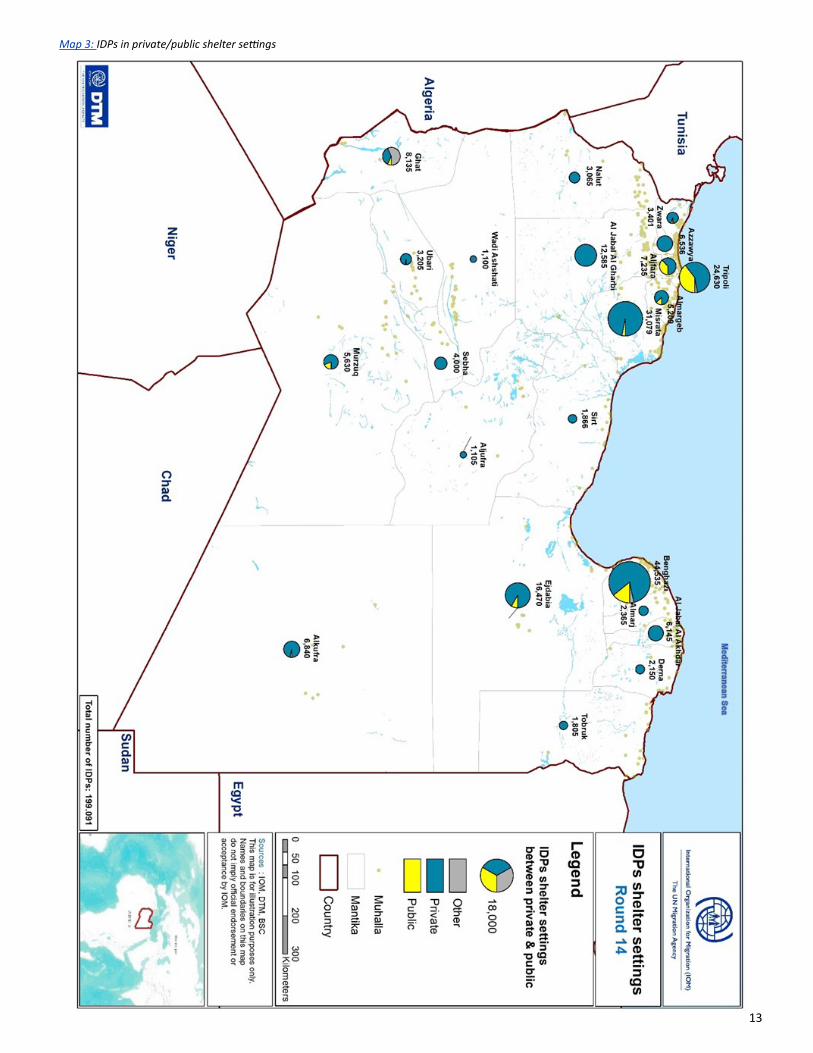
84% of all IDPs in Libya were reported to be residing in private accommodation, 12% were reported to be in public or informal
shelter settings with 4% residing in other shelter settings (Figure 8).
Map 3 displays the distribution of IDPs in public and private shelter settings by region in Libya.
Figure 8: Shelter settings by public/private classification
Across all age categories males made up 52% of the sampled population and females accounted for 48%. Figure 7 provides a
more granular gender disaggregation by age group of identified IDPs which differs slightly for each age category.
Public 12%
Private
84%
Other
4%
13
Map 3: IDPs in private/public shelter settings
14
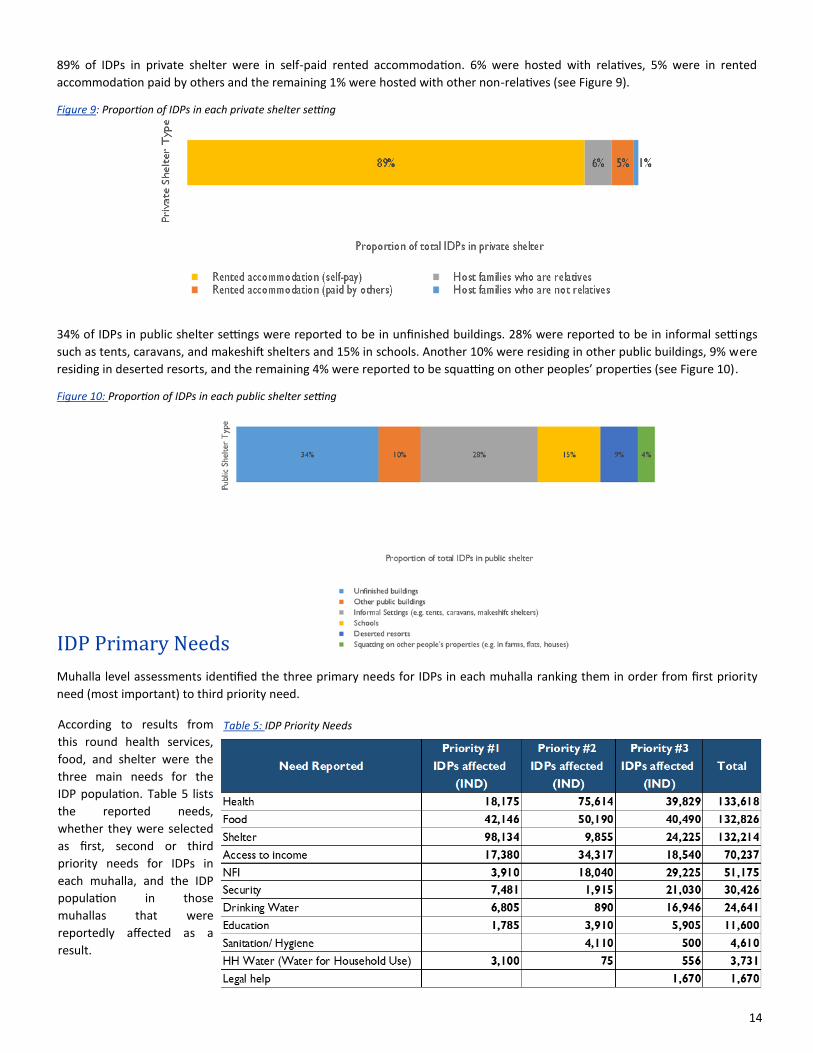
89% of IDPs in private shelter were in self-paid rented accommodation. 6% were hosted with relatives, 5% were in rented
accommodation paid by others and the remaining 1% were hosted with other non-relatives (see Figure 9).
Figure 9: Proportion of IDPs in each private shelter setting
34% of IDPs in public shelter settings were reported to be in unfinished buildings. 28% were reported to be in informal settings
such as tents, caravans, and makeshift shelters and 15% in schools. Another 10% were residing in other public buildings, 9% were
residing in deserted resorts, and the remaining 4% were reported to be squatting on other peoples’ properties (see Figure 10).
Figure 10: Proportion of IDPs in each public shelter setting
IDP Primary Needs
Muhalla level assessments identified the three primary needs for IDPs in each muhalla ranking them in order from first priority
need (most important) to third priority need.
Table 5: IDP Priority Needs According to results from
this round health services,
food, and shelter were the
three main needs for the
IDP population. Table 5 lists
the reported needs,
whether they were selected
as first, second or third
priority needs for IDPs in
each muhalla, and the IDP
population in those
muhallas that were
reportedly affected as a
result.
15
IDP Impact on Baladiyas of Residence
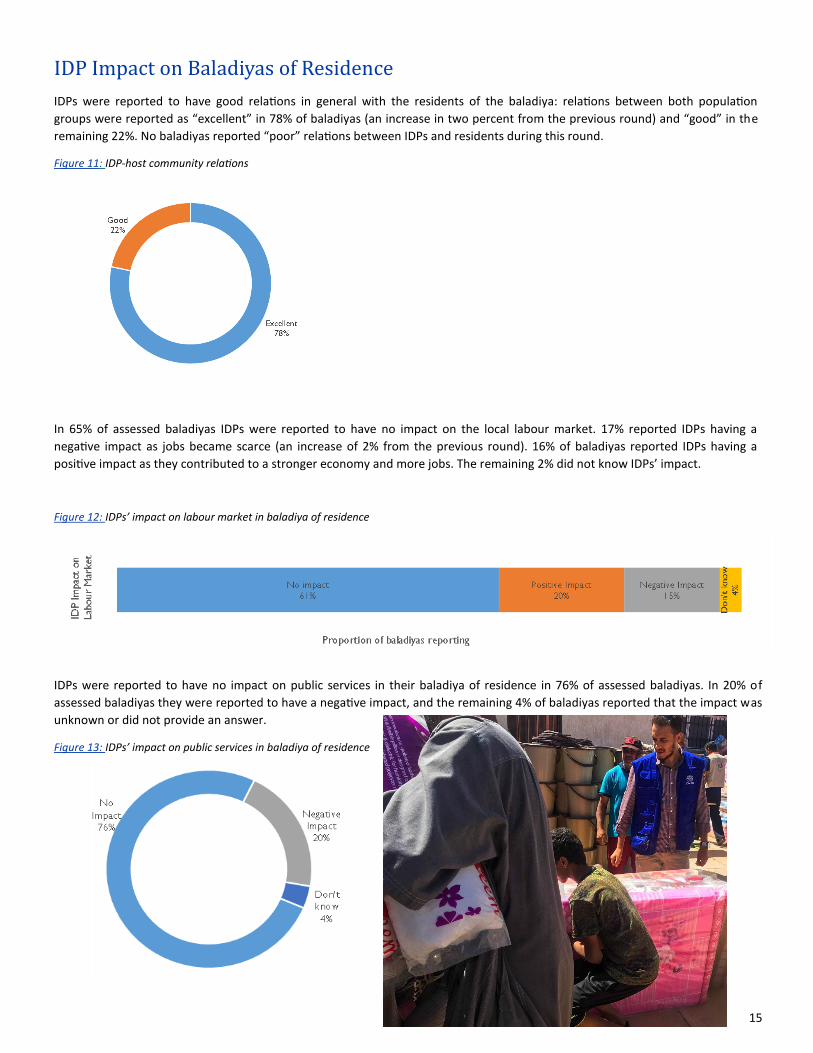
IDPs were reported to have good relations in general with the residents of the baladiya: relations between both population
groups were reported as “excellent” in 78% of baladiyas (an increase in two percent from the previous round) and “good” in the
remaining 22%. No baladiyas reported “poor” relations between IDPs and residents during this round.
Figure 11: IDP-host community relations
In 65% of assessed baladiyas IDPs were reported to have no impact on the local labour market. 17% reported IDPs having a
negative impact as jobs became scarce (an increase of 2% from the previous round). 16% of baladiyas reported IDPs having a
positive impact as they contributed to a stronger economy and more jobs. The remaining 2% did not know IDPs’ impact.
Figure 12: IDPs’ impact on labour market in baladiya of residence
IDPs were reported to have no impact on public services in their baladiya of residence in 76% of assessed baladiyas. In 20% of
assessed baladiyas they were reported to have a negative impact, and the remaining 4% of baladiyas reported that the impact was
unknown or did not provide an answer.
Figure 13: IDPs’ impact on public services in baladiya of residence
16
Chapter 3: Returnee Profiles
Overview
DTM identified and located 304,305 returnees (an increase of approximately 1% since the previous round) in 35 baladiyas in Libya
during the reporting period who had returned between the start of 2016 and the time of data collection.
It is important to note that the timeframes determining the definitions of IDPs and returnees differ from each other. IDPs are those
who were displaced from their homes anytime between 2011 and 2017 and who continued to be displaced at the time of data
collection.
Returnees identified by DTM include those who had been displaced anytime between 2011 and 2017 and returned to their homes
between the start of 2016 to the time of data collection. Due to the differing timeframes used to define these population
categories, the number of IDPs and returnees identified will not be equal. Since May 2017, the number of returnees exceeded the
number of IDPs indicating that the majority of those who had been displaced between 2011 and 2017 have returned, and a
minority continued to be displaced.
The increase in returnees observed during this round was mainly due to the returns to Benghazi, Zliten, Kikkla and Al Ajaylat during
the time of data collection.
Table 6: Baladiyas with biggest changes in returnee population
Returnees are defined as any formerly displaced persons who have returned to their place of origin or habitual residence. DTM
defines returnees as any formerly internally displaced persons or persons displaced outside Libya who came back to their baladiya
of origin or former residence between the start of 2016 and the time of reporting.
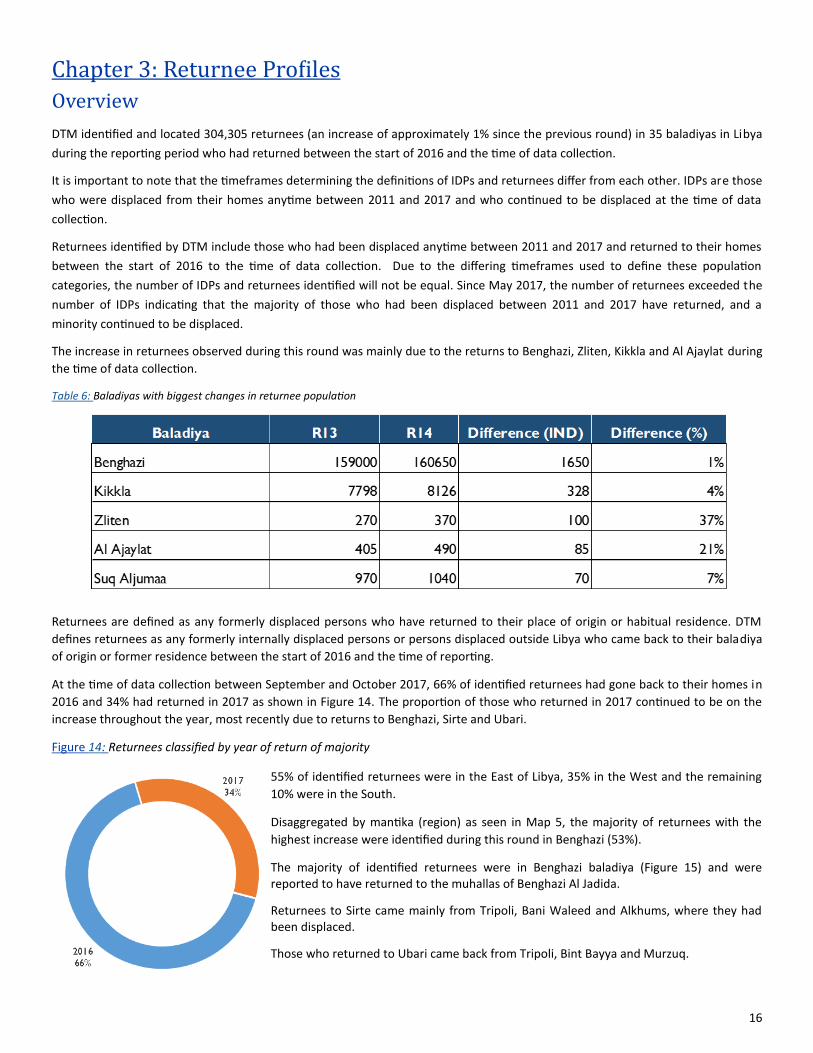
At the time of data collection between September and October 2017, 66% of identified returnees had gone back to their homes in
2016 and 34% had returned in 2017 as shown in Figure 14. The proportion of those who returned in 2017 continued to be on the
increase throughout the year, most recently due to returns to Benghazi, Sirte and Ubari.
Figure 14: Returnees classified by year of return of majority
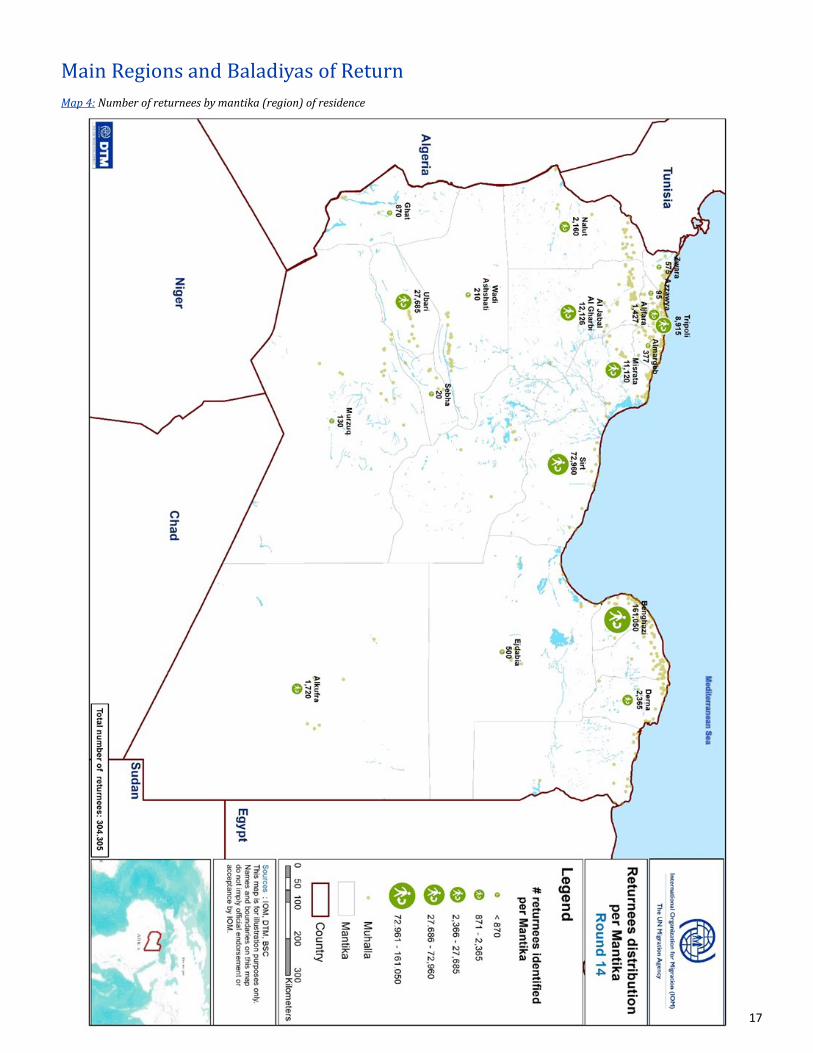
55% of identified returnees were in the East of Libya, 35% in the West and the remaining
10% were in the South.
Disaggregated by mantika (region) as seen in Map 5, the majority of returnees with the
highest increase were identified during this round in Benghazi (53%).
The majority of identified returnees were in Benghazi baladiya (Figure 15) and were reported to have returned to the muhallas of Benghazi Al Jadida.
Returnees to Sirte came mainly from Tripoli, Bani Waleed and Alkhums, where they had been displaced.
Those who returned to Ubari came back from Tripoli, Bint Bayya and Murzuq.
17
Main Regions and Baladiyas of Return
Map 4: Number of returnees by mantika (region) of residence
18
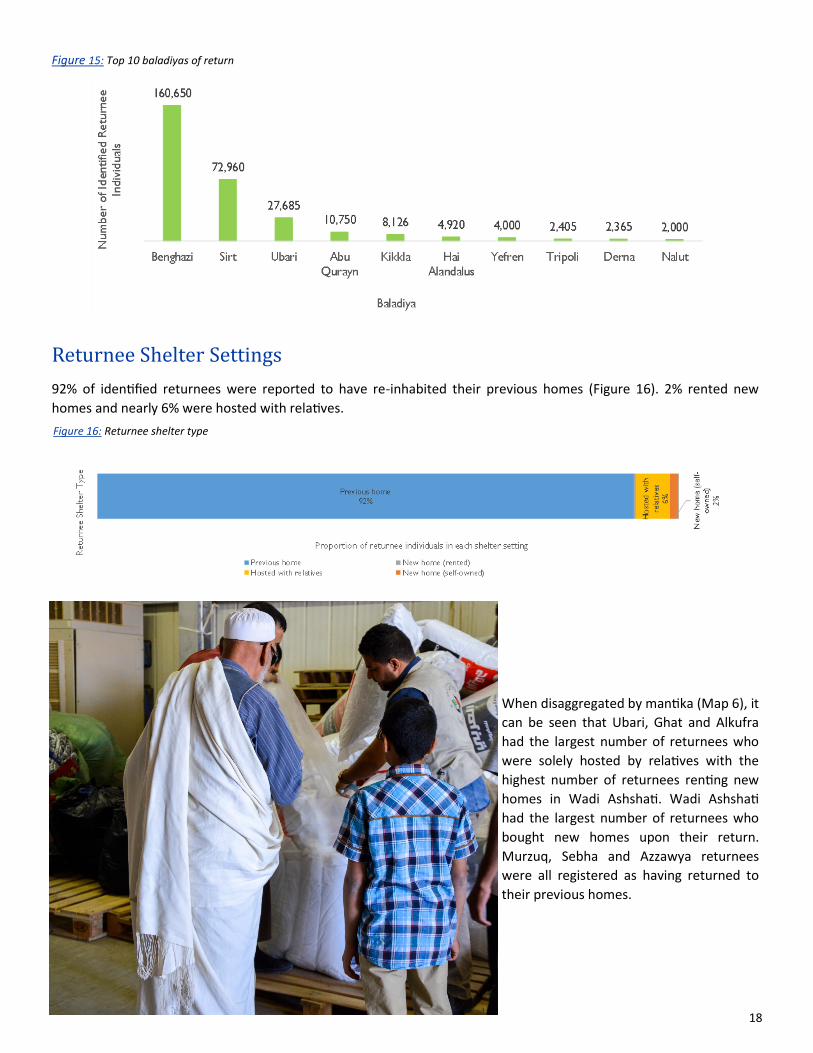
Figure 15: Top 10 baladiyas of return
Returnee Shelter Settings
92% of identified returnees were reported to have re-inhabited their previous homes (Figure 16). 2% rented new
homes and nearly 6% were hosted with relatives.
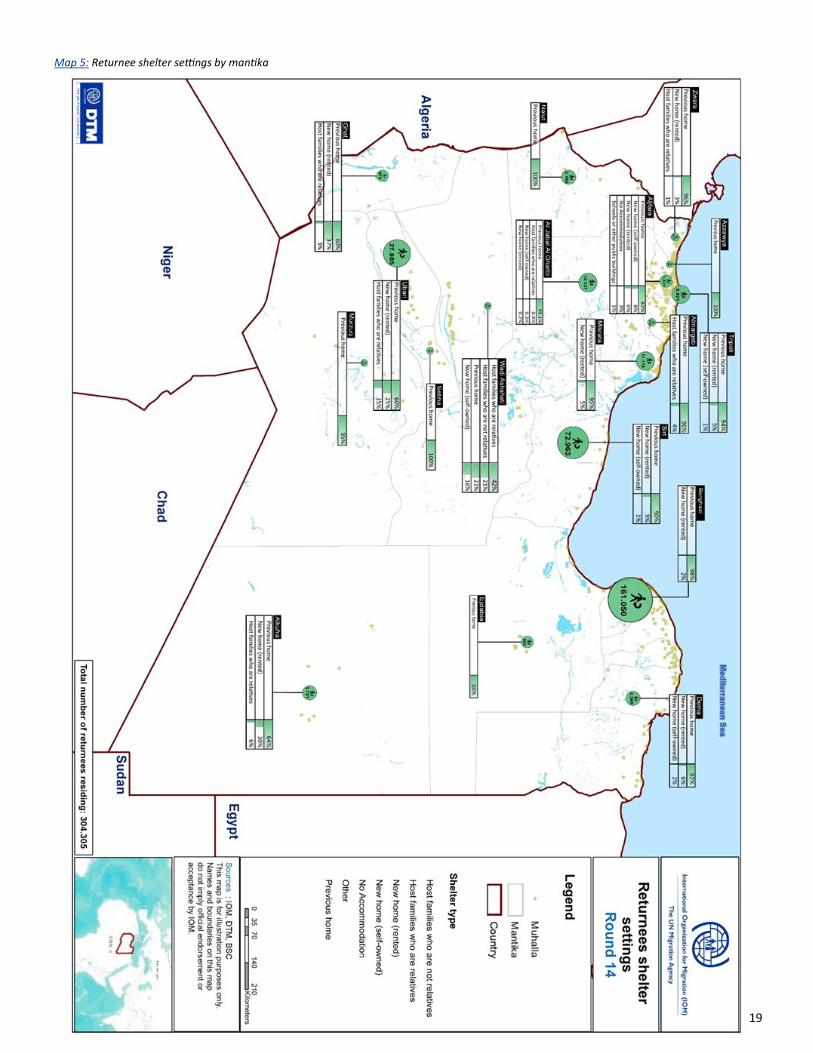
When disaggregated by mantika (Map 6), it
can be seen that Ubari, Ghat and Alkufra
had the largest number of returnees who
were solely hosted by relatives with the
highest number of returnees renting new
homes in Wadi Ashshati. Wadi Ashshati
had the largest number of returnees who
bought new homes upon their return.
Murzuq, Sebha and Azzawya returnees
were all registered as having returned to
their previous homes.
Figure 16: Returnee shelter type
19
Map 5: Returnee shelter settings by mantika
20
Returnees’ Impact on Baladiyas of Return
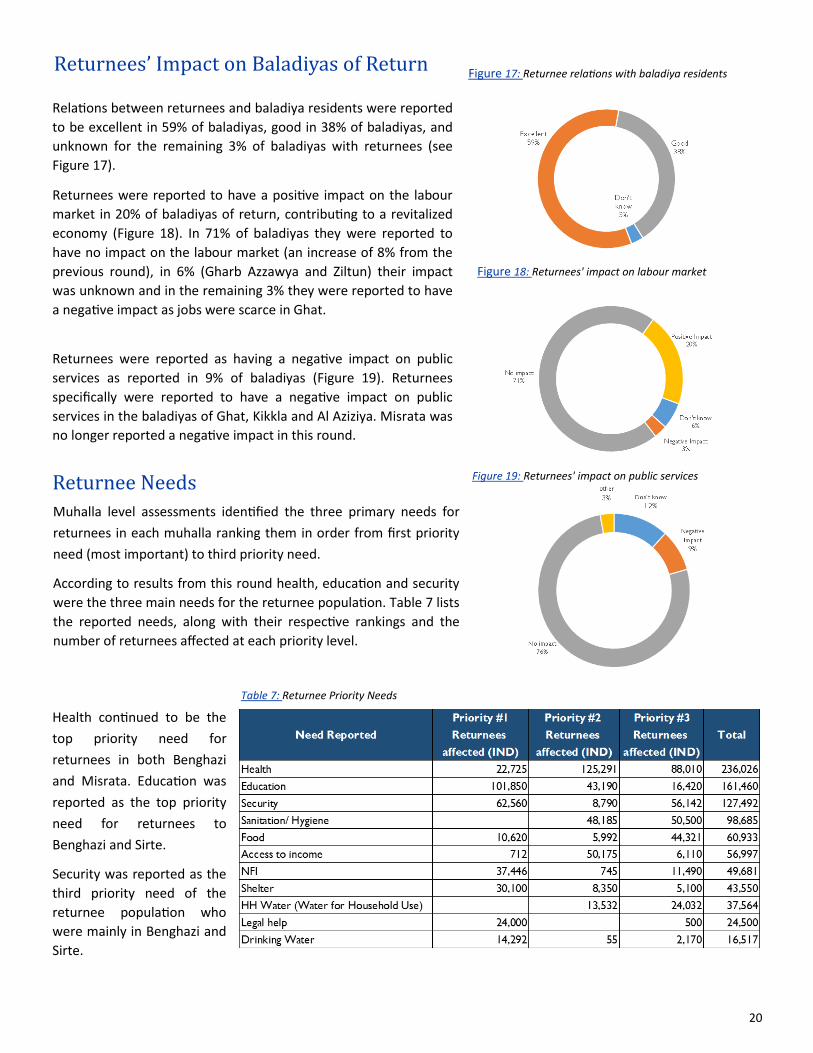
Figure 17: Returnee relations with baladiya residents
Figure 18: Returnees' impact on labour market
Returnee Needs
Muhalla level assessments identified the three primary needs for
returnees in each muhalla ranking them in order from first priority
need (most important) to third priority need.
According to results from this round health, education and security
were the three main needs for the returnee population. Table 7 lists
the reported needs, along with their respective rankings and the
number of returnees affected at each priority level.
Relations between returnees and baladiya residents were reported
to be excellent in 59% of baladiyas, good in 38% of baladiyas, and
unknown for the remaining 3% of baladiyas with returnees (see
Figure 17).
Returnees were reported to have a positive impact on the labour
market in 20% of baladiyas of return, contributing to a revitalized
economy (Figure 18). In 71% of baladiyas they were reported to
have no impact on the labour market (an increase of 8% from the
previous round), in 6% (Gharb Azzawya and Ziltun) their impact
was unknown and in the remaining 3% they were reported to have
a negative impact as jobs were scarce in Ghat.
Returnees were reported as having a negative impact on public
services as reported in 9% of baladiyas (Figure 19). Returnees
specifically were reported to have a negative impact on public
services in the baladiyas of Ghat, Kikkla and Al Aziziya. Misrata was
no longer reported a negative impact in this round.
Figure 19: Returnees' impact on public services
Table 7: Returnee Priority Needs
Health continued to be the
top priority need for
returnees in both Benghazi
and Misrata. Education was
reported as the top priority
need for returnees to
Benghazi and Sirte.
Security was reported as the
third priority need of the
returnee population who
were mainly in Benghazi and
Sirte.
21
Chapter 4: Multisectorial Data As part of 2017 methodology some key baseline multisectorial indicators are collected as part of the baladiya
assessment to facilitate a more context-based analysis of IDP and returnee vulnerabilities, conditions and needs.
While this data is not meant to be a comprehensive multisectorial needs analysis it provides some flagging
indicators that enable humanitarian partners to target their assistance to address specific vulnerabilities in certain
locations.
Education
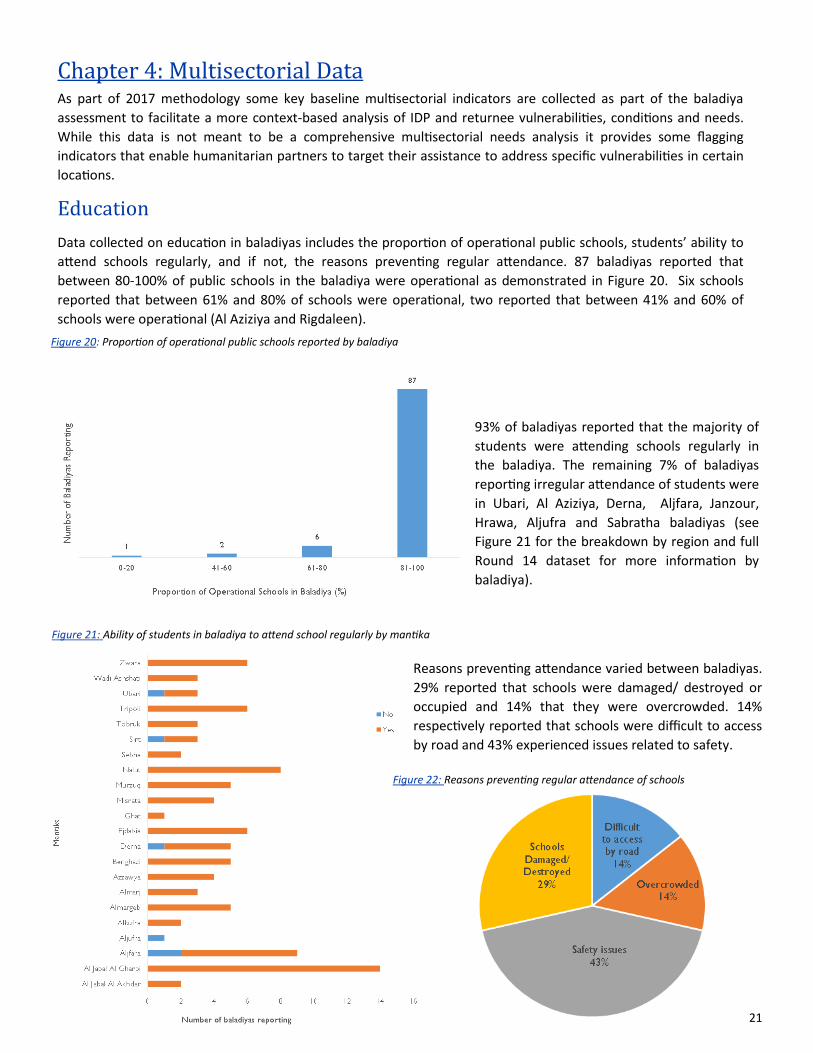
Data collected on education in baladiyas includes the proportion of operational public schools, students’ ability to
attend schools regularly, and if not, the reasons preventing regular attendance. 87 baladiyas reported that
between 80-100% of public schools in the baladiya were operational as demonstrated in Figure 20. Six schools
reported that between 61% and 80% of schools were operational, two reported that between 41% and 60% of
schools were operational (Al Aziziya and Rigdaleen).
Figure 21: Ability of students in baladiya to attend school regularly by mantika
Reasons preventing attendance varied between baladiyas.
29% reported that schools were damaged/ destroyed or
occupied and 14% that they were overcrowded. 14%
respectively reported that schools were difficult to access
by road and 43% experienced issues related to safety.
Figure 22: Reasons preventing regular attendance of schools
Figure 20: Proportion of operational public schools reported by baladiya
93% of baladiyas reported that the majority of
students were attending schools regularly in
the baladiya. The remaining 7% of baladiyas
reporting irregular attendance of students were
in Ubari, Al Aziziya, Derna, Aljfara, Janzour,
Hrawa, Aljufra and Sabratha baladiyas (see
Figure 21 for the breakdown by region and full
Round 14 dataset for more information by
baladiya).
22
Health
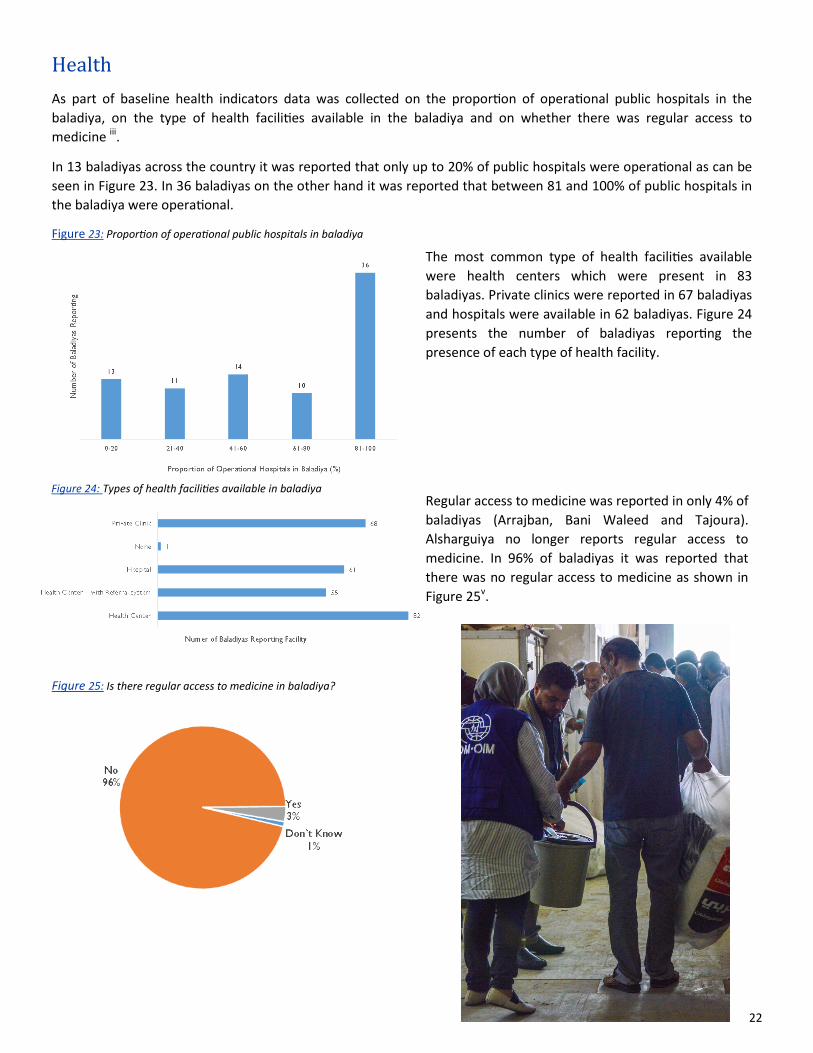
As part of baseline health indicators data was collected on the proportion of operational public hospitals in the
baladiya, on the type of health facilities available in the baladiya and on whether there was regular access to
medicine iii.
In 13 baladiyas across the country it was reported that only up to 20% of public hospitals were operational as can be
seen in Figure 23. In 36 baladiyas on the other hand it was reported that between 81 and 100% of public hospitals in
the baladiya were operational.
Figure 23: Proportion of operational public hospitals in baladiya
The most common type of health facilities available
were health centers which were present in 83
baladiyas. Private clinics were reported in 67 baladiyas
and hospitals were available in 62 baladiyas. Figure 24
presents the number of baladiyas reporting the
presence of each type of health facility.
Regular access to medicine was reported in only 4% of
baladiyas (Arrajban, Bani Waleed and Tajoura).
Alsharguiya no longer reports regular access to
medicine. In 96% of baladiyas it was reported that
there was no regular access to medicine as shown in
Figure 25v.
Figure 25: Is there regular access to medicine in baladiya?
Figure 24: Types of health facilities available in baladiya
23
Public Services & WASH
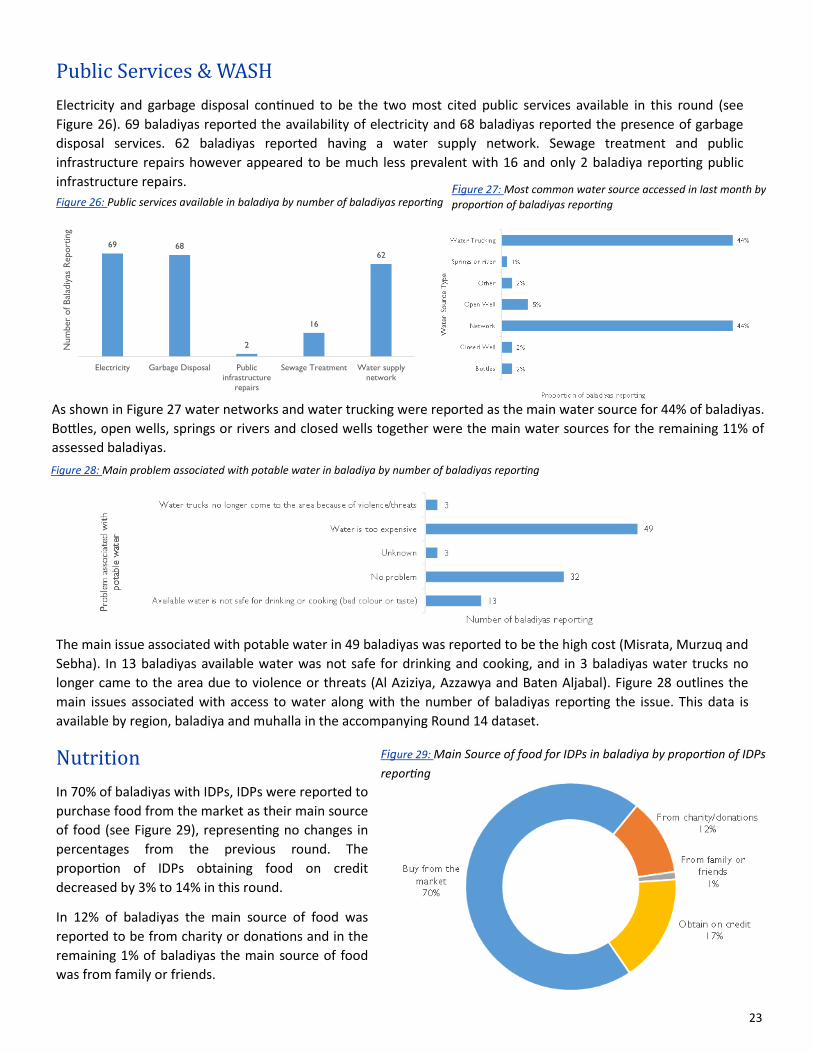
Electricity and garbage disposal continued to be the two most cited public services available in this round (see
Figure 26). 69 baladiyas reported the availability of electricity and 68 baladiyas reported the presence of garbage
disposal services. 62 baladiyas reported having a water supply network. Sewage treatment and public
infrastructure repairs however appeared to be much less prevalent with 16 and only 2 baladiya reporting public
infrastructure repairs.
The main issue associated with potable water in 49 baladiyas was reported to be the high cost (Misrata, Murzuq and
Sebha). In 13 baladiyas available water was not safe for drinking and cooking, and in 3 baladiyas water trucks no
longer came to the area due to violence or threats (Al Aziziya, Azzawya and Baten Aljabal). Figure 28 outlines the
main issues associated with access to water along with the number of baladiyas reporting the issue. This data is
available by region, baladiya and muhalla in the accompanying Round 14 dataset.
Figure 28: Main problem associated with potable water in baladiya by number of baladiyas reporting
Figure 27: Most common water source accessed in last month by
proportion of baladiyas reporting Figure 26: Public services available in baladiya by number of baladiyas reporting
Nutrition
In 70% of baladiyas with IDPs, IDPs were reported to
purchase food from the market as their main source
of food (see Figure 29), representing no changes in
percentages from the previous round. The
proportion of IDPs obtaining food on credit
decreased by 3% to 14% in this round.
In 12% of baladiyas the main source of food was
reported to be from charity or donations and in the
remaining 1% of baladiyas the main source of food
was from family or friends.
Figure 29: Main Source of food for IDPs in baladiya by proportion of IDPs
reporting
69 68
2
16
62
Electricity Garbage Disposal Public
infrastructure
repairs
Sewage Treatment Water supply
network
Num
ber
of B
alad
iyas
Report
ing
As shown in Figure 27 water networks and water trucking were reported as the main water source for 44% of baladiyas.
Bottles, open wells, springs or rivers and closed wells together were the main water sources for the remaining 11% of
assessed baladiyas.
24
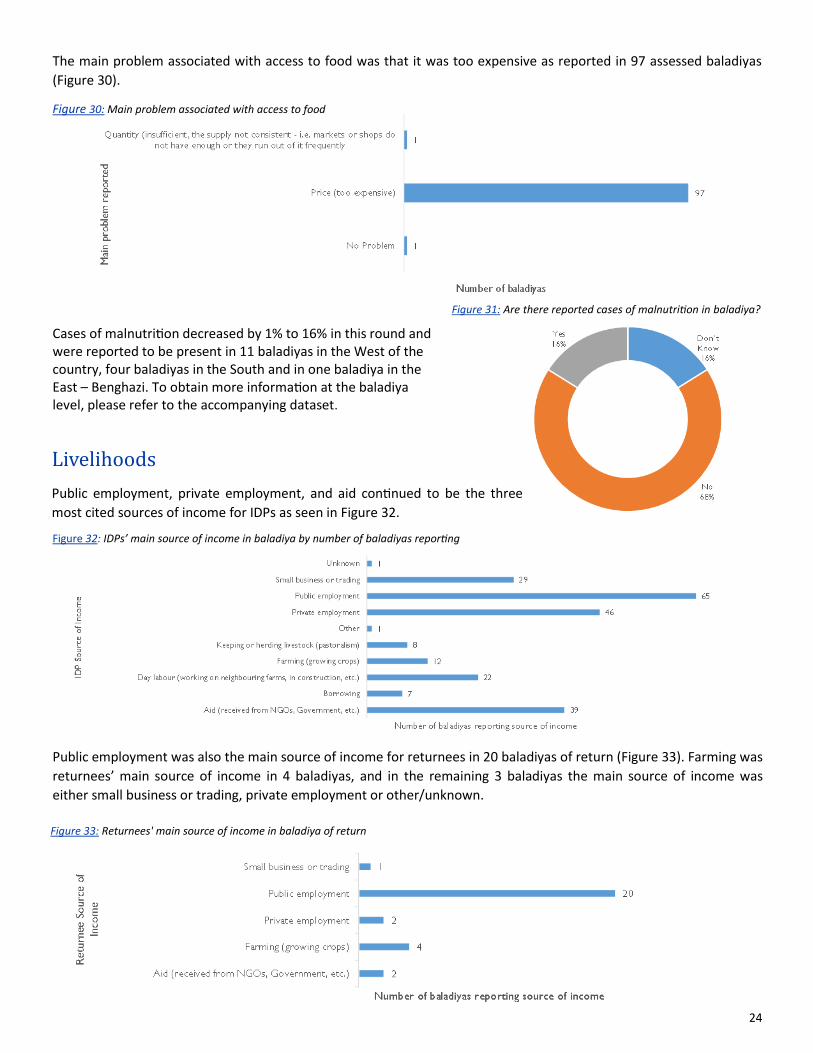
The main problem associated with access to food was that it was too expensive as reported in 97 assessed baladiyas
(Figure 30).
Figure 30: Main problem associated with access to food
Public employment was also the main source of income for returnees in 20 baladiyas of return (Figure 33). Farming was
returnees’ main source of income in 4 baladiyas, and in the remaining 3 baladiyas the main source of income was
either small business or trading, private employment or other/unknown.
Cases of malnutrition decreased by 1% to 16% in this round and were reported to be present in 11 baladiyas in the West of the country, four baladiyas in the South and in one baladiya in the East – Benghazi. To obtain more information at the baladiya level, please refer to the accompanying dataset.
Figure 31: Are there reported cases of malnutrition in baladiya?
Figure 33: Returnees' main source of income in baladiya of return
Figure 32: IDPs’ main source of income in baladiya by number of baladiyas reporting
Livelihoods
Public employment, private employment, and aid continued to be the three
most cited sources of income for IDPs as seen in Figure 32.
25
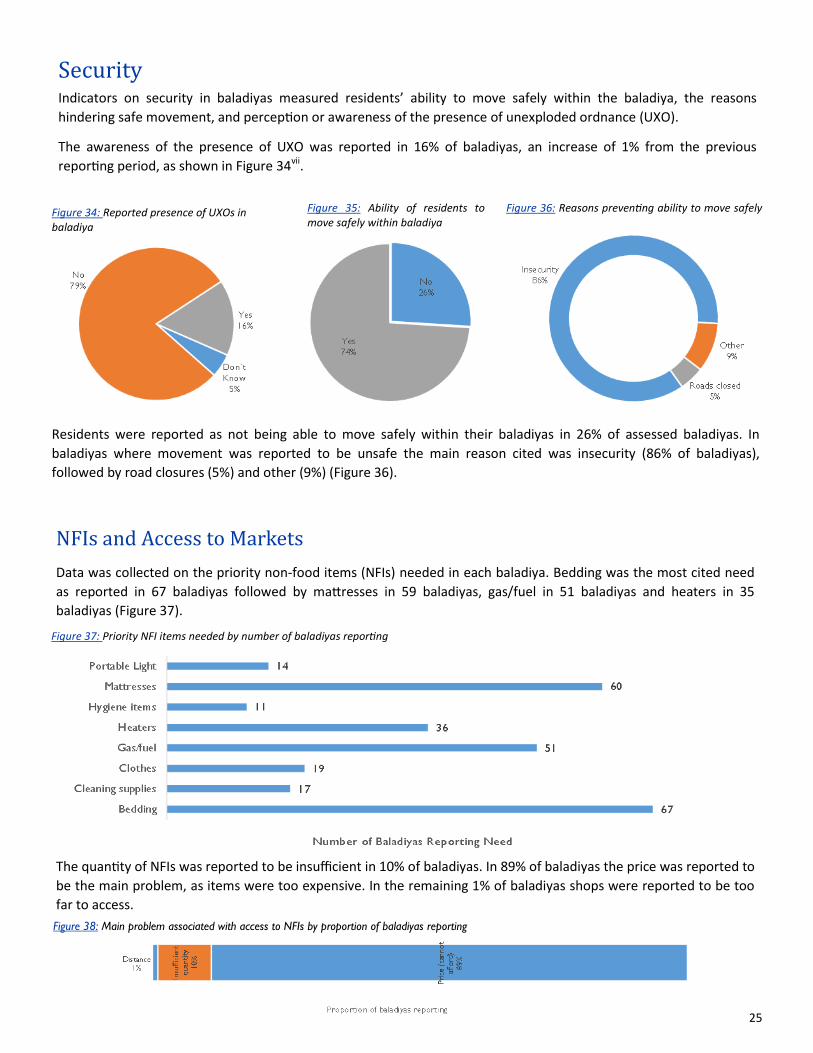
Security Indicators on security in baladiyas measured residents’ ability to move safely within the baladiya, the reasons
hindering safe movement, and perception or awareness of the presence of unexploded ordnance (UXO).
The awareness of the presence of UXO was reported in 16% of baladiyas, an increase of 1% from the previous
reporting period, as shown in Figure 34vii.
Figure 35: Ability of residents to move safely within baladiya
Figure 36: Reasons preventing ability to move safely
NFIs and Access to Markets
Data was collected on the priority non-food items (NFIs) needed in each baladiya. Bedding was the most cited need
as reported in 67 baladiyas followed by mattresses in 59 baladiyas, gas/fuel in 51 baladiyas and heaters in 35
baladiyas (Figure 37).
The quantity of NFIs was reported to be insufficient in 10% of baladiyas. In 89% of baladiyas the price was reported to
be the main problem, as items were too expensive. In the remaining 1% of baladiyas shops were reported to be too
far to access.
Residents were reported as not being able to move safely within their baladiyas in 26% of assessed baladiyas. In
baladiyas where movement was reported to be unsafe the main reason cited was insecurity (86% of baladiyas),
followed by road closures (5%) and other (9%) (Figure 36).
Figure 34: Reported presence of UXOs in baladiya
Figure 38: Main problem associated with access to NFIs by proportion of baladiyas reporting
Figure 37: Priority NFI items needed by number of baladiyas reporting
26
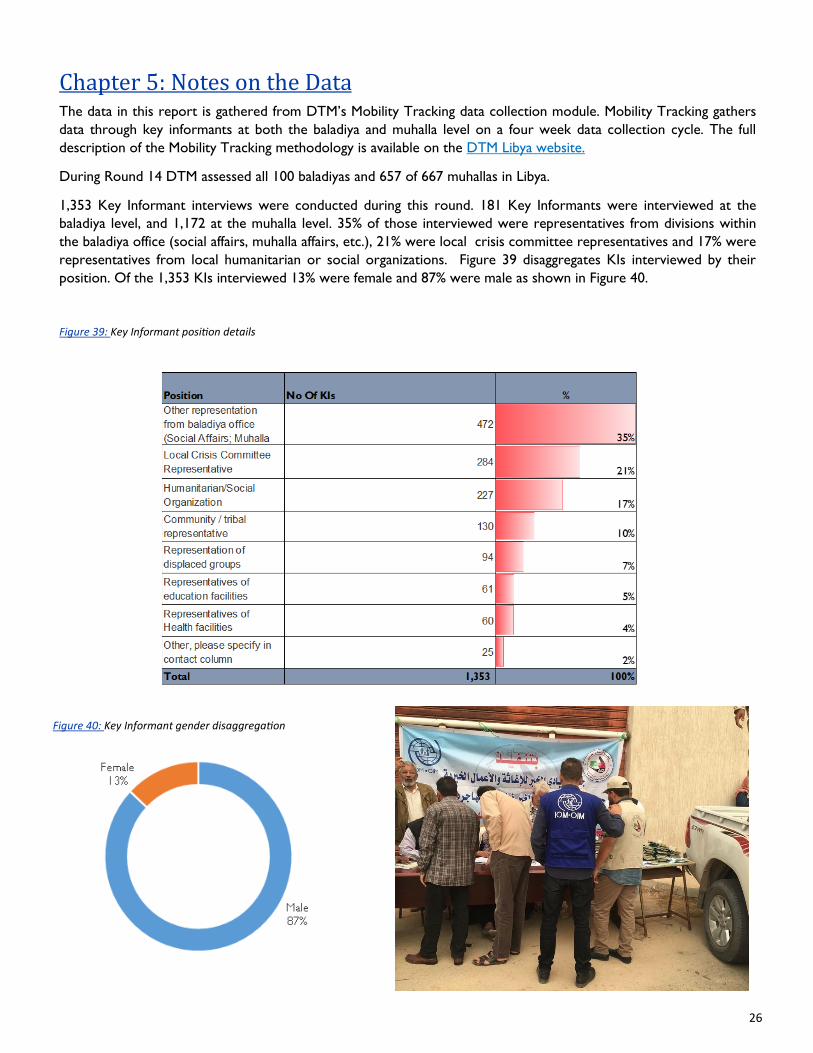
Chapter 5: Notes on the Data The data in this report is gathered from DTM’s Mobility Tracking data collection module. Mobility Tracking gathers
data through key informants at both the baladiya and muhalla level on a four week data collection cycle. The full
description of the Mobility Tracking methodology is available on the DTM Libya website.
During Round 14 DTM assessed all 100 baladiyas and 657 of 667 muhallas in Libya.
1,353 Key Informant interviews were conducted during this round. 181 Key Informants were interviewed at the
baladiya level, and 1,172 at the muhalla level. 35% of those interviewed were representatives from divisions within
the baladiya office (social affairs, muhalla affairs, etc.), 21% were local crisis committee representatives and 17% were
representatives from local humanitarian or social organizations. Figure 39 disaggregates KIs interviewed by their
position. Of the 1,353 KIs interviewed 13% were female and 87% were male as shown in Figure 40.
Figure 39: Key Informant position details
Figure 40: Key Informant gender disaggregation
27
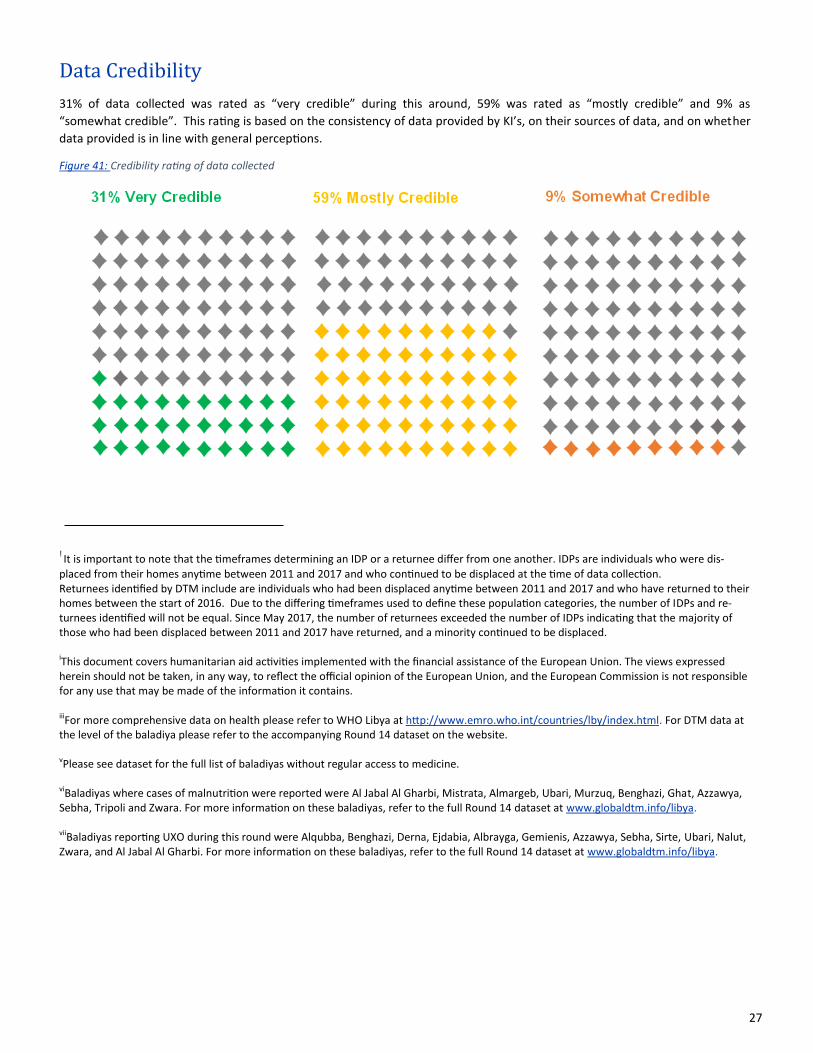
Data Credibility
31% of data collected was rated as “very credible” during this around, 59% was rated as “mostly credible” and 9% as
“somewhat credible”. This rating is based on the consistency of data provided by KI’s, on their sources of data, and on whether
data provided is in line with general perceptions.
Figure 41: Credibility rating of data collected
! It is important to note that the timeframes determining an IDP or a returnee differ from one another. IDPs are individuals who were dis-
placed from their homes anytime between 2011 and 2017 and who continued to be displaced at the time of data collection. Returnees identified by DTM include are individuals who had been displaced anytime between 2011 and 2017 and who have returned to their homes between the start of 2016. Due to the differing timeframes used to define these population categories, the number of IDPs and re-turnees identified will not be equal. Since May 2017, the number of returnees exceeded the number of IDPs indicating that the majority of those who had been displaced between 2011 and 2017 have returned, and a minority continued to be displaced. iThis document covers humanitarian aid activities implemented with the financial assistance of the European Union. The views expressed herein should not be taken, in any way, to reflect the official opinion of the European Union, and the European Commission is not responsible for any use that may be made of the information it contains. iiiFor more comprehensive data on health please refer to WHO Libya at http://www.emro.who.int/countries/lby/index.html. For DTM data at the level of the baladiya please refer to the accompanying Round 14 dataset on the website. vPlease see dataset for the full list of baladiyas without regular access to medicine. viBaladiyas where cases of malnutrition were reported were Al Jabal Al Gharbi, Mistrata, Almargeb, Ubari, Murzuq, Benghazi, Ghat, Azzawya, Sebha, Tripoli and Zwara. For more information on these baladiyas, refer to the full Round 14 dataset at www.globaldtm.info/libya. viiBaladiyas reporting UXO during this round were Alqubba, Benghazi, Derna, Ejdabia, Albrayga, Gemienis, Azzawya, Sebha, Sirte, Ubari, Nalut, Zwara, and Al Jabal Al Gharbi. For more information on these baladiyas, refer to the full Round 14 dataset at www.globaldtm.info/libya.