the dashboard | issue 03
DESCRIPTION
In this edition of The Dashboard you will find examples of our Consultants crafting solutions that embrace the most modern data technologies like Spark and dashDB, as well as an article that will challenge your perspectives on data governance. For those futurists we have a compelling piece on the impact that Cloud computing is having on the traditional business areas of performance management and business intelligence.TRANSCRIPT
THE DASHBOARDTridant’s Quarterly Magazine | Issue 03 April
The Future is Here.Integrated IM, BI & FPM in the Cloud.
Getting Started with dashDB | A Fresh Perspective on Data Governance | Finance + Marketing: Brothers
in Arms | Events, Blogs + More
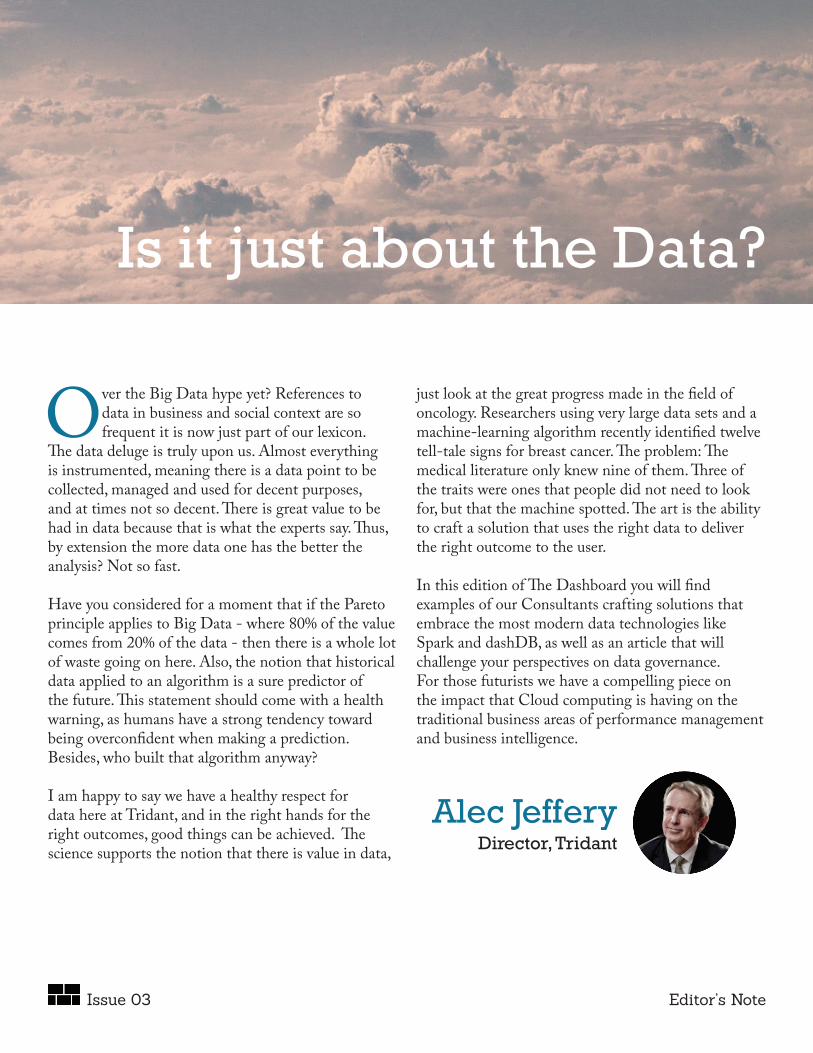
Over the Big Data hype yet? References to data in business and social context are so frequent it is now just part of our lexicon.
The data deluge is truly upon us. Almost everything is instrumented, meaning there is a data point to be collected, managed and used for decent purposes, and at times not so decent. There is great value to be had in data because that is what the experts say. Thus, by extension the more data one has the better the analysis? Not so fast. Have you considered for a moment that if the Pareto principle applies to Big Data - where 80% of the value comes from 20% of the data - then there is a whole lot of waste going on here. Also, the notion that historical data applied to an algorithm is a sure predictor of the future. This statement should come with a health warning, as humans have a strong tendency toward being overconfident when making a prediction. Besides, who built that algorithm anyway? I am happy to say we have a healthy respect for data here at Tridant, and in the right hands for the right outcomes, good things can be achieved. The science supports the notion that there is value in data,
just look at the great progress made in the field of oncology. Researchers using very large data sets and a machine-learning algorithm recently identified twelve tell-tale signs for breast cancer. The problem: The medical literature only knew nine of them. Three of the traits were ones that people did not need to look for, but that the machine spotted. The art is the ability to craft a solution that uses the right data to deliver the right outcome to the user. In this edition of The Dashboard you will find examples of our Consultants crafting solutions that embrace the most modern data technologies like Spark and dashDB, as well as an article that will challenge your perspectives on data governance. For those futurists we have a compelling piece on the impact that Cloud computing is having on the traditional business areas of performance management and business intelligence.
Is it just about the Data?
Alec JefferyDirector, Tridant
Issue 03 Editor’s Note
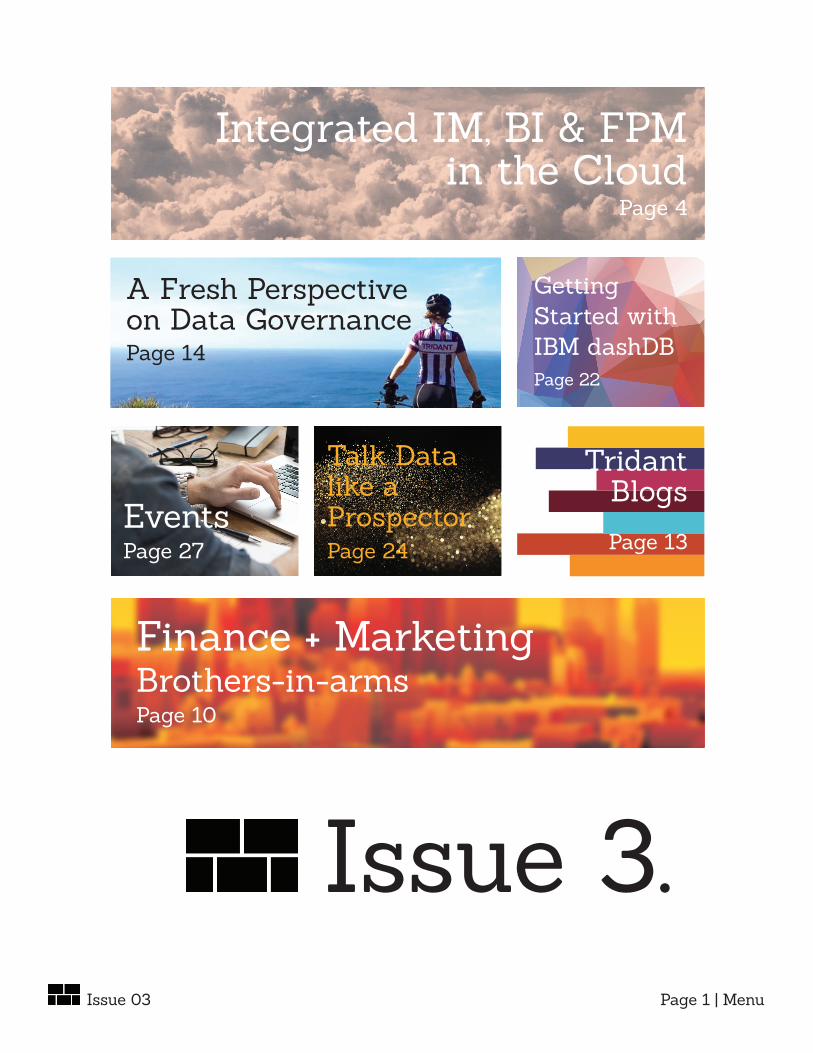
Issue 3.
Tridant Blogs
Page 13EventsPage 27
A Fresh Perspectiveon Data GovernancePage 14
Integrated IM, BI & FPM in the Cloud
Page 4
Getting Started with IBM dashDBPage 22
Talk Data like a ProspectorPage 24
Page 1 | MenuIssue 03
Finance + MarketingBrothers-in-armsPage 10
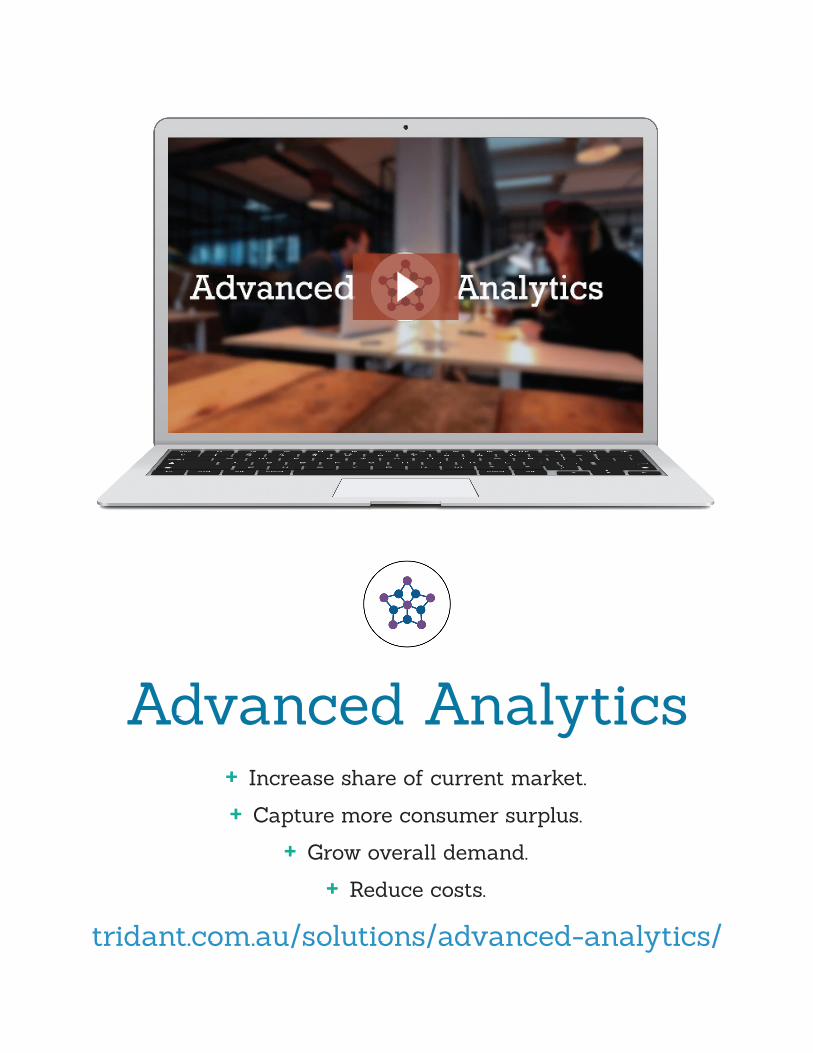
Advanced Analytics+ Increase share of current market.
+ Capture more consumer surplus.
+ Grow overall demand.
+ Reduce costs.
tridant.com.au/solutions/advanced-analytics/

Learn from the Best.
Tridant offers In-Class & Online Training for:
IBM Cognos TM1
IBM Cognos BI
IBM SPSS
Tableau
tridant.com.au/services/training/
The Future is Now.
Integrated IM, BI & FPMIn the Cloud.
By James Wakefield
Performance
Mea
suring & Monitoring
PlanningReporting & Analysis
How are we doing?
What should we be doing?
Why?
Performance Management Capabilities
Operations
Customer Service
ProductDevelopment
Finance
IT
HR
Sales
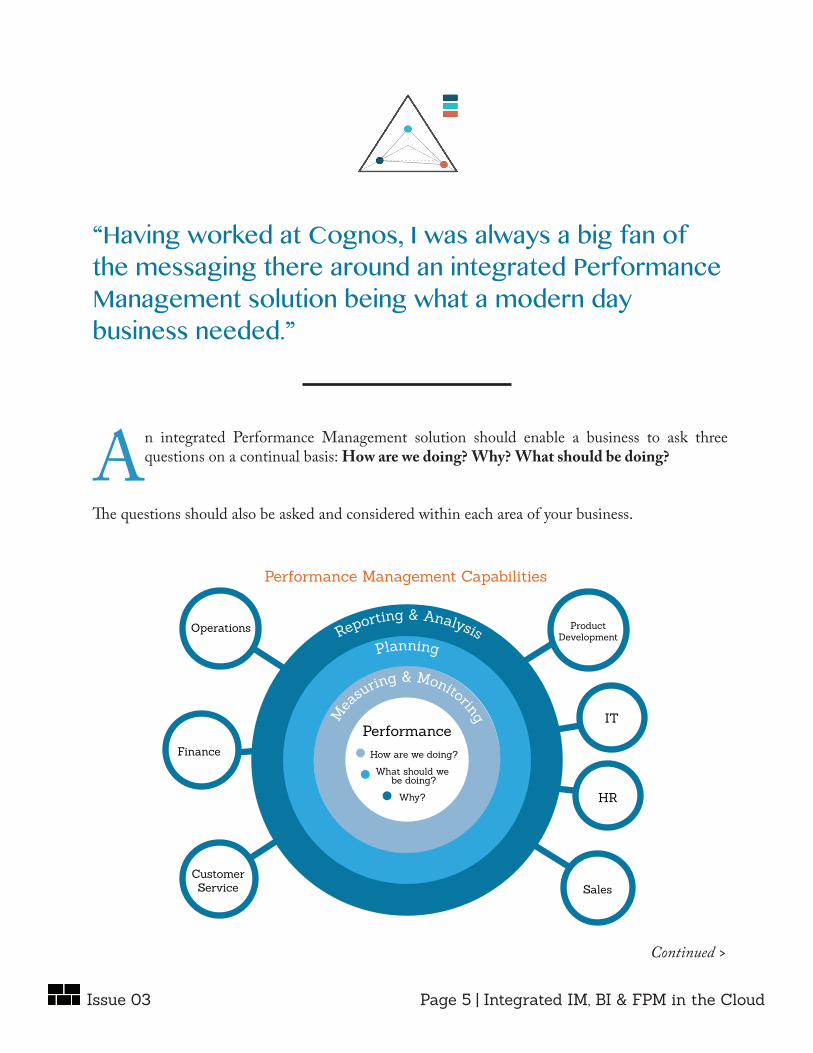
“Having worked at Cognos, I was always a big fan of the messaging there around an integrated Performance Management solution being what a modern day business needed.”
An integrated Performance Management solution should enable a business to ask three questions on a continual basis: How are we doing? Why? What should be doing?
The questions should also be asked and considered within each area of your business.
Continued >
Page 5 | Integrated IM, BI & FPM in the CloudIssue 03
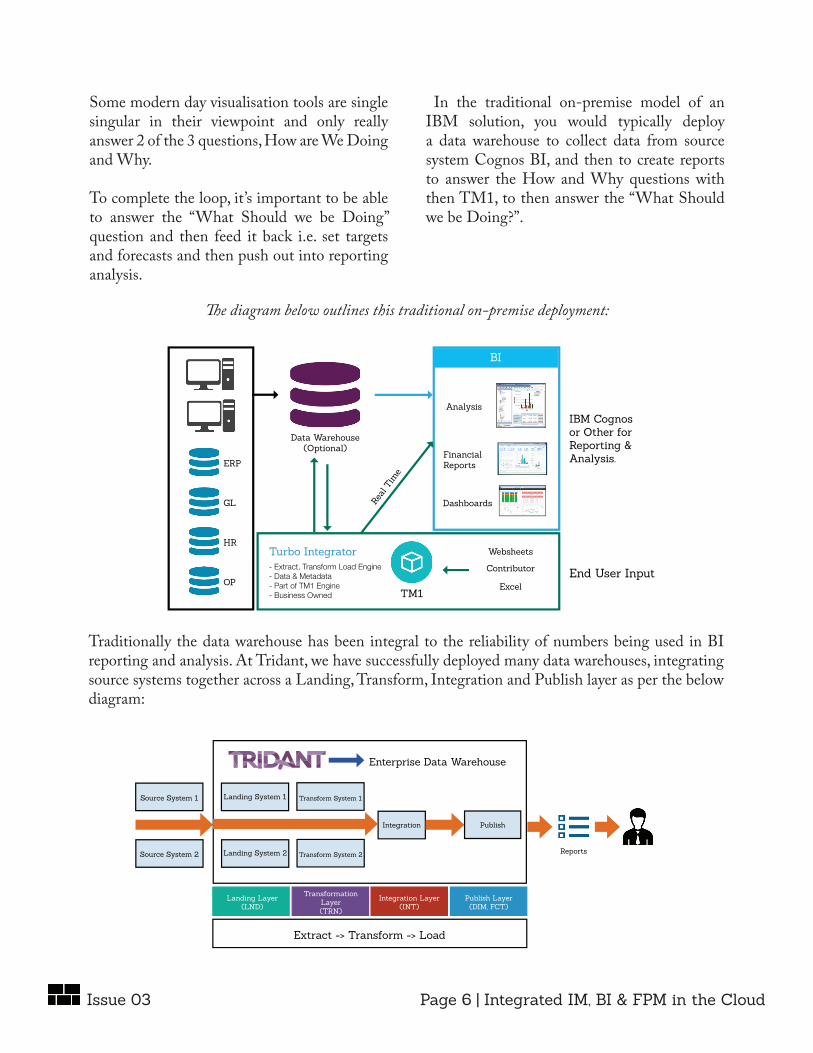
Some modern day visualisation tools are single singular in their viewpoint and only really answer 2 of the 3 questions, How are We Doing and Why.
To complete the loop, it’s important to be able to answer the “What Should we be Doing” question and then feed it back i.e. set targets and forecasts and then push out into reporting analysis.
In the traditional on-premise model of an IBM solution, you would typically deploy a data warehouse to collect data from source system Cognos BI, and then to create reports to answer the How and Why questions with then TM1, to then answer the “What Should we be Doing?”.
The diagram below outlines this traditional on-premise deployment:
ERP
GL
HR
OP
Data Warehouse(Optional)
Turbo Integrator- Extract, Transform Load Engine- Data & Metadata- Part of TM1 Engine- Business Owned
Real
Tim
e
Websheets
Contributor
ExcelTM1
End User Input
IBM Cognos or Other for Reporting & Analysis.
BI
Analysis
FinancialReports
Dashboards
Traditionally the data warehouse has been integral to the reliability of numbers being used in BI reporting and analysis. At Tridant, we have successfully deployed many data warehouses, integrating source systems together across a Landing, Transform, Integration and Publish layer as per the below diagram:
Enterprise Data Warehouse
Source System 1
Source System 2
Landing System 1 Transform System 1
Landing System 2 Transform System 2
Integration Publish
Reports
Extract -> Transform -> Load
Landing Layer (LND)
TransformationLayer(TRN)
Integration Layer (INT)
Publish Layer(DIM, FCT)
Page 6 | Integrated IM, BI & FPM in the CloudIssue 03
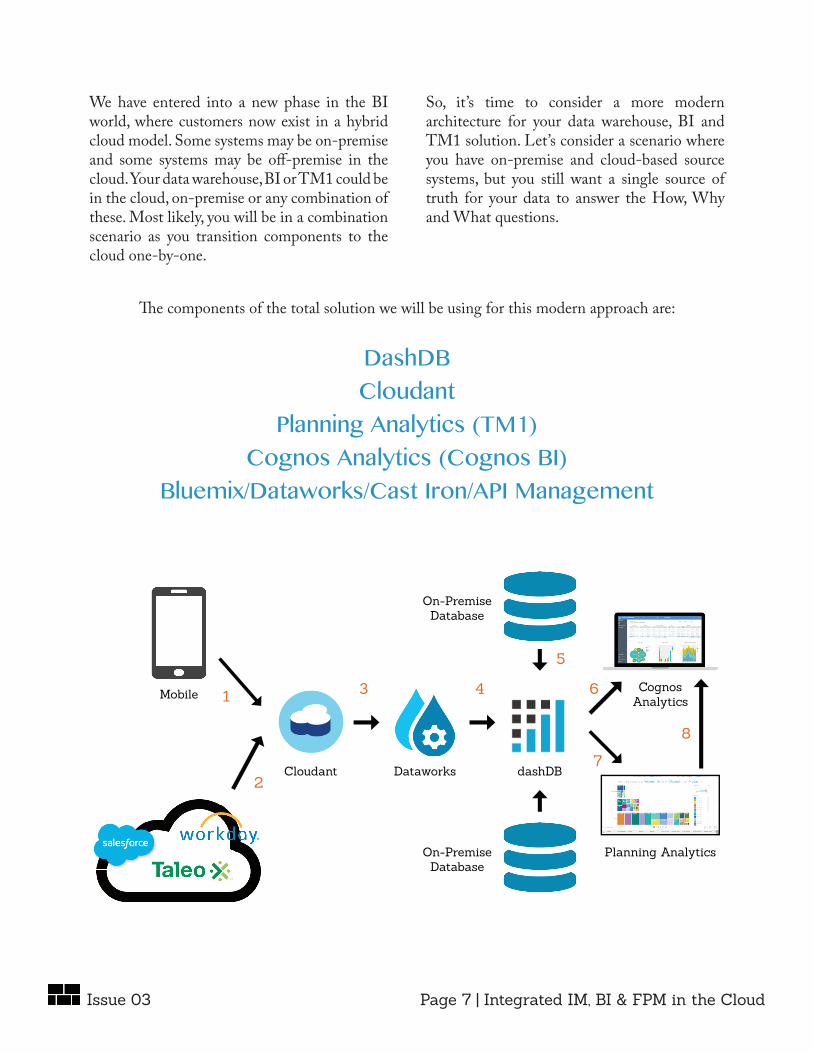
We have entered into a new phase in the BI world, where customers now exist in a hybrid cloud model. Some systems may be on-premise and some systems may be off-premise in the cloud. Your data warehouse, BI or TM1 could be in the cloud, on-premise or any combination of these. Most likely, you will be in a combination scenario as you transition components to the cloud one-by-one.
So, it’s time to consider a more modern architecture for your data warehouse, BI and TM1 solution. Let’s consider a scenario where you have on-premise and cloud-based source systems, but you still want a single source of truth for your data to answer the How, Why and What questions.
The components of the total solution we will be using for this modern approach are:
DashDBCloudant
Planning Analytics (TM1)Cognos Analytics (Cognos BI)
Bluemix/Dataworks/Cast Iron/API Management
Cloudant Dataworks dashDB
CognosAnalytics
Planning Analytics
On-PremiseDatabase
On-PremiseDatabase
Mobile
2
1 3 4
5
6
7
8
Page 7 | Integrated IM, BI & FPM in the CloudIssue 03
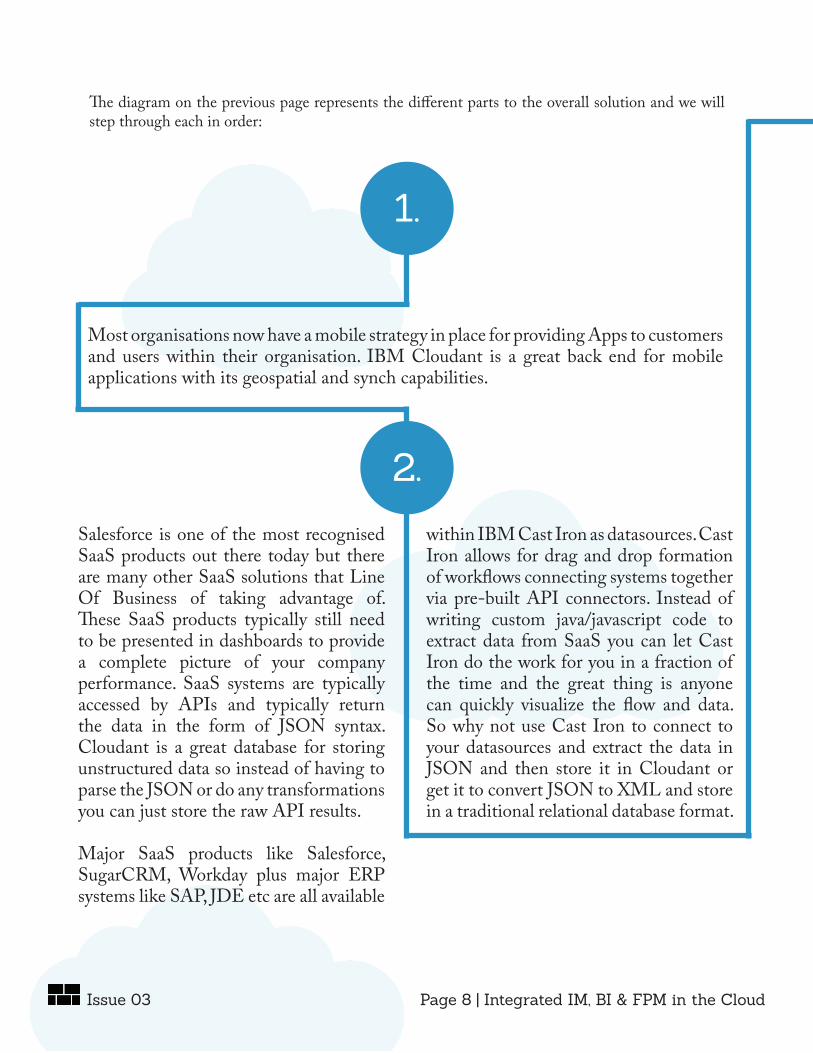
The diagram on the previous page represents the different parts to the overall solution and we will step through each in order:
1.
Most organisations now have a mobile strategy in place for providing Apps to customers and users within their organisation. IBM Cloudant is a great back end for mobile applications with its geospatial and synch capabilities.
2.Salesforce is one of the most recognised SaaS products out there today but there are many other SaaS solutions that Line Of Business of taking advantage of. These SaaS products typically still need to be presented in dashboards to provide a complete picture of your company performance. SaaS systems are typically accessed by APIs and typically return the data in the form of JSON syntax. Cloudant is a great database for storing unstructured data so instead of having to parse the JSON or do any transformations you can just store the raw API results.
Major SaaS products like Salesforce, SugarCRM, Workday plus major ERP systems like SAP, JDE etc are all available
within IBM Cast Iron as datasources. Cast Iron allows for drag and drop formation of workflows connecting systems together via pre-built API connectors. Instead of writing custom java/javascript code to extract data from SaaS you can let Cast Iron do the work for you in a fraction of the time and the great thing is anyone can quickly visualize the flow and data. So why not use Cast Iron to connect to your datasources and extract the data in JSON and then store it in Cloudant or get it to convert JSON to XML and store in a traditional relational database format.
Issue 03 Page 8 | Integrated IM, BI & FPM in the Cloud
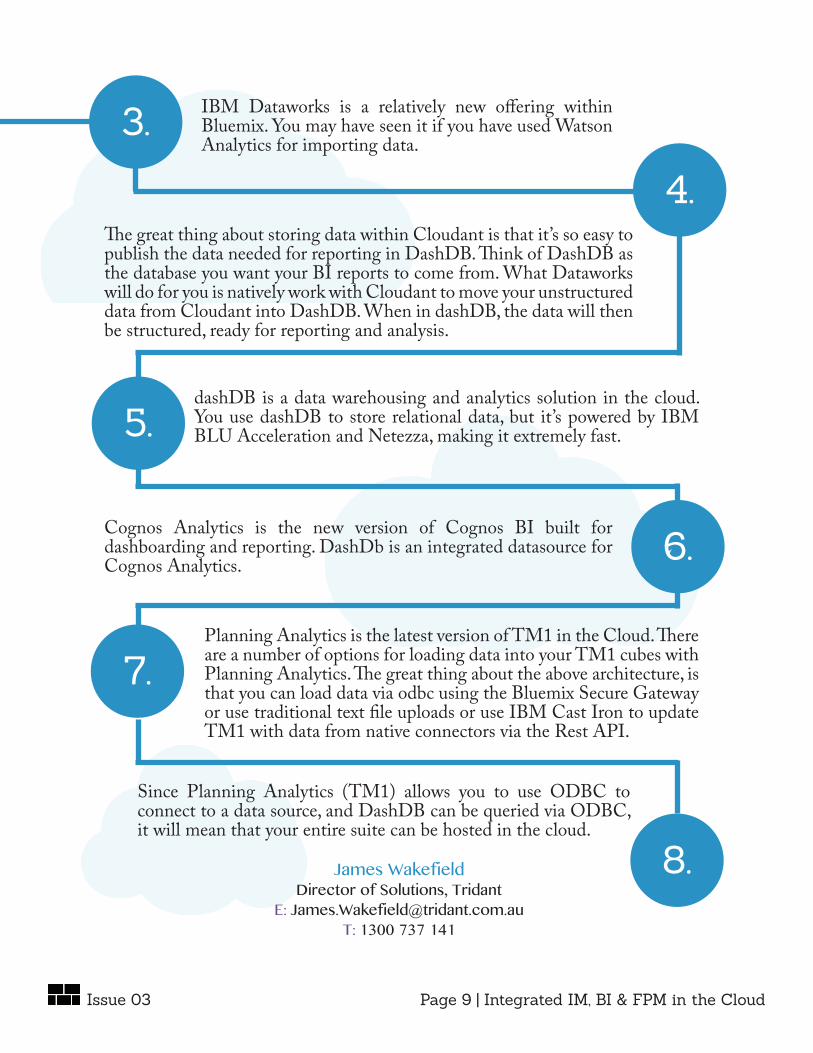
3. IBM Dataworks is a relatively new offering within Bluemix. You may have seen it if you have used Watson Analytics for importing data.
4.The great thing about storing data within Cloudant is that it’s so easy to publish the data needed for reporting in DashDB. Think of DashDB as the database you want your BI reports to come from. What Dataworks will do for you is natively work with Cloudant to move your unstructured data from Cloudant into DashDB. When in dashDB, the data will then be structured, ready for reporting and analysis.
5.dashDB is a data warehousing and analytics solution in the cloud. You use dashDB to store relational data, but it’s powered by IBM BLU Acceleration and Netezza, making it extremely fast.
6.Cognos Analytics is the new version of Cognos BI built for dashboarding and reporting. DashDb is an integrated datasource for Cognos Analytics.
7.Planning Analytics is the latest version of TM1 in the Cloud. There are a number of options for loading data into your TM1 cubes with Planning Analytics. The great thing about the above architecture, is that you can load data via odbc using the Bluemix Secure Gateway or use traditional text file uploads or use IBM Cast Iron to update TM1 with data from native connectors via the Rest API.
8.
Since Planning Analytics (TM1) allows you to use ODBC to connect to a data source, and DashDB can be queried via ODBC, it will mean that your entire suite can be hosted in the cloud.
James WakefieldDirector of Solutions, Tridant
E: [email protected]: 1300 737 141
Issue 03 Page 9 | Integrated IM, BI & FPM in the Cloud
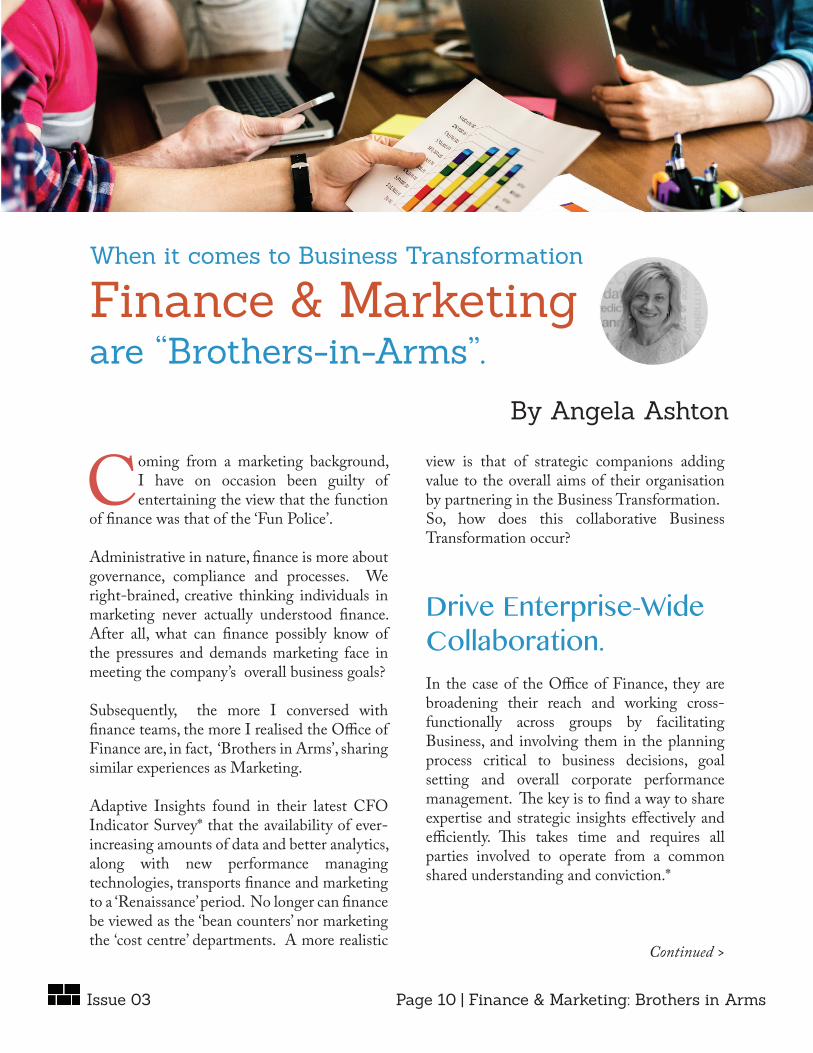
Coming from a marketing background, I have on occasion been guilty of entertaining the view that the function
of finance was that of the ‘Fun Police’.
Administrative in nature, finance is more about governance, compliance and processes. We right-brained, creative thinking individuals in marketing never actually understood finance. After all, what can finance possibly know of the pressures and demands marketing face in meeting the company’s overall business goals?
Subsequently, the more I conversed with finance teams, the more I realised the Office of Finance are, in fact, ‘Brothers in Arms’, sharing similar experiences as Marketing.
Adaptive Insights found in their latest CFO Indicator Survey* that the availability of ever-increasing amounts of data and better analytics, along with new performance managing technologies, transports finance and marketing to a ‘Renaissance’ period. No longer can finance be viewed as the ‘bean counters’ nor marketing the ‘cost centre’ departments. A more realistic
view is that of strategic companions adding value to the overall aims of their organisation by partnering in the Business Transformation. So, how does this collaborative Business Transformation occur?
Drive Enterprise-Wide Collaboration.In the case of the Office of Finance, they are broadening their reach and working cross-functionally across groups by facilitating Business, and involving them in the planning process critical to business decisions, goal setting and overall corporate performance management. The key is to find a way to share expertise and strategic insights effectively and efficiently. This takes time and requires all parties involved to operate from a common shared understanding and conviction.*
Continued >
When it comes to Business Transformation
Finance & Marketingare “Brothers-in-Arms”.
By Angela Ashton
Page 10 | Finance & Marketing: Brothers in ArmsIssue 03
Issue 03
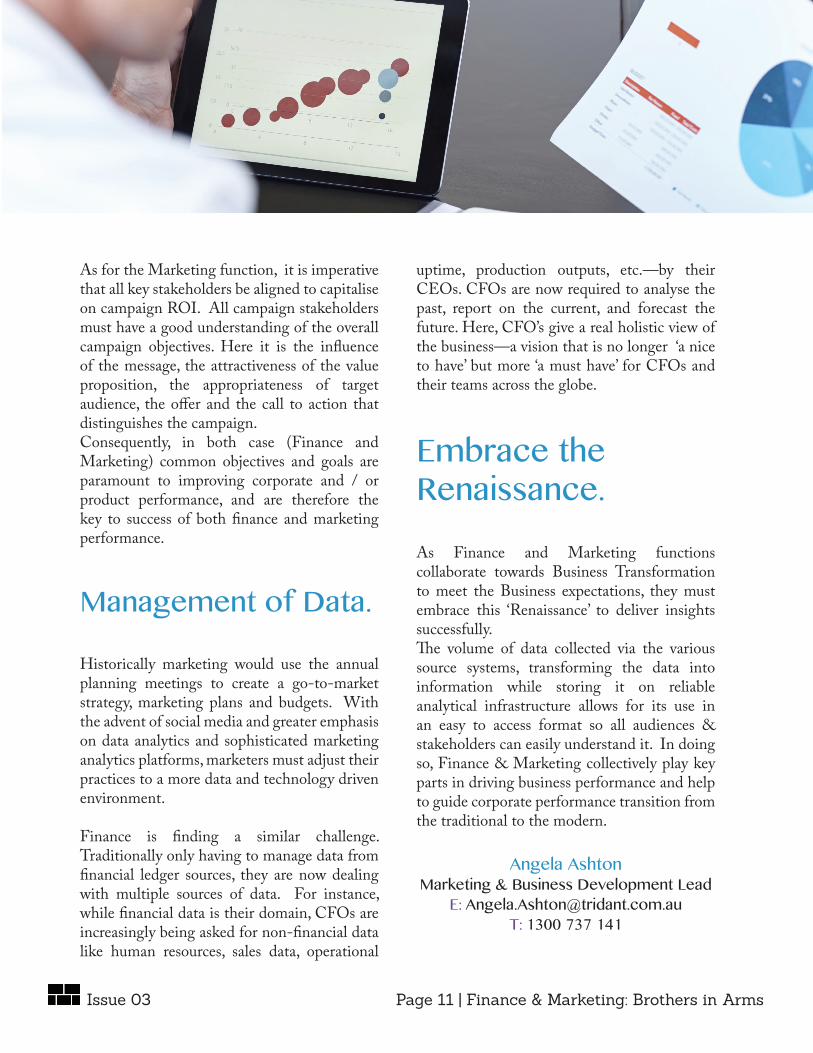
As for the Marketing function, it is imperative that all key stakeholders be aligned to capitalise on campaign ROI. All campaign stakeholders must have a good understanding of the overall campaign objectives. Here it is the influence of the message, the attractiveness of the value proposition, the appropriateness of target audience, the offer and the call to action that distinguishes the campaign.Consequently, in both case (Finance and Marketing) common objectives and goals are paramount to improving corporate and / or product performance, and are therefore the key to success of both finance and marketing performance.
Management of Data.
Historically marketing would use the annual planning meetings to create a go-to-market strategy, marketing plans and budgets. With the advent of social media and greater emphasis on data analytics and sophisticated marketing analytics platforms, marketers must adjust their practices to a more data and technology driven environment.
Finance is finding a similar challenge. Traditionally only having to manage data from financial ledger sources, they are now dealing with multiple sources of data. For instance, while financial data is their domain, CFOs are increasingly being asked for non-financial data like human resources, sales data, operational
uptime, production outputs, etc.—by their CEOs. CFOs are now required to analyse the past, report on the current, and forecast the future. Here, CFO’s give a real holistic view of the business—a vision that is no longer ‘a nice to have’ but more ‘a must have’ for CFOs and their teams across the globe.
Embrace the Renaissance.
As Finance and Marketing functions collaborate towards Business Transformation to meet the Business expectations, they must embrace this ‘Renaissance’ to deliver insights successfully. The volume of data collected via the various source systems, transforming the data into information while storing it on reliable analytical infrastructure allows for its use in an easy to access format so all audiences & stakeholders can easily understand it. In doing so, Finance & Marketing collectively play key parts in driving business performance and help to guide corporate performance transition from the traditional to the modern.
Angela AshtonMarketing & Business Development Lead
E: [email protected]: 1300 737 141
Page 11 | Finance & Marketing: Brothers in Arms
Follow Tridant.
For News, Articles& Insights
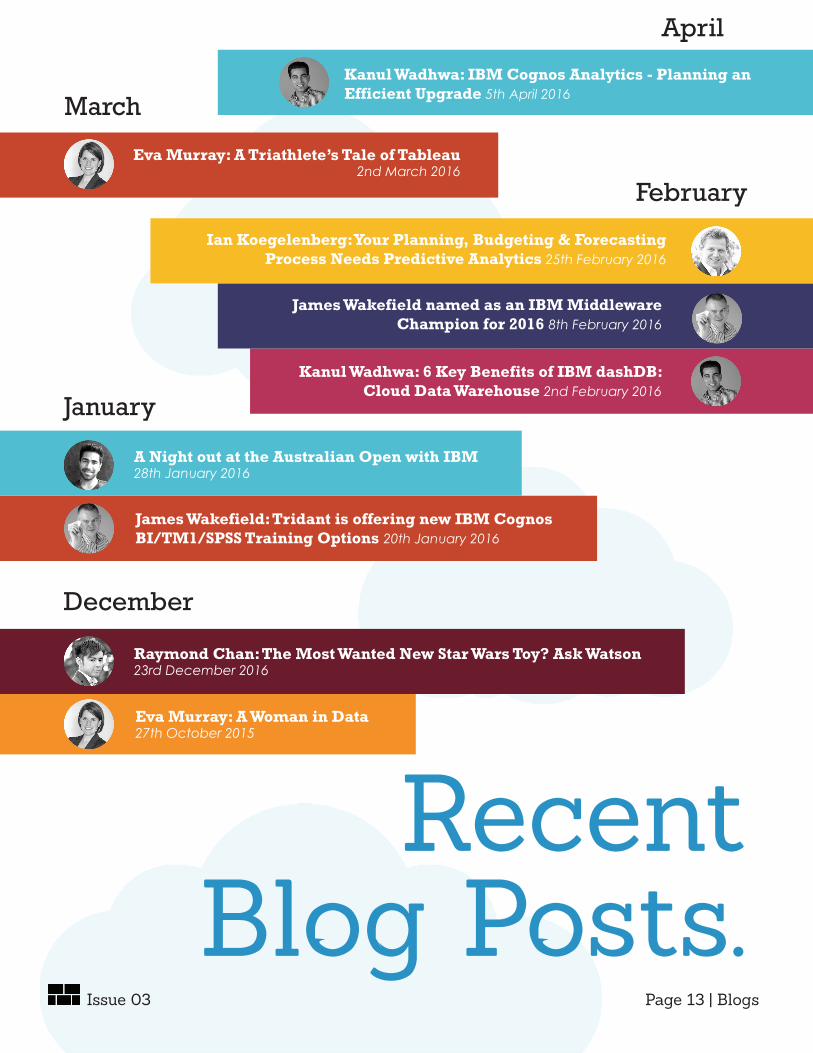
RecentBlog Posts.
March
February
Eva Murray: A Triathlete’s Tale of Tableau2nd March 2016
Ian Koegelenberg: Your Planning, Budgeting & Forecasting Process Needs Predictive Analytics 25th February 2016
James Wakefield named as an IBM Middleware Champion for 2016 8th February 2016
Kanul Wadhwa: 6 Key Benefits of IBM dashDB: Cloud Data Warehouse 2nd February 2016
Raymond Chan: The Most Wanted New Star Wars Toy? Ask Watson23rd December 2016
A Night out at the Australian Open with IBM28th January 2016
James Wakefield: Tridant is offering new IBM Cognos BI/TM1/SPSS Training Options 20th January 2016
Eva Murray: A Woman in Data27th October 2015
January
December
Kanul Wadhwa: IBM Cognos Analytics - Planning an Efficient Upgrade 5th April 2016
April
Issue 03 Page 13 | Blogs
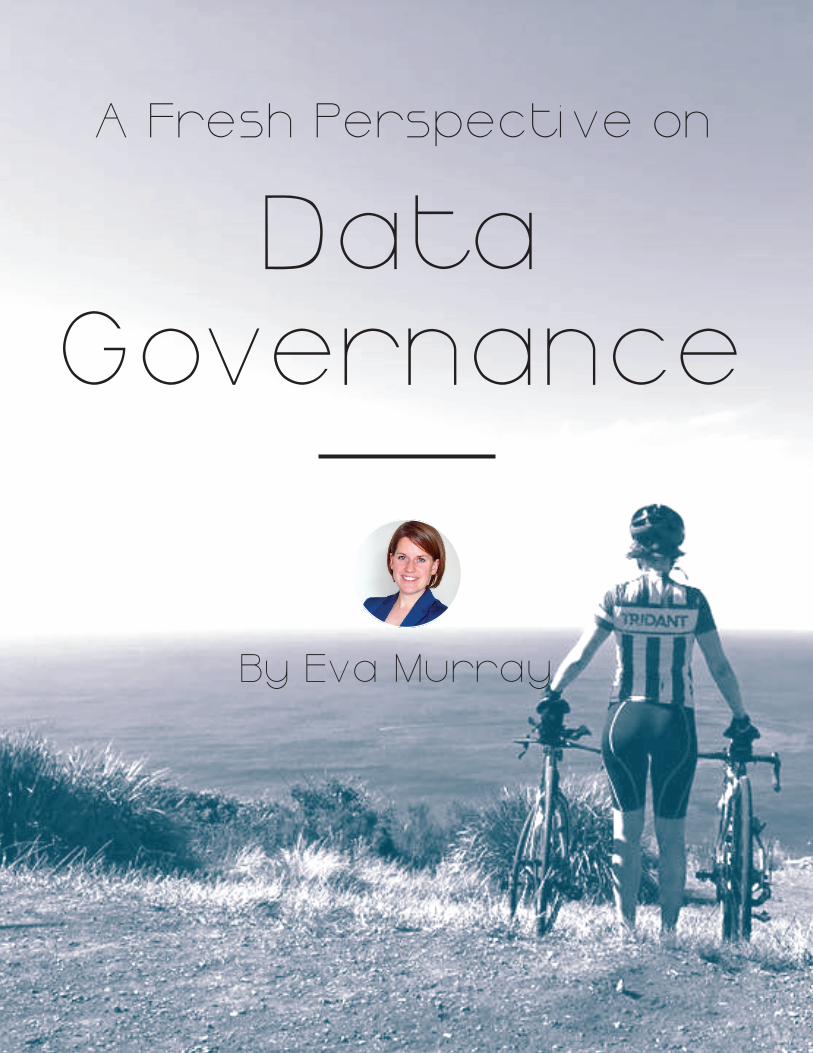
A Fresh Perspective on
DataGovernance
By Eva Murray
During a recent ‘unplugged’ weekend in Sydney, I had the chance to spend some time in the sunshine, riding
my bike, swimming in the ocean and strolling around, playing tourist. I also enjoyed a number of inspiring conversations with a friend, while eating at various restaurants around the city. After 2 1/2 days, my batteries were recharged, and I arrived at the office the next day, ready to dive into some serious data analysis for a client who was seeking to gain new insights from their data. With a refreshed body and mind, I was able to take a new approach. I picked a new angle from which to view ‘problems’, and subsequently identified an interesting pattern in the dataset, which the client appreciated when I eventually presented my findings.
For most of us, it’s all too easy to go around in circles when tackling a problem until we step away and do something else for a little while, and come back with a ‘fresh set of eyes’. Those eyes can be our own, however most of us work in small or large teams these days, connected to colleagues and other professionals across our organisations and social networks. We can easily tap into a vast amount of resources to get inspired, and have the opportunity to collaborate with others to figure out ‘why,
where, when, how, what – and often most importantly - how much…’
As we collaborate and create, solve, investigate and understand what our data is telling us about our organisation, our customers, products, processes and even competitors, we begin to create increasingly complex webs of shared information, shared data, shared opinions and shared artefacts, such as reports, spreadsheets and data extracts…and then it all gets a little hairy…
Suddenly we are asked to produce information - meaningful information with actionable insights to drive decisions in our organisation, but the collaborative effort, which brought us to this point, resembles not the solid scaffolding we envisaged, but rather a Jenga tower, just about to collapse… “Who had the latest version of our report? And is the data still up to date?” “John refreshed it, but suddenly our calculations don’t work anymore, and some of the columns in the raw data are missing”. “And why has no one updated the commentary in the last month?”
Continued >
“The real voyage of discovery consists not in seeking new lands but seeing with new eyes”.
- Marcel Proust
Page 15 | A Fresh Perspective on Data GovernanceIssue 03
Governance Governing the process of creating information artefacts is often easier said than done. On the one hand, we want to enable our people by giving them flexible tools, the freedom to analyse, explore and experiment with the data, and also make data easily accessible to the right people. On the other hand, we aim to govern these processes to ensure that any information reported is accurate, reliable and can be traced back to its inputs. This requires a certain amount of rigour, formal process and - dare I say it - some red tape.
Or does it?In recent months and years, we have seen a number of clients mature in their Tableau journey, from experimental analysis and ad hoc analytics, to establishing the tool as a robust, enterprise-level solution for various analytical
and reporting needs. Additionally, it has provided those clients with an effective means to communicate information and collaborate across geographically distributed organisations.
In line with this development at a client level, there has been progress at Tableau Software HQ, who themselves have made great strides to further enhancing their product’s Enterprise-level capabilities, by overhauling Tableau Server, producing a number of whitepapers and other publications, and by offering a host of training and presentations, delivered through their conferences and webinars. Enterprise is certainly the destination of many organisations’ Tableau efforts. While a number of areas can be addressed to get your own Tableau environment ‘enterprise ready’, I want to share one key recommendation that can enable you to tackle a number of concerns, all at once.
Page 16 | A Fresh Perspective on Data GovernanceIssue 03
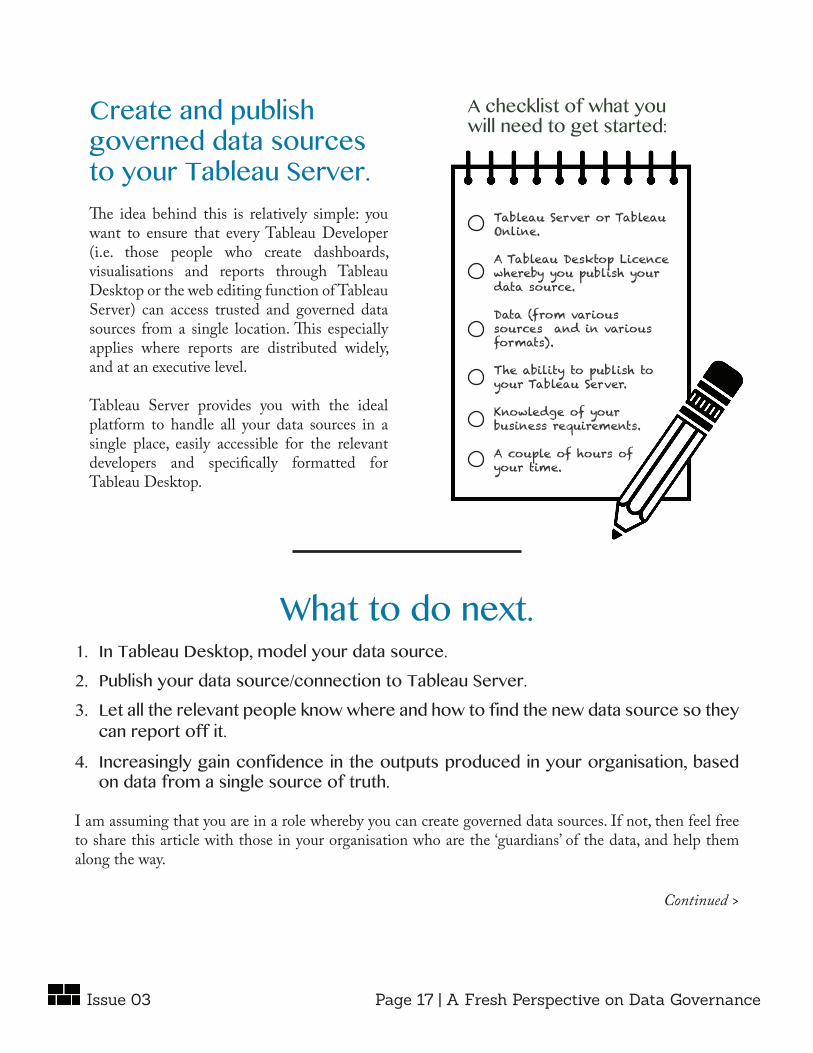
Create and publish governed data sources to your Tableau Server. The idea behind this is relatively simple: you want to ensure that every Tableau Developer (i.e. those people who create dashboards, visualisations and reports through Tableau Desktop or the web editing function of Tableau Server) can access trusted and governed data sources from a single location. This especially applies where reports are distributed widely, and at an executive level.
Tableau Server provides you with the ideal platform to handle all your data sources in a single place, easily accessible for the relevant developers and specifically formatted for Tableau Desktop.
A checklist of what you will need to get started:
Tableau Server or Tableau Online.
A Tableau Desktop Licence whereby you publish your data source.
Data (from various sources and in various formats).
The ability to publish to your Tableau Server.
Knowledge of your business requirements.
A couple of hours of your time.
What to do next. 1. In Tableau Desktop, model your data source.
2. Publish your data source/connection to Tableau Server.
3. Let all the relevant people know where and how to find the new data source so they can report off it.
4. Increasingly gain confidence in the outputs produced in your organisation, based on data from a single source of truth.
I am assuming that you are in a role whereby you can create governed data sources. If not, then feel free to share this article with those in your organisation who are the ‘guardians’ of the data, and help them along the way.
Continued >
Page 17 | A Fresh Perspective on Data GovernanceIssue 03
In more detail, here’s how you can go about it.
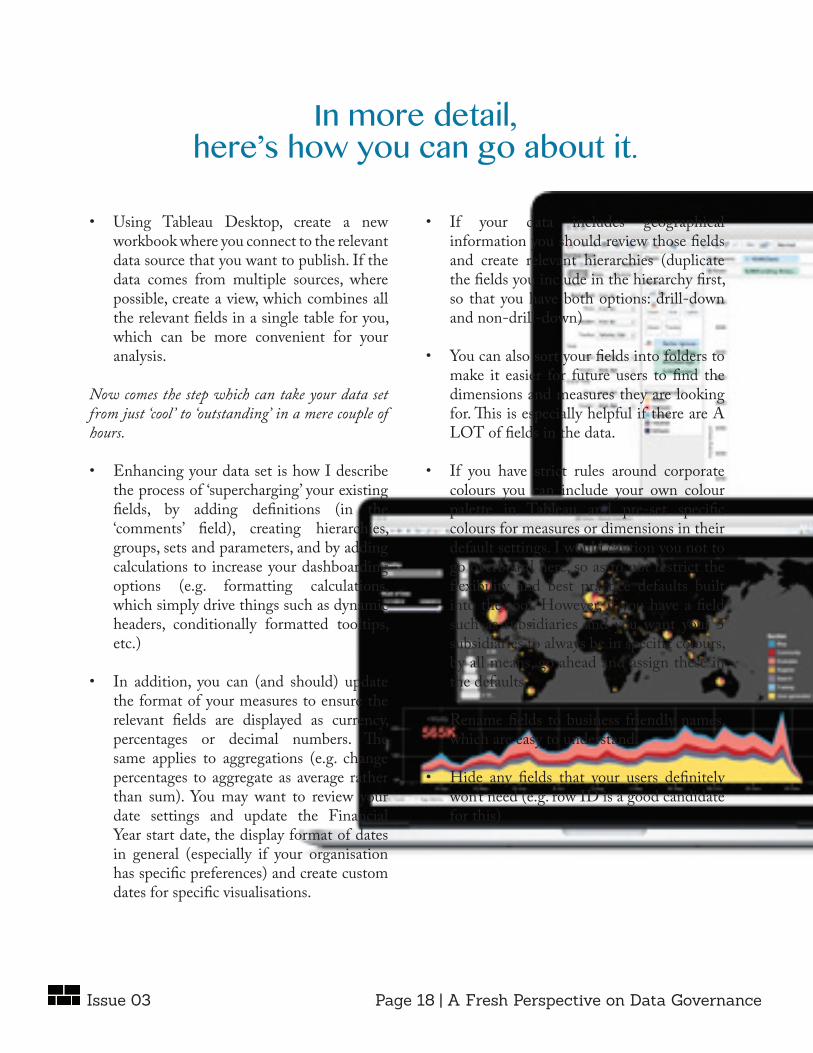
• Using Tableau Desktop, create a new workbook where you connect to the relevant data source that you want to publish. If the data comes from multiple sources, where possible, create a view, which combines all the relevant fields in a single table for you, which can be more convenient for your analysis.
Now comes the step which can take your data set from just ‘cool ’ to ‘outstanding’ in a mere couple of hours.
• Enhancing your data set is how I describe the process of ‘supercharging’ your existing fields, by adding definitions (in the ‘comments’ field), creating hierarchies, groups, sets and parameters, and by adding calculations to increase your dashboarding options (e.g. formatting calculations, which simply drive things such as dynamic headers, conditionally formatted tooltips, etc.)
• In addition, you can (and should) update the format of your measures to ensure the relevant fields are displayed as currency, percentages or decimal numbers. The same applies to aggregations (e.g. change percentages to aggregate as average rather than sum). You may want to review your date settings and update the Financial Year start date, the display format of dates in general (especially if your organisation has specific preferences) and create custom dates for specific visualisations.
• If your data includes geographical information you should review those fields and create relevant hierarchies (duplicate the fields you include in the hierarchy first, so that you have both options: drill-down and non-drill-down)
• You can also sort your fields into folders to make it easier for future users to find the dimensions and measures they are looking for. This is especially helpful if there are A LOT of fields in the data.
• If you have strict rules around corporate colours you can include your own colour palette in Tableau and pre-set specific colours for measures or dimensions in their default settings. I would caution you not to go overboard here, so as to not restrict the flexibility and best practice defaults built into the tool. However, if you have a field such as subsidiaries and you want your 5 subsidiaries to always be in specific colours, by all means, go ahead and assign these in the defaults
• Rename fields to business friendly names, which are easy to understand.
• Hide any fields that your users definitely won’t need (e.g. row ID is a good candidate for this)
Page 18 | A Fresh Perspective on Data GovernanceIssue 03
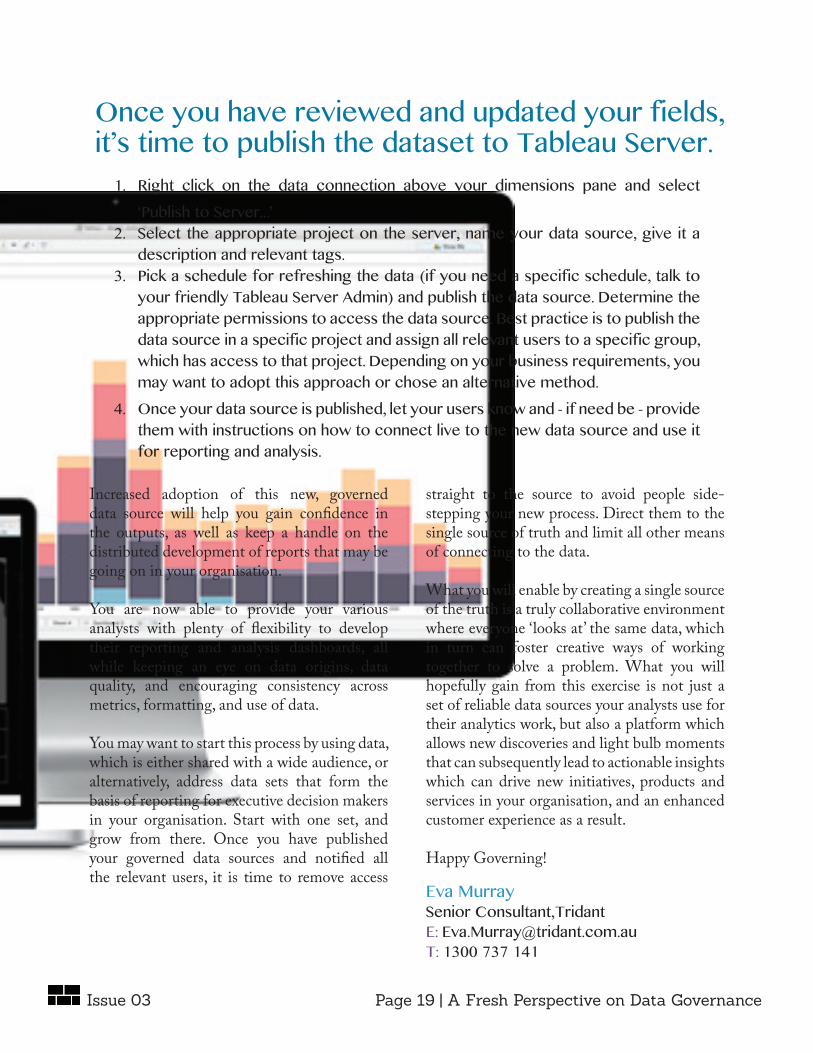
Increased adoption of this new, governed data source will help you gain confidence in the outputs, as well as keep a handle on the distributed development of reports that may be going on in your organisation. You are now able to provide your various analysts with plenty of flexibility to develop their reporting and analysis dashboards, all while keeping an eye on data origins, data quality, and encouraging consistency across metrics, formatting, and use of data. You may want to start this process by using data, which is either shared with a wide audience, or alternatively, address data sets that form the basis of reporting for executive decision makers in your organisation. Start with one set, and grow from there. Once you have published your governed data sources and notified all the relevant users, it is time to remove access
straight to the source to avoid people side-stepping your new process. Direct them to the single source of truth and limit all other means of connecting to the data. What you will enable by creating a single source of the truth is a truly collaborative environment where everyone ‘looks at’ the same data, which in turn can foster creative ways of working together to solve a problem. What you will hopefully gain from this exercise is not just a set of reliable data sources your analysts use for their analytics work, but also a platform which allows new discoveries and light bulb moments that can subsequently lead to actionable insights which can drive new initiatives, products and services in your organisation, and an enhanced customer experience as a result. Happy Governing!
1. Right click on the data connection above your dimensions pane and select
‘Publish to Server...’2. Select the appropriate project on the server, name your data source, give it a
description and relevant tags.3. Pick a schedule for refreshing the data (if you need a specific schedule, talk to
your friendly Tableau Server Admin) and publish the data source. Determine the appropriate permissions to access the data source. Best practice is to publish the data source in a specific project and assign all relevant users to a specific group, which has access to that project. Depending on your business requirements, you may want to adopt this approach or chose an alternative method.
4. Once your data source is published, let your users know and - if need be - provide them with instructions on how to connect live to the new data source and use it for reporting and analysis.
Once you have reviewed and updated your fields, it’s time to publish the dataset to Tableau Server.
Eva MurraySenior Consultant,TridantE: [email protected]: 1300 737 141
Page 19 | A Fresh Perspective on Data GovernanceIssue 03
Getting Started With
IBM dashDB
By Kanul Wadhwa
There is no doubt that cloud database needs are growing and becoming essential requirements for today’s businesses, and as they continue to grow, corporations like IBM are increasing their
cloud service footprints to ensure that their clients have reliable cloud services.
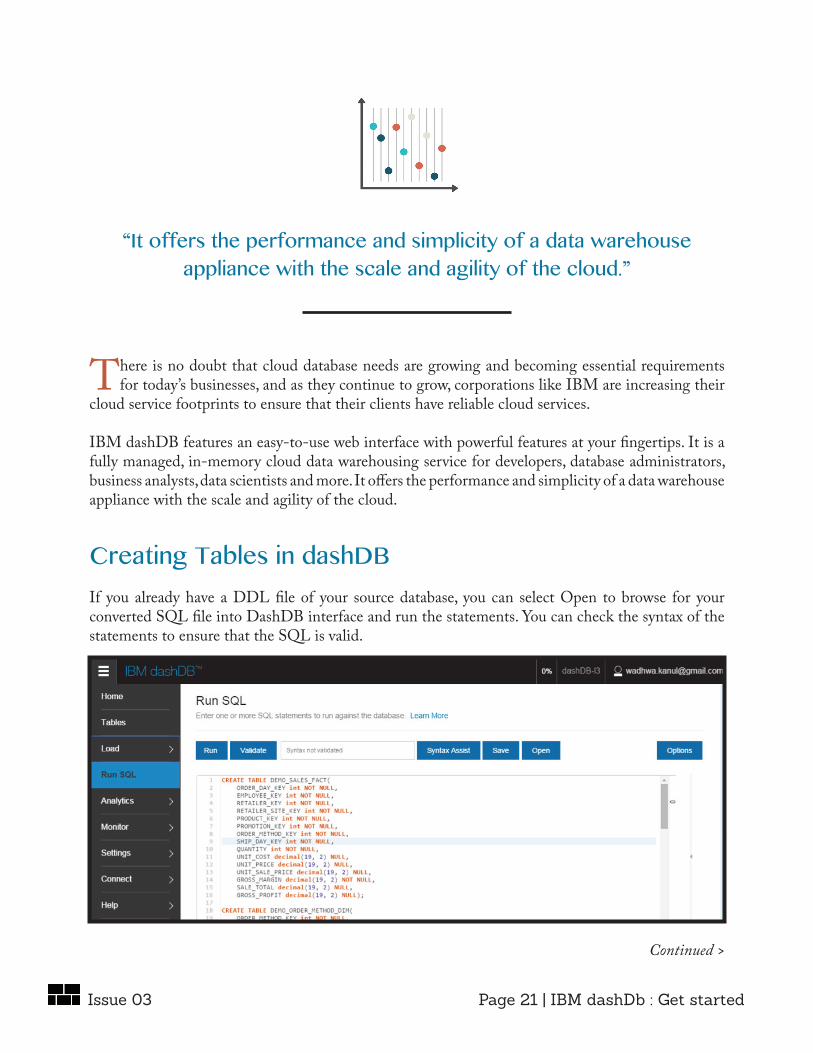
IBM dashDB features an easy-to-use web interface with powerful features at your fingertips. It is a fully managed, in-memory cloud data warehousing service for developers, database administrators, business analysts, data scientists and more. It offers the performance and simplicity of a data warehouse appliance with the scale and agility of the cloud.
“It offers the performance and simplicity of a data warehouse appliance with the scale and agility of the cloud.”
Creating Tables in dashDBIf you already have a DDL file of your source database, you can select Open to browse for your converted SQL file into DashDB interface and run the statements. You can check the syntax of the statements to ensure that the SQL is valid.
Continued >
Page 21 | IBM dashDb : Get started Issue 03
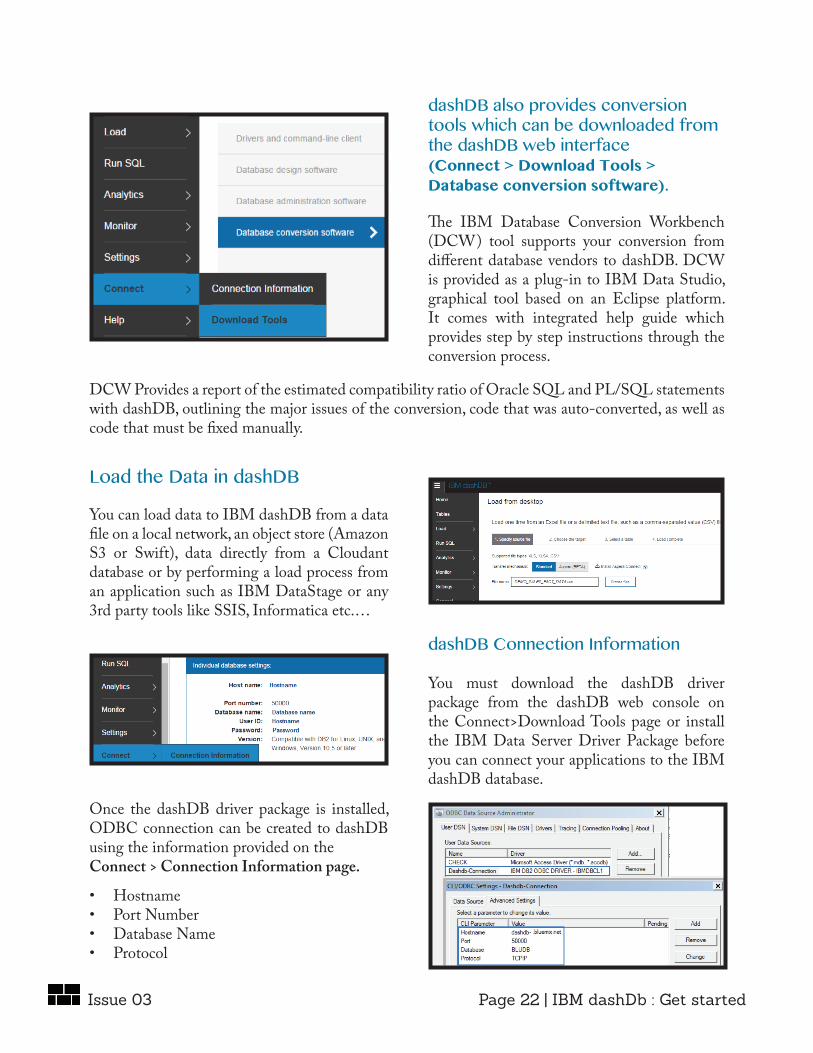
The IBM Database Conversion Workbench (DCW) tool supports your conversion from different database vendors to dashDB. DCW is provided as a plug-in to IBM Data Studio, graphical tool based on an Eclipse platform. It comes with integrated help guide which provides step by step instructions through the conversion process.
dashDB also provides conversion tools which can be downloaded from the dashDB web interface (Connect > Download Tools > Database conversion software).
Load the Data in dashDB
You can load data to IBM dashDB from a data file on a local network, an object store (Amazon S3 or Swift), data directly from a Cloudant database or by performing a load process from an application such as IBM DataStage or any 3rd party tools like SSIS, Informatica etc.…
DCW Provides a report of the estimated compatibility ratio of Oracle SQL and PL/SQL statements with dashDB, outlining the major issues of the conversion, code that was auto-converted, as well as code that must be fixed manually.
dashDB Connection Information
You must download the dashDB driver package from the dashDB web console on the Connect>Download Tools page or install the IBM Data Server Driver Package before you can connect your applications to the IBM dashDB database.
Once the dashDB driver package is installed, ODBC connection can be created to dashDB using the information provided on the Connect > Connection Information page.
• Hostname• Port Number• Database Name• Protocol
Page 22 | IBM dashDb : Get started Issue 03

On-Premises ETL Tools to load data to and from dashDB
More and more companies are moving their data in the cloud but still rely heavily on existing on-premise ETL investment while seeking low cost solution to integrate data in the cloud.
On-Premises IBM DataStage ETL Tool
You can use IBM InfoSphere DataStage server to load data to IBM dashDB. From the DataStage and Quality Stage Designer (DataStage Designer), create a connection to the dashDB database, BLUDB.
Use the DataStage Designer to define and run a parallel job that loads data from your source database to the BLUDB database. After you create a job to load data, you can compile the job and then run the load process.
On-Premises 3rd Party ETL Tools
dashDB is compatible with a wide range of third-party Extract Transformation Load tools. You can connect to dashDB via the ODBC or OLEDB connection.
Load data to dashDB using SSIS is almost identical to the task of pushing data from one source to another. Create a connection (OLEDB or ODBC) for a source and then create a destination connection using the same guidelines. In the example below, I created OLEDB connection to on-Premises SQL server and ODBC connection to dashDB.
It is important to prepare the data in certain format before consumption by users. On-Premises ETL transformations could be used to manipulate and transform data before loading into cloud.
The SSIS package above uses a Data conversion task, Lookup task and Derived column task in its Data Flow to transform the data before loading it to the dashDB cloud.
Kanul WadhwaSenior Consultant,Tridant
E: [email protected]: 1300 737 141
To learn more about dashDB, contact Tridant. or read our blog “6 Key Benefits of IBM dashDB” for further information.
Page 23 | IBM dashDb : Get started Issue 03
Saharan Africa2. It continues to produce even when the price of gold is low.
Now let’s draw a parallel between data and gold. In our long gone era we knew what the high-value data was, things like financial metrics, operational statistics, customer satisfaction, etc. We could easily extract this data and stage it in traditional data warehouses. Costly, but valuable, it provides organisations an insight into what has happened in our business.
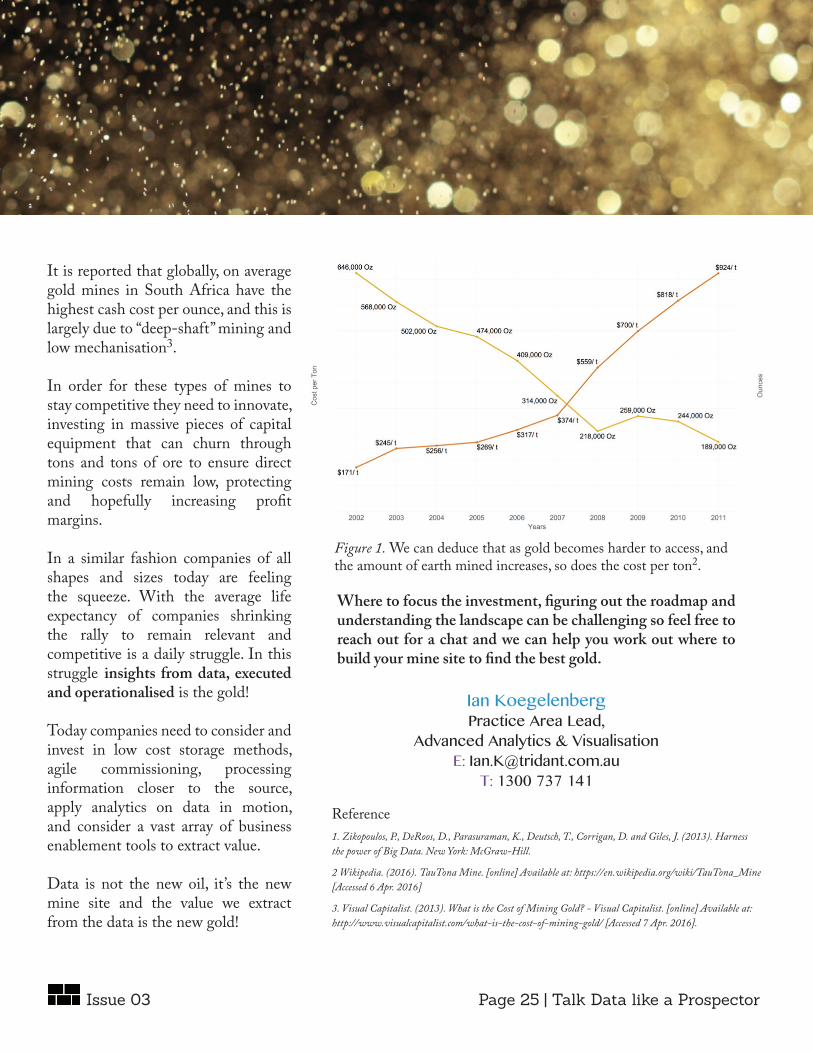
I am sure we have all heard the alarming statistics of how the volume of data being generated is increasing at an exponential rate, along with varying varieties, velocity and veracity. (Better known as Big Data). So let’s think of this data deluge as the amount of earth with no visible gold in it that has to be moved before we can get to mining the good stuff. In mining terms, this is called overburden. From figure 1, we can see the indirectly proportionate relationship between the US $ Cash Cost to mine one ton of ore at TauTona versus the Ounces of gold extracted tracked from 2002 - 2011.
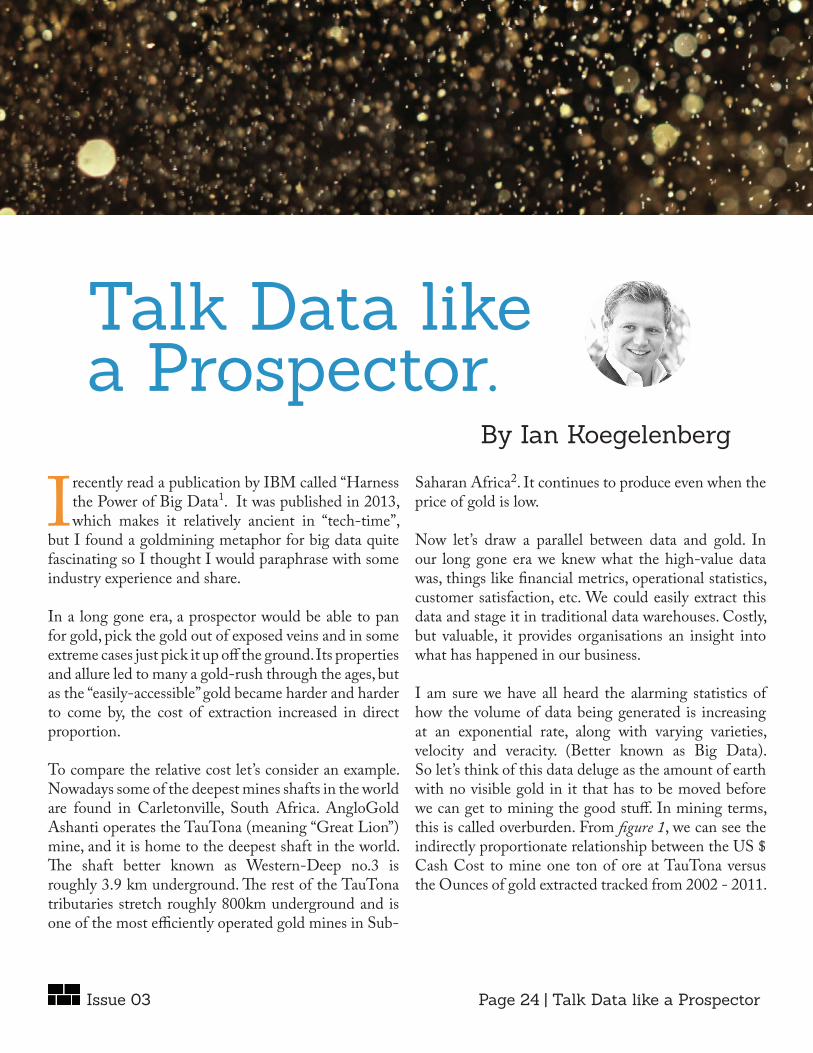
Talk Data likea Prospector.
By Ian Koegelenberg
Page 24 | Talk Data like a ProspectorIssue 03
I recently read a publication by IBM called “Harness the Power of Big Data1. It was published in 2013, which makes it relatively ancient in “tech-time”,
but I found a goldmining metaphor for big data quite fascinating so I thought I would paraphrase with some industry experience and share.
In a long gone era, a prospector would be able to pan for gold, pick the gold out of exposed veins and in some extreme cases just pick it up off the ground. Its properties and allure led to many a gold-rush through the ages, but as the “easily-accessible” gold became harder and harder to come by, the cost of extraction increased in direct proportion.
To compare the relative cost let’s consider an example. Nowadays some of the deepest mines shafts in the world are found in Carletonville, South Africa. AngloGold Ashanti operates the TauTona (meaning “Great Lion”) mine, and it is home to the deepest shaft in the world. The shaft better known as Western-Deep no.3 is roughly 3.9 km underground. The rest of the TauTona tributaries stretch roughly 800km underground and is one of the most efficiently operated gold mines in Sub-
Ian KoegelenbergPractice Area Lead,
Advanced Analytics & VisualisationE: [email protected]
T: 1300 737 141
Page 25 | Talk Data like a ProspectorIssue 03
It is reported that globally, on average gold mines in South Africa have the highest cash cost per ounce, and this is largely due to “deep-shaft” mining and low mechanisation3.
In order for these types of mines to stay competitive they need to innovate, investing in massive pieces of capital equipment that can churn through tons and tons of ore to ensure direct mining costs remain low, protecting and hopefully increasing profit margins.
In a similar fashion companies of all shapes and sizes today are feeling the squeeze. With the average life expectancy of companies shrinking the rally to remain relevant and competitive is a daily struggle. In this struggle insights from data, executed and operationalised is the gold!
Today companies need to consider and invest in low cost storage methods, agile commissioning, processing information closer to the source, apply analytics on data in motion, and consider a vast array of business enablement tools to extract value.
Data is not the new oil, it’s the new mine site and the value we extract from the data is the new gold!
Where to focus the investment, figuring out the roadmap and understanding the landscape can be challenging so feel free to reach out for a chat and we can help you work out where to build your mine site to find the best gold.
Figure 1. We can deduce that as gold becomes harder to access, and the amount of earth mined increases, so does the cost per ton2.
Reference1. Zikopoulos, P., DeRoos, D., Parasuraman, K., Deutsch, T., Corrigan, D. and Giles, J. (2013). Harness the power of Big Data. New York: McGraw-Hill.
2 Wikipedia. (2016). TauTona Mine. [online] Available at: https://en.wikipedia.org/wiki/TauTona_Mine [Accessed 6 Apr. 2016]
3. Visual Capitalist. (2013). What is the Cost of Mining Gold? - Visual Capitalist. [online] Available at: http://www.visualcapitalist.com/what-is-the-cost-of-mining-gold/ [Accessed 7 Apr. 2016].

To remain competitive, organisations need
to make strategic enhancements to
deliver accurate and timely plans, budgets
and forecasts.
Predictive + FPM
predictivefpm.com
Unfortunately, pure guesswork and sticking to the norm will just not cut it anymore. This is where advanced analytics can help improve the traditional financial performance management process.
View the Infographic >

The 2016
Australian Higher Education SummitLeadership, Technology and Research Futures across the Asia-Pacific Region.
Summary
The 2016 Australia and APAC Higher Education Summit will provide an unparalleled opportunity for representatives from all Asia-Pacific higher education institutions to gather together and explore the future of best practice across key facets of the higher education sector. During the two-day event, three key themes will form the basis for rich content and debate around current and future approaches to leadership, technology and research practices within the sector.
Location: Melbourne Park Function Centre
Batman Avenue, Melbourne VIC 3000
Date: July 14-15, 2016
Time: 8:30am – 5:00pm
Tridant Speaker: Julie Morrison
Manager, Corporate Reporting & Finance
University of Tasmania
July 15, 11:15am-11:30am
Register Here
2016 7th CFO Innovation Asia ForumThriving Amid Uncertainty & The Digital RevolutionWith the growth rate widely expected to slow down, what strategic financial planning and business transformation CFOs need to prepare to thrive in today’s challenging market?
The 7th CFO Innovation Asia Forum is back to Singapore. It will focus on the recent developments, opportunities and risks that finance function in Asia face given today’s global and regional bleak economic conditions in a world that is increasingly driven by disruptive digital technologies.
Date:Date: May 25 & 26
Time: 8:30am-5:30pm
Venue:
Swissotel, The Stamford, Singapore
See website for costs.
Register Here
Page 27 | EventsIssue 03

Melbourne (Head Office)Level 3, 1180 Toorak RdCamberwell VIC 3124T 1300 737 141
SydneyLevel 4, 50 Clarence StSydney NSW 2000T 1300 737 141
AdelaideLevel 2, 70 Hindmarsh SqAdelaide SA 5000T 1300 737 141
PerthLevel 3, 1060 Hay Street,West Perth WA 6005T 1300 737 141
CanberraLevel 1, The Realm,18 National Circuit,Barton ACT 2600T 1300 737 141
BrisbaneLevel 19, 10 Eagle St.Brisbane QLD 4000T 1300 737 141
HobartLevel 6, Reserve Bank Building,111 Macquarie Street,Hobart TAS 7000T 1300 737 141
Singapore16 Collyer Quay, Level 18,Singapore 049318T +65 681 89262
www.tridant.com.auE: [email protected] 737 141
Subscribe toThe Dashboard
The Dashboard | Issue 03 - April 2016Designed and Produced by Dilan GunawardanaCopyright 2016 Tridant | About Tridant
Contact Us