uk local growth dashboard · 2017-03-28 · the uk local growth dashboard has been developed by the...
TRANSCRIPT

March 2017
UK Local Growth
Dashboard

IntroductionThe UK Local Growth Dashboard has been developed by the
Enterprise Research Centre (ERC) and builds on the LEP
Growth Dashboard first launched in June 2014. Its purpose is to
present a set of growth metrics for start-ups and existing firms
across a range of sub-national geographies in the UK (NUTS 2)
with a specific focus on each of the 39 English Local Enterprise
Partnership (LEP) areas. Alongside these metrics it provides
some other contextual data for each LEP including the changing
sectoral composition of local economies over time.
The Local Growth Dashboard can be used as a source of
evidence to inform discussions on priorities in business support
concerning small business growth and includes easily understood
metrics which can be readily updated on an annual basis. This
report is designed to simply present the data for others to use and
it is not the intention here to investigate the reasons for these
variations as that can be found elsewhere in the research outputs
of the ERC and the wider research and policy literature.
The growth metrics which are used in the Dashboard are :
• 3-year survival rates of start-ups (2013-16)
• Proportion of 2013 start-ups that reach £1m T/O (2013-16)
• Proportion of £1-2m T/O businesses born before 2013 which
grow to £3m T/O (2013-16)
• High-Growth Firm (OECD Definition) Incidence Rate (2013-16)
• Small High-Growth Incidence Rate (2013-16) – a new metric
this year adopting a methodology advocated to avoid the
exclusion of firms with less than 10 employees from the OECD
definition.
The metrics on HGFs and SHGFs are currently only available for
the English LEPs but the data for the rest of the UK will be
processed and added to the accompanying dataset by the end of
April 2017.
Data Sources
The dataset used in the production of the growth and start-up
data is the Business Structure Database (BSD). This is a dataset
produced by the Office of National Statistics (ONS) and is an
annual snapshot of the Inter-Departmental Business Register
(IDBR) which is a live register of data collected by HM Revenue
and Customs via VAT and Pay as You Earn (PAYE) records . The
IDBR data are complemented with data from ONS business
surveys. If a business is liable for VAT (turnover exceeds the VAT
threshold) and/or has at least one member of staff registered for
the PAYE tax collection system, then the business will appear on
the IDBR (and hence in the BSD). We use the firm-level BSD for
firm growth rates, start-ups, and T/O calculations and the site-level
BSD for the calculation of new and gross new jobs. All the data
contained in this report can be downloaded from the Data Hub on
the ERC website www.enterprsieresearch.ac.uk/
The structure of this report is as follows:
• A summary of the growth metrics for sub-regions across the
UK and the individual LEP areas in England
• Individual set of enterprise and growth metrics for the English
LEPs
Growth Metrics The number of start-ups in an economy is often seen as the
headline metric of ‘enterprise’ and ‘entrepreneurial ability’. Start-
ups have been rising steadily in recent years but this trend does
display some spatial variation across the UK (Figure 1). The South
East, and especially London, has the largest rate of start-ups and
there are generally smaller numbers of start-ups as we move
north and west. However, there are some notable exceptions in
England as West of England (Bristol) and the three northern city-
regions of Manchester, Leeds and Liverpool also exhibit high rates
of start-up on a par with the South East. Generally, start-up rates
in Northern Ireland and Wales are much lower than elsewhere and
in Scotland there is a great variation between higher rates in
Aberdeen and Edinburgh and some of the lowest rates in
Dumfries and Galloway.
Figure 1: Start-ups per 10,000 Population in the UK (2016):
Quartiles
1 Since October 2016 there are now 38 LEPs in England as Northamptonshire and South East
Midlands LEPs merged. However, this edition of the Local Growth Dashboard contains data for the
original 39 LEPs. Data for the merged LEP will be released via the ERC website by the end of April
2017.
2 Metric Definitions:Start-up is defined as a UK-owned employer firm born in 2016; Start-ups
growing to £1m turnover refer to UK-owned firms born in 2013 whose turnover reached at least £1m
in 2016; Firms growing to £3m turnover refer to UK-owned firms born prior to 2013 that survived to
2016, whose turnover grew from £1-2m in 2013 to at least £3m in 2016; High-Growth is defined by
the OECD as annualised average growth in employment of 20% or more over a three year period
(2012-15) and restricted to a business having at least 10 employees in 2013.
3 Note: However, the US Bureau of Labor Statistics (BLS) has argued that the OECD measure was
too narrow and were concerned with the exclusion of firms with less than ten employees in the first
year of the three year growth period. The BLS alternative measure extended the definition of a high-
growth firm to include firms with less than ten employees if the firm added eight or more employees
during the three year growth period. Here we refer to these as Small High Growth Firms (SHGFs).
The ‘eight or more’ figure in the BLS definition was arrived at by multiplying the lower threshold of the
OECD measure, ten employees, by the compound growth ratio, 1.728: if a firm with less than 10
employees added eight jobs, it would have contributed about the same amount to job creation as
would a firm with ten jobs which grew by a factor of 1.728 and therefore satisfied the OECD criterion
[Clayton, Sadeghi, Spletzer and Talan, “High-employment-growth firms: defining and counting them”,
aggregates.Monthly Labor Review, June 2013].
Source: ONS Business Structure Database (BSD)

Figure 2: Proportion of Start-ups Generating £1m
Revenues after 3 Years in the UK (2016): Quartiles
4 Note: The use of this data does not imply the endorsement of the data owner or the UK Data
Service at the UK Data Archive in relation to the interpretation or analysis of the data. This work
uses research datasets which may not exactly reproduce National Statistics aggregates.
Immediately, we can see that the dominance of the South
East is less evident with ‘hot spots’ in all parts of the UK. Of
note are those local economies with relatively low levels of
start-up activity that have the highest proportions of their
start-ups achieving at least £1m in revenues after three
years. This is consistent with the pattern observed in
previous years.
For example, Northern Ireland has the highest proportion of
start-ups reaching at least £1m in revenues within 3 years, a
much higher level than in Scotland and Wales and many of
the local areas in England. In particular, Belfast, West and
South NI (the border region) and North NI have the highest
rates of any local area in the UK.
In England there are 11 local areas (i.e., LEPs) with above
average rates of start-ups showing early signs of scaling.
London tops the list in 2016 with the Black Country in second
place. Looking at the remaining LEPs with an above
average score on this metric there is a mix of urban and rural
LEPs which demonstrates that it is not all about cities in
terms of the survival and initial scaling of start-ups. For
example, while Greater Manchester has an above average
proportion of start-ups scaling, Greater Lincolnshire,
Lancashire, Cheshire and Warrington, Cornwall & Scilly Isles
are all areas which are above the average for England.
Source: ONS Business Structure Database (BSD)
Since 2013 the ERC research programme has emphasised
the importance of small business growth to the objective of
driving economic growth and re-balancing the UK economy.
So we now turn to a range of business growth metrics which
can provide a more fine-grained analysis of the local
business dynamic which can inform the development of local
and regional business support initiatives.
Growth of Start-ups – Initial Scaling
It is a matter of record that the UK has now a larger number
of start-ups than ever before, yet what is less well known is
the proportion, if they survive, that go on and generate at
least £1m in revenues after 3 years. Figure 2 shows that the
proportion of UK-owned start-ups that achieve this early
indication of ‘scale’ is very small indeed (2% nationally) but
that there is a great deal of variation between the Home
Nations and across local economic areas or LEPs in
England.

Source: ONS Business Structure Database (BSD)
5 High-Growth is defined as annualised average growth in employment of 20% or more over a three year period
(2012-15) and restricted to a business having at least 10 employees in 2012.
Growth of Existing Businesses -
Stepping Up
Across the UK we observe that around 7% of existing
firms with turnover of £1-2m per annum in 2013 grow
to at least £3m turnover in 2016 which is slightly
higher to that observed in 2014 and 2015 (i.e., 6%).
This metric of businesses scaling varies greatly
across the UK with the three Home Nations of
Scotland (except the North Eastern sub-region),
Wales and Northern Ireland (except the border
region) having lower proportions of these businesses
than most areas in England.
Within England there is a much more complex
pattern across the LEPs (Figure 3). Although Dorset
has the highest proportion of these businesses
(8.8%) and London the second highest this is not a
simple north-south pattern. Following these two
areas we find above average proportions of these
‘stepping up’ businesses in the North and the
Midlands: for example, Cheshire and Warrington,
Greater Manchester, Tees Valley, Derby,
Derbyshire, Nottingham and Nottinghamshire
(D2N2), Stoke-on-Trent & Staffordshire, Coventry
and Warwickshire and Northampton.
The only other local areas reporting above average
proportions of these businesses are along the M4
corridor – Thames Valley Berkshire, West of England
and Swindon and Wiltshire.
Figure 3: Firms (born<2012) turnover £1-2m in 2013 and reaching
£3m+ in 2016 in the UK: Quartiles

Source: ONS Business Structure Database (BSD) Source: ONS Business Structure Database (BSD)
Figure 4: High-Growth Firm Incidence Rate in England
(2013 -16): Quartiles
Source: ONS Business Structure Database (BSD)
High-Growth Firms
The number of high-growth firms (HGFs), as defined by the
OECD , in the UK declined in the 2013-16 period – the absolute
number fell from 11,855 (2012/15) to 10,865 (2013/16) which
means that the overall incidence rate is now 6.1% for the UK
compared to 7% in the previous period.
The incidence rate of high-growth firms in England varies from
4.7% in the Black Country to 8.0% in London (Figure 4). The
spatial pattern within this range is complex but the overall
message is one of higher rates of HGFs in many of the northern
and midlands local areas of England.
In England, outside London, the highest rates are in the North
West (Greater Manchester, Cheshire and Warrington, Leeds
City Region), West of England, Thames Valley Berkshire and
the two southern LEP areas of Coast to Capital and
EnterpriseM3.
In general, the Midlands is an area of average or below
average proportions of HGFs with the exception of South East
Midlands and Northampton and the Black Country has the
lowest rate in England.
The introduction of this new variation on the official OECD HGF
measure is an important innovation and provides a more
comprehensive overview of growth in local businesses. The
fact that it provides a rather different geography across the
English LEPs underlines the importance of resisting the
acceptance of a single metric for ‘high-growth’ firms.
Figure 5: Small High-Growth Firm Incidence Rate in
England (2013 -16) : Quartiles
Source: ONS Business Structure Database (BSD)
Small High-Growth Firms
There has been growing criticism of the OECD HGF measure in
recent years and in the US the Bureau of Labor Statistics (BLS)
argued that the OECD measure was too narrow and excluded
firms with less than ten employees in the first year of the three
year growth period. The BLS developed an alternative measure
which extended the definition of a high-growth firm to include
firms with less than ten employees if the firm added eight or
more employees during the three year growth period. Here we
adopt this measure for the first time and refer to these as Small
High Growth Firms (SHGFs).
Overall, the SHGF incidence rate is 1.7% for the 2013-16
period which is lower than in previous periods: 2.0% in 2012-15
and 2.4% in 2011-14. As with the HGF measure the SHGF
measure exhibits a complex geography and in general, stand in
contrast to that for the HGF measure (Figure 5). The only
common feature is that London dominates on both measures.
Beyond the capital, however, it is the more peripheral parts of
England together with the northern cities which have above
average proportions of SHGFs.
For example, the four city regions of Liverpool, Manchester,
Leeds and Sheffield all have above average shares of SHGFs.
The highest rates are in Cornwall and Isles of Scilly (2.4%)
followed by York, North Yorkshire and East Riding (2.1%) while
the Humber and the North East also have above average
incidence rates of SHGFs.

This overview of a range of business growth metrics has
underlined the fact that, irrespective of the measure
adopted, there are very few firms in the UK which can be
categorised as ‘high-growth’ or ‘scaling’. We also know that
this small group of firms, whether start-ups scaling or more
established businesses growing rapidly for the first or
second time, have had a disproportionate impact on job
creation. They are crucial to the growth of the UK economy
and the re-balancing of the economy away from London and
the South East.
The maps show a complex LEP geography of ‘scaling’ which
challenges some of the preconceptions about the ‘hotspots’
of business growth across England. There is evidence of
strong business growth underpinning the development of the
Northern Powerhouse but there are some faulty valves in the
Midlands Engine which need urgent attention.
A single-minded preoccupation with HGFs and indeed
SHGFs may not be a sensible focus for policy-makers. Not
only are these measures somewhat artificially defined, they
also have the disadvantage of rendering invisible the reality
of growth for the majority of businesses. As we have argued
on many previous occasions it would be more informative to
concentrate on the importance of creating a growth pipeline
at local level and monitoring its development over time.
Tracking cohorts of start-ups over time, and other groups of
established firms as they begin to engage in a range of
activity which prepares them for future growth, would be a
more meaningful focus for business support policy and
demands richer data.
To support this the ERC research team have undertaken
some recent analysis on three cohorts of ‘high-performing
firms’ over the period 1998-2013 . What it shows quite
clearly is that of these three groups HGFs, as defined by the
OCED, do not create the most jobs, in fact they grow more
slowly and have a lower survival rate than the comparators.
Notably, though, most of the observed growth in all three
groups takes place within the first five years after start-up.
This focus on annual patterns of high-growth is an on-going
agenda for the ERC research team in our discussions with
the owners of business-related data in the UK. In particular,
we are turning our attention to the geography of ‘high-
growth’ episodes over the life of a business and this will be
disseminated later in 2017.
Conclusion
1 Anyadike-Danes, M and Hart, M (2017) “High Performing Firms and Job Creation: a longitudinal analysis (1998-2013)”, ERC Insight Paper, March 2017.

7
High Growth Firm (OECD definition) Incidence Rate 2010/13 – 2013/16 (%)
GROWTH
Growth Hub Website:
www.bcgrowthhub.com
Population: 1,166,400
Private Sector Firms: 31,637
Private Sector Jobs: 297,296
Sectoral Composition: View here: sectoral composition
• 3,940 new registered businesses in 2016
• 34 start-ups per 10,000 population in 2016
• 52% of 2013 start-ups survived to 2016
• 2.5% of surviving 2013 start-ups grew from <500k to £1m + T/O by 2016
• 4.7% high-growth firm (OECD definition) incidence rate (2013-2016)
• 1.5% small high-growth firm (Clayton variation to OECD definition) incidence rate (2013-2016) – 1.7% for England
• 5.5% of £1-2m T/O businesses in 2013 grew to a minimum of £3m by 2016
START-UPS
CONTEXT 2016
Black Country
2.5
2.0
0.0
0.5
1.0
1.5
2.0
2.5
3.0
BCLEP England
0.0
2.0
4.0
6.0
8.0
10.0
2010/13 2011/14 2012/15 2013/16
BCLEP UK
Scaling Survivors £1-2m to £3m+ in 3 years 2013-16 (%)
Start-ups Scaling <£500k to £1m + in 3 years 2013-16 (%)
5.5
6.8
0.0
1.0
2.0
3.0
4.0
5.0
6.0
7.0
8.0
9.0
10.0
BCLEP England

8
High Growth Firm (OECD definition) Incidence Rate 2010/13 – 2013/16 (%)
Growth Hub Website:
www.bbf.uk.com
Population: 528,400
Private Sector Firms: 27,532
Private Sector Jobs: 211,599
Sectoral Composition: View here: sectoral composition
CONTEXT 2016
Buckinghamshire
1.82.0
0.0
0.5
1.0
1.5
2.0
2.5
3.0
BLEP England
4.6
6.8
0.0
1.0
2.0
3.0
4.0
5.0
6.0
7.0
8.0
9.0
10.0
BLEP England
0.0
2.0
4.0
6.0
8.0
10.0
2010/13 2011/14 2012/15 2013/16
BLEP UK
GROWTH
• 3,017 new registered businesses in 2016
• 57 start-ups per 10,000 population in 2016
• 56% of 2013 start-ups survived to 2016
• 1.8% of surviving 2013 start-ups grew from <500k to £1m + T/O by 2016
• 6.5% high-growth firm (OECD definition) incidence rate (2013-2016)
• 1.5% small high-growth firm (Clayton variation to OECD definition) incidence rate (2013-2016) – 1.7% for England
• 4.6% of £1-2m T/O businesses in 2013 grew to a minimum of £3m by 2016
START-UPS
Scaling Survivors £1-2m to £3m+ in 3 years 2013-16 (%)
Start-ups Scaling <£500k to £1m + in 3 years 2013-16 (%)

9
High Growth Firm (OECD definition) Incidence Rate 2010/13 – 2013/16 (%)
Growth Hub Website:
www.candwgrowthhub.co.uk
Population: 917,000
Private Sector Firms: 41,091
Private Sector Jobs: 324,322
Sectoral Composition: View here: sectoral composition
• 4,357 new registered businesses in 2016
• 48 start-ups per 10,000 population in 2016
• 55% of 2013 start-ups survived to 2016
• 2.1% of surviving 2013 start-ups grew from <500k to £1m + T/O by 2016
• 7.2% high-growth firm (OECD definition) incidence rate (2013-2016)
• 1.4% small high-growth firm (Clayton variation to OECD definition) incidence rate (2013-2016) – 1.7% for England
• 8.4% of £1-2m T/O businesses in 2013 grew to a minimum of £3m by 2016
CONTEXT 2016
Cheshire
and Warrington
2.12.0
0.0
0.5
1.0
1.5
2.0
2.5
3.0
CHWARLEP England
8.4
6.8
0.0
1.0
2.0
3.0
4.0
5.0
6.0
7.0
8.0
9.0
10.0
CHWARLEP England
0.0
2.0
4.0
6.0
8.0
10.0
2010/13 2011/14 2012/15 2013/16
CHWARLEP UK
GROWTH
START-UPS
Scaling Survivors £1-2m to £3m+ in 3 years 2013-16 (%)
Start-ups Scaling <£500k to £1m + in 3 years 2013-16 (%)

10
High Growth Firm (OECD definition) Incidence Rate 2010/13 – 2013/16 (%)
Growth Hub Website:
www.c2cbusiness.org.uk
Population: 1,996,400
Private Sector Firms: 82,972
Private Sector Jobs: 659,696
Sectoral Composition: View here: sectoral composition
• 10,041 new registered businesses in 2016
• 50 start-ups per 10,000 population in 2016
• 56% of 2013 start-ups survived to 2016
• 1.8% of surviving 2013 start-ups grew from <500k to £1m + T/O by 2016
• 6.6% high-growth firm (OECD definition) incidence rate (2013-2016)
• 1.6% small high-growth firm (Clayton variation to OECD definition) incidence rate (2013-2016) – 1.7% for England
• 5.7% of £1-2m T/O businesses in 2013 grew to a minimum of £3m by 2016
CONTEXT 2016
Coast to Capital
1.82.0
0.0
0.5
1.0
1.5
2.0
2.5
3.0
CCLEP England
5.7
6.8
0.0
1.0
2.0
3.0
4.0
5.0
6.0
7.0
8.0
9.0
10.0
CCLEP England
0.0
2.0
4.0
6.0
8.0
10.0
2010/13 2011/14 2012/15 2013/16
CCLEP UK
GROWTH
START-UPS
Scaling Survivors £1-2m to £3m+ in 3 years 2013-16 (%)
Start-ups Scaling <£500k to £1m + in 3 years 2013-16 (%)

11
High Growth Firm (OECD definition) Incidence Rate 2010/13 – 2013/16 (%)
Growth Hub Website:
www.ciosgrowthhub.com
Population: 551,700
Private Sector Firms: 16,574
Private Sector Jobs: 110,689
Sectoral Composition: View here: sectoral composition
• 1,616 new registered businesses in 2016
• 29 start-ups per 10,000 population in 2016
• 59% of 2013 start-ups survived to 2016
• 2.0% of surviving 2013 start-ups grew from <500k to £1m + T/O by 2016
• 6.0% high-growth firm (OECD definition) incidence rate (2013-2016)
• 2.4% small high-growth firm (Clayton variation to OECD definition) incidence rate (2013-2016) – 1.7% for England
• 4.4% of £1-2m T/O businesses in 2013 grew to a minimum of £3m by 2016
CONTEXT 2016
Cornwall and
Isles of Scilly
2.0 2.0
0.0
0.5
1.0
1.5
2.0
2.5
3.0
CISLEP England
4.4
6.8
0.0
1.0
2.0
3.0
4.0
5.0
6.0
7.0
8.0
9.0
10.0
CISLEP England
0.0
2.0
4.0
6.0
8.0
10.0
2010/13 2011/14 2012/15 2013/16
CISLEP UK
GROWTH
START-UPS
Scaling Survivors £1-2m to £3m+ in 3 years 2013-16 (%)
Start-ups Scaling <£500k to £1m + in 3 years 2013-16 (%)

12
High Growth Firm (OECD definition) Incidence Rate 2010/13 – 2013/16 (%)
Growth Hub Website:
www.cwgrowthhub.co.uk
Population: 899,400
Private Sector Firms: 34,203
Private Sector Jobs: 309,871
Sectoral Composition: View here: sectoral composition
• 4,448 new registered businesses in 2016
• 49 start-ups per 10,000 population in 2016
• 57% of 2013 start-ups survived to 2016
• 1.4% of surviving 2013 start-ups grew from <500k to £1m + T/O by 2016
• 5.7% high-growth firm (OECD definition) incidence rate (2013-2016)
• 1.6% small high-growth firm (Clayton variation to OECD definition) incidence rate (2013-2016) – 1.7% for England
• 7.1% of £1-2m T/O businesses in 2013 grew to a minimum of £3m by 2016
CONTEXT 2016
Coventry
and Warwickshire
1.4
2.0
0.0
0.5
1.0
1.5
2.0
2.5
3.0
CW LEP England
7.1 6.8
0.0
1.0
2.0
3.0
4.0
5.0
6.0
7.0
8.0
9.0
10.0
CW LEP England
0.0
2.0
4.0
6.0
8.0
10.0
2010/13 2011/14 2012/15 2013/16
CW LEP UK
GROWTH
START-UPS
Scaling Survivors £1-2m to £3m+ in 3 years 2013-16 (%)
Start-ups Scaling <£500k to £1m + in 3 years 2013-16 (%)

13
High Growth Firm (OECD definition) Incidence Rate 2010/13 – 2013/16 (%)
Growth Hub Website:
www.cumbriagrowthhub.co.uk
Population: 498,000
Private Sector Firms: 17,417
Private Sector Jobs: 146,103
Sectoral Composition: View here: sectoral composition
• 1,516 new registered businesses in 2016
• 30 start-ups per 10,000 population in 2016
• 61% of 2013 start-ups survived to 2016
• *% of surviving 2013 start-ups grew from <500k to £1m + T/O by 2016
• 5.1% high-growth firm (OECD definition) incidence rate (2013-2016)
• 1.4% small high-growth firm (Clayton variation to OECD definition) incidence rate (2013-2016) – 1.7% for England
• 6.1% of £1-2m T/O businesses in 2013 grew to a minimum of £3m by 2016
CONTEXT 2016
Cumbria
0.0
2.0
0.0
0.5
1.0
1.5
2.0
2.5
3.0
CLEP England
6.16.8
0.0
1.0
2.0
3.0
4.0
5.0
6.0
7.0
8.0
9.0
10.0
CLEP England
0.0
2.0
4.0
6.0
8.0
10.0
2010/13 2011/14 2012/15 2013/16
CLEP UK
GROWTH
START-UPS
Scaling Survivors £1-2m to £3m+ in 3 years 2013-16 (%)
Start-ups Scaling <£500k to £1m + in 3 years 2013-16 (%)
*the number is suppressed becauseit is disclosive.
*the number is suppressed for CLEP because it is disclosive.
14
High Growth Firm (OECD definition) Incidence Rate 2010/13 – 2013/16 (%)
Growth Hub Website:
www.d2n2growthhub.co.uk
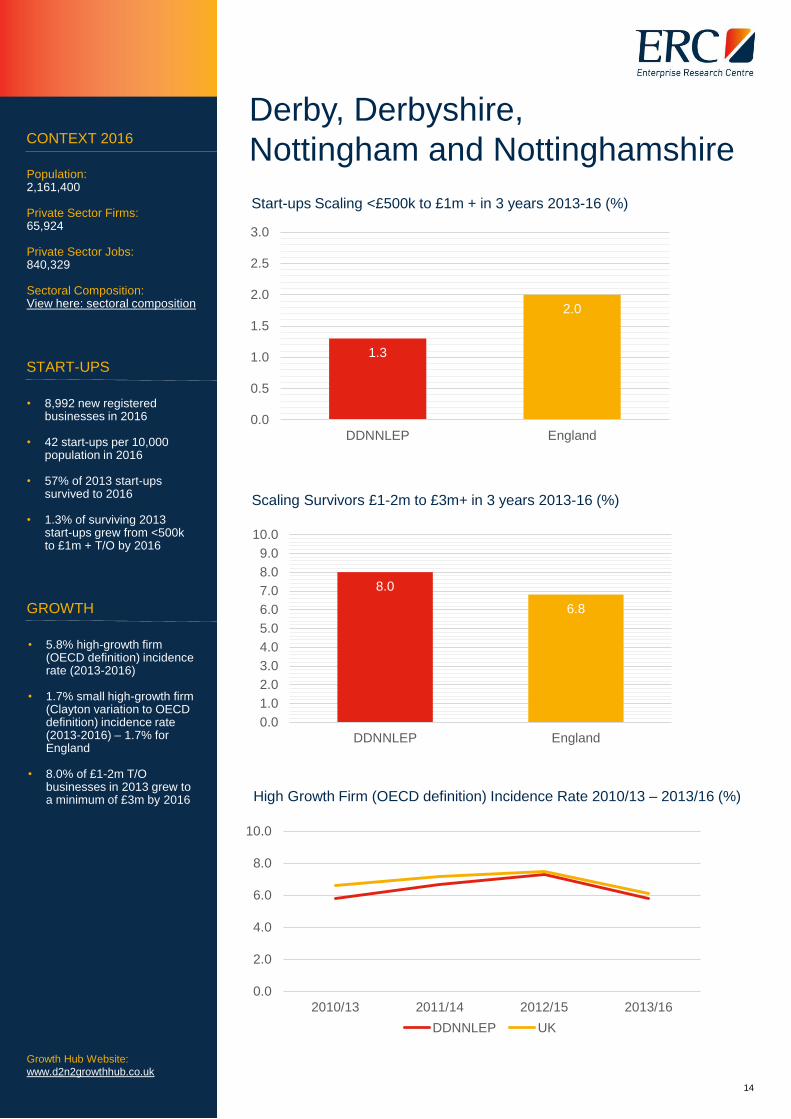
Population: 2,161,400
Private Sector Firms: 65,924
Private Sector Jobs: 840,329
Sectoral Composition: View here: sectoral composition
• 8,992 new registered businesses in 2016
• 42 start-ups per 10,000 population in 2016
• 57% of 2013 start-ups survived to 2016
• 1.3% of surviving 2013 start-ups grew from <500k to £1m + T/O by 2016
• 5.8% high-growth firm (OECD definition) incidence rate (2013-2016)
• 1.7% small high-growth firm (Clayton variation to OECD definition) incidence rate (2013-2016) – 1.7% for England
• 8.0% of £1-2m T/O businesses in 2013 grew to a minimum of £3m by 2016
CONTEXT 2016
Derby, Derbyshire,
Nottingham and Nottinghamshire
1.3
2.0
0.0
0.5
1.0
1.5
2.0
2.5
3.0
DDNNLEP England
8.0
6.8
0.0
1.0
2.0
3.0
4.0
5.0
6.0
7.0
8.0
9.0
10.0
DDNNLEP England
0.0
2.0
4.0
6.0
8.0
10.0
2010/13 2011/14 2012/15 2013/16
DDNNLEP UK
GROWTH
START-UPS
Scaling Survivors £1-2m to £3m+ in 3 years 2013-16 (%)
Start-ups Scaling <£500k to £1m + in 3 years 2013-16 (%)

15
High Growth Firm (OECD definition) Incidence Rate 2010/13 – 2013/16 (%)
Growth Hub Website:
www.dorsetgrowthhub.co.uk
Population: 765,700
Private Sector Firms: 27,621
Private Sector Jobs: 200,490
Sectoral Composition: View here: sectoral composition
• 2,992 new registered businesses in 2016
• 39 start-ups per 10,000 population in 2016
• 55% of 2013 start-ups survived to 2016
• 2.0% of surviving 2013 start-ups grew from <500k to £1m + T/O by 2016
• 5.8% high-growth firm (OECD definition) incidence rate (2013-2016)
• 1.6% small high-growth firm (Clayton variation to OECD definition) incidence rate (2013-2016) – 1.7% for England
• 8.8% of £1-2m T/O businesses in 2013 grew to a minimum of £3m by 2016
CONTEXT 2016
Dorset
2.0 2.0
0.0
0.5
1.0
1.5
2.0
2.5
3.0
DLEP England
8.8
6.8
0.0
1.0
2.0
3.0
4.0
5.0
6.0
7.0
8.0
9.0
10.0
DLEP England
0.0
2.0
4.0
6.0
8.0
10.0
2010/13 2011/14 2012/15 2013/16
DLEP UK
GROWTH
START-UPS
Scaling Survivors £1-2m to £3m+ in 3 years 2013-16 (%)
Start-ups Scaling <£500k to £1m + in 3 years 2013-16 (%)

16
High Growth Firm (OECD definition) Incidence Rate 2010/13 – 2013/16 (%)
Growth Hub Website:
www.enterprisem3growthhub.co.uk
Population: 1,675,200
Private Sector Firms: 80,609
Private Sector Jobs: 663,537
Sectoral Composition: View here: sectoral composition
• 8,904 new registered businesses in 2016
• 53 start-ups per 10,000 population in 2016
• 56% of 2013 start-ups survived to 2016
• 2.0% of surviving 2013 start-ups grew from <500k to £1m + T/O by 2016
• 7.4% high-growth firm (OECD definition) incidence rate (2013-2016)
• 1.6% small high-growth firm (Clayton variation to OECD definition) incidence rate (2013-2016) – 1.7% for England
• 6.8% of £1-2m T/O businesses in 2013 grew to a minimum of £3m by 2016
CONTEXT 2016
Enterprise M3
2.0 2.0
0.0
0.5
1.0
1.5
2.0
2.5
3.0
EM3LEP England
6.8 6.8
0.0
1.0
2.0
3.0
4.0
5.0
6.0
7.0
8.0
9.0
10.0
EM3LEP England
0.0
2.0
4.0
6.0
8.0
10.0
2010/13 2011/14 2012/15 2013/16
EM3LEP UK
GROWTH
START-UPS
Scaling Survivors £1-2m to £3m+ in 3 years 2013-16 (%)
Start-ups Scaling <£500k to £1m + in 3 years 2013-16 (%)
17
High Growth Firm (OECD definition) Incidence Rate 2010/13 – 2013/16 (%)
Growth Hub Website:
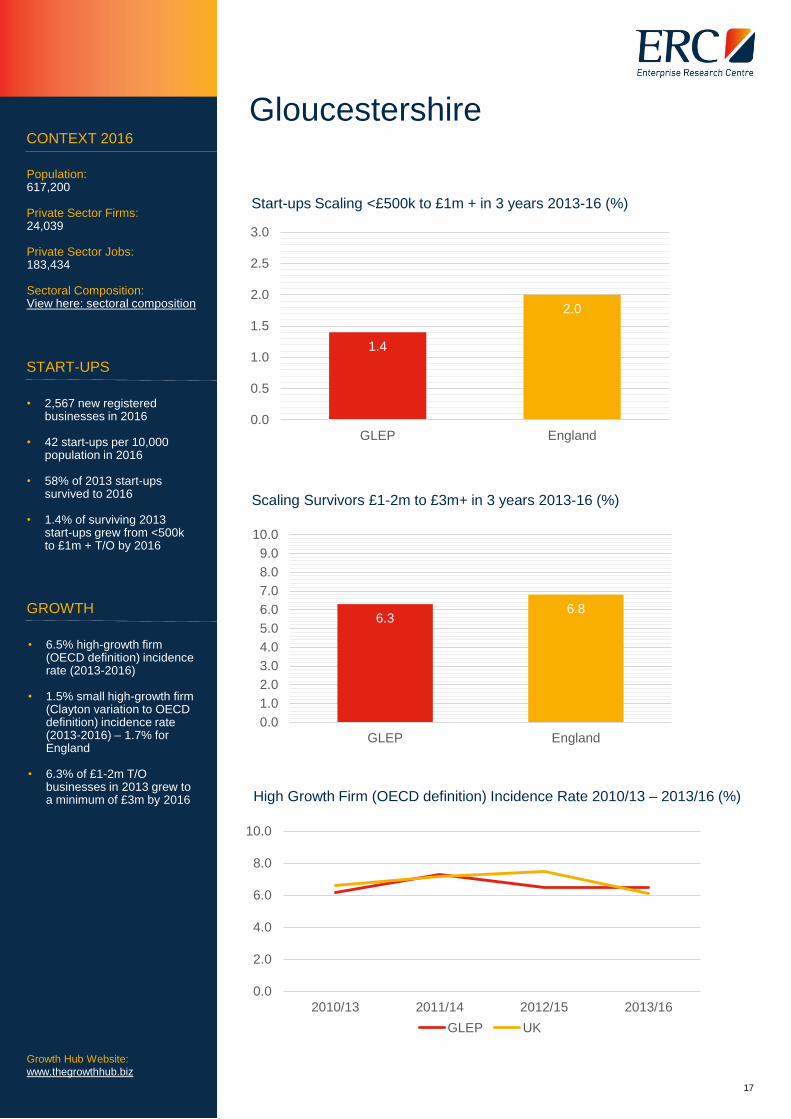
www.thegrowthhub.biz
Population: 617,200
Private Sector Firms: 24,039
Private Sector Jobs: 183,434
Sectoral Composition: View here: sectoral composition
• 2,567 new registered businesses in 2016
• 42 start-ups per 10,000 population in 2016
• 58% of 2013 start-ups survived to 2016
• 1.4% of surviving 2013 start-ups grew from <500k to £1m + T/O by 2016
• 6.5% high-growth firm (OECD definition) incidence rate (2013-2016)
• 1.5% small high-growth firm (Clayton variation to OECD definition) incidence rate (2013-2016) – 1.7% for England
• 6.3% of £1-2m T/O businesses in 2013 grew to a minimum of £3m by 2016
CONTEXT 2016
Gloucestershire
1.4
2.0
0.0
0.5
1.0
1.5
2.0
2.5
3.0
GLEP England
6.36.8
0.0
1.0
2.0
3.0
4.0
5.0
6.0
7.0
8.0
9.0
10.0
GLEP England
0.0
2.0
4.0
6.0
8.0
10.0
2010/13 2011/14 2012/15 2013/16
GLEP UK
GROWTH
START-UPS
Scaling Survivors £1-2m to £3m+ in 3 years 2013-16 (%)
Start-ups Scaling <£500k to £1m + in 3 years 2013-16 (%)

18
High Growth Firm (OECD definition) Incidence Rate 2010/13 – 2013/16 (%)
Growth Hub Website:
www.gbslepgrowthhub.co.uk
Population: 1,996,200
Private Sector Firms: 64,325
Private Sector Jobs: 672,818
Sectoral Composition: View here: sectoral composition
• 9,178 new registered businesses in 2016
• 46 start-ups per 10,000 population in 2016
• 52% of 2013 start-ups survived to 2016
• 1.8% of surviving 2013 start-ups grew from <500k to £1m + T/O by 2016
• 6.0% high-growth firm (OECD definition) incidence rate (2013-2016)
• 1.7% small high-growth firm (Clayton variation to OECD definition) incidence rate (2013-2016) – 1.7% for England
• 6.4% of £1-2m T/O businesses in 2013 grew to a minimum of £3m by 2016
CONTEXT 2016
Greater Birmingham
and Solihull
1.82.0
0.0
0.5
1.0
1.5
2.0
2.5
3.0
GBSLEP England
6.46.8
0.0
1.0
2.0
3.0
4.0
5.0
6.0
7.0
8.0
9.0
10.0
GBSLEP England
0.0
2.0
4.0
6.0
8.0
10.0
2010/13 2011/14 2012/15 2013/16
GBSLEP UK
GROWTH
START-UPS
Scaling Survivors £1-2m to £3m+ in 3 years 2013-16 (%)
Start-ups Scaling <£500k to £1m + in 3 years 2013-16 (%)

19
High Growth Firm (OECD definition) Incidence Rate 2010/13 – 2013/16 (%)
Growth Hub Website:
www.signpost2grow.co.uk
Population: 1,423,300
Private Sector Firms: 52,002
Private Sector Jobs: 408,861
Sectoral Composition: View here: sectoral composition
• 5,791 new registered businesses in 2016
• 41 start-ups per 10,000 population in 2016
• 56% of 2013 start-ups survived to 2016
• 1.7% of surviving 2013 start-ups grew from <500k to £1m + T/O by 2016
• 6.3% high-growth firm (OECD definition) incidence rate (2013-2016)
• 1.7% small high-growth firm (Clayton variation to OECD definition) incidence rate (2013-2016) – 1.7% for England
• 5.7% of £1-2m T/O businesses in 2012 grew to a minimum of £3m by 2015
CONTEXT 2016
Greater Cambridge
and Greater Peterborough
1.7
2.0
0.0
0.5
1.0
1.5
2.0
2.5
3.0
GCGPLEP England
5.7
6.8
0.0
1.0
2.0
3.0
4.0
5.0
6.0
7.0
8.0
9.0
10.0
GCGPLEP England
0.0
2.0
4.0
6.0
8.0
10.0
2010/13 2011/14 2012/15 2013/16
GCGPLEP UK
GROWTH
START-UPS
Scaling Survivors £1-2m to £3m+ in 3 years 2013-16 (%)
Start-ups Scaling <£500k to £1m + in 3 years 2013-16 (%)

20
High Growth Firm (OECD definition) Incidence Rate 2010/13 – 2013/16 (%)
Growth Hub Website:
www.businesslincolnshire.com
Population: 1,066,100
Private Sector Firms: 31,845
Private Sector Jobs: 220,465
Sectoral Composition: View here: sectoral composition
• 3,564 new registered businesses in 2016
• 33 start-ups per 10,000 population in 2016
• 52% of 2013 start-ups survived to 2016
• 2.2% of surviving 2013 start-ups grew from <500k to £1m + T/O by 2016
• 5.6% high-growth firm (OECD definition) incidence rate (2013-2016)
• 1.7% small high-growth firm (Clayton variation to OECD definition) incidence rate (2013-2016) – 1.7% for England
• 6.1% of £1-2m T/O businesses in 2013 grew to a minimum of £3m by 2016
CONTEXT 2016
Greater Lincolnshire
2.22.0
0.0
0.5
1.0
1.5
2.0
2.5
3.0
GLLEP England
6.16.8
0.0
1.0
2.0
3.0
4.0
5.0
6.0
7.0
8.0
9.0
10.0
GLLEP England
0.0
2.0
4.0
6.0
8.0
10.0
2010/13 2011/14 2012/15 2013/16
GLLEP UK
GROWTH
START-UPS
Scaling Survivors £1-2m to £3m+ in 3 years 2013-16 (%)
Start-ups Scaling <£500k to £1m + in 3 years 2013-16 (%)

21
High Growth Firm (OECD definition) Incidence Rate 2010/13 – 2013/16 (%)
Growth Hub Website:
www.businessgrowthhub.com
Population: 2,756,200
Private Sector Firms: 92,694
Private Sector Jobs: 874,195
Sectoral Composition: View here: sectoral composition
• 12,367 new registered businesses in 2016
• 45 start-ups per 10,000 population in 2016
• 51% of 2013 start-ups survived to 2016
• 2.1% of surviving 2013 start-ups grew from <500k to £1m + T/O by 2016
• 7.0% high-growth firm (OECD definition) incidence rate (2013-2016)
• 1.9% small high-growth firm (Clayton variation to OECD definition) incidence rate (2013-2016) – 1.7% for England
• 7.8% of £1-2m T/O businesses in 2013 grew to a minimum of £3m by 2016
CONTEXT 2016
Greater Manchester
2.12.0
0.0
0.5
1.0
1.5
2.0
2.5
3.0
GMLEP England
7.8
6.8
0.0
1.0
2.0
3.0
4.0
5.0
6.0
7.0
8.0
9.0
10.0
GMLEP England
0.0
2.0
4.0
6.0
8.0
10.0
2010/13 2011/14 2012/15 2013/16
GMLEP UK
GROWTH
START-UPS
Scaling Survivors £1-2m to £3m+ in 3 years 2013-16 (%)
Start-ups Scaling <£500k to £1m + in 3 years 2013-16 (%)

22
High Growth Firm (OECD definition) Incidence Rate 2010/13 – 2013/16 (%)
Growth Hub Website:
www.heartofswgrowthhub.co.uk
Population: 1,714,600
Private Sector Firms: 51,307
Private Sector Jobs: 380,120
Sectoral Composition: View here: sectoral composition
• 5,006 new registered businesses in 2016
• 29 start-ups per 10,000 population in 2016
• 56% of 2013 start-ups survived to 2016
• 1.3% of surviving 2013 start-ups grew from <500k to £1m + T/O by 2016
• 5.5% high-growth firm (OECD definition) incidence rate (2013-2016)
• 1.9% small high-growth firm (Clayton variation to OECD definition) incidence rate (2013-2016) – 1.7% for England
• 5.0% of £1-2m T/O businesses in 2013 grew to a minimum of £3m by 2016
CONTEXT 2016
Heart of the South West
1.3
2.0
0.0
0.5
1.0
1.5
2.0
2.5
3.0
HSWLEP England
5.0
6.8
0.0
2.0
4.0
6.0
8.0
10.0
HSWLEP England
0.0
2.0
4.0
6.0
8.0
10.0
2010/13 2011/14 2012/15 2013/16
HSWLEP UK
GROWTH
START-UPS
Scaling Survivors £1-2m to £3m+ in 3 years 2013-16 (%)
Start-ups Scaling <£500k to £1m + in 3 years 2013-16 (%)

23
High Growth Firm (OECD definition) Incidence Rate 2010/13 – 2013/16 (%)
Growth Hub Website:
www.hertsgrowthhub.com
Population: 1,166,300
Private Sector Firms: 53,953
Private Sector Jobs: 820,453
Sectoral Composition: View here: sectoral composition
• 4,381 new registered businesses in 2016
• 38 start-ups per 10,000 population in 2016
• 56% of 2013 start-ups survived to 2016
• 2.0% of surviving 2013 start-ups grew from <500k to £1m + T/O by 2016
• 6.5% high-growth firm (OECD definition) incidence rate (2013-2016)
• 1.5% small high-growth firm (Clayton variation to OECD definition) incidence rate (2013-2016) – 1.7% for England
• 7.8% of £1-2m T/O businesses in 2013 grew to a minimum of £3m by 2016
CONTEXT 2016
Hertfordshire
2.0 2.0
0.0
0.5
1.0
1.5
2.0
2.5
3.0
HERTLEP England
7.8
6.8
0.0
1.0
2.0
3.0
4.0
5.0
6.0
7.0
8.0
9.0
10.0
HERTLEP England
0.0
2.0
4.0
6.0
8.0
10.0
2010/13 2011/14 2012/15 2013/16
HERTLEP UK
GROWTH
START-UPS
Scaling Survivors £1-2m to £3m+ in 3 years 2013-16 (%)
Start-ups Scaling <£500k to £1m + in 3 years 2013-16 (%)

24
High Growth Firm (OECD definition) Incidence Rate 2010/13 – 2013/16 (%)
Growth Hub Website:
www.hub.humberlep.org
Population: 925,100
Private Sector Firms: 26,007
Private Sector Jobs: 205,224
Sectoral Composition: View here: sectoral composition
• 2,703 new registered businesses in 2016
• 29 start-ups per 10,000 population in 2016
• 54% of 2013 start-ups survived to 2016
• 1.9% of surviving 2013 start-ups grew from <500k to £1m + T/O by 2016
• 5.7% high-growth firm (OECD definition) incidence rate (2013-2016)
• 1.9% small high-growth firm (Clayton variation to OECD definition) incidence rate (2013-2016) – 1.7% for England
• 5.2% of £1-2m T/O businesses in 2013 grew to a minimum of £3m by 2016
CONTEXT 2016
Humber
1.92.0
0.0
0.5
1.0
1.5
2.0
2.5
3.0
HUMLEP England
5.2
6.8
0.0
1.0
2.0
3.0
4.0
5.0
6.0
7.0
8.0
9.0
10.0
HUMLEP England
0.0
2.0
4.0
6.0
8.0
10.0
2010/13 2011/14 2012/15 2012/16
HUMLEP UK
GROWTH
START-UPS
Scaling Survivors £1-2m to £3m+ in 3 years 2013-16 (%)
Start-ups Scaling <£500k to £1m + in 3 years 2013-16 (%)

25
High Growth Firm (OECD definition) Incidence Rate 2010/13 – 2013/16 (%)
Growth Hub Website:
www.boostbusinesslancashire.co.uk
Population: 1,478,100
Private Sector Firms: 46,181
Private Sector Jobs: 413,720
Sectoral Composition: View here: sectoral composition
• 4,961 new registered businesses in 2016
• 34 start-ups per 10,000 population in 2016
• 54% of 2013 start-ups survived to 2016
• 2.3% of surviving 2013 start-ups grew from <500k to £1m + T/O by 2016
• 6.4% high-growth firm (OECD definition) incidence rate (2013-2016)
• 1.7% small high-growth firm (Clayton variation to OECD definition) incidence rate (2013-2016) – 1.7% for England
• 5.5% of £1-2m T/O businesses in 2013 grew to a minimum of £3m by 2016
CONTEXT 2016
Lancashire
2.3
2.0
0.0
0.5
1.0
1.5
2.0
2.5
3.0
LNCLEP England
5.5
6.8
0.0
1.0
2.0
3.0
4.0
5.0
6.0
7.0
8.0
9.0
10.0
LNCLEP England
0.0
2.0
4.0
6.0
8.0
10.0
2010/13 2011/14 2012/15 2013/16
LNCLEP UK
GROWTH
START-UPS
Scaling Survivors £1-2m to £3m+ in 3 years 2013-16 (%)
Start-ups Scaling <£500k to £1m + in 3 years 2013-16 (%)

26
High Growth Firm (OECD definition) Incidence Rate 2010/13 – 2013/16 (%)
Growth Hub Website:
www.the-lep.com/for-business
Population: 3,026,700
Private Sector Firms: 95,466
Private Sector Jobs: 1,143,159
Sectoral Composition: View here: sectoral composition
• 11,434 new registered businesses in 2016
• 38 start-ups per 10,000 population in 2016
• 54% of 2013 start-ups survived to 2016
• 1.9% of surviving 2013 start-ups grew from <500k to £1m + T/O by 2016
• 6.7% high-growth firm (OECD definition) incidence rate (2013-2016)
• 1.8% small high-growth firm (Clayton variation to OECD definition) incidence rate (2013-2016) – 1.7% for England
• 6.2% of £1-2m T/O businesses in 2013 grew to a minimum of £3m by 2016
CONTEXT 2016
Leeds City Region
1.92.0
0.0
0.5
1.0
1.5
2.0
2.5
3.0
LCRLEP England
6.26.8
0.0
1.0
2.0
3.0
4.0
5.0
6.0
7.0
8.0
9.0
10.0
LCRLEP England
0.0
2.0
4.0
6.0
8.0
10.0
2010/13 2011/14 2012/15 2013/16
LCRLEP UK
GROWTH
START-UPS
Scaling Survivors £1-2m to £3m+ in 3 years 2013-16 (%)
Start-ups Scaling <£500k to £1m + in 3 years 2013-16 (%)

27
High Growth Firm (OECD definition) Incidence Rate 2010/13 – 2013/16 (%)
Growth Hub Website:
www.llepbizgateway.co.uk
Population: 1,017,900
Private Sector Firms: 34,941
Private Sector Jobs: 295,297
Sectoral Composition: View here: sectoral composition
• 4,115 new registered businesses in 2016
• 40 start-ups per 10,000 population in 2016
• 56% of 2013 start-ups survived to 2016
• 1.5% of surviving 2013 start-ups grew from <500k to £1m + T/O by 2016
• 6.4% high-growth firm (OECD definition) incidence rate (2013-2016)
• 1.6% small high-growth firm (Clayton variation to OECD definition) incidence rate (2013-2016) – 1.7% for England
• 6.3% of £1-2m T/O businesses in 2013 grew to a minimum of £3m by 2016
CONTEXT 2016
Leicester and Leicestershire
1.5
2.0
0.0
0.5
1.0
1.5
2.0
2.5
3.0
LLLEP England
6.36.8
0.0
1.0
2.0
3.0
4.0
5.0
6.0
7.0
8.0
9.0
10.0
LLLEP England
0.0
2.0
4.0
6.0
8.0
10.0
2010/13 2011/14 2012/15 2013/16
LLLEP UK
GROWTH
START-UPS
Scaling Survivors £1-2m to £3m+ in 3 years 2013-16 (%)
Start-ups Scaling <£500k to £1m + in 3 years 2013-16 (%)
28
High Growth Firm (OECD definition) Incidence Rate 2010/13 – 2013/16 (%)
Growth Hub Website:
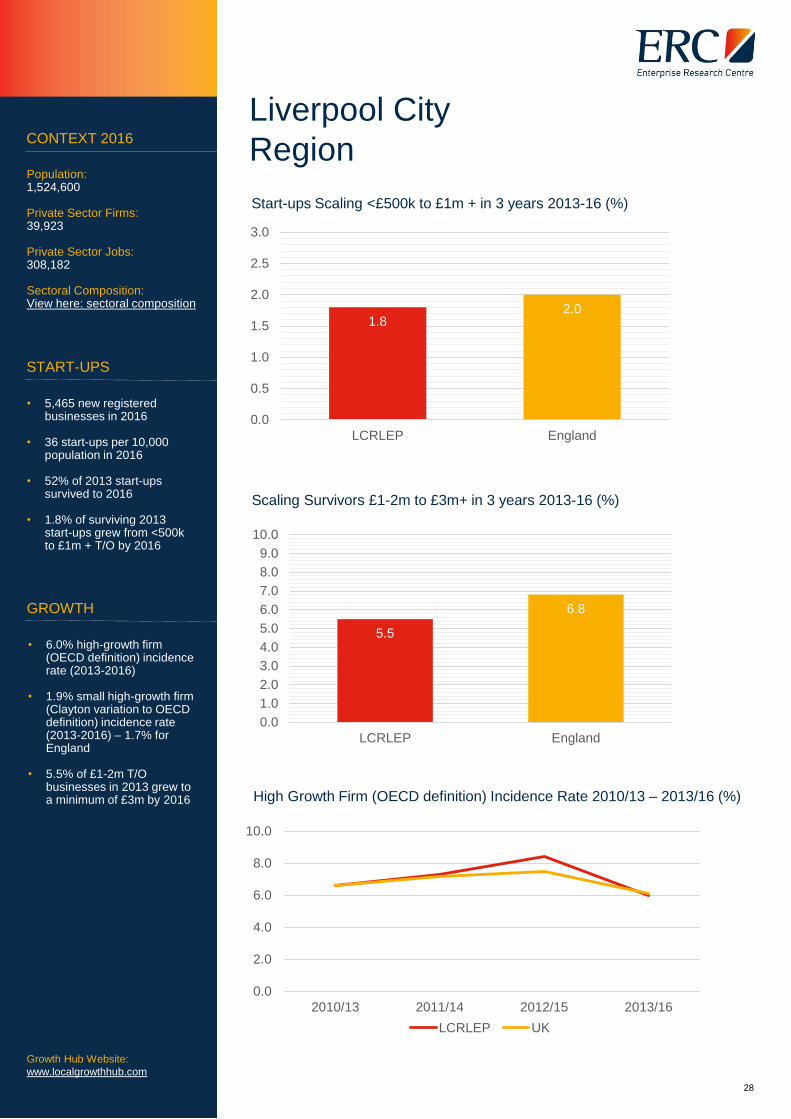
www.localgrowthhub.com
Population: 1,524,600
Private Sector Firms: 39,923
Private Sector Jobs: 308,182
Sectoral Composition: View here: sectoral composition
• 5,465 new registered businesses in 2016
• 36 start-ups per 10,000 population in 2016
• 52% of 2013 start-ups survived to 2016
• 1.8% of surviving 2013 start-ups grew from <500k to £1m + T/O by 2016
• 6.0% high-growth firm (OECD definition) incidence rate (2013-2016)
• 1.9% small high-growth firm (Clayton variation to OECD definition) incidence rate (2013-2016) – 1.7% for England
• 5.5% of £1-2m T/O businesses in 2013 grew to a minimum of £3m by 2016
CONTEXT 2016
Liverpool City
Region
1.82.0
0.0
0.5
1.0
1.5
2.0
2.5
3.0
LCRLEP England
5.5
6.8
0.0
1.0
2.0
3.0
4.0
5.0
6.0
7.0
8.0
9.0
10.0
LCRLEP England
0.0
2.0
4.0
6.0
8.0
10.0
2010/13 2011/14 2012/15 2013/16
LCRLEP UK
GROWTH
START-UPS
Scaling Survivors £1-2m to £3m+ in 3 years 2013-16 (%)
Start-ups Scaling <£500k to £1m + in 3 years 2013-16 (%)
29
High Growth Firm (OECD definition) Incidence Rate 2010/13 – 2013/16 (%)
Growth Hub Website:
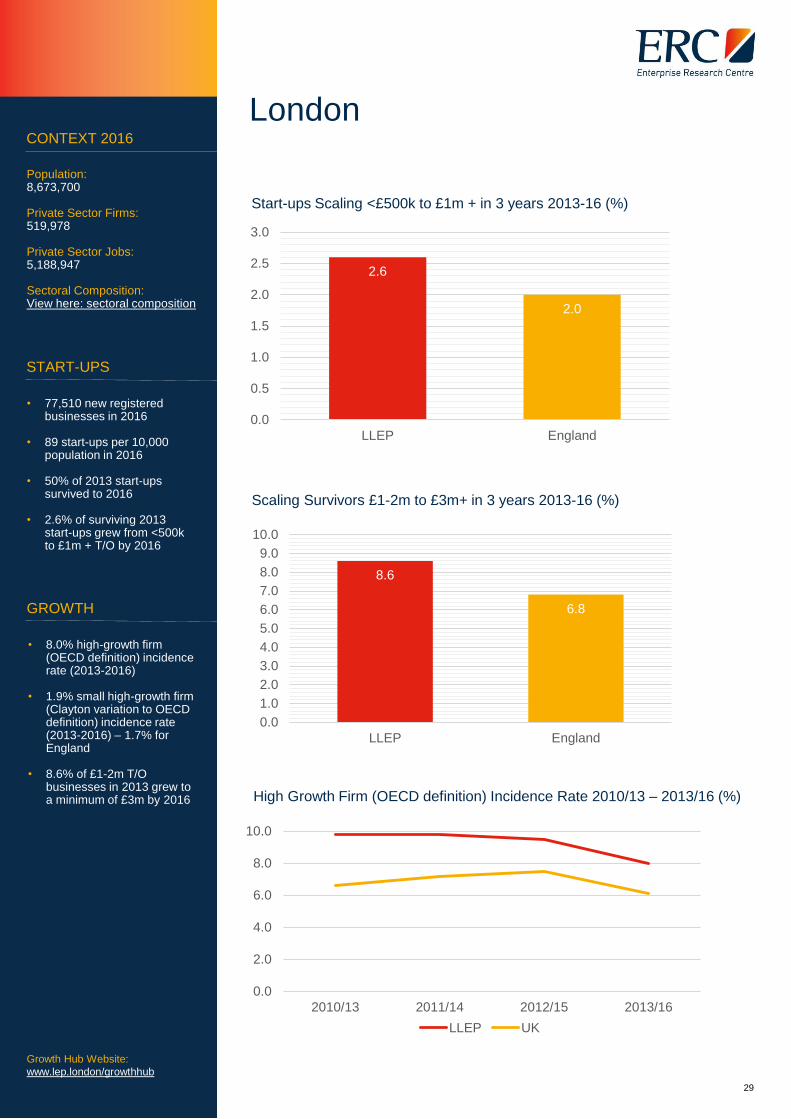
www.lep.london/growthhub
Population: 8,673,700
Private Sector Firms: 519,978
Private Sector Jobs: 5,188,947
Sectoral Composition: View here: sectoral composition
• 77,510 new registered businesses in 2016
• 89 start-ups per 10,000 population in 2016
• 50% of 2013 start-ups survived to 2016
• 2.6% of surviving 2013 start-ups grew from <500k to £1m + T/O by 2016
• 8.0% high-growth firm (OECD definition) incidence rate (2013-2016)
• 1.9% small high-growth firm (Clayton variation to OECD definition) incidence rate (2013-2016) – 1.7% for England
• 8.6% of £1-2m T/O businesses in 2013 grew to a minimum of £3m by 2016
CONTEXT 2016
London
2.6
2.0
0.0
0.5
1.0
1.5
2.0
2.5
3.0
LLEP England
8.6
6.8
0.0
1.0
2.0
3.0
4.0
5.0
6.0
7.0
8.0
9.0
10.0
LLEP England
0.0
2.0
4.0
6.0
8.0
10.0
2010/13 2011/14 2012/15 2013/16
LLEP UK
GROWTH
START-UPS
Scaling Survivors £1-2m to £3m+ in 3 years 2013-16 (%)
Start-ups Scaling <£500k to £1m + in 3 years 2013-16 (%)

30
High Growth Firm (OECD definition) Incidence Rate 2010/13 – 2013/16 (%)
Growth Hub Website:
www.newangliagrowthhub.co.uk
Population: 1,626,900
Private Sector Firms: 49,671
Private Sector Jobs: 427,431
Sectoral Composition: View here: sectoral composition
• 4,911 new registered businesses in 2016
• 30 start-ups per 10,000 population in 2016
• 57% of 2013 start-ups survived to 2016
• 1.9% of surviving 2013 start-ups grew from <500k to £1m + T/O by 2016
• 5.5% high-growth firm (OECD definition) incidence rate (2013-2016)
• 1.7% small high-growth firm (Clayton variation to OECD definition) incidence rate (2013-2016) – 1.7% for England
• 3.8% of £1-2m T/O businesses in 2013 grew to a minimum of £3m by 2016
CONTEXT 2016
New Anglia
1.92.0
0.0
0.5
1.0
1.5
2.0
2.5
3.0
NALEP England
3.8
6.8
0.0
1.0
2.0
3.0
4.0
5.0
6.0
7.0
8.0
9.0
10.0
NALEP England
0.0
2.0
4.0
6.0
8.0
10.0
2010/13 2011/14 2012/15 2013/16
NALEP UK
GROWTH
START-UPS
Scaling Survivors £1-2m to £3m+ in 3 years 2013-16 (%)
Start-ups Scaling <£500k to £1m + in 3 years 2013-16 (%)

31
High Growth Firm (OECD definition) Incidence Rate 2010/13 – 2013/16 (%)
Growth Hub Website:
www.northeastgrowthhub.co.uk
Population: 1,957,200
Private Sector Firms: 44,963
Private Sector Jobs: 425,606
Sectoral Composition: View here: sectoral composition
• 3,948 new registered businesses in 2016
• 20 start-ups per 10,000 population in 2016
• 53% of 2013 start-ups survived to 2016
• 1.6% of surviving 2013 start-ups grew from <500k to £1m + T/O by 2016
• 6.3% high-growth firm (OECD definition) incidence rate (2013-2016)
• 1.9% small high-growth firm (Clayton variation to OECD definition) incidence rate (2013-2016) – 1.7% for England
• 6.4% of £1-2m T/O businesses in 2013 grew to a minimum of £3m by 2016
CONTEXT 2015
North East
1.6
2.0
0.0
0.5
1.0
1.5
2.0
2.5
3.0
NELEP England
6.46.8
0.0
1.0
2.0
3.0
4.0
5.0
6.0
7.0
8.0
9.0
10.0
NELEP England
0.0
2.0
4.0
6.0
8.0
10.0
2010/13 2011/14 2012/15 2013/16
NELEP UK
GROWTH
START-UPS
Scaling Survivors £1-2m to £3m+ in 3 years 2013-16 (%)
Start-ups Scaling <£500k to £1m + in 3 years 2013-16 (%)

32
High Growth Firm (OECD definition) Incidence Rate 2010/13 – 2013/16 (%)
Growth Hub Website:www.northamptonshiregrowthhub.co.uk
Population: 723,000
Private Sector Firms: 29,165
Private Sector Jobs: 294,287
Sectoral Composition: View here: sectoral composition
• 4,051 new registered businesses in 2016
• 56 start-ups per 10,000 population in 2016
• 56% of 2013 start-ups survived to 2016
• 1.2% of surviving 2013 start-ups grew from <500k to £1m + T/O by 2016
• 6.7% high-growth firm (OECD definition) incidence rate (2013-2016)
• 1.6% small high-growth firm (Clayton variation to OECD definition) incidence rate (2013-2016) – 1.7% for England
• 7.5% of £1-2m T/O businesses in 2013 grew to a minimum of £3m by 2016
CONTEXT 2016
Northamptonshire
1.2
2.0
0.0
0.5
1.0
1.5
2.0
2.5
3.0
NLEP England
7.56.8
0.0
1.0
2.0
3.0
4.0
5.0
6.0
7.0
8.0
9.0
10.0
NLEP England
0.0
2.0
4.0
6.0
8.0
10.0
2010/13 2011/14 2012/15 2013/16
NLEP UK
GROWTH
START-UPS
Scaling Survivors £1-2m to £3m+ in 3 years 2013-16 (%)
Start-ups Scaling <£500k to £1m + in 3 years 2013-16 (%)

33
High Growth Firm (OECD definition) Incidence Rate 2010/13 – 2013/16 (%)
Growth Hub Website:www.oxfordshirebusinesssupport.co.uk
Population: 677,800
Private Sector Firms: 27,207
Private Sector Jobs: 260,564
Sectoral Composition: View here: sectoral composition
• 2,747 new registered businesses in 2016
• 41 start-ups per 10,000 population in 2016
• 58% of 2012 start-ups survived to 2016
• 1.8% of surviving 2013 start-ups grew from <500k to £1m + T/O by 2016
• 6.0% high-growth firm (OECD definition) incidence rate (2013-2016)
• 1.8% small high-growth firm (Clayton variation to OECD definition) incidence rate (2013-2016) – 1.7% for England
• 5.5% of £1-2m T/O businesses in 2013 grew to a minimum of £3m by 2016
CONTEXT 2016
Oxfordshire
1.82.0
0.0
0.5
1.0
1.5
2.0
2.5
3.0
OLEP England
5.5
6.8
0.0
1.0
2.0
3.0
4.0
5.0
6.0
7.0
8.0
9.0
10.0
OLEP England
0.0
2.0
4.0
6.0
8.0
10.0
2010/13 2011/14 2012/15 2013/16
OLEP UK
GROWTH
START-UPS
Scaling Survivors £1-2m to £3m+ in 3 years 2013-16 (%)
Start-ups Scaling <£500k to £1m + in 3 years 2013-16 (%)
34
High Growth Firm (OECD definition) Incidence Rate 2010/13 – 2013/16 (%)
Growth Hub Website:
www.scrgrowthhub.co.uk
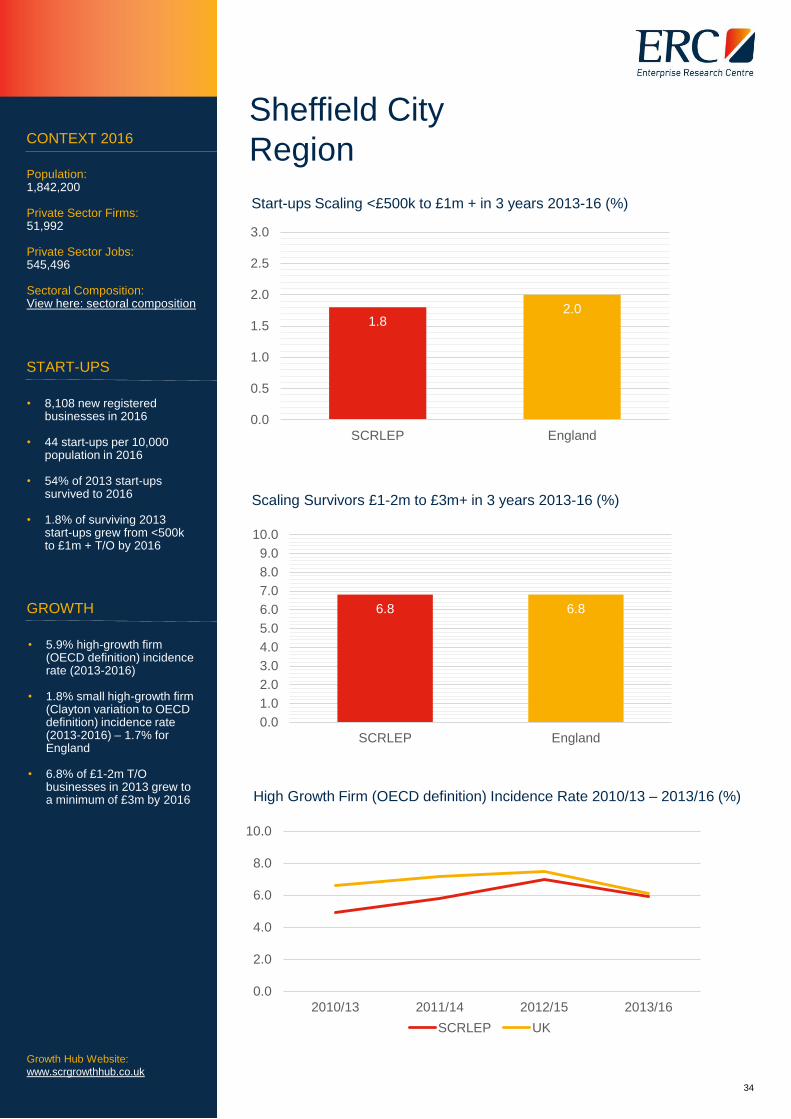
Population: 1,842,200
Private Sector Firms: 51,992
Private Sector Jobs: 545,496
Sectoral Composition: View here: sectoral composition
• 8,108 new registered businesses in 2016
• 44 start-ups per 10,000 population in 2016
• 54% of 2013 start-ups survived to 2016
• 1.8% of surviving 2013 start-ups grew from <500k to £1m + T/O by 2016
• 5.9% high-growth firm (OECD definition) incidence rate (2013-2016)
• 1.8% small high-growth firm (Clayton variation to OECD definition) incidence rate (2013-2016) – 1.7% for England
• 6.8% of £1-2m T/O businesses in 2013 grew to a minimum of £3m by 2016
CONTEXT 2016
Sheffield City
Region
1.82.0
0.0
0.5
1.0
1.5
2.0
2.5
3.0
SCRLEP England
6.8 6.8
0.0
1.0
2.0
3.0
4.0
5.0
6.0
7.0
8.0
9.0
10.0
SCRLEP England
0.0
2.0
4.0
6.0
8.0
10.0
2010/13 2011/14 2012/15 2013/16
SCRLEP UK
GROWTH
START-UPS
Scaling Survivors £1-2m to £3m+ in 3 years 2013-16 (%)
Start-ups Scaling <£500k to £1m + in 3 years 2013-16 (%)

35
High Growth Firm (OECD definition) Incidence Rate 2010/13 – 2013/16 (%)
Growth Hub Website:
www.solentgrowthhub.co.uk
Population: 1,052,100
Private Sector Firms: 55,401
Private Sector Jobs: 442,781
Sectoral Composition: View here: sectoral composition
• 6,517 new registered businesses in 2016
• 62 start-ups per 10,000 population in 2016
• 56% of 2013 start-ups survived to 2016
• 1.8% of surviving 2013 start-ups grew from <500k to £1m + T/O by 2016
• 6.7% high-growth firm (OECD definition) incidence rate (2013-2016)
• 1.7% small high-growth firm (Clayton variation to OECD definition) incidence rate (2013-2016) – 1.7% for England
• 6.6% of £1-2m T/O businesses in 2013 grew to a minimum of £3m by 2016
CONTEXT 2016
Solent
1.82.0
0.0
0.5
1.0
1.5
2.0
2.5
3.0
SLEP England
6.6 6.8
0.0
1.0
2.0
3.0
4.0
5.0
6.0
7.0
8.0
9.0
10.0
SLEP England
0.0
2.0
4.0
6.0
8.0
10.0
2010/13 2011/14 2012/15 2013/16
SLEP UK
GROWTH
START-UPS
Scaling Survivors £1-2m to £3m+ in 3 years 2013-16 (%)
Start-ups Scaling <£500k to £1m + in 3 years 2013-16 (%)

36
High Growth Firm (OECD definition) Incidence Rate 2010/13 – 2013/16 (%)
Growth Hub Website:
www.southeastbusiness.org.uk
Population: 4,132,300
Private Sector Firms: 149,999
Private Sector Jobs: 900,519
Sectoral Composition: View here: sectoral composition
• 18,573 new registered businesses in 2016
• 45 start-ups per 10,000 population in 2016
• 56% of 2013 start-ups survived to 2016
• 2.0% of surviving 2013 start-ups grew from <500k to £1m + T/O by 2016
• 5.6% high-growth firm (OECD definition) incidence rate (2013-2016)
• 1.5% small high-growth firm (Clayton variation to OECD definition) incidence rate (2013-2016) – 1.7% for England
• 6.0% of £1-2m T/O businesses in 2013 grew to a minimum of £3m by 2016
CONTEXT 2016
South East
2.0 2.0
0.0
0.5
1.0
1.5
2.0
2.5
3.0
SELEP England
6.06.8
0.0
1.0
2.0
3.0
4.0
5.0
6.0
7.0
8.0
9.0
10.0
SELEP England
0.0
2.0
4.0
6.0
8.0
10.0
2010/13 2011/14 2012/15 2013/16
SELEP UK
GROWTH
START-UPS
Scaling Survivors £1-2m to £3m+ in 3 years 2013-16 (%)
Start-ups Scaling <£500k to £1m + in 3 years 2013-16 (%)
37
High Growth Firm (OECD definition) Incidence Rate 2010/13 – 2013/16 (%)
Growth Hub Website:
www.velocitybusinesssupport.com
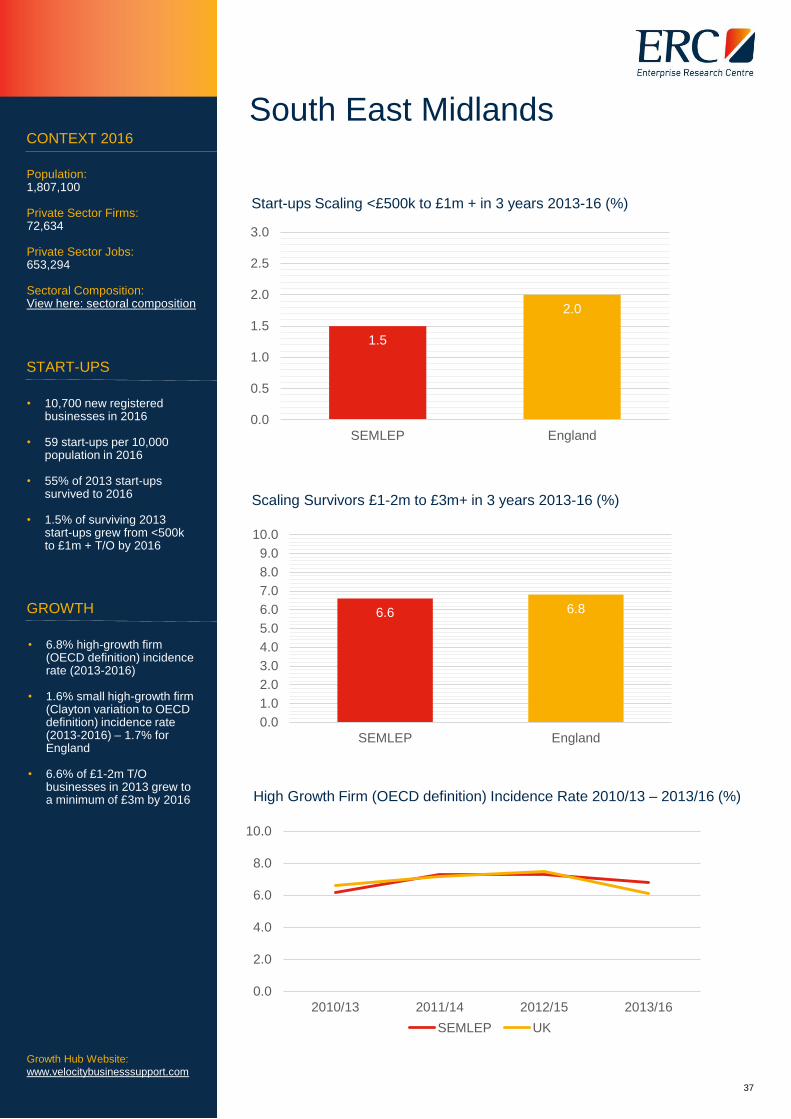
Population: 1,807,100
Private Sector Firms: 72,634
Private Sector Jobs: 653,294
Sectoral Composition: View here: sectoral composition
• 10,700 new registered businesses in 2016
• 59 start-ups per 10,000 population in 2016
• 55% of 2013 start-ups survived to 2016
• 1.5% of surviving 2013 start-ups grew from <500k to £1m + T/O by 2016
• 6.8% high-growth firm (OECD definition) incidence rate (2013-2016)
• 1.6% small high-growth firm (Clayton variation to OECD definition) incidence rate (2013-2016) – 1.7% for England
• 6.6% of £1-2m T/O businesses in 2013 grew to a minimum of £3m by 2016
CONTEXT 2016
South East Midlands
1.5
2.0
0.0
0.5
1.0
1.5
2.0
2.5
3.0
SEMLEP England
6.6 6.8
0.0
1.0
2.0
3.0
4.0
5.0
6.0
7.0
8.0
9.0
10.0
SEMLEP England
0.0
2.0
4.0
6.0
8.0
10.0
2010/13 2011/14 2012/15 2013/16
SEMLEP UK
GROWTH
START-UPS
Scaling Survivors £1-2m to £3m+ in 3 years 2013-16 (%)
Start-ups Scaling <£500k to £1m + in 3 years 2013-16 (%)

38
High Growth Firm (OECD definition) Incidence Rate 2010/13 – 2013/16 (%)
Growth Hub Website:
www.stokestaffsgrowthhub.co.uk
Population: 1,114,200
Private Sector Firms: 33,202
Private Sector Jobs: 282,280
Sectoral Composition: View here: sectoral composition
• 3,548 new registered businesses in 2016
• 32 start-ups per 10,000 population in 2016
• 53% of 2013 start-ups survived to 2016
• 1.9% of surviving 2013 start-ups grew from <500k to £1m + T/O by 2016
• 5.8% high-growth firm (OECD definition) incidence rate (2013-2016)
• 1.7% small high-growth firm (Clayton variation to OECD definition) incidence rate (2013-2016) – 1.7% for England
• 7.4% of £1-2m T/O businesses in 2013 grew to a minimum of £3m by 2016
CONTEXT 2016
Stoke-on-Trent
and Staffordshire
1.92.0
0.0
0.5
1.0
1.5
2.0
2.5
3.0
STSLEP England
7.46.8
0.0
1.0
2.0
3.0
4.0
5.0
6.0
7.0
8.0
9.0
10.0
STSLEP England
0.0
2.0
4.0
6.0
8.0
10.0
2010/13 2011/14 2012/15 2013/16
STSLEP UK
GROWTH
START-UPS
Scaling Survivors £1-2m to £3m+ in 3 years 2013-16 (%)
Start-ups Scaling <£500k to £1m + in 3 years 2013-16 (%)

39
High Growth Firm (OECD definition) Incidence Rate 2010/13 – 2013/16 (%)
Growth Hub Website:
www.wiltshirebusinesshub.co.uk
Population: 703,300
Private Sector Firms: 25,352
Private Sector Jobs: 211,344
Sectoral Composition: View here: sectoral composition
• 2,932 new registered businesses in 2016
• 42 start-ups per 10,000 population in 2016
• 56% of 2013 start-ups survived to 2016
• 1.0% of surviving 2013 start-ups grew from <500k to £1m + T/O by 2016
• 6.4% high-growth firm (OECD definition) incidence rate (2013-2016)
• 1.7% small high-growth firm (Clayton variation to OECD definition) incidence rate (2013-2016) – 1.7% for England
• 7.9% of £1-2m T/O businesses in 2013 grew to a minimum of £3m by 2016
CONTEXT 2016
Swindon and Wiltshire
1.0
2.0
0.0
0.5
1.0
1.5
2.0
2.5
3.0
SWLEP England
7.9
6.8
0.0
1.0
2.0
3.0
4.0
5.0
6.0
7.0
8.0
9.0
10.0
SWLEP England
0.0
2.0
4.0
6.0
8.0
10.0
2010/13 2011/14 2012/15 2013/16
SWLEP UK
GROWTH
START-UPS
Scaling Survivors £1-2m to £3m+ in 3 years 2013-16 (%)
Start-ups Scaling <£500k to £1m + in 3 years 2013-16 (%)

40
High Growth Firm (OECD definition) Incidence Rate 2010/13 – 2013/16 (%)
Growth Hub Website:
www.teesbusinesscompass.co.uk
Population: 667,500
Private Sector Firms: 17,010
Private Sector Jobs: 117,750
Sectoral Composition: View here: sectoral composition
• 2,213 new registered businesses in 2016
• 33 start-ups per 10,000 population in 2016
• 55% of 2012 start-ups survived to 2016
• 1.3% of surviving 2013 start-ups grew from <500k to £1m + T/O by 2016
• 6.6% high-growth firm (OECD definition) incidence rate (2013-2016)
• 1.5% small high-growth firm (Clayton variation to OECD definition) incidence rate (2013-2016) – 1.7% for England
• 6.9% of £1-2m T/O businesses in 2013 grew to a minimum of £3m by 2016
CONTEXT 2016
Tees Valley
1.3
2.0
0.0
0.5
1.0
1.5
2.0
2.5
3.0
TVLEP England
6.9 6.8
0.0
1.0
2.0
3.0
4.0
5.0
6.0
7.0
8.0
9.0
10.0
TVLEP England
0.0
2.0
4.0
6.0
8.0
10.0
2010/13 2011/14 2012/15 2013/16
TVLEP UK
GROWTH
START-UPS
Scaling Survivors £1-2m to £3m+ in 3 years 2013-16 (%)
Start-ups Scaling <£500k to £1m + in 3 years 2013-16 (%)

41
High Growth Firm (OECD definition) Incidence Rate 2010/13 – 2013/16 (%)
Growth Hub Website:
www.berkshirebusinesshub.co.uk
Population: 890,600
Private Sector Firms: 44,159
Private Sector Jobs: 479,674
Sectoral Composition: View here: sectoral composition
• 5,639 new registered businesses in 2016
• 63 start-ups per 10,000 population in 2016
• 54% of 2013 start-ups survived to 2016
• 1.5% of surviving 2013 start-ups grew from <500k to £1m + T/O by 2016
• 7.3% high-growth firm (OECD definition) incidence rate (2013-2016)
• 1.4% small high-growth firm (Clayton variation to OECD definition) incidence rate (2013-2016) – 1.7% for England
• 8.3% of £1-2m T/O businesses in 2013 grew to a minimum of £3m by 2016
CONTEXT 2016
Thames Valley Berkshire
1.5
2.0
0.0
0.5
1.0
1.5
2.0
2.5
3.0
TVBLEP England
8.3
6.8
0.0
1.0
2.0
3.0
4.0
5.0
6.0
7.0
8.0
9.0
10.0
TVBLEP England
0.0
2.0
4.0
6.0
8.0
10.0
2010/13 2011/14 2012/15 2013/16
TVBLEP UK
GROWTH
START-UPS
Scaling Survivors £1-2m to £3m+ in 3 years 2013-16 (%)
Start-ups Scaling <£500k to £1m + in 3 years 2013-16 (%)

42
High Growth Firm (OECD definition) Incidence Rate 2010/13 – 2013/16 (%)
Growth Hub Website:
www.marchesgrowthhub.co.uk
Population: 670,600
Private Sector Firms: 21,548
Private Sector Jobs: 164,296
Sectoral Composition: View here: sectoral composition
• 2,184 new registered businesses in 2016
• 33 start-ups per 10,000 population in 2016
• 58% of 2013 start-ups survived to 2016
• 1.3% of surviving 2013 start-ups grew from <500k to £1m + T/O by 2016
• 5.8% high-growth firm (OECD definition) incidence rate (2013-2016)
• 1.6% small high-growth firm (Clayton variation to OECD definition) incidence rate (2013-2016) – 1.7% for England
• 4.7% of £1-2m T/O businesses in 2013 grew to a minimum of £3m by 2016
CONTEXT 2016
The Marches
1.3
2.0
0.0
0.5
1.0
1.5
2.0
2.5
3.0
TMLEP England
4.7
6.8
0.0
1.0
2.0
3.0
4.0
5.0
6.0
7.0
8.0
9.0
10.0
TMLEP England
0.0
2.0
4.0
6.0
8.0
10.0
2010/13 2011/14 2012/15 2013/15
TMLEP UK
GROWTH
START-UPS
Scaling Survivors £1-2m to £3m+ in 3 years 2013-16 (%)
Start-ups Scaling <£500k to £1m + in 3 years 2013-16 (%)

43
High Growth Firm (OECD definition) Incidence Rate 2010/13 – 2013/16 (%)
Growth Hub Website:
www.wearegrowth.co.uk
Population: 1,118,800
Private Sector Firms: 41,605
Private Sector Jobs: 321,329
Sectoral Composition: View here: sectoral composition
• 4,800 new registered businesses in 2016
• 43 start-ups per 10,000 population in 2016
• 57% of 2013 start-ups survived to 2016
• 1.6% of surviving 2013 start-ups grew from <500k to £1m + T/O by 2016
• 7.5% high-growth firm (OECD definition) incidence rate (2013-2016)
• 1.9% small high-growth firm (Clayton variation to OECD definition) incidence rate (2013-2016) – 1.7% for England
• 8.1% of £1-2m T/O businesses in 2013 grew to a minimum of £3m by 2016
CONTEXT 2016
West of England
1.6
2.0
0.0
0.5
1.0
1.5
2.0
2.5
3.0
WELEP England
0.0
2.0
4.0
6.0
8.0
10.0
2010/13 2011/14 2012/15 2013/16
WELEP UK
GROWTH
START-UPS
Scaling Survivors £1-2m to £3m+ in 3 years 2013-16 (%)
Start-ups Scaling <£500k to £1m + in 3 years 2013-16 (%)
8.1
6.8
0.0
1.0
2.0
3.0
4.0
5.0
6.0
7.0
8.0
9.0
10.0
WELEP England
44
High Growth Firm (OECD definition) Incidence Rate 2010/13 – 2013/16 (%)
Growth Hub Website:
www.business-central.co.uk
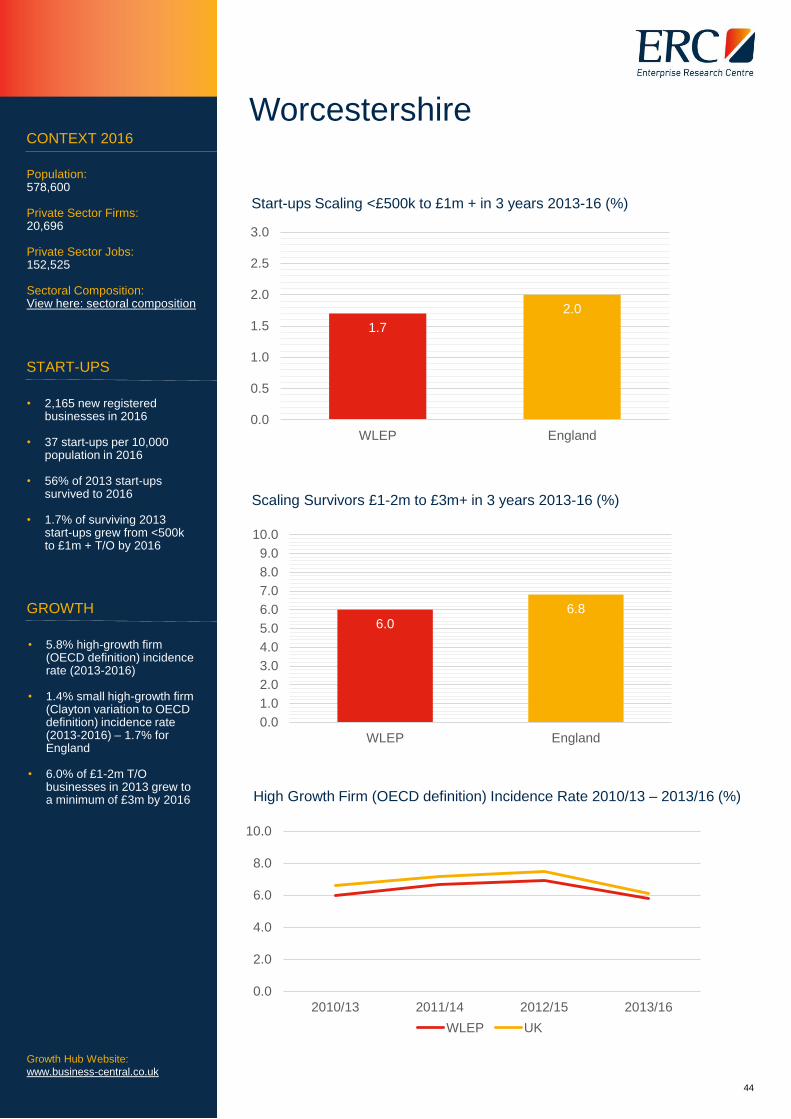
Population: 578,600
Private Sector Firms: 20,696
Private Sector Jobs: 152,525
Sectoral Composition: View here: sectoral composition
• 2,165 new registered businesses in 2016
• 37 start-ups per 10,000 population in 2016
• 56% of 2013 start-ups survived to 2016
• 1.7% of surviving 2013 start-ups grew from <500k to £1m + T/O by 2016
• 5.8% high-growth firm (OECD definition) incidence rate (2013-2016)
• 1.4% small high-growth firm (Clayton variation to OECD definition) incidence rate (2013-2016) – 1.7% for England
• 6.0% of £1-2m T/O businesses in 2013 grew to a minimum of £3m by 2016
CONTEXT 2016
Worcestershire
1.7
2.0
0.0
0.5
1.0
1.5
2.0
2.5
3.0
WLEP England
6.06.8
0.0
1.0
2.0
3.0
4.0
5.0
6.0
7.0
8.0
9.0
10.0
WLEP England
0.0
2.0
4.0
6.0
8.0
10.0
2010/13 2011/14 2012/15 2013/16
WLEP UK
GROWTH
START-UPS
Scaling Survivors £1-2m to £3m+ in 3 years 2013-16 (%)
Start-ups Scaling <£500k to £1m + in 3 years 2013-16 (%)

45
High Growth Firm (OECD definition) Incidence Rate 2010/13 – 2013/16 (%)
Growth Hub Website:
www.howsbusiness.org
Population: 1,145,800
Private Sector Firms: 39,873
Private Sector Jobs: 282,945
Sectoral Composition: View here: sectoral composition
• 3,996 new registered businesses in 2016
• 35 start-ups per 10,000 population in 2016
• 57% of 2013 start-ups survived to 2016
• 1.7% of surviving 2013 start-ups grew from <500k to £1m + T/O by 2016
• 6.5% high-growth firm (OECD definition) incidence rate (2013-2016)
• 2.1% small high-growth firm (Clayton variation to OECD definition) incidence rate (2013-2016) – 1.7% for England
• 5.6% of £1-2m T/O businesses in 2012 grew to a minimum of £3m by 2015
CONTEXT 2016
York, North Yorkshire
and East Riding
1.7
2.0
0.0
0.5
1.0
1.5
2.0
2.5
3.0
YNYERLEP England
5.6
6.8
0.0
1.0
2.0
3.0
4.0
5.0
6.0
7.0
8.0
9.0
10.0
YNYERLEP England
0.0
2.0
4.0
6.0
8.0
10.0
2010/13 2011/14 2012/15 2013/16
YNYERLEP UK
GROWTH
START-UPS
Scaling Survivors £1-2m to £3m+ in 3 years 2013-16 (%)
Start-ups Scaling <£500k to £1m + in 3 years 2013-16 (%)

For more information on ERC please contact:
Centre Manager
Enterprise Research Centre
Aston Business School
Birmingham, B1 7ET
Centre Manager
Enterprise Research Centre
Warwick Business School
Coventry, CV4 7AL
www.enterpriseresearch.ac.uk
@ERC_UK