the costs of low birth weight* - princeton …davidlee/wp/birthweight.pdf · the costs of low birth...
TRANSCRIPT

THE COSTS OF LOW BIRTH WEIGHT*
DOUGLAS ALMOND
KENNETH Y. CHAY
DAVID S. LEE
Low birth weight (LBW) infants experience severe health and developmentaldifficulties that can impose large costs on society. However, estimates of thereturn to LBW-prevention from cross-sectional associations may be biased byomitted variables, such as genetic factors. To address this, we compare thehospital costs, health at birth, and infant mortality rates between heavier andlighter infants from all twin pairs born in the United States. We also examine theeffect of maternal smoking during pregnancy—the leading risk factor for LBW inthe United States—on health among singleton births after controlling for detailedbackground characteristics. Both analyses imply substantially smaller effects ofLBW per se than previously thought, suggesting two possibilities: 1) existingestimates overstate the true costs and consequences of LBW by at least a factor offour and by as much as a factor of twenty; or 2) different LBW-preventinginterventions have different health and cost consequences, implying that policyefforts that presume a single return to reducing LBW will be suboptimal.
I. INTRODUCTION
Infants born at low birth weight (LBW)—conventionally de-fined as a birth weight less than 2500 grams—experience severehealth and developmental difficulties that can impose substantialcosts on society. For example, the expected costs of delivery andinitial care of a baby weighing 1000 grams at birth can exceed$100,000 (in year 2000 dollars), and the risk of death within oneyear of birth is over one in five. Even among babies weighing2000–2100 grams, who have comparatively low mortality rates,an additional pound (454 grams) of weight is still associated witha $10,000 difference in hospital charges for inpatient services.1
Studies have also established a correlation between LBW andhigh blood pressure, cerebral palsy, deafness, blindness, asthma,
* An earlier version of this paper was circulated with the title “Does LowBirth Weight Matter? Evidence from the U. S. Population of Twin Births” (Centerfor Labor Economics Working Paper No. 53, September 2002). We are grateful tothree anonymous referees and Lawrence Katz for very helpful comments. We alsothank David Card, Janet Currie, David Cutler, William Evans, Victor Fuchs,Lorenz Goethe, Michael Grossman, Jonathan Gruber, Theodore Joyce, RobertKaestner, Karen Norberg, Jack Porter, Douglas Staiger, Paul Torelli, and manyseminar participants for useful comments.
1. These figures are based on authors’ calculations, illustrated in Figure I,which we discuss below.
© 2005 by the President and Fellows of Harvard College and the Massachusetts Institute ofTechnology.The Quarterly Journal of Economics, August 2005
1031

and lung disease among children, as well as with IQ, test scores,behavioral problems and cognitive development.2
Not surprisingly, birth weight is the primary measure of ababy’s health in most analyses of infant health and welfare ineconomic research. In some contexts, birth weight is viewed asthe “output” in the study of infant health production functionsand the maternal behaviors that impact infant well-being [Rosen-zweig and Schultz 1983; Corman, Joyce, and Grossman 1987;Grossman and Joyce 1990; Geronimus and Korenman 1992;Rosenzweig and Wolpin 1991, 1995; Currie and Moretti 2003]. Inother contexts, birth weight is an “input”—i.e., a proxy for theinitial endowment of an infant’s “health human capital.” Consis-tent with this view, research has found that LBW infants tend tohave lower educational attainment, poorer self-reported healthstatus, and reduced employment and earnings as adults, relativeto their normal weight counterparts [Behrman, Rosenzweig, andTaubman 1994; Currie and Hyson 1999; Behrman and Rosen-zweig 2004]. Finally, birth weight has been used to evaluate theeffectiveness of social policy. Research on the benefits of large-scale social programs—including welfare and health insurancefor the poor—typically use birth weight as the primary indicatorof infant welfare [Currie and Cole 1993; Currie and Gruber 1996;Hanratty 1996].
Perhaps because of its central role in research on infanthealth and welfare, LBW is also the direct target of health policy,both in the United States and abroad. In the United States,reducing the incidence of LBW has been a stated goal of severalsocial programs targeting infant health, including Medicaid, andpublicly funded nutrition programs such as the Women, Infants,and Children (WIC) program.3 The National Institutes of Healthhas encouraged research to focus on the prevention of LBWbirths.4 The World Bank’s $100 million “Second Tamil Nadu
2. For example, see Kaelber and Pugh [1969], McCormick et al. [1992],Paneth [1995], Nelson and Grether [1997], Lucas, Morley, and Cole [1998], Brookset al. [2001], Matte et al. [2001], and Richards et al. [2001].
3. In the United States, a motivation for the Medicaid expansion to pregnantwomen during the 1980s was the reduction of the incidence of low birth weightthrough expanded access to prenatal care [Currie and Gruber 1996]. See Instituteof Medicine [1996] for the LBW motivation for WIC and Kowalseki-Jones andDuncan [2002] for an evaluation of the birth weight benefits of the SpecialSupplemental Nutrition Program of WIC.
4. For example, the chief goal of a program announcement for NIH-sponsoredresearch [1999] (PA-99-045) is the “development of innovative strategies to pre-vent LBW in minority populations.” In addition, the director of the NICHD, has
1032 QUARTERLY JOURNAL OF ECONOMICS
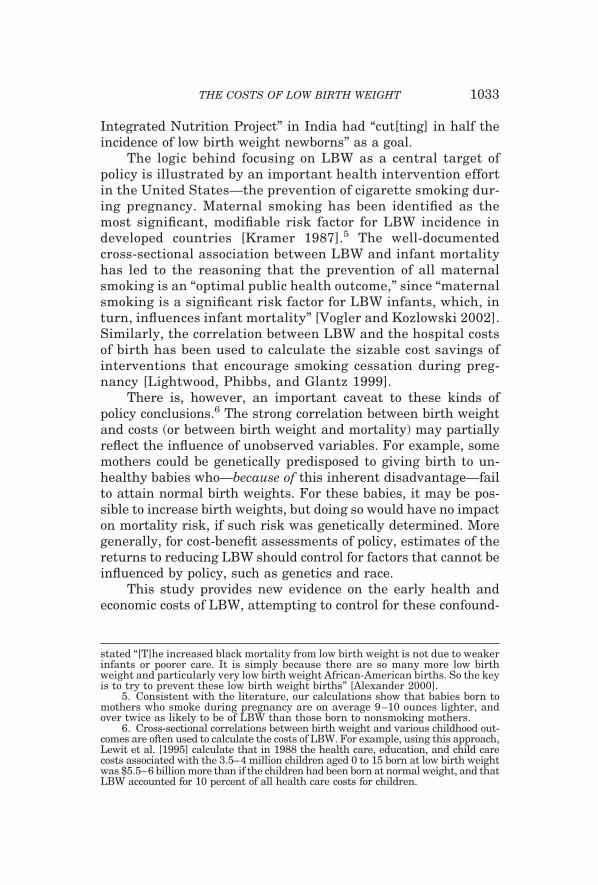
Integrated Nutrition Project” in India had “cut[ting] in half theincidence of low birth weight newborns” as a goal.
The logic behind focusing on LBW as a central target ofpolicy is illustrated by an important health intervention effortin the United States—the prevention of cigarette smoking dur-ing pregnancy. Maternal smoking has been identified as themost significant, modifiable risk factor for LBW incidence indeveloped countries [Kramer 1987].5 The well-documentedcross-sectional association between LBW and infant mortalityhas led to the reasoning that the prevention of all maternalsmoking is an “optimal public health outcome,” since “maternalsmoking is a significant risk factor for LBW infants, which, inturn, influences infant mortality” [Vogler and Kozlowski 2002].Similarly, the correlation between LBW and the hospital costsof birth has been used to calculate the sizable cost savings ofinterventions that encourage smoking cessation during preg-nancy [Lightwood, Phibbs, and Glantz 1999].
There is, however, an important caveat to these kinds ofpolicy conclusions.6 The strong correlation between birth weightand costs (or between birth weight and mortality) may partiallyreflect the influence of unobserved variables. For example, somemothers could be genetically predisposed to giving birth to un-healthy babies who—because of this inherent disadvantage—failto attain normal birth weights. For these babies, it may be pos-sible to increase birth weights, but doing so would have no impacton mortality risk, if such risk was genetically determined. Moregenerally, for cost-benefit assessments of policy, estimates of thereturns to reducing LBW should control for factors that cannot beinfluenced by policy, such as genetics and race.
This study provides new evidence on the early health andeconomic costs of LBW, attempting to control for these confound-
stated “[T]he increased black mortality from low birth weight is not due to weakerinfants or poorer care. It is simply because there are so many more low birthweight and particularly very low birth weight African-American births. So the keyis to try to prevent these low birth weight births” [Alexander 2000].
5. Consistent with the literature, our calculations show that babies born tomothers who smoke during pregnancy are on average 9–10 ounces lighter, andover twice as likely to be of LBW than those born to nonsmoking mothers.
6. Cross-sectional correlations between birth weight and various childhood out-comes are often used to calculate the costs of LBW. For example, using this approach,Lewit et al. [1995] calculate that in 1988 the health care, education, and child carecosts associated with the 3.5–4 million children aged 0 to 15 born at low birth weightwas $5.5–6 billion more than if the children had been born at normal weight, and thatLBW accounted for 10 percent of all health care costs for children.
1033THE COSTS OF LOW BIRTH WEIGHT

ing factors.7 Our first approach uses the population of twins bornin the United States between 1983 and 2000 to examine thecorrelation between twin differences in birth weight and twindifferences in hospital charges, other measures of health at birth,and infant mortality rates. This strategy controls for all observedand unobserved characteristics of the mother. In the case ofidentical twins, it guarantees that the birth weight differencesare entirely driven by environmental factors (e.g., nutritionalintake within the uterus) rather than by any genetic factors.
In a complementary analysis, we consider a specific externalinfluence of LBW that is 1) arguably less directly attributable togenetics, 2) not a consequence of the inherent health of the fetus,and 3) cited as the leading modifiable cause of LBW in the UnitedStates: maternal smoking during pregnancy. We estimate the ef-fects of maternal smoking on a variety of infant health outcomes forthe population of singleton births, controlling for the detailed back-ground variables available in birth certificate data. The estimatesare predicted to be large if, indeed, smoking causes LBW, and ifLBW has a causal link to adverse infant health outcomes. Here, byattributing the entire impact of maternal smoking on infant healthto its impact through LBW, we generate estimates of the effects ofLBW that are arguably overstated. We recognize that this approachcannot fully control for unobserved heterogeneity across mothers.Nevertheless, the analysis allows us to gauge the plausibility of themagnitudes derived from our analysis of twins, within an importantand policy-relevant context.
Both approaches yield implied impacts of LBW that aremany times smaller than those used in conventional cost-benefitcalculations. The cross-sectional OLS estimates imply that a onestandard deviation increase in birth weight is associated with adecrease in hospital costs, a reduction in infant mortality, anincrease in APGAR scores (an initial assessment of the baby’shealth at birth), and a reduction in assisted ventilator use afterbirth, of 0.51, 0.41, 0.51, and 0.25 standard deviations, respec-tively. By contrast, controlling for mother-heterogeneity in thetwins analysis, the corresponding magnitudes are 0.08, 0.03,0.03, and 0.01.
Our analysis of the impact of maternal smoking during preg-nancy on singleton health also points to a relatively weak LBW-
7. More specifically, as we discuss below, we assess the costs and conse-quences of intrauterine growth retardation.
1034 QUARTERLY JOURNAL OF ECONOMICS

health relationship. We estimate a substantial impact of smokingon birth weight (and on LBW incidence), after controlling fordetailed background characteristics using both regression andpropensity score methods. But the corresponding estimates of theeffects of smoking on the five-minute APGAR score, assistedventilation use after birth, and infant mortality are essentiallyzero. Further, while the cross-sectional estimates typically usedin the literature imply a cost savings of over $900 per infant foreach mother who ceases smoking during pregnancy, our esti-mates imply a cost savings of only $53 per infant.
There are two plausible interpretations of these findings. Thefirst is that the analysis identifies the structural impact of birthweight and that the true health benefits and cost savings ofpreventing LBW are greatly exaggerated by cross-sectional cor-relations. A more cautious interpretation is that the cross-sec-tional correlations, within-mother twins analysis, and the covari-ate-adjusted smoking analysis each isolate different determi-nants of birth weight, and therefore that the benefits to reducingLBW are highly dependent on the type of intervention that influ-ences birth weight. At a minimum, this would imply that LBWstatus is not a consistently dependable target of policy, if theultimate objective is to minimize infant mortality, health prob-lems, and consequent health care costs. That is, the most cost-effective ways of preventing LBW may have little correspondencewith the most cost-effective ways of minimizing infant healthproblems and consequent health care costs.
The next section defines the parameter of interest and de-scribes our estimation strategies. Section III describes the dataand provides descriptive statistics. Section IV presents our mainfindings, while Section V implements our robustness checks. Wediscuss the implications of our results for policy and the broadereconomics literature in Section VI and conclude in Section VII.
II. CONCEPTUAL FRAMEWORK AND IDENTIFICATION STRATEGY
This section discusses our framework for quantifying thecosts and consequences of LBW. We define the parameter ofinterest and describe our identification strategies, discuss thepotential determinants of LBW, justify the outcome variablesused in the study, and discuss functional form issues for estimat-ing the impact of birth weight on these outcomes.
1035THE COSTS OF LOW BIRTH WEIGHT

II.A. Parameter of Interest
Let
(1) hij � � � bwij� � X�i� � ai � εij,
where hij is the underlying health of newborn j for mother i, bwij isbirth weight, Xi is a vector of mother-specific observable determi-nants of health (e.g., race, age, education), ai reflects mother-specificunobservable determinants of health (e.g., genetic factors), and εijrepresents other newborn-specific idiosyncratic factors, assumed tobe independent of all observable and unobservable factors.
The central parameter of interest is �, and its magnitude isimportant for policy purposes. If it is large and positive, it suggestssubstantial benefits to interventions that raise birth weights. Esti-mation of � by OLS, however, is confounded by the existence offactors such as race, age, and education (elements of Xi) or geneticdeterminants (ai) that simultaneously influence birth weight andinfant health. The omitted variables formula implies that the OLScoefficient from a bivariate regression of the health measure on birthweight (with no other covariates included) is
(2) �OLS � � �cov�bwij, X�i��
var�bwij��
cov�bwij,ai�
var�bwij�.
Thus, even if there is a strong cross-sectional correlation betweenhealth measures and birth weight—and �OLS is highly signifi-cant—the strength of the relation could be driven by the correla-tion between birth weight and other factors such as race, age,education, and unobservable genetic factors.
The distinction between � and the latter two terms in (2) isimportant. Existing LBW-reducing intervention efforts in theUnited States (nutritional programs, smoking cessation) do notseek to alter the age or education levels of mothers, and no policycan ever affect immutable factors such as race or genetics. Thus,if �OLS is primarily driven by the latter two terms in (2), then itwould be an exaggerated and perhaps misleading estimate of thebenefits (�) of a policy that raises birth weights.
II.B. Identification Strategies
We use two different strategies to estimate �. First, we ex-amine the population of twin births in the United States, andinclude mother fixed effects in the regression. Twins share thesame mother, so the inclusion of fixed effects effectively controls
1036 QUARTERLY JOURNAL OF ECONOMICS

for race, age, education, family background, behaviors (e.g.,smoking), as well as genetic factors and other unobservablemother-specific factors. Including mother fixed effects is equiva-lent to estimating the first-differenced equation:
(3) hi1 � hi2 � �1 � �2 � �bwi1 � bwi2�� � εi1 � εi2,
where 1 and 2 denote the first- and second-born infants of atwin-pair. Under the assumption that εij is uncorrelated withbwij, the fixed effects estimator �FE is unbiased for �. In the caseof fraternal twins, genetic differences could imply that (εi1 � εi2)is correlated with (bwi1 � bwi2) leading to a �FE that is biased.Below, we find evidence that birth weight is negatively correlatedwith congenital defects among twins, suggesting that �FE mightoverstate the impact of birth weight per se.8
Second, to complement this “within-mother” approach, weconduct a “between-mother” analysis. Specifically, we attempt toisolate variation in birth weight that is a direct result of thebehavior that has been identified as the leading cause of LBW inthe United States: maternal smoking [Kramer 1987]. It has beenargued that since smoking induces LBW, and LBW causes infantmortality, then maternal smoking must have an influence oninfant mortality [Vogler and Kozlowski 2002]. To test this rea-soning, we estimate the direct effect of maternal smoking oninfant mortality and on other outcomes and attribute this effectentirely to the impact of smoking on birth weight.
More formally, let
(4) bwij � � � SMOKEi � X�i � uij,
where SMOKEi is an indicator for whether the mother smokedduring pregnancy, uij reflects unobservable determinants of birthweight, and is by definition orthogonal to SMOKEi and Xi. Thereduced-form then becomes
(5) hij � �* � SMOKEi� � X�i�* � a*i � uij� � εij,
where a*i is the residual from regressing ai on Xi.9 Unbiased
estimation of � with OLS requires SMOKEi to be uncorrelatedwith a*i.
8. Almond, Chay, and Lee [2002] show the set of conditions under which the“twins estimate” should be strong and potentially larger than the cross-sectional“between-family” relation if birth weight is a valid policy marker.
9. �* is (� � � � �), where � are the linear projection coefficients fromregressing ai on Xi. �* is (� � ��).
1037THE COSTS OF LOW BIRTH WEIGHT

There is no a priori justification for a*i being uncorrelatedwith SMOKEi, and the analysis cannot control for unobservabledifferences across families. Equations (4) and (5) implicitly as-sume that smoking behavior during pregnancy is “randomized”conditional on the observable characteristics Xi. While experi-mental studies have demonstrated an effect of smoking cessationduring pregnancy on birth weight and LBW, they have found noeffects on gestation length and APGAR scores.10 Further, thesmall numbers of women in the treatment and control groups didnot allow for an analysis of the impact of smoking cessation onrare outcomes such as infant mortality. Thus, all of the evidenceon the infant mortality effects of maternal smoking stems frompurely observational studies.
In view of this, our approach is to estimate the direct effectsof maternal smoking using a large sample of singleton birthswhile controlling for more detailed maternal and backgroundcharacteristics than previous studies. We also allow these char-acteristics to enter flexibly in both a regression and propensityscore analysis. Although this may still result in biased inference,two factors mitigate potential concerns. First, the estimated birthweight effects are robust and similar in magnitude to those docu-mented in the experimental literature. Second, we attribute theentire infant health effect of maternal smoking to its impact onbirth weight. Thus, the OLS estimate of � will overstate theimportance of the birth weight channel if maternal smoking hasa negative effect on infant health that is independent of its effecton LBW. This will also be true if the omitted variables, such asgenetics, are correlated both with smoking and poorer birthoutcomes.
II.C. Sources of Birth Weight Variation
It is generally recognized that LBW is governed by two fac-tors: a short duration of gestation (i.e., prematurity), and a re-duced fetal growth rate at a given gestation length, also known asintrauterine growth retardation (IUGR). Empirically, gestationlength is an important determinant of birth weight. The first rowof Table I, which reports mean squared errors from regressions
10. The quasi-experimental studies involve randomly assigned interventionsin which the treatment group is encouraged to cease smoking through personalvisits, information dissemination, telephone calls, etc. Some examples are Sextonand Hebel [1984], Ershoff, Dolan-Mullen, and Quinn [1989], and Windsor et al.[1993].
1038 QUARTERLY JOURNAL OF ECONOMICS

with birth weight as the dependent variable, shows that theinclusion of gestation variables (columns (2) and (3)) explainsover half of the overall variance (44.43) in birth weight in a pooledsample of twins.11 Despite the significant contribution of gesta-tion length to variation in birth weight, the emphasis of theliterature has instead been on IUGR. In a widely cited survey ofresearch on the determinants of low birth weight, Kramer [1987]notes that most research focuses on the factors causing IUGR, asopposed to those causing prematurity. This is perhaps becausethe causes of prematurity are less well-understood. For example,interventions targeted at preventing premature birth, includingenhanced prenatal care and nutritional interventions, have beenfound to be ineffective [Goldenberg and Rouse 1998].
11. Since gestation length is measured at the level of weeks, 19.08 in thethird column is arguably an upper bound on the residual variation in birth weightremaining after controlling for gestation length fixed effects.
TABLE ICOMPONENTS OF VARIANCE FOR BIRTH WEIGHT AND OUTCOMES AMONG TWINS
Dependent variable
Mean squared error in OLSregressions Ratio
(1) (2) (3) (4) (4)/(3)
1989–1991 U. S. twinsBirth weight 44.434 21.307 19.080 7.535 0.40Mortality (1-year) 0.0356 0.0287 0.0219 0.0149 0.68Mortality (1-day) 0.0183 0.0152 0.0102 0.0046 0.45Mortality (28-day) 0.0283 0.0224 0.0158 0.0090 0.575-min. APGAR 1.9254 1.4078 1.1744 0.6510 0.55Ventilator �30 min. 0.0370 0.0348 0.0338 0.0102 0.30
1995–2000 NY-NJ twinsHospital costs 14.410 — — 2.958 —
Controls forGestation length (linear) No Yes — —Gestation length dummies No No Yes —Mother fixed effects No No No Yes
The hospital cost data are from 1995–2000 annual Healthcare Cost and Utilization Project (HCUP) StateInpatient Database for New York and New Jersey. All other data come from the National Center of HealthStatistics 1989–1991 Linked Infant Birth-Death Detail Files. Columns (1)–(4) provide the means squarederror from OLS regressions that include no controls, a linear control for gestation length (in weeks), gestationlength fixed effects, and mother fixed effects, respectively. The final column provides the ratio of column (4)to column (3); that is, the fraction of overall variation in outcomes, for fixed gestation lengths, that is due towithin-twin-pair differences instead of between-twin-pair differences. The hospital costs data do not containgestation lengths. Birth weight is measured in 100s of grams, and hospital costs are in 10,000s of dollars. Thesample size for birth weight, mortality, and assisted ventilation is 187,948. The sample size for 5-minuteAPGAR score is 158,700, and the sample size for hospital costs is 44,410.
1039THE COSTS OF LOW BIRTH WEIGHT

By contrast, studies focusing on IUGR tend to point to twoimportant factors. According to the Kramer [1987] survey, nutri-tion plays an important role in intrauterine growth. In bothdeveloped and developing countries, low caloric intake is one ofthe most important modifiable contributors to IUGR. In addition,Kramer finds that the other important modifiable contributor toIUGR, particularly in developed countries, is cigarette smokingduring pregnancy.12
Our two empirical approaches attempt to use sources ofvariation in birth weight attributable to IUGR. The two sources ofvariation are quite distinct from one another, each having advan-tages and limitations. With smoking-induced variation in birthweight, we can directly assess whether the health impacts of aspecific, modifiable, environmental factor match what would bepredicted by a strong, structural link between LBW and health.The main limitation is that the covariates we use in the regres-sion and propensity score analysis may not account for all of thebetween-mother differences in genetics and other environmentalfactors that influence IUGR.
By contrast, the twins analysis controls for all mother-specificfactors that simultaneously impact IUGR and other health out-comes. In addition, intrapair variation in birth weight must neces-sarily be due to differences in IUGR, since twins have identicalgestational ages. An important caveat, however, is that the exactidentities and relative contributions of the environmental factorscausing intrapair variation are unknown, as is their modifiability.
For example, if twin differences arise solely because onetwin’s nourishment is of higher caloric value than the other’s,then the twins analysis could plausibly be used to estimate therelation between health outcomes and LBW induced by low ca-loric intake of the mother—a factor that could be directly influ-enced by a health intervention. But if, for example, the twindifferences arise instead because one twin receives a greatersupply of blood from the mother than the other, then the useful-ness of the twins analysis for policy predictions would be consid-erably diminished.
While the medical literature has identified differences innutritional intake as the predominant cause of birth weight dif-
12. Other identified contributors in Kramer [1987] were more generalized:prepregnancy weight, very young maternal age, maternal education, and weightgain during pregnancy.
1040 QUARTERLY JOURNAL OF ECONOMICS
ferences between twins, there exist other causes, some of whichare not amenable to policy intervention.13 Further, even if caloricintake was the sole cause of birth weight differences betweentwins, the results from the twins analysis may not be valid forpredicting the effects of increased caloric intake on the healthoutcomes of singleton births. We return to this issue below.
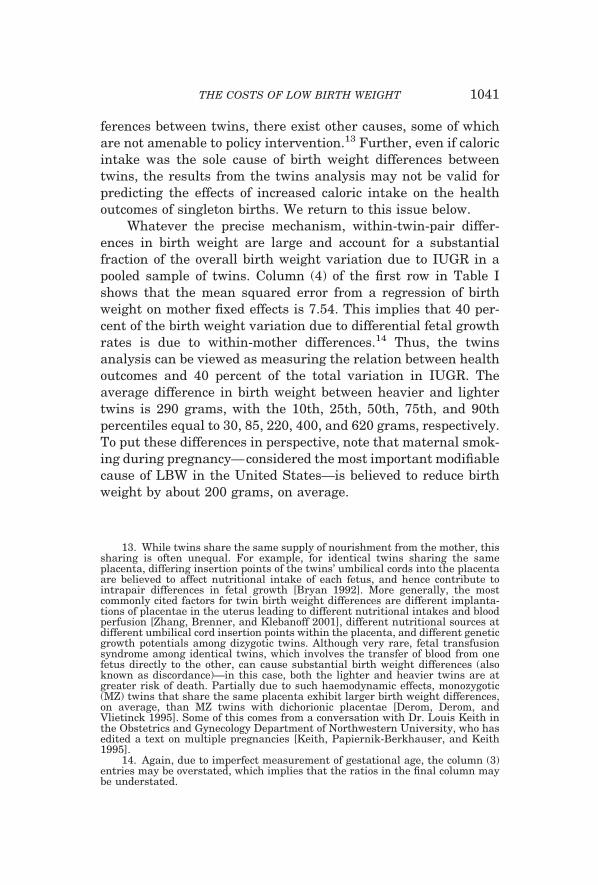
Whatever the precise mechanism, within-twin-pair differ-ences in birth weight are large and account for a substantialfraction of the overall birth weight variation due to IUGR in apooled sample of twins. Column (4) of the first row in Table Ishows that the mean squared error from a regression of birthweight on mother fixed effects is 7.54. This implies that 40 per-cent of the birth weight variation due to differential fetal growthrates is due to within-mother differences.14 Thus, the twinsanalysis can be viewed as measuring the relation between healthoutcomes and 40 percent of the total variation in IUGR. Theaverage difference in birth weight between heavier and lightertwins is 290 grams, with the 10th, 25th, 50th, 75th, and 90thpercentiles equal to 30, 85, 220, 400, and 620 grams, respectively.To put these differences in perspective, note that maternal smok-ing during pregnancy—considered the most important modifiablecause of LBW in the United States—is believed to reduce birthweight by about 200 grams, on average.
13. While twins share the same supply of nourishment from the mother, thissharing is often unequal. For example, for identical twins sharing the sameplacenta, differing insertion points of the twins’ umbilical cords into the placentaare believed to affect nutritional intake of each fetus, and hence contribute tointrapair differences in fetal growth [Bryan 1992]. More generally, the mostcommonly cited factors for twin birth weight differences are different implanta-tions of placentae in the uterus leading to different nutritional intakes and bloodperfusion [Zhang, Brenner, and Klebanoff 2001], different nutritional sources atdifferent umbilical cord insertion points within the placenta, and different geneticgrowth potentials among dizygotic twins. Although very rare, fetal transfusionsyndrome among identical twins, which involves the transfer of blood from onefetus directly to the other, can cause substantial birth weight differences (alsoknown as discordance)—in this case, both the lighter and heavier twins are atgreater risk of death. Partially due to such haemodynamic effects, monozygotic(MZ) twins that share the same placenta exhibit larger birth weight differences,on average, than MZ twins with dichorionic placentae [Derom, Derom, andVlietinck 1995]. Some of this comes from a conversation with Dr. Louis Keith inthe Obstetrics and Gynecology Department of Northwestern University, who hasedited a text on multiple pregnancies [Keith, Papiernik-Berkhauser, and Keith1995].
14. Again, due to imperfect measurement of gestational age, the column (3)entries may be overstated, which implies that the ratios in the final column maybe understated.
1041THE COSTS OF LOW BIRTH WEIGHT

II.D. Measures of Health and Costs and Within-TwinPair Variation
We use four different outcome variables (hij) to characterizethe consequences and costs of low birth weight. First, we considerinfant death at periods up to one year after birth. The advantageof this measure is that it is a somewhat objective indicator ofsevere health problems, and is in fact an outcome of direct inter-est. Smoking cessation campaigns, for example, are motivated notby how smoking impacts birth weight, per se, but instead by howsmoking-induced LBW can affect infant mortality. As anotherexample, the U. S. National Institutes of Health has adopted theview that the difference in LBW between Blacks and Whites isthe leading cause of the substantial Black-White gap in infantmortality. It is for this reason that it has proposed that infantbirth weight be targeted for intervention.
Our second measure is the so-called APGAR score of initialinfant health status. The National Center for Health Statisticsdescribes this measure as a “predictor of the infant’s chances ofsurviving the first year of life” and a “summary measure of theinfant’s condition” [NCHS Vital Statistics Technical Appendix1990]. The APGAR score ranges from 0 to 10 and is calculatedfrom five separate tests of newborn health made both one and fiveminutes after birth. At the time of birth, the doctor assesses eachof the five factors, and gives a score from 0 to 2 for each factor. Thefive health factors are heart rate, respiratory effort, muscle tone,reflex irritability, and color, and the five scores are summed tocalculate the APGAR score.
Since infant death can be extremely rare at birth weightsabove 1500 grams, this measure may provide additional informa-tion on underlying infant health at birth. Although it is highlycorrelated with infant mortality, there is substantial variabilityin APGAR scores among infants who survive their first year oflife, and this variability is highly correlated with different mea-sures of health at birth.15 Also, using data from the NationalMaternal and Infant Health Survey (NMIHS), we find that the
15. In our sample, controlling for infant death in the first year removes 1)under 30 percent of the overall variation in the five-minute APGAR score, 2) 7percent of the variation in APGAR scores at fixed gestation lengths, 2 percent ofthe variation in scores within families. Further, among infants who survive theirfirst year of life, APGAR scores are highly correlated with 1) gestation lengthsacross families in which both twins survive, and 2) assisted ventilator use afterbirth both across families and within twin pairs in which both survive.
1042 QUARTERLY JOURNAL OF ECONOMICS

five-minute APGAR score is a significant predictor for measuresof health, cognitive ability, and behavioral problems of the childat age three, after controlling for family background variablesand infant birth weight.16 We conclude that APGAR scores con-tain information on infant health that is independent of infantmortality.
Our third outcome measure is the newborn’s utilization of aventilator for assisted-breathing shortly after delivery. This indi-cator incorporates health providers’ subjective assessment of theinfant’s immediate medical needs and hence—indirectly—theirunderlying health. When it is utilized, it can also comprise a largeshare of the overall costs of delivery. It is important to note thatassisted ventilation is administered not simply on the basis ofwhether a newborn is premature. If this were the case, then therewould exist little correlation between its use and IUGR in thefirst place. On the contrary, even after controlling for gestationlength, birth weight is a strong predictor of ventilator use.17 Thisis consistent with what we learned from consultation with Dr.David Rubenstein, director of the Neonatal Intensive Care Unitat Columbia-Presbyterian hospital—that ventilators were origi-nally developed for term babies, and then subsequently expandedto treat preterm babies as well.18
The second through sixth rows of Table I show that there issubstantial within-twin-pair variation in these three measures ofhealth. Intrapair differences in mortality account for 45 to 68percent of the variation in infant death conditional on gestation
16. The NMIHS is one of the only data sets that contain information onAPGAR score and health outcomes subsequent to the first year of life. In theanalysis we adjust for mother’s age (cubic), race, schooling (cubic), householdincome, child’s sex, state of birth, and birth weight. We find that the APGAR scorehas a negative, statistically significant association with the likelihood of havingvarious chronic childhood diseases (e.g., asthma and hearing problems) at agethree. Further, the APGAR score is positively and significantly associated withachieving various developmental milestones (results available from the authors).
17. With our twins sample, a regression of ventilator use on birth weightamong pairs where both twins survived yields a coefficient of �0.084 (per 1000births, per gram) with a standard error of 0.0018. When gestation length dummiesare included the coefficient is �0.426 with a standard error of 0.00314. Further-more, among the more than three million singleton births in 1989 with informa-tion on ventilator use, IUGR infants (those with birth weights less than the tenthpercentile for a given gestational age) are twice as likely to be given assistedventilation and three times as likely to require more than 30 minutes of assistedventilation than non-IUGR infants.
18. The primary cause of respiratory distress among premature infants issurfactant deficiency [Behrman, Kliegman, and Jenson 2000]. There was a sizableincrease in the use of ventilators among preterm infants after the introduction ofsurfactant therapy in late 1989, which led to greatly improved survival ratesamong infants born severely premature.
1043THE COSTS OF LOW BIRTH WEIGHT

length (last column). The within twin-pair variations in APGARscores and ventilator use are similar in magnitude. These find-ings suggest that the factors that cause differences between twinsof the same mother may also be important in explaining across-family differences for infants of the same gestational age. We alsofind that the APGAR score is a substantive predictor of thewithin-twin-pair variation in infant death and ventilator use.Thus, the relatively small birth weight effects that we find do notappear to be the result of either measurement error in the out-comes or behavioral responses of parents and hospitals (e.g.,keeping the twins together).
Our fourth and final outcome measure is a proxy for hospitalcosts. Specifically, we use data on the total charges incurred bythe hospital for the delivery and initial care of the infants, derivedfrom hospital inpatient discharge abstracts. Strictly speaking,the data provide information on hospital charges which areclaimed for billing purposes. Thus, while recognizing that theyare conceptually different, we use the terms “costs” and “charges”interchangeably throughout the paper. When using hospitalcharge data in an analysis of twins, it is important to considerthree potential problems. First, to the extent that hospitals “lumptogether” and “split” charges for twins, even if one twin receivesdifferent medical procedures, there will be little within-pairvariation in charges to explain, thus biasing any result towardzero. As Table I shows, however, the contribution of intrapairvariation to the overall cross-sectional variation in hospitalcharges is about (2.958/14.410) 21 percent; this is comparable inmagnitude to the analogous figures for one-day mortality, five-minute APGAR score, ventilator use, and birth weight.19
Second, there could be sample selection based on whether thecharges were assigned to the mother—whom we generally cannotlink to the infants. This is problematic insofar as this potentialsample selection is correlated with birth weights. We did find,however, that mean birth weights for the twins in the dischargedata are very similar to those in our vital statistics data, whichdoes not suffer from this selection bias. We also find that thepooled cross-sectional and fixed-effects estimates of the relation-
19. Since the discharge data do not contain gestation length information, wecannot compare the intrapair variation in hospital charges to the variation atgiven gestation lengths.
1044 QUARTERLY JOURNAL OF ECONOMICS

ship between birth weight and early-life mortality are similar inthe two data sets.
A third concern is that infants within the same twin-paircould be given treatments that are charged to different payers,who may have different payment schedules.20 For example, if oneof the twin’s charges are billed to the Medicaid program whilethose of the other are not, and this is systematically correlatedwith birth weight, this could cause a bias in the fixed-effectsestimates. To assess the importance of this problem, we regressed1) an indicator of whether the expected payer is the Medicaidprogram, and 2) whether the charge will be “self-paid” on birthweight, with mother fixed effects. In neither of these regressionsare the charges significantly related to birth weight.
Unfortunately, the hospital discharge data used in this study donot contain information on the smoking behavior of the motherduring pregnancy, and, to date, we have not found any study that hasused such data. As a result, we can only examine the direct associa-tion between maternal smoking and three of the outcomes of inter-est. However, the effect of maternal smoking on the use of assistedventilation provides evidence on at least one costly procedure.
II.E. Functional Form Issues
There are a number of important functional form issuesinvolved in estimating equations (3), (4), and (5). First, the rela-tionships between birth weight and various health and cost out-comes may be nonlinear. Thus, we additionally estimate fixed-effects models that include a set of dummy variables for discretebirth weight categories, given by
(6) hij � � � �k
Dijk�k � X�i� � ai � εij,
where Dijk is an indicator variable that is equal to one if the jth
infant of the ith mother is in the kth (out of 200) quantile of theoverall birth weight distribution.21 We plot the entire set of esti-mated coefficients of �k to give a complete picture of the effects atdifferent parts of the birth weight distribution.
To quantify the slopes of the relationship throughout thebirth weight distribution, we simply replace ¥k Dij
k �k in (6) with
20. Approximately 4 percent of the matched twin pairs have different ex-pected payers.
21. For the pooled singletons’ plots, we used 655 quantiles of the conditionaldistribution of birth weights below 3000 grams.
1045THE COSTS OF LOW BIRTH WEIGHT

a piecewise linear spline specification with break points at 600,800, 1000, 1500, 2000, 2500, and 3000 grams, and report the slopecoefficients for each segment. For all health and cost outcomes,we use least squares to estimate these equations with and with-out fixed effects. For the binary outcome variables, mortality andventilator use, we also estimate the above specifications by logitand fixed-effects conditional logit to examine sensitivity to thespecification of the probability model.
Finally, for the maternal smoking analysis, we implement apropensity score procedure. The most flexible way to incorporatecovariates is to simply compute smoking-nonsmoking differencesfor each distinct value of the observed covariates X, and averagethose differences. Due to the high dimension of X, we instead usea propensity score approach [Rosenbaum and Rubin 1983]. Spe-cifically, we estimate a logit model that predicts the probability ofmaternal smoking during pregnancy based on all of the “pretreat-ment” covariates that have been determined prior to pregnancy.These include mother’s and father’s age, education, and race,marital status, number of previous live births and terminations,prenatal care usage, months since last birth, immigrant status,county of birth, indicators for previous births over 4000 grams orLBW, indicators for alcohol use, and indicators for medical riskfactors. We then group the predicted probabilities of smoking foreach observation, i.e., the propensity score, into 200 equal-sizedbins from the overall distribution of propensity scores. To graph-ically illustrate the estimated “treatment” effects, we present theaverage outcomes for both smokers and nonsmokers in each of the200 cells in which the propensity score is held constant.
III. DATA AND SUMMARY OF DIFFERENCES BETWEEN TWINS
We utilize two different data sources on twin births. The firstis the annual, linked birth and infant death micro data producedby the National Center for Health Statistics (NCHS). These filesprovide detailed information on the population of U. S. twinbirths and death information for those who die within their firstyear of life. The second is the Healthcare Cost and UtilizationProject (HCUP) State Inpatient Database, produced by the De-partment of Health and Human Services. The HCUP databasecontains detailed information collected from hospital dischargeabstracts in participating states.
1046 QUARTERLY JOURNAL OF ECONOMICS

III.A. Linked Birth-Infant Death Data: 1983–1985, 1989–1991,1995–1997
These micro data files provide detailed information on theuniverse of births occurring each year in the United States, asreported on birth certificates, linked to death certificate informa-tion for the infants who die in their first year of life. The natalityportion of the linked data provides socioeconomic and demo-graphic information on each mother giving birth, including ma-ternal age, race, educational attainment, marital status, child-bearing history, prenatal care, and geographic residence. Begin-ning in 1989, the files also contain information on mother’stobacco use during pregnancy. Information on the father includesage, race, education, and Hispanic origin. The natality portionalso includes detailed information on the newborn infant, includ-ing baby’s sex, race, gestational age, birth weight, APGAR scores,use of assisted ventilation, and plurality; i.e., whether the infantwas part of a multiple birth.
For the infants who die by the age of one, NCHS matchesdetailed information drawn from death certificates to the corre-sponding birth record. This information includes the infant’s ageat death in days, where the death occurred, and the precise causeof death. Annual linked birth/infant death files are available from1983 through to the present, with the exception of the years 1992,1993, and 1994, when only “unlinked” natality and mortalitydetail files are available. In the 1989 birth cohort, for example,approximately 97.4 percent of the 38,605 infant death records arematched to one of the 4,045,881 natality records.
Our main analysis of twins takes advantage of a usefulaspect of the infant birth/death data: beginning with the 1989 file,records for twin pairs are located next to each other. This fact,combined with detailed parental and pregnancy characteristics,allowed us to easily construct twin-pairs. The precise algorithm isdescribed in the Data Appendix. An alternative approach tomatching twins (also described in the Data Appendix) is to matchinfants with identical parental covariates among the subsampleof records identified to be a multiple-birth event. It was necessaryto use this procedure for the earlier, 1983–1985 data, since twinrecords were not adjacent in those data. Subsequent to our initialanalysis in Almond, Chay, and Lee [2002], the NCHS released the1995–1997 Matched Multiple Birth Data Set, which uses a “co-variate-matching” algorithm that is similar to the procedure that
1047THE COSTS OF LOW BIRTH WEIGHT

we used for the 1983–1985 data.22 We have investigated thesensitivity of our results to our initial (record-adjacency) algo-rithm, our own covariate-matching algorithm, and the algorithmused by the NCHS: all algorithms yield nearly identical results.Finally, it is important to note that any false matching of infantsto twin-pairs will tend to bias the within-twin estimate towardthe pooled cross-sectional estimate; thus, any difference betweenthe fixed-effects and cross-sectional estimates will, if anything, bean understatement of their true difference.
III.B. Healthcare Cost and Utilization Project Data: 1995–2000
The HCUP state inpatient database contains detailed infor-mation from the universe of hospital discharge abstracts in par-ticipating states. In 1995, discharge data for thirteen states areavailable with approximately 14 million records. In 2000, eigh-teen states provided data with approximately 16.5 million dis-charge records. According to HCUP, approximately 80 percent ofall U. S. hospital discharges are covered in their data.
The HCUP data include detailed information on hospitalstays and patient characteristics. Clinical information includesthe diagnosis, course of treatment, information on the attendingphysician, primary surgeon, the length of hospital stay, chargesincurred during hospitalization, and the disposition of the patientat discharge. Core demographic information on the patient is alsoprovided, including the age, race, and sex, and geographic resi-dence of each patient. Finally, information on the timing of ad-mission, discharge, hospital at which treatment occurred, and theexpected payment source is also included.
For the purposes of this study, the key data elements are thebirth weight of newborn infants, the diagnosis (used to select twinbirths, as described in the Data Appendix), and the chargesincurred in the course of treatment. The availability of individualdata elements varies by state. Only five of the eighteen statesprovide information on birth weight: Arizona, Colorado, Mary-land, New Jersey, and New York. Of these five states, our analy-sis uses 1995–2000 discharge data from New York and NewJersey, which comprise almost one-quarter of all available dis-charge records in 2000. We also examined the discharge datafrom Maryland, which provided nearly identical results (available
22. These data are used in Conley, Strully, and Bennett [2003a, 2003b].
1048 QUARTERLY JOURNAL OF ECONOMICS

from the authors).23 We use a covariate-matching approach toconstruct a data set of 44,410 (non-Hispanic White and Black)newborn twins in New Jersey and New York between 1995 and2000. The details of the matching algorithm are described in theData Appendix.
III.C. Twins Compared with Singletons
Although twins represent a small subpopulation of all infantsborn in the United States, they are of great interest in the healthand biomedical literatures for several reasons. First, while con-stituting 3 percent of all births in the United States in 1997,twins accounted for 21 percent of all LBW births, 14 percent ofpreterm births, and 13 percent of all infant deaths [Kogan et al.2000].24 Further, Kogan et al. find that multiple births haveaccounted for an increasing share of all LBW infants over the pasttwenty years. Since LBW is strongly associated with increasedrisk of infant mortality and subsequent developmental difficul-ties, several researchers have suggested that the rising incidenceof twin births is an important public health problem.25 Finally,several studies suggest that interventions that decrease infantmortality among twins should be applicable to other high-riskgroups (e.g., Fowler et al. [1991]).
Table II provides summary statistics for both singleton andtwin births for one of the years of data used in our analysis, 1989.It highlights some of the main similarities and dissimilaritiesbetween the two populations. Mothers of singleton and twin in-fants have comparable demographic characteristics, along withrace, age, and education. Owing to the large sample sizes, thedifferences are statistically significant, but the means are simi-lar—mothers of twins are slightly more likely to be Black, older,
23. As more than half of the Arizona discharge records are missing informa-tion on birth weight, Arizona is excluded from the analysis, along with Colorado,which has the smallest sample size (15 percent of the New York sample). We donot include Maryland in our analysis since the (location-based) algorithm used tomatch Maryland twins is different from the algorithm (location- and covariate-based) used to match New York and New Jersey twins.
24. In the 1989–1991 sample, twins account for over 2 percent of all births,15 percent of LBW births, and 10 percent of all infant deaths in the United States.
25. For example, Behrman and Rosenzweig [2001] calculate that twinningresults in a 12 percent reduction in lifetime earnings when compared with sin-gleton births due to their (28-ounce) lower birth weights. They conclude that thegrowing incidence of twin births resulting from the increased use of fertilityprocedures among older women imposes significant costs on children’s futuredevelopment.
1049THE COSTS OF LOW BIRTH WEIGHT

TABLE IISAMPLE MEANS FOR SINGLETONS AND TWINS IN THE 1989 LINKED
NATALITY-MORTALITY DETAIL FILE
Sample means T-ratiofor diff in
sample meansSingletons Twins
Mother’s demographic characteristicsFraction Black 0.195 0.219 14.1Education 12.8 13.0 22.2Fraction high school dropout 0.184 0.157 17.3Fraction college graduate 0.187 0.212 15.2Age 26.3 27.4 51.3Fraction teenager 0.129 0.078 45.8Fraction 30 or older 0.289 0.360 35.5Fraction married 0.736 0.746 5.1
Mother’s risk factorsFraction prenatal care 0.982 0.982 0.4Number of prenatal visits 11.2 12.4 49.7Pregnancy-associated hypertension 0.030 0.067 35.1Anemia of mother 0.018 0.035 21.0Fraction smoke during pregnancy 0.212 0.201 5.4
Characteristics of birthFraction male 0.512 0.504 4.1Breech birth 0.035 0.256 119.5Abnormal conditions of newborn 0.055 0.148 62.9Assisted ventilation ( 30 minutes) 0.011 0.024 20.4Assisted ventilation (�30 minutes) 0.006 0.038 40.1Congenital anomaly 0.019 0.027 12.4
Infant deaths (per 1000 live births)Within 1 year of birth (infant mortality) 8.46 38.71 37.7Within 24 hours of birth 2.73 19.27 29.0Within 7 days 3.99 26.92 34.1Within 28 days (neonatal) 4.99 30.62 35.828 days to 1 year (postneonatal) 3.49 8.19 12.5
Sample size 2,655,977 58,132Infant birth weight (grams)
Mean 3,369 2,417 339.6(591) (670)
Median 3,402 2,49525th percentile 3,060 2,07010th percentile 2,693 1,5035th percentile 2,410 1,0801st percentile 1,430 501Fraction low birth weight ( 2500 g) 0.061 0.504
1050 QUARTERLY JOURNAL OF ECONOMICS

more educated, and married. In addition, they are more likely tobe anemic and have pregnancy-associated hypertension.
There are several, important differences between the two infantpopulations. First, twins are much more likely to die within one day,one week, one month, and one year of birth than singletons. Inaddition, twins tend to be lighter, with mean birth weights about950 grams lower than singleton newborns. As Table II shows, the
TABLE IICONTINUED
Sample meansT-ratio for diff in
sample meansSingletons Twins
Gestation length (in weeks)Mean 39.3 36.0 201.2
(2.65) (3.85)Median 40 3725th percentile 38 3410th percentile 37 315th percentile 35 281st percentile 29 23
1-minute APGAR score (0–10)Mean 8.02 7.30 79.9
(1.35) (1.97)Median 8 825th percentile 8 710th percentile 7 45th percentile 5 31st percentile 2 1
5-minute APGAR score (0–10)Mean 8.97 8.52 70.2
(0.81) (1.40)Median 9 925th percentile 9 810th percentile 8 75th percentile 8 61st percentile 6 1
Fraction of dead with birth weight 2500 gInfant mortality 0.57 0.93Within 24-hour mortality 0.89 0.98Neonatal mortality 0.76 0.97Postneonatal mortality 0.30 0.79
Sample size 2,655,977 58,132
Data come from the National Center of Health Statistics 1989 Linked Birth-Infant Death Detail File. Thesample is restricted to non-Hispanic, Black and White mothers born in the United States. The standarddeviations of the means are in parentheses.
1051THE COSTS OF LOW BIRTH WEIGHT

entire distribution of twin birth weights is shifted leftward in com-parison to the singleton distribution. Indeed, the median twin wouldbe considered a LBW baby. These two facts have been previouslycited as evidence that birth weight differences may indeed be acause of the twin-singleton gap in infant mortality.
However, the table also shows substantive differences in thegestation lengths of twin and singleton births. The median twin isborn prematurely, and the difference in the distributions of ges-tation length is similar to that for birth weight. There are alsolarge differences in APGAR scores, the incidence of a breechbirth, and the incidences of abnormal conditions and congenitalanomalies at birth. Thus, along many measures, twins tend to beless healthy at birth than singletons.
The prevalence of twins with low weights is helpful for theidentification of the birth weight effects. This is especially relevantsince the cross-sectional relation between birth weight and adverseoutcomes among singletons is steeper at very low weights (as shownin Figure I). Further, the cross-sectional relation between infantmortality and gestation length differs for twins and singletons.
Figure V in Appendix 2 plots the average birth weight andinfant mortality rate for the twin and singleton populations in 1989,by infant gestation length. At gestation lengths below 27 weeks,there is a statistically significant, twin-singleton gap in infant mor-tality. This gap is similar for those born at 20–23 weeks comparedwith those born at 24–26 weeks, even though the birth weightdifference grows from less than 100 grams to about 250 grams. Inaddition, the twin-singleton difference in infant mortality is insig-nificant at 28 to 38 weeks of gestation (and changes sign for 31–37weeks), even as the birth weight difference grows to well over 500grams (over one pound). Taken literally, these results suggest thateither: 1) birth weight per se is not the cause of the twin-singletoninfant mortality gap, or 2) the effects of birth weight on infantmortality only exist for infants born at less than 27 weeks of gesta-tion or born with a birth weight below 1000 grams.26
In view of these differences, we do two things when reportingour results. First, we compare the fixed-effects estimates to the
26. Two-thirds of the estimated association between the twin-singleton differ-ence in birth weight and the infant mortality difference can be explained by twin-singleton differences in gestation length, measured in weeks (results available fromthe authors). Loos et al. [2005] conclude that the factors underlying twin-singletondifferences in intrauterine growth include peripheral umbilical cord insertion, fusionof placentas, chorionicity, and limited uterine size of the mother.
1052 QUARTERLY JOURNAL OF ECONOMICS

FIGURE IaHospital Costs and Birth Weight
Note: 1995–2000 NY/NJ Hospital Discharge Microdata.
FIGURE IbInfant Mortality (1-year) and Birth Weight
Note: Linked Birth-Death certificate data, 1989.
1053THE COSTS OF LOW BIRTH WEIGHT

pooled cross-sectional estimates for the same twins population.This ensures that the differences between the two sets of esti-mates can be attributed to the presence of omitted variables,rather than to a changing population. Second, we compare thepooled cross-sectional estimates for the twins with that for thesingleton population. The extent to which they are similar cansuggest that twins are subject to the same LBW-outcome relation(equation (1)) and to the same kinds of omitted variable biases(equation (2)) as singletons.
Finally, in our analysis we present results that both include andexclude pairs where at least one twin has a congenital anomaly,which is a defect present at birth. These include genetic defects anddisorders, but also include conditions that could plausibly be theresult of damage incurred during fetal development.27 Thus, in aneffort to make our analysis more relevant for evaluating policies thatfocus on influencing birth weight per se, we present both sets ofresults. As we show below, the exclusion of pairs of infants withcongenital anomalies reduces the magnitudes of the birth weightcoefficients further. For cost-benefit calculations, we use the coeffi-cients for the entire sample to give a conservative, understated viewof the importance of omitted variables.
IV. EMPIRICAL RESULTS
IV.A. Main Twins Results
Table III reports the coefficients from linear regressions ofseveral different outcomes on birth weight (in grams) for differentsamples of twin pairs. The health outcomes data are for all twinsborn in the United States between 1989 and 1991, and the hos-pital costs data are for twins born in New York and New Jerseybetween 1995 and 2000. The cross-sectional OLS estimates in thefirst column indicate that a one standard deviation increase inbirth weight (667 grams or one pound and seven ounces) isassociated with a decrease in hospital costs of about $19,500 (in$2000), or about 0.51 of a standard deviation. When mother fixed
27. For all congenital malformations, there is a higher concordance amongmonozygotic than dizygotic twins (e.g., five times greater for cleft palate), sug-gesting that malformation differences within twin pairs are partially due togenetic differences [Bryan 1992]. However, for many malformations, MZ twins aremore likely than not to be discordant.
1054 QUARTERLY JOURNAL OF ECONOMICS

TABLE IIIPOOLED OLS AND TWINS FIXED EFFECTS ESTIMATES OF THE EFFECT OF BIRTH WEIGHT
Birth weightcoefficient
Including congenitalanomalies
Excluding congenitalanomalies
Pooled OLS Fixed effects Pooled OLS Fixed effects
Hospital costs �29.95 �4.93 — —(in 2000 dollars) (0.84) (0.44) — —
[�0.506] [�0.083] — —Adj. R2 0.256 0.796 — —Sample size 44,410 44,410 — —
Mortality, 1-year �0.1168 �0.0222 �0.1069 �0.0082(per 1000 births) (0.0016) (0.0016) (0.0017) (0.0012)
[�0.412] [�0.078] [�0.377] [�0.029]Adj. R2 0.169 0.585 0.164 0.629Sample size 189,036 189,036 183,727 183,727
Mortality, 1-day �0.0739 �0.0071 �0.0675 �0.0003(per 1000 births) (0.0015) (0.0010) (0.0015) (0.0006)
[�0.357] [�0.034] [�0.326] [�0.001]Adj. R2 0.132 0.752 0.127 0.809Sample size 189,036 189,036 183,727 183,727
Mortality, neonatal �0.105 �0.0154 �0.0962 �0.0041(per 1000 births) (0.0016) (0.0013) (0.0016) (0.0008)
[�0.415] [�0.061] [�0.38] [�0.016]Adj. R2 0.173 0.683 0.169 0.745Sample size 189,036 189,036 183,727 183,727
5-min. APGAR score 0.1053 0.0117 0.1009 0.0069(0–10 scale,divided by 100)
(0.0011) (0.0012) (0.0011) (0.0011)[0.506] [0.056] [0.485] [0.033]
Adj. R2 0.255 0.663 0.248 0.673Sample size 159,070 159,070 154,449 154,449
Ventilator incidence �0.0837 �0.0039 �0.081 �0.002(per 1000 births) (0.0015) (0.0017) (0.0015) (0.0016)
[�0.228] [�0.011] [�0.221] [�0.005]Adj. R2 0.052 0.706 0.05 0.716Sample size 189,036 189,036 183,727 183,727
Ventilator �30 min. �0.0724 0.0006 �0.0701 0.0016(per 1000 births) (0.0013) (0.0013) (0.0014) (0.0012)
[�0.252] [0.002] [�0.244] [0.006]Adj. R2 0.063 0.724 0.062 0.739Sample size 189,036 189,036 183,727 183,727
See notes to Tables I and II. The data come from the 1989–1991 Linked Birth-Infant Death Detail Files andthe 1995–2000 HCUP Inpatient Database for New York and New Jersey. The first two columns use samples thatinclude twin pairs in which one or both twins either had a congenital anomaly at birth or whose cause of deathwas a congenital anomaly. The second two columns exclude these twin pairs from the analysis. The HCUP datado not contain information on congenital anomalies. The standard errors are in parentheses and are corrected forheteroskedasticity and within-twin-pair correlation in the residuals. For APGAR score, the coefficients are scaledup by 100. Numbers in square brackets indicate effect size in terms of standard deviations of the outcome per onestandard deviation in birth weight (667 grams). There are no other variables included in the regressions.
1055THE COSTS OF LOW BIRTH WEIGHT

effects are included in the second column, the costs estimate fallsby a factor of 6, implying a $3200 decrease in hospital costs.
A similar dramatic drop in the magnitudes occurs for theother outcomes. The first and second columns show that thecoefficients for mortality within one year, one day, one monthfall—when including mother fixed effects—by factors of 5, 10, and7, respectively. The parameter estimate for five-minute APGARscore similarly falls by a factor of 9. The magnitude for ventilatoruse falls by a factor of 20, and the point estimate for ventilator usefor more than 30 minutes is statistically insignificant.
The third and fourth columns illustrate the sensitivity of thefixed effects estimates to the inclusion of twin pairs with congen-ital anomalies. Overall, the coefficients in the third column fall byno more than 10 percent, compared with those in the first column.On the other hand, the exclusion of these cases (which make upabout 3 percent of the sample) cause the fixed-effects estimates tofall by additional factors of 2 or 3 (compared with those in thesecond column). After excluding these pairs, neither of the coef-ficients in the ventilator use regressions is statistically signifi-cant. The fixed effects estimates for the full sample are 5 to 20times smaller in magnitude than the cross-sectional estimates,and they are 14 to 40 times smaller than in the cross section forthe sample excluding “anomalous” pairs.28
We conclude that a substantial portion of the remaining within-twin correlation between birth weight and the outcomes is driven byone of the twins having a congenital abnormality. Since many birthdefects (for example, Down’s syndrome) are clearly not the result oflow birth weight, we believe that cases that can be identified ascongenital anomalies at birth should be excluded from the analysis.Nevertheless, since we do not have the congenital anomaly variablein the HCUP data, and to be more conservative in our conclusions,our cost calculations use the estimates from the sample that in-cludes the pairs with congenital abnormalities.
Figures I and II present our graphical analysis of the birthweight effects that allow for very flexible relationships betweenbirth weight and the outcomes of interest. In each figure the solidcircles are the means of the outcome, by quantiles (200 of them)of the birth weight distribution. The solid squares are the corre-sponding fixed-effects estimates, that is, the estimated coeffi-
28. Adding controls for infant gender and birth order to the regressionsresults in nearly identical findings.
1056 QUARTERLY JOURNAL OF ECONOMICS

FIGURE IIaFive-minute APGAR Score and Birth Weight
Note: Linked Birth-Death certificate data, 1989.
FIGURE IIbAssisted Ventilation (30 minutes or more) and Birth Weight
Note: Linked Birth-Death certificate data, 1989.
1057THE COSTS OF LOW BIRTH WEIGHT

cients �k from the specification in equation (6).29 When data oncongenital anomalies are available, the solid triangles are thefixed-effects estimates when infants with those anomalies (andtheir cotwins) are excluded from the sample.
In Figure Ia the cross section reveals a peak in costs forhospital services of $160,000 for a twin infant weighing nearly800 grams at birth, and a steady and significant decline in costswith increases in birth weight.30 The fixed effects estimates re-veal a substantially smaller effect throughout the 800 to 2000gram range of birth weights. The contrast between the cross-sectional and fixed-effects associations is more pronounced inthe 2000 to 2500 gram range. For the cross section the decreasein costs continues to be substantial until the 2500 gram mark.By comparison, the fixed-effects estimates are relatively flatthroughout that range of birth weights.
Figure Ib shows qualitatively similar results for mortalityrates within one year of birth.31 In the cross section the relation-ship between birth weight and mortality is steepest in the 300 to1000 gram range. This is also the range of birth weights in whichthe differences between the cross-sectional and fixed-effects gra-dients are the largest; that is, the fixed effects slopes are substan-tially smaller in magnitude than the cross-sectional slopes. Onthe other hand, the fixed-effects and cross-sectional gradients aresimilar in the 1000 to 1500 gram range.
The results for the five-minute APGAR score in Figure IIashow significant differences between the cross-sectional andfixed-effects “response functions” throughout the birth weightdistribution. In the cross section the APGAR-birth weight rela-tion is strongly positive even at birth weights well above 1000
29. The average of the mother-specific intercepts is used in reporting the results.30. The rise in costs in the 300 to 800 gram range is likely due to a simple
selection effect, as babies born in that weight range are highly likely to die soonafter birth, and therefore accumulate fewer charges for hospital services. In theHCUP data, we find infant death rates before discharge that are very consistentwith this selection effect.
31. Even though IUGR is emphasized in the literature, studies that havecomputed cost implications have not used LBW variation conditional on gestationlength. To be consistent with this convention, our cross-sectional estimates do notinclude controls for gestation length. For completeness, however, we also derivedcross-sectional estimates and figures that are adjusted for a full set of gestation-length (at the week level) dummies; the HCUP data do not include gestationlength information. The results for infant mortality, five-minute APGAR score,and assisted ventilation are qualitatively similar to those presented here—con-trolling for mother fixed effects significantly reduces the implied “impact” of birthweight relative to cross-sectional estimates that are adjusted for gestation length(results available from the authors).
1058 QUARTERLY JOURNAL OF ECONOMICS

grams. The fixed-effects estimates reveal a somewhat positiverelation in the 300–800 gram range, but little relation at birthweights above 800 grams.32
There are more striking differences between the cross-sec-tional and fixed-effects profiles for the use of a ventilator forassisted breathing in Figure IIb. In the cross section ventilatoruse for more than 30 minutes, which is considered a strongerindicator of initial health problems than overall ventilator use, isstrongly negatively related to birth weight in the 800 to 2500gram range.33 By comparison, the fixed effects estimates revealessentially no relation between birth weight and the use of thisexpensive procedure.
Figures Ib, IIa, and IIb also show that excluding the smallnumber of infants with congenital anomalies tends to furtherflatten the birth weight–outcome profiles. Based on this pat-tern—and the qualitative similarity between the ventilator andhospital costs profiles—it seems plausible that the fixed-effectsprofile for costs at discharge is also partially driven by thesecongenital anomaly cases.
Finally, Figures I and II also present the cross-sectionalrelations for the population of singleton births, represented bythe open circles. For every outcome that we examine, the birthweight profiles for the singletons’ population are virtually iden-tical to the cross-sectional profiles for the twins’ population. Thisis consistent with the notion that the cross-sectional relationshipsfor singletons are subject to omitted variables biases of the samemagnitude as for the twins population. Strictly speaking, how-ever, we cannot rule out the possibility that singletons and twinshave very different “structural” relations between birth weightand health outcomes, and also have different omitted variablesthat offset each other to yield a similar cross-sectional reduced-form relationship. This is one of the reasons why it is instructiveto examine the singleton population by itself, using a completelydifferent source of birth weight variation, as we do with maternalsmoking in subsection IV.C.
32. We find very similar results for the one-minute APGAR score (see Al-mond, Chay, and Lee [2002]).
33. Again, the hump-shaped pattern at extremely low birth weights can beexplained by a selection effect in which these babies die before having the oppor-tunity to use a ventilator for assisted breathing. Almond, Chay, and Lee [2004]document very similar results for overall incidence of ventilator use.
1059THE COSTS OF LOW BIRTH WEIGHT

IV.B. Magnitudes of the Twins Effects
Table IV presents estimates of the implied impact of birthweight in terms of its effect on the outcomes per gram of birthweight. Since the effects are highly nonlinear, we estimate piece-wise linear splines with knot points at 600, 800, 1000, 1500, 2000,2500, and 3000 grams. The table reports the slope coefficients foreach segment of the spline, for both the cross-sectional OLS andfixed-effects specifications applied to the full samples of twins.
First, we consider the results for costs incurred by the hos-pital before discharge. In Table IV the cross-sectional estimateimplies that each gram increase in birth weight is associated witha $30 reduction in hospital costs, whereas the fixed effects esti-mate implies a $5 cost reduction. Table IV shows that even as themarginal effect of birth weight on costs varies significantly acrossthe birth weight distribution, the fixed-effects estimates are con-siderably smaller in magnitude than the corresponding “pooledcross-section” estimates. For the birth weight range of 800 to2500 grams, the fixed-effects coefficients are 3.1 to 5.7 timessmaller than the pooled coefficients. In the 2500–3000 gramrange, the pooled coefficient implies a statistically significant $5reduction in costs for every added gram in weight, but the corre-sponding fixed effects estimate implies a point estimate of no costsavings.
The next sets of columns in Table IV show qualitativelysimilar results for any ventilator use and ventilator use for morethan 30 minutes. The fixed-effects slope coefficients are statisti-cally insignificant throughout the birth weight distribution. Forthe APGAR score, the fixed-effects coefficients are 3 to 20 timessmaller than the cross-sectional coefficients.
For infant mortality in the final two columns, the differencesbetween the cross-sectional and fixed-effects estimates are par-ticularly large at birth weights below 1000 grams. For example,in the 600 to 800 gram range, the cross-sectional estimate is�2.11 per 1000 live births, while the fixed-effects estimate is�0.42. On the other hand, in the 1000–1500 gram range thecross-sectional and fixed-effects estimates are �0.23 and �0.17,respectively.
When interpreting their magnitudes, these two sets of esti-mates must be placed within the context of the highly nonlinearrelationship illustrated in Figure Ic. For example, consider a 200gram increase in birth weight. In the 600–800 gram range, the
1060 QUARTERLY JOURNAL OF ECONOMICS

TA
BL
EIV
PIE
CE
WIS
EL
INE
AR
SP
LIN
EE
ST
IMA
TE
SO
FT
HE
EF
FE
CT
OF
BIR
TH
WE
IGH
TO
NH
OS
PIT
AL
CO
ST
SA
ND
INF
AN
TH
EA
LT
H
Dep
ende
nt
vari
able
Per
cen
t
Hos
pita
lco
sts
Ven
tila
tor
(an
y)V
enti
lato
r(�
30m
in.)
AP
GA
R(5
-min
ute
)M
orta
lity
(1-y
ear)
Un
its
Dol
lars
per
gram
Usa
gepe
r10
00bi
rth
spe
rgr
amU
sage
per
1000
birt
hs
per
gram
Sco
reti
mes
1000
per
gram
Dea
ths
per
1000
birt
hs
per
gram
Bir
thw
eigh
tse
gmen
tP
oole
dF
.E.
Poo
led
F.E
.P
oole
dF
.E.
Poo
led
F.E
.P
oole
dF
.E.
60
0g
0.18
428.
0924
7.79
0.79
950.
2718
0.74
340.
2361
12.2
64.
41�
0.57
54�
0.44
00(3
9.56
)(9
9.35
)(0
.064
0)(0
.101
2)(0
.057
8)(0
.096
9)(0
.39)
(1.0
2)(0
.064
0)(0
.156
0)60
0–80
0g
0.16
186.
59�
270.
300.
3027
�0.
0052
0.23
690.
0261
9.38
2.19
�2.
1122
�0.
4197
(62.
03)
(133
.79)
(0.1
022)
(0.0
914)
(0.0
970)
(0.0
891)
(0.5
8)(1
.06)
(0.0
913)
(0.2
139)
800–
1000
g0.
19�
212.
77�
49.7
5�
0.21
64�
0.07
72�
0.21
36�
0.05
493.
040.
16�
1.13
02�
0.43
32(4
7.89
)(6
7.31
)(0
.086
3)(0
.079
7)(0
.081
5)(0
.079
2)(0
.40)
(0.8
1)(0
.075
2)(0
.166
9)10
00–1
500
g0.
55�
121.
20�
36.8
8�
0.22
16�
0.00
05�
0.21
240.
0168
2.12
0.60
�0.
2258
�0.
1693
(7.5
7)(9
.89)
(0.0
218)
(0.0
243)
(0.0
201)
(0.0
232)
(0.0
9)(0
.22)
(0.0
144)
(0.0
336)
1500
–200
0g
1.11
�74
.27
�24
.07
�0.
2121
�0.
0063
�0.
1891
�0.
0018
0.98
0.18
�0.
0279
�0.
0391
(2.5
0)(2
.95)
(0.0
110)
(0.0
137)
(0.0
096)
(0.0
118)
(0.0
4)(0
.09)
(0.0
051)
(0.0
123)
2000
–250
0g
3.95
�18
.19
�3.
21�
0.06
71�
0.00
91�
0.04
690.
0008
0.51
0.14
�0.
0146
�0.
0113
(0.8
4)(0
.89)
(0.0
052)
(0.0
067)
(0.0
038)
(0.0
050)
(0.0
2)(0
.04)
(0.0
022)
(0.0
051)
2500
–300
0g
15.5
4�
5.19
0.58
�0.
0206
�0.
0009
�0.
0128
0.00
140.
270.
05�
0.00
76�
0.00
43(1
.45)
(0.5
6)(0
.003
4)(0
.005
0)(0
.002
0)(0
.003
2)(0
.02)
(0.0
3)(0
.002
0)(0
.003
4)�
3000
g78
.31
6.66
1.37
�0.
0035
�0.
0012
�0.
0027
�0.
0033
�0.
02�
0.02
0.01
20�
0.00
19(3
.31)
(0.8
3)(0
.003
3)(0
.005
3)(0
.001
6)(0
.003
1)(0
.02)
(0.0
3)(0
.003
8)(0
.003
6)O
bser
vati
ons
44,4
1044
,410
189,
036
189,
036
189,
036
189,
036
159,
070
159,
070
189,
036
189,
036
Cos
tsda
taco
me
from
1995
–200
0N
Y/N
JH
CU
Pda
ta.T
he
rem
ain
ing
colu
mn
su
seth
e19
89–1
991
lin
ked
Bir
th-I
nfa
nt
Dea
thfi
les.
En
trie
sar
eth
esl
ope
coef
fici
ents
wit
hin
each
birt
hw
eigh
tse
gmen
tfr
ompi
ecew
ise
lin
ear
spli
ne
spec
ifica
tion
s.T
he
Per
cen
tco
lum
nco
nta
ins
the
perc
enta
ges
ofal
lsin
glet
onbi
rth
sin
1989
wit
hbi
rth
wei
ghts
inth
eco
rres
pon
din
gbi
rth
wei
ght
segm
ent.
Poo
led
isor
din
ary
leas
tsq
uar
esap
plie
dto
the
pool
edda
ta.T
he
F.E
.col
um
ns
incl
ude
mot
her
fixe
def
fect
s.S
tan
dard
erro
rsar
ein
pare
nth
eses
and
are
corr
ecte
dfo
rbo
thw
ith
in-t
win
-pai
rco
rrel
atio
nan
dh
eter
oske
dast
icit
y.T
her
ear
en
oot
her
vari
able
sin
clu
ded
inth
ere
gres
sion
s.
1061THE COSTS OF LOW BIRTH WEIGHT

cross-sectional estimate implies a decrease in the probability ofdeath of 42 percent; the corresponding fixed effects estimateimplies a decrease of 8.4 percent. On the other hand, that same200 gram increase in the 1000–1500 gram range implies de-creases in the probability of death of 4.5 and 3.4 percent for thecross-sectional and fixed-effects estimates, respectively.
Table V summarizes the excess costs associated with low birthweight, as implied by both the cross-sectional and fixed-effects esti-mates. For every infant born under 2500 grams in the NCHS birthcertificate files (1989–1991), we calculated how much money wouldbe “saved” by raising their weight to 2500 grams. That is, we im-puted the hospital costs in excess of the costs associated with 2500grams for every infant, using the slope coefficients in the first twocolumns of Table IV. Table V reports the average imputed valuewithin each birth category. In each category above 600 grams, thefixed-effects estimates imply significantly smaller excess costs asso-ciated with low birth weight.34 For example, the cross-sectionalestimates imply that increasing the weight of a typical baby born inthe 800–1000 gram range to the “normal” weight range would saveover $127,000 in hospital charges. However, the fixed-effects esti-mates imply a cost savings of $37,000.
Also, the degree of omitted variables bias appears to grow larger
34. The smaller excess costs among infants born below 600 grams are due tothe “perverse” birth weight effects for babies born under 800 grams that aredocumented in Figure Ia and Table IV.
TABLE VIMPLIED EXCESS HOSPITAL COSTS ASSOCIATED WITH LOW BIRTH WEIGHT,
POOLED VERSUS FIXED EFFECTS ESTIMATES
Birth weightsegment
Percent ofsingleton births
Excess hospital costs
Pooled Fixed effects
600 g 0.18 $51,803 $61,213600–800 g 0.16 $131,589 $67,816800–1000 g 0.19 $127,190 $36,8461000–1500 g 0.55 $74,706 $22,3091500–2000 g 1.11 $25,137 $6,8062000–2500 g 3.95 $3,417 $604
The entries represent the average reduced hospital costs associated with increasing an infant’s birth weightfrom the given birth weight category to above 2500 grams. These are calculated using the estimated splinecoefficients in Table VI. The Percent of singleton births column provides the percentages of all singleton births in1989 with birth weights in the corresponding birth weight segment. The costs figures are in year 2000 dollars.
1062 QUARTERLY JOURNAL OF ECONOMICS

in higher birth weight categories. For example, the implied excesscosts among infants born in the 1500–2000 gram range are 3.7times smaller for the fixed effects estimates relative to the cross
FIGURE IIIaDifference between Smokers and Nonsmokers in Average Birth Weight
by the Propensity Score, Pennsylvania Singletons 1989–1991
FIGURE IIIbDifference between Smokers and Nonsmokers in Low Birth Weight
( 2500 grams) Incidence, Pennsylvania Singletons 1989–1991
1063THE COSTS OF LOW BIRTH WEIGHT

section. For the 2000–2500 gram range, the fixed-effects estimatesare 5.7 times smaller than the cross-sectional estimates.
These differences have striking implications for the calcula-tion of the aggregate costs of LBW in the United States popula-tion. The distribution of birth weights can be applied to thenumbers in Table V to impute the aggregate excess costs for allinfants born below 2500 grams. For twins born in the UnitedStates between 1989 and 1991, the cross-sectional estimates im-ply aggregate costs of LBW of $2.22 billion, while the fixed-effectsestimates imply aggregate costs of $691 million. Table V alsoshows the birth weight distribution for the 2.7 million singletonsborn in 1989 to non-Hispanic, Black and White, native-bornmothers. For singleton births in 1989, the (twins) cross-sectionalestimates imply aggregate costs of LBW of $3.40 billion, while thefixed-effects estimates imply aggregate costs of $1.07 billion.
IV.C. Maternal Smoking Results for Singletons
Figure III graphically depicts a propensity score analysis ofthe empirical association between maternal smoking during preg-nancy and birth weight for the 497,139 singleton births in Penn-sylvania between 1989 and 1991.35 First, we estimated a logitmodel of the propensity to smoke conditional on a multitude of“pretreatment” maternal and family background characteris-tics.36 Then we grouped the estimated propensity scores into 200equal-sized cells and separately calculated the average birthweight of the babies of nonsmoking and smoking mothers in eachcell. Thus, the smoking-nonsmoking birth weight difference ineach cell provides the estimated birth weight effect of maternal
35. We focus on Pennsylvania since there is complete smoking informationfor over 95 percent of the mothers in 1989–1991. In the singleton sample, about21 percent of Pennsylvanian women report smoking during pregnancy. Chay,Flores, and Torelli [2005] find similar results for the other states in whichsmoking reporting was comprehensive—i.e., Florida, Georgia, Illinois, Michigan,North Carolina, and Ohio—and in other years of data.
36. The variables used are mother’s age, education, race, ethnicity, maritalstatus, foreign-born status; father’s age, education, race, and ethnicity; dummies fortrimester of first prenatal care visit, number of prenatal visits, and adequacy of care;controls for alcohol use and number of drinks per week; pregnancy history variables(parity indicator, live birth-order, number of previous births where newborn died,interval since last live birth, indicators for previous birth over 4000 grams andprevious birth preterm or small-for-gestational-age); maternal medical risk factorsthat are not believed to be affected by smoking during pregnancy (anemia, cardiacdisease, lung disease, diabetes, genital herpes, hyrdamnios/oligohydramnios, hemo-globinopathy, chronic hypertension, eclampsia, incompetent cervix, renal disease, Rhsensitization, uterine bleeding); month of birth and county of residence indicators.For the details of the specification, see Chay, Flores, and Torelli [2005].
1064 QUARTERLY JOURNAL OF ECONOMICS

smoking at a constant propensity score. According to the propen-sity score theorem [Rosenbaum and Rubin 1983], this effectivelyadjusts for all bias due to observable confounders.
Figure IIIa plots the 200 smoking-nonsmoking differences inbirth weight, which appear to be tightly scattered at around �200grams, as the quartic polynomial fit illustrates. This difference isconsistent with the regression-adjusted estimate of the birthweight effect of maternal smoking reported in the first row ofTable VI (column 2).37 In addition, it is similar in magnitude tothe birth weight effects documented in the experimental inter-vention literature (e.g., Sexton and Hebel [1984]).
Figure IIIb is analogous to Figure IIIa, but substitutes a binaryindicator for birth weight below 2500 grams as the dependent vari-able. The graph shows a higher incidence of LBW among smokingmothers, by about 3 to 4 percent, which is again consistent with theOLS estimates reported in the second row of Table VI. The LBWdifferential appears to be slightly larger at propensity scores above0.7. A similar analysis finds no evidence of a systematic relationbetween maternal smoking and the incidence of birth weights below1000 grams (see Almond, Chay, and Lee [2004]). Table VI showsthat while there are significant raw differences in the incidences ofbirth weights below 1500 and 1000 grams (column 1), these differ-ences disappear after regression adjustment for maternal and back-ground characteristics (column 2)—maternal smoking only appearsto affect birth weights for infants with weights above 1500 grams. Inaddition, the next rows of Table VI reveal little effect of maternalsmoking on gestation lengths and the likelihood of a prematurebirth.38 Thus, maternal smoking appears to influence intrauterinegrowth rates, but not gestation durations.
Figure IVa is the analogue to Figures IIIa and IIIb, exceptthat the dependent variable is now infant mortality within oneyear of birth. The graph reveals no systematic impact of maternalsmoking on infant mortality throughout the propensity scoredistribution. The bottom two rows of Table VI show that while
37. The regression analysis adjusts for the same variables that are used toestimate the logit propensity score model. The same transformations and inter-actions of the variables are also included.
38. Live births of less than 32 weeks of gestation account for the vastmajority of neonatal deaths and disorders.
1065THE COSTS OF LOW BIRTH WEIGHT

there is a significant raw difference in the infant and neonatalmortality rates of smokers and nonsmokers, this difference dis-appears after regression adjustment.39
39. The results are insensitive to dropping the maternal medical risk factorsfrom the analysis and to dropping all higher-order and interaction terms from theregression specification. Also, we find similar results when analyzing the directassociation between maternal smoking and the outcomes of twins, who are born at
TABLE VIOLS ESTIMATES OF EFFECT OF MATERNAL SMOKING DURING PREGNANCY,
PENNSYLVANIA SINGLETONS 1989–1991
Coefficient on smoking indicator
Unadjusted Adjusted
Impact on birth weightBirth weight �284.8 �203.2
(in grams) (2.07) (2.11)Birth weight 2500 grams 64.0 34.7
(per 1000 births) (1.04) (1.03)Birth weight 2000 grams 19.93 6.30
(per 1000 births) (0.63) (0.62)Birth weight 1500 grams 8.58 0.59
(per 1000 births) (0.44) (0.44)Birth weight 1000 grams 3.99 �0.44
(per 1000 births) (0.31) (0.32)Impact on other outcomesGestation length �0.328 �0.079
(in weeks) (0.010) (0.010)Premature birth ( 32 weeks) 13.05 �0.27
(per 1000 births) (0.55) (0.54)5-min. APGAR score �0.067 �0.010
(0–10 scale) (0.003) (0.003)Ventilator incidence 6.28 1.20
(per 1000 births) (0.45) (0.48)Ventilator �30 min. 2.61 �0.11
(per 1000 births) (0.29) (0.30)Mortality, 1-year 4.57 0.10
(per 1000 births) (0.36) (0.38)Mortality, 28 days 1.76 �1.16
(per 1000 births) (0.28) (0.30)
The data come from the 1989–1991 Linked National Natality-Mortality Detail Files. The sample consistsof the 497,139 singletons born in Pennsylvania between 1989 and 1991. The table entries are the coefficientestimates on an indicator equal to one if the mother smoked during pregnancy. The Unadjusted columnpresents the raw difference in sample means between smoking and nonsmoking mothers. The Adjustedcolumn presents the coefficient estimates from a regression that includes all of the “pretreatment” variablesincluded in the propensity score model in Figures III and IV (see footnote 36 for the list of variables). Thestandard errors are in parentheses and are corrected for heteroskedasticity.
1066 QUARTERLY JOURNAL OF ECONOMICS

In addition, Figure IVb shows no impact of maternal smokingon the five-minute APGAR score. Panel c reveals no impact ofmaternal smoking on the probability that the newborn requires
much lower weight than singletons. We found no evidence of an interaction effectbetween birth weight and gestation length; e.g., the birth weight effect was equallysmall for term and preterm infants.
FIGURE IVbDifference between Smokers and Nonsmokers in the Five-Minute APGAR
Score, Pennsylvania Singletons 1989–1991
FIGURE IVaDifference between Smokers and Nonsmokers in Infant Deaths within One
Year of Birth (per 1000 Live Births) by the Propensity Score,Pennsylvania Singletons 1989–1991
1067THE COSTS OF LOW BIRTH WEIGHT

the use of a ventilator for more than 30 minutes. Again, theregression-adjusted estimates in Table VI are quite consistentwith the figures.
Birth weight stands out as the only variable that has a strongempirical association with maternal smoking, once mother’s char-acteristics are included in the analysis. As noted earlier, if smok-ing has other deleterious effects on infant health independentfrom its effect through lowering birth weight, then the impliedimpact of birth weight on all of these outcomes is probably up-wardly biased. That is, however small the implied birth weighteffect is, it would have to be even smaller if maternal smoking isexpected to independently raise infant mortality, lower theAPGAR score, or make it more likely that the infant will need aventilator. Also, we found no effect of maternal smoking on fetaldeath rates [Chay, Flores, and Torelli 2005]. This suggests thatsample selection bias is probably not a first-order issue in analy-ses of maternal smoking that focus on the population of livebirths.
It is useful to compare the findings from our nonexperimentalanalysis with those of the medical literature on the effects ofmaternal smoking on infant birth weight and health. In particu-lar, according to a Cochrane review [Lumley, Oliver, Chamber-lain, and Oakley 2004] of 64 randomized trials of the impact ofsmoking cessation interventions on health outcomes of fetuses
FIGURE IVcDifference between Smokers and Nonsmokers in Incidence of Assisted
Ventilation � 30 Minutes, Pennsylvania Singletons 1989–1991
1068 QUARTERLY JOURNAL OF ECONOMICS

and infants, the studies show, on average, a 33-gram increase inbirth weight in response to programs that encourage pregnantwomen to cease smoking. On the other hand, there is no evidenceof a statistically significant impact on the incidence of neonatalmortality—consistent with the results of our analysis—althoughdue to relatively small sample sizes, standard errors were sub-stantial, and even very large effects could not be ruled out.
Sexton and Hebel [1984] is one of the more well-known ofthese studies (and one of three which specifically examines neo-natal deaths). First, it shows that the smoking cessation inter-vention led to a 20 percentage point reduction (from 83 percentfor the control, to 63 percent for the treated) in late pregnancysmoking. They find a corresponding 92 gram effect in birthweights with a confidence interval of 15.4 to 168.61 grams. In-flating the effects by a factor of 1/0.2, this yields a point estimateof 460 grams with a confidence interval of 77 to 843 grams. Thus,our 200 gram estimate falls below the point estimate but wellwithin the confidence interval range given by this study. Also, inour sample mothers who smoke during pregnancy consume, onaverage, 11 cigarettes-per-day, which implies a cigarette-per-dayeffect on birth weight of 18 grams. Sexton and Hebel find that thetreated group consumes 6.4 cigarettes-per-day less than the con-trol group in late pregnancy, implying a cigarette-per-day effect of14.4 grams.40
Further, there is little-to-no association between treatmentstatus and the incidence of birth weight less than 1500 grams,gestation length, and one- and five-minute APGAR scores. As forneonatal mortality, 2 out of 461 live births in the control groupdied, while 5 out of 454 in the treatment group died. Thus,mortality rates were actually smaller in the control group but theconfidence interval for the relative (treatment to control) risk ofmortality ranges from 0.50 to 13.02—too large to rule out verylarge impacts in either direction. Overall, it appears that thepresumption that impacts of smoking on birth weight necessarilytranslate into effects of birth weight on mortality are not sup-ported either by our (potentially biased, but statistically precise)nonexperimental statistical analysis or by the existing (unbiased,but statistically imprecise) experimental evidence.
40. It should be noted that the samples are not directly comparable, since theSexton and Hebel study recruited smoking women, suggesting that the preinter-vention smoking intensities were probably particularly high.
1069THE COSTS OF LOW BIRTH WEIGHT

Finally, we use the estimates in Table IV and Table VI tocalculate the savings in initial hospital costs achieved by encour-aging women to cease smoking during pregnancy. First, we deriveestimates of the cost savings based on the conventional approachused in the literature; that is, we multiply the cross-sectionalestimates of the association between costs and birth weight by theraw effects of maternal smoking on LBW incidence. Suppose thatmaternal smoking reduces birth weight by 200 grams, on aver-age, and that its effect on the incidences of low, very low, andextremely low birth weights are the same as in column 1 of TableVI. The costs-birth weight gradients in Table IV then imply anestimated cost savings of $907 for every woman who ceases smok-ing before pregnancy.
Next, we derive estimates of the cost savings based on thefixed effects estimates of the costs-birth weight gradients in TableIV and the regression-adjusted effects of smoking on the inci-dences of low, very low, and extremely low birth weights shown incolumn 2 of Table VI. Again, presume that maternal smokingreduces birth weight by 200 grams. The estimated cost savingsfall by a factor of 17 to $53 for each woman who is prevented fromsmoking during pregnancy.41 In Section VI we discuss the impli-cations of this finding for cost-benefit analyses of smoking inter-vention programs targeted at pregnant women.
V. ROBUSTNESS OF THE FINDINGS
In this section we briefly summarize additional analyses—reported in greater detail in Almond, Chay, and Lee [2004]—thataddress important issues with our twins analysis. The first majorconcern is the possibility that twins are treated more or lessidentically, irrespective of their health status. That is, in princi-ple, it is possible that if only one twin requires immediate medicalattention and treatment (e.g., the need for assisted ventilation),the other receives the treatment as well. This would naturallylead to small fixed-effects estimates.
This hypothesis is rejected by the data—at least for theutilization and cost measures we use in our study. For example,
41. Ideally, we could estimate the direct effect of maternal smoking onhospital costs. Unfortunately, the hospital discharge data do not contain informa-tion on the smoking behavior of mothers. However, the adjusted estimate of theeffect of smoking on ventilator use provides evidence that at least one costlyprocedure is not affected by maternal smoking during pregnancy.
1070 QUARTERLY JOURNAL OF ECONOMICS

as Table I shows, about 27 percent (0.0102/0.037) of the pooledcross-sectional variation in the use of assisted ventilation (morethan 30 minutes) is driven by the within-pair variation, whichshould be zero if twins are treated identically. Similarly, about 21percent of the cross-sectional variation in costs is driven bywithin-twin pair variation. Both of these proportions are greaterthan the 17 percent of cross-sectional birth weight variation thatis explained by within-pair differences.
Furthermore, if twins are treated the same independent ofhealth status, then within-twin pair differences should be uncor-related with within-pair differences in treatment. As documentedin Almond, Chay, and Lee [2004], the fixed-effects estimate of theeffect of the five-minute APGAR score on ventilator use is as largein magnitude as the pooled cross-sectional estimate and highlysignificant. In addition, the APGAR score performs notably betterthan birth weight in predicting within-twin pair differences inboth one-year and one-day mortality.
A second important concern is that our analysis—while ac-counting for genetic differences across mothers—cannot controlfor genetic differences between fraternal twins of the samemother, since the data do not allow us to distinguish betweenmonozygotic (identical) and dizygotic (fraternal) twins. Thus,some of our twins estimates may be driven by genetic differencesbetween dizygotic twins of the same mother. Almond, Chay, andLee [2002, 2004] provide a partial assessment of the differences ineffects by zygosity, by examining the necessarily dizygotic infantsof boy-girl twin pairs. Overall, the fixed-effects estimates acrosstwin-types (boy-boy, girl-girl, boy-girl) are similar; more impor-tantly, the significant fall in the estimates, when moving from theOLS to the fixed-effects specification, is of the same magnitudeacross types.42
In Almond, Chay, and Lee [2004] we also demonstrate thatour fixed effects-estimates and qualitative conclusions are similaracross: 1) different years of analysis (we examine the 1983–1985,1989–1991, and 1995–1997 periods); 2) functional form assump-tions (we examine the results in a logit/conditional-logit frame-work, as well as examine the appropriateness of the spline speci-
42. Note that the stability of the results across twin-types rules out thepossibility that the small coefficients are caused by accidental “switching” of twinsat birth, since such switching will not occur for boy-girl pairs. Conley, Strully, andBennett [2003a] argue that among identical twins sharing a placenta, the fixed-effects estimate will overstate the importance of size at birth.
1071THE COSTS OF LOW BIRTH WEIGHT

fication); 3) alternative matching algorithms for constructingtwin pairs (we compare a “record-location” matching algorithmwith a simple covariate-matching algorithm, and also examinethe NCHS algorithm); 4) whether the first-born in a twin pair isheavier or lighter than the second-born (we test the equality andsymmetry of the effects by twin birth order); and 5) subgroupsdefined by the race and education of the mother.
Finally, we note that the findings here and originally re-ported in Almond, Chay, and Lee [2002] are consistent with thoseof Conley, Strully, and Bennett [2003a], who use the NCHS1995–1997 data to obtain within-pair estimates. For example,their main result is an 18.1 percentage increase in the probabilityof dying within the first year of life associated with a 1 pound (454gram) decrease in birth weight. Eighteen point one percent, mul-tiplied by the mean mortality rate of 38.71 deaths per 1000 livebirths, yields a difference of 0.181�38.71 � 7.01 deaths per 1000live births. Based on the linear regression, fixed-effects estimatefor infant mortality in Table III (column 2), a 454-gram decreaseleads to (�454)�(�0.0222) � 10.07 more deaths per 1000 livebirths. Thus, their estimate is slightly smaller in magnitude thanour simple linear fixed-effects estimate. But as emphasizedabove, and shown in Table III and in Figure Ib, the comparison ofthe magnitudes between the cross-sectional relation and thefixed-effects estimates, as well as the sensitivity of the results tothe inclusion of twins with congenital anomalies, suggests thatthe return to reducing LBW is many times smaller than typicallypresumed.
VI. INTERPRETATION AND IMPLICATIONS
VI.A. Implications for Policy
In two different settings—corresponding to birth weightvariation driven by intra-twin-pair differences and variationdriven by maternal smoking—controlling for mother-specific het-erogeneity leads to dramatically smaller effects of birth weight onseveral infant outcomes of interest. In Almond, Chay, and Lee[2002] we find that the cross-sectional estimate of the effect ofbirth weight on infant mortality is largely insensitive to detailedcontrols for mother’s observable characteristics—including age,education, race, marital status, medical and behavioral risk fac-tors, and prenatal care histories. Together, these findings imply
1072 QUARTERLY JOURNAL OF ECONOMICS

that unobserved factors, including genetics, lead to a severe over-statement of the importance of birth weight in cross-sectionalanalysis.
There are two plausible interpretations of our results. Thefirst is that, due to mother-specific omitted variables, the payoff toLBW-prevention—in terms of cost savings or improvements inhealth—has been greatly exaggerated by the well-documentedcross-sectional relationships. For example, consider the study ofLightwood, Phibbs, and Glantz [1999], which provides an esti-mate of the direct medical costs associated with maternal smok-ing. For their costs estimate, they multiply two numbers: theexcess costs at discharge associated with LBW babies, and theexcess risk of LBW due to smoking during pregnancy.43 Theanalysis yields an estimated $263 million (in $1995) of totalhospital costs, per year, for the United States. Our analysissuggests that the cross-sectional estimates of excess costs due toLBW is upwardly biased by a factor of 3.2, which implies that the$263 million estimate overstates the “true” costs of maternalsmoking by $180 million.44
The case of maternal smoking also highlights the policy rele-vance of the highly nonlinear relations between birth weight andinfant outcomes that we document. For example, the secondcolumn of Table VI suggests that maternal smoking does notaffect the incidence of births below 1500 grams. In this case, the$263 million annual cost estimate is exaggerated by a factor ofover four, and its overstatement of the true costs would total $200million per year. This sizable reduction in the estimated economicbenefits of smoking cessation among pregnant women has clearimplications for the cost-effectiveness of different prenatal careinterventions that target maternal smoking. It also has relevancefor federal and state decisions on the optimal allocation of healthcare resources that improves infant health at minimal cost—forexample, how to spend the U. S. states’ $206 billion settlementwith the tobacco industry, and the cost-effectiveness of Proposi-tion 99 in California.
Since our analysis is nonexperimental, it may not identify
43. This is the approach most commonly used in the literature to calculatecosts. For example, see Marks et al. [1990] and Windsor et al. [1993].
44. Our estimate of the excess costs due to LBW is the average of the rows inthe second column of Table V (for the cross section) ($21,428) and in the thirdcolumn (fixed effects) ($6722), using the first column as weights. We do not use the(less than 600 gram) segment, since Lightwood, Phibbs, and Glantz [1999] excludethese births from their analysis.
1073THE COSTS OF LOW BIRTH WEIGHT

the true “structural” relation between birth weight and earlyhealth outcomes and costs. However, we are confident in a second,more cautious interpretation of the findings—that the “impact” ofLBW is dependent on which environmental factor is influencingbirth weight. Cross-sectional birth weight variation is directly orindirectly influenced by immutable factors (genetics), socioeco-nomic factors (education, income), maternal behaviors (caloricintake, smoking behavior), and other environmental factors (in-trauterine environment of the fetus). Within-twin pair varia-tion—which represents 40 percent of the birth weight variabilitydue to variable intrauterine growth rates—holds constant allmother- and pregnancy-specific factors, and is partly generatedby differences in fetal nutritional intake. Our smoking analysis,on the other hand, examines birth weight variation due to amaternal behavior that is the leading modifiable cause of LBW inthe United States.
Our findings suggest that while some interventions may in-deed succeed in both raising birth weights and improving healthoutcomes, others may only be effective in raising birth weights,with little or no effects on health. In other words, the mosteffective ways of preventing LBW may have little correspondencewith the most effective ways of minimizing infant health compli-cations and consequent health care costs.
More generally, other methods of infant health assessmentmay need to be developed. For example, Wilcox [2001] empha-sizes that small preterm births with extremely low weights—lessthan 1000 grams—are much more informative for infant mortal-ity than LBW births. Even though the fixed-effects estimates inFigure Ib are much smaller than the cross-sectional estimates,there is nevertheless a substantive correlation between mortalityand birth weight in this extremely low weight range. This sug-gests that interventions that impact the number of infants weigh-ing less than 1000 grams could be effective in reducing infantmortality; however, their effects at the population level may stillbe small, as only one-half of 1 percent of all babies in the UnitedStates are born with a weight below 1000 grams.
VI.B. Prenatal versus Postnatal Investments
Several, recent studies have documented a relation betweenbirth weight and longer run outcomes such as cognitive develop-ment, educational attainment, labor market outcomes, and adult
1074 QUARTERLY JOURNAL OF ECONOMICS

health.45 Our analysis, which focuses on early infant outcomes, mayprovide some indirect evidence on the role of prenatal investmentsby the parents. However, it provides no evidence on the interactionsbetween birth weight, overall health, and postnatal investments inthe child, which is an important area of research in the economicsliterature (e.g., Becker and Tomes [1976] and Behrman, Rosen-zweig, and Taubman [1994]). The relatively small effects of birthweight that we find for early infant health status suggest thatprevious studies’ findings of significant impacts of birth weight onlater adult outcomes is driven more by an interaction between post-natal investments and initial birth weight than by the effects ofbirth weight (or prenatal investments) per se.
Some evidence on this question can be marshaled from themedical and epidemiology literatures on the effects of parentalsmoking on child health and development. MacArthur et al.[2001], who analyze a randomized intervention, document noeffect of maternal smoking in pregnancy on the child’s IQ andheight at age nine. The handful of nonexperimental studies thathave longitudinal data on maternal (and paternal) smoking be-haviors during and after pregnancy find that postnatal smokingis the dominating predictor (over prenatal smoking) for develop-mental and behavioral problems, cognitive performance, lowerrespiratory illness, and allergies.46
Finally, Chay, Flores, and Torelli [2005], find that SuddenInfant Death Syndrome (SIDS) is the only cause of infant deaththat has a significant correlation with maternal smoking afterregression adjustment for mother’s characteristics. However,whether this association is due to prenatal or postnatal smoke
45. See Strauss [2000], Matte et al. [2001], Jefferis, Power, and Hertzman[2002], Durousseau and Chavez [2003], Morley et al. [2004], and Behrman andRosenzweig [2004]. Behrman and Rosenzweig [2001], based on a sample of 404MZ female twin pairs, find intrapair birth weight effects on educational attain-ment and wages that are larger at normal weights than at weights below 2500grams. Boomsma and Ball [1998], using samples of MZ and DZ twin pairs, findevidence that genetic differences between siblings accounts for much of the esti-mated effect of birth weight on IQ. Stein et al. [1975] find that the birth cohortborn during the 1944–1945 Winter famine in Holland had largely similar adultoutcomes to cohorts born before and after the famine. The studies that have usedtwin differences to estimate the effect of birth weight on adult health have foundmixed evidence on its significance (e.g., Poulter et al. [1999], Ijzerman, Stehouwer,and Boomsma [2000], Zhang et al. [2001], and Hubinnette et al. [2001]).
46. See DiFranza, Aligne, and Weitzman [2004], Ernst, Moolchan, and Rob-inson [2001], Eskenazi and Castorina [1999], Bauman, Flewelling, and Laprelle[1991], Yolton et al. [2005], Strachan and Cook [1997], Cook and Strachan [1999],and Kulig et al. [1999].
1075THE COSTS OF LOW BIRTH WEIGHT

exposure is a topic of ongoing debate in the medical literature.47
In addition, experimental animal studies have established sig-nificant effects of postnatal, environmental tobacco smoke (ETS)exposure on body and brain function, but little to no effect ofprenatal exposure [Gospe, Zhou, and Pinkerton 1996; Slotkin etal. 2001]. The relative importance of prenatal and postnatalsmoke exposure is of obvious health policy significance sincewomen who quit smoking during pregnancy have high relapserates following delivery [Fingerhut, Kleinman, and Kendrick1990; Kahn, Certain, and Whitaker 2002].
VII. CONCLUSION
We conclude by pointing out some important limitations inthe scope of our analysis, and suggested areas of future research.First, while we have focused on two empirically importantsources of birth weight variation, there are undoubtedly otherfactors that influence birth weight. Thus, we cannot rule out thepossibility that the two sources of variation we have examined arethe exception and not the rule.48 We suspect that this can only beresolved through an accumulation of evidence from studies thatcan control for confounding immutable factors, such as genetics.Mother-level unobserved heterogeneity appears to be an impor-tant confounder.
Second, our outcomes focus on the status of the infant atbirth, or shortly thereafter. Therefore, we cannot make any con-clusions about the relation between LBW (or birth weight moregenerally) and longer run outcomes. The relatively small effectsthat we find for early infant health status suggest that previousstudies’ findings of significant impacts of birth weight on later
47. See Klonoff-Cohen et al. [1995], Anderson and Cook [1997], Schoendorfand Kiely [1992], and Dwyer, Ponsonby, and Couper [1999]. Almond, Chay, andLee [2002] find a significant (though small in magnitude) association betweentwin differences in birth weight and twin differences in postneonatal mortalityand infant death due to SIDS. Two-thirds of the overall twin differences estimateof the effect of birth weight on postneonatal mortality is attributable to deaths dueto SIDS or congenital anomalies at birth.
48. We note that if these are anomalies, they are not the only ones. Forexample, Chay and Greenstone [2003a, 2003b] find a strong association betweensharp reductions in particulates air pollution across counties and declines ininfant mortality, with only small effects on birth weight, or the incidence of LBW.Almond, Chay, and Greenstone [2003] document that the dramatic reduction inBlack infant mortality rates (IMR) in the United States from 1965 to 1971accounts for the greatest convergence in Black-White IMRs in the entire post-World War II era. However, they find a comparatively small change in the birthweight distribution of Black infants relative to Whites during this period.
1076 QUARTERLY JOURNAL OF ECONOMICS

developmental and adult outcomes is more likely to be driven byan interaction between postnatal investments and initial birthweight, rather than due to the effects of birth weight (or prenatalinvestments) per se. A more direct investigation of this hypothe-sis seems to be a useful direction for future research.
APPENDIX 1: DATA
Matching Twins in Linked Birth/Infant Death Data
Two approaches are used to match twins in the annual linkedbirth/infant death data. The primary approach uses the fact thatbeginning in 1989, multiple-birth records are generally locatednext to each other in the “denominator-plus” microdata file pro-vided by NCHS. Additionally, with the rich set of covariatesincluded on the microdata file, twin pairs can be matched whentwo unique strings of parental and pregnancy covariates areidentified. Although we examined the results from both ap-proaches, the results reported in this paper use the record-loca-tion matching approach. The second approach, necessary for ex-amining births occurring before 1989 when multiple births werenot located next to each other in the “denominator-plus” file, isdescribed in Almond, Chay, and Lee [2004].
The record location-based matching approach begins byselecting all “higher-order” pregnancies identified with theDPLURAL variable. For 1989 the DPLURAL variable indicatesthat 90,222 of the 4,045,881 births (2.2 percent) were twin births.The repetition of paternal and pregnancy characteristics indicatethat adjacent twin records are part of the same twin set. Adjacenttwin records are considered matched twins if the following covari-ates are each identical: mother’s age, state of birth, state ofresidence, race, and education, marital status of the parents,father’s age, father’s education, and the month in which prenatalcare began. Of the 81,757 adjacent twin records that have bothinformation on maternal education and birth weight, 74,472 (91percent) have identical information for these nine covariates.Additional information on these files not used in matching sug-gests that incorrect twin matches are uncommon: of the 74,742matched twin pairs for 1989, all but 37 of the pairs were born inthe same month. While a longer string of covariates could be usedto increase the likelihood that adjacent twin records are indeed
1077THE COSTS OF LOW BIRTH WEIGHT

part of the same twin set, incomplete or miscoding of the secondtwin record can cause the incorrect rejection of true twin matches.
This risk of Type 1 error needs to be balanced against the riskgenerated by relying more on the adjacency of twin records andless on the correspondence of parental and pregnancy covariates.Relying more on adjacency increases the risk of Type 2 error forseveral reasons. First, there appear to be singleton birth recordsthat were coded as twins. (This could possibly result from the factthat the plurality field, DPLURAL, should be coded as “2” fortwins, whereas “2” is often used as a code for “no”). It is alsopossible that one twin in the pair was not born alive, and there-fore will appear in the fetal death data rather than in the “de-nominator-plus” natality data. Finally, it could be the case thatwhile both twin birth records are present in the natality data,they are not adjacent in the “denominator-plus” file. All of thesepossibilities increase the risk of incorrectly matching adjacenttwin records when a sparser set of covariate checks is used.
Matching Twins in HCUP State Inpatient Discharge Data
The first step to matching twin records in the discharge data isto identify birth records where the newborn is part of a twin set. Incontrast to the linked birth/infant death data, there is no dedicatedfield that identifies multiple births. In the hospital discharge data,the fields containing the diagnosis code DX1 (principal diagnosis)and DX2 (first secondary diagnosis) are used to select liveborninfants who are twins (ICD9-9-CM code equals V31, V32, or V33).
Like the NCHS data, the HCUP data do not provide infor-mation on the twin set to which individual twin records belong.Nor are twin discharge records linked to the maternal dischargerecord, which would permit use of information on the mother inidentifying which twin records are part of a twin set. Neverthe-less, the two basic approaches used to match twins in the linkedbirth/infant death data can be applied to the discharge records;i.e., using location of the discharge record in the ascii data andusing a string of covariates that sibling twins should have incommon. Note, the absence of information on the mother alsomeans that the birth order of the twins cannot be imputed, as itwas in the linked birth-infant death data (using the informationon the number of children born to the mother). The covariate-matching approach yielded larger sample sizes, so we used thisalgorithm for our analysis of the HCUP data.
The covariate approach to matching twins does not use any
1078 QUARTERLY JOURNAL OF ECONOMICS

information on the position of records within the file. Instead, ituses a string of five variables that will be common within twinsets in order to isolate unique pairs. The variables used to matchtwins are the zip code of the patients’ residence, the HCUPhospital ID number from which the twin was discharged, themonth the hospital admission occurred, whether the admissionwas on a weekend, and the race of the infant twin. Approximately82 percent of discharge records with twin diagnosis codes can beuniquely matched with this approach.
APPENDIX 2
COLUMBIA UNIVERSITY AND NATIONAL BUREAU OF ECONOMIC RESEARCH
UNIVERSITY OF CALIFORNIA AT BERKELEY AND NATIONAL BUREAU OF ECONOMIC
RESEARCH
UNIVERSITY OF CALIFORNIA AT BERKELEY AND NATIONAL BUREAU OF ECONOMIC
RESEARCH
FIGURE VAverage Birth Weight and Infant Mortality Rate for Twins and Singletons,
by Gestation LengthNote: Linked Birth-Death certificate data, 1989.
1079THE COSTS OF LOW BIRTH WEIGHT

REFERENCES
Almond, Douglas, Kenneth Y. Chay, and Michael Greenstone, “Civil Rights, theWar on Poverty, and Black-White Convergence in Infant Mortality in Mis-sissippi,” mimeo, University of California, Berkeley, 2003.
Almond, Douglas, Kenneth Y. Chay, and David S. Lee, “Does Birth WeightMatter? Evidence from the U. S. Population of Twin Births,” Center for LaborEconomics Working Paper No. 53, September 2002.
Almond, Douglas, Kenneth Y. Chay, and David S. Lee, “The Costs of Low BirthWeight,” NBER Working Paper No. 10552, June 2004.
Alexander, Duane, “Child Health: Birth Outcomes and Infant Mortality,”Speeches and Reports, National Institute for Child and Human Development,2000.
Anderson, H. Ross, and Derek G. Cook, “Passive Smoking and Sudden InfantDeath Syndrome: Review of the Epidemiological Evidence,” Thorax, LII(1997), 1003–1009.
Bauman, Karl E., Robert L. Flewelling, and John LaPrelle, “Parental CigaretteSmoking and Cognitive Performance of Children,” Health Psychology, X(1991), 282–288.
Becker, Gary S., and Nigel Tomes, “Child Endowments, and the Quantity andQuality of Children,” Journal of Political Economy, LXXXIV (1976),S143–S162.
Behrman, Jere R., and Mark R. Rosenzweig, “The Returns to Increasing BodyWeight,” PIER Working Paper No. 01-052, 2001.
Behrman, Jere R., and Mark R. Rosenzweig, “The Returns to Birth Weight,”Review of Economics and Statistics, LXXXVI (2004), 586–601.
Behrman, Jere R., Mark R. Rosenzweig, and Paul Taubman, “Endowments andthe Allocation of Schooling in the Family and in the Marriage Market: TheTwins Experiment,” Journal of Political Economy, CII (1994), 1131–1174.
Behrman, Richard, Robert M. Kliegman, and Hal B. Jenson, Nelson Textbook ofPediatrics (Amsterdam, The Netherlands: Elsevier Science, 2000).
Boomsma, Dorret I., and G. C. M. Ball, “Genetic Influences on Childhood IQ in 5-and 7-Year Old Dutch Twins,” Developmental Neuropsychology, XIV (1998),115–126.
Brooks, Anne-Marie, Robert S. Byrd, Michael Weitzman, Peggy Auinger, et al.,“Impact of Low Birth Weight on Early Childhood Asthma in the UnitedStates,” Archives of Pediatric and Adolescent Medicine, CLV (2001), 401–406.
Bryan, Elizabeth, Twins and Higher Order Births: A Guide to their Nature andNurture (London, UK: Edward Arnold, 1992).
Chay, Kenneth Y., Carlos A. Flores, and Paul A. Torelli, “The Association betweenMaternal Smoking during Pregnancy and Fetal and Infant Health: NewEvidence from United States Birth Records,” mimeo, University of California,Berkeley, 2005.
Chay, Kenneth Y., and Michael Greenstone, “The Impact of Air Pollution onInfant Mortality: Evidence from Geographic Variation in Pollution ShocksInduced by a Recession,” Quarterly Journal of Economics, CXVIII (2003a),1121–1167.
Chay, Kenneth Y., and Michael Greenstone, “Air Quality, Infant Mortality, andthe Clean Air Act of 1970,” NBER Working Paper No. 10053, 2003b.
Conley, Dalton, Kate W. Strully, and Neil G. Bennett, “A Pound of Flesh or JustProxy? Using Twin Differences to Estimate the Effect of Life Chances,” NBERWorking Paper No. 9901, 2003a.
Conley, Dalton, Kate W. Strully, and Neil G. Bennett, The Starting Gate: BirthWeight and Life Chances (Berkeley, CA: University of California Press,2003b).
Cook, Derek G., and David P. Strachan, “Summary of Effects of Parental Smokingon the Respiratory Health of Children and Implications for Research,” Tho-rax, LIV (1999), 357–366.
Corman, Hope, Theodore J. Joyce, and Michael Grossman, “Birth Outcome Pro-duction Functions in the U. S.,” Journal of Human Resources, XXII (1987),339–360.
Currie, Janet, and Nancy Cole, “Welfare and Child Health: The Link between
1080 QUARTERLY JOURNAL OF ECONOMICS

AFDC Participation and Birth Weight,” American Economic Review, LXXXIII(1993), 971–985.
Currie, Janet, and Jonathan Gruber, “Saving Babies: The Efficacy and Cost ofRecent Changes in the Medicaid Eligibility of Pregnant Women,” Journal ofPolitical Economy, CIV (1996), 1263–1296.
Currie, Janet, and Rosemary Hyson, “Is the Impact of Health Shocks Cushionedby Socioeconomic Status? The Case of Low Birth Weight,” AEA Papers andProceedings, LXXXIX (1999), 245–250.
Currie, Janet, and Enrico Moretti, “Mother’s Education and the IntergenerationalTransmission of Human Capital: Evidence from College Openings,” QuarterlyJournal of Economics, CXVIII (2003), 1495–1532.
Derom, Richard, Catherine Derom, and Robert Vlietinck, “Placentation,” in Keith,et al., eds., Multiple Pregnancy: Epidemiology, Gestation and Perinatal Out-come (New York: The Parthenon Publishing Group, 1995).
DiFranza, Joseph R., C. Andrew Aligne, and Michael Weitzman, “Prenatal andPostnatal Environmental Tobacco Smoke Exposure and Children’s Health,”Pediatrics, CXIII (2004), 1007–1015.
Durousseau, Sharon, and Gilberto F. Chavez, “Associations of IntrauterineGrowth Restriction among Term Infants and Maternal Pregnancy Intended-ness, Initial Happiness about Being Pregnant, and Sense of Control,” Pedi-atrics, CXI (2003), 1171–1175.
Dwyer, Terence, Anne-Louise Ponsonby, and David Couper, “Tobacco SmokeExposure at One Month of Age and Subsequent Risk of SIDS—A ProspectiveStudy,” American Journal of Epidemiology, CXLIX (1999), 593–602.
Ernst, Monique, Eric T. Moolchan, and Miqun L. Robinson, “Behavioral andNeural Consequences of Prenatal Exposure to Nicotine,” Journal of the Ameri-can Academy of Child and Adolescent Psychiatry, XL (2001), 630–641.
Ershoff, Daniel H., Patricia Dolan-Mullen, and Virginia P. Quinn, “RandomizedTrial of a Serialized Self-Help Smoking Cessation Program for PregnantWomen in an HMO,” American Journal of Public Health, LXXIX (1989),182–187.
Eskenazi, Brenda, and Rosemary Castorina, “Association of Prenatal Maternal orPostnatal Child Environmental Tobacco Smoke Exposure and Neurodevelop-mental and Behavioral Problems in Children,” Environmental Health Per-spectives, CVII (1999), 991–1000.
Fingerhut, Lois A., Joel C. Kleinman, and Juliette S. Kendrick, “Smoking Before,During, and After Pregnancy,” American Journal of Public Health, LXXX(1990), 541–544.
Fowler, Mary Glenn, Joel Kleinman, John L. Kiely, and Samuel Kessel, “DoubleJeopardy: Twin Infant Mortality in the United States, 1983 and 1984,”American Journal of Obstetrics and Gynecology, CLXV (1991), 15–22.
Geronimus, Arline T., and Sanders Korenman, “The Socioeconomic Consequencesof Teen Childbearing Reconsidered,” Quarterly Journal of Economics, CVII(1992), 1187–1214.
Goldenberg, Robert L., and Dwight J. Rouse, “Prevention of Premature Birth,”New England Journal of Medicine, CCCXXXIX (1998), 313–320.
Gospe, Sidney, Shan Shan Zhou, and Kent E. Pinkerton, “Effects of Environmen-tal Tobacco Smoke Exposure in Utero and/or Postnatally on Brain Develop-ment,” Pediatric Research, XXXIX (1996), 494–498.
Grossman, Michael, and Theodore J. Joyce, “Unobservables, Pregnancy Resolu-tions, and Birth Weight Production Functions in New York City,” Journal ofPolitical Economy, XCVIII (1990), 983–1007.
Hanratty, Maria J., “Canadian National Health Insurance and Infant Health,”American Economic Review, LXXXVI (1996), 276–284.
Hubinnette, Anna, Sven Cnattingius, Anders Ekbom, Ulf de Faire, et al., “BirthWeight, Early Environment, and Genetics: A Study of Twins Discordant forAcute Myocardial Infarction,” The Lancet, CCCLVII (2001), 1997–2001.
Ijzerman, Richard G., Coen Stehouwer, and Dorret Boomsma, “Evidence forGenetic Factors Explaining the Birth Weight-Blood Pressure Relation: Analy-sis in Twins,” Hypertension, XXXVI (2000), 1008–1012.
Institute of Medicine, WIC Nutrition Risk Criteria: A Scientific Assessment (Wash-ington, DC: National Academy Press, 1996).
1081THE COSTS OF LOW BIRTH WEIGHT

Jefferis, Barbara, Chris Power, and Clyde Hertzman, “Birth Weight, ChildhoodSocioeconomic Environment, and Cognitive Development in the 1958 BritishBirth Cohort Study,” British Medical Journal, CCCXXV (2002), 1–6.
Kaelber, Charles T., and Thomas F. Pugh, “Influence of Intrauterine Relations onthe Intelligence of Twins,” New England Journal of Medicine, CCLXXX(1969), 1030–1034.
Kahn, Robert S., Laura Certain, and Robert C. Whitaker, “A Reexamination ofSmoking Before, During, and After Pregnancy,” American Journal of PublicHealth, XCII (2002), 1801–1808.
Keith, Louis G., Emile Papiernik-Berkhauer, and Donald M. Keith, MultiplePregnancy: Epidemiology, Gestation and Perinatal Outcome (New York: TheParthenon Publishing Group, 1995).
Klonoff-Cohen, Hillary Sandra, Sharon Edelstein, Ellen S. Lefkowitz, Indu P.Srinivasan, et al., “The Effect of Passive Smoking and Tobacco Exposurethrough Breast Milk on Sudden Infant Death Syndrome,” Journal of theAmerican Medical Association, CCLXXIII (1995), 795–798.
Kogan, Michael D., Greg R. Alexander, Milton Kotelchuck, Marian MacDorman,et al., “Trends in Twin Birth Outcomes and Prenatal Care Utilization in theUnited States, 1981–1997,” Journal of the American Medical Association,CCLXXXIV (2000), 335–341.
Kowaleski-Jones, Lori, and Greg J. Duncan, “Effects of Participation in the WICProgram on Birth Weight: Evidence from the National Longitudinal Survey ofYouth,” American Journal of Public Health, XCII (2002), 799–804.
Kramer, Michael S., “Intrauterine Growth and Gestational Duration Determi-nants,” Pediatrics, LXXX (1987), 502–511.
Kulig, Michael, W. Luck, S. Lau, B. Niggerman, et al., “Effect of Pre- and Post-natal Tobacco Smoke Exposure on Specific Sensitization to Food and InhalantAllergens during the First 3 Years of Life,” Allergy, LIV (1999), 220–228.
Lewit, Eugene M., Linda Schuurmann Baker, Hope Corman, and Patricia Shiono,“The Direct Cost of Low Birth Weight,” The Future of Children, V (1995),35–56.
Lightwood, James M., Ciaran S. Phibbs, and Stanton A. Glantz, “Short-TermHealth and Economic Benefits of Smoking Cessation: Low Birth Weight,”Pediatrics, CIV (1999), 1312–1320.
Loos, Ruth J., Catherine Derom, Robert Derom, and Robert Vlietinck, “Determi-nants of Birth Weight and Intrauterine Growth in Liveborn Twins,” Paedi-atric and Perinatal Epidemiology, XIX (2005), 15–22.
Lucas, Alan, Ruth Morley, and Tim J. Cole, “Randomised Trial of Early Diet inPreterm Babies and Later Intelligence Quotient,” British Medical Journal,CCCXVII (1998), 1481–1487.
Lumley, Judith, Sandy S. Oliver, Catherine Chamberlain, and Laura Oakley,“Interventions for Promoting Smoking Cessation during Pregnancy,” TheCochrane Database of Systematic Reviews (2004), Issue 3.
MacArthur, Christine, E. George Knox, and Robert J. Lancashire, “Effects at AgeNine of Maternal Smoking in Pregnancy: Experimental and ObservationalFindings,” British Journal of Obstetrics and Gynaecology, CVIII (2001),67–73.
Marks, James S., Jeffrey Koplan, Carol Hogue, and Michael Dalmat, “A Cost-Benefit/Cost Effectiveness Analysis of Smoking Cessation for PregnantWomen,” American Journal of Preventative Medicine, VI (1990), 282–289.
Matte, Thomas D., Michaeline Bresnahan, Melissa D. Begg, and Ezra Susser,“Influence of Variation in Birth Weight within Normal Range and withinSibships on IQ at Age 7 Years: Cohort Study,” British Medical Journal,CCCXXIII (2001), 310–314.
McCormick, Marie C., Jeanne Brooks-Gunn, K. Workman-Daniels, J. Turner, etal., “The Health and Developmental Status of Very Low-Birth Weight Chil-dren at School Age,” Journal of the American Medical Association, CCLXVII(1992), 2204–2208.
Morley, Ruth, Mary S. Fewtrell, Rebecca A. Abbott, Terence Stephenson, et al.,“Neurodevelopment in Children Born Small for Gestational Age: A Random-ized Trial of Nutrient-Enriched versus Standard Formula and Comparisonwith a Reference Breastfed Group,” Pediatrics, CXIII (2004), 515–521.
1082 QUARTERLY JOURNAL OF ECONOMICS

National Institutes of Health, “NIH Guide: Low Birth Weight in Minority Popu-lations,” PA-99-045, 1999.
Nelson, Karin B., and Judith K. Grether, “Cerebral Palsy in Low-Birth WeightInfants: Etiology and Strategies for Prevention,” Mental Retardation andDevelopmental Disabilities Research Reviews, III (1997), 112–117.
Paneth, Nigel S., “The Problem of Low Birth Weight,” The Future of Children, V(1995), 19–34.
Pollack, Harold, Paula M. Lantz, and John G. Frohna, “Maternal Smoking andAdverse Birth Outcomes among Singletons and Twins,” American Journal ofPublic Health, XC (2000), 395–400.
Poulter, N. R., et al., “Association between Birth Weight and Adult Blood Pressurein Twins: Historical Cohort Study,” British Medical Journal, CCCXIX (1999),1330–1333.
Richards, Marcus, Rebecca Hardy, Diana Kuh, and Michael Wadsworth, “BirthWeight and Cognitive Function in the British 1946 Birth Cohort: Longitudi-nal Population Based Study,” British Medical Journal, CCCXXII (2001),199–203.
Rosenbaum, Paul, and Donald Rubin, “The Central Role of the Propensity Scorein Observational Studies for Causal Effects,” Biometrika, LXX (1983), 41–55.
Rosenzweig, Mark R., and T. Paul Schultz, “Estimating a Household ProductionFunction: Heterogeneity and the Demand for Health Inputs, and Their Ef-fects on Birth Weight,” Journal of Political Economy, XCI (1983), 723–746.
Rosenzweig, Mark R., and Kenneth I. Wolpin, “Inequality at Birth: The Scope forPolicy Intervention,” Journal of Econometrics, L (1991), 205–228.
Rosenzweig, Mark R., and Kenneth I. Wolpin, “Sisters, Siblings, and Mothers: TheEffects of Teen-Age Childbearing on Birth Outcomes,” Econometrica, LXIII(1995), 303–326.
Schoendorf, Kenneth C., and John L. Kiely, “Relationship of Sudden Infant DeathSyndrome to Maternal Smoking During and After Pregnancy,” Pediatrics, XC(1992), 905–908.
Sexton, Mary, and J. Richard Hebel, “A Clinical Trial of Change in MaternalSmoking and Its Effect on Birth Weight,” Journal of the American MedicalAssociation, CCLI (1984), 911–915.
Slotkin, Theodore A., Kent Pinkerton, M. C. Garofolo, J. T. Auman, et al., “Peri-natal Exposure to Environmental Tobacco Smoke Induces Adenylyl Cyclaseand Alters Receptor-Mediated Cell Signaling in Brain and Heart of NeonatalRats,” Brain Research, DCCCXCVIII (2001), 73–81.
Stein, Zena, Mervyn Susser, Gerhart Saenger, and Francis Marolla, Famine andHuman Development: The Dutch Hunger Winter of 1944–45 (New York, NY:Oxford University Press, 1975).
Strachan, David P., and Derek G. Cook, “Parental Smoking and Lower Respira-tory Illness in Infancy and Early Childhood,” Thorax, LII (1997), 905–914.
Strauss, Richard S., “Adult Functional Outcome of Those Born Small for Gesta-tional Age: Twenty-six-Year Follow-up of the 1970 British Birth Cohort,”Journal of the American Medical Association, CCLXXXIII (2000), 625–632.
Vogler, George P., and Lynn T. Kozlowski, “Differential Influence of MaternalSmoking on Infant Birth Weight,” Journal of the American Medical Associa-tion, CCLXXXVII (2002), 241–242.
Wilcox, Allen J., “On the Importance—and the Unimportance—of Birth Weight,”International Journal of Epidemiology, XXX (2001), 1233–1241.
Windsor, Richard A., John B. Lowe, Laura L. Perkins, Dianna Smith-Yoder, et al.,“Health Education for Pregnant Smokers: Its Behavioral Impact and CostBenefit,” American Journal of Public Health, LXXXIII (1993), 201–206.
Yolton, Kimberly, et al., “Exposure to Environmental Tobacco Smoke and Cogni-tive Abilities among U. S. Children and Adolescents,” Environmental HealthPerspectives, CXIII (2005), 98–103.
Zhang, Jun, Ruth A. Brenner, and Mark A. Klebanoff, “Differences in BirthWeight and Blood Pressure at Age 7 Years among Twins,” American Journalof Epidemiology, CLIII (2001), 779–782.
1083THE COSTS OF LOW BIRTH WEIGHT