the cost of government debt in canada 2016 - fraser · pdf filete ost of overnent et in anaa...
TRANSCRIPT
fraserinstitute.org FRASER RESEARCH BULLETIN 1
F R A S E R RESEARCHBULLETIN
January 2016
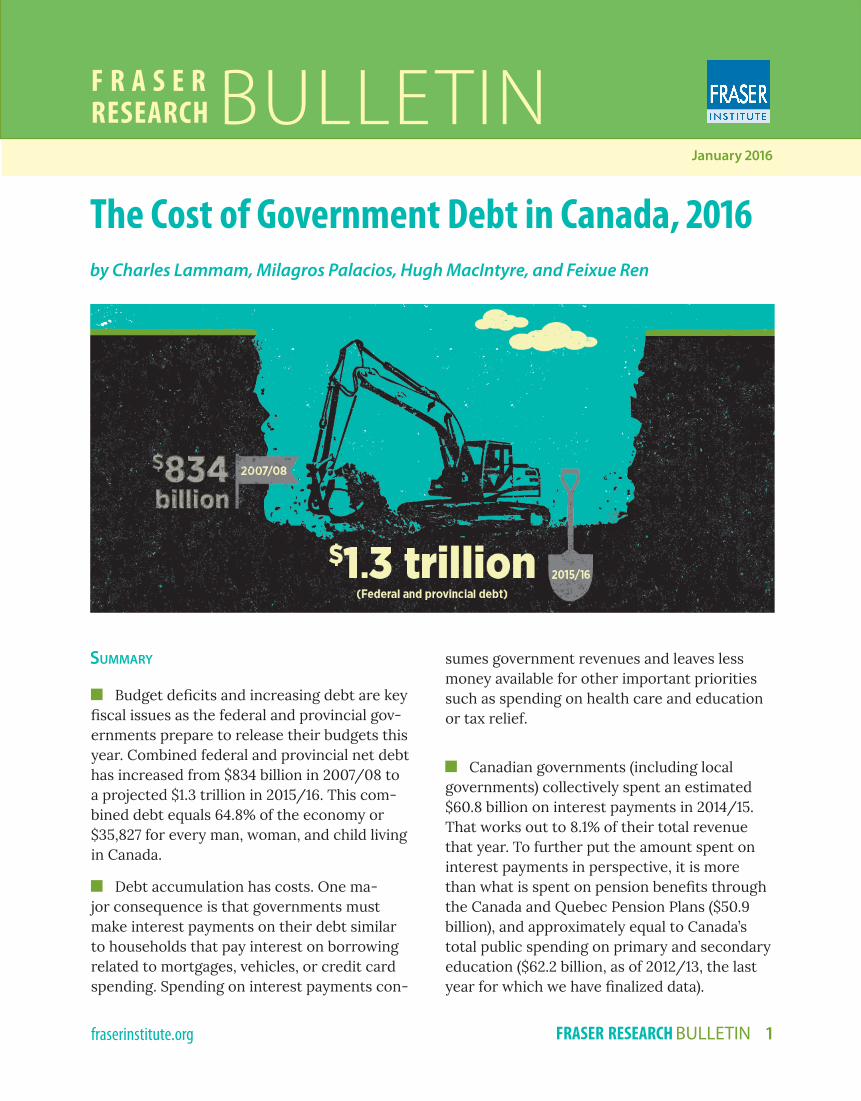
�� Budget deficits and increasing debt are key fiscal issues as the federal and provincial gov-ernments prepare to release their budgets this year. Combined federal and provincial net debt has increased from $834 billion in 2007/08 to a projected $1.3 trillion in 2015/16. This com-bined debt equals 64.8% of the economy or $35,827 for every man, woman, and child living in Canada.
�� Debt accumulation has costs. One ma-jor consequence is that governments must make interest payments on their debt similar to households that pay interest on bor rowing related to mortgages, vehicles, or credit card spending. Spending on interest payments con-
sumes government revenues and leaves less money available for other important priorities such as spending on health care and education or tax relief.
�� Canadian governments (including local gov ernments) collectively spent an estimated $60.8 billion on interest payments in 2014/15. That works out to 8.1% of their total revenue that year. To further put the amount spent on interest payments in perspective, it is more than what is spent on pension benefits through the Canada and Quebec Pension Plans ($50.9 billion), and approximately equal to Canada’s total public spending on primary and sec ondary education ($62.2 billion, as of 2012/13, the last year for which we have finalized data).
Summary
The Cost of Government Debt in Canada, 2016by Charles Lammam, Milagros Palacios, Hugh MacIntyre, and Feixue Ren
The Cost of Government Debt in Canada, 2016
fraserinstitute.org FRASER RESEARCH BULLETIN 2
IntroductionAlmost seven years after the 2008/09 reces-sion, budget deficits and increased government debt remain ongoing fiscal issues in Canada. Currently the federal government and eight out of 10 provinces are projecting deficits for the 2015/16 fiscal year. Debt levels for all gov-ernments are projected to grow in 2015/16 and rising debt levels in some provinces, including Ontario, have attracted negative attention from international credit agencies.1 With govern-ments set to release their budgets in the com-ing months, deficits and debt warrant close attention. The ongoing trend of deficit spend-ing and growing government debt for many Canadian governments carries short-and long-term consequences for the country and its citi-zens.
This research bulletin examines the growth of government debt in Canada since the 2008/09 recession and the immediate consequences of that debt—specifically, government spending on interest payments to service previously accu-mulated debt.2
1 In this research bulletin, debt is defined as net direct debt. Net debt is the amount of total (gross) debt (including pension liabilities) minus financial assets. “Direct debt” refers to debt that government has borrowed directly. In con trast, “indirect debt” is other liabilities that represent a future claim on gov-ernment resources and could become direct debt. For more discussion on the measures of debt, see Palacios et al., 2014. The authors use “debt” through-out the rest of the paper to mean “net direct debt.”
2 Canadian governments use different descriptors for interest payments on past debt. “Debt service costs,” “public debt charges,” and “interest on debt” can be found in different budgets or other financial reporting documents. This bulletin uses these dif-ferent terms interchangeably.
Trend reversal: Growing government debt The growth in government debt over the past eight years reversed a positive trend from the mid-1990s to late-2000s when Canada’s federal and provincial governments made consider able progress in reducing their debt burdens (Pala-cios et al., 2014). After a period of debt reduc-tion, combined federal and provincial debt reached a low of $833.8 billion in 2007/08.
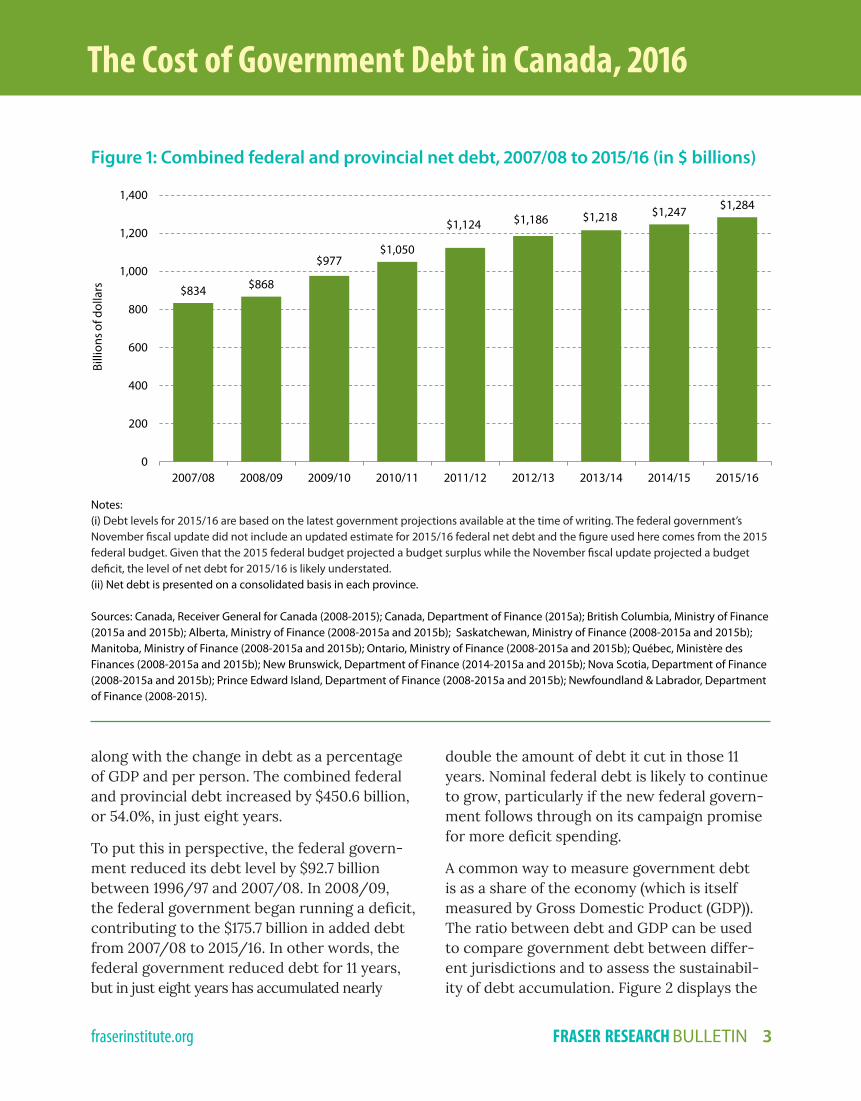
However, the economic recession in 2008/09, combined with the significant increases in gov-ernment spending that took place in 2009/10, meant that every government fell into deficit in either 2008/09 or 2009/10. This started Can-ada’s governments down their current path of persistent deficits and growing debt. The trend has largely persisted since then and will like-ly continue in 2015/16 through the upcoming round of federal and provin cial budgets.3 Figure 1 illustrates total combined federal and provin-cial debt (excluding local gov ernments) from 2007/08 to 2015/16. Total debt in 2015/16 is estimated to be just shy of $1.3 trillion.
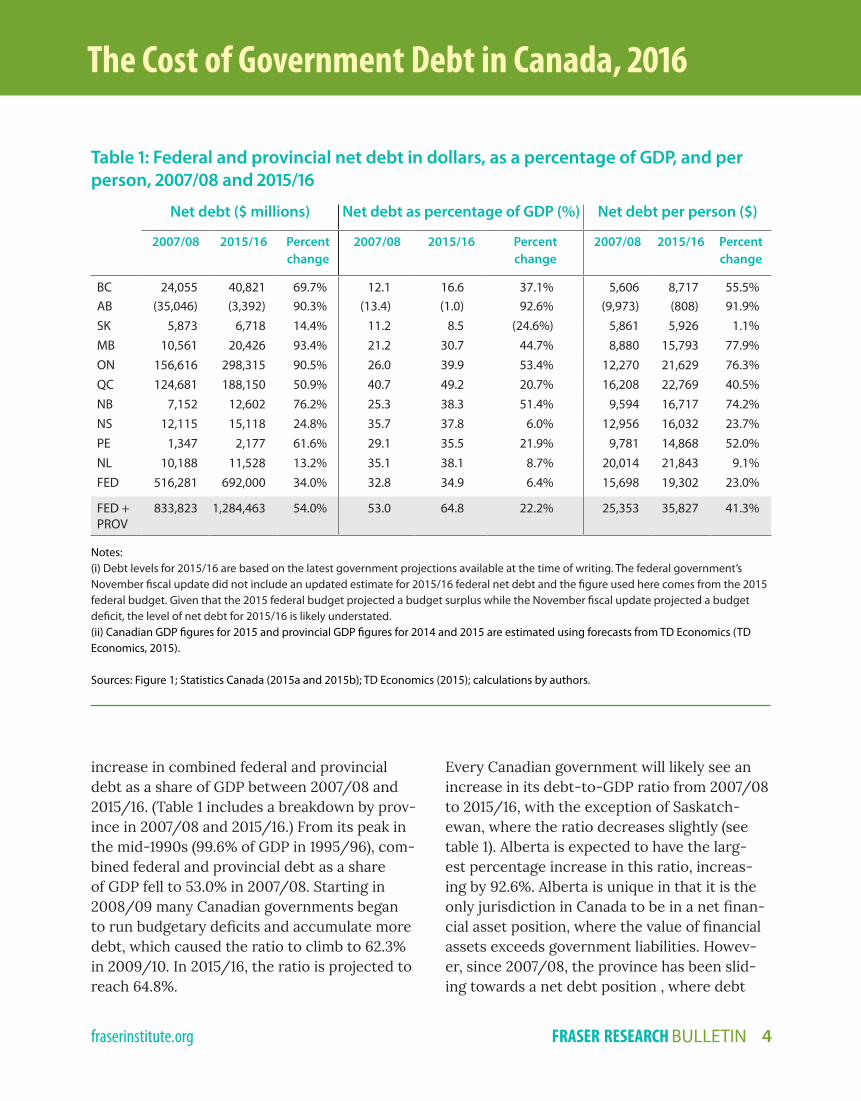
This growth in combined federal and provin-cial debt has not been limited to just a few jurisdic tions. The federal and every provin-cial govern ment increased their debt levels between 2007/08 and 2015/16. Table 1 shows the percentage change in debt for the federal and provincial governments over this period,
3 While recessions and other economic factors that are largely out of the control of governments can affect the growth in government debt, research by Professor Ron Kneebone of the University of Calgary suggests that government policy decisions often have a larger impact on debt accumulation than the ups and downs of the economy, particularly in the case of Ontario (Kneebone and Wilkins, 2014; Knee-bone, 2015a; Kneebone, 2015b).
The Cost of Government Debt in Canada, 2016
fraserinstitute.org FRASER RESEARCH BULLETIN 3
along with the change in debt as a percentage of GDP and per person. The combined federal and provincial debt increased by $450.6 billion, or 54.0%, in just eight years.
To put this in perspective, the federal govern-ment reduced its debt level by $92.7 billion between 1996/97 and 2007/08. In 2008/09, the federal government began running a deficit, contributing to the $175.7 billion in added debt from 2007/08 to 2015/16. In other words, the fed eral government reduced debt for 11 years, but in just eight years has accumulated nearly
double the amount of debt it cut in those 11 years. Nominal federal debt is likely to continue to grow, particularly if the new federal govern-ment follows through on its campaign promise for more deficit spending.
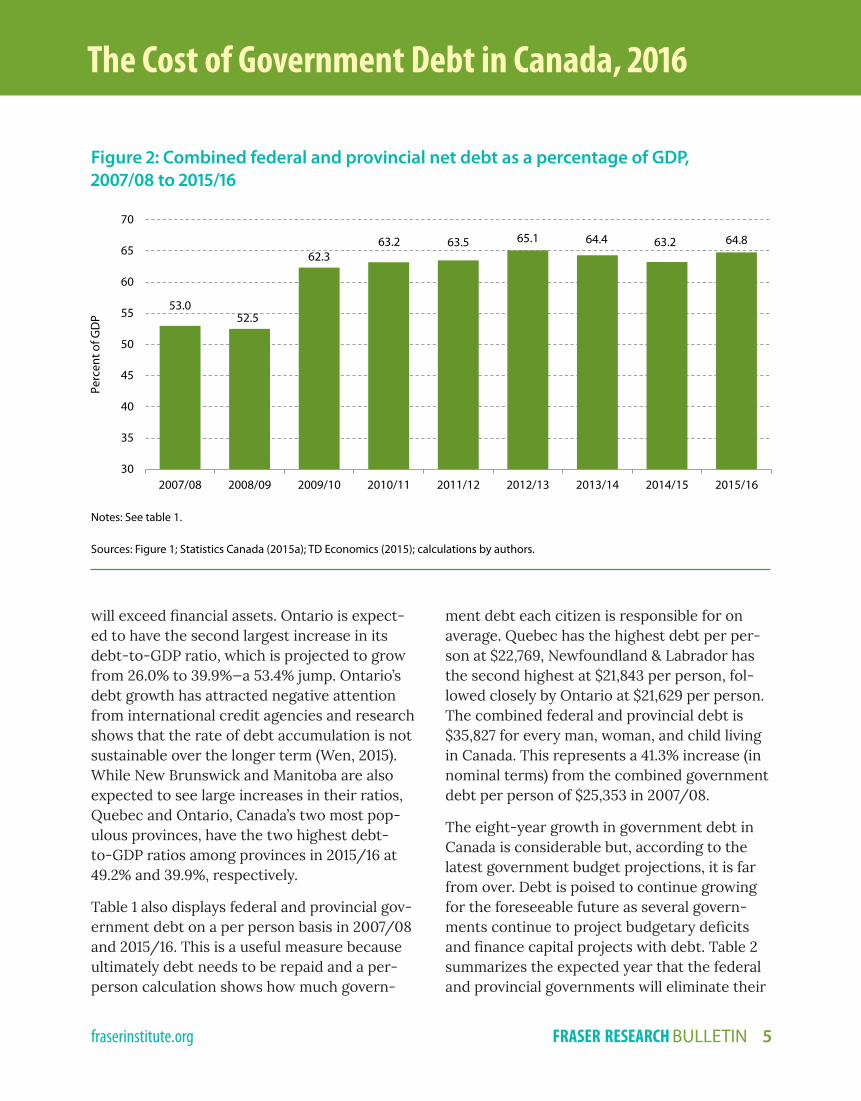
A common way to measure government debt is as a share of the economy (which is itself measured by Gross Domes tic Product (GDP)). The ratio between debt and GDP can be used to compare government debt between differ-ent jurisdictions and to assess the sustainabil-ity of debt accumulation. Fig ure 2 displays the
Figure 1: Combined federal and provincial net debt, 2007/08 to 2015/16 (in $ billions)
Notes:(i) Debt levels for 2015/16 are based on the latest government projections available at the time of writing. The federal government’s November fiscal update did not include an updated estimate for 2015/16 federal net debt and the figure used here comes from the 2015 federal budget. Given that the 2015 federal budget projected a budget surplus while the November fiscal update projected a budget deficit, the level of net debt for 2015/16 is likely understated. (ii) Net debt is presented on a consolidated basis in each province.
Sources: Canada, Receiver General for Canada (2008-2015); Canada, Department of Finance (2015a); British Columbia, Ministry of Finance (2015a and 2015b); Alberta, Ministry of Finance (2008-2015a and 2015b); Saskatchewan, Ministry of Finance (2008-2015a and 2015b); Manitoba, Ministry of Finance (2008-2015a and 2015b); Ontario, Ministry of Finance (2008-2015a and 2015b); Québec, Ministère des Finances (2008-2015a and 2015b); New Brunswick, Department of Finance (2014-2015a and 2015b); Nova Scotia, Department of Finance (2008-2015a and 2015b); Prince Edward Island, Department of Finance (2008-2015a and 2015b); Newfoundland & Labrador, Department of Finance (2008-2015).
$834 $868
$977$1,050
$1,124 $1,186 $1,218 $1,247 $1,284
0
200
400
600
800
1,000
1,200
1,400
2007/08 2008/09 2009/10 2010/11 2011/12 2012/13 2013/14 2014/15 2015/16
Billi
ons o
f dol
lars
The Cost of Government Debt in Canada, 2016
fraserinstitute.org FRASER RESEARCH BULLETIN 4
increase in combined federal and provincial debt as a share of GDP between 2007/08 and 2015/16. (Table 1 includes a breakdown by prov-ince in 2007/08 and 2015/16.) From its peak in the mid-1990s (99.6% of GDP in 1995/96), com-bined federal and provincial debt as a share of GDP fell to 53.0% in 2007/08. Starting in 2008/09 many Canadian governments began to run budgetary deficits and accumulate more debt, which caused the ratio to climb to 62.3% in 2009/10. In 2015/16, the ratio is projected to reach 64.8%.
Every Canadian government will likely see an increase in its debt-to-GDP ratio from 2007/08 to 2015/16, with the exception of Saskatch-ewan, where the ratio decreases slightly (see table 1). Alberta is expected to have the larg-est percentage increase in this ratio, increas-ing by 92.6%. Alberta is unique in that it is the only jurisdiction in Canada to be in a net finan-cial asset position, where the value of financial assets exceeds government liabilities. Howev-er, since 2007/08, the province has been slid-ing towards a net debt position , where debt
Table 1: Federal and provincial net debt in dollars, as a percentage of GDP, and per person, 2007/08 and 2015/16
Net debt ($ millions) Net debt as percentage of GDP (%) Net debt per person ($)
2007/08 2015/16 Percent change
2007/08 2015/16 Percent change
2007/08 2015/16 Percent change
BC 24,055 40,821 69.7% 12.1 16.6 37.1% 5,606 8,717 55.5%AB (35,046) (3,392) 90.3% (13.4) (1.0) 92.6% (9,973) (808) 91.9%SK 5,873 6,718 14.4% 11.2 8.5 (24.6%) 5,861 5,926 1.1%MB 10,561 20,426 93.4% 21.2 30.7 44.7% 8,880 15,793 77.9%ON 156,616 298,315 90.5% 26.0 39.9 53.4% 12,270 21,629 76.3%QC 124,681 188,150 50.9% 40.7 49.2 20.7% 16,208 22,769 40.5%NB 7,152 12,602 76.2% 25.3 38.3 51.4% 9,594 16,717 74.2%NS 12,115 15,118 24.8% 35.7 37.8 6.0% 12,956 16,032 23.7%PE 1,347 2,177 61.6% 29.1 35.5 21.9% 9,781 14,868 52.0%NL 10,188 11,528 13.2% 35.1 38.1 8.7% 20,014 21,843 9.1%FED 516,281 692,000 34.0% 32.8 34.9 6.4% 15,698 19,302 23.0%
FED + PROV
833,823 1,284,463 54.0% 53.0 64.8 22.2% 25,353 35,827 41.3%
Notes: (i) Debt levels for 2015/16 are based on the latest government projections available at the time of writing. The federal government’s November fiscal update did not include an updated estimate for 2015/16 federal net debt and the figure used here comes from the 2015 federal budget. Given that the 2015 federal budget projected a budget surplus while the November fiscal update projected a budget deficit, the level of net debt for 2015/16 is likely understated. (ii) Canadian GDP figures for 2015 and provincial GDP figures for 2014 and 2015 are estimated using forecasts from TD Economics (TD Economics, 2015). Sources: Figure 1; Statistics Canada (2015a and 2015b); TD Economics (2015); calculations by authors.
The Cost of Government Debt in Canada, 2016
fraserinstitute.org FRASER RESEARCH BULLETIN 5
Figure 2: Combined federal and provincial net debt as a percentage of GDP, 2007/08 to 2015/16
Notes: See table 1.
Sources: Figure 1; Statistics Canada (2015a); TD Economics (2015); calculations by authors.
will exceed financial assets. Ontario is expect-ed to have the second largest increase in its debt-to-GDP ratio, which is projected to grow from 26.0% to 39.9%—a 53.4% jump. Ontario’s debt growth has attracted negative attention from international credit agencies and research shows that the rate of debt accumulation is not sustainable over the longer term (Wen, 2015). While New Brunswick and Manitoba are also expected to see large increases in their ratios, Quebec and Ontario, Canada’s two most pop-ulous provinces, have the two highest debt-to-GDP ratios among provinces in 2015/16 at 49.2% and 39.9%, respectively.
Table 1 also displays federal and provincial gov-ernment debt on a per person basis in 2007/08 and 2015/16. This is a useful measure because ultimately debt needs to be repaid and a per-person calculation shows how much govern-
ment debt each citizen is responsible for on average. Quebec has the highest debt per per-son at $22,769, Newfoundland & Labrador has the second highest at $21,843 per person, fol-lowed closely by Ontario at $21,629 per person. The combined federal and provincial debt is $35,827 for every man, woman, and child living in Canada. This represents a 41.3% increase (in nominal terms) from the combined government debt per person of $25,353 in 2007/08.
The eight-year growth in government debt in Canada is considerable but, according to the lat est government budget projections, it is far from over. Debt is poised to continue growing for the foresee able future as several govern-ments continue to project budgetary deficits and finance capital projects with debt. Table 2 summarizes the expected year that the federal and provin cial governments will eliminate their
53.052.5
62.363.2 63.5 65.1 64.4 63.2 64.8
30
35
40
45
50
55
60
65
70
2007/08 2008/09 2009/10 2010/11 2011/12 2012/13 2013/14 2014/15 2015/16
Perc
ent o
f GD
P

The Cost of Government Debt in Canada, 2016
fraserinstitute.org FRASER RESEARCH BULLETIN 6
deficits as well as the number of years of pro-jected defi cits since 2008/09.
There is uncertainty about whether some gov-ernments will actually achieve a balanced bud-get on schedule. For instance, the projected year of federal deficit elimination does not take into account spending promises made by the new federal government during the 2015 election. The timeline for a balanced bud-get in Ontario remains precarious (FAO, 2015). And several provinces have recently pushed back their planned date for deficit elimination. Newfoundland & Labrador’s government had previously planned to eliminate its deficit by 2015/16 but the new target has been delayed to 2019/20.4 The governments of New Brunswick and Prince Edward Island have also delayed their deficit elimination date by another year. Notably, the new Alberta government has recently backed away from an election cam-paign commitment to balance the budget by 2018/19; it now plans to balance the budget by 2019/20.
The uncertainty around the timing of defi-cit elimination means that the total amount of debt that will be accumulated before Canadian governments ultimately return to surplus is still unclear. However, one thing is sure: Canadian governments have collectively increased debt since 2007/08 and eroded the progress made from the mid-1990s through to the late-2000s. The sooner governments return to balanced budgets, the sooner they can begin restoring the long-run health of Canada’s pub lic finances.
4 The 2019/20 target for deficit elimination in Newfoundland & Labrador was set by the previous government, but the new government’s election platform also established 2019/20 as the target. For further details, see http://nlliberals.ca/why-liberal/our-five-point-plan/.
Table 2: Expected year of deficit elimination, federal and provincial governments (as of December 4, 2015)
Projected year of deficit elimination from latest
budget
Projected number of years in deficit
since 2008/09
BC Surplus projected for 2015/16
4
AB 2019/20 10
SK n/a 4
MB 2018/19 9
ON 2017/18 9
QC Surplus projected for 2015/16
6
NB 2018/19 10
NS 2016/17 6
PE 2016/17 8
NL 2019/20 8
FED 2019/20 10
Notes:
(i) Provinces that have eliminated their deficit may still be ac-cumulating debt due to debt-financed capital spending (Wen, 2014). For example, despite expecting a balanced operating budget, British Columbia projects that its net debt will increase by $1.9 billion in 2015/16 compared to the previous year (British Columbia, Ministry of Finance, 2015b).
(ii) The fiscal balance is based on consolidated government figures for each province except for Nova Scotia, which reports its 2015 budget on a General Revenue Fund basis.
(iii) The Saskatchewan government initially projected a surplus for 2015/16 in its 2015 budget, but the most recent update shows that the government now expects a deficit for 2015/16.
(iv) The projected year of federal deficit elimination does not take into account the new federal government’s spending commit-ments made during the 2015 federal election.
Sources: Canada, Department of Finance (2015b); British Co-lumbia, Ministry of Finance (2015c); Alberta, Ministry of Finance (2015b); Saskatchewan, Ministry of Finance (2015c); Manitoba, Ministry of Finance (2015c); Ontario, Ministry of Finance (2015b); Québec, Ministère des Finances (2015b); New Brunswick, Depart-ment of Finance (2015b); Nova Scotia, Department of Finance (2015c); Prince Edward Island, Department of Finance (2015b); Newfoundland & Labrador, Department of Finance (2015); calcu-lations by authors.
The Cost of Government Debt in Canada, 2016
fraserinstitute.org FRASER RESEARCH BULLETIN 7
Why growing government debt is problematic
Empirical research has found that a nega-tive relationship exists between government debt and economic growth (Reinhart and Rog-off, 2010; Cecchetti et al., 2011; Checherita and Rother, 2010; Woo and Kumar, 2014; Chudik et al., 2015; Eberhardt and Presbitero, 2015; Égert, 2015). This negative rela tionship can be explained in different ways but one impor-tant way relates to the effect of government debt on private invest ment. When government debt expands, it can cause long-term interest rates to rise, which in turn increases the cost of private sector bor rowing. Higher borrowing costs can then dis courage private capital investment, which is a key driver of long-term economic growth.
There are also immediate consequences from government debt in the form of interest pay-ments, or what are called debt servicing costs. Governments must make interest payments on their debt similar to households that must pay interest on borrowing related to mortgages, vehicles, or credit card spending. Government spending on debt servicing costs results in less revenue available for important priorities such as tax relief and spending on public programs like health care, education, and social services.
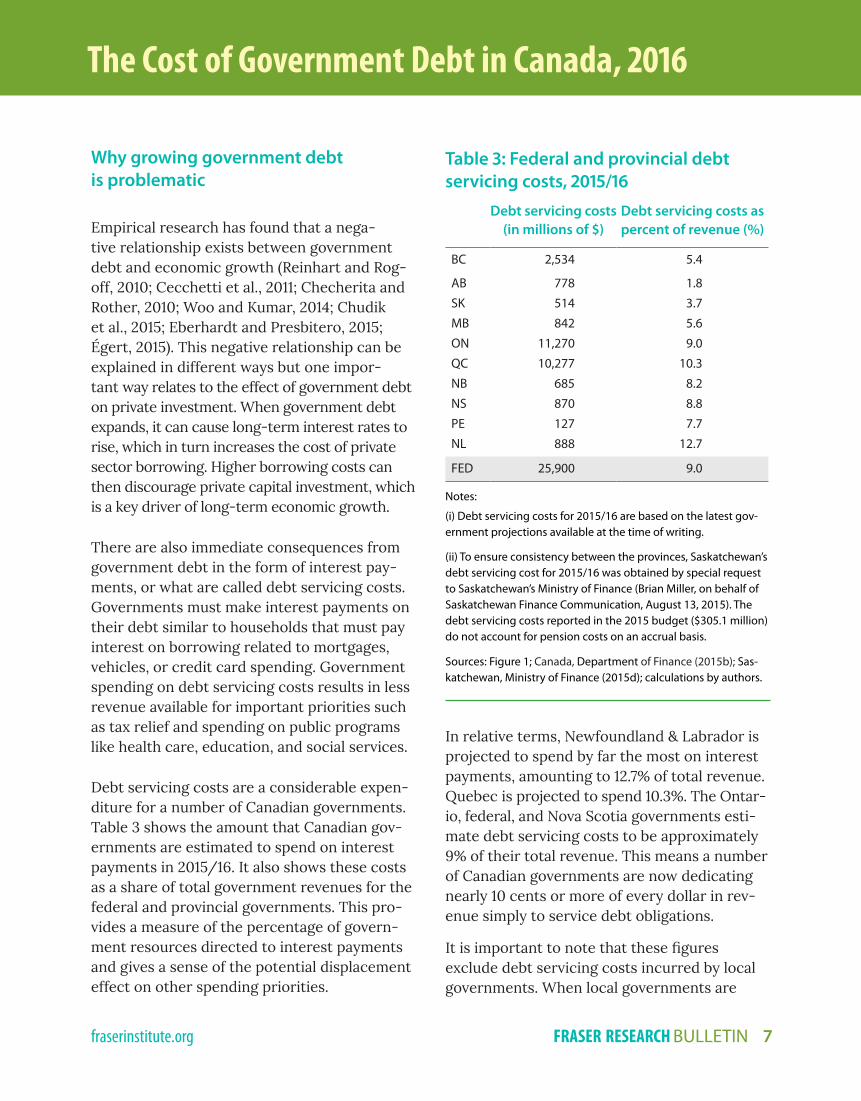
Debt servicing costs are a consid erable expen-diture for a number of Canadian governments. Table 3 shows the amount that Canadian gov-ernments are estimated to spend on interest payments in 2015/16. It also shows these costs as a share of total government revenues for the federal and pro vincial governments. This pro-vides a measure of the percentage of govern-ment resources directed to interest payments and gives a sense of the potential displacement effect on other spending priorities.
In relative terms, Newfoundland & Labrador is projected to spend by far the most on interest payments, amounting to 12.7% of total revenue. Quebec is projected to spend 10.3%. The Ontar-io, federal, and Nova Scotia gov ernments esti-mate debt servicing costs to be approximately 9% of their total revenue. This means a number of Canadian governments are now dedicating nearly 10 cents or more of every dollar in rev-enue simply to service debt obligations.
It is important to note that these figures exclude debt servicing costs incurred by local governments. When local governments are
Table 3: Federal and provincial debt servicing costs, 2015/16
Debt servicing costs (in millions of $)
Debt servicing costs as percent of revenue (%)
BC 2,534 5.4
AB 778 1.8
SK 514 3.7
MB 842 5.6
ON 11,270 9.0
QC 10,277 10.3
NB 685 8.2
NS 870 8.8
PE 127 7.7
NL 888 12.7
FED 25,900 9.0
Notes:
(i) Debt servicing costs for 2015/16 are based on the latest gov-ernment projections available at the time of writing.
(ii) To ensure consistency between the provinces, Saskatchewan’s debt servicing cost for 2015/16 was obtained by special request to Saskatchewan’s Ministry of Finance (Brian Miller, on behalf of Saskatchewan Finance Communication, August 13, 2015). The debt servicing costs reported in the 2015 budget ($305.1 million) do not account for pension costs on an accrual basis.
Sources: Figure 1; Canada, Department of Finance (2015b); Sas-katchewan, Ministry of Finance (2015d); calculations by authors.
The Cost of Government Debt in Canada, 2016
fraserinstitute.org FRASER RESEARCH BULLETIN 8
included, total debt servicing costs in Canada for 2014/15 (the latest year of available data) totalled $60.8 billion, or 8.1% of total govern-ment revenue5 (Statistics Canada, 2015d).
Debt accumulation is a significant driver of debt servicing costs. But debt levels alone do not determine the magnitude of interest pay-ments. The interest rate, or the cost of borrow-ing, also has a significant impact. Governments have been able to borrow at historically low rates. If interest rates rise, borrowing costs will rise accordingly and result in even more resources being directed to debt servicing costs. Govern ments that maintain relatively high debt levels, such as Ontario and Quebec, are
5 Total government revenue includes CPP and QPP contributions.
especially vulnerable to interest rate increases (Wen, forthcoming).
Debt servicing costs compared to other spending
More spending on debt servicing costs invari-ably means that fewer resources are available for public priorities. To put debt servicing costs into perspective, consider the following illustra-tions from Canada’s three largest governments.
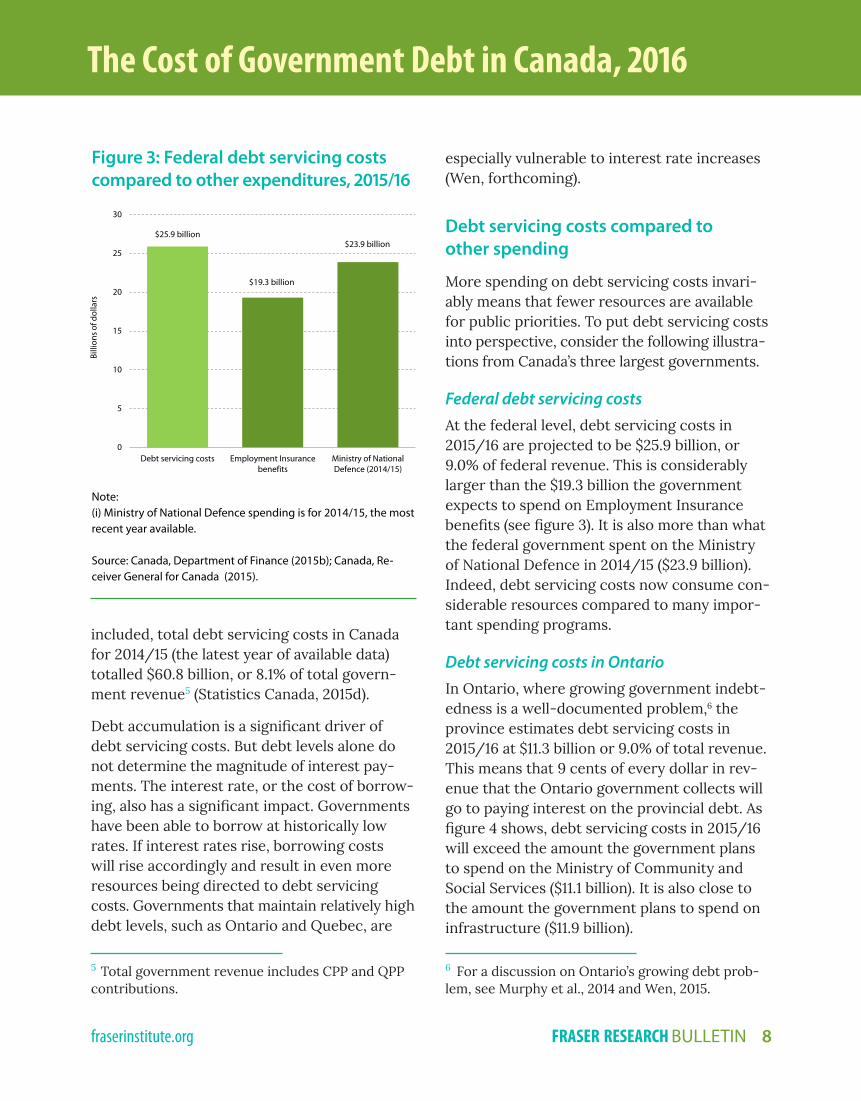
Federal debt servicing costs At the federal level, debt servicing costs in 2015/16 are projected to be $25.9 billion, or 9.0% of federal revenue. This is considerably larger than the $19.3 billion the government expects to spend on Employment Insurance benefits (see figure 3). It is also more than what the federal government spent on the Ministry of National Defence in 2014/15 ($23.9 billion). Indeed, debt servicing costs now consume con-siderable resources compared to many impor-tant spending programs.
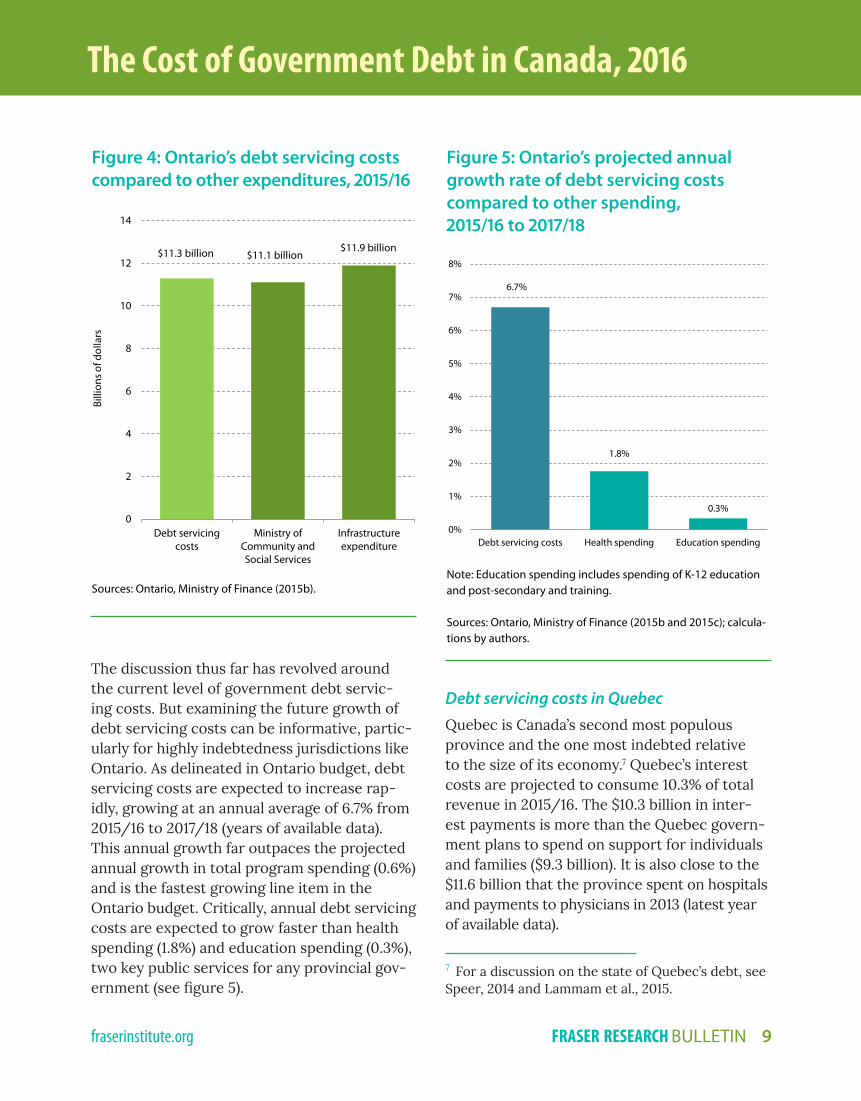
Debt servicing costs in Ontario In Ontario, where growing government indebt-edness is a well-documented problem,6 the province estimates debt servicing costs in 2015/16 at $11.3 billion or 9.0% of total reve nue. This means that 9 cents of every dol lar in rev-enue that the Ontario government collects will go to paying interest on the provincial debt. As figure 4 shows, debt servicing costs in 2015/16 will exceed the amount the government plans to spend on the Ministry of Community and Social Services ($11.1 billion). It is also close to the amount the government plans to spend on infrastructure ($11.9 billion).
6 For a discussion on Ontario’s growing debt prob-lem, see Murphy et al., 2014 and Wen, 2015.
Figure 3: Federal debt servicing costs compared to other expenditures, 2015/16
Note:(i) Ministry of National Defence spending is for 2014/15, the most recent year available.
Source: Canada, Department of Finance (2015b); Canada, Re-ceiver General for Canada (2015).
$25.9 billion
$19.3 billion
$23.9 billion
0
5
10
15
20
25
30
Debt servicing costs Employment Insurancebenefits
Ministry of NationalDefence (2014/15)
Billi
ons o
f dol
lars
The Cost of Government Debt in Canada, 2016
fraserinstitute.org FRASER RESEARCH BULLETIN 9
The discussion thus far has revolved around the current level of government debt servic-ing costs. But examining the future growth of debt servicing costs can be informative, partic-ularly for highly indebtedness jurisdictions like Ontario. As delineated in Ontario budget, debt servicing costs are expected to increase rap-idly, growing at an annual average of 6.7% from 2015/16 to 2017/18 (years of available data). This annual growth far outpaces the projected annual growth in total program spending (0.6%) and is the fastest growing line item in the Ontario budget. Critically, annual debt servicing costs are expected to grow faster than health spending (1.8%) and education spending (0.3%), two key public services for any provincial gov-ernment (see figure 5).
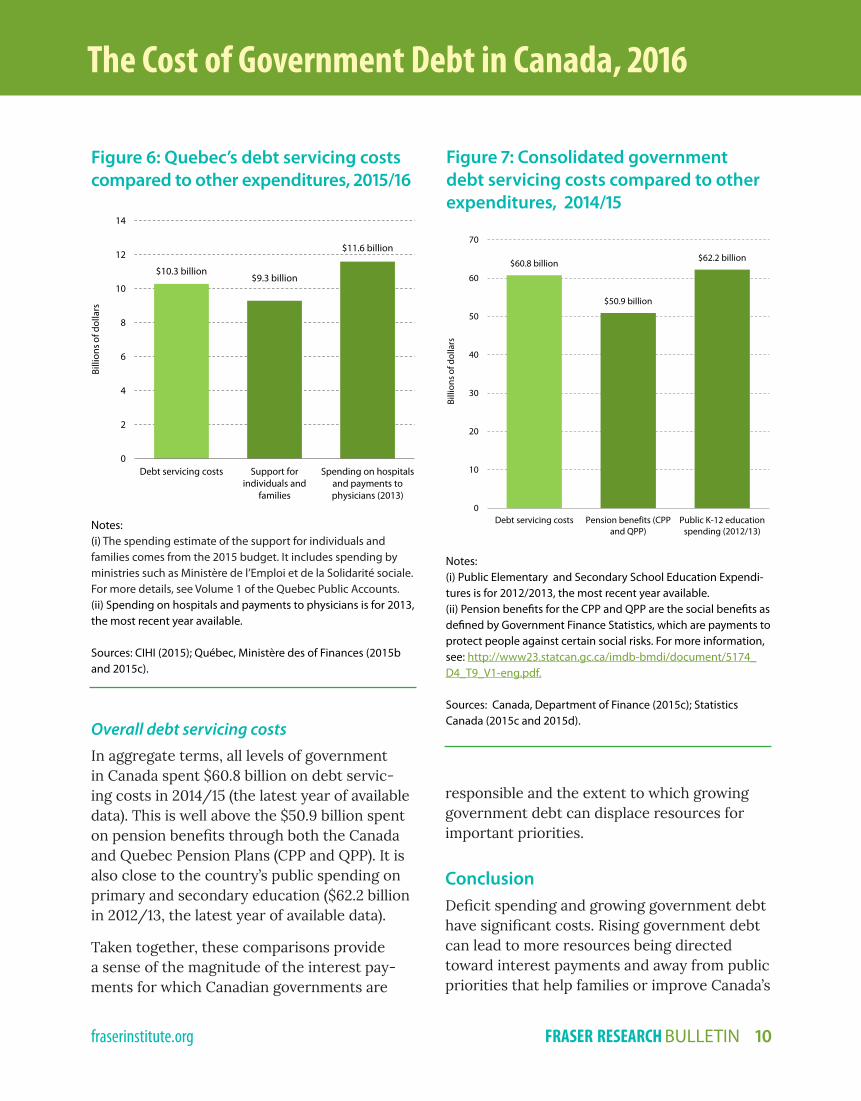
Debt servicing costs in Quebec Quebec is Canada’s second most populous province and the one most indebted relative to the size of its economy.7 Quebec’s interest costs are projected to consume 10.3% of total revenue in 2015/16. The $10.3 billion in inter-est payments is more than the Quebec govern-ment plans to spend on support for individuals and families ($9.3 billion). It is also close to the $11.6 billion that the province spent on hospitals and payments to physicians in 2013 (latest year of available data).
7 For a discussion on the state of Quebec’s debt, see Speer, 2014 and Lammam et al., 2015.
Figure 4: Ontario’s debt servicing costs compared to other expenditures, 2015/16
Sources: Ontario, Ministry of Finance (2015b).
Figure 5: Ontario’s projected annual growth rate of debt servicing costs compared to other spending, 2015/16 to 2017/18
Note: Education spending includes spending of K-12 education and post-secondary and training.
Sources: Ontario, Ministry of Finance (2015b and 2015c); calcula-tions by authors.
$11.1 billion$11.3 billion $11.9 billion
0
2
4
6
8
10
12
14
Debt servicingcosts
Ministry ofCommunity andSocial Services
Infrastructureexpenditure
Billi
ons o
f dol
lars
6.7%
1.8%
0.3%
0%
1%
2%
3%
4%
5%
6%
7%
8%
Debt servicing costs Health spending Education spending
The Cost of Government Debt in Canada, 2016
fraserinstitute.org FRASER RESEARCH BULLETIN 10
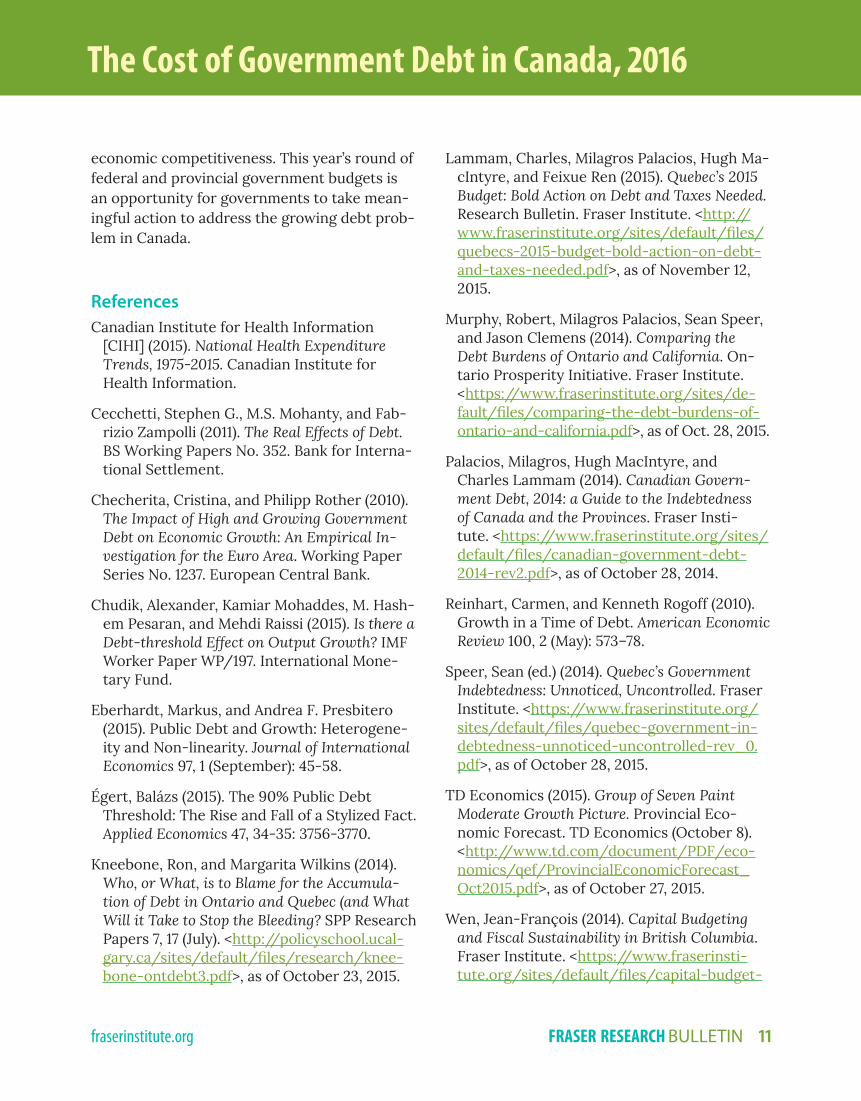
Overall debt servicing costs In aggregate terms, all levels of government in Canada spent $60.8 billion on debt servic-ing costs in 2014/15 (the latest year of available data). This is well above the $50.9 billion spent on pension benefits through both the Canada and Quebec Pension Plans (CPP and QPP). It is also close to the country’s public spending on primary and secondary educa tion ($62.2 billion in 2012/13, the latest year of available data).
Taken together, these comparisons provide a sense of the magnitude of the interest pay-ments for which Canadian governments are
responsible and the extent to which growing government debt can displace resources for important priorities.
Conclusion Deficit spending and growing government debt have significant costs. Rising government debt can lead to more resources being directed toward interest payments and away from public priorities that help fami lies or improve Canada’s
Figure 7: Consolidated government debt servicing costs compared to other expenditures, 2014/15
Notes:(i) Public Elementary and Secondary School Education Expendi-tures is for 2012/2013, the most recent year available.(ii) Pension benefits for the CPP and QPP are the social benefits as defined by Government Finance Statistics, which are payments to protect people against certain social risks. For more information, see: http://www23.statcan.gc.ca/imdb-bmdi/document/5174_D4_T9_V1-eng.pdf. Sources: Canada, Department of Finance (2015c); Statistics Canada (2015c and 2015d).
Figure 6: Quebec’s debt servicing costs compared to other expenditures, 2015/16
Notes:(i) The spending estimate of the support for individuals and families comes from the 2015 budget. It includes spending by ministries such as Ministère de l’Emploi et de la Solidarité sociale. For more details, see Volume 1 of the Quebec Public Accounts.(ii) Spending on hospitals and payments to physicians is for 2013, the most recent year available.
Sources: CIHI (2015); Québec, Ministère des of Finances (2015b and 2015c).
$10.3 billion$9.3 billion
$11.6 billion
0
2
4
6
8
10
12
14
Debt servicing costs Support forindividuals and
families
Spending on hospitalsand payments tophysicians (2013)
Billi
ons o
f dol
lars
$60.8 billion
$50.9 billion
$62.2 billion
0
10
20
30
40
50
60
70
Debt servicing costs Pension benefits (CPPand QPP)
Public K-12 educationspending (2012/13)
Billi
ons o
f dol
lars
The Cost of Government Debt in Canada, 2016
fraserinstitute.org FRASER RESEARCH BULLETIN 11
economic competi tiveness. This year’s round of federal and provincial government budgets is an opportunity for governments to take mean-ingful action to address the growing debt prob-lem in Canada.
References Canadian Institute for Health Information
[CIHI] (2015). National Health Expenditure Trends, 1975-2015. Canadian Institute for Health Information.
Cecchetti, Stephen G., M.S. Mohanty, and Fab-rizio Zampolli (2011). The Real Effects of Debt. BS Working Papers No. 352. Bank for Interna-tional Settlement.
Checherita, Cristina, and Philipp Rother (2010). The Impact of High and Growing Government Debt on Economic Growth: An Empirical In-vestigation for the Euro Area. Working Paper Series No. 1237. European Central Bank.
Chudik, Alexander, Kamiar Mohaddes, M. Hash-em Pesaran, and Mehdi Raissi (2015). Is there a Debt-threshold Effect on Output Growth? IMF Worker Paper WP/197. International Mone-tary Fund.
Eberhardt, Markus, and Andrea F. Presbitero (2015). Public Debt and Growth: Heterogene-ity and Non-linearity. Journal of International Economics 97, 1 (September): 45-58.
Égert, Balázs (2015). The 90% Public Debt Threshold: The Rise and Fall of a Stylized Fact. Applied Economics 47, 34-35: 3756-3770.
Kneebone, Ron, and Margarita Wilkins (2014). Who, or What, is to Blame for the Accumula-tion of Debt in Ontario and Quebec (and What Will it Take to Stop the Bleeding? SPP Research Papers 7, 17 (July). <http://policyschool.ucal-gary.ca/sites/default/files/research/knee-bone-ontdebt3.pdf>, as of October 23, 2015.
Lammam, Charles, Milagros Palacios, Hugh Ma-cIntyre, and Feixue Ren (2015). Quebec’s 2015 Budget: Bold Action on Debt and Taxes Needed. Research Bulletin. Fraser Institute. <http://www.fraserinstitute.org/sites/default/files/quebecs-2015-budget-bold-action-on-debt-and-taxes-needed.pdf>, as of November 12, 2015.
Murphy, Robert, Milagros Palacios, Sean Speer, and Jason Clemens (2014). Comparing the Debt Burdens of Ontario and California. On-tario Prosperity Initiative. Fra ser Institute. <https://www.fraserinstitute.org/sites/de-fault/files/comparing-the-debt-burdens-of-ontario-and-california.pdf>, as of Oct. 28, 2015.
Palacios, Milagros, Hugh MacIntyre, and Charles Lammam (2014). Canadian Govern-ment Debt, 2014: a Guide to the Indebtedness of Canada and the Provinces. Fraser Insti-tute. <https://www.fraserinstitute.org/sites/default/files/canadian-government-debt-2014-rev2.pdf>, as of October 28, 2014.
Reinhart, Carmen, and Kenneth Rogoff (2010). Growth in a Time of Debt. American Economic Review 100, 2 (May): 573–78.
Speer, Sean (ed.) (2014). Quebec’s Government Indebtedness: Unnoticed, Uncontrolled. Fraser Institute. <https://www.fraserinstitute.org/sites/default/files/quebec-government-in-debtedness-unnoticed-uncontrolled-rev_0.pdf>, as of October 28, 2015.
TD Economics (2015). Group of Seven Paint Moderate Growth Picture. Provincial Eco-nomic Forecast. TD Economics (October 8). <http://www.td.com/document/PDF/eco-nomics/qef/ProvincialEconomicForecast_Oct2015.pdf>, as of October 27, 2015.
Wen, Jean-François (2014). Capital Budgeting and Fiscal Sustainability in British Columbia. Fraser Institute. <https://www.fraserinsti-tute.org/sites/default/files/capital-budget-
The Cost of Government Debt in Canada, 2016
fraserinstitute.org FRASER RESEARCH BULLETIN 12
ing-and-fiscal-sustainability-in-british-co-lumbia.pdf >, as of October 28, 2015.
Wen, Jean-François (2015). Ontario’s Debt Bal-loon: Source and Sustainability. Fraser In-stitute. <http://fraserinstitute.org/sites/default/files/ontarios-debt-balloon-source-and-sustainability-rev.pdf>, as of October 22, 2015.
Wen, Jean-François (forthcoming). The Impact of Higher Interest Rates on the Cost of Servic-ing Government Debt. Fraser Institute.
Woo, Jaejoon, and Manmohan S. Kumar (2014). Public Debt and Growth. Economica 82, 328 (October): 705-739.
Government sourcesAlberta, Ministry of Finance (2008-2015a). Pub-
lic Accounts. Government of Alberta.
Alberta, Ministry of Finance (2015b). Budget Plan 2015 (October). Government of Alberta.
British Columbia, Ministry of Finance (2015a). 2015 Financial and Economic Review (July). Government of British Columbia.
British Columbia, Ministry of Finance (2015b). 2015/16 Quarterly Report. Government of British Columbia.
British Columbia, Ministry of Finance (2015c). Budget and Fiscal Plan 2015/16. Government of British Columbia.
Canada, Department of Finance (2015a). Budget Plan 2015. Government of Canada.
Canada, Department of Finance (2015b). Update of Economic and Fiscal Projections, 2015. Gov-ernment of Canada.
Canada, Department of Finance 2015c). Federal Support to Provinces and Territories. Web table. Government of Canada. <http://www.fin.gc.ca/fedprov/mtp-eng.asp>, as of Oct. 18, 2015.
Canada, Receiver General for Canada (2008–2015). Public Accounts of Canada. Ministry of Public Works and Government Services.
Financial Accountability Office [FAO] (2015). An Assessment of Ontario’s Medium-term Eco-nomic and Fiscal Outlook. Government of On-tario.
Manitoba, Ministry of Finance (2008–2015a). Public Accounts of Manitoba. Government of Manitoba.
Manitoba, Ministry of Finance (2015b). 2015/16 First Quarter. Government of Manitoba.
Manitoba, Ministry of Finance (2015c). Budget 2015. Government of Manitoba.
New Brunswick, Department of Finance (2014–2015a). Public Accounts. Government of New Brunswick.
New Brunswick, Department of Finance (2015b). 2015-2016 First Quarter Report. Government of New Brunswick.
New Brunswick, Department of Finance (2015c). Budget 2015. Government of New Brunswick.
Newfoundland & Labrador, Department of Fi-nance (2008–2014). Public Accounts. Govern-ment of Newfoundland & Labrador.
Newfoundland & Labrador, Department of Fi-nance (2015). Budget 2015. Government of New foundland & Labrador.
Nova Scotia, Department of Finance (2008–2015a). Public Accounts of the Province of Nova Scotia. Government of Nova Scotia.
Nova Scotia, Department of Finance (2015b). 2015 Forecast Update. Government of Nova Scotia.
Nova Scotia, Ministry of Finance (2015c). Budget 2015. Government of Nova Scotia.
The Cost of Government Debt in Canada, 2016
fraserinstitute.org FRASER RESEARCH BULLETIN 13
Ontario, Ministry of Finance (2008–2015a). Pub-lic Accounts of Ontario. Government of Ontario.
Ontario, Ministry of Finance (2015b). Ontario Economic Outlook and Fiscal Review. Govern-ment of Ontario.
Ontario, Ministry of Finance (2015c). Budget 2015. Government of Ontario.
Prince Edward Island, Department of Finance (2008–2015a). Public Accounts. Government of Prince Edward Island.
Prince Edward Island, Department of Finance (2015b). Budget 2015. Government of Prince Ed ward Island.
Québec, Ministère des Finances (2008–2015a). Public Accounts. Government of Québec.
Québec, Ministère des Finances (2015b). Novem-ber 2015 Update. Government of Québec.
Québec, Ministère des Finances (2015c). 2015–2016 Budget Plan. Government of Québec.
Saskatchewan, Ministry of Finance (2008–2015a). Public Accounts. Government of Saskatche wan.
Saskatchewan, Ministry of Finance (2015b). Budget 2015. Government of Saskatchewan.
Saskatchewan, Ministry of Finance (2015c). 2015-16 First Quarter Financial Report. Gov-ernment of Saskatchewan.
Saskatchewan, Ministry of Finance (2015d). Special request from the Ministry of Finance, Saskatchewan. Government of Saskatchewan.
Statistics Canada (2015a). CANSIM Table 384-0038: Real Gross Domestic Product, income-based, provincial and territorial, annual (in millions). Statistics Canada. <http://www5.statcan.gc.ca/cansim/a26?lang=eng&retrLang=eng&id=3840038&paSer=&pattern=&stByVal=1&p1=1&p2=-1&tabMode=dataTable&csid=>, as of December 4, 2015.
Statistics Canada (2015b). CANSIM Table 051–0001: Estimates of Population, by Age Group and Sex for July 1, Canada, Provinces and Ter-ritories, annual. Statistics Canada. <http://www5.statcan.gc.ca/cansim/a26?lang=eng&retrLang=eng&id=0510001&tabMode=dataTable&srchLan=-1&p1=-1&p2=9>, as of Dec. 4, 2015.
Statistics Canada (2015c). CANSIM Table 385–0032: Government finance statistics, statement of government operations and balance sheet, quarterly. <http://www5.statcan.gc.ca/can-sim/a26?lang=eng&id=3850032>, as of Octo-ber 22, 2015.
Statistics Canada (2015d). CANSIM Table 478–0014: Public and private elementary and secondary education expenditures, annu-al. <http://www5.statcan.gc.ca/cansim/a26?lang=eng&id=4780014>, as of Oct. 22, 2015.
AcknowledgmentsThe authors wish to thank the anonymous reviewers for their comments, sugges-tions, and insights. Any remaining errors or over sights are the sole responsibility of the authors. As the researchers have worked independently, the views and conclusions expressed in this paper do not necessar-ily reflect those of the Board of Directors of the Fraser Institute, the staff, or supporters.
The Cost of Government Debt in Canada, 2016
fraserinstitute.org FRASER RESEARCH BULLETIN 14
Charles Lammam is Director of Fis-cal Studies at the Fraser Institute. He has published over 60 studies and 220 original articles on a wide range of economic policy issues. He holds an MA in public policy and a BA in economics with a minor in business administration from Simon Fraser University.
Hugh MacIntyre is a Policy Ana-lyst at the Fraser Institute. He has co-authored numerous studies on topics such as government finances and government performance. His commentaries have appeared in various media outlets including the National Post and the American Enterprise Institute’s prestigious magazine, The American. Mr. MacIntyre holds an MSc in Politi-cal Science from the University of Edinburgh and an Honours BA from the University of Toronto.
Feixue Ren is an Economist at the Fraser Institute. She holds a Mas-ter’s Degree in Economics from Lakehead University and a BA in Statistics from Hunan Normal Uni-versity in China.
Milagros Palacios is a Senior Re-search Economist at the Fraser Institute. She holds a BA in Indus-trial Engineering from the Pon-tifical Catholic University of Peru and a M.Sc. in Economics from the University of Concepción, Chile. Since joining the Institute, she has published or co-published over 80 research studies and over 80 com-mentaries on a wide range of public policy issues including taxation, government finances, investment, productivity, labour markets, and charitable giving.
Copyright © 2016 by the Fraser Institute. All rights re-served. Without written permission, only brief passag-es may be quoted in critical articles and reviews.
ISSN 2291-8620
Media queries: call 604.714.4582 or e-mail: [email protected]
Support the Institute: call 1.800.665.3558, ext. 586 or e-mail: [email protected]
Visit our website: www.fraserinstitute.org