the cook county property tax and … county property...the cook county . property tax extension...
TRANSCRIPT
THE COOK COUNTY PROPERTY TAX EXTENSION PROCESS
A Primer on Levies, Tax Caps, Tax Bills
and the Effects of Tax Increment Financing Districts
Updated on September 7, 2011
ACKNOWLEDGEMENTS
The Civic Federation would like to thank the following individuals for providing data and answering our questions about property tax extension: Bill Vaselopulos, Manager of Tax
Extension and Accounting, Office of the Cook County Clerk, and Bob Benjamin, Office of the Cook County Treasurer.
We would also like to thank the following people for their editorial review: Woods Bowman, DePaul University; Whitney Carlisle, McCracken, Walsh & de LaVan; Mark Davis, O’Keefe
Lyons & Hynes LLC; Thomas McNulty, Neal, Gerber & Eisenberg LLP; Scott Metcalf, Franczek Radelet P.C.; and Timothy Moran, Schmidt Salzman & Moran, Ltd.
This primer was first published on October 5, 2010. The September 7, 2011 update primarily adds an additional year of data where applicable and enhances explanations of
Tax Increment Financing.
Copyright © 2011 The Civic Federation
Chicago, Illinois
TABLE OF CONTENTS
EXECUTIVE SUMMARY ......................................................................................................................................... 2
INTRODUCTION ....................................................................................................................................................... 3
TAX RATES ................................................................................................................................................................ 3
TAXING DISTRICT EAV ............................................................................................................................................. 4 Taxing Districts .................................................................................................................................................... 4 Tax Codes ............................................................................................................................................................. 5 Tax Increment Financing District EAV ................................................................................................................ 7 EAV Available to Taxing Districts ..................................................................................................................... 11
TAXING DISTRICT LEVY .......................................................................................................................................... 14 Rate Limits ......................................................................................................................................................... 16 Property Tax Extension Limitation Law (or “Tax Caps”) ................................................................................. 17 The Conceptual Difference between Rate Limits and Tax Caps ........................................................................ 20
CALCULATION OF FINAL TAX RATE ........................................................................................................................ 24 Composite Tax Rate ........................................................................................................................................... 25 Total Tax Extensions .......................................................................................................................................... 26 Tax Abatement.................................................................................................................................................... 29 TIF Property Tax Revenue ................................................................................................................................. 30 The Effect of TIF Districts on Tax Rates ............................................................................................................ 32 TIF Expenditures for Taxing District Projects ................................................................................................... 36
TAX BILLS ................................................................................................................................................................ 37
BILLING AND COLLECTION ...................................................................................................................................... 37 Delinquent Taxes and Tax Sales ........................................................................................................................ 38 Why Individual Tax Bills Increase or Decrease ................................................................................................. 39 Representing TIF on Tax Bills ........................................................................................................................... 41
DISTRIBUTION TO TAXING DISTRICTS ..................................................................................................................... 43
EFFECTIVE PROPERTY TAX RATES ................................................................................................................ 44
SUMMARY ................................................................................................................................................................ 45
APPENDIX A: NUMBER OF TAXING DISTRICTS ........................................................................................... 47
APPENDIX B: TIF DISTRICT EAV ...................................................................................................................... 48
APPENDIX C: EXAMPLE OF TAXING AGENCY RATE REPORT ............................................................... 49
APPENDIX D: HYPOTHETICAL EXAMPLE OF EFFECT OF TIF ON MAXIMUM EXTENSION .......... 50
APPENDIX E: TIF FUNDS ALLOCATED FOR CHICAGO PUBLIC SCHOOLS .......................................... 55
APPENDIX F: TAX RATES AND EXTENSIONS OF MAJOR TAXING DISTRICTS IN THE CITY OF CHICAGO .................................................................................................................................................................. 56
1
APPENDIX G: EFFECTIVE PROPERTY TAX RATES ..................................................................................... 59
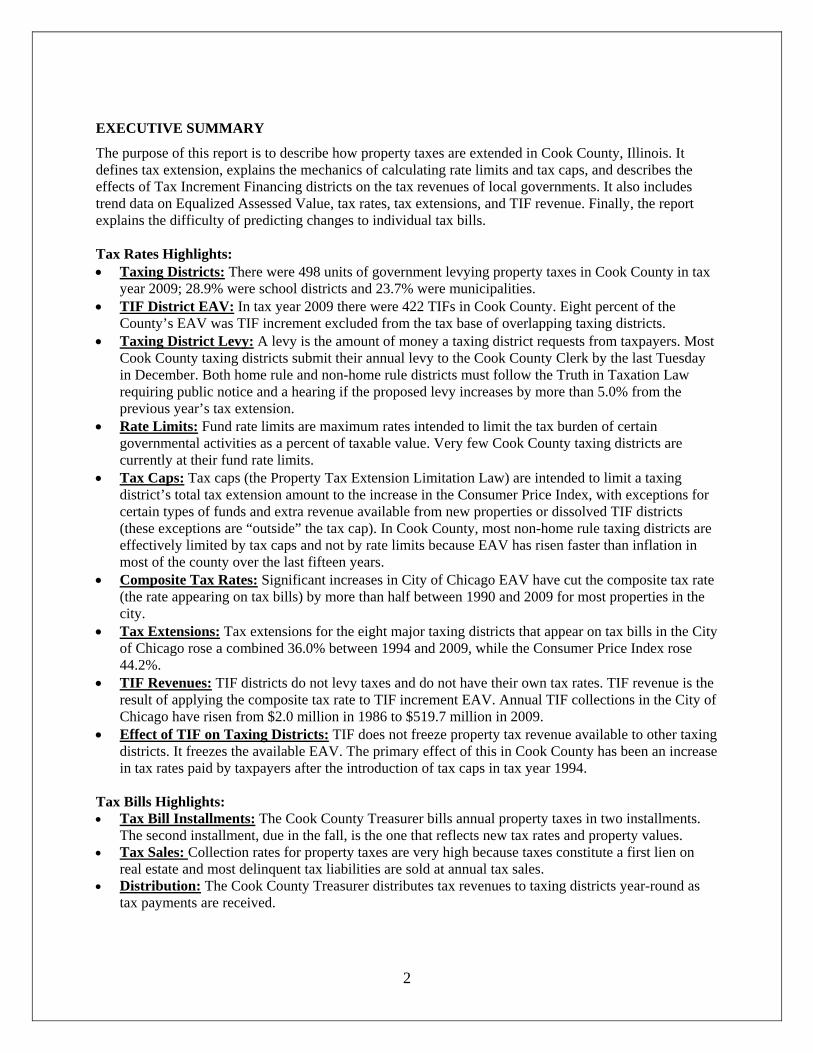
EXECUTIVE SUMMARY
The purpose of this report is to describe how property taxes are extended in Cook County, Illinois. It defines tax extension, explains the mechanics of calculating rate limits and tax caps, and describes the effects of Tax Increment Financing districts on the tax revenues of local governments. It also includes trend data on Equalized Assessed Value, tax rates, tax extensions, and TIF revenue. Finally, the report explains the difficulty of predicting changes to individual tax bills. Tax Rates Highlights: • Taxing Districts: There were 498 units of government levying property taxes in Cook County in tax
year 2009; 28.9% were school districts and 23.7% were municipalities. • TIF District EAV: In tax year 2009 there were 422 TIFs in Cook County. Eight percent of the
County’s EAV was TIF increment excluded from the tax base of overlapping taxing districts. • Taxing District Levy: A levy is the amount of money a taxing district requests from taxpayers. Most
Cook County taxing districts submit their annual levy to the Cook County Clerk by the last Tuesday in December. Both home rule and non-home rule districts must follow the Truth in Taxation Law requiring public notice and a hearing if the proposed levy increases by more than 5.0% from the previous year’s tax extension.
• Rate Limits: Fund rate limits are maximum rates intended to limit the tax burden of certain governmental activities as a percent of taxable value. Very few Cook County taxing districts are currently at their fund rate limits.
• Tax Caps: Tax caps (the Property Tax Extension Limitation Law) are intended to limit a taxing district’s total tax extension amount to the increase in the Consumer Price Index, with exceptions for certain types of funds and extra revenue available from new properties or dissolved TIF districts (these exceptions are “outside” the tax cap). In Cook County, most non-home rule taxing districts are effectively limited by tax caps and not by rate limits because EAV has risen faster than inflation in most of the county over the last fifteen years.
• Composite Tax Rates: Significant increases in City of Chicago EAV have cut the composite tax rate (the rate appearing on tax bills) by more than half between 1990 and 2009 for most properties in the city.
• Tax Extensions: Tax extensions for the eight major taxing districts that appear on tax bills in the City of Chicago rose a combined 36.0% between 1994 and 2009, while the Consumer Price Index rose 44.2%.
• TIF Revenues: TIF districts do not levy taxes and do not have their own tax rates. TIF revenue is the result of applying the composite tax rate to TIF increment EAV. Annual TIF collections in the City of Chicago have risen from $2.0 million in 1986 to $519.7 million in 2009.
• Effect of TIF on Taxing Districts: TIF does not freeze property tax revenue available to other taxing districts. It freezes the available EAV. The primary effect of this in Cook County has been an increase in tax rates paid by taxpayers after the introduction of tax caps in tax year 1994.
Tax Bills Highlights: • Tax Bill Installments: The Cook County Treasurer bills annual property taxes in two installments.
The second installment, due in the fall, is the one that reflects new tax rates and property values. • Tax Sales: Collection rates for property taxes are very high because taxes constitute a first lien on
real estate and most delinquent tax liabilities are sold at annual tax sales.
2
• Distribution: The Cook County Treasurer distributes tax revenues to taxing districts year-round as tax payments are received.
INTRODUCTION The purpose of this report is to describe how property tax rates are calculated in Cook County, Illinois. The process of determining how much tax revenue may be collected by local governments and at what rate is called tax extension. The Cook County Clerk’s Tax Extension Unit is responsible for extending the correct amount of property tax against the value of all taxable property located within the boundaries of a local government. Before property tax rates for local governments can be calculated, the taxable value of real estate must be determined. Taxable value is called Equalized Assessed Valuation (EAV). The EAV of a property is equal to the assessed value multiplied by a state equalization factor minus exemptions (or (AV × equalization factor) – exemptions). The process of calculating EAV is described in the Civic Federation report entitled The Cook County Property Assessment Process: A Primer on Assessment, Classification, Equalization, and Property Tax Exemptions.1
TAX RATES The Cook County Clerk’s Office calculates property tax rates using two primary pieces of information:
1) the Equalized Assessed Value (taxable value) of property under a taxing district’s jurisdiction2
2) the taxing district’s levy, which is the amount of property tax revenue it requests from taxpayers
Conceptually, a property tax rate = levy ÷ EAV
Although this basic equation appears simple, calculating the rate is very complicated. Multiple steps are needed to determine the correct EAV of the jurisdiction and to apply various statutory limitations to the levy. The following sections describe in detail the process of tax extension. Extension is also the noun used to refer to the final amount of property tax revenue that a unit of local government is authorized to receive and that is billed to taxpayers.3 In other words, the levy is the amount of money a taxing district requests and the extension is the amount of money it is allowed to receive based on the application of various laws to the original request.
1 See http://www.civicfed.org/civic-federation/publications/cook-county-property-assessment-process-primer-assessment-classificati. 2 In this report the term “taxing district” is used interchangeably with “taxing agency”, which is any unit or sub-unit of local government that, by state law, has the authority to levy a property tax. See 35 ILCS 200/1-150. Examples include school districts, townships, municipalities, counties, fire protection districts, etc. A TIF district is not considered a taxing district because it does not have the power to levy, although it does receive property tax revenue.
3
3 As described on page 41 of this report, property taxpayers also pay for Tax Increment Financing districts. Although TIF district property tax revenue is not technically a property tax extension, it is part of the total taxes paid and is received as revenue by municipal governments in Cook County.
Taxing District EAV This section describes the types of Cook County taxing districts and explains how the Cook County Clerk determines the tax base of a taxing district.
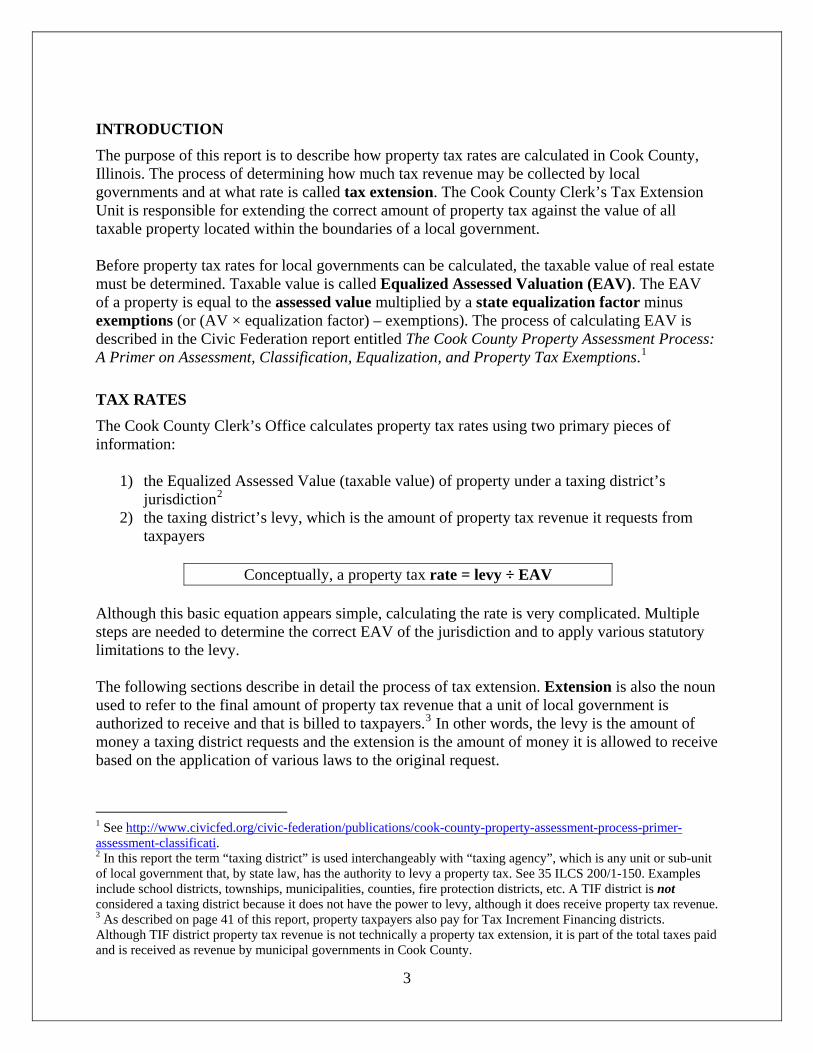
Taxing Districts There are 498 separate local governments that levy property taxes in Cook County.4 Over half of the taxing districts are school districts or municipal governments. Park districts make up 17.7% of all taxing districts, library districts represent 9.6%, and the remaining taxing districts are an assortment of fire protection, township, sanitary, community college, mosquito abatement and other units of local government. Most property owners pay taxes to roughly seven to fifteen units of local government.5
Elementary or Secondary School
District144
28.9%
Municipality118
23.7%Park District
8817.7%
Library District48
9.6%
Fire Protection District31
6.2%
Township30
6.0%
Sanitary District19
3.8%
81.6%
All Other Districts7
1.4%
40.8%
County1
0.2%
Community College District
Mosquito Abatement District
Cook County Taxing Districts by Type: 2009
Source: Illinois Department of Revenue, 2009 Property Tax Statistics Table 5 http://www.revenue.state.il.us/Publications/LocalGovernment/PtaxStats/2009/Y2009Tbl05.xlsx
Total 2009 Cook CountyTaxing Districts = 498
4 There were 498 local governments levying property taxes in Cook County in 2009 according to the Illinois Department of Revenue, http://www.revenue.state.il.us/Publications/LocalGovernment/PtaxStats/2009/Y2009Tbl05.xlsx. For more data on taxing districts statewide see Appendix A. According to the Cook County Clerk’s Office, there are over 1300 separate taxing agencies including entities such as Special Service Areas, Tax Increment Financing Districts and General Assistance levies for townships. Information provided by Bill Vaselopulos, Manager of Tax Extension and Accounting, Cook County Clerk’s Office, July 29, 2010.
4
5 Illinois has more local governments than any other state in the nation. In October 2007 it had 6,994 local governments statewide according to the U.S. Census Bureau. http://www2.census.gov/govs/cog/all_ind_st_descr.pdf.
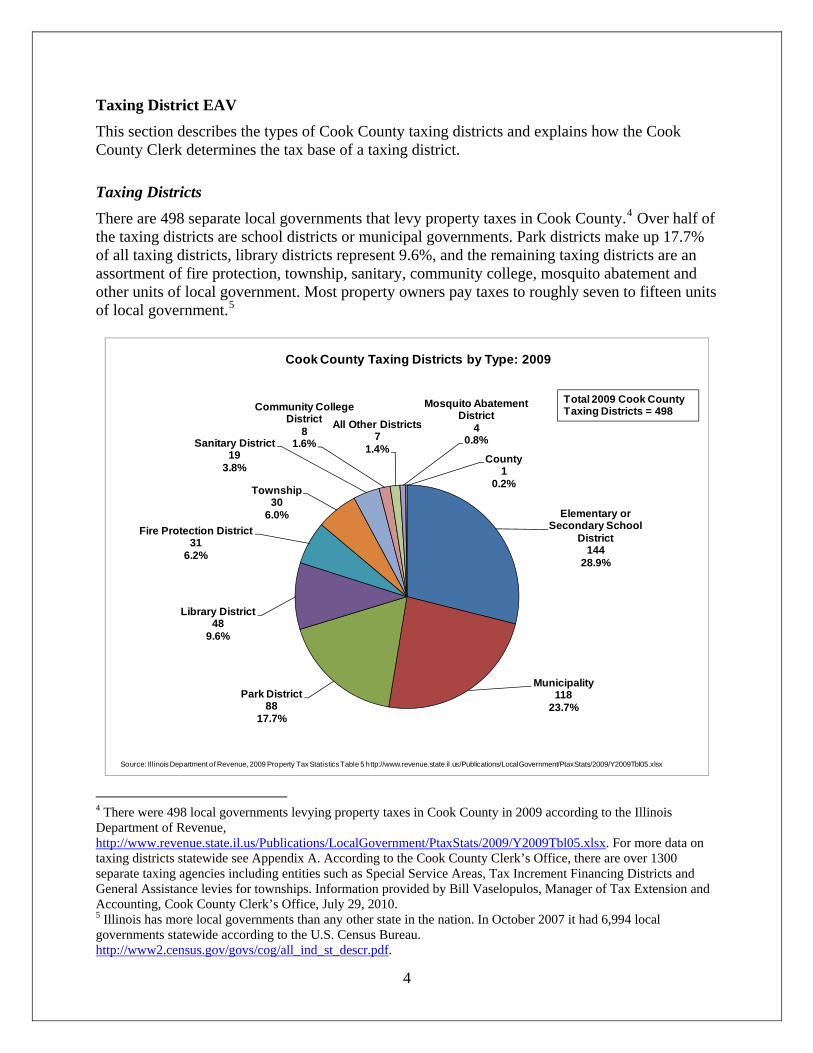
Tax Codes In order to determine the correct EAV for each taxing district, the Cook County Clerk must compute the EAV for all tax codes in that district. The organization of parcels into tax codes is critical to the tax extension process. Each parcel of real estate is assigned a five-digit tax code that identifies the array of taxing districts with authority to levy property taxes on that parcel. Most parcels in Cook County are taxed by as few as seven to as many as fifteen different taxing districts, so individual tax codes are created for the range of combinations that occur. Parcels in the same tax code all owe taxes to the same array of taxing districts and are taxed at the same composite tax rate, which is the sum of the rates of the individual taxing districts. Consider for example two neighbors in the western Cook County suburb of Melrose Park in Leyden Township. One neighbor’s home is within the boundaries of School District 83 and the other is within the boundaries of School District 84. They pay taxes to all of the same taxing districts except the elementary school district, as illustrated in the table below. The difference in their tax year 2009 composite tax rate is due to School District 83 having a slightly higher tax rate than School District 84.
Taxing District Tax Rate Taxing District Tax RateCook County 0.394% Cook County 0.394%Forest Preserve District of Cook County 0.049% Forest Preserve District of Cook County 0.049%Consolidated Elections 0.021% Consolidated Elections 0.021%Leyden Township 0.071% Leyden Township 0.071%Leyden General Assistance 0.003% Leyden General Assistance 0.003%Leyden Road and Bridge 0.102% Leyden Road and Bridge 0.102%Village of Melrose Park 1.219% Village of Melrose Park 1.219%Village of Melrose Park Library 0.107% Village of Melrose Park Library 0.107%School District 83 3.481% School District 84 3.383%Community High School 212 1.989% Community High School 212 1.989%Triton Community College District 504 0.214% Triton Community College District 504 0.214%Veterans Park District 0.315% Veterans Park District 0.315%Metropolitan Water Reclamation District 0.261% Metropolitan Water Reclamation District 0.261%Composite Tax Rate 2009 8.226% Composite Tax Rate 2009 8.128%Source: Cook County Clerk, 2009 Cook County Tax Rates Report
Tax Code 20036 Tax Code 20037Example of Two Tax Codes in Melrose Park
5
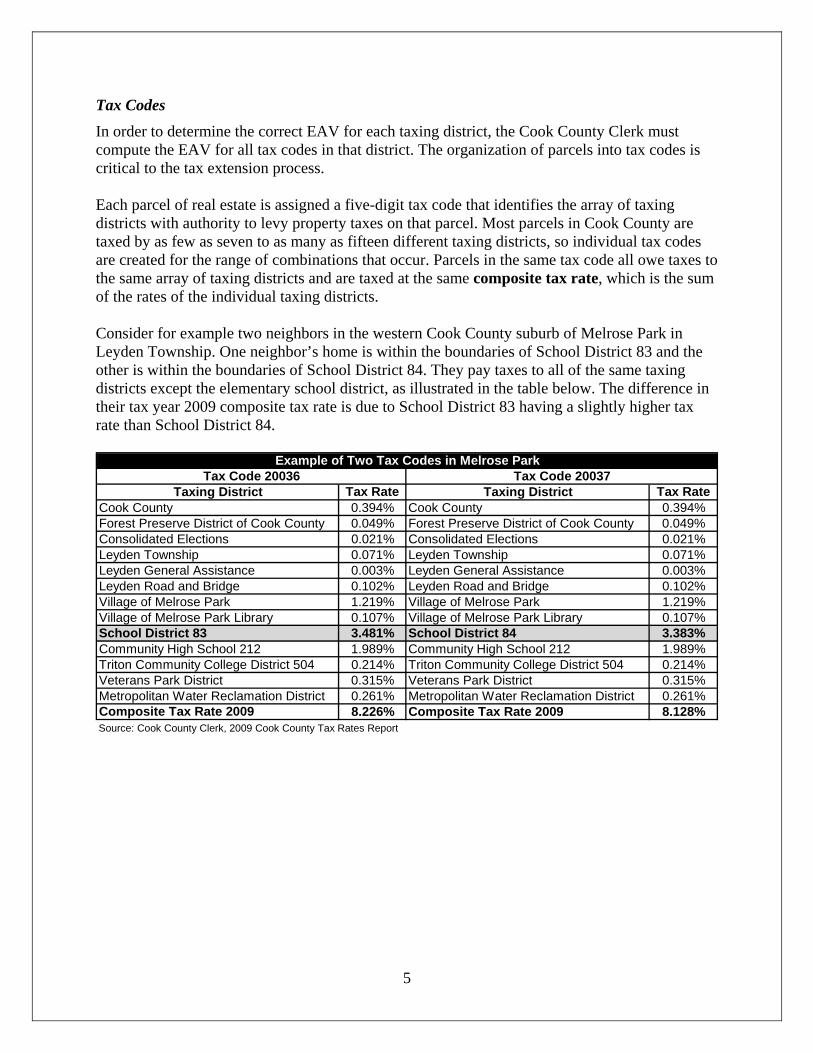
Now consider two homeowners who live in different municipalities but are both in School District 83, as illustrated below. The difference in their composite tax rates is not due to the school district, but rather to the difference in the tax rates of their municipalities, libraries, and a separate fire protection district in Northlake.6
Taxing District Tax Rate Taxing District Tax RateCook County 0.394% Cook County 0.394%Forest Preserve District of Cook County 0.049% Forest Preserve District of Cook County 0.049%Consolidated Elections 0.021% Consolidated Elections 0.021%Leyden Township 0.071% Leyden Township 0.071%Leyden General Assistance 0.003% Leyden General Assistance 0.003%Leyden Road and Bridge 0.102% Leyden Road and Bridge 0.102%Village of Melrose Park 1.219% City of Northlake 1.157%Village of Melrose Park Library 0.107% Northlake Public Library District 0.330%School District 83 3.481% School District 83 3.481%Community High School 212 1.989% Community High School 212 1.989%Triton Community College District 504 0.214% Triton Community College District 504 0.214%Veterans Park District 0.315% Veterans Park District 0.315%Metropolitan Water Reclamation District 0.261% Metropolitan Water Reclamation District 0.261%
Northlake Fire Protection District 1.008%Composite Tax Rate 2009 8.226% Composite Tax Rate 2009 9.395%Source: Cook County Clerk, 2009 Cook County Tax Rates Report
Tax Code 20036 (Melrose Park) Tax Code 20047 (Northlake)Example of Two Tax Codes in School District 83
For a taxpayer, the tax code represents the unique collection of taxing districts to which taxes are owed. For a taxing district, the total EAV of tax codes under the district’s jurisdiction represents the value of property in the tax base.
6
6 In Melrose Park, fire protection services are provided by a fire department that is part of the Village government and supported by the Village’s tax levy. In Northlake, fire protection services are provided by a separate taxing district with its own elected board of trustees and separate tax levy.
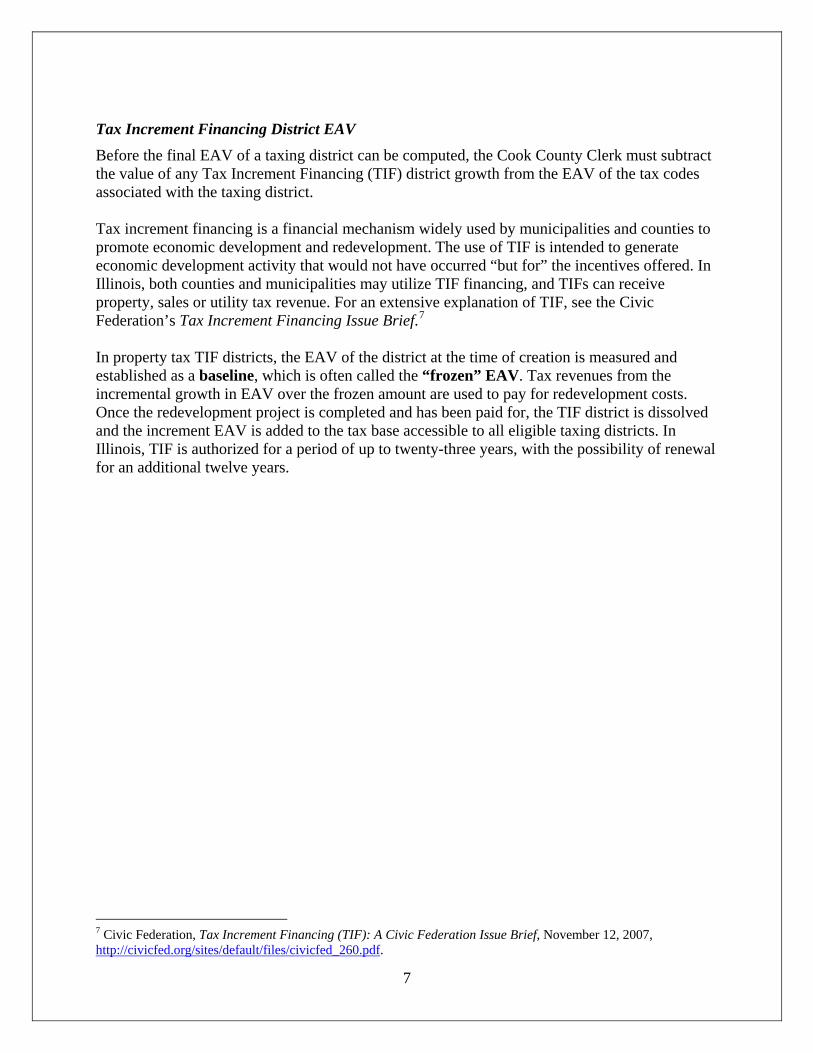
Tax Increment Financing District EAV Before the final EAV of a taxing district can be computed, the Cook County Clerk must subtract the value of any Tax Increment Financing (TIF) district growth from the EAV of the tax codes associated with the taxing district. Tax increment financing is a financial mechanism widely used by municipalities and counties to promote economic development and redevelopment. The use of TIF is intended to generate economic development activity that would not have occurred “but for” the incentives offered. In Illinois, both counties and municipalities may utilize TIF financing, and TIFs can receive property, sales or utility tax revenue. For an extensive explanation of TIF, see the Civic Federation’s Tax Increment Financing Issue Brief.7 In property tax TIF districts, the EAV of the district at the time of creation is measured and established as a baseline, which is often called the “frozen” EAV. Tax revenues from the incremental growth in EAV over the frozen amount are used to pay for redevelopment costs. Once the redevelopment project is completed and has been paid for, the TIF district is dissolved and the increment EAV is added to the tax base accessible to all eligible taxing districts. In Illinois, TIF is authorized for a period of up to twenty-three years, with the possibility of renewal for an additional twelve years.
7
7 Civic Federation, Tax Increment Financing (TIF): A Civic Federation Issue Brief, November 12, 2007, http://civicfed.org/sites/default/files/civicfed_260.pdf.
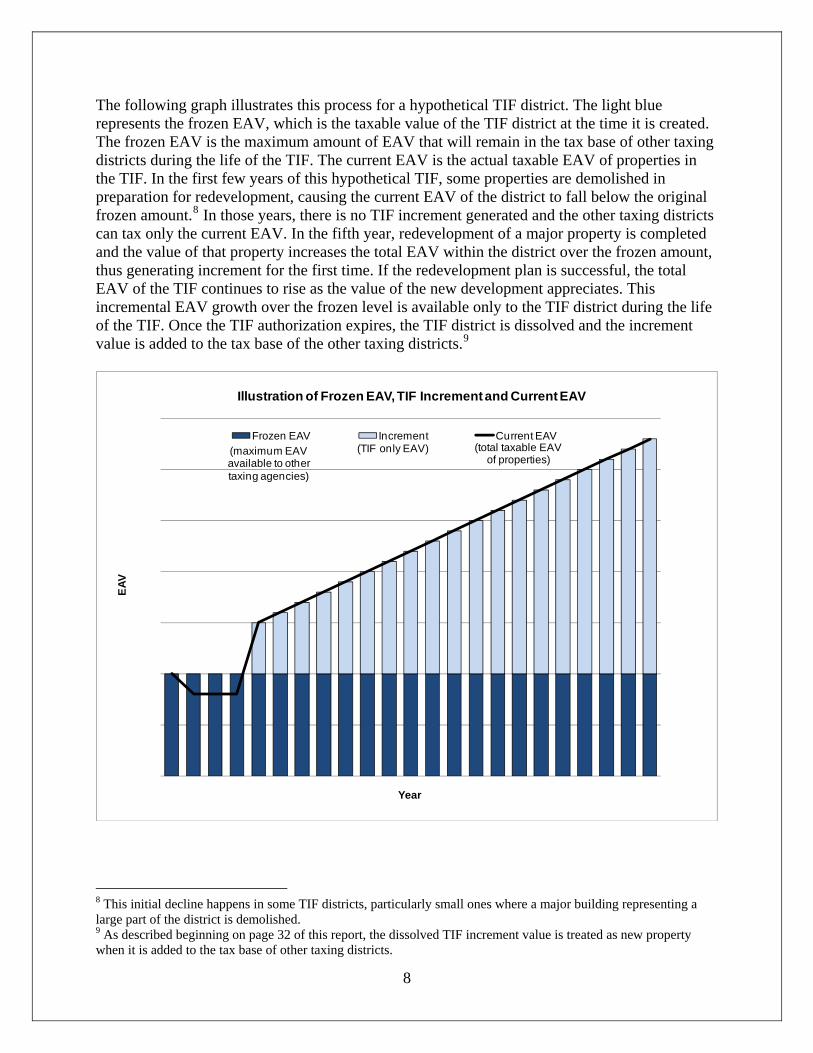
The following graph illustrates this process for a hypothetical TIF district. The light blue represents the frozen EAV, which is the taxable value of the TIF district at the time it is created. The frozen EAV is the maximum amount of EAV that will remain in the tax base of other taxing districts during the life of the TIF. The current EAV is the actual taxable EAV of properties in the TIF. In the first few years of this hypothetical TIF, some properties are demolished in preparation for redevelopment, causing the current EAV of the district to fall below the original frozen amount.8 In those years, there is no TIF increment generated and the other taxing districts can tax only the current EAV. In the fifth year, redevelopment of a major property is completed and the value of that property increases the total EAV within the district over the frozen amount, thus generating increment for the first time. If the redevelopment plan is successful, the total EAV of the TIF continues to rise as the value of the new development appreciates. This incremental EAV growth over the frozen level is available only to the TIF district during the life of the TIF. Once the TIF authorization expires, the TIF district is dissolved and the increment value is added to the tax base of the other taxing districts.9
EAV
Year
Illustration of Frozen EAV, TIF Increment and Current EAV
Frozen EAV Increment Current EAV(TIF only EAV)(maximum EAV
available to other taxing agencies)
(total taxable EAV of properties)
8 This initial decline happens in some TIF districts, particularly small ones where a major building representing a large part of the district is demolished.
8
9 As described beginning on page 32 of this report, the dissolved TIF increment value is treated as new property when it is added to the tax base of other taxing districts.
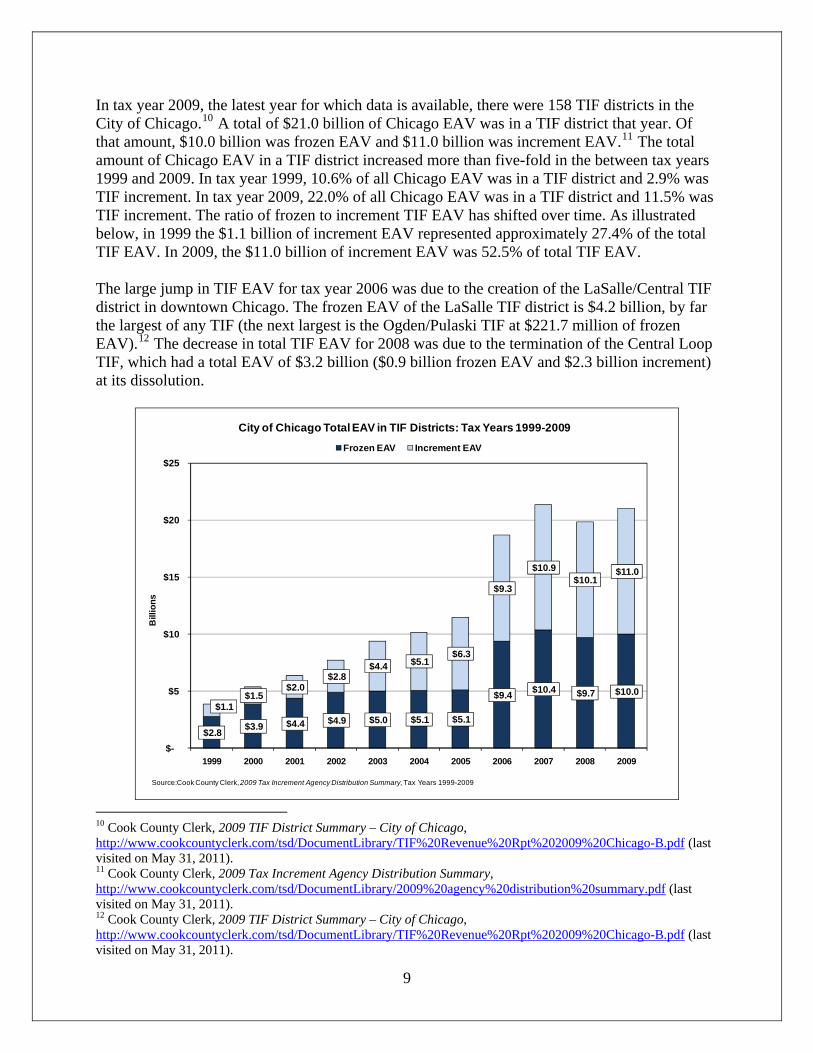
In tax year 2009, the latest year for which data is available, there were 158 TIF districts in the City of Chicago.10 A total of $21.0 billion of Chicago EAV was in a TIF district that year. Of that amount, $10.0 billion was frozen EAV and $11.0 billion was increment EAV.11 The total amount of Chicago EAV in a TIF district increased more than five-fold in the between tax years 1999 and 2009. In tax year 1999, 10.6% of all Chicago EAV was in a TIF district and 2.9% was TIF increment. In tax year 2009, 22.0% of all Chicago EAV was in a TIF district and 11.5% was TIF increment. The ratio of frozen to increment TIF EAV has shifted over time. As illustrated below, in 1999 the $1.1 billion of increment EAV represented approximately 27.4% of the total TIF EAV. In 2009, the $11.0 billion of increment EAV was 52.5% of total TIF EAV. The large jump in TIF EAV for tax year 2006 was due to the creation of the LaSalle/Central TIF district in downtown Chicago. The frozen EAV of the LaSalle TIF district is $4.2 billion, by far the largest of any TIF (the next largest is the Ogden/Pulaski TIF at $221.7 million of frozen EAV).12 The decrease in total TIF EAV for 2008 was due to the termination of the Central Loop TIF, which had a total EAV of $3.2 billion ($0.9 billion frozen EAV and $2.3 billion increment) at its dissolution.
$2.8 $3.9 $4.4 $4.9 $5.0 $5.1 $5.1
$9.4 $10.4 $9.7 $10.0 $1.1
$1.5 $2.0
$2.8 $4.4 $5.1
$6.3
$9.3
$10.9 $10.1
$11.0
$-
$5
$10
$15
$20
$25
1999 2000 2001 2002 2003 2004 2005 2006 2007 2008 2009
Bill
ions
City of Chicago Total EAV in TIF Districts: Tax Years 1999-2009
Frozen EAV Increment EAV
Source:Cook County Clerk, 2009 Tax Increment Agency Distribution Summary, Tax Years 1999-2009
10 Cook County Clerk, 2009 TIF District Summary – City of Chicago, http://www.cookcountyclerk.com/tsd/DocumentLibrary/TIF%20Revenue%20Rpt%202009%20Chicago-B.pdf (last visited on May 31, 2011). 11 Cook County Clerk, 2009 Tax Increment Agency Distribution Summary, http://www.cookcountyclerk.com/tsd/DocumentLibrary/2009%20agency%20distribution%20summary.pdf (last visited on May 31, 2011).
9
12 Cook County Clerk, 2009 TIF District Summary – City of Chicago, http://www.cookcountyclerk.com/tsd/DocumentLibrary/TIF%20Revenue%20Rpt%202009%20Chicago-B.pdf (last visited on May 31, 2011).
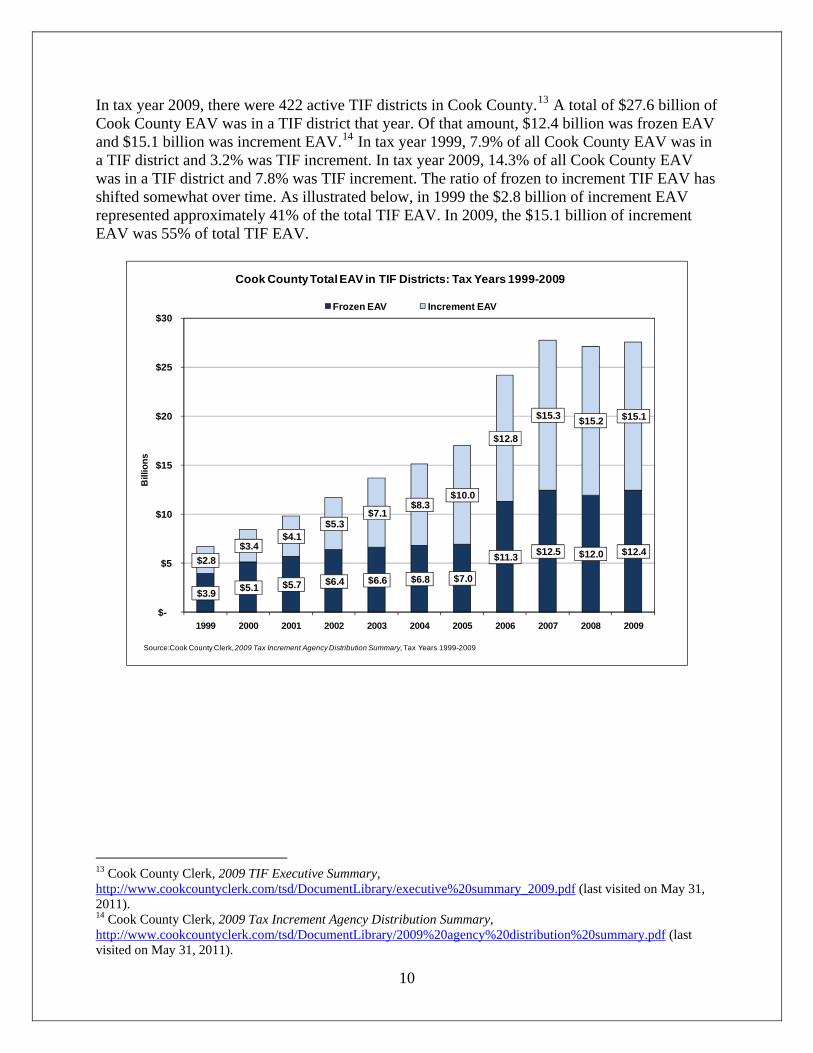
In tax year 2009, there were 422 active TIF districts in Cook County.13 A total of $27.6 billion of Cook County EAV was in a TIF district that year. Of that amount, $12.4 billion was frozen EAV and $15.1 billion was increment EAV.14 In tax year 1999, 7.9% of all Cook County EAV was in a TIF district and 3.2% was TIF increment. In tax year 2009, 14.3% of all Cook County EAV was in a TIF district and 7.8% was TIF increment. The ratio of frozen to increment TIF EAV has shifted somewhat over time. As illustrated below, in 1999 the $2.8 billion of increment EAV represented approximately 41% of the total TIF EAV. In 2009, the $15.1 billion of increment EAV was 55% of total TIF EAV.
$3.9 $5.1 $5.7 $6.4 $6.6 $6.8 $7.0
$11.3 $12.5 $12.0 $12.4 $2.8
$3.4 $4.1
$5.3 $7.1
$8.3 $10.0
$12.8
$15.3 $15.2 $15.1
$-
$5
$10
$15
$20
$25
$30
1999 2000 2001 2002 2003 2004 2005 2006 2007 2008 2009
Bill
ions
Cook County Total EAV in TIF Districts: Tax Years 1999-2009
Frozen EAV Increment EAV
Source:Cook County Clerk, 2009 Tax Increment Agency Distribution Summary, Tax Years 1999-2009
13 Cook County Clerk, 2009 TIF Executive Summary, http://www.cookcountyclerk.com/tsd/DocumentLibrary/executive%20summary_2009.pdf (last visited on May 31, 2011).
10
14 Cook County Clerk, 2009 Tax Increment Agency Distribution Summary, http://www.cookcountyclerk.com/tsd/DocumentLibrary/2009%20agency%20distribution%20summary.pdf (last visited on May 31, 2011).
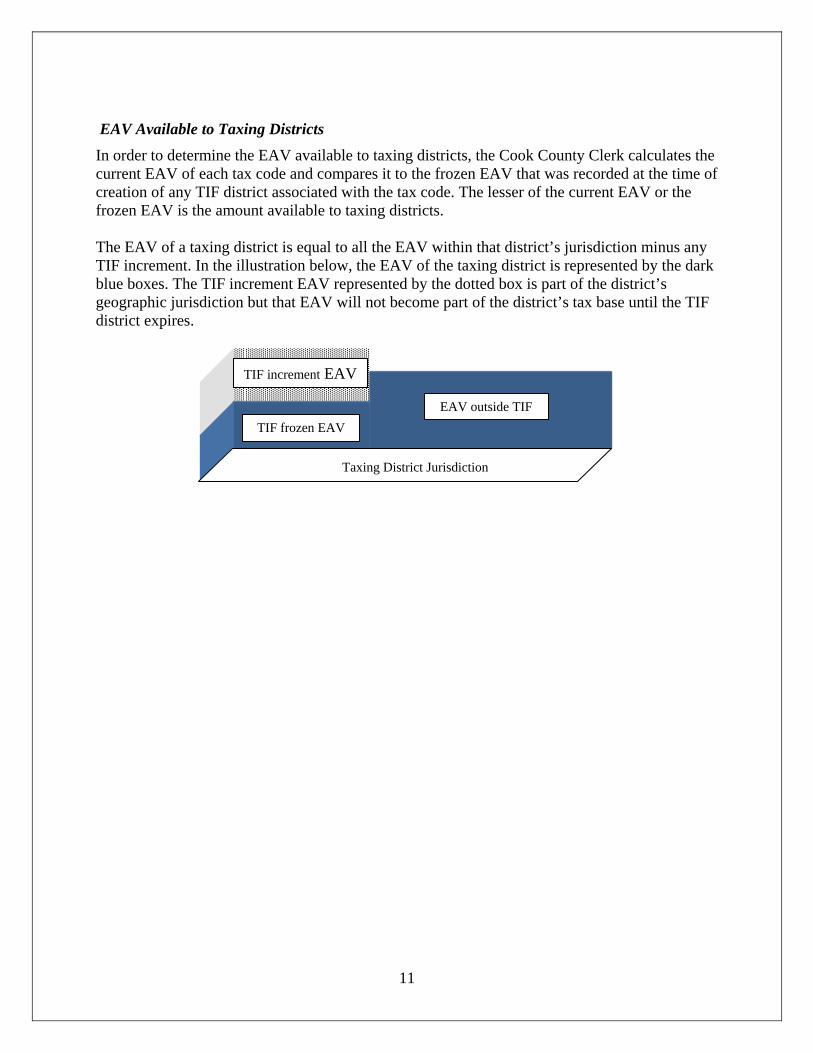
EAV Available to Taxing Districts In order to determine the EAV available to taxing districts, the Cook County Clerk calculates the current EAV of each tax code and compares it to the frozen EAV that was recorded at the time of creation of any TIF district associated with the tax code. The lesser of the current EAV or the frozen EAV is the amount available to taxing districts. The EAV of a taxing district is equal to all the EAV within that district’s jurisdiction minus any TIF increment. In the illustration below, the EAV of the taxing district is represented by the dark blue boxes. The TIF increment EAV represented by the dotted box is part of the district’s geographic jurisdiction but that EAV will not become part of the district’s tax base until the TIF district expires.
11
Taxing District Jurisdiction
TIF frozen EAV
TIF increment EAV
EAV outside TIF
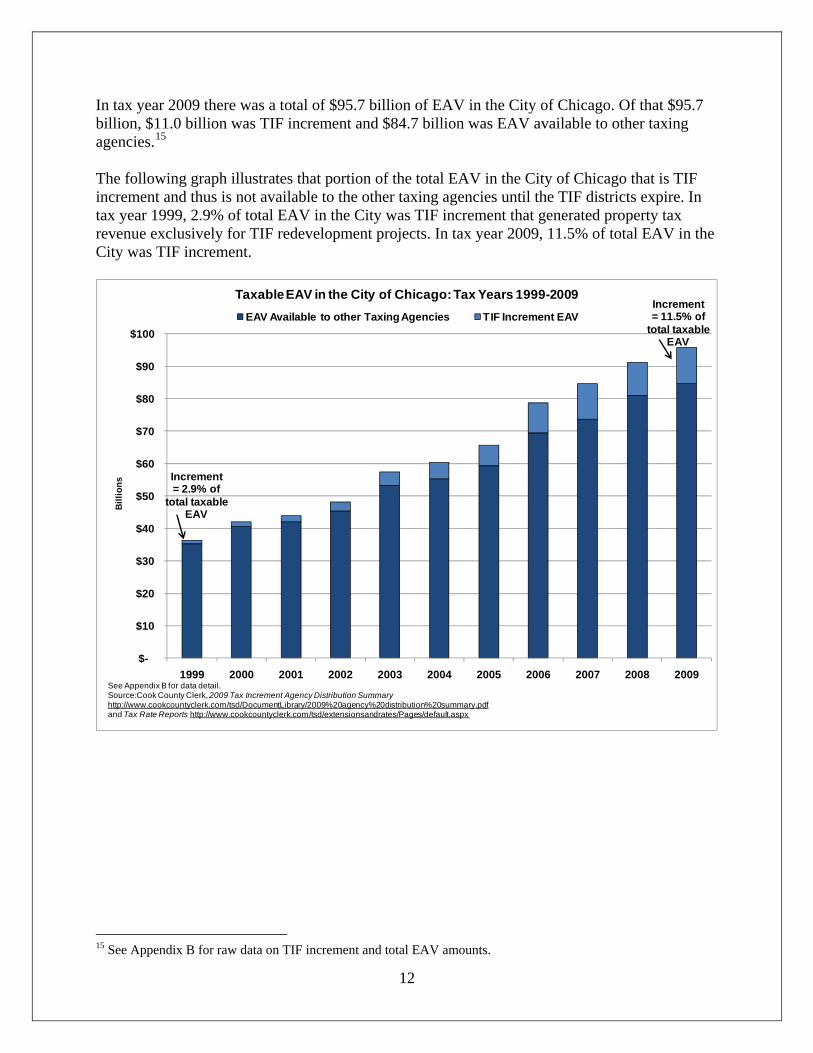
In tax year 2009 there was a total of $95.7 billion of EAV in the City of Chicago. Of that $95.7 billion, $11.0 billion was TIF increment and $84.7 billion was EAV available to other taxing agencies.15 The following graph illustrates that portion of the total EAV in the City of Chicago that is TIF increment and thus is not available to the other taxing agencies until the TIF districts expire. In tax year 1999, 2.9% of total EAV in the City was TIF increment that generated property tax revenue exclusively for TIF redevelopment projects. In tax year 2009, 11.5% of total EAV in the City was TIF increment.
$-
$10
$20
$30
$40
$50
$60
$70
$80
$90
$100
1999 2000 2001 2002 2003 2004 2005 2006 2007 2008 2009
Bill
ions
Taxable EAV in the City of Chicago: Tax Years 1999-2009EAV Available to other Taxing Agencies TIF Increment EAV
Increment= 2.9% of
total taxableEAV
Increment= 11.5% of
total taxableEAV
See Appendix B for data detail.Source:Cook County Clerk, 2009 Tax Increment Agency Distribution Summaryhttp://www.cookcountyclerk.com/tsd/DocumentLibrary/2009%20agency%20distribution%20summary.pdfand Tax Rate Reports http://www.cookcountyclerk.com/tsd/extensionsandrates/Pages/default.aspx
12
15 See Appendix B for raw data on TIF increment and total EAV amounts.
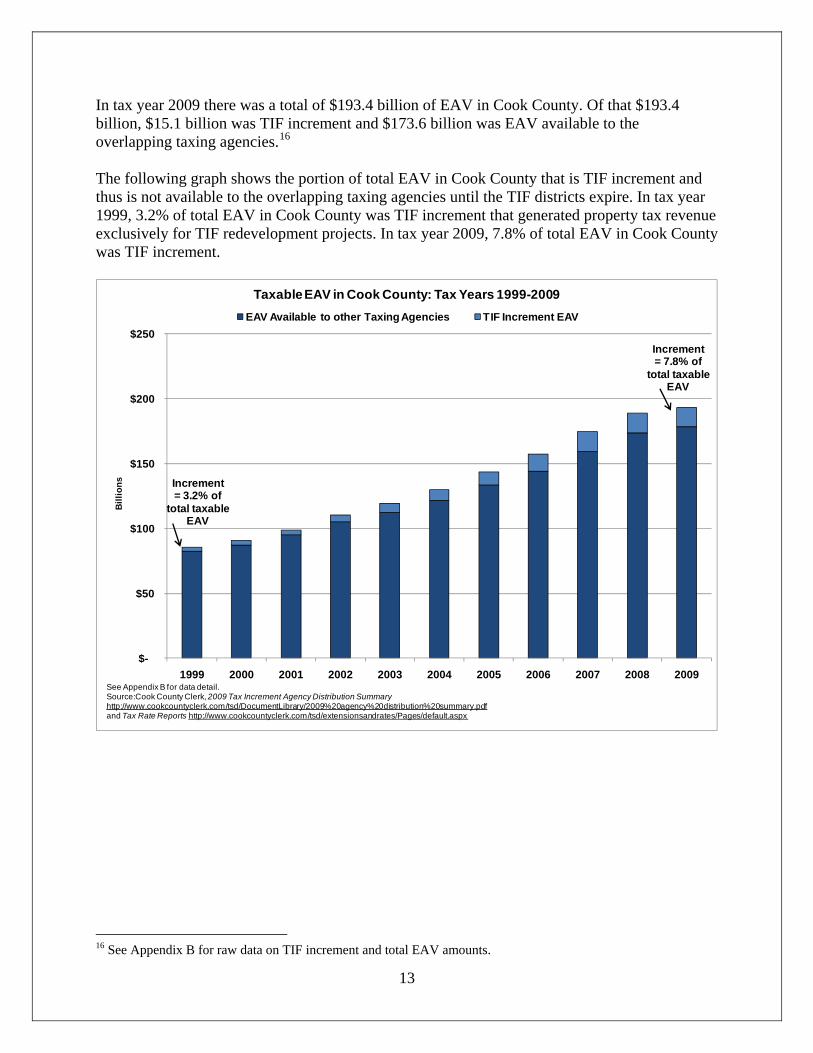
In tax year 2009 there was a total of $193.4 billion of EAV in Cook County. Of that $193.4 billion, $15.1 billion was TIF increment and $173.6 billion was EAV available to the overlapping taxing agencies.16 The following graph shows the portion of total EAV in Cook County that is TIF increment and thus is not available to the overlapping taxing agencies until the TIF districts expire. In tax year 1999, 3.2% of total EAV in Cook County was TIF increment that generated property tax revenue exclusively for TIF redevelopment projects. In tax year 2009, 7.8% of total EAV in Cook County was TIF increment.
$-
$50
$100
$150
$200
$250
1999 2000 2001 2002 2003 2004 2005 2006 2007 2008 2009
Bill
ions
Taxable EAV in Cook County: Tax Years 1999-2009EAV Available to other Taxing Agencies TIF Increment EAV
See Appendix B for data detail.Source:Cook County Clerk, 2009 Tax Increment Agency Distribution Summaryhttp://www.cookcountyclerk.com/tsd/DocumentLibrary/2009%20agency%20distribution%20summary.pdfand Tax Rate Reports http://www.cookcountyclerk.com/tsd/extensionsandrates/Pages/default.aspx
Increment= 3.2% of
total taxableEAV
Increment= 7.8% of
total taxableEAV
13
16 See Appendix B for raw data on TIF increment and total EAV amounts.
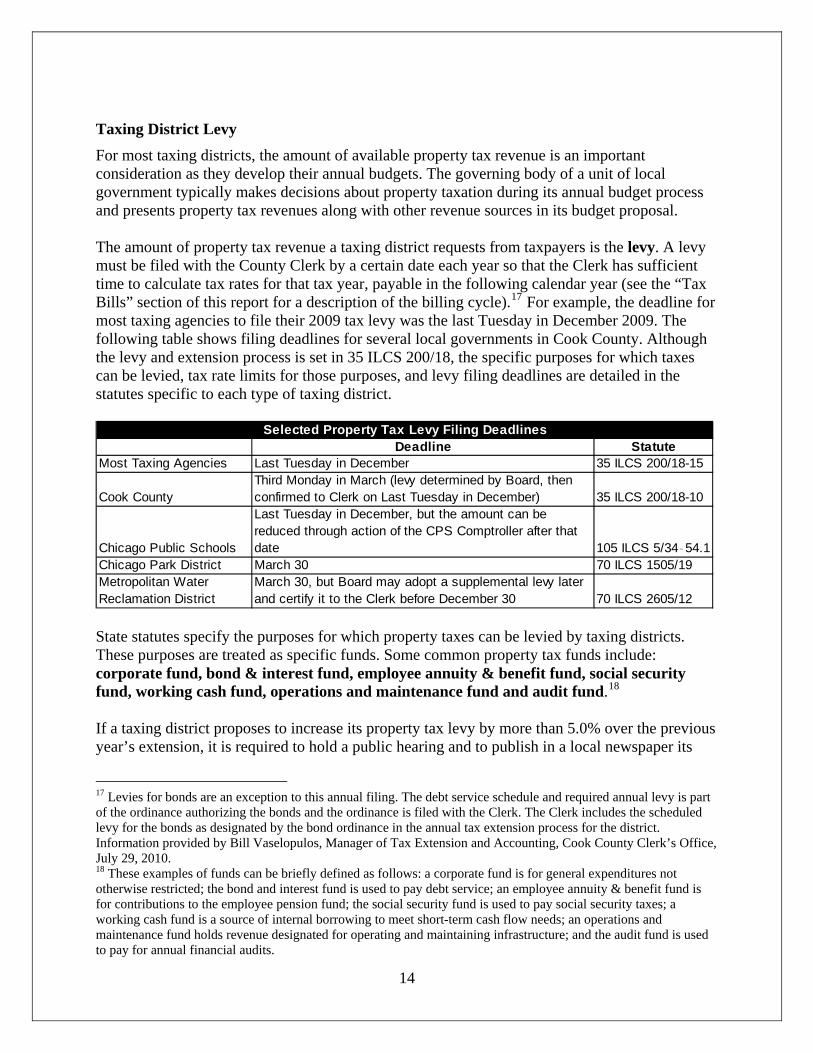
Taxing District Levy For most taxing districts, the amount of available property tax revenue is an important consideration as they develop their annual budgets. The governing body of a unit of local government typically makes decisions about property taxation during its annual budget process and presents property tax revenues along with other revenue sources in its budget proposal. The amount of property tax revenue a taxing district requests from taxpayers is the levy. A levy must be filed with the County Clerk by a certain date each year so that the Clerk has sufficient time to calculate tax rates for that tax year, payable in the following calendar year (see the “Tax Bills” section of this report for a description of the billing cycle).17 For example, the deadline for most taxing agencies to file their 2009 tax levy was the last Tuesday in December 2009. The following table shows filing deadlines for several local governments in Cook County. Although the levy and extension process is set in 35 ILCS 200/18, the specific purposes for which taxes can be levied, tax rate limits for those purposes, and levy filing deadlines are detailed in the statutes specific to each type of taxing district.
Deadline StatuteMost Taxing Agencies Last Tuesday in December 35 ILCS 200/18-15
Cook CountyThird Monday in March (levy determined by Board, then confirmed to Clerk on Last Tuesday in December) 35 ILCS 200/18-10
Chicago Public Schools
Last Tuesday in December, but the amount can be reduced through action of the CPS Comptroller after that date 105 ILCS 5/34‑54.1
Chicago Park District March 30 70 ILCS 1505/19Metropolitan Water Reclamation District
March 30, but Board may adopt a supplemental levy later and certify it to the Clerk before December 30 70 ILCS 2605/12
Selected Property Tax Levy Filing Deadlines
State statutes specify the purposes for which property taxes can be levied by taxing districts. These purposes are treated as specific funds. Some common property tax funds include: corporate fund, bond & interest fund, employee annuity & benefit fund, social security fund, working cash fund, operations and maintenance fund and audit fund.18 If a taxing district proposes to increase its property tax levy by more than 5.0% over the previous year’s extension, it is required to hold a public hearing and to publish in a local newspaper its
17 Levies for bonds are an exception to this annual filing. The debt service schedule and required annual levy is part of the ordinance authorizing the bonds and the ordinance is filed with the Clerk. The Clerk includes the scheduled levy for the bonds as designated by the bond ordinance in the annual tax extension process for the district. Information provided by Bill Vaselopulos, Manager of Tax Extension and Accounting, Cook County Clerk’s Office, July 29, 2010.
14
18 These examples of funds can be briefly defined as follows: a corporate fund is for general expenditures not otherwise restricted; the bond and interest fund is used to pay debt service; an employee annuity & benefit fund is for contributions to the employee pension fund; the social security fund is used to pay social security taxes; a working cash fund is a source of internal borrowing to meet short-term cash flow needs; an operations and maintenance fund holds revenue designated for operating and maintaining infrastructure; and the audit fund is used to pay for annual financial audits.
intention to raise the levy.19 Illinois’ Truth in Taxation Law is very specific about the timing and wording of the required public notice. If the taxing district does not certify to the County Clerk that the notice requirements of the Truth in Taxation Law have been met, the County Clerk is required to limit the district’s tax extension to 105% of the prior year extension. The Truth in Taxation Law applies to both home rule and non-home rule units of government. A home rule unit of government is one that is permitted to do anything not expressly prohibited by the Illinois Constitution or statutes. Article VII of the Illinois Constitution designates as a home rule government any municipality with a population over 25,000, any municipality that has adopted home rule by referendum, and a county with a chief executive officer (i.e., Cook).20 All special districts including school districts, community college districts, forest preserve districts, park districts, townships and sanitary districts are non-home rule. Non-home rule units of government are only allowed to take actions explicitly permitted by the Illinois Constitution and statutes. There are two major limitations placed on non-home rule taxing districts’ ability to raise revenue through property taxation. They are commonly called “rate limits” and “tax caps”. Some home rule units of government voluntarily adopt similar limitations through local ordinance, although these ordinances can be amended by the governing board of that government.21 The Cook County Clerk is responsible for applying rate limits and tax caps to non home-rule taxing districts in Cook County as part of the tax extension process. The following sections describe rate limits and tax caps. Before either limitation is applied, the levy for each fund may be augmented by a small amount to compensate for anticipated loss in collection. The state statutes governing tax extension require county clerks to determine the tax rate that will yield the amount levied (subject to rate limits and tax caps if applicable).22 Collection rates for property taxes are very high (see page 38 of this report), but there is always a small fraction of taxes that remains unpaid. In order to comply with the statute and set rates that will produce the amount levied, county clerks typically add an amount for “loss in collection” to the levy amount. The Cook County standard loss amount is an additional 3% for most funds and 5% for bond and interest funds. A taxing district may pass a resolution requesting a different amount. If the Clerk’s Office finds historical collection rate evidence to support the request it may be granted.23 After the loss amount is added, any rate limits or tax caps are applied as described below.
19 35 ILCS 200/18-55 through 35 ILCS 200/18-100. This statute applies to the “aggregate levy,” which is defined as the “the annual corporate levy of the taxing district and those special purpose levies which are made annually (other than debt service levies and levies made for the purpose of paying amounts due under public building commission leases).” 20 Municipalities over 25,000 in population can also decide by referendum to reject home rule. Cook County is the only county in Illinois that is home rule. 21 For example City of Chicago Municipal Code Chapter 3-92 limits the City’s aggregate levy, but the definition of aggregate levy has been modified at least twice to accommodate tax increases. 22 35 ILCS 200/18-45.
15
23 Information provided by Bill Vaselopulos, Manager of Tax Extension and Accounting, Cook County Clerk’s Office, July 29, 2010.
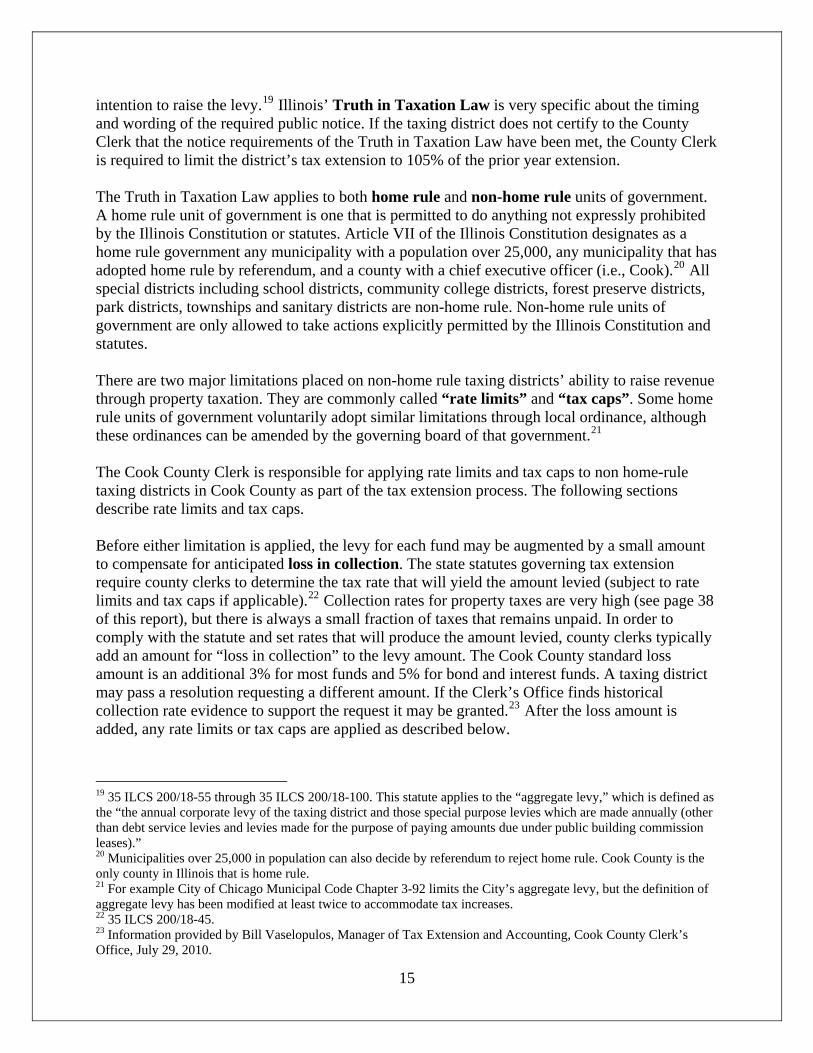
Rate Limits Rate limits are statutory maximum tax rates applied to each purpose (fund) for which a taxing district may levy taxes.24 The current maximum tax rates by fund and their statutory references are compiled by the Illinois Department of Revenue in one document for easy reference.25 Some funds, such as bond and interest funds, have no rate limit.26 Home rule taxing districts are not subject to rate limits on any fund. For example, the statutory education fund rate limit for a unit school district (grades K-12) is currently 4.0%. In most Illinois counties, the rate limit is applied to the current year EAV of the taxing district to produce a maximum allowable levy. Thus, the maximum allowable education fund levy for a school district with an EAV of $40 million would be $1.6 million ($40 million x 4.0%). In Cook County the rate limit is applied to the prior year EAV plus any current year new property, annexed property, recovered TIF increment and expired incentive value, minus any disconnected property.27
Fund Rate Limit Formula for Cook County Taxing Districts
Rate Limit ×
(Prior Year EAV in Cook County + Current Year New Property EAV + Current Year Annexed Property EAV + Current Year Recovered TIF Increment EAV + Current Year Expired Incentives EAV – Current Year Disconnected Property EAV)
= Maximum Allowable Levy
If the levy requested by a taxing district for a specific fund exceeds the maximum allowable for that fund, the Cook County Clerk must reduce the levy to the maximum allowable amount. The fund rate limit is called the “Tax Rate Ceiling” on the Cook County Clerk’s Agency Tax Rate reports (see example in Appendix C).28 Very few taxing districts in Cook County hit their fund rate limits now. This is due to two significant changes in state property tax statutes. First, the 1995 introduction of tax caps in Cook County has slowly made fund rate limits less relevant because tax caps have had a stronger
24 Until recently, state statute set a baseline rate for a fund and a maximum statutory rate. The baseline could be increased up to the statutory maximum only by voter referendum. Public Act 94-976 changed this in 2006 by allowing PTELL-limited taxing districts to exceed the voter-approved rates and levy up to the statutory maximum. This provides districts with more flexibility in allocating their tax levy among funds. See http://www.revenue.state.il.us/LocalGovernment/PA94-976memo.pdf for more information. 25 http://www.revenue.state.il.us/LocalGovernment/PropertyTax/NewMaxRates.pdf 26 A rationale for excluding bond funds from tax limitations would be that bondholders expect to be paid in full without the risk of limitations on the revenue stream designated for debt service. 27 35 ILCS 200/18-45. If the current year EAV is less than the EAV computed according to this statute, the current year EAV is used because the extension cannot be made against less EAV than currently exists. Information provided by Bill Vaselopulos, Manager of Tax Extension and Accounting, Cook County Clerk’s Office, July 29, 2010. 28 See http://www.cookctyclerk.com/sub/tax_extension.asp and click the Taxing Agency Reports link. Note that the “Maximum Allowable Levy” column simply shows the levy amount if the levy did not exceed the rate ceiling.
16
limiting effect than rate limits over time (see page 23). Second, the 2006 passage of Public Act 94-976 allowed taxing districts to increase their fund rate limits up to the state maximum rate without going to referendum, thus giving them more flexibility in how they allocated their tax revenues among funds.29 Only taxing districts in very low property wealth areas of Cook County are still at risk of hitting major fund rate limits.30
Property Tax Extension Limitation Law (or “Tax Caps”) While rate limits apply to specific funds, the Property Tax Extension Limitation Law (PTELL) is intended to limit the growth of the overall agency levy to 5.0% or the rate of inflation, whichever is less.31 PTELL is often called “tax caps”. Although the principle of PTELL is simple, its application is complex.32 PTELL was passed in reaction to rapid growth in the collar counties and was applied to those counties beginning with tax year 1991.33 When PTELL is applied to a county, all non-home rule taxing districts in that county are subject to it. Cook County was made subject to PTEbeginning in tax year 1994.
LL
34 In 1996 all counties in Illinois were given the opportunity to hold referenda on whether the non home-rule taxing districts in those counties should be subject to PTELL. Currently 39 counties are under PTELL (33 by referendum, and Cook and the collar counties by statute). Nine of the 62 counties not under PTELL have held referenda that failed.35 The rate of inflation used for PTELL is the national Consumer Price Index for all urban consumers for the year preceding the tax year. It is the December to December change in CPI-U for all items and all urban consumers published by the United States Bureau of Labor Statistics in January of each year.36 For example, the tax year 2009 (payable in 2010) CPI was 0.1% and the tax year 2010 (payable in 2011) CPI was 2.7%. This limit can be raised by the voters through a local referendum. Tax caps are intended to limit the dollar amount (not the rate) of property tax revenue that a taxing district may receive. However, the dollar limit must be converted into a tax rate in order to be billed to taxpayers. The PTELL tax rate for a district is called the “limiting rate”. It is important to note that the term “tax cap” can be misleading because the PTELL limiting rate
29 Public Act 94-976 did not result in greater tax revenue for districts, but rather more flexibility in allocating tax levies among funds. 30 For example, in tax year 2009 only two school districts in Cook County hit their Education Fund rate limits: School District 133 in Riverdale and School District 169 in Ford Heights. 31 35 ILCS 200/18-185 to 35 ILCS 200/18-249. The only year in which CPI was higher than 5.0% was tax year 1991 (payable in 1992). As described later in this section, some funds are exempted from PTELL so it does not necessarily limit a district’s entire extension. 32 The Illinois Department of Revenue’s Property Tax Extension Limitation Law Technical Manual is a comprehensive resource for information about the history and application of tax caps http://www.revenue.state.il.us/LocalGovernment/PropertyTax/ptell.htm. 33 The collar counties are the five counties surrounding Cook County: Lake, Kane, McHenry, DuPage, and Will. 34 Cook County government itself is home rule so it is not subject to PTELL, but all non-home rule taxing districts within Cook County are subject to PTELL. 35 http://www.revenue.state.il.us/LocalGovernment/PropertyTax/PTELLcounties.pdf.
17
36 http://www.bls.gov/cpi/. See also the Illinois Department of Revenue list of applicable CPI figures at http://www.revenue.state.il.us/LocalGovernment/PropertyTax/CPIhistory.pdf.
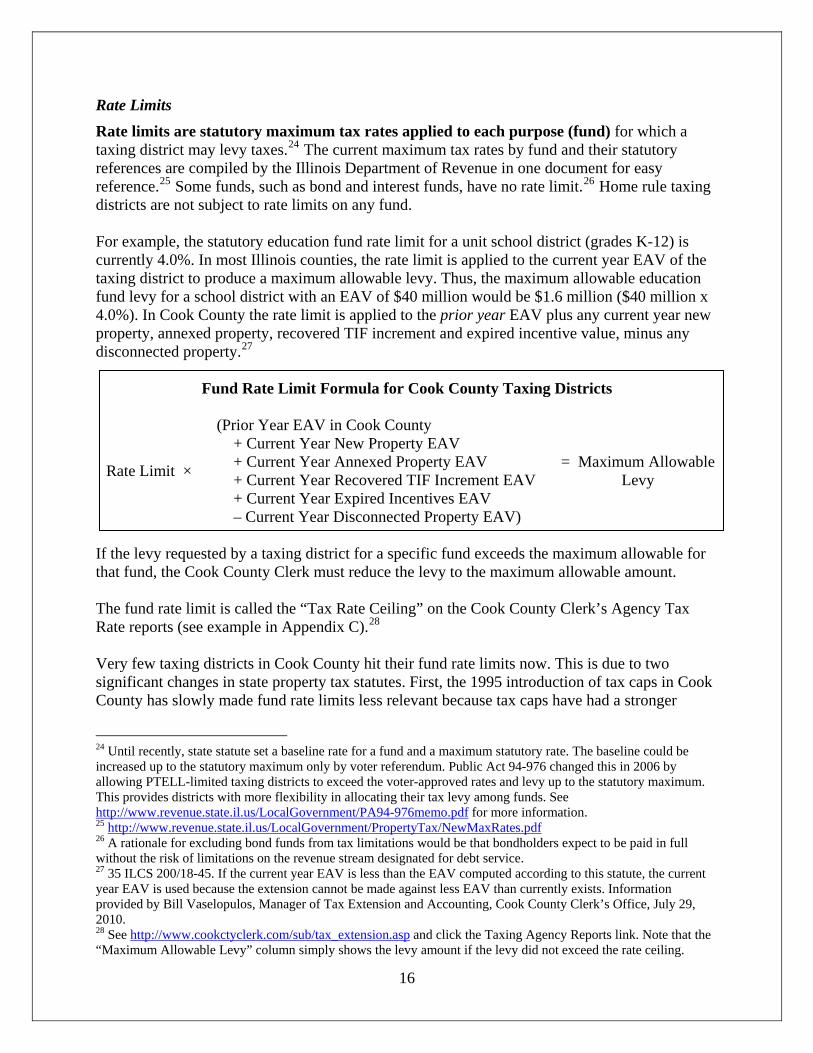
does not “cap” taxable value of property, property tax bills, or even the total property tax extension of a taxing district subject to the law. Tax caps do not completely limit the total extension of a taxing district because some funds and some EAV are excluded from the limiting rate calculation. Tax levies for purposes including some types of bonds, special service areas, and special education and recreation for persons with disabilities are explicitly excluded from the “aggregate extension” of a taxing district subject to PTELL as enumerated in 35 ILCS 200/18-185.37 The EAV for new property, annexed property, recovered TIF increment, and expired incentive value is also excluded from calculation of the PTELL limiting rate. The following illustration shows the tax cap limiting rate formula:
PTELL Formula for Cook County Taxing Districts
(Prior Year Aggregate
Extension × (1+CPI % increase))
÷
(Current Year EAV – Current Year New Property EAV – Current Year Annexed Property EAV – Current Year Recovered TIF Increment EAV – Current Year Expired Incentives EAV + Current Year Disconnected Property EAV)
= PTELL Limiting Rate
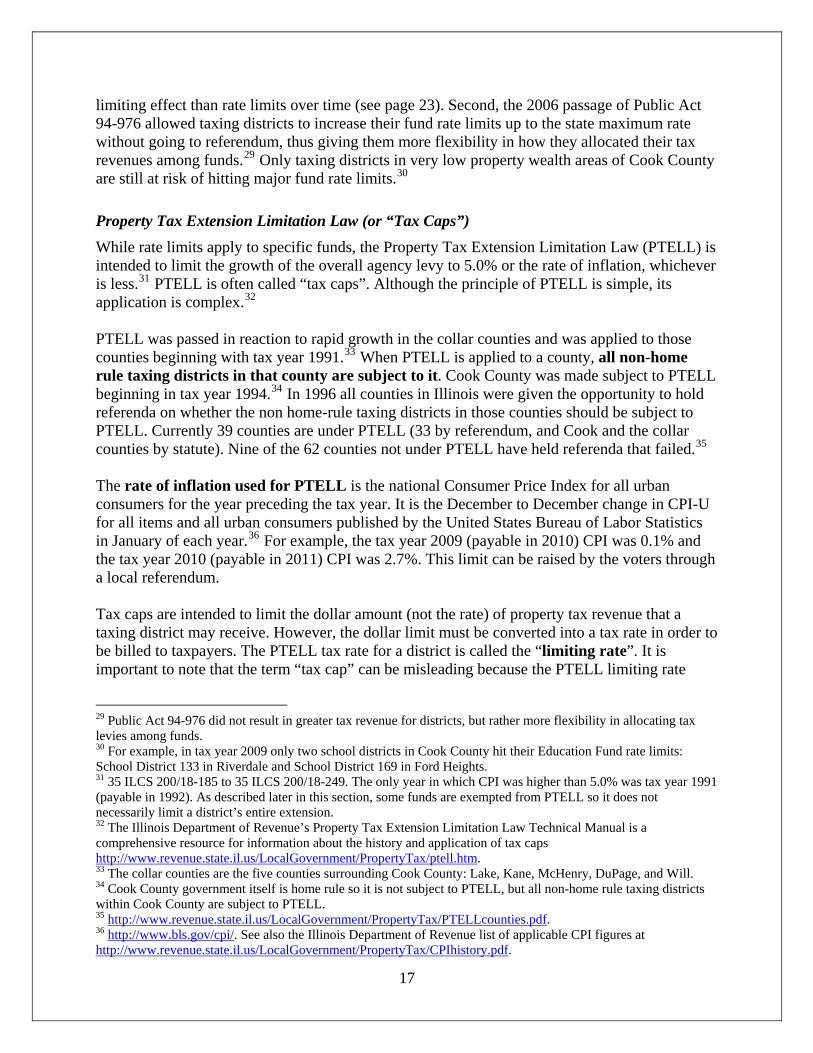
See footnote 37 for the definition of “aggregate extension.” The next illustration shows the actual tax cap limiting rate formula for New Trier Township High School District 203 in tax year 2009. The $81.9 million prior year aggregate extension included all funds except the Building Bonds fund and Life Safety Limited Bonds fund, which are exempted from tax caps. The $82.6 million in EAV for new property, annexed property, recovered TIF increment, etc. is also excluded from the PTELL limiting rate calculation.
2008 Aggregate Extension* 81,817,826$ 2009 EAV 6,972,255,991$
x –
1 + CPI 1.001
2009 New Property, Annexed Property, Recovered TIF Increment,
Expired Incentives, Plus Disconnected Property 82,569,206$
= =81,899,644$ ÷ 6,889,686,785$ = 1.189%
** Follows specific rounding rules used by the Cook County Clerk.Source: Cook County Clerk Tax Year 2009 Agency Tax Rate Report for Agency 04-2050-000.
New Trier Township High School District 203 Example of PTELL Limiting Rate: Tax Year 2009
PTELL Limiting Rate**
* Aggregate Extension is for all funds except Building Bonds (Bonds & Interest School) and Life Safety Limited Bonds, which are excluded under PTELL.
37 In other words, the “aggregate extension” refers to the extension for funds that are subject to PTELL. For most taxing districts the aggregate extension includes all funds except a few bond funds. If a district’s prior year aggregate extension was less than the year before it, the Clerk uses the highest aggregate extension of the last three years to calculate the limiting rate. For example, if the 2009 aggregate extension was $9.9 million, the 2008 aggregate extension was $10.0 million and the 2007 aggregate extension was $10.1 million, the prior year aggregate extension used for the limiting rate in 2010 would be $10.1 million. However, if the 2009 aggregate extension was $10.0 million and the 2008 aggregate extension was $9.9 million, the prior year aggregate extension used for the limiting rate in 2010 would be $10.0 million. 35 ILCS 200/18-185.
18
After the limiting rate is calculated, it is applied to the total current year EAV of the taxing district to compute the maximum aggregate extension for the district (not yet the total extension). Note that the exclusion of new property, annexed property, recovered TIF increment, and expired incentive value from the denominator of the limiting rate calculation has the effect of making the limiting rate higher than it would be if that EAV were included. This excluded EAV is sometimes referred to as being “outside the tax cap” because it is not included in the limiting rate calculation yet taxes are extended against it. In the New Trier Township High School District 203 example above, the limiting rate would have been 1.175% rather than 1.189% if the $82.6 million of new property, annexed property, recovered TIF increment, and expired incentive value EAV had been included in the denominator. The 1.189% limiting rate is applied not only to the “existing property” EAV of $6.889 billion but also to the “new property” EAV of $82.6 million, thus generating an additional $1.0 million in tax revenue for the District “outside the tax cap” ($82.6 million × 1.189% = $0.981 million). This is why PTELL is sometimes referred to by taxing districts as a limitation on property taxes billed to existing properties. Taxing districts also receive additional property tax revenue from new property, annexed property, recovered TIF increment, and expired incentive value.38 In reality, both existing and new properties pay a higher tax rate than they would if the limiting rate formula did not exclude new property, recovered TIF increment and other EAV adjustments. If the district’s levy exceeds the maximum for funds subject to the tax cap, the County Clerk must reduce the aggregate extension accordingly. The Clerk may reduce each fund proportionately or may follow instructions from the taxing district on which funds it would like reduced. These reductions are made after rate limits have already been applied to individual funds. The tax rate for any funds that are exempt from tax caps is calculated by summing the levies for those funds and dividing them by the total current year EAV of the district. The final tax rate for the district is computed by summing the rates of all capped and non-capped funds.
19
38 Conversely, if a district experienced a disconnection of property it would have the effect of lowering the limiting rate.
The Conceptual Difference between Rate Limits and Tax Caps This section explains the difference between rate limits and tax caps by illustrating their effects separately. In reality, tax caps are layered on top of rate limits in PTELL counties, such that tax-capped taxing districts are also subject to rate limits even if rate limits no longer effectively limit the districts’ tax extensions (see page 16). Rate limits and tax caps are two conceptually different ways to limit property taxes. By restricting fund tax rates, rate limits attempt to set the maximum tax burden as a percent of taxable value of property. Rate limits also attempt to restrict the proportion of revenue that can be raised for certain purposes (i.e., funds). If the EAV in a government’s jurisdiction does not change, neither does the total dollar amount that can be extended under fund rate limits. If taxable value rises or falls significantly, so does the maximum allowable property tax revenue of the taxing district. Tax caps take a different approach, aiming instead to directly limit the dollar amount of revenue a taxing agency can collect. Tax caps ignore the tax burden as a percent of taxable value of property. Tax caps in Illinois are also less prescriptive than rate limits about the proportion of revenue raised for various purposes because all fund levies are simply designated as either subject to or exempt from the limiting rate. The effect of this conceptual difference becomes clear when taxable value of property increases or decreases significantly:
• Under tax caps, a tax extension can increase only up to the lesser of the change in CPI or 5% plus additional amounts attributable to new property or special funds exempt from the PTELL; rapidly rising EAV causes declining tax rates.
• Under rate limits, tax extensions fluctuate in proportion to the changes in EAV and the tax rate remains the same if the district levies the maximum amount allowable; thus, rapidly rising EAV generates more revenue. This situation occurred in the collar counties in the 1980s and prompted the creation of tax caps as noted on page 17.
• In the case of falling EAV (for example, due to a contraction in the overall real estate market), tax caps continue to limit extensions but the phenomenon of declining tax rates will slow, cease, or even reverse. In such a case, rate limits impose a check against extensions measured by an absolute percentage of the tax base, regardless of its size, unless voters approve a larger percentage by referendum.
20
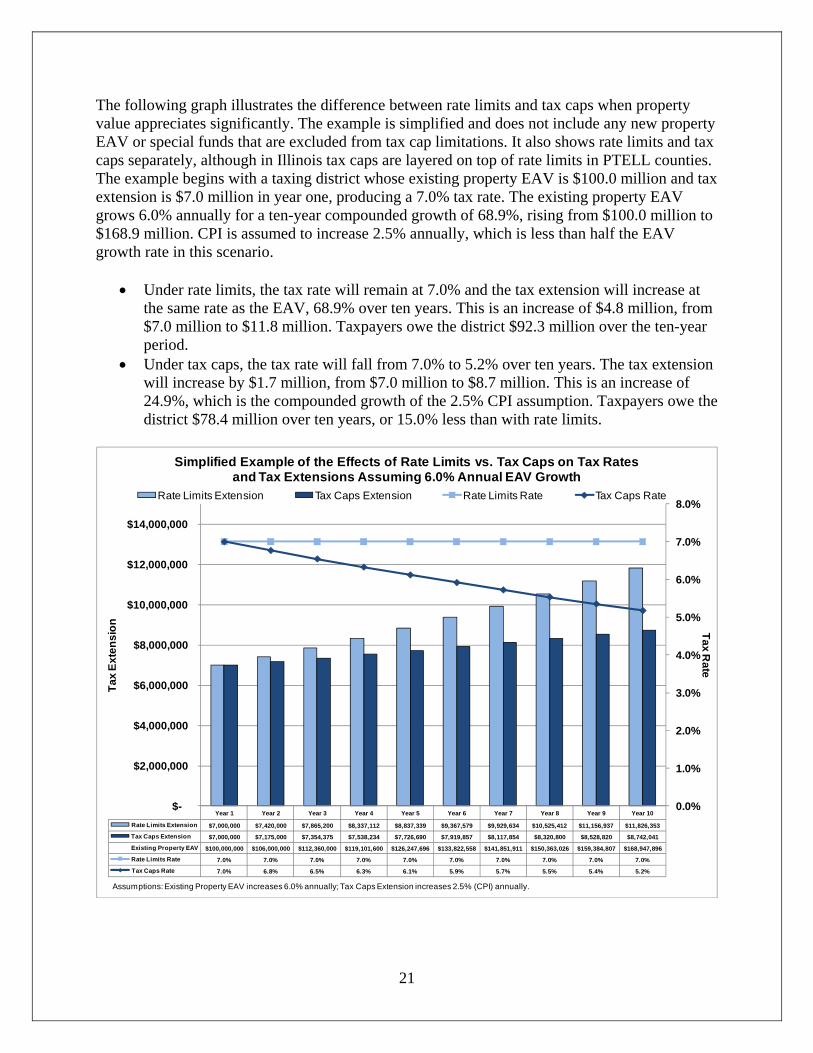
The following graph illustrates the difference between rate limits and tax caps when property value appreciates significantly. The example is simplified and does not include any new property EAV or special funds that are excluded from tax cap limitations. It also shows rate limits and tax caps separately, although in Illinois tax caps are layered on top of rate limits in PTELL counties. The example begins with a taxing district whose existing property EAV is $100.0 million and tax extension is $7.0 million in year one, producing a 7.0% tax rate. The existing property EAV grows 6.0% annually for a ten-year compounded growth of 68.9%, rising from $100.0 million to $168.9 million. CPI is assumed to increase 2.5% annually, which is less than half the EAV growth rate in this scenario.
• Under rate limits, the tax rate will remain at 7.0% and the tax extension will increase at the same rate as the EAV, 68.9% over ten years. This is an increase of $4.8 million, from $7.0 million to $11.8 million. Taxpayers owe the district $92.3 million over the ten-year period.
• Under tax caps, the tax rate will fall from 7.0% to 5.2% over ten years. The tax extension will increase by $1.7 million, from $7.0 million to $8.7 million. This is an increase of 24.9%, which is the compounded growth of the 2.5% CPI assumption. Taxpayers owe the district $78.4 million over ten years, or 15.0% less than with rate limits.
Year 1 Year 2 Year 3 Year 4 Year 5 Year 6 Year 7 Year 8 Year 9 Year 10
Rate Limits Extension $7,000,000 $7,420,000 $7,865,200 $8,337,112 $8,837,339 $9,367,579 $9,929,634 $10,525,412 $11,156,937 $11,826,353
Tax Caps Extension $7,000,000 $7,175,000 $7,354,375 $7,538,234 $7,726,690 $7,919,857 $8,117,854 $8,320,800 $8,528,820 $8,742,041
Existing Property EAV $100,000,000 $106,000,000 $112,360,000 $119,101,600 $126,247,696 $133,822,558 $141,851,911 $150,363,026 $159,384,807 $168,947,896
Rate Limits Rate 7.0% 7.0% 7.0% 7.0% 7.0% 7.0% 7.0% 7.0% 7.0% 7.0%
Tax Caps Rate 7.0% 6.8% 6.5% 6.3% 6.1% 5.9% 5.7% 5.5% 5.4% 5.2%
0.0%
1.0%
2.0%
3.0%
4.0%
5.0%
6.0%
7.0%
8.0%
$-
$2,000,000
$4,000,000
$6,000,000
$8,000,000
$10,000,000
$12,000,000
$14,000,000
Tax Rate
Tax
Exte
nsio
n
Simplified Example of the Effects of Rate Limits vs. Tax Caps on Tax Rates and Tax Extensions Assuming 6.0% Annual EAV Growth
Rate Limits Extension Tax Caps Extension Rate Limits Rate Tax Caps Rate
Assumptions: Existing Property EAV increases 6.0% annually; Tax Caps Extension increases 2.5% (CPI) annually.
21
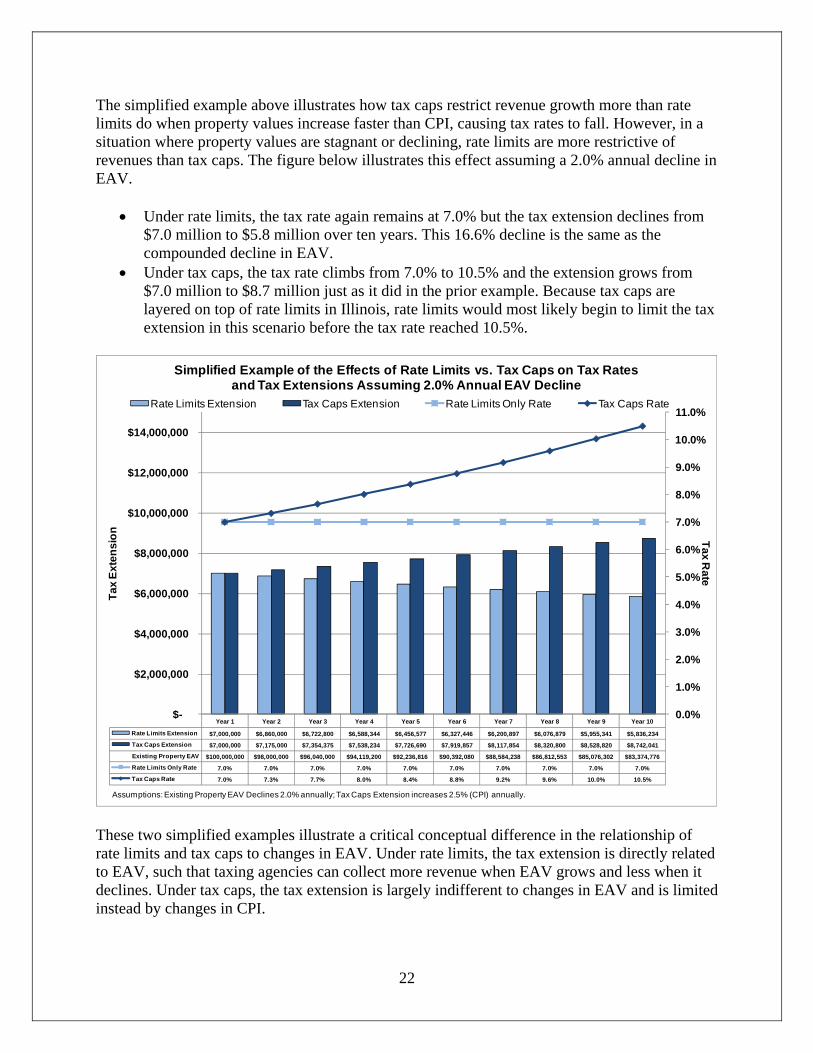
The simplified example above illustrates how tax caps restrict revenue growth more than rate limits do when property values increase faster than CPI, causing tax rates to fall. However, in a situation where property values are stagnant or declining, rate limits are more restrictive of revenues than tax caps. The figure below illustrates this effect assuming a 2.0% annual decline in EAV.
• Under rate limits, the tax rate again remains at 7.0% but the tax extension declines from $7.0 million to $5.8 million over ten years. This 16.6% decline is the same as the compounded decline in EAV.
• Under tax caps, the tax rate climbs from 7.0% to 10.5% and the extension grows from $7.0 million to $8.7 million just as it did in the prior example. Because tax caps are layered on top of rate limits in Illinois, rate limits would most likely begin to limit the tax extension in this scenario before the tax rate reached 10.5%.
Year 1 Year 2 Year 3 Year 4 Year 5 Year 6 Year 7 Year 8 Year 9 Year 10
Rate Limits Extension $7,000,000 $6,860,000 $6,722,800 $6,588,344 $6,456,577 $6,327,446 $6,200,897 $6,076,879 $5,955,341 $5,836,234
Tax Caps Extension $7,000,000 $7,175,000 $7,354,375 $7,538,234 $7,726,690 $7,919,857 $8,117,854 $8,320,800 $8,528,820 $8,742,041
Existing Property EAV $100,000,000 $98,000,000 $96,040,000 $94,119,200 $92,236,816 $90,392,080 $88,584,238 $86,812,553 $85,076,302 $83,374,776
Rate Limits Only Rate 7.0% 7.0% 7.0% 7.0% 7.0% 7.0% 7.0% 7.0% 7.0% 7.0%
Tax Caps Rate 7.0% 7.3% 7.7% 8.0% 8.4% 8.8% 9.2% 9.6% 10.0% 10.5%
0.0%
1.0%
2.0%
3.0%
4.0%
5.0%
6.0%
7.0%
8.0%
9.0%
10.0%
11.0%
$-
$2,000,000
$4,000,000
$6,000,000
$8,000,000
$10,000,000
$12,000,000
$14,000,000
Tax Rate
Tax
Exte
nsio
n
Simplified Example of the Effects of Rate Limits vs. Tax Caps on Tax Rates and Tax Extensions Assuming 2.0% Annual EAV Decline
Rate Limits Extension Tax Caps Extension Rate Limits Only Rate Tax Caps Rate
Assumptions: Existing Property EAV Declines 2.0% annually; Tax Caps Extension increases 2.5% (CPI) annually. These two simplified examples illustrate a critical conceptual difference in the relationship of rate limits and tax caps to changes in EAV. Under rate limits, the tax extension is directly related to EAV, such that taxing agencies can collect more revenue when EAV grows and less when it declines. Under tax caps, the tax extension is largely indifferent to changes in EAV and is limited instead by changes in CPI.
22
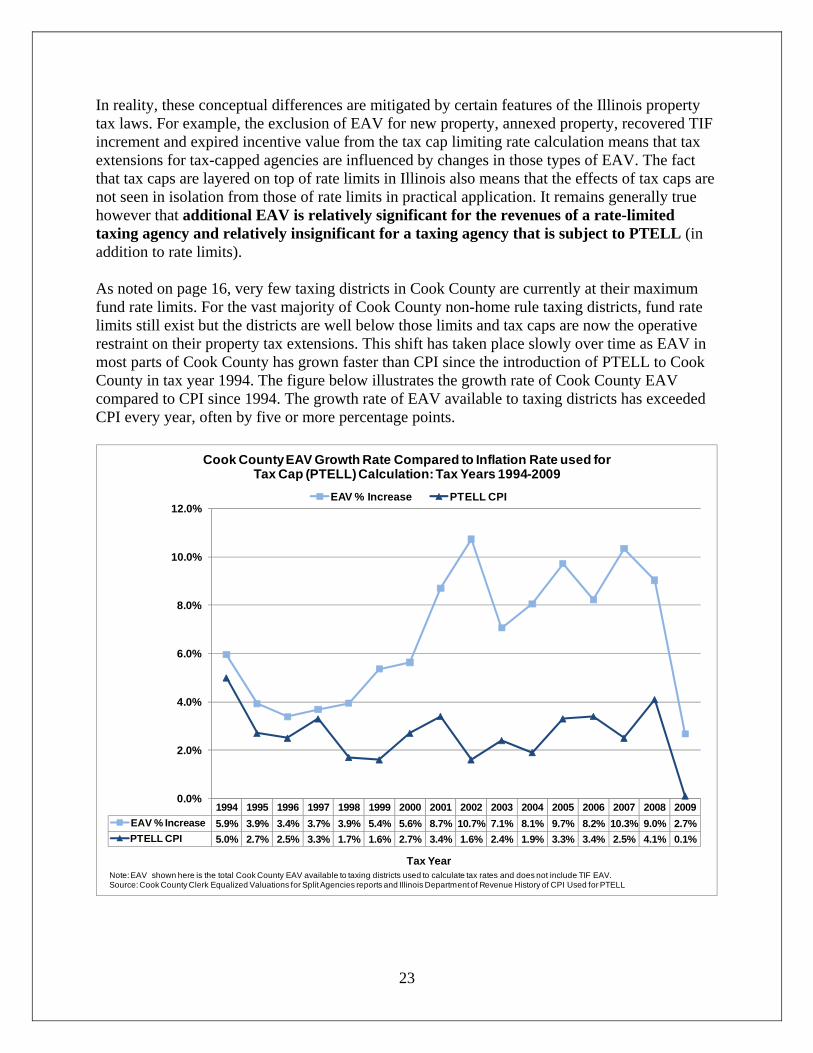
In reality, these conceptual differences are mitigated by certain features of the Illinois property tax laws. For example, the exclusion of EAV for new property, annexed property, recovered TIF increment and expired incentive value from the tax cap limiting rate calculation means that tax extensions for tax-capped agencies are influenced by changes in those types of EAV. The fact that tax caps are layered on top of rate limits in Illinois also means that the effects of tax caps are not seen in isolation from those of rate limits in practical application. It remains generally true however that additional EAV is relatively significant for the revenues of a rate-limited taxing agency and relatively insignificant for a taxing agency that is subject to PTELL (in addition to rate limits). As noted on page 16, very few taxing districts in Cook County are currently at their maximum fund rate limits. For the vast majority of Cook County non-home rule taxing districts, fund rate limits still exist but the districts are well below those limits and tax caps are now the operative restraint on their property tax extensions. This shift has taken place slowly over time as EAV in most parts of Cook County has grown faster than CPI since the introduction of PTELL to Cook County in tax year 1994. The figure below illustrates the growth rate of Cook County EAV compared to CPI since 1994. The growth rate of EAV available to taxing districts has exceeded CPI every year, often by five or more percentage points.
1994 1995 1996 1997 1998 1999 2000 2001 2002 2003 2004 2005 2006 2007 2008 2009EAV % Increase 5.9% 3.9% 3.4% 3.7% 3.9% 5.4% 5.6% 8.7% 10.7% 7.1% 8.1% 9.7% 8.2% 10.3% 9.0% 2.7%PTELL CPI 5.0% 2.7% 2.5% 3.3% 1.7% 1.6% 2.7% 3.4% 1.6% 2.4% 1.9% 3.3% 3.4% 2.5% 4.1% 0.1%
0.0%
2.0%
4.0%
6.0%
8.0%
10.0%
12.0%
Tax Year
Cook County EAV Growth Rate Compared to Inflation Rate used forTax Cap (PTELL) Calculation: Tax Years 1994-2009
EAV % Increase PTELL CPI
Note:EAV shown here is the total Cook County EAV available to taxing districts used to calculate tax rates and does not include TIF EAV.Source: Cook County Clerk Equalized Valuations for Split Agencies reports and Illinois Department of Revenue History of CPI Used for PTELL
23
The effect of the rapid EAV growth throughout most of this period was to hold down or reduce tax rates in many jurisdictions. Conversely, stagnant or declining real estate values are expected to cause tax rates to rise again but will not immediately adversely affect the revenues of most non-home rule taxing districts because they are now so far below their fund rate limits. It is possible that tax caps encourage taxing districts to levy up to the limit even if the additional revenue is not needed that year because by failing to do so they would forgo future compounded growth. Rate limits do not create the same incentive because they are not based on the prior year’s extension. Whether or not tax-capped districts do in fact unnecessarily maximize their levies, there is evidence that tax caps have slowed the growth of tax extensions for municipalities and schools in PTELL counties.39
Calculation of Final Tax Rate After all fund rate limits and tax caps have been applied to a levy, the Cook County Clerk must consider whether or not 100% of a taxing district’s jurisdiction is located in Cook County. Some taxing agencies are in two or more counties. The City of Chicago, for example, is 99.99% in Cook County and 0.01% in DuPage County (a portion of O’Hare airport is located in DuPage County). Joliet Community College District 525 has jurisdiction in seven different counties: Cook, Will, Grundy, Kankakee, Kendall, LaSalle, and Livingston. The Illinois Constitution states that the General Assembly may enact laws to provide for the fair apportionment of property tax burden for taxing districts situated in more than one county.40 State statute provides that the Illinois Department of Revenue may determine the apportionment percentages using assessed value data obtained from the relevant county clerks.41 The clerk of each county then extends taxes for that district using the apportionment percentage assigned by the Department of Revenue. The apportionment percentage is applied to the levy for each fund after rate limits and tax caps have been applied. If the Department of Revenue has not assigned an apportionment percentage, the Clerk proceeds with the tax extension as though 100% of the burden were in Cook County then applies the final tax rate to the Cook County EAV only. After the dollar amount of the levy for each fund has been determined and any rate limits, tax caps, or apportionment percentages have been applied the Clerk computes the final tax rate for each fund by dividing the fund dollar amount into the current year EAV of the taxing district (or the Cook County portion of EAV if an apportionment percentage has already been applied). The sum of the final tax rates for all funds is the total final tax rate of the district. The standard arithmetic rounding rule (round up five or higher) is used for individual fund rates but the total final tax rate uses a special rounding rule that rounds up the third decimal place if the fourth decimal place is greater than zero. Any 0.0001% is rounded up to the nearest 0.001% in the
39 Richard F. Dye, Therese J. McGuire, and Daniel P. McMillen, “Are Property Tax Limitations More Binding Over Time?” National Tax Journal Vol. LVIII, No. 2, June 2005. 40 Illinois Constitution Article IX Section 7.
24
41 35 ILCS 200/18-155. The Illinois Department of Revenue is required to apportion the tax burden if a written request to do so is filed by an assessor, chief county assessment officer, board of review, board of appeals, the multi-county taxing district or 25 interested taxpayers.
total final tax rate, such that a final rate of 1.1111% would be rounded to 1.112%.42 The Cook County Clerk uses two additional decimal places for individual fund rates of a few taxing districts with a very large EAV (e.g., Cook County, City of Chicago, Metropolitan Water Reclamation District). More decimal places allows for more precision in fund rates for these districts. For these districts, the sixth decimal place is rounded up if the seventh decimal place is greater than zero. The final total tax rate is rounded to three decimal places as with other districts.43
Composite Tax Rate After final tax rates for each taxing district are calculated, the Cook County Clerk’s Office computes the composite tax rate for each tax code in the County (see page 5 for more on tax codes) by summing the final tax rates of all taxing districts with jurisdiction in the tax code.44 The composite tax rate for the majority of parcels in the City of Chicago was 4.627% in tax year 2009. The composite tax rate has fallen by more than 50% since tax year 1990 when it was 9.964% (see Appendix F). This decline has occurred because EAV of the taxing districts has risen much faster than their extensions in the aggregate.
42 35 ILCS 200/18-140 states that “In the computation of rates, a fraction of a mill shall be extended as the next higher mill.” A mill is one tenth of one cent, or $0.001, in dollars per hundred dollars of EAV. 43 Information provided by Bill Vaselopulos, Manager of Tax Extension and Accounting, Cook County Clerk’s Office, July 29, 2010.
25
44 The Cook County Clerk’s Office has a Tax Code Rate Report available at http://www.cookcountyclerk.com/tsd/extensionsandrates/Pages/default.aspx#reports (last visited on May 31, 2011). The Clerk’s annual Tax Rates Report (http://www.cookcountyclerk.com/tsd/extensionsandrates/Pages/default.aspx) also shows composite rates by tax code for selected sample tax codes.
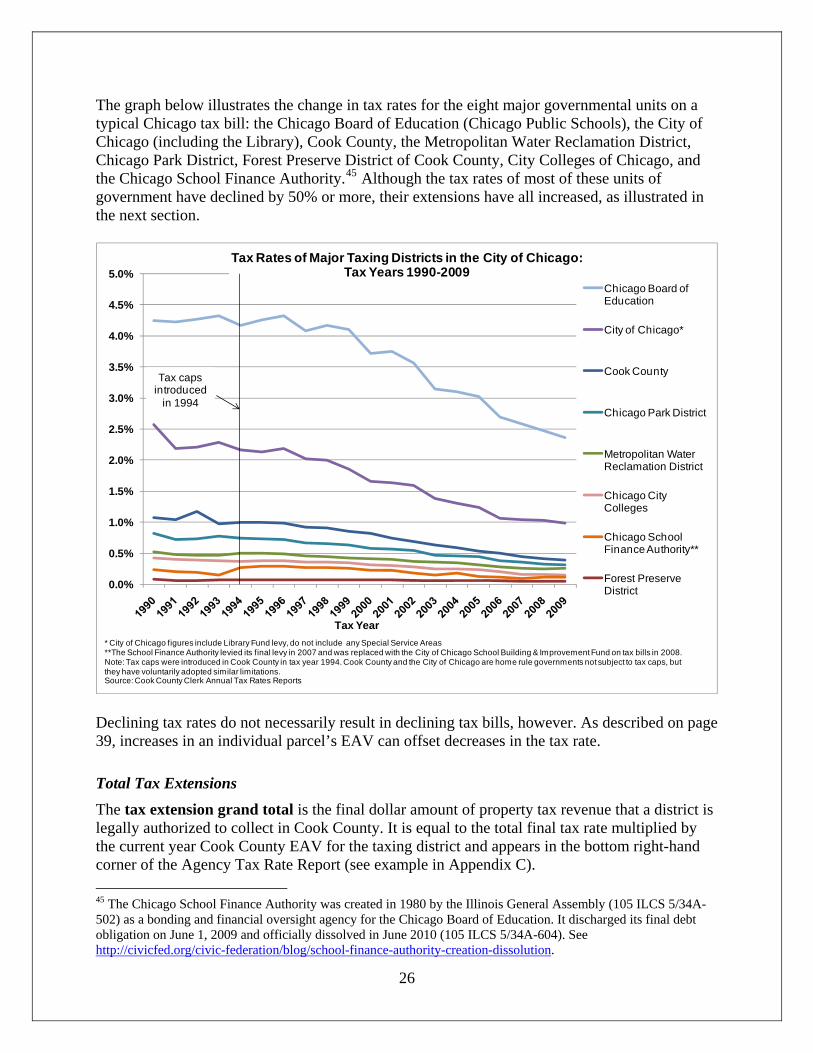
The graph below illustrates the change in tax rates for the eight major governmental units on a typical Chicago tax bill: the Chicago Board of Education (Chicago Public Schools), the City of Chicago (including the Library), Cook County, the Metropolitan Water Reclamation District, Chicago Park District, Forest Preserve District of Cook County, City Colleges of Chicago, and the Chicago School Finance Authority.45 Although the tax rates of most of these units of government have declined by 50% or more, their extensions have all increased, as illustrated in the next section.
0.0%
0.5%
1.0%
1.5%
2.0%
2.5%
3.0%
3.5%
4.0%
4.5%
5.0%
Tax Year
Tax Rates of Major Taxing Districts in the City of Chicago:Tax Years 1990-2009
Chicago Board of Education
City of Chicago*
Cook County
Chicago Park District
Metropolitan Water Reclamation District
Chicago City Colleges
Chicago School Finance Authority**
Forest Preserve District
Tax caps introduced
in 1994
* City of Chicago figures include Library Fund levy, do not include any Special Service Areas**The School Finance Authority levied its final levy in 2007 and was replaced with the City of Chicago School Building & Improvement Fund on tax bills in 2008.Note: Tax caps were introduced in Cook County in tax year 1994. Cook County and the City of Chicago are home rule governments not subject to tax caps, but they have voluntarily adopted similar limitations.Source: Cook County Clerk Annual Tax Rates Reports
Declining tax rates do not necessarily result in declining tax bills, however. As described on page 39, increases in an individual parcel’s EAV can offset decreases in the tax rate.
Total Tax Extensions The tax extension grand total is the final dollar amount of property tax revenue that a district is legally authorized to collect in Cook County. It is equal to the total final tax rate multiplied by the current year Cook County EAV for the taxing district and appears in the bottom right-hand corner of the Agency Tax Rate Report (see example in Appendix C).
26
45 The Chicago School Finance Authority was created in 1980 by the Illinois General Assembly (105 ILCS 5/34A-502) as a bonding and financial oversight agency for the Chicago Board of Education. It discharged its final debt obligation on June 1, 2009 and officially dissolved in June 2010 (105 ILCS 5/34A-604). See http://civicfed.org/civic-federation/blog/school-finance-authority-creation-dissolution.
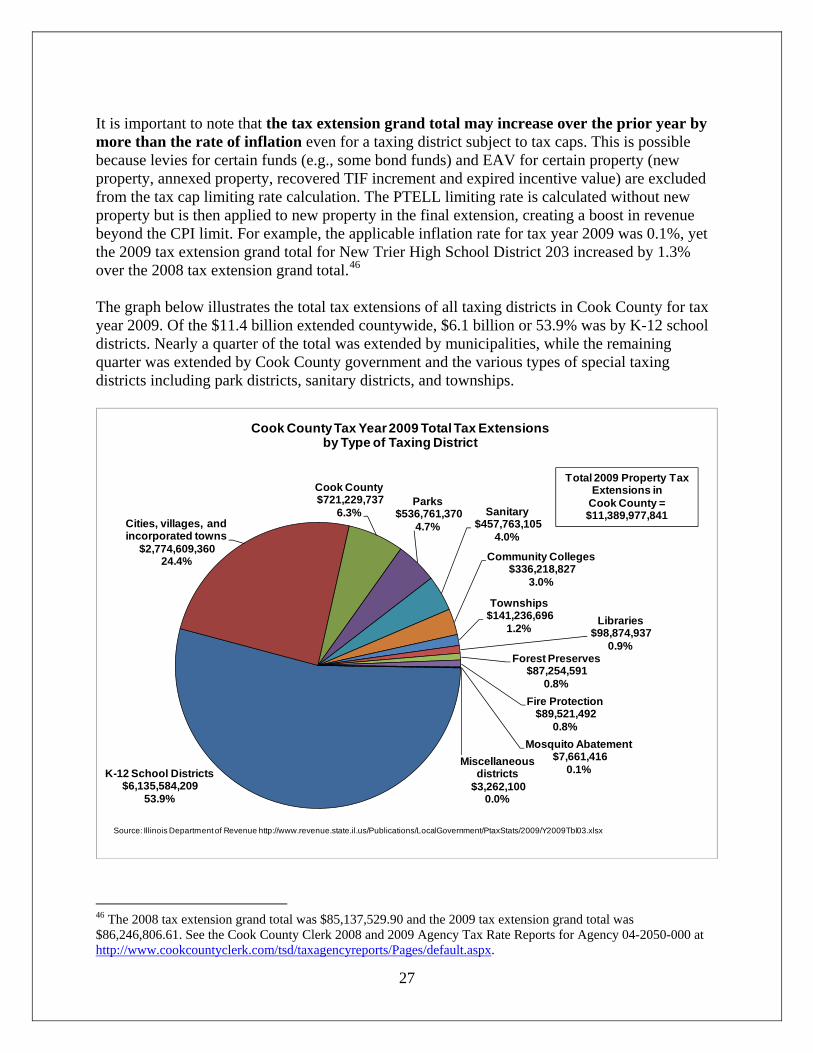
It is important to note that the tax extension grand total may increase over the prior year by more than the rate of inflation even for a taxing district subject to tax caps. This is possible because levies for certain funds (e.g., some bond funds) and EAV for certain property (new property, annexed property, recovered TIF increment and expired incentive value) are excluded from the tax cap limiting rate calculation. The PTELL limiting rate is calculated without new property but is then applied to new property in the final extension, creating a boost in revenue beyond the CPI limit. For example, the applicable inflation rate for tax year 2009 was 0.1%, yet the 2009 tax extension grand total for New Trier High School District 203 increased by 1.3% over the 2008 tax extension grand total.46 The graph below illustrates the total tax extensions of all taxing districts in Cook County for tax year 2009. Of the $11.4 billion extended countywide, $6.1 billion or 53.9% was by K-12 school districts. Nearly a quarter of the total was extended by municipalities, while the remaining quarter was extended by Cook County government and the various types of special taxing districts including park districts, sanitary districts, and townships.
K-12 School Districts$6,135,584,209
53.9%
Cities, villages, and incorporated towns
$2,774,609,360 24.4%
Cook County$721,229,737
6.3%Parks
$536,761,370 4.7%
Sanitary $457,763,105
4.0%
Community Colleges $336,218,827
3.0%
Townships $141,236,696
1.2%Libraries
$98,874,937 0.9%
Forest Preserves $87,254,591
0.8%Fire Protection
$89,521,492 0.8%
Mosquito Abatement $7,661,416
0.1%Miscellaneous
districts $3,262,100
0.0%
Cook County Tax Year 2009 Total Tax Extensionsby Type of Taxing District
Source: Illinois Department of Revenue http://www.revenue.state.il.us/Publications/LocalGovernment/PtaxStats/2009/Y2009Tbl03.xlsx
Total 2009 Property Tax Extensions in
Cook County = $11,389,977,841
27
46 The 2008 tax extension grand total was $85,137,529.90 and the 2009 tax extension grand total was $86,246,806.61. See the Cook County Clerk 2008 and 2009 Agency Tax Rate Reports for Agency 04-2050-000 at http://www.cookcountyclerk.com/tsd/taxagencyreports/Pages/default.aspx.
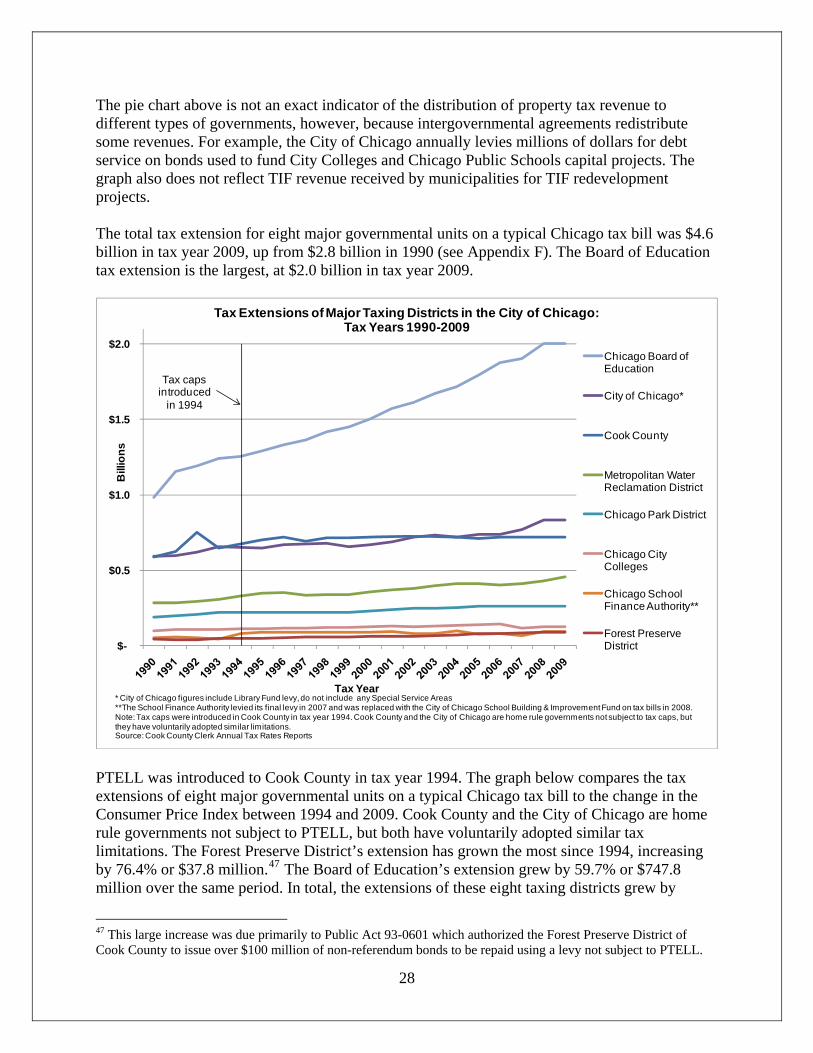
The pie chart above is not an exact indicator of the distribution of property tax revenue to different types of governments, however, because intergovernmental agreements redistribute some revenues. For example, the City of Chicago annually levies millions of dollars for debt service on bonds used to fund City Colleges and Chicago Public Schools capital projects. The graph also does not reflect TIF revenue received by municipalities for TIF redevelopment projects. The total tax extension for eight major governmental units on a typical Chicago tax bill was $4.6 billion in tax year 2009, up from $2.8 billion in 1990 (see Appendix F). The Board of Education tax extension is the largest, at $2.0 billion in tax year 2009.
$-
$0.5
$1.0
$1.5
$2.0
Bill
ions
Tax Year
Tax Extensions of Major Taxing Districts in the City of Chicago:Tax Years 1990-2009
Chicago Board of Education
City of Chicago*
Cook County
Metropolitan Water Reclamation District
Chicago Park District
Chicago City Colleges
Chicago School Finance Authority**
Forest Preserve District
* City of Chicago figures include Library Fund levy, do not include any Special Service Areas**The School Finance Authority levied its final levy in 2007 and was replaced with the City of Chicago School Building & Improvement Fund on tax bills in 2008.Note: Tax caps were introduced in Cook County in tax year 1994. Cook County and the City of Chicago are home rule governments not subject to tax caps, but they have voluntarily adopted similar limitations.Source: Cook County Clerk Annual Tax Rates Reports
Tax caps introduced
in 1994
PTELL was introduced to Cook County in tax year 1994. The graph below compares the tax extensions of eight major governmental units on a typical Chicago tax bill to the change in the Consumer Price Index between 1994 and 2009. Cook County and the City of Chicago are home rule governments not subject to PTELL, but both have voluntarily adopted similar tax limitations. The Forest Preserve District’s extension has grown the most since 1994, increasing by 76.4% or $37.8 million.47 The Board of Education’s extension grew by 59.7% or $747.8 million over the same period. In total, the extensions of these eight taxing districts grew by
28
47 This large increase was due primarily to Public Act 93-0601 which authorized the Forest Preserve District of Cook County to issue over $100 million of non-referendum bonds to be repaid using a levy not subject to PTELL.
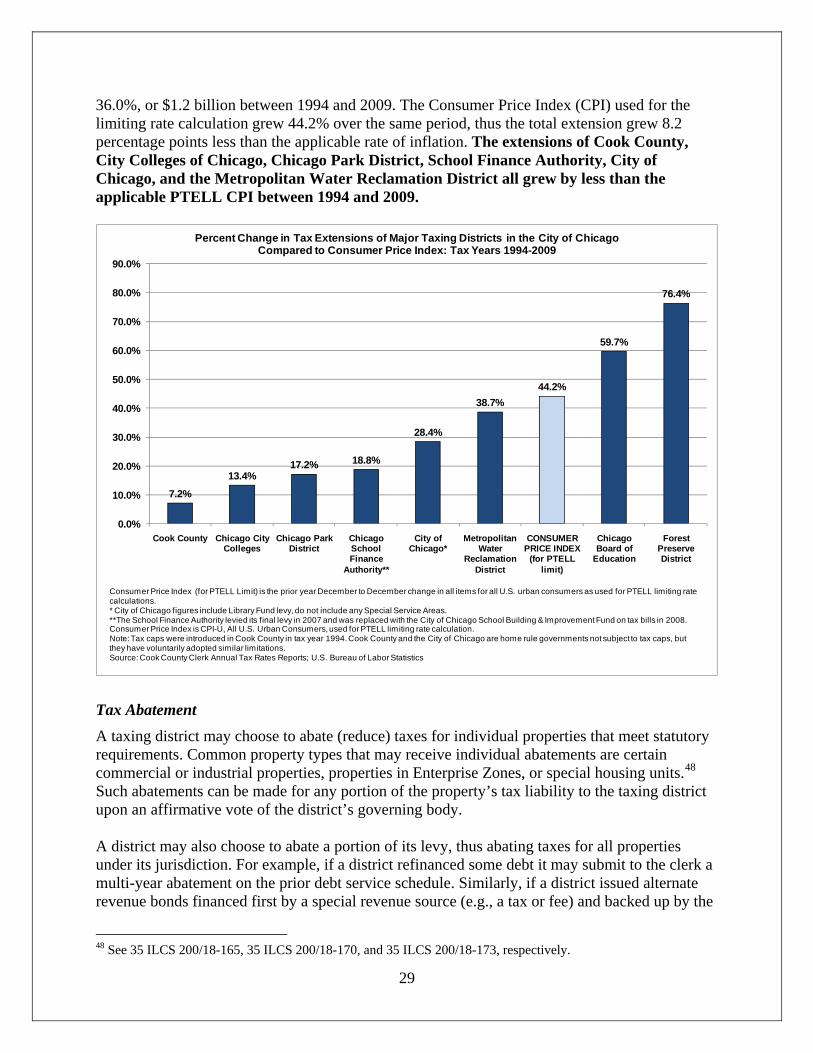
36.0%, or $1.2 billion between 1994 and 2009. The Consumer Price Index (CPI) used for the limiting rate calculation grew 44.2% over the same period, thus the total extension grew 8.2 percentage points less than the applicable rate of inflation. The extensions of Cook County, City Colleges of Chicago, Chicago Park District, School Finance Authority, City of Chicago, and the Metropolitan Water Reclamation District all grew by less than the applicable PTELL CPI between 1994 and 2009.
7.2%
13.4%17.2% 18.8%
28.4%
38.7%44.2%
59.7%
76.4%
0.0%
10.0%
20.0%
30.0%
40.0%
50.0%
60.0%
70.0%
80.0%
90.0%
Cook County Chicago City Colleges
Chicago Park District
Chicago School Finance
Authority**
City of Chicago*
Metropolitan Water
Reclamation District
CONSUMER PRICE INDEX
(for PTELL limit)
Chicago Board of
Education
Forest Preserve District
Percent Change in Tax Extensions of Major Taxing Districts in the City of ChicagoCompared to Consumer Price Index: Tax Years 1994-2009
Consumer Price Index (for PTELL Limit) is the prior year December to December change in all items for all U.S. urban consumers as used for PTELL limiting rate calculations.* City of Chicago figures include Library Fund levy, do not include any Special Service Areas.**The School Finance Authority levied its final levy in 2007 and was replaced with the City of Chicago School Building & Improvement Fund on tax bills in 2008.Consumer Price Index is CPI-U, All U.S. Urban Consumers, used for PTELL limiting rate calculation.Note: Tax caps were introduced in Cook County in tax year 1994. Cook County and the City of Chicago are home rule governments not subject to tax caps, but they have voluntarily adopted similar limitations.Source: Cook County Clerk Annual Tax Rates Reports; U.S. Bureau of Labor Statistics
Tax Abatement A taxing district may choose to abate (reduce) taxes for individual properties that meet statutory requirements. Common property types that may receive individual abatements are certain commercial or industrial properties, properties in Enterprise Zones, or special housing units.48 Such abatements can be made for any portion of the property’s tax liability to the taxing district upon an affirmative vote of the district’s governing body. A district may also choose to abate a portion of its levy, thus abating taxes for all properties under its jurisdiction. For example, if a district refinanced some debt it may submit to the clerk a multi-year abatement on the prior debt service schedule. Similarly, if a district issued alternate revenue bonds financed first by a special revenue source (e.g., a tax or fee) and backed up by the
29
48 See 35 ILCS 200/18-165, 35 ILCS 200/18-170, and 35 ILCS 200/18-173, respectively.
property tax levy, it may routinely abate the scheduled property tax levy if the first revenue source proves adequate to pay the debt service. The deadline for taxing districts to submit abatements that reduce their tax levy to the Cook County Clerk is June 1 of the year following the levy year.49
TIF Property Tax Revenue TIF districts to not levy taxes, thus TIFs do not have their own tax rates. TIF districts do not ask for a certain amount of money from taxpayers the way that other taxing agencies do. The property tax revenues received by TIF districts are the result of applying the tax rates of other taxing agencies to the TIF increment EAV. The same property tax rate is applied to all property in the TIF, both the frozen EAV and the increment EAV. Revenue generated from the frozen EAV amount goes to the taxing districts (schools, parks, etc.) while revenue generated from the increment EAV amount goes to the TIF district.50 Property tax revenue generated from the increment EAV is used to pay for TIF projects, or to pay for debt service on bonds that were issued to pay for TIF projects.51 In Illinois, TIF districts are created by municipal and county governments, so the increment revenue is received by the municipality or county and spent according to the TIF redevelopment plan.
49 Information provided by Bill Vaselopulos, Manager of Tax Extension and Accounting, Cook County Clerk’s Office, July 29, 2010. 50 The challenges of representing TIF on tax bills are discussed on page 41 of this report.
30
51 Some TIF districts issue bonds in order to pay for major initial construction costs and then use TIF district revenue for debt service on the bonds over time. Other TIF districts use a pay-as-you-go strategy to fund their improvements without borrowing.
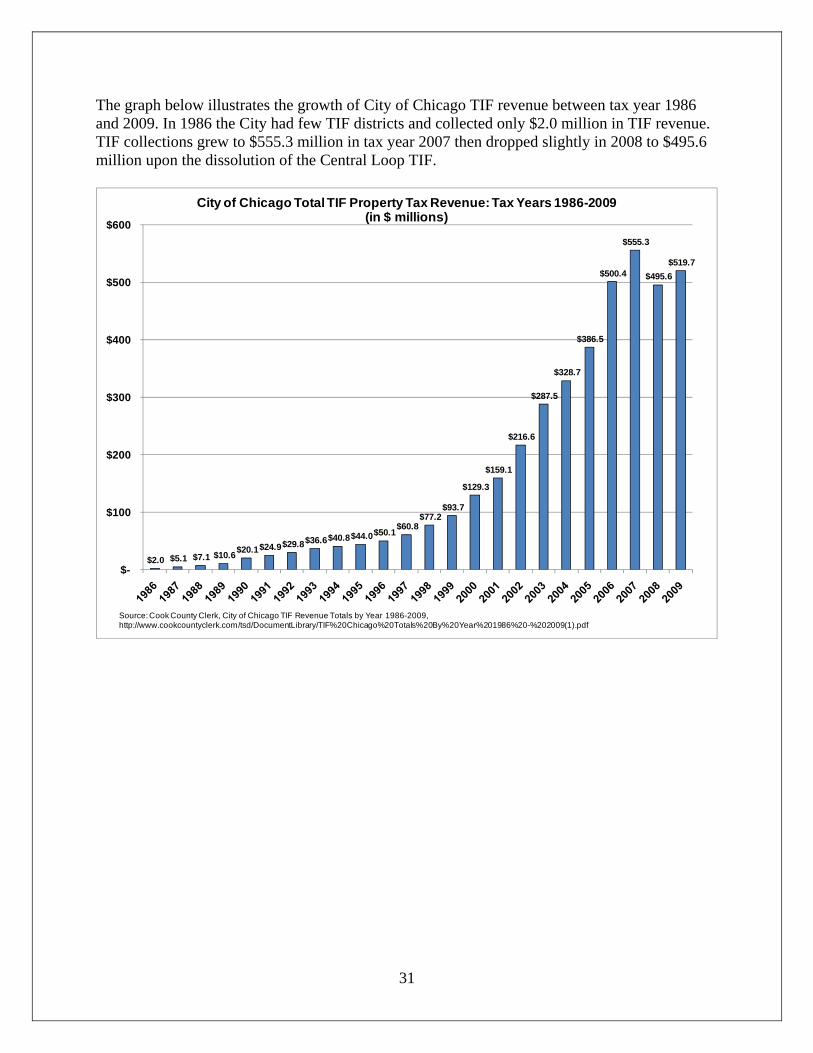
The graph below illustrates the growth of City of Chicago TIF revenue between tax year 1986 and 2009. In 1986 the City had few TIF districts and collected only $2.0 million in TIF revenue. TIF collections grew to $555.3 million in tax year 2007 then dropped slightly in 2008 to $495.6 million upon the dissolution of the Central Loop TIF.
31
$2.0 $5.1 $7.1 $10.6 $20.1 $24.9 $29.8 $36.6 $40.8 $44.0 $50.1 $60.8 $77.2
$93.7
$129.3
$159.1
$216.6
$287.5
$328.7
$386.5
$500.4
$555.3
$495.6 $519.7
$-
$100
$200
$300
$400
$500
$600
City of Chicago Total TIF Property Tax Revenue: Tax Years 1986-2009(in $ millions)
Source:Cook County Clerk, City of Chicago TIF Revenue Totals by Year 1986-2009, http://www.cookcountyclerk.com/tsd/DocumentLibrary/TIF%20Chicago%20Totals%20By%20Year%201986%20-%202009(1).pdf
The Effect of TIF Districts on Tax Rates TIF districts do not levy taxes and thus do not have tax extensions or tax rates, only tax distributions. TIF districts freeze the EAV, not the amount of tax revenue originating from a TIF district that is available to taxing districts other than the municipality that created the TIF district.52 By restricting the denominator of the basic tax rate equation (Levy ÷ EAV = Rate), TIF districts cause property tax rates of overlapping taxing districts (e.g., school districts, park districts) to be higher than they would have been otherwise.53 The higher tax rate applies throughout the taxing district, so taxpayers both inside and outside of a TIF district pay the same higher rate than if the TIF district did not exist. Opponents of TIF often claim that TIF districts divert millions of dollars from school districts and other local taxing districts in Cook County. This view overlooks three important aspects of the property tax laws:
• First, the belief that TIF diverts revenue from overlapping taxing districts in Cook County assumes that the affected taxing districts are rate-limited—that is, that they have reached their maximum fund rate limits (see page 16) and intend to keep maximizing their revenue under these limits. Prior to the imposition of tax caps on Cook County in tax year 1994, it was true that TIF district creation could restrict revenue available to rate-limited taxing districts in Cook County seeking to maximize their tax extensions. However, as described on page 23, tax caps (not rate limits) are now the effective tax limitation for the vast majority of non-home rule Cook County taxing districts.54
The tax cap law limits tax extensions to the increase in Consumer Price Index, not EAV, although some additional property tax revenue beyond CPI growth can be obtained from new property as described on page 19. Unless rate-limited funds of the taxing district are at or close to their maximum rates, freezing the EAV simply causes tax rates to rise. In other words, the general effect of TIF in a PTELL-limited county such as Cook is to increase taxes paid by all taxpayers, not to limit tax revenue for overlapping taxing districts.
• Second, the belief that TIF diverts revenue from overlapping taxing districts in Cook County assumes that all affected taxing districts seek to maximize their property tax revenues. The Chicago Park District, Metropolitan Water Reclamation District and
52 Illinois statutes allow counties and municipalities to create TIF districts but in Cook County only municipalities have created TIF districts. 53 However, in the absence of TIF municipalities might choose to directly levy additional property taxes for economic development purposes. Thus eliminating TIF might not necessarily lead to a corresponding decrease in property taxes unless municipalities eliminated or scaled back their property tax-funded economic development programs. Eliminating TIF could also lead municipalities to increase other taxes or fees to fund economic development.
32
54 In the 1990s and early 2000s rate limits still limited some Cook County taxing districts and the fact that TIF froze some EAV did reduce the amount of tax revenue available to taxing districts that were at their rate limits.
Chicago Public Schools are all examples of taxing districts that have chosen not request the maximum levy available to them in recent years. If a taxing district has voluntarily chosen not to maximize its property tax levy, it is illogical to contend that it has lost revenue to TIF.
• Third, home rule taxing districts such as Cook County and the City of Chicago are not
subject to rate limits or tax caps, therefore home rule taxing districts can never be said to lose revenue to TIF. Any property tax limitation on a home rule taxing district is self-imposed and can be changed by its governing body if it seeks more property tax revenue.55
There is one way in which a tax-capped taxing district that is far from its maximum rate limits can be said to lose revenue to TIF. If one believes that the new construction in a TIF district would have occurred even if the TIF district had not been created, then it is true that a tax-capped taxing district seeking to maximize its property tax revenue does lose some revenue during the life of the TIF district.56 It loses additional revenue it could have received from the new property EAV in the TIF district because new property is taxable outside the tax cap in the first year it is assessed (see page 19 on what is “outside” the tax cap). However, TIF also enables tax-capped districts to capture revenue from existing property EAV growth that they could not have captured without a TIF district. Under PTELL, the growth of existing property EAV does not increase revenues to the taxing district—it simply lowers the tax rate. But the growth of existing property EAV in a TIF district becomes part of the increment and is eventually returned to the taxing district’s EAV base outside the tax cap. The graph on page 35 illustrates the interaction between tax caps and TIF described above. It shows a simplified example of a tax-capped (PTELL-limited) school district where a TIF is created, freezing 10% of the EAV in the school district’s jurisdiction.57 The model conservatively assumes that all new construction in the TIF district would have been built even if the TIF district had not been established and that new and existing property growth occurs at the same rate both within and outside the TIF district.58 The graph shows that during the 23-year life of the TIF district, the overlying school district experiences a cumulative loss equal to 0.9% of the maximum extensions it could have achieved under the PTELL if the TIF district had not been created but all the new property had still been built. The loss occurs because the school district cannot tax the new property in the TIF district, which would otherwise be available for taxation “outside” the tax cap in the first year after its construction under the tax cap law. 55 Cook County is the only county in Illinois that is home-rule. See page 15 of this report. 56 It is important to note that not all tax-capped taxing districts seek to maximize their property tax revenues every year. The Chicago Park District, Metropolitan Water Reclamation District, and Chicago Public Schools are all examples of districts that have chosen not to go to their tax cap limit in recent levy years. If a taxing district has voluntarily chosen not to maximize its property tax levy, it is illogical to contend that it has lost revenue to TIF. Furthermore, as described on page 36, some taxing districts receive capital funding directly from TIF districts. 57 See Appendix D for details and assumptions of the model.
33
58 In other words, it assumes that the TIF district adds no value and TIF projects fail the “but for” test.
At the end of 23 years, the TIF district expires and the school district is permitted to tax the entire recovered TIF increment EAV in year 24. Recovered TIF increment EAV includes both new property and the appreciation of existing property. Under the assumptions of this model, 65% of the recovered TIF increment EAV is appreciation on the original frozen base of existing properties. The appreciation on existing property would not normally provide additional revenue to the school district under the tax cap law. But because it is part of the recovered TIF increment, it becomes available outside the tax cap limit and provides additional revenue that would not have been available if the TIF had not been created. If the school district maximizes its extension to capture the recovered TIF increment in year 24, it can boost that extension by 6.3 percentage points more than the normal annual increase.59 As a result of this boost in maximum extension, the cumulative losses incurred over the life of the TIF begin to reverse and in six years the school district experiences a net gain. By year 46, the cumulative gain is equal to 1.4% over what the maximum extensions would have been without the TIF district.60 It is important to note that in the opposite case of a successful TIF district where the “but for” test is met and no new construction would have occurred without the TIF district creation, there is no loss to the tax-capped school district over the life of the TIF and there is significant additional revenue available from recovered TIF increment (which includes existing property appreciation) when the TIF is closed.
59 See Appendix D Table 2, Maximum Extension (in Nominal Dollars) Annual % Increase.
34
60 An increase in property tax revenue for a school district does not necessarily result in an equivalent increase in total revenue, however, due to the compensating effect of Illinois’ General State Aid formula. For more on this relationship see “Tax Increment Financing: A Civic Federation Issue Brief,” November 12, 2007 at http://www.civicfed.org/sites/default/files/civicfed_260.pdf.
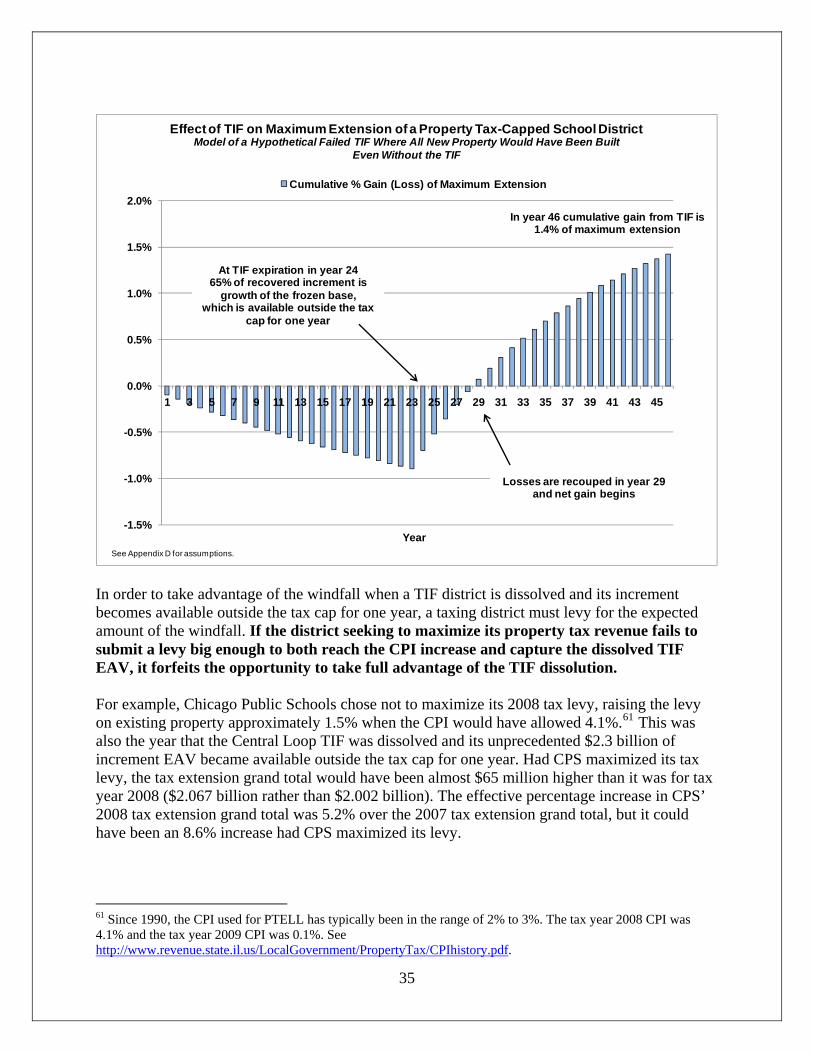
-1.5%
-1.0%
-0.5%
0.0%
0.5%
1.0%
1.5%
2.0%
1 3 5 7 9 11 13 15 17 19 21 23 25 27 29 31 33 35 37 39 41 43 45
Year
Effect of TIF on Maximum Extension of a Property Tax-Capped School DistrictModel of a Hypothetical Failed TIF Where All New Property Would Have Been Built
Even Without the TIF
Cumulative % Gain (Loss) of Maximum Extension
See Appendix D for assumptions.
In year 46 cumulative gain from TIF is 1.4% of maximum extension
At TIF expiration in year 2465% of recovered increment is
growth of the frozen base,which is available outside the tax
cap for one year
Losses are recouped in year 29 and net gain begins
In order to take advantage of the windfall when a TIF district is dissolved and its increment becomes available outside the tax cap for one year, a taxing district must levy for the expected amount of the windfall. If the district seeking to maximize its property tax revenue fails to submit a levy big enough to both reach the CPI increase and capture the dissolved TIF EAV, it forfeits the opportunity to take full advantage of the TIF dissolution. For example, Chicago Public Schools chose not to maximize its 2008 tax levy, raising the levy on existing property approximately 1.5% when the CPI would have allowed 4.1%.61 This was also the year that the Central Loop TIF was dissolved and its unprecedented $2.3 billion of increment EAV became available outside the tax cap for one year. Had CPS maximized its tax levy, the tax extension grand total would have been almost $65 million higher than it was for tax year 2008 ($2.067 billion rather than $2.002 billion). The effective percentage increase in CPS’ 2008 tax extension grand total was 5.2% over the 2007 tax extension grand total, but it could have been an 8.6% increase had CPS maximized its levy.
35
61 Since 1990, the CPI used for PTELL has typically been in the range of 2% to 3%. The tax year 2008 CPI was 4.1% and the tax year 2009 CPI was 0.1%. See http://www.revenue.state.il.us/LocalGovernment/PropertyTax/CPIhistory.pdf.
The effect of TIF on taxpayers in the scenario modeled above is to raise tax rates. All taxpayers under the jurisdiction of the school district owe higher taxes than they would have without TIF.62 Taxpayers owe 2.9% more in taxes during the first 23 years of the scenario and 3.9% more in taxes to the TIF district and school district cumulatively over the 46-year time peri 63od.
TIF Expenditures for Taxing District Projects Some taxing districts benefit directly from TIF by receiving TIF funding for capital projects. Municipalities may enter into intergovernmental agreements to allocate TIF revenues for the capital projects of other taxing districts when those projects fit the purpose of the redevelopment plan. The City of Chicago allocated $1.7 billion in TIF revenues—or 47% of total TIF allocations—for public works projects between 1983 and 2010:
• $690 million was spent by the City on public infrastructure improvements including $73.7 million transferred to the Chicago Transit Authority for public transit projects;
• $813 million was used for Chicago Public Schools capital improvements, including the construction of 27 schools;64 and
• $233 million was allocated for parks, of which 40% was for Millennium Park.65
Such direct subsidy of capital projects through TIF can be especially beneficial for school districts because increases in their property tax extensions are partially offset by decreases in state funding.66 TIF revenue received through an intergovernmental agreement with the municipality does not currently count toward the school district’s local taxing effort measured by the General State Aid formula.
62 This is true only if one assumes that the government creating the TIF would not raise a different tax to fund economic development in the absence of the TIF. 63 See Appendix D Table 4. 64 See Appendix E for a list of school construction projects supported by TIF funding through July 2009. 65 Chicago TIF Reform Panel, “Findings and Recommendations for Reforming the Use of Tax Increment Financing in Chicago: Creating Greater Efficiency, Transparency and Accountability,” August 23, 2011. http://www.cityofchicago.org/content/dam/city/depts/mayor/Press%20Room/Press%20Releases/2011/August/8.29.11TIFReport.pdf (last visited on August 31, 2011).
36
66 For a fuller explanation of how the State of Illinois’ General State Aid formula for school districts dampens the effects of any property tax revenue increases, see the Civic Federation’s 2007 Tax Increment Financing Issue Brief, p. 18ff. at http://civicfed.org/sites/default/files/civicfed_260.pdf.
TAX BILLS This section describes how tax bills are computed and collected, as well has how the revenue is distributed to taxing districts.
Billing and Collection The amount owed by each property owner is equal to the composite tax rate for that tax code multiplied by the EAV of the property.67
Composite Tax Rate x Property EAV = Taxes Owed The Cook County Clerk prepares the files used by the Cook County Treasurer to record tax amounts, payments, and delinquencies. In Cook County, the annual tax liability is divided into two installments. The first installment is mailed by January 31 and payment is typically due on the first business day of March.68 The first installment of tax year 2009 was due on March 2, 2010,69 and was equal to 55% of the prior year’s total tax bill.70 The second installment due date varies considerably. The terms “first” and “second” installment are somewhat confusing because they refer to the time of year when the tax bill is received and not to the imposition of a new tax rate. The new tax rate is not calculated until the second installment. The second installment is the central event of the tax year because it is when the new property values, exemptions, and tax rates are implemented. As described in this primer, the calculation of the rate is complex and it depends on integrating data from a variety of sources in order to compute tax liabilities for 1.8 million real estate parcels. In recent years some common reasons for delayed second installment tax bills have been a high volume of assessment appeals and new or expanded homeowner exemptions, which have taken extra time to calculate. As described in the Civic Federation’s primer on the appeals process, taxpayers can appeal at the Cook County Assessor’s Office and at the Board of Review before taxes are extended, so a large number of appeals can delay the work of both offices.71 After final assessments are certified by the Board of Review, it also takes time for the State of Illinois Department of Revenue to calculate the equalization factor for Cook County, as described in the Civic Federation primer on the property assessment process.72
67 See the Civic Federation’s Cook County Property Assessment Process: A Primer on Assessment, Classification, Equalization, and Property Tax Exemptions for information on how taxable EAV is calculated, http://civicfed.org/sites/default/files/100405_CookCountyAssessmentPrimer.pdf. 68 35 ILCS 200/21-25 and 35 ILCS 200/21-30. Public Act 96-1297 moved this due date to April 1 in 2011 because the second installment of 2009 property taxes payable in 2010 was due later than usual, on December 13, 2010. 69 See the Cook County Treasurer’s web site for a list of tax due dates at http://www.cookcountytreasurer.com/taxdates.aspx?ntopicid=75. 70 Previously the first installment was equal to 50% of the prior year’s tax amount. Public Act 96-490, effective August 14, 2009, changed this to 55% and first took effect for the taxes due March 2, 2010. 71 See the Civic Federation’s Cook County Property Tax Appeals: A Primer on the Appeals Process with Comparative Data from 2000-2008 at http://www.civicfed.org/civic-federation/publications/cook-county-property-tax-appeals-primer-appeals-process-comparative-da.
37
72 Civic Federation, The Cook County Property Assessment Process: A Primer on Assessment, Classification, Equalization, and Property Tax Exemptions (Chicago: Civic Federation, April 5, 2010), available at http://civicfed.org/sites/default/files/100405_CookCountyAssessmentPrimer.pdf.
Tax bills are mailed by the Cook County Treasurer to the taxpayer of record.73 The Cook County Treasurer’s web site provides information about the status of tax payments for individual parcels.74
Delinquent Taxes and Tax Sales Property taxes are legally a first lien on a property, meaning that their payment takes priority over any other lien or encumbrance upon the sale of a property.75 If a property owner does not pay the tax liability in full as of the due date printed on the tax bill, an interest penalty of 1.5% per month will be added to the liability.76 State statute requires the Cook County Treasurer to hold an annual tax sale. A tax sale is an opportunity for individuals or institutions to purchase the tax liabilities of delinquent taxpayers. The buyer pays the outstanding taxes and in return receives a lien on the property. The buyer is entitled to up to 18% interest penalty every six months (or fraction thereof) on the tax liability in addition to the 1.5% baseline monthly interest penalty.77 The Treasurer awards the tax sale to the bidder offering the lowest interest penalty. If the property owner does not repay the taxes with interest to the tax buyer within the period of time prescribed by law, the owner may lose ownership of the property.78 In advance of the tax sale, the Treasurer sends delinquency notices and publishes a list of delinquent properties, an action which prompts some owners to resolve their outstanding tax liability. Delinquency notices for tax year 2008 were mailed by the Treasurer on August 2, 2010 and the 2008 tax sale was held from September 13 to September 22, 2010.79 Every two years the Cook County Treasurer is required to hold a scavenger sale at which taxes that have been delinquent for two or more years (and not sold at an annual tax sale) are offered for purchase. Scavenger sales are similar to annual tax sales except that the Treasurer awards the sale to the bidder offering the highest dollar payment for the sale above a minimum bid, although the winning bid is often less than the full tax liability, and the penalty interest amounts are set in statute.80 The first lien nature of tax liability combined with the annual tax sale make collection rates for property taxes consistently high, typically between 97%-99%. For example, the Cook County Treasurer reported that there were 62,300 parcels delinquent on $203.9 million before the tax 73 35 ILCS 200/20-5 and 10. A copy of the bill may be sent to the taxpayer’s mortgage lender upon request. 74 See http://www.cookcountytreasurer.com. 75 35 ILCS 200/21-75. 76 35 ILCS 200/21-25. The interest payment may be waived for specific reasons detailed in 35 ILCS 200/21-27. 77 The 1.5% monthly interest penalty is paid by the tax buyer at the time of the tax sale so it does not accrue past that date, but becomes part of the amount due to the tax buyer by an owner seeking to redeem his or her tax liability. 78 In some cases this time period may be as short as 6 months. See http://www.cookcountyclerk.com/tsd/taxredemption/Pages/default.aspx, http://www.cookcountytreasurer.com/taxdates.aspx?ntopicid=81, and http://www.revenue.state.il.us/Publications/LocalGovernment/PTAX1004.pdf for more on tax sales. 79 See schedule at http://www.cookcountytreasurer.com/taxdates.aspx?ntopicid=75.
38
80 35 ILCS 200/21-260.
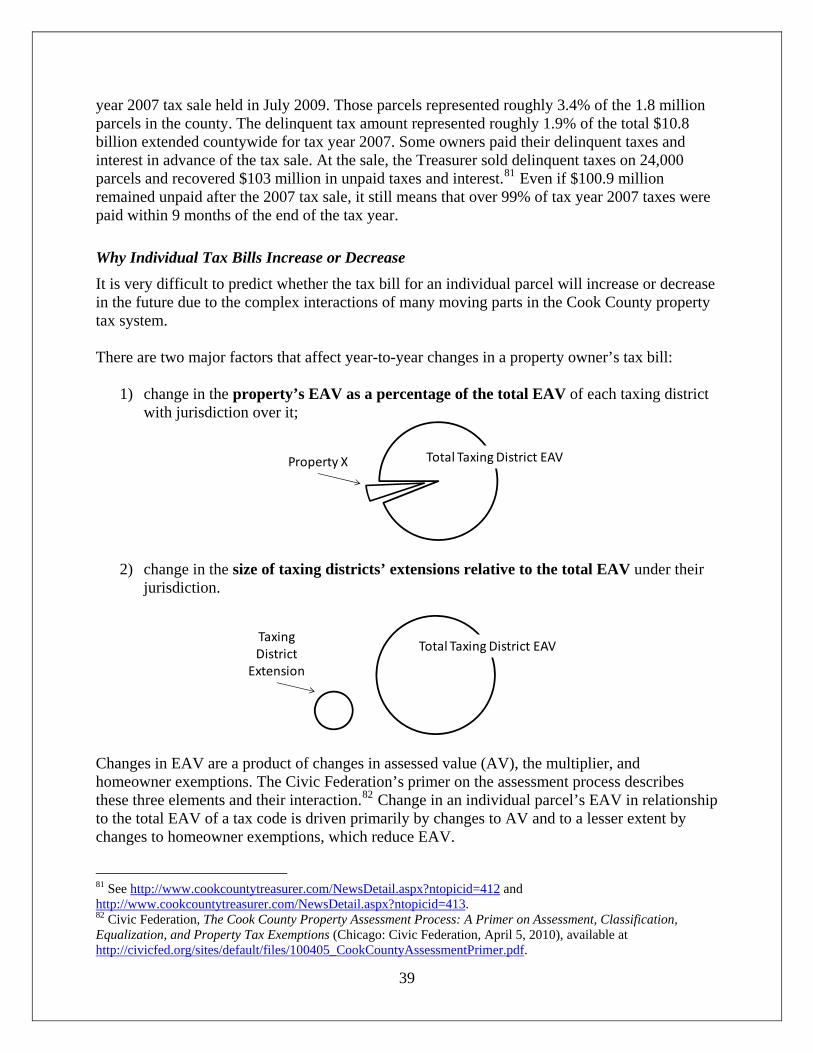
year 2007 tax sale held in July 2009. Those parcels represented roughly 3.4% of the 1.8 million parcels in the county. The delinquent tax amount represented roughly 1.9% of the total $10.8 billion extended countywide for tax year 2007. Some owners paid their delinquent taxes and interest in advance of the tax sale. At the sale, the Treasurer sold delinquent taxes on 24,000 parcels and recovered $103 million in unpaid taxes and interest.81 Even if $100.9 million remained unpaid after the 2007 tax sale, it still means that over 99% of tax year 2007 taxes were paid within 9 months of the end of the tax year.
Why Individual Tax Bills Increase or Decrease It is very difficult to predict whether the tax bill for an individual parcel will increase or decrease in the future due to the complex interactions of many moving parts in the Cook County property tax system. There are two major factors that affect year-to-year changes in a property owner’s tax bill:
1) change in the property’s EAV as a percentage of the total EAV of each taxing district with jurisdiction over it;
Property X Total Taxing District EAV
2) change in the size of taxing districts’ extensions relative to the total EAV under their jurisdiction.
Taxing District
Extension
Total Taxing District EAV
Changes in EAV are a product of changes in assessed value (AV), the multiplier, and homeowner exemptions. The Civic Federation’s primer on the assessment process describes these three elements and their interaction.82 Change in an individual parcel’s EAV in relationship to the total EAV of a tax code is driven primarily by changes to AV and to a lesser extent by changes to homeowner exemptions, which reduce EAV.
81 See http://www.cookcountytreasurer.com/NewsDetail.aspx?ntopicid=412 and http://www.cookcountytreasurer.com/NewsDetail.aspx?ntopicid=413.
39
82 Civic Federation, The Cook County Property Assessment Process: A Primer on Assessment, Classification, Equalization, and Property Tax Exemptions (Chicago: Civic Federation, April 5, 2010), available at http://civicfed.org/sites/default/files/100405_CookCountyAssessmentPrimer.pdf.
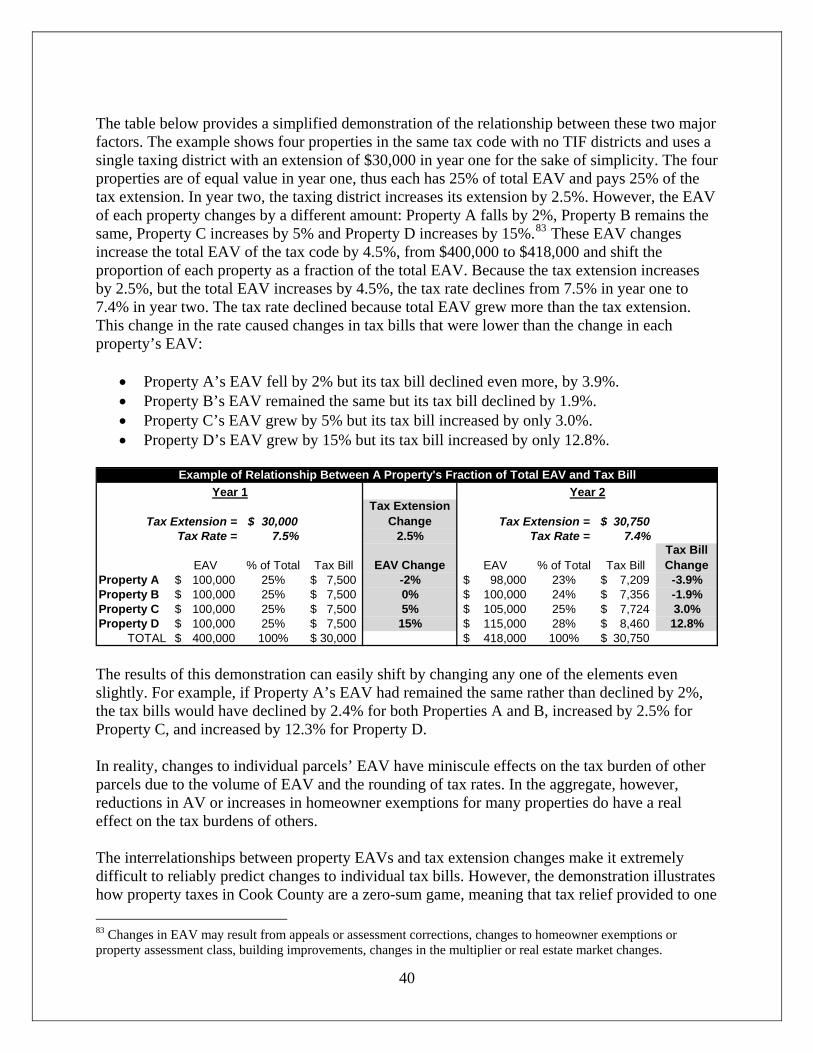
The table below provides a simplified demonstration of the relationship between these two major factors. The example shows four properties in the same tax code with no TIF districts and uses a single taxing district with an extension of $30,000 in year one for the sake of simplicity. The four properties are of equal value in year one, thus each has 25% of total EAV and pays 25% of the tax extension. In year two, the taxing district increases its extension by 2.5%. However, the EAV of each property changes by a different amount: Property A falls by 2%, Property B remains the same, Property C increases by 5% and Property D increases by 15%.83 These EAV changes increase the total EAV of the tax code by 4.5%, from $400,000 to $418,000 and shift the proportion of each property as a fraction of the total EAV. Because the tax extension increases by 2.5%, but the total EAV increases by 4.5%, the tax rate declines from 7.5% in year one to 7.4% in year two. The tax rate declined because total EAV grew more than the tax extension. This change in the rate caused changes in tax bills that were lower than the change in each property’s EAV:
• Property A’s EAV fell by 2% but its tax bill declined even more, by 3.9%. • Property B’s EAV remained the same but its tax bill declined by 1.9%. • Property C’s EAV grew by 5% but its tax bill increased by only 3.0%. • Property D’s EAV grew by 15% but its tax bill increased by only 12.8%.
Tax Extension = 30,000$ Tax Extension
Change Tax Extension = 30,750$ Tax Rate = 7.5% 2.5% Tax Rate = 7.4%
EAV % of Total Tax Bill EAV Change EAV % of Total Tax BillTax Bill Change
Property A 100,000$ 25% 7,500$ -2% 98,000$ 23% 7,209$ -3.9%Property B 100,000$ 25% 7,500$ 0% 100,000$ 24% 7,356$ -1.9%Property C 100,000$ 25% 7,500$ 5% 105,000$ 25% 7,724$ 3.0%Property D 100,000$ 25% 7,500$ 15% 115,000$ 28% 8,460$ 12.8%
TOTAL 400,000$ 100% 30,000$ 418,000$ 100% 30,750$
Example of Relationship Between A Property's Fraction of Total EAV and Tax BillYear 1 Year 2
The results of this demonstration can easily shift by changing any one of the elements even slightly. For example, if Property A’s EAV had remained the same rather than declined by 2%, the tax bills would have declined by 2.4% for both Properties A and B, increased by 2.5% for Property C, and increased by 12.3% for Property D. In reality, changes to individual parcels’ EAV have miniscule effects on the tax burden of other parcels due to the volume of EAV and the rounding of tax rates. In the aggregate, however, reductions in AV or increases in homeowner exemptions for many properties do have a real effect on the tax burdens of others. The interrelationships between property EAVs and tax extension changes make it extremely difficult to reliably predict changes to individual tax bills. However, the demonstration illustrates how property taxes in Cook County are a zero-sum game, meaning that tax relief provided to one
40
83 Changes in EAV may result from appeals or assessment corrections, changes to homeowner exemptions or property assessment class, building improvements, changes in the multiplier or real estate market changes.
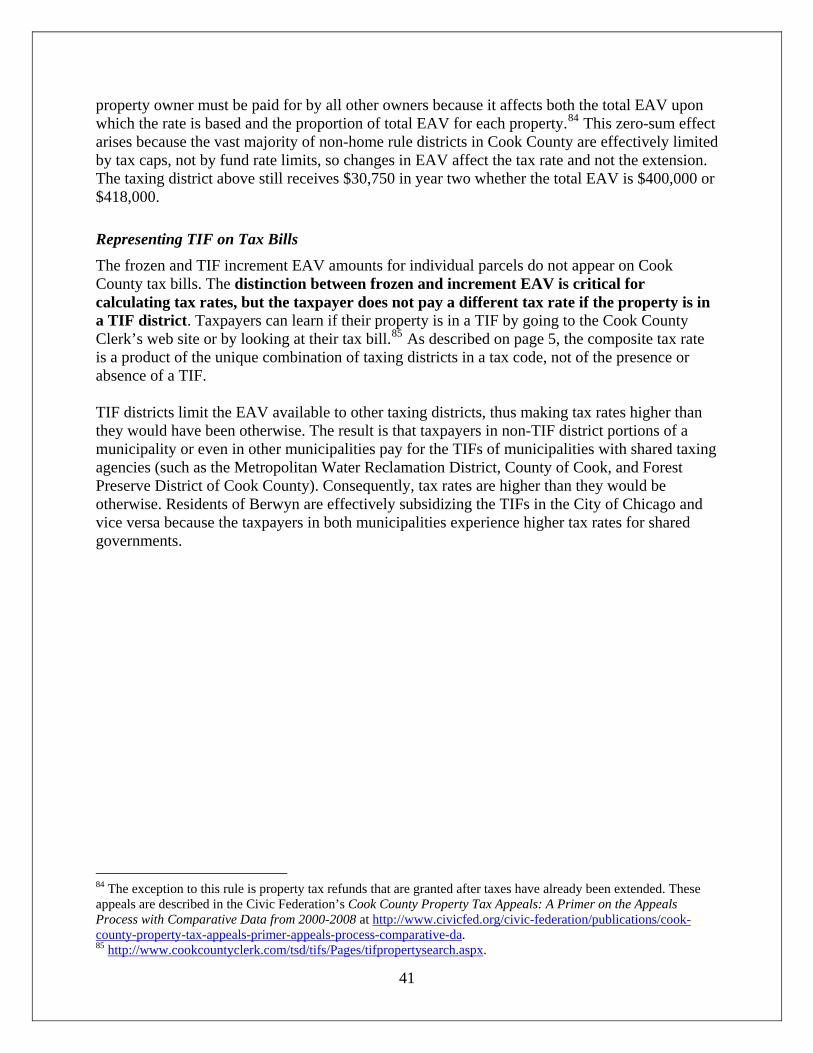
property owner must be paid for by all other owners because it affects both the total EAV upon which the rate is based and the proportion of total EAV for each property.84 This zero-sum effect arises because the vast majority of non-home rule districts in Cook County are effectively limited by tax caps, not by fund rate limits, so changes in EAV affect the tax rate and not the extension. The taxing district above still receives $30,750 in year two whether the total EAV is $400,000 or $418,000.
Representing TIF on Tax Bills The frozen and TIF increment EAV amounts for individual parcels do not appear on Cook County tax bills. The distinction between frozen and increment EAV is critical for calculating tax rates, but the taxpayer does not pay a different tax rate if the property is in a TIF district. Taxpayers can learn if their property is in a TIF by going to the Cook County Clerk’s web site or by looking at their tax bill.85 As described on page 5, the composite tax rate is a product of the unique combination of taxing districts in a tax code, not of the presence oabsence of a TIF.
r
TIF districts limit the EAV available to other taxing districts, thus making tax rates higher than they would have been otherwise. The result is that taxpayers in non-TIF district portions of a municipality or even in other municipalities pay for the TIFs of municipalities with shared taxing agencies (such as the Metropolitan Water Reclamation District, County of Cook, and Forest Preserve District of Cook County). Consequently, tax rates are higher than they would be otherwise. Residents of Berwyn are effectively subsidizing the TIFs in the City of Chicago and vice versa because the taxpayers in both municipalities experience higher tax rates for shared governments.
84 The exception to this rule is property tax refunds that are granted after taxes have already been extended. These appeals are described in the Civic Federation’s Cook County Property Tax Appeals: A Primer on the Appeals Process with Comparative Data from 2000-2008 at http://www.civicfed.org/civic-federation/publications/cook-county-property-tax-appeals-primer-appeals-process-comparative-da.
41
85 http://www.cookcountyclerk.com/tsd/tifs/Pages/tifpropertysearch.aspx.
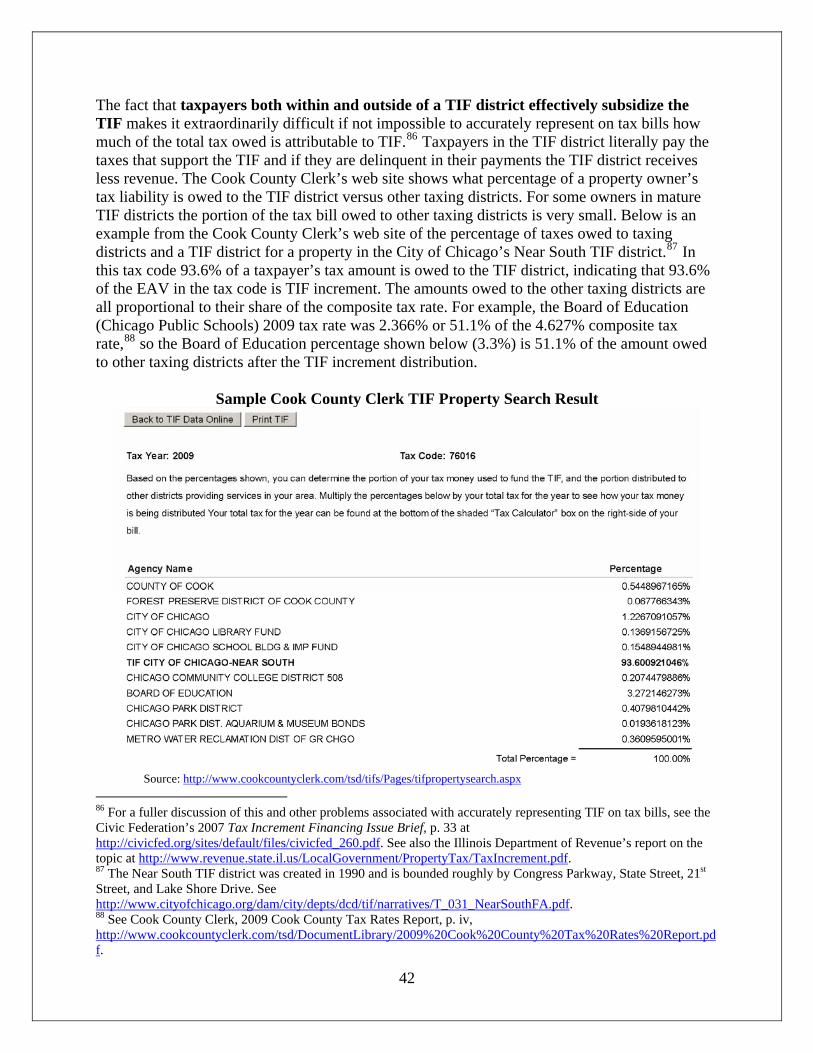
The fact that taxpayers both within and outside of a TIF district effectively subsidize the TIF makes it extraordinarily difficult if not impossible to accurately represent on tax bills how much of the total tax owed is attributable to TIF.86 Taxpayers in the TIF district literally pay the taxes that support the TIF and if they are delinquent in their payments the TIF district receives less revenue. The Cook County Clerk’s web site shows what percentage of a property owner’s tax liability is owed to the TIF district versus other taxing districts. For some owners in mature TIF districts the portion of the tax bill owed to other taxing districts is very small. Below is an example from the Cook County Clerk’s web site of the percentage of taxes owed to taxing districts and a TIF district for a property in the City of Chicago’s Near South TIF district.87 In this tax code 93.6% of a taxpayer’s tax amount is owed to the TIF district, indicating that 93.6% of the EAV in the tax code is TIF increment. The amounts owed to the other taxing districts are all proportional to their share of the composite tax rate. For example, the Board of Education (Chicago Public Schools) 2009 tax rate was 2.366% or 51.1% of the 4.627% composite tax rate,88 so the Board of Education percentage shown below (3.3%) is 51.1% of the amount owed to other taxing districts after the TIF increment distribution.
Sample Cook County Clerk TIF Property Search Result
Source: http://www.cookcountyclerk.com/tsd/tifs/Pages/tifpropertysearch.aspx
86 For a fuller discussion of this and other problems associated with accurately representing TIF on tax bills, see the Civic Federation’s 2007 Tax Increment Financing Issue Brief, p. 33 at http://civicfed.org/sites/default/files/civicfed_260.pdf. See also the Illinois Department of Revenue’s report on the topic at http://www.revenue.state.il.us/LocalGovernment/PropertyTax/TaxIncrement.pdf. 87 The Near South TIF district was created in 1990 and is bounded roughly by Congress Parkway, State Street, 21st Street, and Lake Shore Drive. See http://www.cityofchicago.org/dam/city/depts/dcd/tif/narratives/T_031_NearSouthFA.pdf.
42
88 See Cook County Clerk, 2009 Cook County Tax Rates Report, p. iv, http://www.cookcountyclerk.com/tsd/DocumentLibrary/2009%20Cook%20County%20Tax%20Rates%20Report.pdf.
The fact that 93.6% of the payments by taxpayers in the example shown above will go to the TIF district instead of to the school district, forest preserve, and other taxing districts means that taxpayers outside the TIF district must pay more to those other taxing districts to make up the difference.89 The current effect of TIF in Cook County is an increase in tax rates, not a reduction in taxes received by other taxing districts (see page 32 of this report), so taxpayers outside TIF districts pay more to the other districts in order for the TIF district properties to pay less. It would be difficult if not impossible to represent this amount on the tax bills of properties outside the TIF district.
Distribution to Taxing Districts It is the responsibility of the Cook County Clerk to inform the Treasurer of the total extension amount due to each taxing district as well as each district’s proportion of the total tax rate. The property tax revenue is distributed to the taxing districts according to their proportion of the total rate, after amounts due to TIF districts have been deducted.90 Tax revenues are remitted by the Treasurer to Cook County taxing districts year-round as they are received.91 A significant amount of time elapses between a taxing district’s budget decision regarding its property tax levy and the time when revenue from that decision is received. Those districts that voted on their tax year 2009 levy in the fall of 2009 and submitted it to the Clerk in December 2009 first received some tax revenue attributed to that levy in March 2010 when first installment 2009 taxes were due. The first installment amount owed by taxpayers was simply equal to 55% of the prior year’s tax liability.92 Any increases or decreases in the 2009 tax levy were reflected only in the second installment payments, which were due to the Treasurer on December 13, 2010, nearly twelve months after the 2009 levy was submitted to the Clerk.93 Some districts use short-term borrowing vehicles such as tax anticipation notes to bridge the gap between levy and receipt of taxes. Others have established sufficient reserves to accommodate the delay before taxes from a new levy are received.
89 As described on page 33 of this report, if you believe that new construction in the TIF would have happened even if the TIF had not been created, then PTELL-limited taxing districts that maximize their tax rates also make up some of this difference through a small loss in revenue they otherwise would have received. 90 35 ILCS 200/18-150. 91 Information provided by Bill Vaselopulos, Manager of Tax Extension and Accounting, Cook County Clerk’s Office , July 29, 2010. 92 Public Act 96-490 changed this amount to 55% from 50% of the prior year’s tax bill for tax year 2009 and thereafter. The rationale for this change was that it would mitigate taxpayers’ “sticker shock” resulting from tax increases that appear on second installment tax bills.
43
93 See the Treasurer’s Tax Bill Schedule at http://www.cookcountytreasurer.com/taxdates.aspx?ntopicid=75.
EFFECTIVE PROPERTY TAX RATES Effective property tax rates are a measure of property tax burden for homeowners and businesses. They translate the tax rates on property tax bills into rates that reflect the percentage of full market value that a property owed in taxes for a given year. An effective property tax rate is an estimate of the percentage of a property’s full market value paid in property taxes during a given tax year.94 Multiplying the market value of a home or business property by the applicable effective tax rate provides an estimate of the property taxes due on that property in the given year. For example, a property with a market value of $300,000 and an effective tax rate of 2% would have an estimated property tax liability of $6,000. Effective tax rates are useful because they provide a common denominator for comparing average property tax burdens in different jurisdictions over time. The Civic Federation publishes an annual estimate of effective tax rates for a sample of tax codes in northeastern Illinois.95 The lowest effective tax rate among the Cook County communities included in the 2008 report was the City of Chicago, with a residential effective rate of 1.31% before any homeowner exemptions. The highest was Harvey where industrial properties paid an estimated 11.70% of their full market value in property taxes. Differences in effective tax rates reflect variations in composite tax rates as well as levels of assessment. For example, Cook County commercial and industrial properties are assessed at higher levels than residential properties, so their estimated effective tax rates are higher than those of residences in the same community. Effective tax rates declined for nearly all Cook County communities analyzed between 1999 and 2008, especially for commercial and industrial properties (see Appendix G). Although estimated effective rates rose for all selected communities between 2007 and 2008, Chicago still has one of the lowest residential tax burdens in the region and very competitive commercial and industrial rates. Decline in effective tax rates over time is a product of declining composite tax rates, declining median levels of assessment, or both. For example, Chicago’s composite tax rate fell from 8.536% in 1999 to 4.816% in 2008. At the same time, the median level of assessment rose from 7.84% to 9.13% for residential but fell from 23.99% to 16.41% for commercial, and 22.59% to 11.25% for industrial properties.96
94 This is the standard definition of effective tax rate nationwide. Some Cook County property tax professionals may refer to the equalization factor × composite tax rate as the effective rate. 95 The Civic Federation, Effective Property Tax Rates 1999-2008: Selected Municipalities in Northeastern Illinois, August 23, 2010, http://www.civicfed.org/civic-federation/publications/effective-property-tax-rates-1999-2008-selected-municipalities-northea.
44
96 See the Illinois Department of Revenue’s Assessment Level Ratios, available at http://www.revenue.state.il.us/AboutIdor/TaxStats/index.htm.
SUMMARY The tax extension process is complex but can be separated into two primary operations conducted by the Cook County Clerk’s Office of Tax Extension: determining the tax base of a taxing district and applying any statutory limits to the district’s levy. The levy is the amount of money requested by a taxing district and the extension is the amount to which it is entitled once the tax base and legal limits have been determined. The EAV of a taxing district is equal to all the EAV (minus exemptions) within the district’s jurisdiction minus any TIF increment. In tax year 2009, 7.8% of total EAV in Cook County was TIF increment and thus excluded from the tax base of the taxing districts. There are no statutory limits on property tax levies for home rule units of government, although these units may self-impose limits through local ordinance and they must adhere to the Truth in Taxation law. Non-home rule taxing districts may be limited by fund rate limits, tax caps, or both, in addition to the Truth in Taxation law. Fund rate limits are maximum rates intended to limit the tax burden of certain governmental activities as a percent of taxable value. Non-home rule taxing districts in 39 Illinois counties are also subject to tax caps in addition to rate limits. Tax caps are intended to limit the total tax extension amount to increases in the Consumer Price Index, with exceptions for certain funds and extra revenue available from new properties (these exceptions are “outside” the tax cap). In Cook County, the vast majority of non-home rule taxing districts are now effectively limited by tax caps and not by rate limits because EAV has risen faster than inflation in most of the county over the last fifteen years, causing the fund rates to be well below their maximums. Significant growth in City of Chicago EAV has cut the composite tax rate by more than half between 1994 and 2009 for most properties in the city. The tax extensions for the eight major taxing districts in the City rose a combined 36.0% over that time period while CPI increased by 44.2%. TIF districts do not levy taxes and thus do not have tax extensions, only tax distributions. TIF revenue is the result of applying the tax rates of overlapping taxing districts to the TIF increment EAV. TIF distributions in the City of Chicago have risen from $2.0 million in tax year 1986 to $519.7 million in 2009. The same property tax rate is applied to all property in the TIF, whether it is frozen or increment EAV.
45
TIF does not freeze property tax revenue available to other taxing districts. It freezes the available EAV, the primary effect of which is to raise the tax rate in a county subject to tax caps. Home rule taxing districts cannot lose revenue to TIF because any limitations on their taxing authority are self-imposed and can be changed if they seek additional tax revenue. If one believes that 100% of the new construction in a TIF district would have occurred even if the TIF had not been created, then it is true that non home-rule taxing districts which sought to maximize their property tax revenues did lose some revenue during the life of the TIF. They lost the additional revenue they could have received from new property in the TIF. However, the fact that dissolved TIF increment makes the appreciation of existing property available outside the tax cap can produce substantial windfalls for non-home rule governments. Furthermore, those governments may benefit from direct TIF subsidy of their capital projects during the life of the TIF.
46
The Cook County Treasurer sends tax bills in two annual installments. The first installment is equal to 55% of the prior year’s tax liability and is typically due on the first business day of March. The second installment is when the new tax rates for that tax year are calculated and it is typically due in late fall, depending on when all of the processes required for tax extension are completed by various state and county agencies. Collection rates for property taxes are very high because property taxes constitute a first lien on real estate and delinquent taxes are sold to buyers at annual tax sales and biennial scavenger sales. It is very difficult to predict whether the tax bill for an individual parcel will increase or decrease in the future. The two major factors affecting annual changes in tax bills are changes in parcel EAV as a fraction of total EAV and change in the taxing districts’ extensions relative to EAV (as reflected in tax rates). The fate of an individual tax bill is dependent on changes in the value of other properties and on the tax rate such that an owner’s bill may increase even if the tax rate declines. The Cook County Treasurer distributes property tax revenues to taxing districts and TIF districts on a rolling basis as they are received, but there is typically a delay of nine to 12 months between the time when a taxing district submits its levy and the time when a tax increase or decrease created by that levy is reflected in tax distributions.
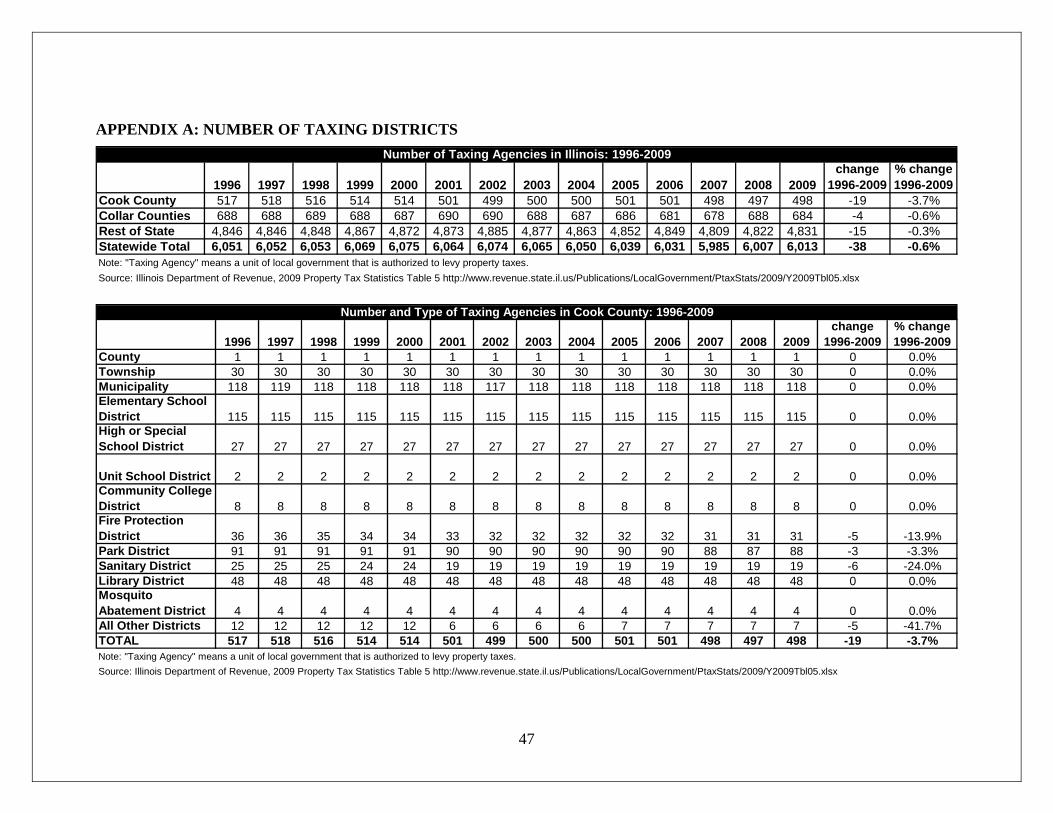
APPENDIX A: NUMBER OF TAXING DISTRICTS
1996 1997 1998 1999 2000 2001 2002 2003 2004 2005 2006 2007 2008 2009 1996-2009 1996-2009Cook County 517 518 516 514 514 501 499 500 500 501 501 498 497 498 -19 -3.7%Collar Counties 688 688 689 688 687 690 690 688 687 686 681 678 688 684 -4 -0.6%Rest of State 4,846 4,846 4,848 4,867 4,872 4,873 4,885 4,877 4,863 4,852 4,849 4,809 4,822 4,831 -15 -0.3%Statewide Total 6,051 6,052 6,053 6,069 6,075 6,064 6,074 6,065 6,050 6,039 6,031 5,985 6,007 6,013 -38 -0.6%Note: "Taxing Agency" means a unit of local government that is authorized to levy property taxes.Source: Illinois Department of Revenue, 2009 Property Tax Statistics Table 5 http://www.revenue.state.il.us/Publications/LocalGovernment/PtaxStats/2009/Y2009Tbl05.xlsx
change % change Number of Taxing Agencies in Illinois: 1996-2009
1996 1997 1998 1999 2000 2001 2002 2003 2004 2005 2006 2007 2008 2009 1996-2009 1996-2009County 1 1 1 1 1 1 1 1 1 1 1 1 1 1 0 0.0%Township 30 30 30 30 30 30 30 30 30 30 30 30 30 30 0 0.0%Municipality 118 119 118 118 118 118 117 118 118 118 118 118 118 118 0 0.0%Elementary School District 115 115 115 115 115 115 115 115 115 115 115 115 115 115 0 0.0%High or Special School District 27 27 27 27 27 27 27 27 27 27 27 27 27 27 0 0.0%
Unit School District 2 2 2 2 2 2 2 2 2 2 2 2 2 2 0 0.0%Community College District 8 8 8 8 8 8 8 8 8 8 8 8 8 8 0 0.0%Fire Protection District 36 36 35 34 34 33 32 32 32 32 32 31 31 31 -5 -13.9%Park District 91 91 91 91 91 90 90 90 90 90 90 88 87 88 -3 -3.3%Sanitary District 25 25 25 24 24 19 19 19 19 19 19 19 19 19 -6 -24.0%Library District 48 48 48 48 48 48 48 48 48 48 48 48 48 48 0 0.0%Mosquito Abatement District 4 4 4 4 4 4 4 4 4 4 4 4 4 4 0 0.0%All Other Districts 12 12 12 12 12 6 6 6 6 7 7 7 7 7 -5 -41.7%TOTAL 517 518 516 514 514 501 499 500 500 501 501 498 497 498 -19 -3.7%Note: "Taxing Agency" means a unit of local government that is authorized to levy property taxes.Source: Illinois Department of Revenue, 2009 Property Tax Statistics Table 5 http://www.revenue.state.il.us/Publications/LocalGovernment/PtaxStats/2009/Y2009Tbl05.xlsx
47
change % change Number and Type of Taxing Agencies in Cook County: 1996-2009
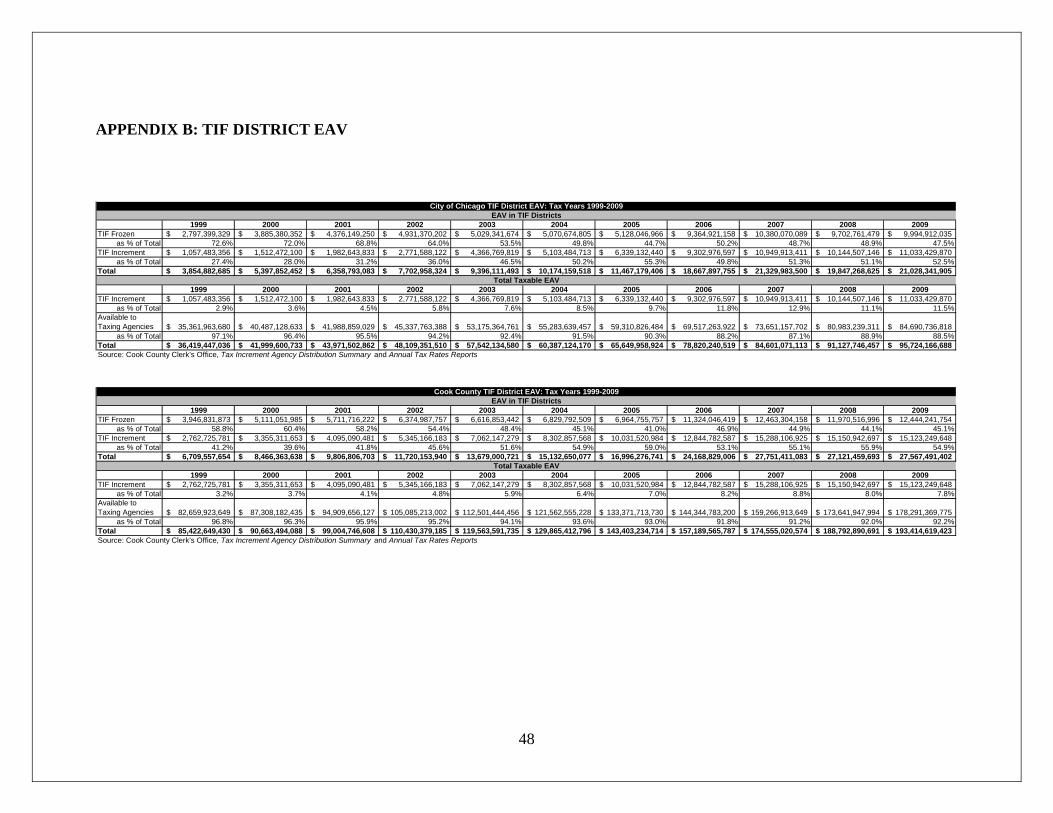
APPENDIX B: TIF DISTRICT EAV
1999 2000 2001 2002 2003 2004 2005 2006 2007 2008 2009TIF Frozen 2,797,399,329$ 3,885,380,352$ 4,376,149,250$ 4,931,370,202$ 5,029,341,674$ 5,070,674,805$ 5,128,046,966$ 9,364,921,158$ 10,380,070,089$ 9,702,761,479$ 9,994,912,035$
as % of Total 72.6% 72.0% 68.8% 64.0% 53.5% 49.8% 44.7% 50.2% 48.7% 48.9% 47.5%TIF Increment 1,057,483,356$ 1,512,472,100$ 1,982,643,833$ 2,771,588,122$ 4,366,769,819$ 5,103,484,713$ 6,339,132,440$ 9,302,976,597$ 10,949,913,411$ 10,144,507,146$ 11,033,429,870$
as % of Total 27.4% 28.0% 31.2% 36.0% 46.5% 50.2% 55.3% 49.8% 51.3% 51.1% 52.5%Total 3,854,882,685$ 5,397,852,452$ 6,358,793,083$ 7,702,958,324$ 9,396,111,493$ 10,174,159,518$ 11,467,179,406$ 18,667,897,755$ 21,329,983,500$ 19,847,268,625$ 21,028,341,905$
1999 2000 2001 2002 2003 2004 2005 2006 2007 2008 2009TIF Increment 1,057,483,356$ 1,512,472,100$ 1,982,643,833$ 2,771,588,122$ 4,366,769,819$ 5,103,484,713$ 6,339,132,440$ 9,302,976,597$ 10,949,913,411$ 10,144,507,146$ 11,033,429,870$
as % of Total 2.9% 3.6% 4.5% 5.8% 7.6% 8.5% 9.7% 11.8% 12.9% 11.1% 11.5%Available to Taxing Agencies 35,361,963,680$ 40,487,128,633$ 41,988,859,029$ 45,337,763,388$ 53,175,364,761$ 55,283,639,457$ 59,310,826,484$ 69,517,263,922$ 73,651,157,702$ 80,983,239,311$ 84,690,736,818$
as % of Total 97.1% 96.4% 95.5% 94.2% 92.4% 91.5% 90.3% 88.2% 87.1% 88.9% 88.5%Total 36,419,447,036$ 41,999,600,733$ 43,971,502,862$ 48,109,351,510$ 57,542,134,580$ 60,387,124,170$ 65,649,958,924$ 78,820,240,519$ 84,601,071,113$ 91,127,746,457$ 95,724,166,688$
1999 2000 2001 2002 2003 2004 2005 2006 2007 2008 2009TIF Frozen 3,946,831,873$ 5,111,051,985$ 5,711,716,222$ 6,374,987,757$ 6,616,853,442$ 6,829,792,509$ 6,964,755,757$ 11,324,046,419$ 12,463,304,158$ 11,970,516,996$ 12,444,241,754$
as % of Total 58.8% 60.4% 58.2% 54.4% 48.4% 45.1% 41.0% 46.9% 44.9% 44.1% 45.1%TIF Increment 2,762,725,781$ 3,355,311,653$ 4,095,090,481$ 5,345,166,183$ 7,062,147,279$ 8,302,857,568$ 10,031,520,984$ 12,844,782,587$ 15,288,106,925$ 15,150,942,697$ 15,123,249,648$
as % of Total 41.2% 39.6% 41.8% 45.6% 51.6% 54.9% 59.0% 53.1% 55.1% 55.9% 54.9%Total 6,709,557,654$ 8,466,363,638$ 9,806,806,703$ 11,720,153,940$ 13,679,000,721$ 15,132,650,077$ 16,996,276,741$ 24,168,829,006$ 27,751,411,083$ 27,121,459,693$ 27,567,491,402$
1999 2000 2001 2002 2003 2004 2005 2006 2007 2008 2009TIF Increment 2,762,725,781$ 3,355,311,653$ 4,095,090,481$ 5,345,166,183$ 7,062,147,279$ 8,302,857,568$ 10,031,520,984$ 12,844,782,587$ 15,288,106,925$ 15,150,942,697$ 15,123,249,648$
as % of Total 3.2% 3.7% 4.1% 4.8% 5.9% 6.4% 7.0% 8.2% 8.8% 8.0% 7.8%Available to Taxing Agencies 82,659,923,649$ 87,308,182,435$ 94,909,656,127$ 105,085,213,002$ 112,501,444,456$ 121,562,555,228$ 133,371,713,730$ 144,344,783,200$ 159,266,913,649$ 173,641,947,994$ 178,291,369,775$
as % of Total 96.8% 96.3% 95.9% 95.2% 94.1% 93.6% 93.0% 91.8% 91.2% 92.0% 92.2%Total 85,422,649,430$ 90,663,494,088$ 99,004,746,608$ 110,430,379,185$ 119,563,591,735$ 129,865,412,796$ 143,403,234,714$ 157,189,565,787$ 174,555,020,574$ 188,792,890,691$ 193,414,619,423$ Source: Cook County Clerk's Office, Tax Increment Agency Distribution Summary and Annual Tax Rates Reports
Source: Cook County Clerk's Office, Tax Increment Agency Distribution Summary and Annual Tax Rates Reports
City of Chicago TIF District EAV: Tax Years 1999-2009EAV in TIF Districts
Total Taxable EAV
Cook County TIF District EAV: Tax Years 1999-2009EAV in TIF Districts
Total Taxable EAV
48
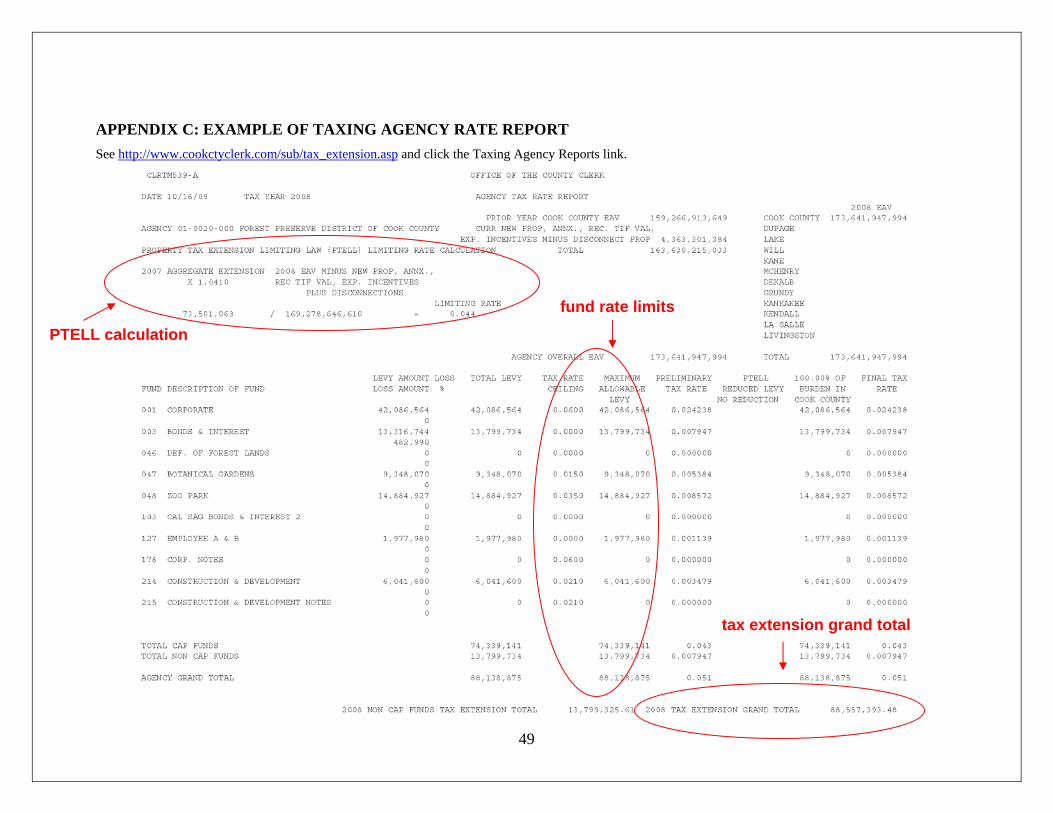
APPENDIX C: EXAMPLE OF TAXING AGENCY RATE REPORT See http://www.cookctyclerk.com/sub/tax_extension.asp and click the Taxing Agency Reports link.
49
PTELL calculation
fund rate limits
tax extension grand total
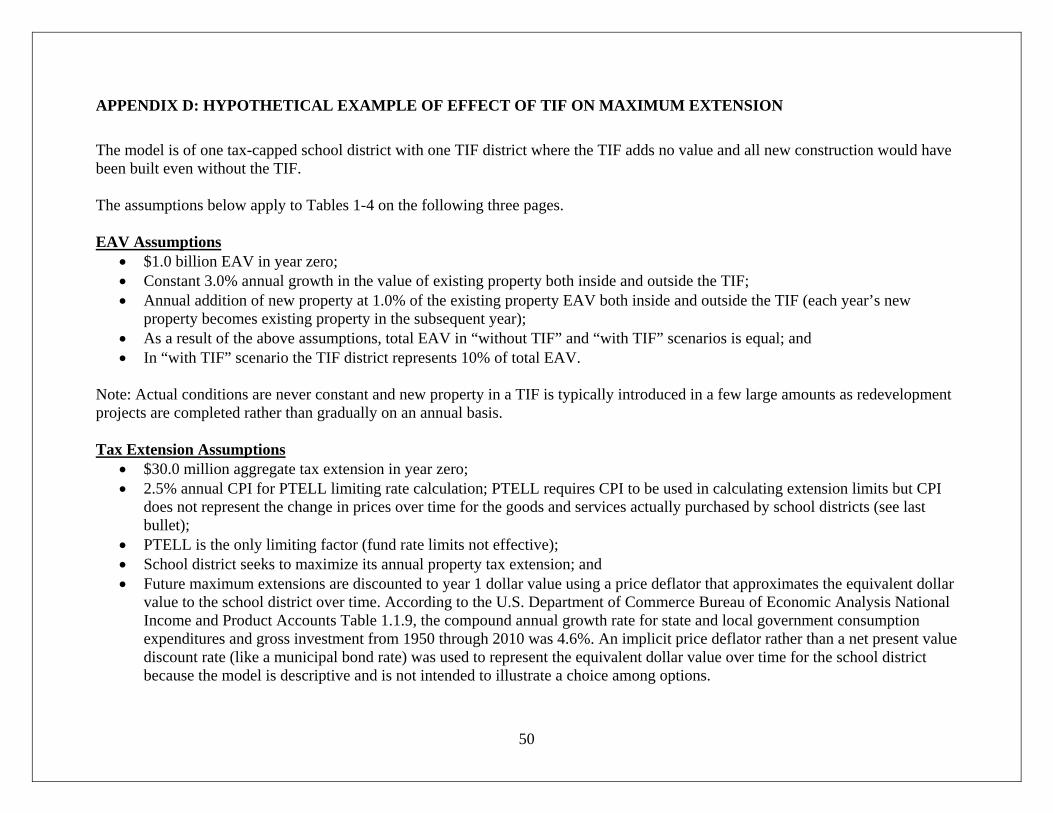
APPENDIX D: HYPOTHETICAL EXAMPLE OF EFFECT OF TIF ON MAXIMUM EXTENSION The model is of one tax-capped school district with one TIF district where the TIF adds no value and all new construction would have been built even without the TIF. The assumptions below apply to Tables 1-4 on the following three pages. EAV Assumptions
• $1.0 billion EAV in year zero; • Constant 3.0% annual growth in the value of existing property both inside and outside the TIF; • Annual addition of new property at 1.0% of the existing property EAV both inside and outside the TIF (each year’s new
property becomes existing property in the subsequent year); • As a result of the above assumptions, total EAV in “without TIF” and “with TIF” scenarios is equal; and • In “with TIF” scenario the TIF district represents 10% of total EAV.
Note: Actual conditions are never constant and new property in a TIF is typically introduced in a few large amounts as redevelopment projects are completed rather than gradually on an annual basis. Tax Extension Assumptions
• $30.0 million aggregate tax extension in year zero; • 2.5% annual CPI for PTELL limiting rate calculation; PTELL requires CPI to be used in calculating extension limits but CPI
does not represent the change in prices over time for the goods and services actually purchased by school districts (see last bullet);
• PTELL is the only limiting factor (fund rate limits not effective); • School district seeks to maximize its annual property tax extension; and
50
• Future maximum extensions are discounted to year 1 dollar value using a price deflator that approximates the equivalent dollar value to the school district over time. According to the U.S. Department of Commerce Bureau of Economic Analysis National Income and Product Accounts Table 1.1.9, the compound annual growth rate for state and local government consumption expenditures and gross investment from 1950 through 2010 was 4.6%. An implicit price deflator rather than a net present value discount rate (like a municipal bond rate) was used to represent the equivalent dollar value over time for the school district because the model is descriptive and is not intended to illustrate a choice among options.
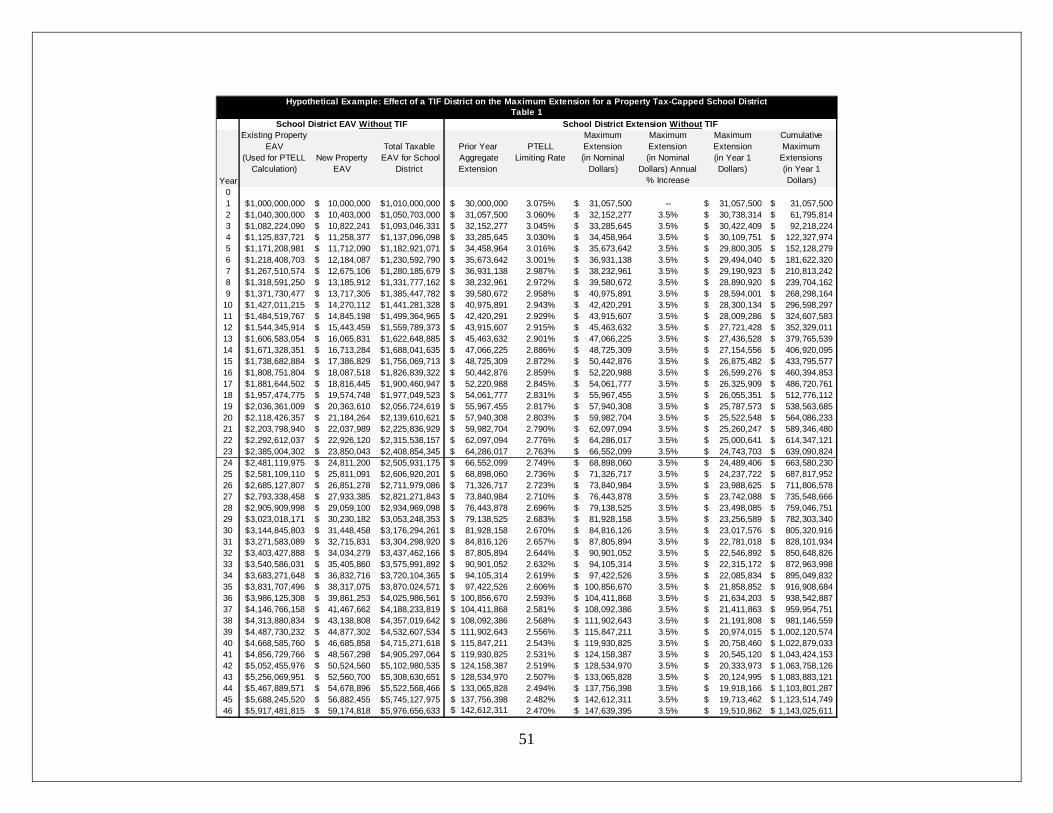
51
Existing Property EAV Total Taxable Prior Year PTELL
Maximum Extension
Maximum Extension
Maximum Extension
Cumulative Maximum
Year
(Used for PTELL Calculation)
New Property EAV
EAV for School District
Aggregate Extension
Limiting Rate (in Nominal Dollars)
(in Nominal Dollars) Annual
% Increase
(in Year 1 Dollars)
Extensions (in Year 1 Dollars)
01 1,000,000,000$ 10,000,000$ 1,010,000,000$ $ 30,000,000 3.075% 31,057,500$ -- 31,057,500$ 31,057,500$ 2 1,040,300,000$ 10,403,000$ 1,050,703,000$ $ 31,057,500 3.060% 32,152,277$ 3.5% 30,738,314$ 61,795,814$ 3 1,082,224,090$ 10,822,241$ 1,093,046,331$ $ 32,152,277 3.045% 33,285,645$ 3.5% 30,422,409$ 92,218,224$ 4 1,125,837,721$ 11,258,377$ 1,137,096,098$ $ 33,285,645 3.030% 34,458,964$ 3.5% 30,109,751$ 122,327,974$ 5 1,171,208,981$ 11,712,090$ 1,182,921,071$ $ 34,458,964 3.016% 35,673,642$ 3.5% 29,800,305$ 152,128,279$ 6 1,218,408,703$ 12,184,087$ 1,230,592,790$ $ 35,673,642 3.001% 36,931,138$ 3.5% 29,494,040$ 181,622,320$ 7 1,267,510,574$ 12,675,106$ 1,280,185,679$ $ 36,931,138 2.987% 38,232,961$ 3.5% 29,190,923$ 210,813,242$ 8 1,318,591,250$ 13,185,912$ 1,331,777,162$ $ 38,232,961 2.972% 39,580,672$ 3.5% 28,890,920$ 239,704,162$ 9 1,371,730,477$ 13,717,305$ 1,385,447,782$ $ 39,580,672 2.958% 40,975,891$ 3.5% 28,594,001$ 268,298,164$
10 1,427,011,215$ 14,270,112$ 1,441,281,328$ $ 40,975,891 2.943% 42,420,291$ 3.5% 28,300,134$ 296,598,297$ 11 1,484,519,767$ 14,845,198$ 1,499,364,965$ $ 42,420,291 2.929% 43,915,607$ 3.5% 28,009,286$ 324,607,583$ 12 1,544,345,914$ 15,443,459$ 1,559,789,373$ $ 43,915,607 2.915% 45,463,632$ 3.5% 27,721,428$ 352,329,011$ 13 1,606,583,054$ 16,065,831$ 1,622,648,885$ $ 45,463,632 2.901% 47,066,225$ 3.5% 27,436,528$ 379,765,539$ 14 1,671,328,351$ 16,713,284$ 1,688,041,635$ $ 47,066,225 2.886% 48,725,309$ 3.5% 27,154,556$ 406,920,095$ 15 1,738,682,884$ 17,386,829$ 1,756,069,713$ $ 48,725,309 2.872% 50,442,876$ 3.5% 26,875,482$ 433,795,577$ 16 1,808,751,804$ 18,087,518$ 1,826,839,322$ $ 50,442,876 2.859% 52,220,988$ 3.5% 26,599,276$ 460,394,853$ 17 1,881,644,502$ 18,816,445$ 1,900,460,947$ $ 52,220,988 2.845% 54,061,777$ 3.5% 26,325,909$ 486,720,761$ 18 1,957,474,775$ 19,574,748$ 1,977,049,523$ $ 54,061,777 2.831% 55,967,455$ 3.5% 26,055,351$ 512,776,112$ 19 2,036,361,009$ 20,363,610$ 2,056,724,619$ $ 55,967,455 2.817% 57,940,308$ 3.5% 25,787,573$ 538,563,685$ 20 2,118,426,357$ 21,184,264$ 2,139,610,621$ $ 57,940,308 2.803% 59,982,704$ 3.5% 25,522,548$ 564,086,233$ 21 2,203,798,940$ 22,037,989$ 2,225,836,929$ $ 59,982,704 2.790% 62,097,094$ 3.5% 25,260,247$ 589,346,480$ 22 2,292,612,037$ 22,926,120$ 2,315,538,157$ $ 62,097,094 2.776% 64,286,017$ 3.5% 25,000,641$ 614,347,121$ 23 2,385,004,302$ 23,850,043$ 2,408,854,345$ $ 64,286,017 2.763% 66,552,099$ 3.5% 24,743,703$ 639,090,824$ 24 2,481,119,975$ 24,811,200$ 2,505,931,175$ $ 66,552,099 2.749% 68,898,060$ 3.5% 24,489,406$ 663,580,230$ 25 2,581,109,110$ 25,811,091$ 2,606,920,201$ $ 68,898,060 2.736% 71,326,717$ 3.5% 24,237,722$ 687,817,952$ 26 2,685,127,807$ 26,851,278$ 2,711,979,086$ $ 71,326,717 2.723% 73,840,984$ 3.5% 23,988,625$ 711,806,578$ 27 2,793,338,458$ 27,933,385$ 2,821,271,843$ $ 73,840,984 2.710% 76,443,878$ 3.5% 23,742,088$ 735,548,666$ 28 2,905,909,998$ 29,059,100$ 2,934,969,098$ $ 76,443,878 2.696% 79,138,525$ 3.5% 23,498,085$ 759,046,751$ 29 3,023,018,171$ 30,230,182$ 3,053,248,353$ $ 79,138,525 2.683% 81,928,158$ 3.5% 23,256,589$ 782,303,340$ 30 3,144,845,803$ 31,448,458$ 3,176,294,261$ $ 81,928,158 2.670% 84,816,126$ 3.5% 23,017,576$ 805,320,916$ 31 3,271,583,089$ 32,715,831$ 3,304,298,920$ $ 84,816,126 2.657% 87,805,894$ 3.5% 22,781,018$ 828,101,934$ 32 3,403,427,888$ 34,034,279$ 3,437,462,166$ $ 87,805,894 2.644% 90,901,052$ 3.5% 22,546,892$ 850,648,826$ 33 3,540,586,031$ 35,405,860$ 3,575,991,892$ $ 90,901,052 2.632% 94,105,314$ 3.5% 22,315,172$ 872,963,998$ 34 3,683,271,648$ 36,832,716$ 3,720,104,365$ $ 94,105,314 2.619% 97,422,526$ 3.5% 22,085,834$ 895,049,832$ 35 3,831,707,496$ 38,317,075$ 3,870,024,571$ $ 97,422,526 2.606% 100,856,670$ 3.5% 21,858,852$ 916,908,684$ 36 3,986,125,308$ 39,861,253$ 4,025,986,561$ $ 100,856,670 2.593% 104,411,868$ 3.5% 21,634,203$ 938,542,887$ 37 4,146,766,158$ 41,467,662$ 4,188,233,819$ $ 104,411,868 2.581% 108,092,386$ 3.5% 21,411,863$ 959,954,751$ 38 4,313,880,834$ 43,138,808$ 4,357,019,642$ $ 108,092,386 2.568% 111,902,643$ 3.5% 21,191,808$ 981,146,559$ 39 4,487,730,232$ 44,877,302$ 4,532,607,534$ $ 111,902,643 2.556% 115,847,211$ 3.5% 20,974,015$ 1,002,120,574$ 40 4,668,585,760$ 46,685,858$ 4,715,271,618$ $ 115,847,211 2.543% 119,930,825$ 3.5% 20,758,460$ 1,022,879,033$ 41 4,856,729,766$ 48,567,298$ 4,905,297,064$ $ 119,930,825 2.531% 124,158,387$ 3.5% 20,545,120$ 1,043,424,153$ 42 5,052,455,976$ 50,524,560$ 5,102,980,535$ $ 124,158,387 2.519% 128,534,970$ 3.5% 20,333,973$ 1,063,758,126$ 43 5,256,069,951$ 52,560,700$ 5,308,630,651$ $ 128,534,970 2.507% 133,065,828$ 3.5% 20,124,995$ 1,083,883,121$ 44 5,467,889,571$ 54,678,896$ 5,522,568,466$ $ 133,065,828 2.494% 137,756,398$ 3.5% 19,918,166$ 1,103,801,287$ 45 5,688,245,520$ 56,882,455$ 5,745,127,975$ $ 137,756,398 2.482% 142,612,311$ 3.5% 19,713,462$ 1,123,514,749$ 46 5,917,481,815$ 59,174,818$ 5,976,656,633$ $ 142,612,311 2.470% 147,639,395$ 3.5% 19,510,862$ 1,143,025,611$
Hypothetical Example: Effect of a TIF District on the Maximum Extension for a Property Tax-Capped School DistrictTable 1
School District EAV Without TIF School District Extension Without TIF
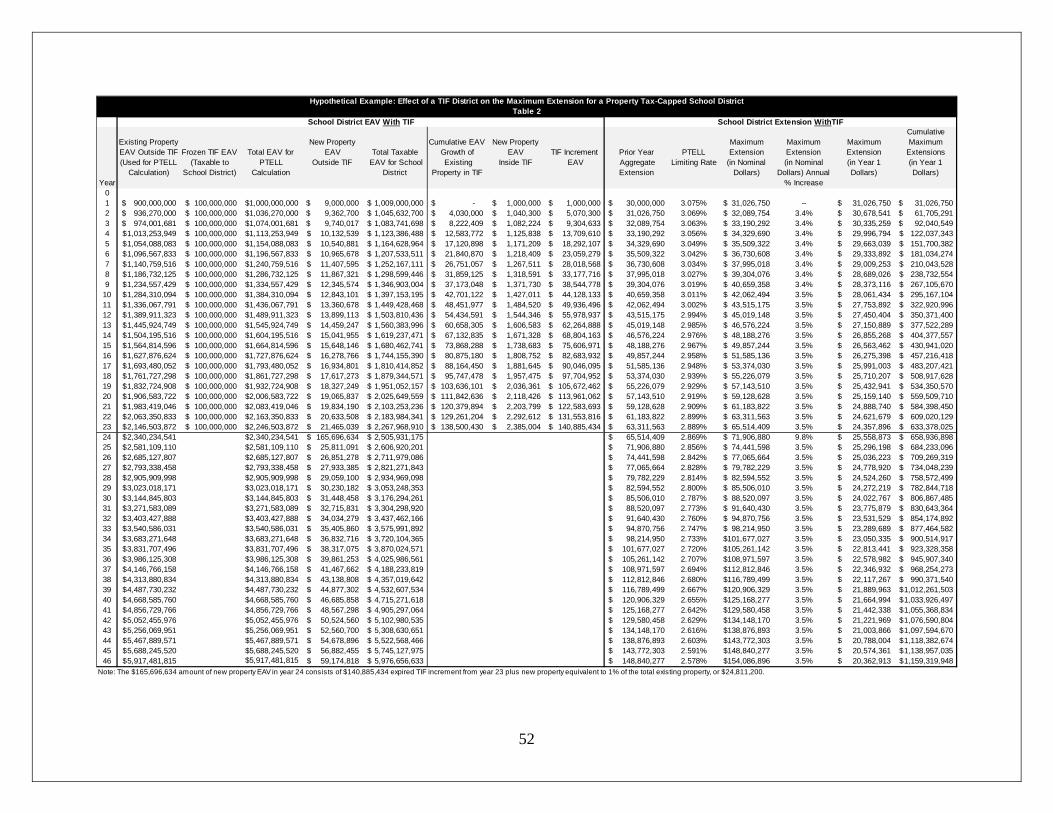
52
Existing Property EAV Outside TIF Frozen TIF EAV Total EAV for
New Property EAV Total Taxable
Cumulative EAV Growth of
New Property EAV TIF Increment Prior Year PTELL
Maximum Extension
Maximum Extension
Maximum Extension
Cumulative Maximum
Extensions
Year
(Used for PTELL Calculation)
(Taxable to School District)
PTELL Calculation
Outside TIF EAV for School District
Existing Property in TIF
Inside TIF EAV Aggregate Extension
Limiting Rate (in Nominal Dollars)
(in Nominal Dollars) Annual
% Increase
(in Year 1 Dollars)
(in Year 1 Dollars)
01 900,000,000$ $ 100,000,000 $1,000,000,000 9,000,000$ 1,009,000,000$ -$ 1,000,000$ 1,000,000$ 30,000,000$ 3.075% 31,026,750$ -- 31,026,750$ 31,026,750$ 2 936,270,000$ $ 100,000,000 $1,036,270,000 9,362,700$ 1,045,632,700$ 4,030,000$ 1,040,300$ 5,070,300$ 31,026,750$ 3.069% 32,089,754$ 3.4% 30,678,541$ 61,705,291$ 3 974,001,681$ $ 100,000,000 $1,074,001,681 9,740,017$ 1,083,741,698$ 8,222,409$ 1,082,224$ 9,304,633$ 32,089,754$ 3.063% 33,190,292$ 3.4% 30,335,259$ 92,040,549$ 4 1,013,253,949$ $ 100,000,000 $1,113,253,949 10,132,539$ 1,123,386,488$ 12,583,772$ 1,125,838$ 13,709,610$ 33,190,292$ 3.056% 34,329,690$ 3.4% 29,996,794$ 122,037,343$ 5 1,054,088,083$ $ 100,000,000 $1,154,088,083 10,540,881$ 1,164,628,964$ 17,120,898$ 1,171,209$ 18,292,107$ 34,329,690$ 3.049% 35,509,322$ 3.4% 29,663,039$ 151,700,382$ 6 1,096,567,833$ $ 100,000,000 $1,196,567,833 10,965,678$ 1,207,533,511$ 21,840,870$ 1,218,409$ 23,059,279$ 35,509,322$ 3.042% 36,730,608$ 3.4% 29,333,892$ 181,034,274$ 7 1,140,759,516$ $ 100,000,000 $1,240,759,516 11,407,595$ 1,252,167,111$ 26,751,057$ 1,267,511$ 28,018,568$ 36,730,608$ 3.034% 37,995,018$ 3.4% 29,009,253$ 210,043,528$ 8 1,186,732,125$ $ 100,000,000 $1,286,732,125 11,867,321$ 1,298,599,446$ 31,859,125$ 1,318,591$ 33,177,716$ 37,995,018$ 3.027% 39,304,076$ 3.4% 28,689,026$ 238,732,554$ 9 1,234,557,429$ $ 100,000,000 $1,334,557,429 12,345,574$ 1,346,903,004$ 37,173,048$ 1,371,730$ 38,544,778$ 39,304,076$ 3.019% 40,659,358$ 3.4% 28,373,116$ 267,105,670$
10 1,284,310,094$ $ 100,000,000 $1,384,310,094 12,843,101$ 1,397,153,195$ 42,701,122$ 1,427,011$ 44,128,133$ 40,659,358$ 3.011% 42,062,494$ 3.5% 28,061,434$ 295,167,104$ 11 1,336,067,791$ $ 100,000,000 $1,436,067,791 13,360,678$ 1,449,428,468$ 48,451,977$ 1,484,520$ 49,936,496$ 42,062,494$ 3.002% 43,515,175$ 3.5% 27,753,892$ 322,920,996$ 12 1,389,911,323$ $ 100,000,000 $1,489,911,323 13,899,113$ 1,503,810,436$ 54,434,591$ 1,544,346$ 55,978,937$ 43,515,175$ 2.994% 45,019,148$ 3.5% 27,450,404$ 350,371,400$ 13 1,445,924,749$ $ 100,000,000 $1,545,924,749 14,459,247$ 1,560,383,996$ 60,658,305$ 1,606,583$ 62,264,888$ 45,019,148$ 2.985% 46,576,224$ 3.5% 27,150,889$ 377,522,289$ 14 1,504,195,516$ $ 100,000,000 $1,604,195,516 15,041,955$ 1,619,237,471$ 67,132,835$ 1,671,328$ 68,804,163$ 46,576,224$ 2.976% 48,188,276$ 3.5% 26,855,268$ 404,377,557$ 15 1,564,814,596$ $ 100,000,000 $1,664,814,596 15,648,146$ 1,680,462,741$ 73,868,288$ 1,738,683$ 75,606,971$ 48,188,276$ 2.967% 49,857,244$ 3.5% 26,563,462$ 430,941,020$ 16 1,627,876,624$ $ 100,000,000 $1,727,876,624 16,278,766$ 1,744,155,390$ 80,875,180$ 1,808,752$ 82,683,932$ 49,857,244$ 2.958% 51,585,136$ 3.5% 26,275,398$ 457,216,418$ 17 1,693,480,052$ $ 100,000,000 $1,793,480,052 16,934,801$ 1,810,414,852$ 88,164,450$ 1,881,645$ 90,046,095$ 51,585,136$ 2.948% 53,374,030$ 3.5% 25,991,003$ 483,207,421$ 18 1,761,727,298$ $ 100,000,000 $1,861,727,298 17,617,273$ 1,879,344,571$ 95,747,478$ 1,957,475$ 97,704,952$ 53,374,030$ 2.939% 55,226,079$ 3.5% 25,710,207$ 508,917,628$ 19 1,832,724,908$ $ 100,000,000 $1,932,724,908 18,327,249$ 1,951,052,157$ 103,636,101$ 2,036,361$ 105,672,462$ 55,226,079$ 2.929% 57,143,510$ 3.5% 25,432,941$ 534,350,570$ 20 1,906,583,722$ $ 100,000,000 $2,006,583,722 19,065,837$ 2,025,649,559$ 111,842,636$ 2,118,426$ 113,961,062$ 57,143,510$ 2.919% 59,128,628$ 3.5% 25,159,140$ 559,509,710$ 21 1,983,419,046$ $ 100,000,000 $2,083,419,046 19,834,190$ 2,103,253,236$ 120,379,894$ 2,203,799$ 122,583,693$ 59,128,628$ 2.909% 61,183,822$ 3.5% 24,888,740$ 584,398,450$ 22 2,063,350,833$ $ 100,000,000 $2,163,350,833 20,633,508$ 2,183,984,341$ 129,261,204$ 2,292,612$ 131,553,816$ 61,183,822$ 2.899% 63,311,563$ 3.5% 24,621,679$ 609,020,129$ 23 2,146,503,872$ $ 100,000,000 $2,246,503,872 21,465,039$ 2,267,968,910$ 138,500,430$ 2,385,004$ 140,885,434$ 63,311,563$ 2.889% 65,514,409$ 3.5% 24,357,896$ 633,378,025$ 24 2,340,234,541$ $2,340,234,541 165,696,634$ 2,505,931,175$ 65,514,409$ 2.869% 71,906,880$ 9.8% 25,558,873$ 658,936,898$ 25 2,581,109,110$ $2,581,109,110 25,811,091$ 2,606,920,201$ 71,906,880$ 2.856% 74,441,598$ 3.5% 25,296,198$ 684,233,096$ 26 2,685,127,807$ $2,685,127,807 26,851,278$ 2,711,979,086$ 74,441,598$ 2.842% 77,065,664$ 3.5% 25,036,223$ 709,269,319$ 27 2,793,338,458$ $2,793,338,458 27,933,385$ 2,821,271,843$ 77,065,664$ 2.828% 79,782,229$ 3.5% 24,778,920$ 734,048,239$ 28 2,905,909,998$ $2,905,909,998 29,059,100$ 2,934,969,098$ 79,782,229$ 2.814% 82,594,552$ 3.5% 24,524,260$ 758,572,499$ 29 3,023,018,171$ $3,023,018,171 30,230,182$ 3,053,248,353$ 82,594,552$ 2.800% 85,506,010$ 3.5% 24,272,219$ 782,844,718$ 30 3,144,845,803$ $3,144,845,803 31,448,458$ 3,176,294,261$ 85,506,010$ 2.787% 88,520,097$ 3.5% 24,022,767$ 806,867,485$ 31 3,271,583,089$ $3,271,583,089 32,715,831$ 3,304,298,920$ 88,520,097$ 2.773% 91,640,430$ 3.5% 23,775,879$ 830,643,364$ 32 3,403,427,888$ $3,403,427,888 34,034,279$ 3,437,462,166$ 91,640,430$ 2.760% 94,870,756$ 3.5% 23,531,529$ 854,174,892$ 33 3,540,586,031$ $3,540,586,031 35,405,860$ 3,575,991,892$ 94,870,756$ 2.747% 98,214,950$ 3.5% 23,289,689$ 877,464,582$ 34 3,683,271,648$ $3,683,271,648 36,832,716$ 3,720,104,365$ 98,214,950$ 2.733% 101,677,027$ 3.5% 23,050,335$ 900,514,917$ 35 3,831,707,496$ $3,831,707,496 38,317,075$ 3,870,024,571$ 101,677,027$ 2.720% 105,261,142$ 3.5% 22,813,441$ 923,328,358$ 36 3,986,125,308$ $3,986,125,308 39,861,253$ 4,025,986,561$ 105,261,142$ 2.707% 108,971,597$ 3.5% 22,578,982$ 945,907,340$ 37 4,146,766,158$ $4,146,766,158 41,467,662$ 4,188,233,819$ 108,971,597$ 2.694% 112,812,846$ 3.5% 22,346,932$ 968,254,273$ 38 4,313,880,834$ $4,313,880,834 43,138,808$ 4,357,019,642$ 112,812,846$ 2.680% 116,789,499$ 3.5% 22,117,267$ 990,371,540$ 39 4,487,730,232$ $4,487,730,232 44,877,302$ 4,532,607,534$ 116,789,499$ 2.667% 120,906,329$ 3.5% 21,889,963$ 1,012,261,503$ 40 4,668,585,760$ $4,668,585,760 46,685,858$ 4,715,271,618$ 120,906,329$ 2.655% 125,168,277$ 3.5% 21,664,994$ 1,033,926,497$ 41 4,856,729,766$ $4,856,729,766 48,567,298$ 4,905,297,064$ 125,168,277$ 2.642% 129,580,458$ 3.5% 21,442,338$ 1,055,368,834$ 42 5,052,455,976$ $5,052,455,976 50,524,560$ 5,102,980,535$ 129,580,458$ 2.629% 134,148,170$ 3.5% 21,221,969$ 1,076,590,804$ 43 5,256,069,951$ $5,256,069,951 52,560,700$ 5,308,630,651$ 134,148,170$ 2.616% 138,876,893$ 3.5% 21,003,866$ 1,097,594,670$ 44 5,467,889,571$ $5,467,889,571 54,678,896$ 5,522,568,466$ 138,876,893$ 2.603% 143,772,303$ 3.5% 20,788,004$ 1,118,382,674$ 45 5,688,245,520$ $5,688,245,520 56,882,455$ 5,745,127,975$ 143,772,303$ 2.591% 148,840,277$ 3.5% 20,574,361$ 1,138,957,035$ 46 5,917,481,815$ $5,917,481,815 59,174,818$ 5,976,656,633$ 148,840,277$ 2.578% 154,086,896$ 3.5% 20,362,913$ 1,159,319,948$
Hypothetical Example: Effect of a TIF District on the Maximum Extension for a Property Tax-Capped School DistrictTable 2
Note: The $165,696,634 amount of new property EAV in year 24 consists of $140,885,434 expired TIF increment from year 23 plus new property equivalent to 1% of the total existing property, or $24,811,200.
School District EAV With TIF School District Extension WithTIF
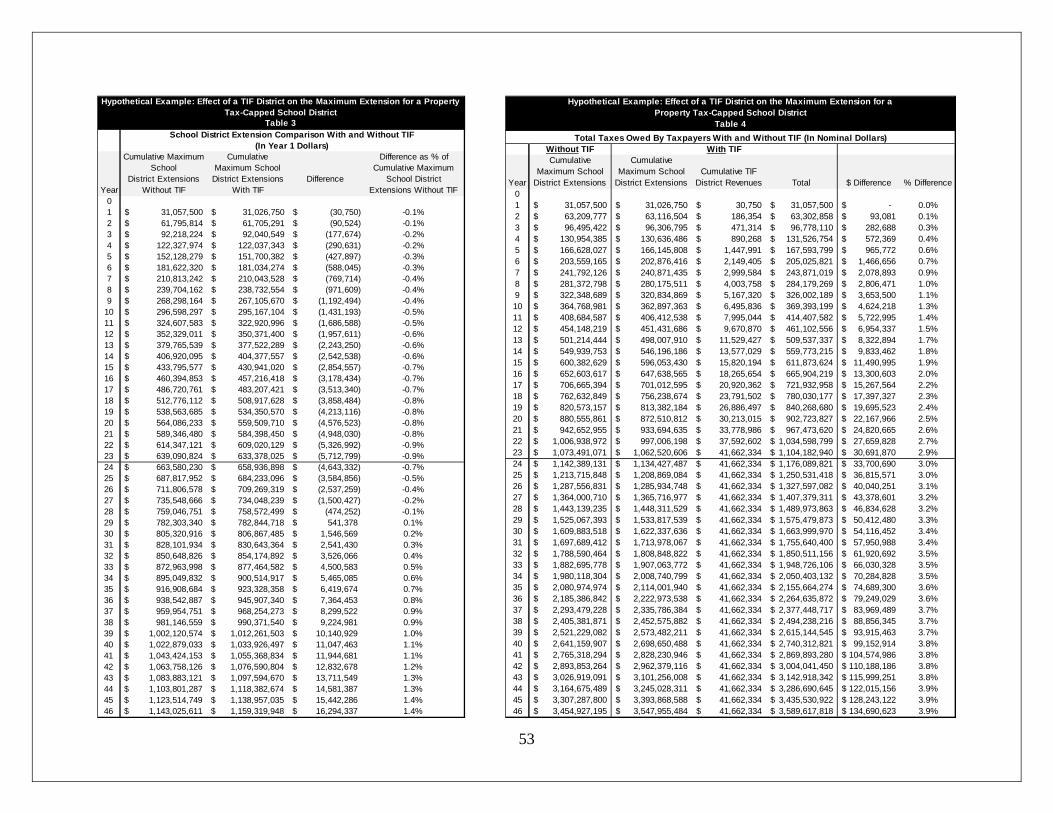
53
Cumulative Maximum School
Cumulative Maximum School
Difference as % of Cumulative Maximum
YearDistrict Extensions
Without TIF District Extensions
With TIF Difference School District
Extensions Without TIF01 31,057,500$ 31,026,750$ (30,750)$ -0.1%2 61,795,814$ 61,705,291$ (90,524)$ -0.1%3 92,218,224$ 92,040,549$ (177,674)$ -0.2%4 122,327,974$ 122,037,343$ (290,631)$ -0.2%5 152,128,279$ 151,700,382$ (427,897)$ -0.3%6 181,622,320$ 181,034,274$ (588,045)$ -0.3%7 210,813,242$ 210,043,528$ (769,714)$ -0.4%8 239,704,162$ 238,732,554$ (971,609)$ -0.4%9 268,298,164$ 267,105,670$ (1,192,494)$ -0.4%
10 296,598,297$ 295,167,104$ (1,431,193)$ -0.5%11 324,607,583$ 322,920,996$ (1,686,588)$ -0.5%12 352,329,011$ 350,371,400$ (1,957,611)$ -0.6%13 379,765,539$ 377,522,289$ (2,243,250)$ -0.6%14 406,920,095$ 404,377,557$ (2,542,538)$ -0.6%15 433,795,577$ 430,941,020$ (2,854,557)$ -0.7%16 460,394,853$ 457,216,418$ (3,178,434)$ -0.7%17 486,720,761$ 483,207,421$ (3,513,340)$ -0.7%18 512,776,112$ 508,917,628$ (3,858,484)$ -0.8%19 538,563,685$ 534,350,570$ (4,213,116)$ -0.8%20 564,086,233$ 559,509,710$ (4,576,523)$ -0.8%21 589,346,480$ 584,398,450$ (4,948,030)$ -0.8%22 614,347,121$ 609,020,129$ (5,326,992)$ -0.9%23 639,090,824$ 633,378,025$ (5,712,799)$ -0.9%24 663,580,230$ 658,936,898$ (4,643,332)$ -0.7%25 687,817,952$ 684,233,096$ (3,584,856)$ -0.5%26 711,806,578$ 709,269,319$ (2,537,259)$ -0.4%27 735,548,666$ 734,048,239$ (1,500,427)$ -0.2%28 759,046,751$ 758,572,499$ (474,252)$ -0.1%29 782,303,340$ 782,844,718$ 541,378$ 0.1%30 805,320,916$ 806,867,485$ 1,546,569$ 0.2%31 828,101,934$ 830,643,364$ 2,541,430$ 0.3%32 850,648,826$ 854,174,892$ 3,526,066$ 0.4%33 872,963,998$ 877,464,582$ 4,500,583$ 0.5%34 895,049,832$ 900,514,917$ 5,465,085$ 0.6%35 916,908,684$ 923,328,358$ 6,419,674$ 0.7%36 938,542,887$ 945,907,340$ 7,364,453$ 0.8%37 959,954,751$ 968,254,273$ 8,299,522$ 0.9%38 981,146,559$ 990,371,540$ 9,224,981$ 0.9%39 1,002,120,574$ 1,012,261,503$ 10,140,929$ 1.0%40 1,022,879,033$ 1,033,926,497$ 11,047,463$ 1.1%41 1,043,424,153$ 1,055,368,834$ 11,944,681$ 1.1%42 1,063,758,126$ 1,076,590,804$ 12,832,678$ 1.2%43 1,083,883,121$ 1,097,594,670$ 13,711,549$ 1.3%44 1,103,801,287$ 1,118,382,674$ 14,581,387$ 1.3%45 1,123,514,749$ 1,138,957,035$ 15,442,286$ 1.4%46 1,143,025,611$ 1,159,319,948$ 16,294,337$ 1.4%
(In Year 1 Dollars)
Hypothetical Example: Effect of a TIF District on the Maximum Extension for a Property Tax-Capped School District
Table 3School District Extension Comparison With and Without TIF
Without TIF
Year
Cumulative Maximum School
District Extensions
Cumulative Maximum School
District ExtensionsCumulative TIF
District Revenues Total $ Difference % Difference01 31,057,500$ 31,026,750$ 30,750$ 31,057,500$ -$ 0.0%2 63,209,777$ 63,116,504$ 186,354$ 63,302,858$ 93,081$ 0.1%3 96,495,422$ 96,306,795$ 471,314$ 96,778,110$ 282,688$ 0.3%4 130,954,385$ 130,636,486$ 890,268$ 131,526,754$ 572,369$ 0.4%5 166,628,027$ 166,145,808$ 1,447,991$ 167,593,799$ 965,772$ 0.6%6 203,559,165$ 202,876,416$ 2,149,405$ 205,025,821$ 1,466,656$ 0.7%7 241,792,126$ 240,871,435$ 2,999,584$ 243,871,019$ 2,078,893$ 0.9%8 281,372,798$ 280,175,511$ 4,003,758$ 284,179,269$ 2,806,471$ 1.0%9 322,348,689$ 320,834,869$ 5,167,320$ 326,002,189$ 3,653,500$ 1.1%10 364,768,981$ 362,897,363$ 6,495,836$ 369,393,199$ 4,624,218$ 1.3%11 408,684,587$ 406,412,538$ 7,995,044$ 414,407,582$ 5,722,995$ 1.4%12 454,148,219$ 451,431,686$ 9,670,870$ 461,102,556$ 6,954,337$ 1.5%13 501,214,444$ 498,007,910$ 11,529,427$ 509,537,337$ 8,322,894$ 1.7%14 549,939,753$ 546,196,186$ 13,577,029$ 559,773,215$ 9,833,462$ 1.8%15 600,382,629$ 596,053,430$ 15,820,194$ 611,873,624$ 11,490,995$ 1.9%16 652,603,617$ 647,638,565$ 18,265,654$ 665,904,219$ 13,300,603$ 2.0%17 706,665,394$ 701,012,595$ 20,920,362$ 721,932,958$ 15,267,564$ 2.2%18 762,632,849$ 756,238,674$ 23,791,502$ 780,030,177$ 17,397,327$ 2.3%19 820,573,157$ 813,382,184$ 26,886,497$ 840,268,680$ 19,695,523$ 2.4%20 880,555,861$ 872,510,812$ 30,213,015$ 902,723,827$ 22,167,966$ 2.5%21 942,652,955$ 933,694,635$ 33,778,986$ 967,473,620$ 24,820,665$ 2.6%22 1,006,938,972$ 997,006,198$ 37,592,602$ 1,034,598,799$ 27,659,828$ 2.7%23 1,073,491,071$ 1,062,520,606$ 41,662,334$ 1,104,182,940$ 30,691,870$ 2.9%24 1,142,389,131$ 1,134,427,487$ 41,662,334$ 1,176,089,821$ 33,700,690$ 3.0%25 1,213,715,848$ 1,208,869,084$ 41,662,334$ 1,250,531,418$ 36,815,571$ 3.0%26 1,287,556,831$ 1,285,934,748$ 41,662,334$ 1,327,597,082$ 40,040,251$ 3.1%27 1,364,000,710$ 1,365,716,977$ 41,662,334$ 1,407,379,311$ 43,378,601$ 3.2%28 1,443,139,235$ 1,448,311,529$ 41,662,334$ 1,489,973,863$ 46,834,628$ 3.2%29 1,525,067,393$ 1,533,817,539$ 41,662,334$ 1,575,479,873$ 50,412,480$ 3.3%30 1,609,883,518$ 1,622,337,636$ 41,662,334$ 1,663,999,970$ 54,116,452$ 3.4%31 1,697,689,412$ 1,713,978,067$ 41,662,334$ 1,755,640,400$ 57,950,988$ 3.4%32 1,788,590,464$ 1,808,848,822$ 41,662,334$ 1,850,511,156$ 61,920,692$ 3.5%33 1,882,695,778$ 1,907,063,772$ 41,662,334$ 1,948,726,106$ 66,030,328$ 3.5%34 1,980,118,304$ 2,008,740,799$ 41,662,334$ 2,050,403,132$ 70,284,828$ 3.5%35 2,080,974,974$ 2,114,001,940$ 41,662,334$ 2,155,664,274$ 74,689,300$ 3.6%36 2,185,386,842$ 2,222,973,538$ 41,662,334$ 2,264,635,872$ 79,249,029$ 3.6%37 2,293,479,228$ 2,335,786,384$ 41,662,334$ 2,377,448,717$ 83,969,489$ 3.7%38 2,405,381,871$ 2,452,575,882$ 41,662,334$ 2,494,238,216$ 88,856,345$ 3.7%39 2,521,229,082$ 2,573,482,211$ 41,662,334$ 2,615,144,545$ 93,915,463$ 3.7%40 2,641,159,907$ 2,698,650,488$ 41,662,334$ 2,740,312,821$ 99,152,914$ 3.8%41 2,765,318,294$ 2,828,230,946$ 41,662,334$ 2,869,893,280$ 104,574,986$ 3.8%42 2,893,853,264$ 2,962,379,116$ 41,662,334$ 3,004,041,450$ 110,188,186$ 3.8%43 3,026,919,091$ 3,101,256,008$ 41,662,334$ 3,142,918,342$ 115,999,251$ 3.8%44 3,164,675,489$ 3,245,028,311$ 41,662,334$ 3,286,690,645$ 122,015,156$ 3.9%45 3,307,287,800$ 3,393,868,588$ 41,662,334$ 3,435,530,922$ 128,243,122$ 3.9%46 3,454,927,195$ 3,547,955,484$ 41,662,334$ 3,589,617,818$ 134,690,623$ 3.9%
Total Taxes Owed By Taxpayers With and Without TIF (In Nominal Dollars)With TIF
Property Tax-Capped School DistrictHypothetical Example: Effect of a TIF District on the Maximum Extension for a
Table 4

54
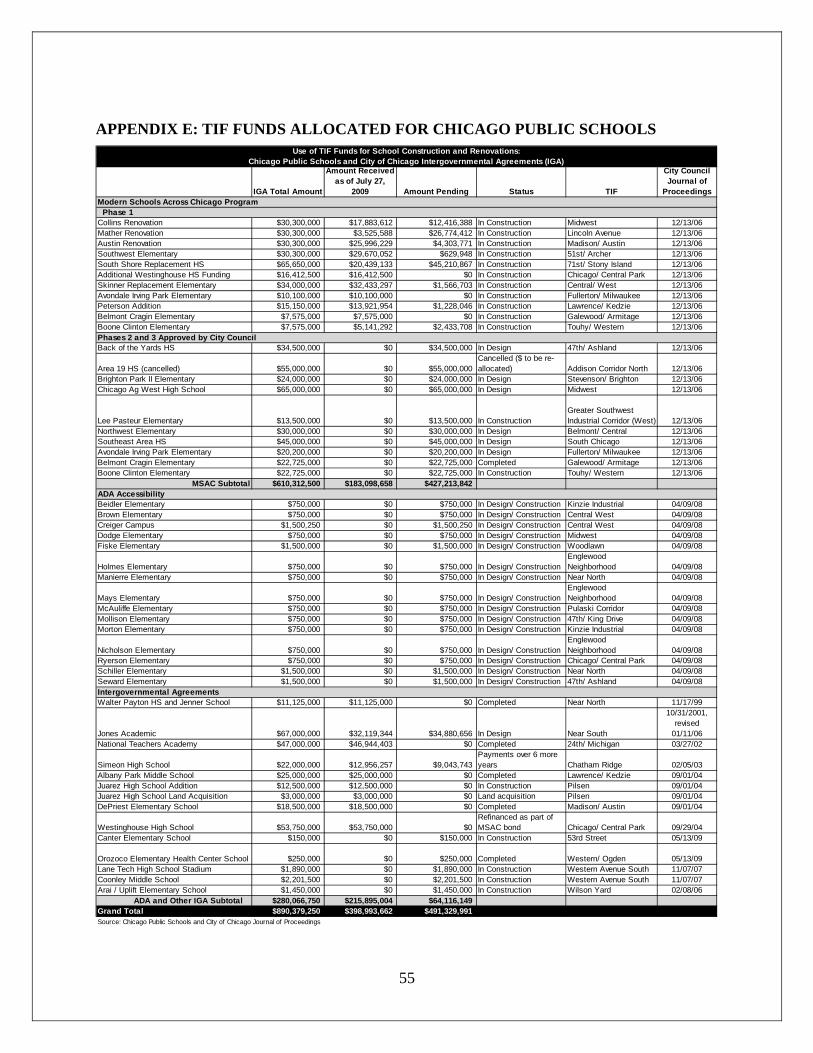
APPENDIX E: TIF FUNDS ALLOCATED FOR CHICAGO PUBLIC SCHOOLS
IGA Total Amountas of July 27,
2009 Amount Pending Status TIFJournal of
Proceedings
Collins Renovation $30,300,000 $17,883,612 $12,416,388 In Construction Midwest 12/13/06Mather Renovation $30,300,000 $3,525,588 $26,774,412 In Construction Lincoln Avenue 12/13/06Austin Renovation $30,300,000 $25,996,229 $4,303,771 In Construction Madison/ Austin 12/13/06Southwest Elementary $30,300,000 $29,670,052 $629,948 In Construction 51st/ Archer 12/13/06South Shore Replacement HS $65,650,000 $20,439,133 $45,210,867 In Construction 71st/ Stony Island 12/13/06Additional Westinghouse HS Funding $16,412,500 $16,412,500 $0 In Construction Chicago/ Central Park 12/13/06Skinner Replacement Elementary $34,000,000 $32,433,297 $1,566,703 In Construction Central/ West 12/13/06Avondale Irving Park Elementary $10,100,000 $10,100,000 $0 In Construction Fullerton/ Milwaukee 12/13/06Peterson Addition $15,150,000 $13,921,954 $1,228,046 In Construction Lawrence/ Kedzie 12/13/06Belmont Cragin Elementary $7,575,000 $7,575,000 $0 In Construction Galewood/ Armitage 12/13/06Boone Clinton Elementary $7,575,000 $5,141,292 $2,433,708 In Construction Touhy/ Western 12/13/06
Back of the Yards HS $34,500,000 $0 $34,500,000 In Design 47th/ Ashland 12/13/06
Area 19 HS (cancelled) $55,000,000 $0 $55,000,000Cancelled ($ to be re-allocated) Addison Corridor North 12/13/06
Brighton Park II Elementary $24,000,000 $0 $24,000,000 In Design Stevenson/ Brighton 12/13/06Chicago Ag West High School $65,000,000 $0 $65,000,000 In Design Midwest 12/13/06
Lee Pasteur Elementary $13,500,000 $0 $13,500,000 In ConstructionGreater Southwest Industrial Corridor (West) 12/13/06
Northwest Elementary $30,000,000 $0 $30,000,000 In Design Belmont/ Central 12/13/06Southeast Area HS $45,000,000 $0 $45,000,000 In Design South Chicago 12/13/06Avondale Irving Park Elementary $20,200,000 $0 $20,200,000 In Design Fullerton/ Milwaukee 12/13/06Belmont Cragin Elementary $22,725,000 $0 $22,725,000 Completed Galewood/ Armitage 12/13/06Boone Clinton Elementary $22,725,000 $0 $22,725,000 In Construction Touhy/ Western 12/13/06
MSAC Subtotal $610,312,500 $183,098,658 $427,213,842
Beidler Elementary $750,000 $0 $750,000 In Design/ Construction Kinzie Industrial 04/09/08Brown Elementary $750,000 $0 $750,000 In Design/ Construction Central West 04/09/08Creiger Campus $1,500,250 $0 $1,500,250 In Design/ Construction Central West 04/09/08Dodge Elementary $750,000 $0 $750,000 In Design/ Construction Midwest 04/09/08Fiske Elementary $1,500,000 $0 $1,500,000 In Design/ Construction Woodlawn 04/09/08
Holmes Elementary $750,000 $0 $750,000 In Design/ ConstructionEnglewood Neighborhood 04/09/08
Manierre Elementary $750,000 $0 $750,000 In Design/ Construction Near North 04/09/08
Mays Elementary $750,000 $0 $750,000 In Design/ ConstructionEnglewood Neighborhood 04/09/08
McAuliffe Elementary $750,000 $0 $750,000 In Design/ Construction Pulaski Corridor 04/09/08Mollison Elementary $750,000 $0 $750,000 In Design/ Construction 47th/ King Drive 04/09/08Morton Elementary $750,000 $0 $750,000 In Design/ Construction Kinzie Industrial 04/09/08
Nicholson Elementary $750,000 $0 $750,000 In Design/ ConstructionEnglewood Neighborhood 04/09/08
Ryerson Elementary $750,000 $0 $750,000 In Design/ Construction Chicago/ Central Park 04/09/08Schiller Elementary $1,500,000 $0 $1,500,000 In Design/ Construction Near North 04/09/08Seward Elementary $1,500,000 $0 $1,500,000 In Design/ Construction 47th/ Ashland 04/09/08
Walter Payton HS and Jenner School $11,125,000 $11,125,000 $0 Completed Near North 11/17/99
Jones Academic $67,000,000 $32,119,344 $34,880,656 In Design Near South
10/31/2001, revised
01/11/06National Teachers Academy $47,000,000 $46,944,403 $0 Completed 24th/ Michigan 03/27/02
Simeon High School $22,000,000 $12,956,257 $9,043,743Payments over 6 more years Chatham Ridge 02/05/03
Albany Park Middle School $25,000,000 $25,000,000 $0 Completed Lawrence/ Kedzie 09/01/04Juarez High School Addition $12,500,000 $12,500,000 $0 In Construction Pilsen 09/01/04Juarez High School Land Acquisition $3,000,000 $3,000,000 $0 Land acquisition Pilsen 09/01/04DePriest Elementary School $18,500,000 $18,500,000 $0 Completed Madison/ Austin 09/01/04
Westinghouse High School $53,750,000 $53,750,000 $0Refinanced as part of MSAC bond Chicago/ Central Park 09/29/04
Canter Elementary School $150,000 $0 $150,000 In Construction 53rd Street 05/13/09
Orozoco Elementary Health Center School $250,000 $0 $250,000 Completed Western/ Ogden 05/13/09Lane Tech High School Stadium $1,890,000 $0 $1,890,000 In Construction Western Avenue South 11/07/07Coonley Middle School $2,201,500 $0 $2,201,500 In Construction Western Avenue South 11/07/07Arai / Uplift Elementary School $1,450,000 $0 $1,450,000 In Construction Wilson Yard 02/08/06
ADA and Other IGA Subtotal $280,066,750 $215,895,004 $64,116,149Grand Total $890,379,250 $398,993,662 $491,329,991Source: Chicago Public Schools and City of Chicago Journal of Proceedings
Modern Schools Across Chicago Program Phase 1
ADA Accessibility
Intergovernmental Agreements
Phases 2 and 3 Approved by City Council
55
Amount Received City Council
Use of TIF Funds for School Construction and Renovations:Chicago Public Schools and City of Chicago Intergovernmental Agreements (IGA)
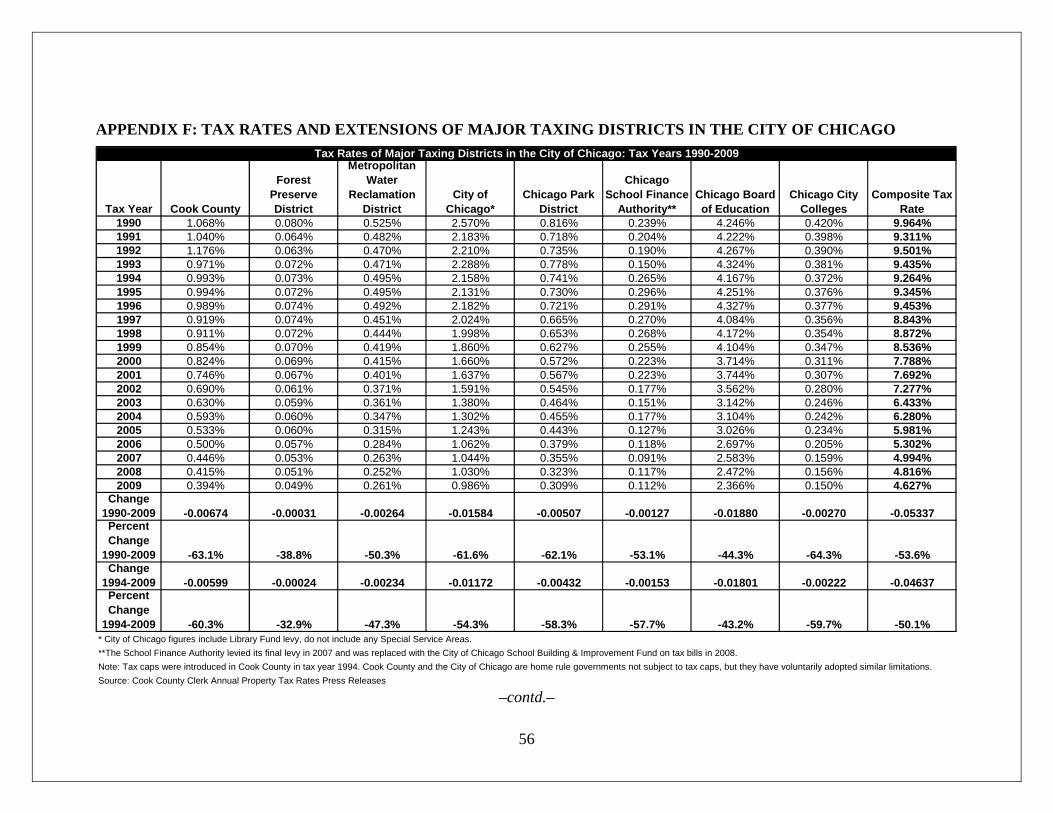
APPENDIX F: TAX RATES AND EXTENSIONS OF MAJOR TAXING DISTRICTS IN THE CITY OF CHICAGO
Tax Year Cook County
Forest Preserve District
Water Reclamation
DistrictCity of
Chicago*Chicago Park
District
Chicago School Finance
Authority**Chicago Board of Education
Chicago City Colleges
Composite Tax Rate
1990 1.068% 0.080% 0.525% 2.570% 0.816% 0.239% 4.246% 0.420% 9.964%1991 1.040% 0.064% 0.482% 2.183% 0.718% 0.204% 4.222% 0.398% 9.311%1992 1.176% 0.063% 0.470% 2.210% 0.735% 0.190% 4.267% 0.390% 9.501%1993 0.971% 0.072% 0.471% 2.288% 0.778% 0.150% 4.324% 0.381% 9.435%1994 0.993% 0.073% 0.495% 2.158% 0.741% 0.265% 4.167% 0.372% 9.264%1995 0.994% 0.072% 0.495% 2.131% 0.730% 0.296% 4.251% 0.376% 9.345%1996 0.989% 0.074% 0.492% 2.182% 0.721% 0.291% 4.327% 0.377% 9.453%1997 0.919% 0.074% 0.451% 2.024% 0.665% 0.270% 4.084% 0.356% 8.843%1998 0.911% 0.072% 0.444% 1.998% 0.653% 0.268% 4.172% 0.354% 8.872%1999 0.854% 0.070% 0.419% 1.860% 0.627% 0.255% 4.104% 0.347% 8.536%2000 0.824% 0.069% 0.415% 1.660% 0.572% 0.223% 3.714% 0.311% 7.788%2001 0.746% 0.067% 0.401% 1.637% 0.567% 0.223% 3.744% 0.307% 7.692%2002 0.690% 0.061% 0.371% 1.591% 0.545% 0.177% 3.562% 0.280% 7.277%2003 0.630% 0.059% 0.361% 1.380% 0.464% 0.151% 3.142% 0.246% 6.433%2004 0.593% 0.060% 0.347% 1.302% 0.455% 0.177% 3.104% 0.242% 6.280%2005 0.533% 0.060% 0.315% 1.243% 0.443% 0.127% 3.026% 0.234% 5.981%2006 0.500% 0.057% 0.284% 1.062% 0.379% 0.118% 2.697% 0.205% 5.302%2007 0.446% 0.053% 0.263% 1.044% 0.355% 0.091% 2.583% 0.159% 4.994%2008 0.415% 0.051% 0.252% 1.030% 0.323% 0.117% 2.472% 0.156% 4.816%2009 0.394% 0.049% 0.261% 0.986% 0.309% 0.112% 2.366% 0.150% 4.627%
Change 1990-2009 -0.00674 -0.00031 -0.00264 -0.01584 -0.00507 -0.00127 -0.01880 -0.00270 -0.05337Percent Change
1990-2009 -63.1% -38.8% -50.3% -61.6% -62.1% -53.1% -44.3% -64.3% -53.6%Change
1994-2009 -0.00599 -0.00024 -0.00234 -0.01172 -0.00432 -0.00153 -0.01801 -0.00222 -0.04637Percent Change
1994-2009 -60.3% -32.9% -47.3% -54.3% -58.3% -57.7% -43.2% -59.7% -50.1%* City of Chicago figures include Library Fund levy, do not include any Special Service Areas.**The School Finance Authority levied its final levy in 2007 and was replaced with the City of Chicago School Building & Improvement Fund on tax bills in 2008.Note: Tax caps were introduced in Cook County in tax year 1994. Cook County and the City of Chicago are home rule governments not subject to tax caps, but they have voluntarily adopted similar limitations.Source: Cook County Clerk Annual Property Tax Rates Press Releases
Metropolitan Tax Rates of Major Taxing Districts in the City of Chicago: Tax Years 1990-2009
56
–contd.–
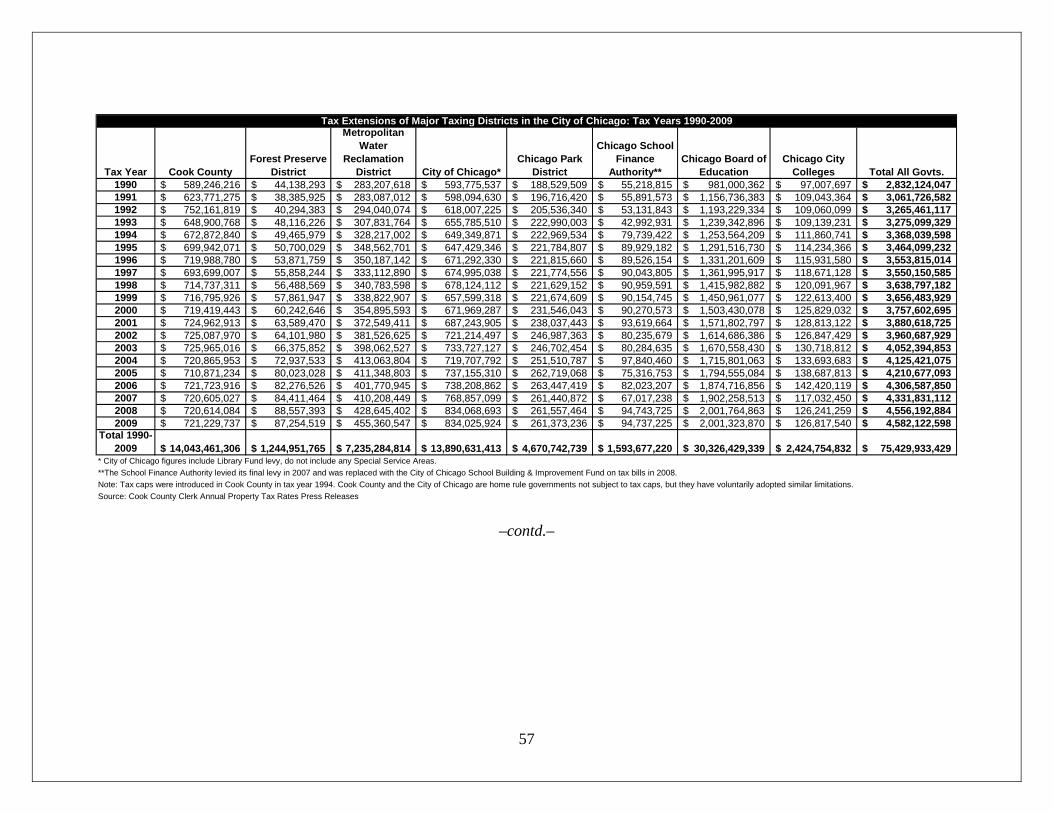
Tax Year Cook CountyForest Preserve
District
Metropolitan Water
Reclamation District City of Chicago*
Chicago Park District
Chicago School Finance
Authority**Chicago Board of
EducationChicago City
Colleges Total All Govts.1990 589,246,216$ 44,138,293$ 283,207,618$ 593,775,537$ 188,529,509$ 55,218,815$ 981,000,362$ 97,007,697$ 2,832,124,047$ 1991 623,771,275$ 38,385,925$ 283,087,012$ 598,094,630$ 196,716,420$ 55,891,573$ 1,156,736,383$ 109,043,364$ 3,061,726,582$ 1992 752,161,819$ 40,294,383$ 294,040,074$ 618,007,225$ 205,536,340$ 53,131,843$ 1,193,229,334$ 109,060,099$ 3,265,461,117$ 1993 648,900,768$ 48,116,226$ 307,831,764$ 655,785,510$ 222,990,003$ 42,992,931$ 1,239,342,896$ 109,139,231$ 3,275,099,329$ 1994 672,872,840$ 49,465,979$ 328,217,002$ 649,349,871$ 222,969,534$ 79,739,422$ 1,253,564,209$ 111,860,741$ 3,368,039,598$ 1995 699,942,071$ 50,700,029$ 348,562,701$ 647,429,346$ 221,784,807$ 89,929,182$ 1,291,516,730$ 114,234,366$ 3,464,099,232$ 1996 719,988,780$ 53,871,759$ 350,187,142$ 671,292,330$ 221,815,660$ 89,526,154$ 1,331,201,609$ 115,931,580$ 3,553,815,014$ 1997 693,699,007$ 55,858,244$ 333,112,890$ 674,995,038$ 221,774,556$ 90,043,805$ 1,361,995,917$ 118,671,128$ 3,550,150,585$ 1998 714,737,311$ 56,488,569$ 340,783,598$ 678,124,112$ 221,629,152$ 90,959,591$ 1,415,982,882$ 120,091,967$ 3,638,797,182$ 1999 716,795,926$ 57,861,947$ 338,822,907$ 657,599,318$ 221,674,609$ 90,154,745$ 1,450,961,077$ 122,613,400$ 3,656,483,929$ 2000 719,419,443$ 60,242,646$ 354,895,593$ 671,969,287$ 231,546,043$ 90,270,573$ 1,503,430,078$ 125,829,032$ 3,757,602,695$ 2001 724,962,913$ 63,589,470$ 372,549,411$ 687,243,905$ 238,037,443$ 93,619,664$ 1,571,802,797$ 128,813,122$ 3,880,618,725$ 2002 725,087,970$ 64,101,980$ 381,526,625$ 721,214,497$ 246,987,363$ 80,235,679$ 1,614,686,386$ 126,847,429$ 3,960,687,929$ 2003 725,965,016$ 66,375,852$ 398,062,527$ 733,727,127$ 246,702,454$ 80,284,635$ 1,670,558,430$ 130,718,812$ 4,052,394,853$ 2004 720,865,953$ 72,937,533$ 413,063,804$ 719,707,792$ 251,510,787$ 97,840,460$ 1,715,801,063$ 133,693,683$ 4,125,421,075$ 2005 710,871,234$ 80,023,028$ 411,348,803$ 737,155,310$ 262,719,068$ 75,316,753$ 1,794,555,084$ 138,687,813$ 4,210,677,093$ 2006 721,723,916$ 82,276,526$ 401,770,945$ 738,208,862$ 263,447,419$ 82,023,207$ 1,874,716,856$ 142,420,119$ 4,306,587,850$ 2007 720,605,027$ 84,411,464$ 410,208,449$ 768,857,099$ 261,440,872$ 67,017,238$ 1,902,258,513$ 117,032,450$ 4,331,831,112$ 2008 720,614,084$ 88,557,393$ 428,645,402$ 834,068,693$ 261,557,464$ 94,743,725$ 2,001,764,863$ 126,241,259$ 4,556,192,884$ 2009 721,229,737$ 87,254,519$ 455,360,547$ 834,025,924$ 261,373,236$ 94,737,225$ 2,001,323,870$ 126,817,540$ 4,582,122,598$
Total 1990-2009 14,043,461,306$ 1,244,951,765$ 7,235,284,814$ 13,890,631,413$ 4,670,742,739$ 1,593,677,220$ 30,326,429,339$ 2,424,754,832$ 75,429,933,429$
* City of Chicago figures include Library Fund levy, do not include any Special Service Areas.**The School Finance Authority levied its final levy in 2007 and was replaced with the City of Chicago School Building & Improvement Fund on tax bills in 2008.Note: Tax caps were introduced in Cook County in tax year 1994. Cook County and the City of Chicago are home rule governments not subject to tax caps, but they have voluntarily adopted similar limitations.Source: Cook County Clerk Annual Property Tax Rates Press Releases
Tax Extensions of Major Taxing Districts in the City of Chicago: Tax Years 1990-2009
57
–contd.–
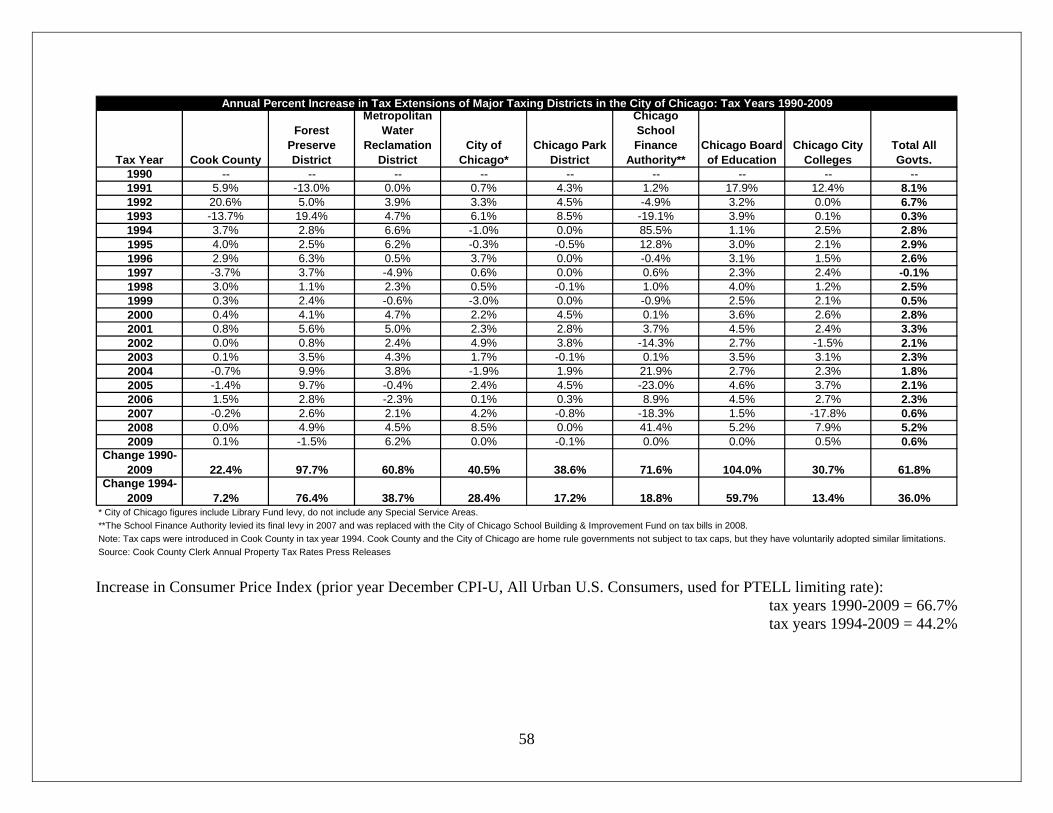
Tax Year Cook County
Forest Preserve District
Metropolitan Water
Reclamation District
City of Chicago*
Chicago Park District
Chicago School Finance
Authority**Chicago Board of Education
Chicago City Colleges
Total All Govts.
1990 -- -- -- -- -- -- -- -- --1991 5.9% -13.0% 0.0% 0.7% 4.3% 1.2% 17.9% 12.4% 8.1%1992 20.6% 5.0% 3.9% 3.3% 4.5% -4.9% 3.2% 0.0% 6.7%1993 -13.7% 19.4% 4.7% 6.1% 8.5% -19.1% 3.9% 0.1% 0.3%1994 3.7% 2.8% 6.6% -1.0% 0.0% 85.5% 1.1% 2.5% 2.8%1995 4.0% 2.5% 6.2% -0.3% -0.5% 12.8% 3.0% 2.1% 2.9%1996 2.9% 6.3% 0.5% 3.7% 0.0% -0.4% 3.1% 1.5% 2.6%1997 -3.7% 3.7% -4.9% 0.6% 0.0% 0.6% 2.3% 2.4% -0.1%1998 3.0% 1.1% 2.3% 0.5% -0.1% 1.0% 4.0% 1.2% 2.5%1999 0.3% 2.4% -0.6% -3.0% 0.0% -0.9% 2.5% 2.1% 0.5%2000 0.4% 4.1% 4.7% 2.2% 4.5% 0.1% 3.6% 2.6% 2.8%2001 0.8% 5.6% 5.0% 2.3% 2.8% 3.7% 4.5% 2.4% 3.3%2002 0.0% 0.8% 2.4% 4.9% 3.8% -14.3% 2.7% -1.5% 2.1%2003 0.1% 3.5% 4.3% 1.7% -0.1% 0.1% 3.5% 3.1% 2.3%2004 -0.7% 9.9% 3.8% -1.9% 1.9% 21.9% 2.7% 2.3% 1.8%2005 -1.4% 9.7% -0.4% 2.4% 4.5% -23.0% 4.6% 3.7% 2.1%2006 1.5% 2.8% -2.3% 0.1% 0.3% 8.9% 4.5% 2.7% 2.3%2007 -0.2% 2.6% 2.1% 4.2% -0.8% -18.3% 1.5% -17.8% 0.6%2008 0.0% 4.9% 4.5% 8.5% 0.0% 41.4% 5.2% 7.9% 5.2%2009 0.1% -1.5% 6.2% 0.0% -0.1% 0.0% 0.0% 0.5% 0.6%
Change 1990-2009 22.4% 97.7% 60.8% 40.5% 38.6% 71.6% 104.0% 30.7% 61.8%
Change 1994-2009 7.2% 76.4% 38.7% 28.4% 17.2% 18.8% 59.7% 13.4% 36.0%
* City of Chicago figures include Library Fund levy, do not include any Special Service Areas.**The School Finance Authority levied its final levy in 2007 and was replaced with the City of Chicago School Building & Improvement Fund on tax bills in 2008.Note: Tax caps were introduced in Cook County in tax year 1994. Cook County and the City of Chicago are home rule governments not subject to tax caps, but they have voluntarily adopted similar limitations.Source: Cook County Clerk Annual Property Tax Rates Press Releases
Annual Percent Increase in Tax Extensions of Major Taxing Districts in the City of Chicago: Tax Years 1990-2009
Increase in Consumer Price Index (prior year December CPI-U, All Urban U.S. Consumers, used for PTELL limiting rate):
tax years 1990-2009 = 66.7%
58
tax years 1994-2009 = 44.2%
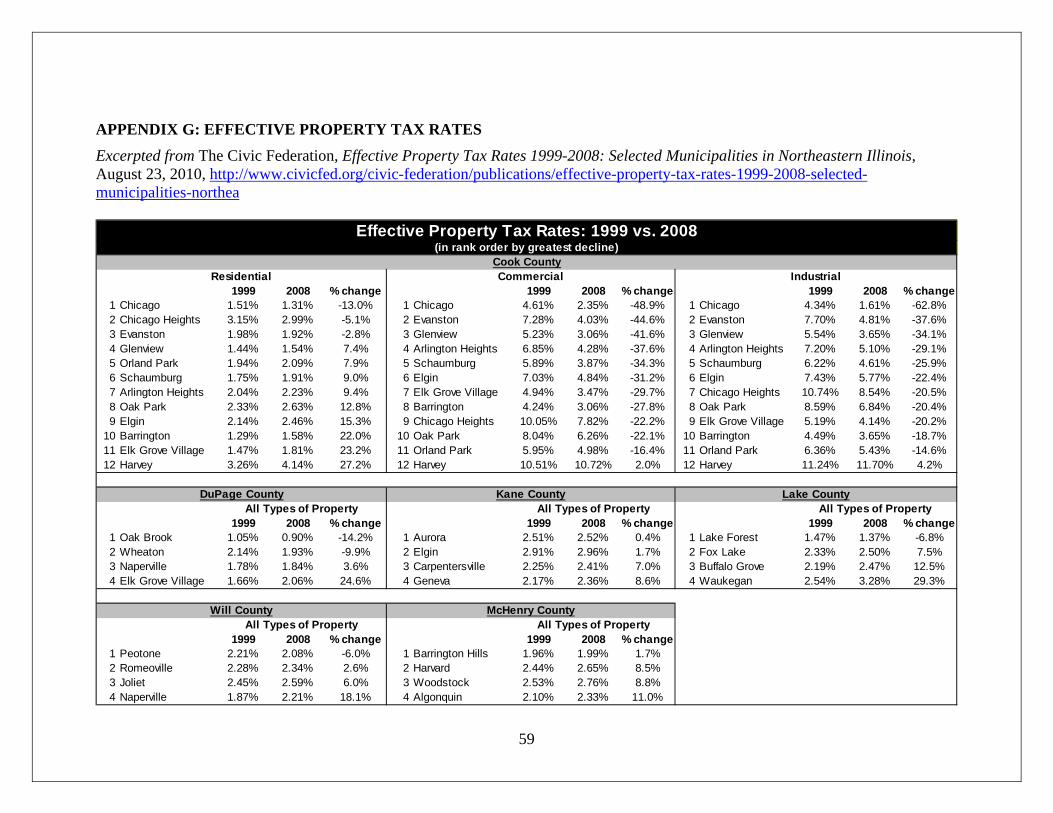
59
Excerpted from The Civic Federation, Effective Property Tax Rates 1999-2008: Selected Municipalities in Northeastern Illinois, August 23, 2010, http://www.civicfed.org/civic-federation/publications/effective-property-tax-rates-1999-2008-selected-municipalities-northea
APPENDIX G: EFFECTIVE PROPERTY TAX RATES
1999 2008 % change 1999 2008 % change 1999 2008 % change1 Chicago 1.51% 1.31% -13.0% 1 Chicago 4.61% 2.35% -48.9% 1 Chicago 4.34% 1.61% -62.8%2 Chicago Heights 3.15% 2.99% -5.1% 2 Evanston 7.28% 4.03% -44.6% 2 Evanston 7.70% 4.81% -37.6%3 Evanston 1.98% 1.92% -2.8% 3 Glenview 5.23% 3.06% -41.6% 3 Glenview 5.54% 3.65% -34.1%4 Glenview 1.44% 1.54% 7.4% 4 Arlington Heights 6.85% 4.28% -37.6% 4 Arlington Heights 7.20% 5.10% -29.1%5 Orland Park 1.94% 2.09% 7.9% 5 Schaumburg 5.89% 3.87% -34.3% 5 Schaumburg 6.22% 4.61% -25.9%6 Schaumburg 1.75% 1.91% 9.0% 6 Elgin 7.03% 4.84% -31.2% 6 Elgin 7.43% 5.77% -22.4%7 Arlington Heights 2.04% 2.23% 9.4% 7 Elk Grove Village 4.94% 3.47% -29.7% 7 Chicago Heights 10.74% 8.54% -20.5%8 Oak Park 2.33% 2.63% 12.8% 8 Barrington 4.24% 3.06% -27.8% 8 Oak Park 8.59% 6.84% -20.4%9 Elgin 2.14% 2.46% 15.3% 9 Chicago Heights 10.05% 7.82% -22.2% 9 Elk Grove Village 5.19% 4.14% -20.2%
10 Barrington 1.29% 1.58% 22.0% 10 Oak Park 8.04% 6.26% -22.1% 10 Barrington 4.49% 3.65% -18.7%11 Elk Grove Village 1.47% 1.81% 23.2% 11 Orland Park 5.95% 4.98% -16.4% 11 Orland Park 6.36% 5.43% -14.6%12 Harvey 3.26% 4.14% 27.2% 12 Harvey 10.51% 10.72% 2.0% 12 Harvey 11.24% 11.70% 4.2%
1999 2008 % change 1999 2008 % change 1999 2008 % change1 Oak Brook 1.05% 0.90% -14.2% 1 Aurora 2.51% 2.52% 0.4% 1 Lake Forest 1.47% 1.37% -6.8%2 Wheaton 2.14% 1.93% -9.9% 2 Elgin 2.91% 2.96% 1.7% 2 Fox Lake 2.33% 2.50% 7.5%3 Naperville 1.78% 1.84% 3.6% 3 Carpentersville 2.25% 2.41% 7.0% 3 Buffalo Grove 2.19% 2.47% 12.5%4 Elk Grove Village 1.66% 2.06% 24.6% 4 Geneva 2.17% 2.36% 8.6% 4 Waukegan 2.54% 3.28% 29.3%
1999 2008 % change 1999 2008 % change1 Peotone 2.21% 2.08% -6.0% 1 Barrington Hills 1.96% 1.99% 1.7%2 Romeoville 2.28% 2.34% 2.6% 2 Harvard 2.44% 2.65% 8.5%3 Joliet 2.45% 2.59% 6.0% 3 Woodstock 2.53% 2.76% 8.8%4 Naperville 1.87% 2.21% 18.1% 4 Algonquin 2.10% 2.33% 11.0%
Lake CountyAll Types of Property All Types of Property All Types of Property
Effective Property Tax Rates: 1999 vs. 2008(in rank order by greatest decline)
Cook CountyResidential Commercial Industrial
Will County McHenry CountyAll Types of Property All Types of Property
DuPage County Kane County