2017 reports and opinions of the property tax … · of the property tax administator dawes county....
TRANSCRIPT
2017 REPORTS AND OPINIONS
OF THE PROPERTY TAX ADMINISTATOR
DAWES COUNTY

April 7, 2017 Commissioner Salmon: The Property Tax Administrator has compiled the 2017 Reports and Opinions of the Property Tax Administrator for Dawes County pursuant to Neb. Rev. Stat. § 77-5027. This Report and Opinion will inform the Tax Equalization and Review Commission of the level of value and quality of assessment for real property in Dawes County. The information contained within the County Reports of the Appendices was provided by the county assessor pursuant to Neb. Rev. Stat. § 77-1514.
For the Tax Commissioner Sincerely,
Ruth A. Sorensen Property Tax Administrator 402-471-5962 cc: Roberta Coleman, Dawes County Assessor
23 Dawes Page 2

Table of Contents 2017 Reports and Opinions of the Property Tax Administrator:
Certification to the Commission Introduction County Overview
Residential Correlation Commercial Correlation Agricultural Land Correlation PTA’s Opinion
Appendices: Commission Summary
Statistical Reports and Displays:
Residential Statistics Commercial Statistics
Chart of Net Sales Compared to Commercial Assessed Value Agricultural Land Statistics
Table-Average Value of Land Capability Groups Special Valuation Statistics (if applicable)
Market Area Map Valuation History Charts
County Reports:
County Abstract of Assessment for Real Property, Form 45 County Abstract of Assessment for Real Property Compared to the Prior Year Certificate of Taxes Levied (CTL). Assessor Survey Three-Year Plan of Assessment Special Value Methodology (if applicable)
Ad Hoc Reports Submitted by County (if applicable)
23 Dawes Page 3

Introduction
Neb. Rev. Stat. § 77-5027 provides that the Property Tax Administrator (PTA) shall prepare and deliver an annual Reports and Opinions (R&O) document to each county and to the Tax Equalization and Review Commission (Commission). This will contain statistical and narrative reports informing the Commission of the certified opinion of the PTA regarding the level of value and the quality of assessment of the classes and subclasses of real property within each county. In addition to an opinion of the level of value and quality of assessment in the county, the PTA may make nonbinding recommendations for subclass adjustments for consideration by the Commission.
The statistical and narrative reports contained in the R&O of the PTA provide an analysis of the assessment process implemented by each county to reach the levels of value and quality of assessment required by Nebraska law. The PTA’s opinion of the level of value and quality of assessment in each county is a conclusion based upon all the data provided by the county assessor and gathered by the Nebraska Department of Revenue, Property Assessment Division (Division) regarding the assessment activities in the county during the preceding year.
The statistical reports are developed using the state-wide sales file that contains all arm’s-length transactions as required by Neb. Rev. Stat. § 77-1327. From this sale file, the Division prepares a statistical analysis comparing assessments to sale prices. After determining if the sales represent the class or subclass of properties being measured, inferences are drawn regarding the assessment level and quality of assessment of the class or subclass being evaluated. The statistical reports contained in the R&O are developed based on standards developed by the International Association of Assessing Officers (IAAO).
The analysis of assessment practices in each county is necessary to give proper context to the statistical inferences from the assessment sales ratio studies and the overall quality of assessment in the county. The assessment practices are evaluated in the county to ensure professionally accepted mass appraisal methods are used and that those methods will generally produce uniform and proportionate valuations.
The PTA considers the statistical reports and the analysis of assessment practices when forming conclusions on both the level of value and quality of assessment. The consideration of both the statistical indicators and assessment processes used to develop valuations is necessary to accurately determine the level of value and quality of assessment. Assessment practices that produce a biased sales file will generally produce a biased statistical indicator, which, on its face, would otherwise appear to be valid. Likewise, statistics produced on small, unrepresentative, or otherwise unreliable samples, may indicate issues with assessment uniformity and assessment level—however, a detailed review of the practices and valuation models may suggest otherwise. For these reasons, the detail of the Division’s analysis is presented and contained within the correlation sections for Residential, Commercial, and Agricultural land.
23 Dawes Page 4

Statistical Analysis:
In determining a point estimate of the level of value, the PTA considers three measures as indicators of the central tendency of assessment: the median ratio, weighted mean ratio, and mean ratio. The use and reliability of each measure is based on inherent strengths and weaknesses which are the quantity and quality of the information from which it was calculated and the defined scope of the analysis.
The median ratio is considered the most appropriate statistical measure to determine a level of value for direct equalization which is the process of adjusting the values of classes or subclasses of property in response to an unacceptable level. Since the median ratio is considered neutral in relationship to either assessed value or selling price, adjusting the class or subclass of properties based on the median measure will not change the relationships between assessed value and level of value already present in the class of property. Additionally, the median ratio is less influenced by the presence of extreme ratios, commonly called outliers, which can skew the outcome in the other measures.
The weighted mean ratio best reflects a comparison of the fully assessable valuation of a jurisdiction, by measuring the total assessed value against the total of selling prices. The weighted mean ratio can be heavily influenced by sales of large-dollar property with extreme ratios.
The mean ratio is used as a basis for other statistical calculations, such as the price related differential and coefficient of variation. As a simple average of the ratios the mean ratio has limited application in the analysis of the level of value because it assumes a normal distribution of the data set around the mean ratio with each ratio having the same impact on the calculation regardless of the assessed value or the selling price.
The quality of assessment relies in part on statistical indicators as well. If the weighted mean ratio, because of its dollar-weighting feature, is significantly different from the mean ratio, it may be an indication of disproportionate assessments. The coefficient produced by this calculation is referred to as the Price Related Differential (PRD) and measures the assessment level of lower-priced properties relative to the assessment level of higher-priced properties.
The Coefficient of Dispersion (COD) is a measure also used in the evaluation of assessment quality. The COD measures the average deviation from the median and is expressed as a percentage of the median. A COD of 15 percent indicates that half of the assessment ratios are expected to fall within 15 percent of the median. The closer the ratios are grouped around the median the more equitable the property assessments tend to be.
Pursuant to Neb. Rev. Stat. § 77-5023, the acceptable range is 69% to 75% of actual value for agricultural land and 92% to 100% for all other classes of real property.
23 Dawes Page 5

Nebraska Statutes do not provide for a range of acceptability for the COD or PRD; however, the IAAO establishes the following range of acceptability:
Analysis of Assessment Practices:
The Division reviews assessment practices that ultimately affect the valuation of real property in each county. This review is done to ensure the reliability of the statistical analysis and to ensure professionally accepted methods are used in the county assessor’s effort to establish uniform and proportionate valuations.
To ensure county assessors are submitting all Real Estate Transfer Statements, required for the development of the state sales file pursuant to Neb. Rev. Stat. § 77-1327, the Division audits a random sample from the county registers of deeds’ records to confirm that the required sales have been submitted and reflect accurate information. The timeliness of the submission is also reviewed to ensure the sales file allows analysis of up-to-date information. The county’s sales verification and qualification procedures are reviewed to ensure that sales are properly considered arm’s-length transactions unless determined to be otherwise through the verification process. Proper sales verification practices ensure the statistical analysis is based on an unbiased sample of sales.
Valuation groupings and market areas are also examined to identify whether the areas being measured truly represent economic areas within the county. The measurement of economic areas is the method by which the Division ensures intra-county equalization exists. The progress of the county’s six-year inspection cycle is documented to ensure compliance with Neb. Rev. Stat. § 77-1311.03 and also to confirm that all property is being uniformly listed and described for valuation purposes.
Valuation methodologies developed by the county assessor are reviewed for both appraisal logic and to ensure compliance with professionally accepted mass appraisal methods. Methods and sales used to develop lot values are also reviewed to ensure the land component of the valuation process is based on the local market, and agricultural outbuildings and sites are reviewed as well.
The comprehensive review of assessment practices is conducted throughout the year. Issues are presented to the county assessor for clarification. The county assessor can then work to implement corrective measures prior to establishing assessed values. The PTA’s conclusion that assessment quality is either compliant or not compliant with professionally accepted mass appraisal methods is based on the totality of the assessment practices in the county.
*Further information may be found in Exhibit 94
Property Class Residential
COD .05 -.15
PRD .98-1.03
Newer Residential .05 -.10 .98-1.03 Commercial .05 -.20 .98-1.03 Agricultural Land .05 -.25 .98-1.03
23 Dawes Page 6

County Overview
With a total area of 1,396 miles, Dawes had
9,055 residents, per the Census Bureau Quick
Facts for 2015, a slight population decline from
the 2010 US Census. In a review of the past
fifty-five years, Dawes has maintained a steady
population (Nebraska Department of Economic
Development). Reports indicated that 68% of
county residents were homeowners and 85% of residents occupied the same residence as in the
prior year (Census Quick Facts).
The majority of the commercial properties in Dawes convene in and around Chadron, the county
seat. Per the latest information available from the U.S. Census Bureau, there were 283 employer
establishments in Dawes. County-wide
employment was at 5,134 people, a 3% loss
relative to the 2010 Census (Nebraska
Department of Labor).
Simultaneously, the agricultural economy
has remained another strong anchor for
Dawes that has fortified the local rural area
economies. Dawes is included in the Upper
Niobrara White Natural Resources District
(NRD). Grassland makes up a majority of
the land in the county. When compared
against the top crops of the other counties in
Nebraska, Dawes ranks first in spring wheat
for grain (USDA AgCensus).
2006 2016 Change
CHADRON 5,634 5,851 4%
CRAWFORD 1,107 997 -10%
WHITNEY 87 77 -11%
U.S. CENSUS POPULATION CHANGE
2017 Abstract of Assessment, Form 45
Residential34%
Commercial10%
Agricultural56%
County Value Breakdown
23 Dawes Page 7

2017 Residential Correlation for Dawes County
Assessment Actions
Actions taken to address the residential property class by the Dawes County Assessor included the
completion of all pick-up work and the review of Valuation Group 10 (Chadron). This included
an updated residential lot study.
Description of Analysis
The county assessor has established four valuation groupings based primarily on assessor location,
and these are described in the table below:
Valuation
Grouping
Description
10 Residential parcels within the city of Chadron.
16 All residential properties within Crawford.
20 All rural residential parcels.
22 Whitney—a village located between Chadron and Crawford.
The residential statistical profile shows 229 qualified sales, comprised of all four valuation
groupings listed in the table, with the largest number of sales occurring in valuation grouping 10
(Chadron, at 67%). This grouping and VG 16 (Crawford) are over-represented in the sample
compared to the residential base. Two of the three measures of central tendency—the median and
weighted mean—are within acceptable range, only the mean is skewed by several low-dollar sales.
The overall median is not significantly affected by the presence of outliers. All four valuation
groupings reveal medians that are within acceptable range, but these are not always confirmed by
their respective coefficient of dispersion.
A comparison of the difference between the measures of central tendency for the two years of the
study period do not appear to suggest an increase in the residential market within the county. This
would appear to contradict the positive increase in residential value (excluding growth) as shown
in the 2017 County Abstract. Compared with the 2016 Certificate of Taxes Levied Report (Form
45). However, Form 45 does reflect the assessment actions taken for the current assessment year
as described in that section.
Assessment Practice Review
The Division conducts an annual comprehensive review of assessment practices for each county.
The purpose of the review is to examine the specific assessment practices to determine compliance
23 Dawes Page 8

2017 Residential Correlation for Dawes County
for all activities that ultimately affect the uniform and proportionate valuation of all three classes
of property.
One aspect of this review addresses sales qualification and verification. Dawes County’s sales
verification process includes a questionnaire that is mailed to all buyers of real estate within the
county (with the exception of those transactions normally suggested for exclusion by the IAAO).
The response rate is slightly less than 50%, and non-respondents are sent a second questionnaire
or contacted by telephone. Non-qualified sales are also reviewed to ensure that the grounds for
disqualifying sales were supported and documented. The review includes a dialogue with the
county assessor and a consideration of verification documentation. In the past, not all non-qualified
sales were documented, though a large portion were obvious (family sales, foreclosures, etc.)—
however, a review of the most current non-qualified sales shows documentation. Therefore, the
Division does not believe that any apparent bias existed in the qualification determination.
Another important part of the review was the examination of the six-year inspection cycle. Since
VG 10 (Chadron) was the oldest grouping previously reviewed, the assessment actions for the
current year fulfilled the timely part of the review cycle. The Dawes County assessor has developed
an excellent assessment practice of using realtor information for homes offered on the market and
keeping these in the paper record file to be used for the next review process. This eliminates “sales
chasing.”
The Division also examined valuation groups to ensure that as defined they are equally subject to
a set of economic forces that affect the value of properties within the designated group. The
Division’s review and analysis indicates that the county has adequately identified economic areas
for the residential property class. Based on all relevant information, the quality of assessment for
the residential class adheres to professionally accepted mass appraisal standards and has been
determined to be in general compliance.
Equalization and Quality of Assessment
Valuation grouping substrata indicates that all groupings are (via the median) statistically within
acceptable range.
23 Dawes Page 9

2017 Residential Correlation for Dawes County
Level of Value
Based on analysis of all available information, the level of value for the residential class of real
property in Dawes County is 99%.
23 Dawes Page 10

2017 Commercial Correlation for Dawes County
Assessment Actions
Assessment actions taken by the county assessor to address the commercial property class included
the completion of all pick-up work.
Description of Analysis
Like the residential property class, the county assessor has established four valuation groupings
based primarily on assessor location, and these are described in the table below:
Valuation
Grouping
Description
10 Chadron—all commercial property within the city of Chadron.
16 Crawford—the commercial parcels found within the town of Crawford.
20 Rural—all commercial properties outside of the towns and villages of Dawes
County and including the commercial parcels that would traditionally be
classified as “suburban,” since there is no separate suburban commercial
market.
22 Whitney—any commercial enterprise located in the village of Whitney.
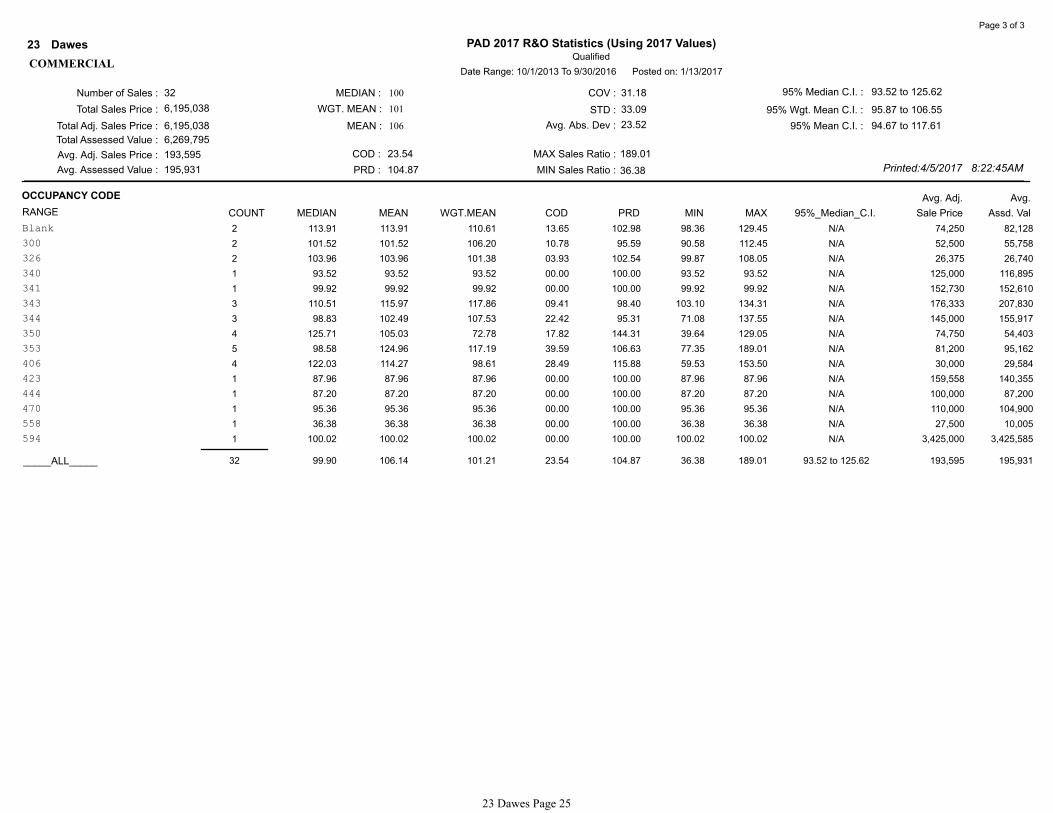
A review of the commercial statistical profile reveals 32 qualified sales, comprised of all four
valuation groupings listed in the table, with the largest number of sales occurring in valuation
groupings 10 (Chadron) and 16 (Crawford). Although these groupings are somewhat over-
represented in the sample compared to the base, they are the only two that have an active
commercial market. Only one overall measure of central tendency—the median—is within
acceptable range and is moderately supported by the COD. Only the Chadron (VG 10) commercial
subclass indicates a median statistic within acceptable range (and again, is moderately supported
by the COD).
Assessment Practice Review
The Division conducts an annual comprehensive review of assessment practices for each county.
The purpose of the review is to examine the specific assessment practices to determine compliance
for all activities that ultimately affect the uniform and proportionate valuation of all three classes
of property. Any incongruities are discussed with the county assessor to address these before they
become an issue.
One important feature of this review addresses both sales qualification and verification. Dawes
County’s sales verification process includes a mailed questionnaire to all buyers of real estate
within the county (with the exception of those transactions normally suggested for exclusion by
23 Dawes Page 11

2017 Commercial Correlation for Dawes County
the IAAO). The response rate appears to be slightly less than 50%, and non-respondents are sent
a second questionnaire or contacted by telephone. Non-qualified sales are also reviewed to ensure
that the grounds for disqualifying sales were supported and documented. The review includes a
dialogue with the county assessor and a consideration of verification documentation. Some
obvious exclusions were not documented (family sales, foreclosures, etc.) and need to be, but a
review of the most current sales indicates documentation. Therefore, the Division does not believe
that any apparent bias existed in the qualification determination. Percent of commercial sales used
has been consistent for the last five years.
Another important part of the review was the examination of the six-year inspection cycle. The
county utilizes a contracted appraisal firm, Stanard Appraisal, to help review and re-value the
commercial property class. The last date for the physical review and re-valuation of the
commercial class was completed in assessment year 2013.
The Division also examined commercial valuation groups to ensure that as defined they are equally
subject to a set of economic forces that affect the value of properties within the designated group.
The Division’s review and analysis indicates that the county has adequately identified commercial
economic areas. The quality of assessment, based on all relevant information, for the commercial
class of property adheres to professionally accepted mass appraisal standards and has been
determined to be in general compliance.
Equalization and Quality of Assessment
Only valuation grouping 10 (Chadron) has a median that falls within the acceptable range. While
it appears that VG 16 (Crawford) appears to be above the upper limits of acceptable range
according to all three measures of central tendency, it should be noted that the mere removal of
the two highest extreme outliers bring all three of these into alignment with acceptable range (96.5
Md; 98.28 Mn; 97.3 Wmn). Only two sales of this VG are within range in the statistical profile (at
93.52 and 99.48)—therefore, no adjustment would move a majority of the twelve sales within
acceptable range. In consideration of all information available, it was confirmed that the
assessment practices of the county assessor are reliable and applied consistently.
23 Dawes Page 12

2017 Commercial Correlation for Dawes County
Level of Value
Based on analysis of all available information, the level of value for the commercial property class
in Dawes County is 100% of market value.
23 Dawes Page 13

2017 Agricultural Correlation for Dawes County
Assessment Actions
Assessment actions taken to address agricultural/horticultural land for assessment year 2017
included the following overall adjustments: only grass received a 1.93% increase. Specifically by
market area, Area 1 received an average increase to grass of 8% and Area 4 received an average
increase to grass of 1%.
Description of Analysis
The Dawes County assessor has partitioned agricultural land geographically into three market
areas. Two of the three market areas are not influenced by non-agricultural factors (Areas 1 and 4)
and Area 3 is influenced by residential and recreational demands due to its location within the Pine
Ridge area. Area 1 consists of land in the northern portion of the county and has less water for
crop production, irrigation and livestock than the other two areas. Area 4 is basically the southern
portion of the county and has better quality soils and water availability compared to Area 1.
Although two neighboring counties have small portions comparable to Area 1, Area 4 is more
comparable to the same neighboring counties. Analysis of the sample reveals twenty-three
qualified sales with two of the three overall measures of central tendency falling within acceptable
range. Both non-influenced market areas also have medians within acceptable range, but only Area
4’s median is supported by the COD. No comparable sales were available to expand Area 1’s
sample. However, the increase to grass resulted in equalized values with comparable neighboring
counties. The overall sample is considered stable, since no removal of extreme outliers affect the
overall median.
Assessment Practice Review
Annually, the Division conducts a comprehensive review of assessment practices for each county.
The purpose of the review is to examine the specific assessment practices of the county to ensure
that these produce uniform and proportionate valuation of all property.
One of the assessment practices addressed is the county’s sales qualification and verification
process. The county’s process begins with the assumption that all sales are arm’s-length unless
proven otherwise by information gathered by a mailed questionnaire to all agricultural buyers. The
review of all sales deemed non-qualified was examined for support and documentation, and this
has improved over time. The review includes a dialogue with the county assessor and consideration
of verification documentation. This review indicates that no apparent bias exist in qualification
determination. Further, all sales were reviewed to ensure that those sales deemed qualified were
not affected by non-agricultural influences or special factors that would cause a premium to be
paid for the land. The county’s utilization of agricultural sales has been relatively stable, and
overall the county submits sales on a timely basis and reports transactions accurately.
23 Dawes Page 14

2017 Agricultural Correlation for Dawes County
The Division also examined the county’s inspection and review cycle for agricultural land and
improvements. Land use was updated in 2015 via aerial photography compared with taxpayer
information (provided by Farm Service Agency maps). Agricultural improvements are reviewed
at the same time as the rural residential/suburban parcels. This was last completed during
assessment year 2016.
The Division’s review of agricultural market areas within the county was conducted with the
county assessor to ensure that the areas defined are equally subject to economic forces that affect
the value of land within the delineated areas. Due to the non-agricultural influences found in Area
3, the county assessor uses special value for valuing land used for agricultural purposes within this
area. The special values established are determined by averaging the land values in the two
uninfluenced market areas: Areas 1 and 4. In summary, the market area analysis indicates that the
county assessor has adequately identified market areas for the agricultural land class.
The final part of the assessment practices review addresses the identification of rural residential
and recreational land apart from agricultural land within the county. The county assessor
determines rural residential land use first by identifying parcels of less than eighty acres that have
a home, and then verifying that the primary use does not meet the definition of agricultural land.
If the land does not meet the definition of primary agricultural land use, then it is determined to be
residential or recreational.
Equalization
Dwellings and outbuildings on agricultural land are valued using the same cost index as those for
the rural residential acreages. Farm home sites carry the same value as rural residential home sites.
The two non-agricultural influenced market areas have medians within acceptable range, but again,
only Area 4’s median is supported by the COD. The sample is quite small for both market areas,
and by subclass, the overall grass median measure of central tendency is within range (as well as
Area 4’s grass median). No comparable sales were available to expand the sample, but the grass
increase resulted in equalized values. The overall sample is considered stable, since no removal of
extreme outliers affect the overall median. It is believed that the quality of assessment of
agricultural land within the county in in general compliance with generally accepted mass appraisal
standards.
23 Dawes Page 15

2017 Agricultural Correlation for Dawes County
Level of Value
Based on analysis of all available information, the level of value of agricultural land in Dawes
County is 70%.
Special Valuation
A review of agricultural land value in Dawes County in areas that have other non-agricultural
influences indicates that the assessed values used are similar to the values used in the portion of
market area one where no non-agricultural influences exist. Therefore, it is the opinion of the
Property Tax Administrator that the level of value for Special Valuation of agricultural land is
70%
23 Dawes Page 16

2017 Opinions of the Property Tax Administrator
for Dawes County
My opinions and recommendations are stated as a conclusion based on all of the factors known to me
regarding the assessment practices and statistical analysis for this county. See, Neb. Rev. Stat. § 77-5027
(Cum. Supp. 2016). While the median assessment sales ratio from the Qualified Statistical Reports for
each class of real property is considered, my opinion of the level of value for a class of real property may
be determined from other evidence contained within these Reports and Opinions of the Property Tax
Administrator. My opinion of quality of assessment for a class of real property may be influenced by the
assessment practices of the county assessor.
Residential Real
Property
Commercial Real
Property
Agricultural Land
Class Level of Value Quality of Assessment
100
70
99
Meets generally accepted mass appraisal
practices.
Meets generally accepted mass appraisal
practices.
Meets generally accepted mass appraisal
practices.
No recommendation.
No recommendation.
No recommendation.
Non-binding recommendation
Meets generally accepted mass appraisal
practices.70 No recommendation.Special Valuation
of Agricultural
Land
**A level of value displayed as NEI (not enough information) represents a class of property with insufficient
information to determine a level of value.
Dated this 7th day of April, 2017.
Ruth A. Sorensen
Property Tax Administrator
23 Dawes Page 17
Appendices
APPENDICES
23 Dawes Page 18

2017 Commission Summary
for Dawes County
Residential Real Property - Current
Number of Sales
Total Sales Price
Total Adj. Sales Price
Total Assessed Value
Avg. Adj. Sales Price Avg. Assessed Value
Median
Wgt. Mean
Mean
95% Median C.I
95% Wgt. Mean C.I
95% Mean C.I
98.22 to 99.53
96.56 to 101.56
101.37 to 112.73
% of Value of the Class of all Real Property Value in the County
% of Records Sold in the Study Period
% of Value Sold in the Study Period
Average Assessed Value of the Base
32.97
6.84
7.87
$79,358
Residential Real Property - History
Year
2015
2014
2016
Number of Sales LOV
Confidence Interval - Current
Median
2013
229
107.05
98.71
99.06
$21,106,226
$21,106,226
$20,908,135
$92,167 $91,302
98 98.16 174
95.88 168 96
198 94.73 95
96.60 208 97
23 Dawes Page 19

2017 Commission Summary
for Dawes County
Commercial Real Property - Current
Number of Sales
Total Sales Price
Total Adj. Sales Price
Total Assessed Value
Avg. Adj. Sales Price Avg. Assessed Value
Median
Wgt. Mean
Mean
95% Median C.I
95% Wgt. Mean C.I
95% Mean C.I
% of Value of the Class of all Real Property Value in the County
% of Records Sold in the Study Period
% of Value Sold in the Study Period
Average Assessed Value of the Base
Commercial Real Property - History
Year
2015
Number of Sales LOV
32
93.52 to 125.62
95.87 to 106.55
94.67 to 117.61
10.13
6.12
7.68
$156,176
Confidence Interval - Current
Median
2013
$6,195,038
$6,195,038
$6,269,795
$193,595 $195,931
106.14
99.90
101.21
2014
26 99 96.86
98.64 99 18
99.38 30 99
32 99.37 992016
23 Dawes Page 20

Number of Sales :
Total Sales Price :
Total Adj. Sales Price :
Total Assessed Value :
Avg. Adj. Sales Price :
Avg. Assessed Value :
MEDIAN :
WGT. MEAN :
MEAN :
COD :
PRD :
COV :
STD :
Avg. Abs. Dev :
MAX Sales Ratio :
MIN Sales Ratio :
95% Median C.I. :
95% Wgt. Mean C.I. :
95% Mean C.I. :
229
21,106,226
21,106,226
20,908,135
92,167
91,302
18.81
108.07
40.93
43.82
18.57
479.65
44.40
98.22 to 99.53
96.56 to 101.56
101.37 to 112.73
Printed:4/5/2017 8:22:44AM
Qualified
PAD 2017 R&O Statistics (Using 2017 Values)Dawes23
Date Range: 10/1/2014 To 9/30/2016 Posted on: 1/13/2017
99
99
107
RESIDENTIAL
Page 1 of 2
Avg. Adj.
RANGE Assd. ValSale Price95%_Median_C.I.MAXMINPRDCODWGT.MEANMEANMEDIANCOUNT
Avg.DATE OF SALE *
_____Qrtrs_____
01-OCT-14 To 31-DEC-14 26 103.39 121.50 108.71 25.43 111.77 83.71 228.27 98.39 to 123.97 74,218 80,683
01-JAN-15 To 31-MAR-15 21 100.21 122.66 106.72 31.87 114.94 62.44 448.41 97.19 to 112.57 99,940 106,651
01-APR-15 To 30-JUN-15 23 100.32 103.12 100.49 10.80 102.62 71.26 148.88 94.92 to 107.13 89,283 89,720
01-JUL-15 To 30-SEP-15 39 98.07 102.46 98.21 13.04 104.33 65.55 164.65 96.54 to 99.37 98,701 96,933
01-OCT-15 To 31-DEC-15 32 98.89 113.61 95.80 27.04 118.59 54.92 479.65 95.28 to 103.69 93,778 89,835
01-JAN-16 To 31-MAR-16 20 97.93 92.62 94.13 10.95 98.40 44.40 118.71 91.66 to 100.57 98,333 92,556
01-APR-16 To 30-JUN-16 24 99.68 105.54 97.33 16.30 108.44 62.30 238.71 97.02 to 105.18 84,916 82,653
01-JUL-16 To 30-SEP-16 44 98.42 99.77 96.35 15.47 103.55 55.09 211.53 96.71 to 99.82 94,761 91,301
_____Study Yrs_____
01-OCT-14 To 30-SEP-15 109 98.82 111.03 102.52 19.69 108.30 62.44 448.41 98.07 to 101.73 91,112 93,407
01-OCT-15 To 30-SEP-16 120 98.68 103.42 95.99 18.00 107.74 44.40 479.65 97.99 to 99.77 93,125 89,390
_____Calendar Yrs_____
01-JAN-15 To 31-DEC-15 115 98.61 109.38 99.60 20.12 109.82 54.92 479.65 98.02 to 100.16 95,674 95,290
_____ALL_____ 229 98.71 107.05 99.06 18.81 108.07 44.40 479.65 98.22 to 99.53 92,167 91,302
Avg. Adj.
RANGE Assd. ValSale Price95%_Median_C.I.MAXMINPRDCODWGT.MEANMEANMEDIANCOUNT
Avg.VALUATION GROUPING
10 153 98.71 105.12 100.14 13.85 104.97 44.40 228.27 98.18 to 99.52 97,824 97,960
16 45 94.65 115.44 93.79 38.34 123.08 54.92 479.65 87.40 to 106.97 45,094 42,295
20 26 99.29 106.15 97.82 16.28 108.52 66.07 238.71 94.92 to 111.63 151,298 148,004
22 5 99.95 94.92 95.80 20.45 99.08 62.30 138.42 N/A 35,245 33,765
_____ALL_____ 229 98.71 107.05 99.06 18.81 108.07 44.40 479.65 98.22 to 99.53 92,167 91,302
Avg. Adj.
RANGE Assd. ValSale Price95%_Median_C.I.MAXMINPRDCODWGT.MEANMEANMEDIANCOUNT
Avg.PROPERTY TYPE *
01 229 98.71 107.05 99.06 18.81 108.07 44.40 479.65 98.22 to 99.53 92,167 91,302
06 0 00.00 00.00 00.00 00.00 00.00 00.00 00.00 N/A 0 0
07 0 00.00 00.00 00.00 00.00 00.00 00.00 00.00 N/A 0 0
_____ALL_____ 229 98.71 107.05 99.06 18.81 108.07 44.40 479.65 98.22 to 99.53 92,167 91,302
23 Dawes Page 21

Number of Sales :
Total Sales Price :
Total Adj. Sales Price :
Total Assessed Value :
Avg. Adj. Sales Price :
Avg. Assessed Value :
MEDIAN :
WGT. MEAN :
MEAN :
COD :
PRD :
COV :
STD :
Avg. Abs. Dev :
MAX Sales Ratio :
MIN Sales Ratio :
95% Median C.I. :
95% Wgt. Mean C.I. :
95% Mean C.I. :
229
21,106,226
21,106,226
20,908,135
92,167
91,302
18.81
108.07
40.93
43.82
18.57
479.65
44.40
98.22 to 99.53
96.56 to 101.56
101.37 to 112.73
Printed:4/5/2017 8:22:44AM
Qualified
PAD 2017 R&O Statistics (Using 2017 Values)Dawes23
Date Range: 10/1/2014 To 9/30/2016 Posted on: 1/13/2017
99
99
107
RESIDENTIAL
Page 2 of 2
Avg. Adj.
RANGE Assd. ValSale Price95%_Median_C.I.MAXMINPRDCODWGT.MEANMEANMEDIANCOUNT
Avg.SALE PRICE *
_____Low $ Ranges_____
Less Than 5,000 2 286.46 286.46 350.02 56.54 81.84 124.50 448.41 N/A 3,292 11,523
Less Than 15,000 9 137.94 208.81 216.26 71.16 96.56 81.92 479.65 98.43 to 448.41 7,714 16,681
Less Than 30,000 36 125.53 148.92 136.24 43.29 109.31 62.30 479.65 100.32 to 148.27 19,176 26,125
__Ranges Excl. Low $__
Greater Than 4,999 227 98.71 105.46 98.98 17.30 106.55 44.40 479.65 98.18 to 99.52 92,950 92,005
Greater Than 14,999 220 98.66 102.88 98.67 14.87 104.27 44.40 228.27 98.14 to 99.52 95,622 94,355
Greater Than 29,999 193 98.40 99.24 97.80 11.07 101.47 44.40 215.78 97.99 to 98.99 105,782 103,459
__Incremental Ranges__
0 TO 4,999 2 286.46 286.46 350.02 56.54 81.84 124.50 448.41 N/A 3,292 11,523
5,000 TO 14,999 7 137.94 186.63 202.24 57.95 92.28 81.92 479.65 81.92 to 479.65 8,977 18,155
15,000 TO 29,999 27 113.27 128.95 127.29 34.27 101.30 62.30 228.27 99.43 to 148.88 22,996 29,273
30,000 TO 59,999 47 99.95 103.12 101.86 18.69 101.24 55.09 192.74 97.18 to 105.18 45,753 46,605
60,000 TO 99,999 51 98.40 100.17 101.17 10.17 99.01 62.44 215.78 97.02 to 100.41 77,594 78,503
100,000 TO 149,999 56 98.86 98.64 98.76 06.88 99.88 44.40 131.21 97.99 to 99.80 121,421 119,920
150,000 TO 249,999 34 97.84 94.43 94.13 07.95 100.32 54.92 139.83 94.92 to 98.71 176,240 165,887
250,000 TO 499,999 5 89.02 92.49 93.49 11.60 98.93 80.40 113.81 N/A 303,300 283,567
500,000 TO 999,999 0 00.00 00.00 00.00 00.00 00.00 00.00 00.00 N/A 0 0
1,000,000 + 0 00.00 00.00 00.00 00.00 00.00 00.00 00.00 N/A 0 0
_____ALL_____ 229 98.71 107.05 99.06 18.81 108.07 44.40 479.65 98.22 to 99.53 92,167 91,302
23 Dawes Page 22

Number of Sales :
Total Sales Price :
Total Adj. Sales Price :
Total Assessed Value :
Avg. Adj. Sales Price :
Avg. Assessed Value :
MEDIAN :
WGT. MEAN :
MEAN :
COD :
PRD :
COV :
STD :
Avg. Abs. Dev :
MAX Sales Ratio :
MIN Sales Ratio :
95% Median C.I. :
95% Wgt. Mean C.I. :
95% Mean C.I. :
32
6,195,038
6,195,038
6,269,795
193,595
195,931
23.54
104.87
31.18
33.09
23.52
189.01
36.38
93.52 to 125.62
95.87 to 106.55
94.67 to 117.61
Printed:4/5/2017 8:22:45AM
Qualified
PAD 2017 R&O Statistics (Using 2017 Values)Dawes23
Date Range: 10/1/2013 To 9/30/2016 Posted on: 1/13/2017
100
101
106
COMMERCIAL
Page 1 of 3
Avg. Adj.
RANGE Assd. ValSale Price95%_Median_C.I.MAXMINPRDCODWGT.MEANMEANMEDIANCOUNT
Avg.DATE OF SALE *
_____Qrtrs_____
01-OCT-13 To 31-DEC-13 4 99.35 108.71 106.65 10.07 101.93 98.58 137.55 N/A 160,750 171,433
01-JAN-14 To 31-MAR-14 4 97.64 110.58 97.99 16.53 112.85 93.52 153.50 N/A 99,433 97,439
01-APR-14 To 30-JUN-14 2 108.33 108.33 102.79 19.51 105.39 87.20 129.45 N/A 79,250 81,465
01-JUL-14 To 30-SEP-14 3 125.80 118.11 120.04 07.84 98.39 99.48 129.05 N/A 40,500 48,617
01-OCT-14 To 31-DEC-14 2 150.73 150.73 139.08 25.40 108.38 112.45 189.01 N/A 57,500 79,973
01-JAN-15 To 31-MAR-15 2 88.07 88.07 88.02 00.12 100.06 87.96 88.18 N/A 109,779 96,630
01-APR-15 To 30-JUN-15 4 99.32 86.38 103.26 23.06 83.65 36.38 110.51 N/A 91,813 94,809
01-JUL-15 To 30-SEP-15 2 82.63 82.63 48.97 52.03 168.74 39.64 125.62 N/A 103,750 50,803
01-OCT-15 To 31-DEC-15 1 171.67 171.67 171.67 00.00 100.00 171.67 171.67 N/A 70,000 120,170
01-JAN-16 To 31-MAR-16 3 77.35 78.41 83.37 16.73 94.05 59.53 98.36 N/A 55,333 46,133
01-APR-16 To 30-JUN-16 3 103.10 112.48 101.74 11.09 110.56 100.02 134.31 N/A 1,218,000 1,239,185
01-JUL-16 To 30-SEP-16 2 107.83 107.83 100.48 34.08 107.31 71.08 144.58 N/A 37,500 37,680
_____Study Yrs_____
01-OCT-13 To 30-SEP-14 13 99.87 111.39 104.81 15.58 106.28 87.20 153.50 95.36 to 129.45 101,595 106,482
01-OCT-14 To 30-SEP-15 10 99.32 98.84 91.72 30.50 107.76 36.38 189.01 39.64 to 125.62 90,931 83,405
01-OCT-15 To 30-SEP-16 9 100.02 106.67 102.18 27.47 104.39 59.53 171.67 71.08 to 144.58 440,556 450,165
_____Calendar Yrs_____
01-JAN-14 To 31-DEC-14 11 112.45 119.52 108.29 20.32 110.37 87.20 189.01 93.52 to 153.50 72,066 78,044
01-JAN-15 To 31-DEC-15 9 90.58 95.40 91.90 32.35 103.81 36.38 171.67 39.64 to 125.62 96,034 88,252
_____ALL_____ 32 99.90 106.14 101.21 23.54 104.87 36.38 189.01 93.52 to 125.62 193,595 195,931
Avg. Adj.
RANGE Assd. ValSale Price95%_Median_C.I.MAXMINPRDCODWGT.MEANMEANMEDIANCOUNT
Avg.VALUATION GROUPING
10 18 99.97 111.97 100.72 26.79 111.17 39.64 189.01 95.36 to 137.55 293,822 295,949
16 12 101.29 103.84 108.51 16.93 95.70 71.08 134.31 88.18 to 125.80 55,729 60,474
20 1 98.58 98.58 98.58 00.00 100.00 98.58 98.58 N/A 210,000 207,020
22 1 36.38 36.38 36.38 00.00 100.00 36.38 36.38 N/A 27,500 10,005
_____ALL_____ 32 99.90 106.14 101.21 23.54 104.87 36.38 189.01 93.52 to 125.62 193,595 195,931
Avg. Adj.
RANGE Assd. ValSale Price95%_Median_C.I.MAXMINPRDCODWGT.MEANMEANMEDIANCOUNT
Avg.PROPERTY TYPE *
02 1 98.36 98.36 98.36 00.00 100.00 98.36 98.36 N/A 90,000 88,525
03 31 99.92 106.39 101.25 24.25 105.08 36.38 189.01 93.52 to 125.62 196,937 199,396
04 0 00.00 00.00 00.00 00.00 00.00 00.00 00.00 N/A 0 0
_____ALL_____ 32 99.90 106.14 101.21 23.54 104.87 36.38 189.01 93.52 to 125.62 193,595 195,931
23 Dawes Page 23

Number of Sales :
Total Sales Price :
Total Adj. Sales Price :
Total Assessed Value :
Avg. Adj. Sales Price :
Avg. Assessed Value :
MEDIAN :
WGT. MEAN :
MEAN :
COD :
PRD :
COV :
STD :
Avg. Abs. Dev :
MAX Sales Ratio :
MIN Sales Ratio :
95% Median C.I. :
95% Wgt. Mean C.I. :
95% Mean C.I. :
32
6,195,038
6,195,038
6,269,795
193,595
195,931
23.54
104.87
31.18
33.09
23.52
189.01
36.38
93.52 to 125.62
95.87 to 106.55
94.67 to 117.61
Printed:4/5/2017 8:22:45AM
Qualified
PAD 2017 R&O Statistics (Using 2017 Values)Dawes23
Date Range: 10/1/2013 To 9/30/2016 Posted on: 1/13/2017
100
101
106
COMMERCIAL
Page 2 of 3
Avg. Adj.
RANGE Assd. ValSale Price95%_Median_C.I.MAXMINPRDCODWGT.MEANMEANMEDIANCOUNT
Avg.SALE PRICE *
_____Low $ Ranges_____
Less Than 5,000 0 00.00 00.00 00.00 00.00 00.00 00.00 00.00 N/A 0 0
Less Than 15,000 2 130.78 130.78 131.06 17.38 99.79 108.05 153.50 N/A 9,875 12,943
Less Than 30,000 6 116.84 104.99 97.16 26.59 108.06 36.38 153.50 36.38 to 153.50 20,542 19,959
__Ranges Excl. Low $__
Greater Than 4,999 32 99.90 106.14 101.21 23.54 104.87 36.38 189.01 93.52 to 125.62 193,595 195,931
Greater Than 14,999 30 99.68 104.50 101.11 23.10 103.35 36.38 189.01 93.52 to 112.45 205,843 208,130
Greater Than 29,999 26 99.68 106.41 101.29 21.22 105.05 39.64 189.01 93.52 to 112.45 233,530 236,540
__Incremental Ranges__
0 TO 4,999 0 00.00 00.00 00.00 00.00 00.00 00.00 00.00 N/A 0 0
5,000 TO 14,999 2 130.78 130.78 131.06 17.38 99.79 108.05 153.50 N/A 9,875 12,943
15,000 TO 29,999 4 101.49 92.10 90.70 34.72 101.54 36.38 129.05 N/A 25,875 23,468
30,000 TO 59,999 9 99.87 109.63 108.36 27.31 101.17 59.53 189.01 71.08 to 144.58 41,833 45,331
60,000 TO 99,999 5 112.45 119.29 118.79 19.73 100.42 88.18 171.67 N/A 71,800 85,291
100,000 TO 149,999 4 94.44 103.41 104.91 13.82 98.57 87.20 137.55 N/A 116,250 121,953
150,000 TO 249,999 5 98.58 92.08 91.81 21.64 100.29 39.64 134.31 N/A 177,258 162,749
250,000 TO 499,999 2 104.67 104.67 105.08 05.58 99.61 98.83 110.51 N/A 280,000 294,235
500,000 TO 999,999 0 00.00 00.00 00.00 00.00 00.00 00.00 00.00 N/A 0 0
1,000,000 + 1 100.02 100.02 100.02 00.00 100.00 100.02 100.02 N/A 3,425,000 3,425,585
_____ALL_____ 32 99.90 106.14 101.21 23.54 104.87 36.38 189.01 93.52 to 125.62 193,595 195,931
23 Dawes Page 24
Number of Sales :
Total Sales Price :
Total Adj. Sales Price :
Total Assessed Value :
Avg. Adj. Sales Price :
Avg. Assessed Value :
MEDIAN :
WGT. MEAN :
MEAN :
COD :
PRD :
COV :
STD :
Avg. Abs. Dev :
MAX Sales Ratio :
MIN Sales Ratio :
95% Median C.I. :
95% Wgt. Mean C.I. :
95% Mean C.I. :
32
6,195,038
6,195,038
6,269,795
193,595
195,931
23.54
104.87
31.18
33.09
23.52
189.01
36.38
93.52 to 125.62
95.87 to 106.55
94.67 to 117.61
Printed:4/5/2017 8:22:45AM
Qualified
PAD 2017 R&O Statistics (Using 2017 Values)Dawes23
Date Range: 10/1/2013 To 9/30/2016 Posted on: 1/13/2017
100
101
106
COMMERCIAL
Page 3 of 3
Avg. Adj.
RANGE Assd. ValSale Price95%_Median_C.I.MAXMINPRDCODWGT.MEANMEANMEDIANCOUNT
Avg.OCCUPANCY CODE
Blank 2 113.91 113.91 110.61 13.65 102.98 98.36 129.45 N/A 74,250 82,128
300 2 101.52 101.52 106.20 10.78 95.59 90.58 112.45 N/A 52,500 55,758
326 2 103.96 103.96 101.38 03.93 102.54 99.87 108.05 N/A 26,375 26,740
340 1 93.52 93.52 93.52 00.00 100.00 93.52 93.52 N/A 125,000 116,895
341 1 99.92 99.92 99.92 00.00 100.00 99.92 99.92 N/A 152,730 152,610
343 3 110.51 115.97 117.86 09.41 98.40 103.10 134.31 N/A 176,333 207,830
344 3 98.83 102.49 107.53 22.42 95.31 71.08 137.55 N/A 145,000 155,917
350 4 125.71 105.03 72.78 17.82 144.31 39.64 129.05 N/A 74,750 54,403
353 5 98.58 124.96 117.19 39.59 106.63 77.35 189.01 N/A 81,200 95,162
406 4 122.03 114.27 98.61 28.49 115.88 59.53 153.50 N/A 30,000 29,584
423 1 87.96 87.96 87.96 00.00 100.00 87.96 87.96 N/A 159,558 140,355
444 1 87.20 87.20 87.20 00.00 100.00 87.20 87.20 N/A 100,000 87,200
470 1 95.36 95.36 95.36 00.00 100.00 95.36 95.36 N/A 110,000 104,900
558 1 36.38 36.38 36.38 00.00 100.00 36.38 36.38 N/A 27,500 10,005
594 1 100.02 100.02 100.02 00.00 100.00 100.02 100.02 N/A 3,425,000 3,425,585
_____ALL_____ 32 99.90 106.14 101.21 23.54 104.87 36.38 189.01 93.52 to 125.62 193,595 195,931
23 Dawes Page 25

Tax Growth % Growth Value Ann.%chg Net Taxable % Chg Net
Year Value Value of Value Exclud. Growth w/o grwth Sales Value Tax. Sales
2006 46,879,845$ 499,045$ 1.06% 46,380,800$ - 80,739,458$ -
2007 53,236,505$ 503,930$ 0.95% 52,732,575$ 12.48% 83,497,790$ 3.42%
2008 59,625,763$ 1,240,315$ 2.08% 58,385,448$ 9.67% 83,766,053$ 0.32%
2009 65,784,138$ 5,772,977$ 8.78% 60,011,161$ 0.65% 84,279,311$ 0.61%
2010 63,226,330$ 593,304$ 0.94% 62,633,026$ -4.79% 85,750,839$ 1.75%
2011 63,626,936$ 6,526,320$ 10.26% 57,100,616$ -9.69% 85,046,888$ -0.82%
2012 65,315,930$ 478,740$ 0.73% 64,837,190$ 1.90% 87,175,334$ 2.50%
2013 65,959,514$ 262,500$ 0.40% 65,697,014$ 0.58% 88,489,176$ 1.51%
2014 77,612,084$ 2,822,835$ 3.64% 74,789,249$ 13.39% 93,080,294$ 5.19%
2015 79,953,170$ 2,483,475$ 3.11% 77,469,695$ -0.18% 93,372,773$ 0.31%
2016 80,279,784$ 1,076,780$ 1.34% 79,203,004$ -0.94% 91,907,231$ -1.57%
Ann %chg 5.53% Average 2.31% 1.63% 1.32%
Tax Cmltv%chg Cmltv%chg Cmltv%chg County Number 23
Year w/o grwth Value Net Sales County Name Dawes
2006 - - -
2007 12.48% 13.56% 3.42%
2008 24.54% 27.19% 3.75%
2009 28.01% 40.32% 4.38%
2010 33.60% 34.87% 6.21%
2011 21.80% 35.72% 5.33%
2012 38.31% 39.33% 7.97%
2013 40.14% 40.70% 9.60%
2014 59.53% 65.56% 15.28%
2015 65.25% 70.55% 15.65%
2016 68.95% 71.25% 13.83%
Cumulative Change
0%
10%
20%
30%
40%
50%
60%
70%
80%
2006 2007 2008 2009 2010 2011 2012 2013 2014 2015 2016
Commercial & Industrial Value Change Vs. Net Taxable Sales Change
Comm.&Ind w/o Growth
Comm.&Ind. Value Chg
Net Tax. Sales Value Change
Linear (Comm.&Ind w/oGrowth)Linear (Net Tax. Sales ValueChange)
Sources:
Value; 2006-2016 CTL Report
Growth Value; 2006-2016 Abstract Rpt
Net Taxable Sales; Dept. of Revenue
website.
23 Dawes Page 26

Number of Sales :
Total Sales Price :
Total Adj. Sales Price :
Total Assessed Value :
Avg. Adj. Sales Price :
Avg. Assessed Value :
MEDIAN :
WGT. MEAN :
MEAN :
COD :
PRD :
COV :
STD :
Avg. Abs. Dev :
MAX Sales Ratio :
MIN Sales Ratio :
95% Median C.I. :
95% Wgt. Mean C.I. :
95% Mean C.I. :
23
10,666,927
10,666,927
7,411,015
463,779
322,218
26.98
113.50
37.51
29.58
19.00
171.90
45.47
61.68 to 88.78
60.53 to 78.42
66.07 to 91.65
Printed:4/5/2017 8:22:46AM
Qualified
PAD 2017 R&O Statistics (Using 2017 Values)Dawes23
Date Range: 10/1/2013 To 9/30/2016 Posted on: 1/13/2017
70
69
79
AGRICULTURAL LAND
Page 1 of 2
Avg. Adj.
RANGE Assd. ValSale Price95%_Median_C.I.MAXMINPRDCODWGT.MEANMEANMEDIANCOUNT
Avg.DATE OF SALE *
_____Qrtrs_____
01-OCT-13 To 31-DEC-13 1 139.47 139.47 139.47 00.00 100.00 139.47 139.47 N/A 381,768 532,435
01-JAN-14 To 31-MAR-14 0 00.00 00.00 00.00 00.00 00.00 00.00 00.00 N/A 0 0
01-APR-14 To 30-JUN-14 1 61.68 61.68 61.68 00.00 100.00 61.68 61.68 N/A 1,788,000 1,102,805
01-JUL-14 To 30-SEP-14 5 70.43 80.92 83.40 16.78 97.03 67.55 106.96 N/A 335,616 279,906
01-OCT-14 To 31-DEC-14 3 70.88 70.12 68.14 03.40 102.91 66.12 73.36 N/A 1,145,418 780,465
01-JAN-15 To 31-MAR-15 6 80.11 90.85 69.27 33.85 131.15 49.44 171.90 49.44 to 171.90 232,345 160,934
01-APR-15 To 30-JUN-15 1 61.46 61.46 61.46 00.00 100.00 61.46 61.46 N/A 106,670 65,560
01-JUL-15 To 30-SEP-15 1 58.00 58.00 58.00 00.00 100.00 58.00 58.00 N/A 105,000 60,900
01-OCT-15 To 31-DEC-15 0 00.00 00.00 00.00 00.00 00.00 00.00 00.00 N/A 0 0
01-JAN-16 To 31-MAR-16 1 100.55 100.55 100.55 00.00 100.00 100.55 100.55 N/A 100,000 100,545
01-APR-16 To 30-JUN-16 0 00.00 00.00 00.00 00.00 00.00 00.00 00.00 N/A 0 0
01-JUL-16 To 30-SEP-16 4 51.58 58.17 50.22 23.63 115.83 45.47 84.04 N/A 419,271 210,560
_____Study Yrs_____
01-OCT-13 To 30-SEP-14 7 70.43 86.54 78.87 27.76 109.72 61.68 139.47 61.68 to 139.47 549,693 433,539
01-OCT-14 To 30-SEP-15 11 70.88 79.54 68.10 24.80 116.80 49.44 171.90 58.00 to 93.21 458,363 312,133
01-OCT-15 To 30-SEP-16 5 56.67 66.64 53.05 32.70 125.62 45.47 100.55 N/A 355,417 188,557
_____Calendar Yrs_____
01-JAN-14 To 31-DEC-14 9 70.43 75.18 70.18 11.91 107.12 61.68 106.96 66.12 to 89.67 766,926 538,192
01-JAN-15 To 31-DEC-15 8 70.88 83.07 68.01 32.82 122.14 49.44 171.90 49.44 to 171.90 200,717 136,508
_____ALL_____ 23 70.43 78.86 69.48 26.98 113.50 45.47 171.90 61.68 to 88.78 463,779 322,218
Avg. Adj.
RANGE Assd. ValSale Price95%_Median_C.I.MAXMINPRDCODWGT.MEANMEANMEDIANCOUNT
Avg.AREA (MARKET)
1 11 70.32 79.94 65.53 34.33 121.99 45.47 171.90 46.49 to 139.47 384,911 252,227
4 12 72.12 77.88 72.08 19.70 108.05 49.44 106.96 66.12 to 93.21 536,075 386,377
_____ALL_____ 23 70.43 78.86 69.48 26.98 113.50 45.47 171.90 61.68 to 88.78 463,779 322,218
23 Dawes Page 27

Number of Sales :
Total Sales Price :
Total Adj. Sales Price :
Total Assessed Value :
Avg. Adj. Sales Price :
Avg. Assessed Value :
MEDIAN :
WGT. MEAN :
MEAN :
COD :
PRD :
COV :
STD :
Avg. Abs. Dev :
MAX Sales Ratio :
MIN Sales Ratio :
95% Median C.I. :
95% Wgt. Mean C.I. :
95% Mean C.I. :
23
10,666,927
10,666,927
7,411,015
463,779
322,218
26.98
113.50
37.51
29.58
19.00
171.90
45.47
61.68 to 88.78
60.53 to 78.42
66.07 to 91.65
Printed:4/5/2017 8:22:46AM
Qualified
PAD 2017 R&O Statistics (Using 2017 Values)Dawes23
Date Range: 10/1/2013 To 9/30/2016 Posted on: 1/13/2017
70
69
79
AGRICULTURAL LAND
Page 2 of 2
Avg. Adj.
RANGE Assd. ValSale Price95%_Median_C.I.MAXMINPRDCODWGT.MEANMEANMEDIANCOUNT
Avg.95%MLU By Market Area
_____Dry_____
County 1 61.46 61.46 61.46 00.00 100.00 61.46 61.46 N/A 106,670 65,560
1 1 61.46 61.46 61.46 00.00 100.00 61.46 61.46 N/A 106,670 65,560
_____Grass_____
County 10 72.12 92.02 76.03 34.61 121.03 58.00 171.90 66.12 to 139.47 466,587 354,724
1 3 139.47 127.23 128.75 24.28 98.82 70.32 171.90 N/A 169,540 218,283
4 7 70.88 76.93 69.57 16.01 110.58 58.00 106.96 58.00 to 106.96 593,893 413,198
_____ALL_____ 23 70.43 78.86 69.48 26.98 113.50 45.47 171.90 61.68 to 88.78 463,779 322,218
Avg. Adj.
RANGE Assd. ValSale Price95%_Median_C.I.MAXMINPRDCODWGT.MEANMEANMEDIANCOUNT
Avg.80%MLU By Market Area
_____Irrigated_____
County 1 61.68 61.68 61.68 00.00 100.00 61.68 61.68 N/A 1,788,000 1,102,805
1 1 61.68 61.68 61.68 00.00 100.00 61.68 61.68 N/A 1,788,000 1,102,805
_____Dry_____
County 2 72.75 72.75 72.66 15.52 100.12 61.46 84.04 N/A 105,766 76,845
1 2 72.75 72.75 72.66 15.52 100.12 61.46 84.04 N/A 105,766 76,845
_____Grass_____
County 14 71.16 87.03 76.52 27.29 113.73 58.00 171.90 67.55 to 106.96 375,907 287,641
1 5 71.44 104.71 115.34 47.76 90.78 70.32 171.90 N/A 132,454 152,778
4 9 70.88 77.21 70.93 15.77 108.85 58.00 106.96 66.12 to 93.21 511,158 362,566
_____ALL_____ 23 70.43 78.86 69.48 26.98 113.50 45.47 171.90 61.68 to 88.78 463,779 322,218
23 Dawes Page 28

2 3 4 5 6 7 8 9 10 11 12.00
Mkt
Area1A1 1A 2A1 2A 3A1 3A 4A1 4A
WEIGHTED
AVG IRR
1 n/a 1365 1260 1260 1208 1208 1181 1181 1226
4 n/a 2016 n/a 1792 1568 1568 1344 1344 1731
1 n/a 1775 1660 1605 1585 1585 1570 1525 1651
3 n/a 1966 2075 1953 1800 1754 1759 1793 1943
1 n/a 1350 1270 1270 1220 1220 1180 1180 1232
1 13 14 15 16 17 18 19 20 21Mkt
Area1D1 1D 2D1 2D 3D1 3D 4D1 4D
WEIGHTED
AVG DRY
1 n/a 693 651 651 604 604 551 551 633
4 n/a 825 n/a 775 719 719 656 656 776
1 n/a 690 620 615 600 570 560 550 614
3 n/a 720 720 720 650 650 650 650 711
1 n/a 600 495 450 435 435 430 410 458
22 23 24 25 26 27 28 29 30Mkt
Area1G1 1G 2G1 2G 3G1 3G 4G1 4G
WEIGHTED
AVG GRASS
1 n/a 425 400 400 375 375 350 350 360
4 n/a 505 480 480 460 460 430 430 446
1 n/a 520 485 485 475 475 425 385 420
3 n/a 426 425 425 425 425 425 425 425
1 n/a 440 425 425 420 420 400 375 396
Source: 2017 Abstract of Assessment, Form 45, Schedule IX and Grass Detail from Schedule XIII.
Box Butte
Sioux
Sheridan
County
Dawes
County
Dawes
Dawes
Sheridan
Box Butte
Dawes
Sheridan
Box Butte
Sioux
Dawes County 2017 Average Acre Value Comparison
Sioux
County
Dawes
Dawes
23 Dawes Page 29

Dawes
Sioux
Box Butte
Sheridan
23_1
83_1
81_1
7_3
23_3
23_4
7_2
23_4
111 113 117 119
811
331
115107
299
325
303
579
305
593
333
825
583
557
817
585
329
301
853851
109
547
821823 819
555
581
815
849
553
307
813
587 591589
335
845
105
549
297
551561
295
559
327337
847
339
293
859857843 855
108710951091
1099 10931097
1101 1085
87 8185 79 73
121
83
291
7577
1089
577
827
323
563
113511331121 1123 11251119 1127 1129 1131
545
341
595
71
809
103
309
89
861
1083
1137
ST71
ST87
£¤20
£¤385
LegendCounty LinesMarket AreasGeo CodesModerately well drained silty soils on uplands and in depressions formed in loessModerately well drained silty soils with clayey subsoils on uplandsWell drained silty soils formed in loess on uplandsWell drained silty soils formed in loess and alluvium on stream terracesWell to somewhat excessively drained loamy soils formed in weathered sandstone and eolian material on uplandsExcessively drained sandy soils formed in alluvium in valleys and eolian sand on uplands in sandhillsExcessively drained sandy soils formed in eolian sands on uplands in sandhillsSomewhat poorly drained soils formed in alluvium on bottom landsLakes and PondsIrrigationWells
Dawes County Map
§
23 Dawes Page 30

Tax Residential & Recreational (1)
Commercial & Industrial (1)
Total Agricultural Land (1)
Year Value Amnt Value Chg Ann.%chg Cmltv%chg Value Amnt Value Chg Ann.%chg Cmltv%chg Value Amnt Value Chg Ann.%chg Cmltv%chg
2006 166,977,750 -- -- -- 46,879,845 -- -- -- 162,760,880 -- -- --
2007 169,289,196 2,311,446 1.38% 1.38% 53,236,505 6,356,660 13.56% 13.56% 167,196,700 4,435,820 2.73% 2.73%
2008 172,779,405 3,490,209 2.06% 3.47% 59,625,763 6,389,258 12.00% 27.19% 182,802,120 15,605,420 9.33% 12.31%
2009 188,943,394 16,163,989 9.36% 13.15% 65,784,138 6,158,375 10.33% 40.32% 183,490,530 688,410 0.38% 12.74%
2010 212,216,347 23,272,953 12.32% 27.09% 63,226,330 -2,557,808 -3.89% 34.87% 228,555,280 45,064,750 24.56% 40.42%
2011 219,606,799 7,390,452 3.48% 31.52% 63,626,936 400,606 0.63% 35.72% 208,453,660 -20,101,620 -8.80% 28.07%
2012 224,738,672 5,131,873 2.34% 34.59% 65,315,930 1,688,994 2.65% 39.33% 197,041,590 -11,412,070 -5.47% 21.06%
2013 212,942,249 -11,796,423 -5.25% 27.53% 65,959,514 643,584 0.99% 40.70% 232,717,870 35,676,280 18.11% 42.98%
2014 225,027,969 12,085,720 5.68% 34.77% 77,612,084 11,652,570 17.67% 65.56% 263,838,235 31,120,365 13.37% 62.10%
2015 227,887,783 2,859,814 1.27% 36.48% 79,953,170 2,341,086 3.02% 70.55% 321,205,640 57,367,405 21.74% 97.35%
2016 237,481,085 9,593,302 4.21% 42.22% 80,279,784 326,614 0.41% 71.25% 367,034,790 45,829,150 14.27% 125.51%
Rate Annual %chg: Residential & Recreational 3.59% Commercial & Industrial 5.53% Agricultural Land 8.47%
Cnty# 23
County DAWES CHART 1 EXHIBIT 23B Page 1
(1) Residential & Recreational excludes Agric. dwelling & farm home site land. Commercial & Industrial excludes minerals. Agricultural land includes irrigated, dry, grass, waste, & other agland, excludes farm site land.
Source: 2006 - 2016 Certificate of Taxes Levied Reports CTL NE Dept. of Revenue, Property Assessment Division Prepared as of 03/01/2017
-60%-40%-20%0%20%40%60%80%100%120%140%160%180%200%220%240%260%280%300%320%340%360%380%400%420%440%460%480%500%
2006 2007 2008 2009 2010 2011 2012 2013 2014 2015 2016
REAL PROPERTY VALUATIONS - Cumulative %Change 2006-2016ResRec
Comm&Indust
Total Agland
23 Dawes Page 31

Residential & Recreational (1)
Commercial & Industrial (1)
Tax Growth % growth Value Ann.%chg Cmltv%chg Growth % growth Value Ann.%chg Cmltv%chg
Year Value Value of value Exclud. Growth w/o grwth w/o grwth Value Value of value Exclud. Growth w/o grwth w/o grwth
2006 166,977,750 1,807,243 1.08% 165,170,507 -- -- 46,879,845 499,045 1.06% 46,380,800 -- --
2007 169,289,196 1,865,977 1.10% 167,423,219 0.27% 0.27% 53,236,505 503,930 0.95% 52,732,575 12.48% 12.48%
2008 172,779,405 2,291,503 1.33% 170,487,902 0.71% 2.10% 59,625,763 1,240,315 2.08% 58,385,448 9.67% 24.54%
2009 188,943,394 3,768,391 1.99% 185,175,003 7.17% 10.90% 65,784,138 5,772,977 8.78% 60,011,161 0.65% 28.01%
2010 212,216,347 2,097,470 0.99% 210,118,877 11.21% 25.84% 63,226,330 593,304 0.94% 62,633,026 -4.79% 33.60%
2011 219,606,799 1,435,995 0.65% 218,170,804 2.81% 30.66% 63,626,936 6,526,320 10.26% 57,100,616 -9.69% 21.80%
2012 224,738,672 2,295,993 1.02% 222,442,679 1.29% 33.22% 65,315,930 478,740 0.73% 64,837,190 1.90% 38.31%
2013 212,942,249 2,526,118 1.19% 210,416,131 -6.37% 26.01% 65,959,514 262,500 0.40% 65,697,014 0.58% 40.14%
2014 225,027,969 2,008,924 0.89% 223,019,045 4.73% 33.56% 77,612,084 2,822,835 3.64% 74,789,249 13.39% 59.53%
2015 227,887,783 2,151,360 0.94% 225,736,423 0.31% 35.19% 79,953,170 2,483,475 3.11% 77,469,695 -0.18% 65.25%
2016 237,481,085 1,307,340 0.55% 236,173,745 3.64% 41.44% 80,279,784 1,076,780 1.34% 79,203,004 -0.94% 68.95%
Rate Ann%chg 3.59% 2.58% 5.53% C & I w/o growth 2.31%
Ag Improvements & Site Land (1)
Tax Agric. Dwelling & Agoutbldg & Ag Imprv&Site Growth % growth Value Ann.%chg Cmltv%chg (1) Residential & Recreational excludes AgDwelling
Year Homesite Value Farmsite Value Total Value Value of value Exclud. Growth w/o grwth w/o grwth & farm home site land; Comm. & Indust. excludes
2006 43,207,245 11,707,336 54,914,581 939,630 1.71% 53,974,951 -- -- minerals; Agric. land incudes irrigated, dry, grass,
2007 44,299,040 11,860,927 56,159,967 354,125 0.63% 55,805,842 1.62% 1.62% waste & other agland, excludes farm site land.
2008 45,133,346 12,101,262 57,234,608 2,411,125 4.21% 54,823,483 -2.38% -0.17% Real property growth is value attributable to new
2009 42,894,625 14,437,290 57,331,915 1,717,964 3.00% 55,613,951 -2.83% 1.27% construction, additions to existing buildings,
2010 44,140,870 14,997,935 59,138,805 1,575,543 2.66% 57,563,262 0.40% 4.82% and any improvements to real property which
2011 44,669,335 15,024,380 59,693,715 1,457,579 2.44% 58,236,136 -1.53% 6.05% increase the value of such property.
2012 45,288,730 15,244,355 60,533,085 1,112,747 1.84% 59,420,338 -0.46% 8.21% Sources:
2013 50,367,755 16,448,678 66,816,433 1,881,024 2.82% 64,935,409 7.27% 18.25% Value; 2006 - 2016 CTL
2014 51,142,020 16,351,113 67,493,133 487,090 0.72% 67,006,043 0.28% 22.02% Growth Value; 2006-2016 Abstract of Asmnt Rpt.
2015 58,524,060 15,899,370 74,423,430 2,313,595 3.11% 72,109,835 6.84% 31.31%
2016 59,027,085 16,666,440 75,693,525 1,464,920 1.94% 74,228,605 -0.26% 35.17% NE Dept. of Revenue, Property Assessment Division
Rate Ann%chg 3.17% 3.59% 3.26% Ag Imprv+Site w/o growth 0.90% Prepared as of 03/01/2017
Cnty# 23
County DAWES CHART 2
-60%-40%-20%0%20%40%60%80%100%120%140%160%180%200%220%240%260%280%300%320%340%360%380%400%420%440%460%480%500%
2006 2007 2008 2009 2010 2011 2012 2013 2014 2015 2016
REAL PROPERTY & GROWTH VALUATIONS - Cumulative %Change 2006-2016ResRec
Comm&Indust
Ag Imprv+SiteLand
23 Dawes Page 32

Tax Irrigated Land Dryland Grassland
Year Value Value Chg Ann%chg Cmltv%chg Value Value Chg Ann%chg Cmltv%chg Value Value Chg Ann%chg Cmltv%chg
2006 5,150,135 -- -- -- 34,228,720 -- -- -- 120,757,455 -- -- --
2007 5,163,460 13,325 0.26% 0.26% 35,058,570 829,850 2.42% 2.42% 122,705,790 1,948,335 1.61% 1.61%
2008 7,447,350 2,283,890 44.23% 44.60% 35,956,625 898,055 2.56% 5.05% 135,284,885 12,579,095 10.25% 12.03%
2009 8,170,150 722,800 9.71% 58.64% 37,069,585 1,112,960 3.10% 8.30% 137,136,950 1,852,065 1.37% 13.56%
2010 8,488,365 318,215 3.89% 64.82% 43,887,355 6,817,770 18.39% 28.22% 175,926,540 38,789,590 28.29% 45.69%
2011 15,353,370 6,865,005 80.88% 198.12% 51,328,195 7,440,840 16.95% 49.96% 141,444,235 -34,482,305 -19.60% 17.13%
2012 15,329,840 -23,530 -0.15% 197.66% 51,211,900 -116,295 -0.23% 49.62% 129,904,495 -11,539,740 -8.16% 7.57%
2013 16,600,130 1,270,290 8.29% 222.32% 53,726,350 2,514,450 4.91% 56.96% 152,812,195 22,907,700 17.63% 26.54%
2014 20,322,760 3,722,630 22.43% 294.61% 62,299,430 8,573,080 15.96% 82.01% 180,500,510 27,688,315 18.12% 49.47%
2015 26,767,325 6,444,565 31.71% 419.74% 78,693,105 16,393,675 26.31% 129.90% 214,643,005 34,142,495 18.92% 77.75%
2016 29,193,850 2,426,525 9.07% 466.86% 89,431,445 10,738,340 13.65% 161.28% 247,815,410 33,172,405 15.45% 105.22%
Rate Ann.%chg: Irrigated 18.95% Dryland 10.08% Grassland 7.45%
Tax Waste Land (1)
Other Agland (1)
Total Agricultural
Year Value Value Chg Ann%chg Cmltv%chg Value Value Chg Ann%chg Cmltv%chg Value Value Chg Ann%chg Cmltv%chg
2006 111,855 -- -- -- 2,512,715 -- -- -- 162,760,880 -- -- --
2007 112,115 260 0.23% 0.23% 4,156,765 1,644,050 65.43% 65.43% 167,196,700 4,435,820 2.73% 2.73%
2008 112,115 0 0.00% 0.23% 4,001,145 -155,620 -3.74% 59.24% 182,802,120 15,605,420 9.33% 12.31%
2009 168,355 56,240 50.16% 50.51% 945,490 -3,055,655 -76.37% -62.37% 183,490,530 688,410 0.38% 12.74%
2010 168,415 60 0.04% 50.57% 84,605 -860,885 -91.05% -96.63% 228,555,280 45,064,750 24.56% 40.42%
2011 174,700 6,285 3.73% 56.18% 153,160 68,555 81.03% -93.90% 208,453,660 -20,101,620 -8.80% 28.07%
2012 175,330 630 0.36% 56.75% 420,025 266,865 174.24% -83.28% 197,041,590 -11,412,070 -5.47% 21.06%
2013 205,245 29,915 17.06% 83.49% 9,373,950 8,953,925 2131.76% 273.06% 232,717,870 35,676,280 18.11% 42.98%
2014 207,265 2,020 0.98% 85.30% 508,270 -8,865,680 -94.58% -79.77% 263,838,235 31,120,365 13.37% 62.10%
2015 703,960 496,695 239.64% 529.35% 398,245 -110,025 -21.65% -84.15% 321,205,640 57,367,405 21.74% 97.35%
2016 594,085 -109,875 -15.61% 431.12% 0 -398,245 -100.00% -100.00% 367,034,790 45,829,150 14.27% 125.51%
Cnty# 23 Rate Ann.%chg: Total Agric Land 8.47%
County DAWES
Source: 2006 - 2016 Certificate of Taxes Levied Reports CTL NE Dept. of Revenue, Property Assessment Division Prepared as of 03/01/2017 CHART 3 EXHIBIT 23B Page 3
-60%-40%-20%0%20%40%60%80%100%120%140%160%180%200%220%240%260%280%300%320%340%360%380%400%420%440%460%480%500%
2006 2007 2008 2009 2010 2011 2012 2013 2014 2015 2016
AGRICULTURAL LAND VALUATIONS - Cumulative %Change 2006-2016
Irrigated
Dryland
Total Agland
Grassland
23 Dawes Page 33
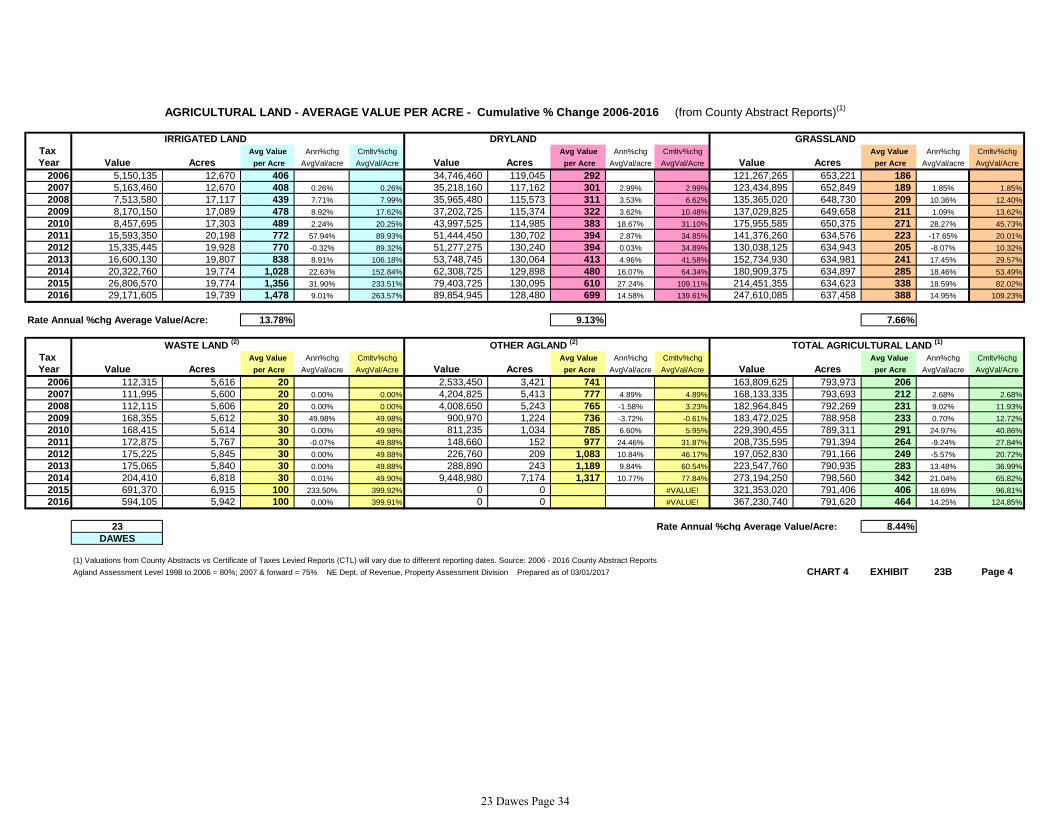
AGRICULTURAL LAND - AVERAGE VALUE PER ACRE - Cumulative % Change 2006-2016 (from County Abstract Reports)(1)
IRRIGATED LAND DRYLAND GRASSLAND
Tax Avg Value Ann%chg Cmltv%chg Avg Value Ann%chg Cmltv%chg Avg Value Ann%chg Cmltv%chg
Year Value Acres per Acre AvgVal/acre AvgVal/Acre Value Acres per Acre AvgVal/acre AvgVal/Acre Value Acres per Acre AvgVal/acre AvgVal/Acre
2006 5,150,135 12,670 406 34,746,460 119,045 292 121,267,265 653,221 186
2007 5,163,460 12,670 408 0.26% 0.26% 35,218,160 117,162 301 2.99% 2.99% 123,434,895 652,849 189 1.85% 1.85%
2008 7,513,580 17,117 439 7.71% 7.99% 35,965,480 115,573 311 3.53% 6.62% 135,365,020 648,730 209 10.36% 12.40%
2009 8,170,150 17,089 478 8.92% 17.62% 37,202,725 115,374 322 3.62% 10.48% 137,029,825 649,658 211 1.09% 13.62%
2010 8,457,695 17,303 489 2.24% 20.25% 43,997,525 114,985 383 18.67% 31.10% 175,955,585 650,375 271 28.27% 45.73%
2011 15,593,350 20,198 772 57.94% 89.93% 51,444,450 130,702 394 2.87% 34.85% 141,376,260 634,576 223 -17.65% 20.01%
2012 15,335,445 19,928 770 -0.32% 89.32% 51,277,275 130,240 394 0.03% 34.89% 130,038,125 634,943 205 -8.07% 10.32%
2013 16,600,130 19,807 838 8.91% 106.18% 53,748,745 130,064 413 4.96% 41.58% 152,734,930 634,981 241 17.45% 29.57%
2014 20,322,760 19,774 1,028 22.63% 152.84% 62,308,725 129,898 480 16.07% 64.34% 180,909,375 634,897 285 18.46% 53.49%
2015 26,806,570 19,774 1,356 31.90% 233.51% 79,403,725 130,095 610 27.24% 109.11% 214,451,355 634,623 338 18.59% 82.02%
2016 29,171,605 19,739 1,478 9.01% 263.57% 89,854,945 128,480 699 14.58% 139.61% 247,610,085 637,458 388 14.95% 109.23%
Rate Annual %chg Average Value/Acre: 13.78% 9.13% 7.66%
WASTE LAND (2)
OTHER AGLAND (2)
TOTAL AGRICULTURAL LAND (1)
Tax Avg Value Ann%chg Cmltv%chg Avg Value Ann%chg Cmltv%chg Avg Value Ann%chg Cmltv%chg
Year Value Acres per Acre AvgVal/acre AvgVal/Acre Value Acres per Acre AvgVal/acre AvgVal/Acre Value Acres per Acre AvgVal/acre AvgVal/Acre
2006 112,315 5,616 20 2,533,450 3,421 741 163,809,625 793,973 206
2007 111,995 5,600 20 0.00% 0.00% 4,204,825 5,413 777 4.89% 4.89% 168,133,335 793,693 212 2.68% 2.68%
2008 112,115 5,606 20 0.00% 0.00% 4,008,650 5,243 765 -1.58% 3.23% 182,964,845 792,269 231 9.02% 11.93%
2009 168,355 5,612 30 49.98% 49.98% 900,970 1,224 736 -3.72% -0.61% 183,472,025 788,958 233 0.70% 12.72%
2010 168,415 5,614 30 0.00% 49.98% 811,235 1,034 785 6.60% 5.95% 229,390,455 789,311 291 24.97% 40.86%
2011 172,875 5,767 30 -0.07% 49.88% 148,660 152 977 24.46% 31.87% 208,735,595 791,394 264 -9.24% 27.84%
2012 175,225 5,845 30 0.00% 49.88% 226,760 209 1,083 10.84% 46.17% 197,052,830 791,166 249 -5.57% 20.72%
2013 175,065 5,840 30 0.00% 49.88% 288,890 243 1,189 9.84% 60.54% 223,547,760 790,935 283 13.48% 36.99%
2014 204,410 6,818 30 0.01% 49.90% 9,448,980 7,174 1,317 10.77% 77.84% 273,194,250 798,560 342 21.04% 65.82%
2015 691,370 6,915 100 233.50% 399.92% 0 0 #VALUE! 321,353,020 791,406 406 18.69% 96.81%
2016 594,105 5,942 100 0.00% 399.91% 0 0 #VALUE! 367,230,740 791,620 464 14.25% 124.85%
23 Rate Annual %chg Average Value/Acre: 8.44%
DAWES
(1) Valuations from County Abstracts vs Certificate of Taxes Levied Reports (CTL) will vary due to different reporting dates. Source: 2006 - 2016 County Abstract Reports
Agland Assessment Level 1998 to 2006 = 80%; 2007 & forward = 75% NE Dept. of Revenue, Property Assessment Division Prepared as of 03/01/2017 CHART 4 EXHIBIT 23B Page 4
23 Dawes Page 34

2016 County and Municipal Valuations by Property TypePop. County: Personal Prop StateAsd PP StateAsdReal Residential Commercial Industrial Recreation Agland Agdwell&HS AgImprv&FS Minerals Total Value
9,182 DAWES 29,714,874 20,234,848 57,519,963 237,450,345 79,791,825 487,959 30,740 367,034,790 59,027,085 16,666,440 13,573,709 881,532,578
cnty sectorvalue % of total value: 3.37% 2.30% 6.52% 26.94% 9.05% 0.06% 0.00% 41.64% 6.70% 1.89% 1.54% 100.00%
Pop. Municipality: Personal Prop StateAsd PP StateAsd Real Residential Commercial Industrial Recreation Agland Agdwell&HS AgImprv&FS Minerals Total Value
5,851 CHADRON 7,809,095 2,592,842 691,546 139,757,450 65,825,525 145,775 0 0 0 0 0 216,822,233
63.72% %sector of county sector 26.28% 12.81% 1.20% 58.86% 82.50% 29.87% 24.60% %sector of municipality 3.60% 1.20% 0.32% 64.46% 30.36% 0.07% 100.00%
997 CRAWFORD 835,448 1,144,142 2,637,214 21,504,870 4,980,260 48,070 0 0 0 0 0 31,150,004
10.86% %sector of county sector 2.81% 5.65% 4.58% 9.06% 6.24% 9.85% 3.53% %sector of municipality 2.68% 3.67% 8.47% 69.04% 15.99% 0.15% 100.00%
77 WHITNEY 28,081 62,208 116,715 1,448,360 352,985 0 0 30,125 0 0 0 2,038,474
0.84% %sector of county sector 0.09% 0.31% 0.20% 0.61% 0.44% 0.01% 0.23% %sector of municipality 1.38% 3.05% 5.73% 71.05% 17.32% 1.48% 100.00%
6,925 Total Municipalities 8,672,624 3,799,192 3,445,475 162,710,680 71,158,770 193,845 0 30,125 0 0 0 250,010,711
75.42% %all municip.sect of cnty 29.19% 18.78% 5.99% 68.52% 89.18% 39.73% 0.01% 28.36%Cnty# County Sources: 2016 Certificate of Taxes Levied CTL, 2010 US Census; Dec. 2016 Municipality Population per Research Division NE Dept. of Revenue, Property Assessment Division Prepared as of 03/01/2017
23 DAWES CHART 5 EXHIBIT 23B Page 5
23 Dawes Page 35

DawesCounty 23 2017 County Abstract of Assessment for Real Property, Form 45
01. Res UnImp Land
02. Res Improve Land
259 1,800,495 51 1,325,420 150 2,254,075 460 5,379,990
2,172 12,859,705 170 4,745,135 295 8,507,110 2,637 26,111,950
2,337 174,646,440 206 24,711,635 345 34,887,505 2,888 234,245,580
3,348 265,737,520 1,629,300
1,517,195 85 712,275 5 94,180 4 710,740 76
384 6,387,605 23 459,510 11 1,107,735 418 7,954,850
71,720,165 429 3,024,200 16 3,517,290 24 65,178,675 389
514 81,192,210 5,556,275
03. Res Improvements
04. Res Total
05. Com UnImp Land
06. Com Improve Land
07. Com Improvements
08. Com Total
7,151 806,203,425 9,056,475 Total Real Property
Growth Value : Records : Sum Lines 17, 25, & 30 Sum Lines 17, 25, & 41
09. Ind UnImp Land
10. Ind Improve Land
11. Ind Improvements
12. Ind Total
13. Rec UnImp Land
14. Rec Improve Land
15. Rec Improvements
16. Rec Total
17. Taxable Total
4 96,775 0 0 1 294,114 5 390,889
4 11,500 0 0 0 0 4 11,500
4 85,570 0 0 0 0 4 85,570
9 487,959 0
0 0 0 0 0 0 0 0
0 0 0 0 1 19,500 1 19,500
0 0 0 0 1 11,240 1 11,240
1 30,740 0
3,872 347,448,429 7,185,575
Urban SubUrban Rural Total GrowthRecords Value Records Value Records Value Records Value
Schedule I : Non-Agricultural Records
% of Res Total
% of Com Total
% of Ind Total
% of Rec Total
% of Taxable Total
% of Res & Rec Total
Res & Rec Total
% of Com & Ind Total
Com & Ind Total
77.54 71.24 7.68 11.58 14.78 17.18 46.82 32.96
13.38 14.63 54.15 43.10
473 72,470,865 28 4,070,980 22 5,138,324 523 81,680,169
3,349 265,768,260 2,596 189,306,640 496 45,679,430 257 30,782,190
71.23 77.52 32.97 46.83 11.58 7.67 17.19 14.81
0.00 0.00 0.00 0.01 0.00 0.00 100.00 100.00
88.73 90.44 10.13 7.31 4.98 5.35 6.29 4.21
11.11 60.27 0.13 0.06 0.00 0.00 39.73 88.89
89.02 90.47 10.07 7.19 5.01 5.45 5.97 4.09
10.03 7.36 75.34 79.26
495 45,648,690 257 30,782,190 2,596 189,306,640
21 4,844,210 28 4,070,980 465 72,277,020
1 294,114 0 0 8 193,845
1 30,740 0 0 0 0
3,069 261,777,505 285 34,853,170 518 50,817,754
61.35
0.00
0.00
17.99
79.34
61.35
17.99
5,556,275
1,629,300
23 Dawes Page 36
DawesCounty 23 2017 County Abstract of Assessment for Real Property, Form 45
18. Residential
Records
TotalRural
SubUrban Urban
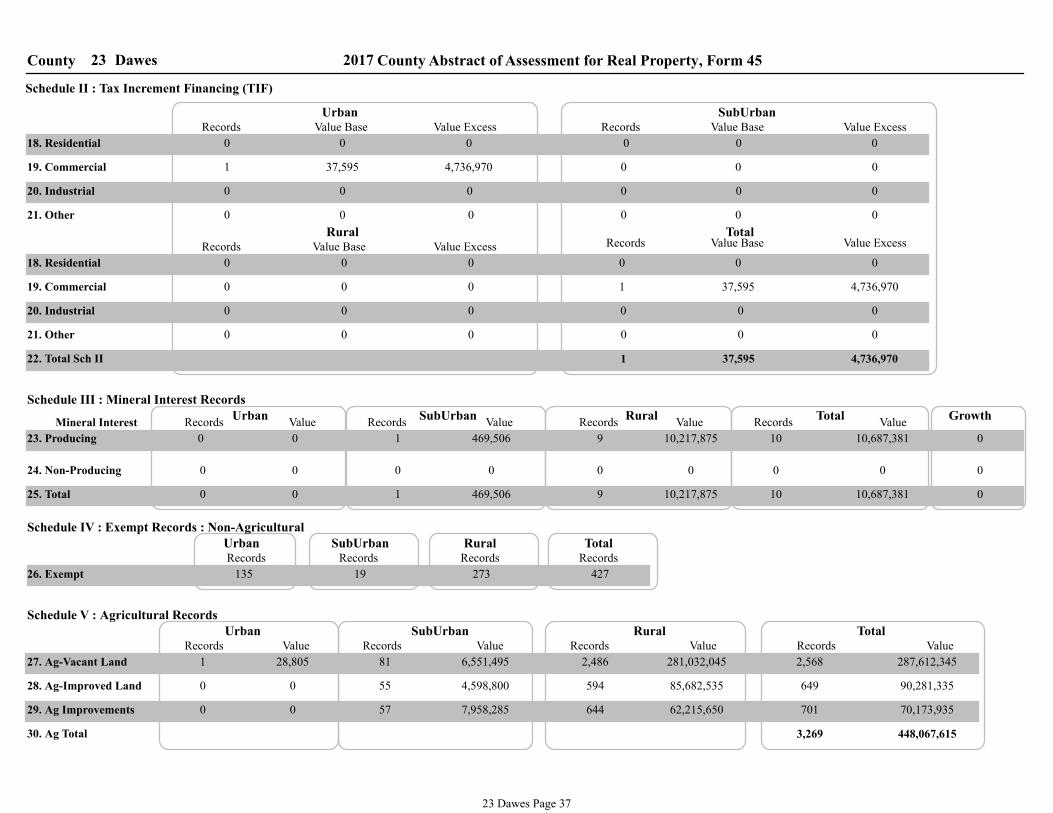
Schedule II : Tax Increment Financing (TIF)
Value Base Value Excess Value ExcessValue BaseRecords
0 0 0 0 0 0
19. Commercial
20. Industrial
21. Other
22. Total Sch II
1 37,595 4,736,970
0 0 0
0 0 0 0 0 0
0 0 0
0 0 0
Value ExcessValue BaseRecordsValue ExcessValue BaseRecords
21. Other
20. Industrial
19. Commercial
18. Residential 0 0 0 0 0 0
0 0 0 1 37,595 4,736,970
0 0 0 0 0 0
0 0 0 0 0 0
1 37,595 4,736,970
23. Producing
GrowthValueRecords
TotalValueRecords
RuralValueRecords
SubUrbanValueRecords
UrbanSchedule III : Mineral Interest Records
0 0 1 469,506 9 10,217,875 10 10,687,381 0
0 0 0 0 0 0 0 0 0
0 0 1 469,506 9 10,217,875 10 10,687,381 0
Mineral Interest
24. Non-Producing
25. Total
Schedule IV : Exempt Records : Non-Agricultural
Schedule V : Agricultural Records
Records Records Records RecordsTotalRural SubUrban Urban
26. Exempt 135 19 273 427
30. Ag Total
29. Ag Improvements
28. Ag-Improved Land
ValueRecordsTotal
ValueRecordsRural
Records Value SubUrban
ValueRecords
27. Ag-Vacant Land
Urban
1 28,805 81 6,551,495 2,486 281,032,045 2,568 287,612,345
0 0 55 4,598,800 594 85,682,535 649 90,281,335
0 0 57 7,958,285 644 62,215,650 701 70,173,935
3,269 448,067,615
23 Dawes Page 37

DawesCounty 23 2017 County Abstract of Assessment for Real Property, Form 45
31. HomeSite UnImp Land
Records
TotalRural
SubUrban UrbanSchedule VI : Agricultural Records :Non-Agricultural Detail
Acres Value ValueAcresRecords
32. HomeSite Improv Land
33. HomeSite Improvements
34. HomeSite Total
ValueAcresRecordsValueAcres
34. HomeSite Total
33. HomeSite Improvements
32. HomeSite Improv Land
31. HomeSite UnImp Land
35. FarmSite UnImp Land
36. FarmSite Improv Land
37. FarmSite Improvements
38. FarmSite Total
37. FarmSite Improvements
36. FarmSite Improv Land
35. FarmSite UnImp Land
39. Road & Ditches
38. FarmSite Total
39. Road & Ditches
Records
40. Other- Non Ag Use
40. Other- Non Ag Use
41. Total Section VI
0 0.00 0 1 1.00 10,000
0 0.00 0
0 0.00 0 50
0 0.00 0 0
0 0.00 0 49
0 0.00 0 53
0 0.00 0 70
0 0.00 0 0 0.00 0
0 162.86
1,975,000 0.00
98,000 49.00
0.00 0
5,983,285 0.00
522,100 52.91 48
23 232,000 24.00 24 25.00 242,000
486 528.00 5,051,600 534 580.91 5,573,700
542 0.00 48,009,055 592 0.00 53,992,340
616 605.91 59,808,040
9.00 9 18,000 9 9.00 18,000
521 520.21 1,013,720 570 569.21 1,111,720
557 0.00 14,206,595 610 0.00 16,181,595
619 578.21 17,311,315
1,424 4,408.12 0 1,494 4,570.98 0
0 0.00 0 0 0.00 0
1,235 5,755.10 77,119,355
Growth
1,870,900
0
1,870,900
23 Dawes Page 38

DawesCounty 23 2017 County Abstract of Assessment for Real Property, Form 45
42. Game & Parks
ValueAcresRecords
SubUrban
ValueAcresRecords
Urban
0 0.00 0 1 0.00 0
42. Game & Parks
ValueAcresRecordsTotal
ValueAcresRecordsRural
Schedule VII : Agricultural Records :Ag Land Detail - Game & Parks
34 5,502.08 2,215,470 35 5,502.08 2,215,470
Schedule VIII : Agricultural Records : Special Value
43. Special Value
ValueAcresRecords SubUrban
ValueAcresRecords Urban
43. Special Value
ValueAcresRecordsTotal
ValueAcresRecordsRural
44. Recapture Value N/A
44. Market Value
0 0.00 0 128 20,889.71 10,140,310
814 155,555.40 67,942,495 942 176,445.11 78,082,805
0 0.00 0 128 20,889.71 19,636,490
* LB 968 (2006) for tax year 2009 and forward there will be no Recapture value.
0 0 0 0 0 0
23 Dawes Page 39

1Market AreaSchedule IX : Agricultural Records : Ag Land Market Area Detail
2017 County Abstract of Assessment for Real Property, Form 45Dawes23County
45. 1A1
ValueAcres
46. 1A
47. 2A1
48. 2A
49. 3A1
50. 3A
51. 4A1
52. 4A
53. Total
54. 1D1
55. 1D
56. 2D1
57. 2D
58. 3D1
59. 3D
60. 4D1
61. 4D
62. Total
63. 1G1
64. 1G
65. 2G1
66. 2G
67. 3G1
68. 3G
69. 4G1
70. 4G
71. Total
Waste
Other
Exempt
Irrigated
Dry
Grass
Market Area Total 156,241,110 371,132.44
0 0.00
0 0.00
506,270 5,063.34
107,820,080 299,533.52
71,538,435 204,395.63
6,419,770 18,341.76
13,678,765 36,475.40
1,720,410 4,587.24
10,321,175 25,802.97
1,264,360 3,160.97
2,877,165 6,769.55
0 0.00
35,983,745 56,802.82
4,154,215 7,539.46
4,434.99 2,443,680
3,328,435 5,510.66
1,617,855 2,678.58
12,449,570 19,123.77
2,296,995 3,528.37
9,692,995 13,986.99
0 0.00
11,931,015 9,732.76
1,320,360 1,118.00
2,860,035 2,421.71
1,845,465 1,527.70
2,650,800 2,194.36
805,150 639.00
617,455 490.05
1,831,750 1,341.94
0 0.00
% of Acres* % of Value*
0.00%
13.79%
24.62%
0.00%
0.00%
2.26%
6.57%
5.04%
33.67%
6.21%
8.61%
1.06%
22.55%
15.70%
9.70%
4.72%
1.53%
12.18%
11.49%
24.88%
7.81%
13.27%
68.24%
6.12%
100.00%
100.00%
100.00%
Grass Total
Dry Total
Irrigated Total 9,732.76
56,802.82
299,533.52
11,931,015
35,983,745
107,820,080
2.62%
15.31%
80.71%
1.36%
0.00%
0.00%
100.00%
Average Assessed Value*
15.35%
0.00%
6.75%
5.18%
22.22%
15.47%
23.97%
11.07%
100.00%
0.00%
26.94%
2.67%
0.00%
6.38%
34.60%
1.17%
9.57%
4.50%
9.25%
1.60%
12.69%
6.79%
11.54%
5.95%
66.35%
100.00%
100.00%
0.00
1,365.00
693.00
0.00
0.00
425.02
1,260.02
1,259.98
651.01
651.00
400.00
399.99
1,208.01
1,208.00
604.00
604.00
375.04
375.01
1,181.00
1,181.00
551.00
551.00
350.00
350.01
1,225.86
633.49
359.96
0.00% 0.00
0.00% 0.00
100.00% 420.98
633.49 23.03%
359.96 69.01%
1,225.86 7.64%
99.99 0.32%72.
73.
74.
75.
23 Dawes Page 40

3Market AreaSchedule IX : Agricultural Records : Ag Land Market Area Detail
2017 County Abstract of Assessment for Real Property, Form 45Dawes23County
45. 1A1
ValueAcres
46. 1A
47. 2A1
48. 2A
49. 3A1
50. 3A
51. 4A1
52. 4A
53. Total
54. 1D1
55. 1D
56. 2D1
57. 2D
58. 3D1
59. 3D
60. 4D1
61. 4D
62. Total
63. 1G1
64. 1G
65. 2G1
66. 2G
67. 3G1
68. 3G
69. 4G1
70. 4G
71. Total
Waste
Other
Exempt
Irrigated
Dry
Grass
Market Area Total 80,287,990 178,416.97
0 0.00
0 0.00
34,955 349.70
61,232,445 151,498.58
46,678,045 117,670.76
4,729,175 12,010.04
199,715 476.40
1,013,065 2,320.70
5,454,140 12,289.05
206,965 453.54
2,951,340 6,278.09
0 0.00
18,698,900 26,362.89
1,701,635 2,783.59
5,094.80 3,110,420
138,530 206.11
822,090 1,222.06
5,858,500 8,169.85
134,240 186.79
6,933,485 8,699.69
0 0.00
321,690 205.80
11,555 9.15
30,135 23.86
0 0.00
41,240 29.71
29,435 19.29
0 0.00
209,325 123.79
0 0.00
% of Acres* % of Value*
0.00%
60.15%
33.00%
0.00%
0.00%
4.14%
9.37%
0.00%
30.99%
0.71%
8.11%
0.30%
14.44%
0.00%
0.78%
4.64%
1.53%
0.31%
4.45%
11.59%
19.33%
10.56%
77.67%
7.93%
100.00%
100.00%
100.00%
Grass Total
Dry Total
Irrigated Total 205.80
26,362.89
151,498.58
321,690
18,698,900
61,232,445
0.12%
14.78%
84.91%
0.20%
0.00%
0.00%
100.00%
Average Assessed Value*
65.07%
0.00%
9.15%
0.00%
12.82%
0.00%
9.37%
3.59%
100.00%
0.00%
37.08%
4.82%
0.00%
0.72%
31.33%
0.34%
8.91%
4.40%
0.74%
1.65%
0.33%
16.63%
9.10%
7.72%
76.23%
100.00%
100.00%
0.00
1,690.97
796.98
0.00
0.00
470.10
1,525.92
0.00
718.67
717.09
443.82
456.33
1,388.08
0.00
672.71
672.12
436.53
419.22
1,262.99
1,262.84
610.51
611.31
396.68
393.77
1,563.12
709.29
404.18
0.00% 0.00
0.00% 0.00
100.00% 450.00
709.29 23.29%
404.18 76.27%
1,563.12 0.40%
99.96 0.04%72.
73.
74.
75.
23 Dawes Page 41

4Market AreaSchedule IX : Agricultural Records : Ag Land Market Area Detail
2017 County Abstract of Assessment for Real Property, Form 45Dawes23County
45. 1A1
ValueAcres
46. 1A
47. 2A1
48. 2A
49. 3A1
50. 3A
51. 4A1
52. 4A
53. Total
54. 1D1
55. 1D
56. 2D1
57. 2D
58. 3D1
59. 3D
60. 4D1
61. 4D
62. Total
63. 1G1
64. 1G
65. 2G1
66. 2G
67. 3G1
68. 3G
69. 4G1
70. 4G
71. Total
Waste
Other
Exempt
Irrigated
Dry
Grass
Market Area Total 134,419,160 241,436.31
0 0.00
0 0.00
41,360 413.73
83,543,495 187,491.50
45,835,080 106,593.00
12,273,640 28,543.15
4,133,630 8,986.02
2,380,390 5,174.72
6,981,375 14,544.44
73,555 153.26
11,865,825 23,496.91
0 0.00
33,971,940 43,792.42
1,602,080 2,442.22
7,790.59 5,110,600
405,540 564.05
433,580 603.07
4,708,530 6,075.47
0 0.00
21,711,610 26,317.02
0 0.00
16,862,365 9,738.66
1,506,715 1,121.07
1,719,115 1,279.11
2,172,215 1,385.35
1,157,870 738.44
1,650,945 921.28
0 0.00
8,655,505 4,293.41
0 0.00
% of Acres* % of Value*
0.00%
44.09%
60.09%
0.00%
0.00%
12.53%
9.46%
0.00%
13.87%
0.00%
7.76%
0.08%
7.58%
14.23%
1.29%
1.38%
2.76%
4.79%
11.51%
13.13%
17.79%
5.58%
56.85%
15.22%
100.00%
100.00%
100.00%
Grass Total
Dry Total
Irrigated Total 9,738.66
43,792.42
187,491.50
16,862,365
33,971,940
83,543,495
4.03%
18.14%
77.66%
0.17%
0.00%
0.00%
100.00%
Average Assessed Value*
51.33%
0.00%
9.79%
0.00%
6.87%
12.88%
10.19%
8.94%
100.00%
0.00%
63.91%
14.20%
0.00%
0.00%
13.86%
0.09%
8.36%
1.28%
1.19%
2.85%
4.95%
15.04%
4.72%
14.69%
54.86%
100.00%
100.00%
0.00
2,016.00
825.00
0.00
0.00
505.00
1,792.01
0.00
0.00
775.01
480.00
479.94
1,567.99
1,567.99
718.95
718.98
460.00
460.01
1,343.99
1,344.00
656.00
655.99
430.00
430.00
1,731.49
775.75
445.59
0.00% 0.00
0.00% 0.00
100.00% 556.75
775.75 25.27%
445.59 62.15%
1,731.49 12.54%
99.97 0.03%72.
73.
74.
75.
23 Dawes Page 42

County 2017 County Abstract of Assessment for Real Property, Form 45Dawes23
Schedule X : Agricultural Records :Ag Land Total
76. Irrigated
TotalValueAcresAcres Value
RuralAcres Value ValueAcres
SubUrban Urban
77. Dry Land
78. Grass
79. Waste
80. Other
81. Exempt
82. Total
24.39 28,805 190.27 297,745 19,462.56 28,788,520 19,677.22 29,115,070
0.00 0 5,518.71 3,875,805 121,439.42 84,778,780 126,958.13 88,654,585
0.00 0 15,595.03 6,318,685 622,928.57 246,277,335 638,523.60 252,596,020
0.00 0 279.65 27,960 5,547.12 554,625 5,826.77 582,585
0.00 0 0.00 0 0.00 0 0.00 0
0.00 0
24.39 28,805 21,583.66 10,520,195
0.00 0 0.00 0 0.00 0
769,377.67 360,399,260 790,985.72 370,948,260
Irrigated
Dry Land
Grass
Waste
Other
Exempt
Total 370,948,260 790,985.72
0 0.00
0 0.00
582,585 5,826.77
252,596,020 638,523.60
88,654,585 126,958.13
29,115,070 19,677.22
% of Acres*Acres Value % of Value* Average Assessed Value*
698.30 16.05% 23.90%
0.00 0.00% 0.00%
395.59 80.73% 68.09%
1,479.63 2.49% 7.85%
0.00 0.00% 0.00%
468.97 100.00% 100.00%
99.98 0.74% 0.16%
23 Dawes Page 43

GrowthUnimproved Land Improved Land Improvements Total
2017 County Abstract of Assessment for Real Property, Form 45County 23 Dawes
Records Value Records Value Records Value Records Value
Schedule XI : Residential Records - Assessor Location Detail
Assessor LocationLine# L
2 510 3 114,220 5 325,380 7 440,110 083.1 N/a Or Error
154 1,420,750 1,613 10,724,565 1,763 154,197,390 1,917 166,342,705 414,58083.2 Chadron
73 297,135 516 2,022,005 525 19,209,925 598 21,529,065 16,00083.3 Crawford
199 3,578,985 462 13,142,455 546 59,282,280 745 76,003,720 1,197,82583.4 Rural
32 82,610 44 128,205 50 1,241,845 82 1,452,660 89583.5 Whitney
460 5,379,990 2,638 26,131,450 2,889 234,256,820 3,349 265,768,260 1,629,30084 Residential Total
23 Dawes Page 44
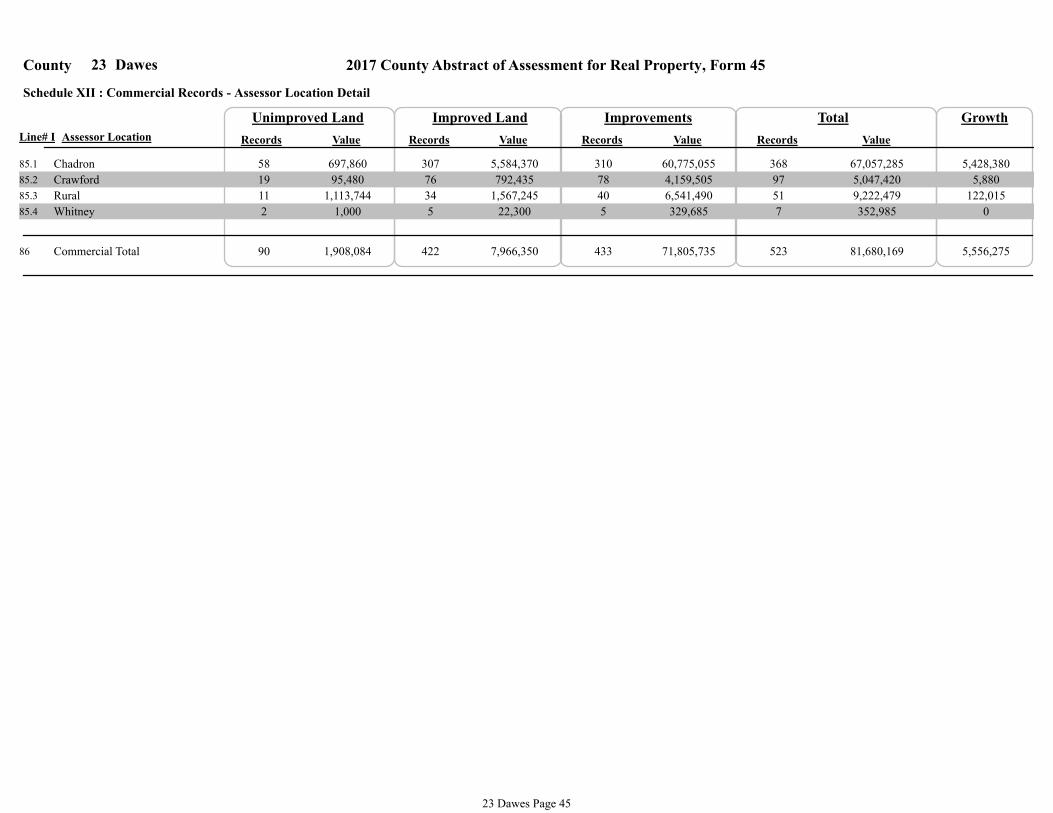
GrowthUnimproved Land Improved Land Improvements Total
2017 County Abstract of Assessment for Real Property, Form 45County 23 Dawes
Records Value Records Value Records Value Records Value
Schedule XII : Commercial Records - Assessor Location Detail
Assessor LocationLine# L
58 697,860 307 5,584,370 310 60,775,055 368 67,057,285 5,428,38085.1 Chadron
19 95,480 76 792,435 78 4,159,505 97 5,047,420 5,88085.2 Crawford
11 1,113,744 34 1,567,245 40 6,541,490 51 9,222,479 122,01585.3 Rural
2 1,000 5 22,300 5 329,685 7 352,985 085.4 Whitney
90 1,908,084 422 7,966,350 433 71,805,735 523 81,680,169 5,556,27586 Commercial Total
23 Dawes Page 45

1Market AreaSchedule XIII : Agricultural Records : Grass Land Detail By Market Area
2017 County Abstract of Assessment for Real Property, Form 45Dawes23County
87. 1G1
ValueAcres
88. 1G
89. 2G1
90. 2G
91. 3G1
92. 3G
93. 4G1
94. 4G
95. Total
96. 1C1
97. 1C
98. 2C1
99. 2C
100. 3C1
101. 3C
102. 4C1
103. 4C
104. Total
105. 1T1
106. 1T
107. 2T1
108. 2T
109. 3T1
110. 3T
111. 4T1
112. 4T
113. Total
Pure Grass
CRP
Timber
114. Market Area Total 107,820,080 299,533.52
107,820,080 299,533.52
71,538,435 204,395.63
6,419,770 18,341.76
13,678,765 36,475.40
1,720,410 4,587.24
10,321,175 25,802.97
1,264,360 3,160.97
2,877,165 6,769.55
0 0.00
% of Acres* % of Value*
0.00%
2.26%
8.61%
1.06%
1.53%
12.18%
68.24%
6.12%
100.00%
Grass TotalCRP Total
Timber Total
299,533.52 107,820,080 100.00%
100.00%
Average Assessed Value*
2.67%
0.00%
1.17%
9.57%
1.60%
12.69%
5.95%
66.35%
100.00%
0.00
425.02
400.00
399.99
375.04
375.01
350.00
350.01
359.96
100.00% 359.96
359.96 100.00%
0.00
0.00
0.00
0.00
0.00
0.00
0.00
0.00
0.00
0.00 0
0
0
0
0
0
0
0
0
0
0.00 0
0.00 0
0.00 0
0.00 0
0.00 0
0.00 0
0.00 0
0.00 0
0.00% 0.00 0.00%
0.00% 0.00 0.00%
0.00% 0.00 0.00% 0.00% 0.00 0.00%
0.00% 0.00 0.00%
0.00% 0.00 0.00%
0.00% 0.00 0.00% 0.00% 0.00 0.00%
0.00% 0.00 0.00% 0.00% 0.00 0.00%
0.00% 0.00 0.00%
0.00% 0.00 0.00%
0.00% 0.00 0.00%
0.00% 0.00 0.00%
0.00% 0.00 0.00%
0.00% 0.00 0.00%
0.00% 0.00% 0.00
0.00% 0.00%
0.00%
0.00% 0.00
0.00
0.00 0.00%
0.00% 0.00 0
0.00 0
23 Dawes Page 46

3Market AreaSchedule XIII : Agricultural Records : Grass Land Detail By Market Area
2017 County Abstract of Assessment for Real Property, Form 45Dawes23County
87. 1G1
ValueAcres
88. 1G
89. 2G1
90. 2G
91. 3G1
92. 3G
93. 4G1
94. 4G
95. Total
96. 1C1
97. 1C
98. 2C1
99. 2C
100. 3C1
101. 3C
102. 4C1
103. 4C
104. Total
105. 1T1
106. 1T
107. 2T1
108. 2T
109. 3T1
110. 3T
111. 4T1
112. 4T
113. Total
Pure Grass
CRP
Timber
114. Market Area Total 61,232,445 151,498.58
61,232,445 151,498.58
46,678,045 117,670.76
4,729,175 12,010.04
199,715 476.40
1,013,065 2,320.70
5,454,140 12,289.05
206,965 453.54
2,951,340 6,278.09
0 0.00
% of Acres* % of Value*
0.00%
4.14%
8.11%
0.30%
1.53%
0.31%
77.67%
7.93%
100.00%
Grass TotalCRP Total
Timber Total
151,498.58 61,232,445 100.00%
100.00%
Average Assessed Value*
4.82%
0.00%
0.34%
8.91%
1.65%
0.33%
7.72%
76.23%
100.00%
0.00
470.10
443.82
456.33
436.53
419.22
396.68
393.77
404.18
100.00% 404.18
404.18 100.00%
0.00
0.00
0.00
0.00
0.00
0.00
0.00
0.00
0.00
0.00 0
0
0
0
0
0
0
0
0
0
0.00 0
0.00 0
0.00 0
0.00 0
0.00 0
0.00 0
0.00 0
0.00 0
0.00% 0.00 0.00%
0.00% 0.00 0.00%
0.00% 0.00 0.00% 0.00% 0.00 0.00%
0.00% 0.00 0.00%
0.00% 0.00 0.00%
0.00% 0.00 0.00% 0.00% 0.00 0.00%
0.00% 0.00 0.00% 0.00% 0.00 0.00%
0.00% 0.00 0.00%
0.00% 0.00 0.00%
0.00% 0.00 0.00%
0.00% 0.00 0.00%
0.00% 0.00 0.00%
0.00% 0.00 0.00%
0.00% 0.00% 0.00
0.00% 0.00%
0.00%
0.00% 0.00
0.00
0.00 0.00%
0.00% 0.00 0
0.00 0
23 Dawes Page 47

4Market AreaSchedule XIII : Agricultural Records : Grass Land Detail By Market Area
2017 County Abstract of Assessment for Real Property, Form 45Dawes23County
87. 1G1
ValueAcres
88. 1G
89. 2G1
90. 2G
91. 3G1
92. 3G
93. 4G1
94. 4G
95. Total
96. 1C1
97. 1C
98. 2C1
99. 2C
100. 3C1
101. 3C
102. 4C1
103. 4C
104. Total
105. 1T1
106. 1T
107. 2T1
108. 2T
109. 3T1
110. 3T
111. 4T1
112. 4T
113. Total
Pure Grass
CRP
Timber
114. Market Area Total 83,543,495 187,491.50
83,543,495 187,491.50
45,835,080 106,593.00
12,273,640 28,543.15
4,133,630 8,986.02
2,380,390 5,174.72
6,981,375 14,544.44
73,555 153.26
11,865,825 23,496.91
0 0.00
% of Acres* % of Value*
0.00%
12.53%
7.76%
0.08%
2.76%
4.79%
56.85%
15.22%
100.00%
Grass TotalCRP Total
Timber Total
187,491.50 83,543,495 100.00%
100.00%
Average Assessed Value*
14.20%
0.00%
0.09%
8.36%
2.85%
4.95%
14.69%
54.86%
100.00%
0.00
505.00
480.00
479.94
460.00
460.01
430.00
430.00
445.59
100.00% 445.59
445.59 100.00%
0.00
0.00
0.00
0.00
0.00
0.00
0.00
0.00
0.00
0.00 0
0
0
0
0
0
0
0
0
0
0.00 0
0.00 0
0.00 0
0.00 0
0.00 0
0.00 0
0.00 0
0.00 0
0.00% 0.00 0.00%
0.00% 0.00 0.00%
0.00% 0.00 0.00% 0.00% 0.00 0.00%
0.00% 0.00 0.00%
0.00% 0.00 0.00%
0.00% 0.00 0.00% 0.00% 0.00 0.00%
0.00% 0.00 0.00% 0.00% 0.00 0.00%
0.00% 0.00 0.00%
0.00% 0.00 0.00%
0.00% 0.00 0.00%
0.00% 0.00 0.00%
0.00% 0.00 0.00%
0.00% 0.00 0.00%
0.00% 0.00% 0.00
0.00% 0.00%
0.00%
0.00% 0.00
0.00
0.00 0.00%
0.00% 0.00 0
0.00 0
23 Dawes Page 48

2017 County Abstract of Assessment for Real Property, Form 45
23 DawesCompared with the 2016 Certificate of Taxes Levied Report (CTL)
2016 CTL
County Total
2017 Form 45
County Total
Value Difference Percent
Change
2017 Growth Percent Change
excl. Growth
237,450,345
30,740
01. Residential
02. Recreational
03. Ag-Homesite Land, Ag-Res Dwelling
04. Total Residential (sum lines 1-3)
05. Commercial
06. Industrial
07. Total Commercial (sum lines 5-6)
08. Ag-Farmsite Land, Outbuildings
09. Minerals
10. Non Ag Use Land
11. Total Non-Agland (sum lines 8-10)
12. Irrigated
13. Dryland
14. Grassland
15. Wasteland
16. Other Agland
18. Total Value of all Real Property
(Locally Assessed)
(2017 form 45 - 2016 CTL) (New Construction Value)
59,027,085
296,508,170
79,791,825
487,959
80,279,784
16,666,440
13,573,709
0
30,240,149
29,193,850
89,431,445
247,815,410
594,085
0
367,034,790
265,737,520
30,740
59,808,040
325,576,300
81,192,210
487,959
81,680,169
17,311,315
10,687,381
0
27,998,696
29,115,070
88,654,585
252,596,020
582,585
0
370,948,260
28,287,175
0
780,955
29,068,130
1,400,385
0
1,400,385
644,875
-2,886,328
0
-2,241,453
-78,780
-776,860
4,780,610
-11,500
0
3,913,470
11.91%
0.00%
1.32%
9.80%
1.76%
0.00%
1.74%
3.87%
-21.26
-7.41%
-0.27%
-0.87%
1.93%
-1.94%
1.07%
1,629,300
0
1,629,300
5,556,275
0
5,556,275
1,870,900
0
0.00%
11.23%
1.32%
9.25%
-5.21%
0.00%
-5.18%
-7.36%
-21.26%
0
17. Total Agricultural Land
774,062,893 806,203,425 32,140,532 4.15% 9,056,475 2.98%
1,870,900 -13.60%
23 Dawes Page 49
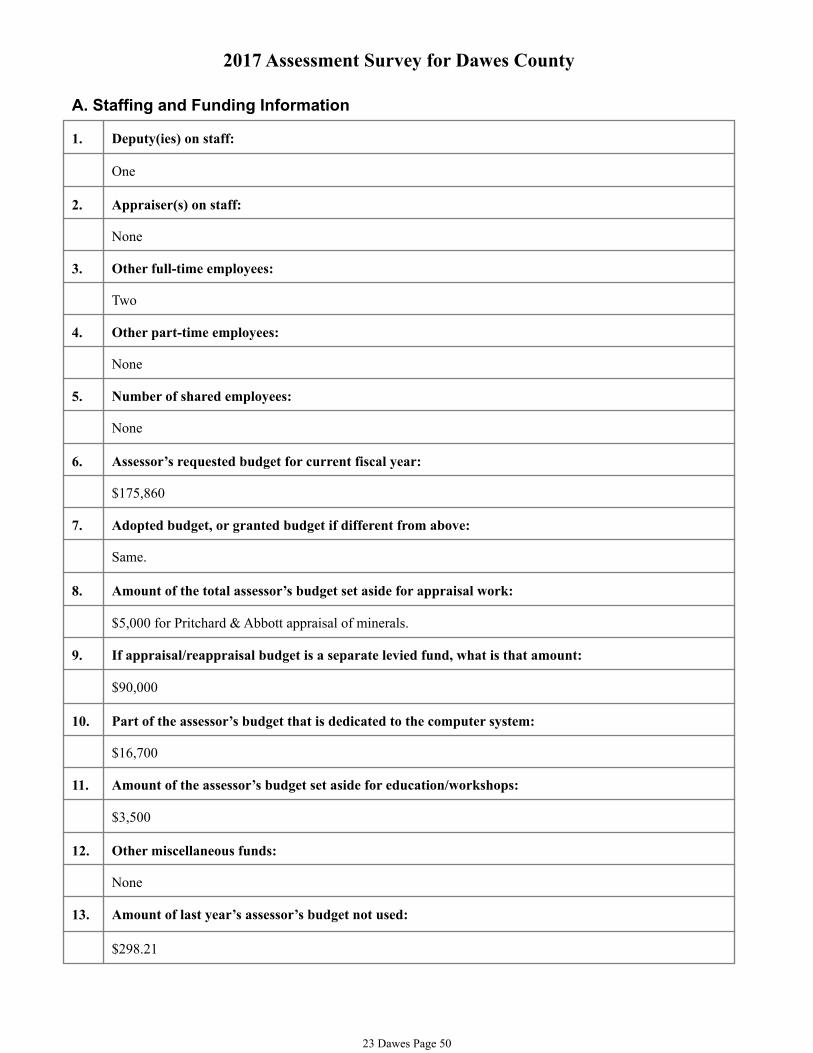
2017 Assessment Survey for Dawes County
A. Staffing and Funding Information
Deputy(ies) on staff:1.
One
Appraiser(s) on staff:2.
None
Other full-time employees:3.
Two
Other part-time employees:4.
None
Number of shared employees:5.
None
Assessor’s requested budget for current fiscal year:6.
$175,860
Adopted budget, or granted budget if different from above:7.
Same.
Amount of the total assessor’s budget set aside for appraisal work:8.
$5,000 for Pritchard & Abbott appraisal of minerals.
If appraisal/reappraisal budget is a separate levied fund, what is that amount:9.
$90,000
Part of the assessor’s budget that is dedicated to the computer system:10.
$16,700
Amount of the assessor’s budget set aside for education/workshops:11.
$3,500
Other miscellaneous funds:12.
None
Amount of last year’s assessor’s budget not used:13.
$298.21
23 Dawes Page 50

B. Computer, Automation Information and GIS
1. Administrative software:
MIPS
2. CAMA software:
MIPS
3. Are cadastral maps currently being used?
No
4. If so, who maintains the Cadastral Maps?
N/A
5. Does the county have GIS software?
Yes
6. Is GIS available to the public? If so, what is the web address?
Yes. The web address is dawes.assessor.gisworkshop.com
7. Who maintains the GIS software and maps?
GIS Workshop
8. Personal Property software:
MIPS
C. Zoning Information
1. Does the county have zoning?
Yes
2. If so, is the zoning countywide?
Yes
3. What municipalities in the county are zoned?
Chadron and Crawford.
4. When was zoning implemented?
2002
23 Dawes Page 51

D. Contracted Services
1. Appraisal Services:
Stanard Appraisal for commercial property; Pritchard & Abbott for mineral interests.
2. GIS Services:
GIS Workshop
3. Other services:
MIPS for CAMA, administrative and personal property software; Pictometry.
E. Appraisal /Listing Services
1. Does the county employ outside help for appraisal or listing services?
Stanard Appraisal for the commercial property class; Pritchard & Abbott for mineral
interests.
2. If so, is the appraisal or listing service performed under contract?
Yes
3. What appraisal certifications or qualifications does the County require?
The appropriate certification for the services performed.
4. Have the existing contracts been approved by the PTA?
The Assessor is not sure.
5. Does the appraisal or listing service providers establish assessed values for the county?
The Dawes County Assessor is responsible for establishing assessed values.
23 Dawes Page 52

2017 Residential Assessment Survey for Dawes County
1. Valuation data collection done by:
The Assessor and her staff.
List the valuation groupings recognized by the County and describe the unique
characteristics of each:
2.
Description of unique characteristicsValuation
Grouping
10 Chadron: all residential properties within the city of Chadron.
16 Crawford: all residential properties within the town of Crawford.
20 Rural: this grouping is comprised of all rural residential properties and those that would
be traditionally classified as suburban, since there is no separate suburban market within
the County.
22 Whitney: a village in Dawes County located between Chadron and Crawford.
AG Agricultural homes and outbuildings.
3. List and describe the approach(es) used to estimate the market value of residential
properties.
The cost approach.
4. If the cost approach is used, does the County develop the depreciation study(ies) based on
local market information or does the county use the tables provided by the CAMA vendor?
The tables provided by the CAMA vendor.
5. Are individual depreciation tables developed for each valuation grouping?
No.
6. Describe the methodology used to determine the residential lot values?
By a review of sales, market values of vacant lots are compiled for each valuation grouping.
7. Describe the methodology used to determine value for vacant lots being held for sale or
resale?
There are currently no blocks of vacant lots being held for sale or resale in the County.
8. Valuation
Grouping
Date of
Costing
Date of
Lot Value Study
Date of
Last Inspection
Date of
Depreciation Tables
10 2013 2013 2017 2017
16 2013 2013 2012 2012
20 2013 2013 2016 2016
22 2013 2013 2013 2013
AG 2013 2013 2016 2016
23 Dawes Page 53

23 Dawes Page 54

2017 Commercial Assessment Survey for Dawes County
1. Valuation data collection done by:
The Assessor, her staff and Stanard Appraisal.
List the valuation groupings recognized in the County and describe the unique characteristics
of each:
2.
Description of unique characteristicsValuation
Grouping
10 Chadron: all commercial property within the city of Chadron.
16 Crawford: the commercial parcels within the town of Crawford.
20 Rural: all commercial parcels outside of the towns and villages of Dawes County and
includes the commercial parcels that would traditionally be classified as suburban, since
there is no separate suburban commercial market.
22 Whitney: any commercial enterprise located in the village of Whitney.
3. List and describe the approach(es) used to estimate the market value of commercial
properties.
The cost, income and market approaches are used.
3a. Describe the process used to determine the value of unique commercial properties.
The same three approaches to estimate market value would be used to address unique commercial
properties.
4. If the cost approach is used, does the County develop the depreciation study(ies) based on
local market information or does the county use the tables provided by the CAMA vendor?
The tables provided by the CAMA vendor are used.
5. Are individual depreciation tables developed for each valuation grouping?
No.
6. Describe the methodology used to determine the commercial lot values.
Commercial lot values are determined by current vacant lot sales.
7. Date of
Depreciation Tables
Valuation
Grouping
Date of
Costing
Date of
Lot Value Study
Date of
Last Inspection
10 2013 2013 2013 2013
16 2013 2013 2013 2013
20 2013 2013 2013 2013
22 2013 2013 2013 2013
23 Dawes Page 55

2017 Agricultural Assessment Survey for Dawes County
1. Valuation data collection done by:
The Assessor and her staff.
List each market area, and describe the location and the specific characteristics that make
each unique.
2.
Year Land Use
Completed
Description of unique characteristicsMarket
Area
1 This agricultural market area is the uninfluenced northern portion of
Dawes County, and consists primarily of agricultural use despite lower
land capability with little water available for crop production, irrigation
and livestock.
2015
3 This area's geographical location is primarily the Pine Ridge and includes
trees and bluffs; it also exhibits a market demand that exceeds that of pure
agricultural use. This area has absorbed some of what was previously area
two, depending on non-agricultural influence in this area.
2015
4 This agricultural market area is located in the southern portion of the
county and consists of higher quality land capability with irrigated lands
and water availability for higher production of crops and livestock.
2015
3. Describe the process used to determine and monitor market areas.
Sales within the three market areas, coupled with sales data verification are used to determine
any necessary changes. Examination of influenced sales versus uninfluenced agricultural sales is
used to confirm the need for special value in the county.
4. Describe the process used to identify rural residential land and recreational land in the
county apart from agricultural land.
Rural residential land in Dawes County is identified as parcels of less than eighty acres that have
a home; further, the primary use of the land does not meet the definition of agricultural use.
Recreational land is used primarily for diversion and/or relaxation, not for
agricultural/horticultural production.
5. Do farm home sites carry the same value as rural residential home sites? If not, what are
the market differences?
All home sites are valued the same. Only the first acre of an unimproved parcel would have a
different value.
6. If applicable, describe the process used to develop assessed values for parcels enrolled in
the Wetland Reserve Program.
Currently, there are no known parcels enrolled in the Wetland Reserve Program in the county.
If your county has special value applications, please answer the following
7a. How many special valuation applications are on file?
2,583
7b. What process was used to determine if non-agricultural influences exist in the county?
23 Dawes Page 56
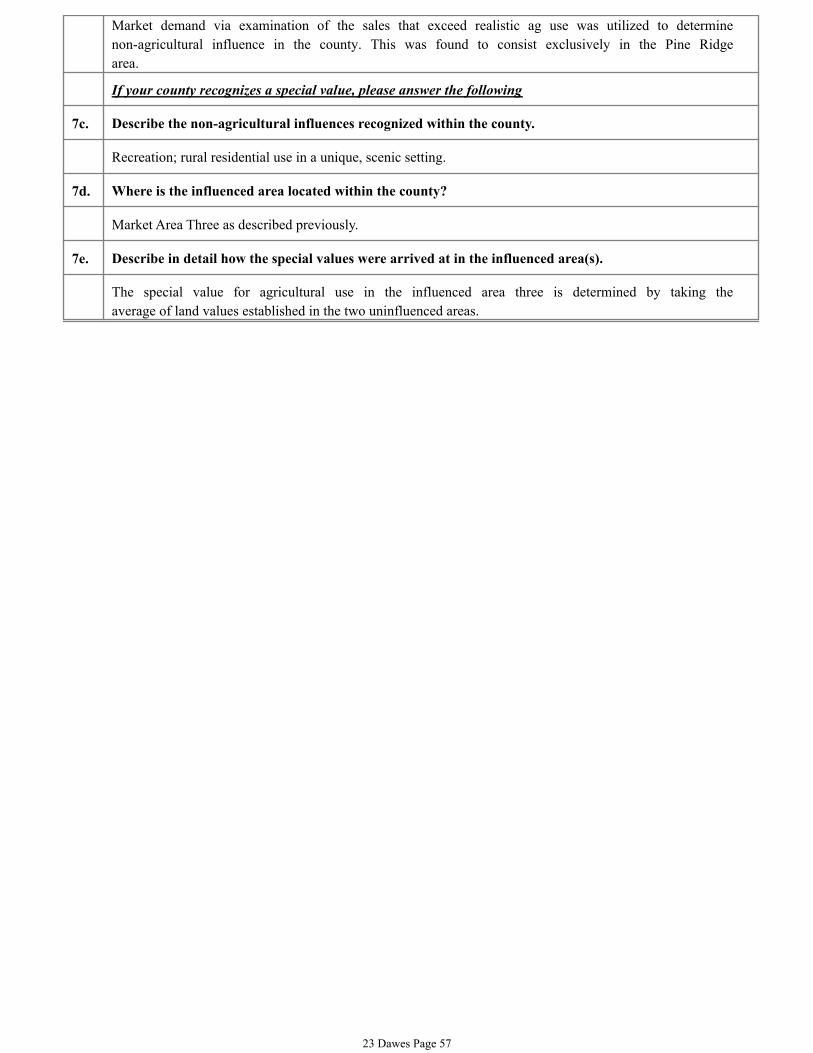
Market demand via examination of the sales that exceed realistic ag use was utilized to determine
non-agricultural influence in the county. This was found to consist exclusively in the Pine Ridge
area.
If your county recognizes a special value, please answer the following
7c. Describe the non-agricultural influences recognized within the county.
Recreation; rural residential use in a unique, scenic setting.
7d. Where is the influenced area located within the county?
Market Area Three as described previously.
7e. Describe in detail how the special values were arrived at in the influenced area(s).
The special value for agricultural use in the influenced area three is determined by taking the
average of land values established in the two uninfluenced areas.
23 Dawes Page 57

3 YEAR PLAN OF ASSESSMENT
ROBERTA “LINDY” COLEMAN
DAWES COUNTY ASSESSOR
2017 Tax Year
Review Chadron Parcels
New Pictures for files
GIS Updates
Review and update Assessor Locations
Review and update Market Area Boundaries
2018 Tax Year
Review Crawford Parcels
New pictures for files
GIS Updates
Review and Update Assessor Locations
Review and Update Market Area Boundaries
2019 Tax Year
Review Whitney, Marsland & Kenwood Parcels
New pictures for files
GIS Updates
Review and Update Assessor Locations
Review and Update Market Area Boundaries
23 Dawes Page 58

Dawes County Agriculture Land Sales Criteria
Special Agriculture Value
Tax Year 2017
Dawes County is using “Special value” for tax year 2017. The special agriculture
value will be used on a county wide basis.
The county is divided into three agriculture market areas with each market area
analyzed separately. Market area 1 and 4 includes the north and south portions of the
county and is primarily used for agriculture.
Market area 3, the Pine Ridge area, includes trees and bluffs and has a market
demand that exceeds agriculture use.
Although both market areas 1 and 4 are both utilized for primarily agriculture
purposes, there are significant differences in the two market areas. Market area 1, the
northern portion of the county consists primarily of lower land capability with little water
available for crop production, irrigation and livestock. Market area 4, the southern
portion of the county consists of higher quality land capability with irrigated lands and
water availability for higher production of crops and livestock.
An average of the agriculture land values established for market area 1 and 4 are
utilized for the special value of agriculture land in market areas 3.
Following is the criteria used to select the sales that are utilized in the analysis to
estimate the accurate agriculture value.
Sales included in analysis:
A. Sales that do not include improvements or with improvements
which are valued less than 5% of the sales price.
B. All other agriculture land sales not specifically excluded below.
Sales excluded from analysis:
A. Sales less than 80 acres (valued on size basis)
B. Sales within market area 3.
C. Sales immediately in the Chadron and Crawford area.
D. Sales that include one or more of the influencing factors shown
above.
23 Dawes Page 59