the conductivity of aqueous solutions of lanthanum...
TRANSCRIPT

T he conductivity of aqueous solutions oflan thanum ferricyanide
B y C. W . D a v ie s a n d J . C. J am es
University College of Wales, Aberystwyth, and Battersea Polytechnic
(Communicated by J . Kenyon, F.R.S— Received 20 February 1948)
The conductivity of lanthanum ferricyanide in water has been measured at 18, 25 and 30° C. In dilute solutions the salt shows the behaviour of a comparatively weak electrolyte, and when the limiting Debye-Huckel and Onsager equations are applied to thirty measurements at ionic strengths lower than 0-002, a constant valued = 1-82 x 10“4 is found for its dissociation constant at 25° C. The dissociation constants at 18 and 30° C have also been calculated, and hence AH, AO and AS for dissociation.
At the higher concentrations the conductivity curve shows abnormalities which find a reasonable explanation in the theory that the degree of dissociation falls to a minimum value of approximately 0-5, and increases again at higher concentrations.
The composition of the hydrate stable at room temperature is found to be LaFe(CN)6,5H20. One molecule of water is readily lost over concentrated sulphuric acid, and this may account for the lower degrees of hydration reported in the literature.
The object of this work was to add to existing knowledge of aqueous salt solutions by studying the conductivity of a ter-tervalent electrolyte. Lanthanum ferricyanide was chosen as being a typical salt, not subject to hydrolysis in dilute solutions, and with a reasonable solubility.
P r epa r a tio n a n d com position of th e h y d r a t e
Lanthanum oxide was purified by three times precipitating the oxalate from neutral solution and igniting the well-washed oxalate at 950° C. I t was then dissolved in the stoichiometric quantity of dilute hydrochloric acid, and the solution filtered, cooled and diluted to give a concentration of 1 g. La20 3 per 25 ml. solution (cf. Prandtl & Mohr 1938). The calculated volume of cold saturated potassium ferricyanide solution, prepared from the recrystallized salt, was added, and the solution allowed to stand in the dark. Crystallization was complete after 4 days, and the crystals were drained off, washed with cold water, and allowed to stand in a desiccator over a partly dehydrated specimen of the salt. Constant weight was attained after 6 weeks.
The composition of the crystals was determined by estimating the ferricyanide content iodometrically, as recommended by Kolthoff (1922). Two separate samples gave mean results of 100-20 and 99-94 % LaFe(CN)6,5H20, and this formula was therefore adopted (m = 440-89). Prandtl & Mohr give the formula of the salt as LaFe(CN)6,4 |H 20 ; their salt was dried over concentrated sulphuric acid. Grant & James (1917). who also prepared the salt, do not give their method of drying but state that the composition is ‘practically in agreement w ith’ the formula LaFe(CN)6,4H20. To discover whether these discrepancies are due to the method of drying we allowed two samples of our salt to stand over concentrated sulphuric
[ 116 ]
on May 27, 2018http://rspa.royalsocietypublishing.org/Downloaded from

acid in a vacuum desiccator. They steadily lost in weight, and an apparent equilibrium was reached after 1 month, when the final weights were 96-16 and 96-11 % of the respective original weights. This is consistent with dehydration from LaFe(CN)6,5H20 to LaFe(CN)6,4H20, which would require a decrease to 95-92 % of the original weight.
E x pe r im e n t a l m eth o d s
The conductivity measurements were made with the apparatus and technique previously described (Davies 1937). Temperatures were checked by two thermometers calibrated at the National Physical Laboratory. Conductivities were measured at two or more frequencies. For the most dilute solutions a Hartley & Barrett cell with ‘greyed’ platinum electrodes was employed; this was standardized by carrying out several series of measurements with potassium chloride a t concentrations extending up to one-thousandth normal, and comparing the results of these with conductivities calculated from the interpolation formula
A = 149*92 — 93-85(7* + 50(7(Davies 1937). For the more concentrated solutions cells of the Washburn type were used, modified as recommended by Jones & Bollinger (1931). These were calibrated by means of Jones & Bradshaw’s (1933) value for 0-01D potassium chloride at 25° C.
The density of the crystals was determined for the purpose of buoyancy corrections, and found to be 2-045 at 25° C. Marsh (1947) has recently reported the value 2-044. Density measurements were also made for the more concentrated solutions studied, using 5 ml. pyknometers of the Sprengel type. Within the needed accuracy the densities a t 25° C are represented by the equation df5 = 0-99707 + 0-090(7, C being the equivalent concentration.
The measured conductivity was corrected in every case for the conductivity of the solvent, allowance being made in the correction for interionic attraction effects (Davies 1929). The corrected results are in figure 1 and in tables 1, 2 and 3. Tables 1 and 2 give all our measurements at 18 and 30° C, but, to save space, interpolated values are given in table 3 for the more dilute solutions at 25° C.
D il u t e so lu tio n s at 25° C
At 25° C an independent value of the conductivity at infinite dilution may be calculated from the relation A0LaCl3-t- A0K 3Fe(CN)6 — A0KC1 = A0LaFe(CN)6. Unfortunately, there is a considerable uncertainty in the result of this calculation, mainly on account of the long extrapolation involved in obtaining the lanthanum chloride value from Jones & Bickford’s data (1934); Owen (1939) derived the value 145-8, whereas Hartley & Donaldson (1937), from the same data, obtained a value more than a unit lower. An independent A0 value is of advantage, however, in a preliminary discussion of the results, and we will temporarily combine Owen’s value for lanthanum chloride with Hartley & Donaldson’s figure A0 = 174-4 for potassium ferricyanide, and A0 = 149-9 for potassium chloride (Davies 1937) to give the approximate value A0 = 170-3 for lanthanum ferricyanide. We derive a value from our own measurements later.
Conductivity of lanthanum ferricyanide 117
on May 27, 2018http://rspa.royalsocietypublishing.org/Downloaded from

118 C. W. Davies and J. C. James
In figure 1 are plotted all our measurements below one-thousandth normal. The figure also shows the line predicted for the completely dissociated salt by Onsager’s equation which, using the physical constants given by Birge (1941), takes the form A = 170*3 — 918-3(7*. I t will be seen that the experimental conductivities can only be reconciled with the limiting value, and with the theoretical limiting slope, by attributing to the salt a conductivity curve of the type characteristic of weak electrolytes. We have accordingly treated the data in the way now commonly applied to weak acids (Davies 1927). The degree of dissociation is calculated from the equation ot = A/[170-3- 918*3x/(a(7)], and the logarithm of the apparent
170
150
A130
110
F igure 1. Equivalent conductivity at 25° C . ------- Onsager slope.
dissociation constarit, K ' = a 2(7/3(l — a), derived in this way, is plotted in curve 1 of figure 2 against the square root of the ionic strength ( — 3 The line throughthe points is drawn with the slope required by the limiting Debye-Hiickel equation — l°g/± = 9-164/*, and the agreement with experiment is very good except at the lowest concentrations (m< 0-00005), where the slight falling away of the experimental points can be fully explained by the possible error in the A0 value used. If, therefore, the ions of this ter-tervalent salt obey Onsager’s equation at high dilutions, as was assumed in calculating the degrees of dissociation, then they also obey the Debye- Huckel limiting equation. Doubts have been expressed of the applicability of the limiting equations to highly charged ions, but clearly the probability here is that both equations are obeyed, as they are by ions of lower charge, though over a more restricted concentration range. That the points shown in figure 2 lie on straight lines up to the highest ionic strength shown (0-002) does not imply that the limiting equations hold accurately up to this value; rather it may be supposed that the
on May 27, 2018http://rspa.royalsocietypublishing.org/Downloaded from
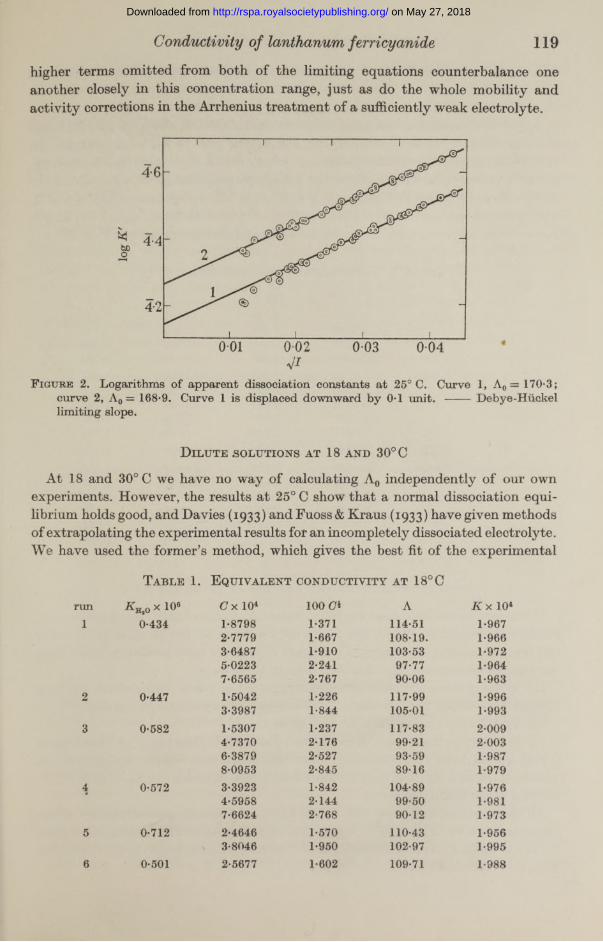
higher terms omitted from both of the limiting equations counterbalance one another closely in this concentration range, just as do the whole mobility and activity corrections in the Arrhenius treatment of a sufficiently weak electrolyte.
Conductivity of lanthanum ferricyanide 119
F igure 2. Logarithms of apparent dissociation constants at 25° C. Curve 1, A0 = 170*3;curve 2, A0 = 168*9. Curve 1 is displaced downward by 0*1 unit. ------ Debye-Huckellimiting slope.
D il u t e so l u t io n s at 18 a n d 30° C
At 18 and 30° C we have no way of calculating A0 independently of our own experiments. However, the results a t 25° C show that a normal dissociation equilibrium holds good, and Davies (1933) and Fuoss & Kraus (1933) have given methods of extrapolating the experimental results for an incompletely dissociated electrolyte. We have used the former’s method, which gives the best fit of the experimental
T a ble 1. E q u iv a l e n t c o n d u c tiv ity at 18°C
rim K h2o X 106 C x 10* 100 Cl A K x 1041 0*434 1*8798 1*371 114*51 1*967
2*7779 1*667 108*19. 1*9663*6487 1*910 103*53 1*9725*0223 2*241 97*77 1*9647*6565 2*767 90*06 1*963
2 0*447 1*5042 1*226 117*99 1*9963*3987 1*844 105*01 1*993
3 0*582 1*5307 1*237 117*83 2*0094*7370 2*176 99*21 2*0036*3879 2*527 93*59 1*9878*0953 2*845 89*16 1*979
4 0*572 3*3923 1*842 104*89 1*9764*5958 2*144 99*50 1*9817*6624 2*768 90*12 1*973
5 0*712 2*4646 1*570 110*43 1*9563*8046 1*950 102*97 1*995
6 0*501 2*5677 1*602 109*71 1*988
on May 27, 2018http://rspa.royalsocietypublishing.org/Downloaded from

120 C. W. Davies and'J. C. James
points on the assumption that the limiting Onsager and Debye-Hiickel equations simultaneously apply to these dilute solutions. The values obtained are: a t 18° C, A0 = 144-1; a t 30° C, A0 = 188-0.
Apparent dissociation constants were next calculated, as was done at 25° C, and the logarithms of these plotted against the square root of the ionic strength. In both cases agreement with the theoretical Debye-Hiickel slope was very satisfactory. Finally, values of the thermodynamic dissociation constants were calculated for each individual point, and these are given in the last columns of tables 1 and 2. The mean values are: at 18° C, K = l-980x 10~4, and at 30° C, K — l-726x 10-4, the average deviation from the mean, at each temperature, being 0-01 x 10-4.
T a b l e 2. E q u iv a l e n t c o n d u c tiv ity at 30° C
run K Ui0 x 10« C x 104 100 C* A K x 1041 0-407 0-8871 0-942 160-16 (1-628)
1-3326 1-154 153-57 1-7103-0275 1-740 136-02 1-7004-4058 2-099 127-16 1-702
2 0-462 1-7124 1-309 149-06 1-744J-0406 1-625 139-80 1-753
4 37*2 2-091 127-98 1-7466 5309 2-556 118-20 1-7398-5010 2-916 111-75 1-733
3 0-692 10-258 3-203 107-01 1-7164 0-453 1-1522 1-073 156-32 1-712
2-4349 1-560 141-37 1-7333-3436 1-829 134-09 1-7294-8437 2-201 125-26 1-7356-2092 2-492 119-20 1-7247-1684 2-677 115-65 1-723
I n terco m pariso n of th e r e su l t s at 18, 25 a n d 30° C
I t has been mentioned that the independent A0 value a t 25° C is subject to considerable uncertainty. Before comparing our results at 25° C with those a t the other two temperatures it was therefore necessary to derive a more precise A0 value from our own measurements. This has been done in three ways:
(1) by using the extrapolation method suggested by Owen (1939), which has been applied successfully to other electrolytes in which ion-association is marked;
(2) by extrapolating in the same way as a t 18 and 30° C;(3) by interpolating from the results a t 18 and 30° C. The equation of Johnston
(1909) should hold very accurately over this short temperature range, and the values a t 18 and 30° C give the constants in this equation as A0 = 1-83100'9595, where <f> is the fluidity of water.
All three methods give the value A0 = 168-9, corresponding to a mobility of the lanthanum ion, a t 25° C of 68-1. Using this value instead of 170-3, calculation gives curve 2 of figure 2, in place of curve 1, and the dissociation constant at 25° C becomes l-825x 10~4± 0-015 x 10-4.
on May 27, 2018http://rspa.royalsocietypublishing.org/Downloaded from

By inserting our three dissociation constants in the van’t Hoff isochore, assuming constancy of A Hover these small temperature intervals, we derive the values: AH = -2-Ojkcal. between 18 and 25° C, -2 -0 3kcal. between 25 and 30° C, and — 2-0akcal. between 18. and 30° C. We further obtain A G ^ ^ = 5094 cal., and A$298-i = — 23*9 e.u. for the dissociation process. An interesting feature of these results is th a t the values found for AH and AS are comparatively small; although the range studied is insufficient to give a reliable figure for ACp it seems clear that this also has a small value. The formation of an ion-pair, therefore, does not seem to involve a very drastic alteration in the large hydration energy of the lanthanum ion.
The same conclusion is reached when the results are examined in the light of the ion-association theory of Bjerrum (1926). When our dissociation constants are inserted in Bjerrum’s equation the values obtained for the closest distance of approach of the ionic centres are: a t 18° C, 7-23A; a t 25° C, 7-20A; and a', 30°C, 7-20A. The quantitative accuracy of the Bjerrum treatm ent can be questioned on several grounds; nevertheless, the value obtained does suggest that a t least one molecule of water is included in the effective radius of the lanthanum ion. Moreover, the constancy of the mean ionic diameter shows tha t Bjerrum’s electrostatic treatment, employing the normal dielectric constant of water, is adequate to explain the temperature dependence of the dissociation constant.
Conductivity of lanthan 121
M ore c o n c en tr a ted so l u t io n s
Measurements a t 25° C, extending almost to saturation, are shown in table 3 and in curve 1 of figure 3.
T a b l e 3. E q u iv a l e n t c o n d u c t iv it ie s at 25° CC x 104 A C x 104 A C x 104 A
1 0 144-2 46-048 68-83 270-65 49-192-0 132-3 94-568 59-23 292-01 48-765 0 112-1 130-73 55-16 294-08 48-70
10*0 98-1 138-86 54-82 348-48 47-6812-040 94-09 176-95 52-58 438-72 46-6921-118 82-64 199-51 51-35 578-40 45-5129-376 76-47 213-97 50-78
The curve is quite unlike those of weak uni-univalent electrolytes in the way that it flattens out at moderate concentrations; between 0*025 and 0*05n the conductivity decreases by less than three units. Now the equivalent conductivity curve is governed by two factors, changes in ionic mobilities due to interionic forces, and changes in the extent of ion-association; the latter, if governed by a mass-action equilibrium, depends in turn on changes in the activity coefficients and the concentration. To explain the almost constant conductivity (without recourse to an ad hoc assumption of the appearance of new ionic species) we must therefore postulate: (a) almost constant values for both mobility and degree of dissociation at the higher concentrations; this would imply mobility and activity equations quite unlike those governing electrolytes of lower valence types at comparable ionic strengths;
on May 27, 2018http://rspa.royalsocietypublishing.org/Downloaded from
122 C. W. Davies and J. C. James
(6) ionic mobilities increasing with increasing ionic strength; this is even more unlikely; or (c) degrees of dissociation increasing with increasing concentration.
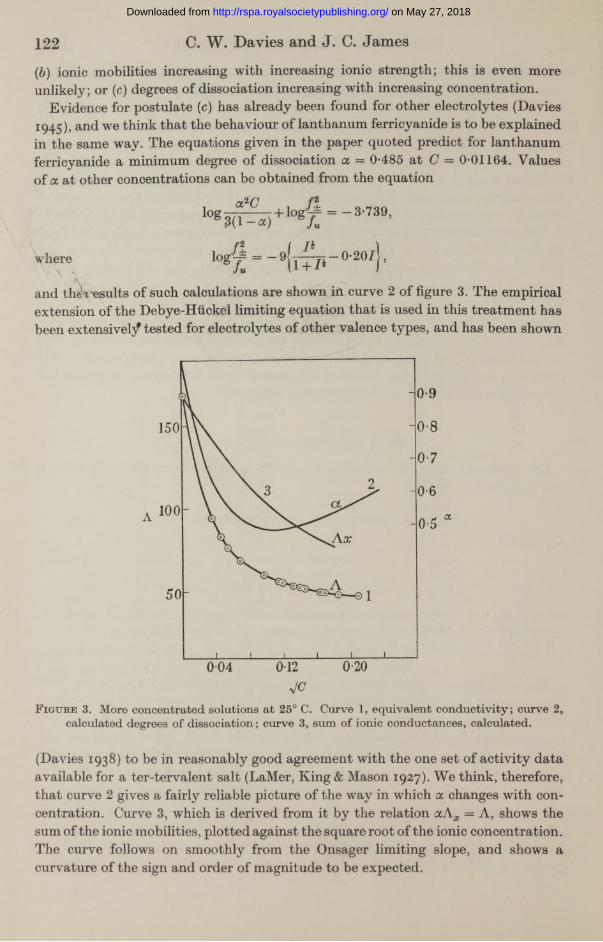
Evidence for postulate (c) has already been found for other electrolytes (Davies 1945), and we think that the behaviour of lanthanum ferricyanide is to be explained in the same way. The equations given in the paper quoted predict for lanthanum ferricyanide a minimum degree of dissociation a = 0*485 at 0*01164. Values of a at other concentrations can be obtained from the equation
^w^)+logi = ~ 3'739’
where = — ~ 0*207 j ,
and theVesults of such calculations are shown iri curve 2 of figure 3. The empirical extension of the Debye-Huckel limiting equation that is used in this treatm ent has been extensively tested for electrolytes of other valence types, and has been shown
F igure 3. More concentrated solutions at 25° C. Curve 1, equivalent conductivity; curve 2, calculated degrees of dissociation; curve 3, sum of ionic conductances, calculated.
(Davies 1938) to be in reasonably good agreement with the one set of activity data available for a ter-tervalent salt (LaMer, King & Mason 1927). We think, therefore, that curve 2 gives a fairly reliable picture of the way in which a changes with concentration. Curve 3, which is derived from it by the relation ocAx — A, shows the sum of the ionic mobilities, plotted against the square root of the ionic concentration. The curve follows on smoothly from the Onsager limiting slope, and shows a curvature of the sign and order of magnitude to be expected.
on May 27, 2018http://rspa.royalsocietypublishing.org/Downloaded from
R eferences
Birge, R. T. 1941 Rev. Mod. Phys. 13, 233.Bjerrum, N. 1926 K . danske vidensk. Selsk., M'edd. 7, 9.Davies, C. W. 1927 Phil. Mag. 4, 244.Davies, C. W. 1929 Trans. Faraday Soc. 25, 129.Davies, C. W. 1933 J . Chem. Soc. p. 645.Davies, C. W. 1937 J . Chem. Soc. p. 432.Davies, C. W. 1938 J . Chem. Soc. p. 2093.Davies, C. W. 1945 J . Chem. Soc. p. 460.Fuoss, R. M. & Kraus, C. A. 1933 J . Amer. Chem. Soc. 55, 476.Grant, A. J. & James, C. 1917 J . Amer. Chem. Soc. 39, 933.Hartley, G. S. & Donaldson, G. W. 1937 Trans. Faraday Soc. 33, 465.Johnston, J. 1909 J . Amer. Chem. Soc. 31, 1010.Jones, G. & Bollinger, G. M. 1931 J . Amer. Chem. Soc. 53, 411.Jones, G. & Bradshaw, B. C. 1933 J . Amer. Chem. Soc. 55, 1780.Jones, G. & Bickford, C. F. 1934 J . Amer. Chem. Soc. 56, 606.Kolthoff, I. M. 1922 Pharm. Weekbl. 59, 66.LaMer, V. K., King, C. V. & Mason, C. F. 1927 J . Amer. Chem. Soc. 49, 363. Marsh, J. K. 1947 J . Chem. Soc. p. 1084.Owen, B. B. 1939 J . Amer. Chem. Soc. 61, 1393.Prandtl, W. & Mohr, S. 1938 Z. anorg. Chem. 236, 243.
Conductivity of lanthanum ferr icy anide 123
An investigation of the neutrons produced in the deuteron-deuteron reaction
B y D. L. Livesey , St John’s College, and D. H. W ilkinson, Jesus College,University of Cambridge
{Communicated by Sir John Cockcroft, — Received 27 February 1948)
Some properties of the JH + = 2He + \n reaction are investigated by the photographicplate technique for a bombarding deuteron energy of 920 keV. Thick deuterium targets only are used, and the following quantities measured:
(a) The Q value—found to be (3*23 ±0*02) MeV.(b) The neutron spectra at various angles of neutron emission.(c) The angular distribution of the neutrons.The problems arising in the application of the technique to the precision determination of
neutron energy are discussed and the previous precision determination of the Q value by Bonner is criticized. The present results are in good agreement with the Q value of the reaction + and the maximum energy of the JH /7-spectrum. The neutronspectra are in accord with those calculated from the ballistics of the reaction and the known excitation function. The neutron angular distribution shows a marked maximum in the forward direction and a minimum at 90° to the deuteron beam.
Introduction
The emission of neutrons in the disintegration of deuterons by deuterons was first reported by Oliphant, Harteck & Rutherford (1934), who ascribed it to the reaction
fH + fH = IHe + Jw.This reaction is extremely important because of the simplicity of the particles involved, and because it has been widely used to provide sources of fast neutrons of known energy. The properties of the reaction have been investigated by several authors, and the most important results are summarized below.
on May 27, 2018http://rspa.royalsocietypublishing.org/Downloaded from