the class v underground injection control study … · the class v underground injection control...
TRANSCRIPT
United States Office of Ground Water EPA/816-R-99-014cEnvironmental and Drinking Water (4601) September 1999Protection Agency
The Class V Underground InjectionControl Study
Volume 3
Storm Water Drainage Wells
September 30, 1999
Table of ContentsPage
1. Summary . . . . . . . . . . . . . . . . . . . . . . . . . . . . . . . . . . . . . . . . . . . . . . . . . . . . . . . . . . . . . . . 1
2. Introduction . . . . . . . . . . . . . . . . . . . . . . . . . . . . . . . . . . . . . . . . . . . . . . . . . . . . . . . . . . . . . 4
3. Prevalence of Wells . . . . . . . . . . . . . . . . . . . . . . . . . . . . . . . . . . . . . . . . . . . . . . . . . . . . . . . 53.1 Review of Literature . . . . . . . . . . . . . . . . . . . . . . . . . . . . . . . . . . . . . . . . . . . . . . . . . 63.2 General Data Collection . . . . . . . . . . . . . . . . . . . . . . . . . . . . . . . . . . . . . . . . . . . . . . 63.3 Inventory Model . . . . . . . . . . . . . . . . . . . . . . . . . . . . . . . . . . . . . . . . . . . . . . . . . . . 93.4 Factors Affecting Use and Prevalence of Wells . . . . . . . . . . . . . . . . . . . . . . . . . . . . 11
3.4.1 Housing and Population Density . . . . . . . . . . . . . . . . . . . . . . . . . . . . . . . . . 113.4.2 Development . . . . . . . . . . . . . . . . . . . . . . . . . . . . . . . . . . . . . . . . . . . . . . . 123.4.3 Historical and Political Practices . . . . . . . . . . . . . . . . . . . . . . . . . . . . . . . . . 123.4.4 Geological Characteristics and Rainfall . . . . . . . . . . . . . . . . . . . . . . . . . . . . 12
3.5 Future Use of Storm Water Wells . . . . . . . . . . . . . . . . . . . . . . . . . . . . . . . . . . . . . . 13
4. Injectate Characteristics and Injection Practices . . . . . . . . . . . . . . . . . . . . . . . . . . . . . . . . . 144.1 Injectate Characteristics . . . . . . . . . . . . . . . . . . . . . . . . . . . . . . . . . . . . . . . . . . . . . 14
4.1.1 Inorganic Constituents . . . . . . . . . . . . . . . . . . . . . . . . . . . . . . . . . . . . . . . . 214.1.2 Organic Constituents . . . . . . . . . . . . . . . . . . . . . . . . . . . . . . . . . . . . . . . . . 254.1.3 Biological/Microorganism Constituents . . . . . . . . . . . . . . . . . . . . . . . . . . . . 27
4.2 Well Characteristics . . . . . . . . . . . . . . . . . . . . . . . . . . . . . . . . . . . . . . . . . . . . . . . . 274.2.1 Dug Wells . . . . . . . . . . . . . . . . . . . . . . . . . . . . . . . . . . . . . . . . . . . . . . . . . 284.2.2 Bored Wells . . . . . . . . . . . . . . . . . . . . . . . . . . . . . . . . . . . . . . . . . . . . . . . . 334.2.3 Lake Level Control Wells . . . . . . . . . . . . . . . . . . . . . . . . . . . . . . . . . . . . . 354.2.4 Improved Sinkholes . . . . . . . . . . . . . . . . . . . . . . . . . . . . . . . . . . . . . . . . . . 36
4.3 Operational Issues and Concerns . . . . . . . . . . . . . . . . . . . . . . . . . . . . . . . . . . . . . . 374.3.1 The Impacts of Siting and Land Use on Injectate . . . . . . . . . . . . . . . . . . . . . 37
5. Potential and Documented Damage to USDWs . . . . . . . . . . . . . . . . . . . . . . . . . . . . . . . . . 405.1 Injectate Constituent Properties . . . . . . . . . . . . . . . . . . . . . . . . . . . . . . . . . . . . . . . 405.2 Observed Impacts . . . . . . . . . . . . . . . . . . . . . . . . . . . . . . . . . . . . . . . . . . . . . . . . . 41
5.2.1 Storm Water Drainage Well Contamination Incidents . . . . . . . . . . . . . . . . . 415.2.2 Storm Water Drainage Wells: Other Contamination
Incidents and Studies . . . . . . . . . . . . . . . . . . . . . . . . . . . . . . . . . . . . . . . . . 445.2.3 Lake Level Control Wells Contamination Incidents . . . . . . . . . . . . . . . . . . . 45
6. Best Management Practices . . . . . . . . . . . . . . . . . . . . . . . . . . . . . . . . . . . . . . . . . . . . . . . . 466.1 Siting BMPs . . . . . . . . . . . . . . . . . . . . . . . . . . . . . . . . . . . . . . . . . . . . . . . . . . . . . . 46
6.1.1 Minimum Setback Distance from Surface Waters . . . . . . . . . . . . . . . . . . . . 47
Table of Contents (cont’d)Page
September 30, 1999
6.1.2 Minimum Setback Distance from Drinking Water Wells . . . . . . . . . . . . . . . 486.1.3 Minimum Separation from Water Table . . . . . . . . . . . . . . . . . . . . . . . . . . . 486.1.4 Prohibition from Some Areas of Critical Concern . . . . . . . . . . . . . . . . . . . . 486.1.5 Minimum Engineering Design/Soil Performance Specifications . . . . . . . . . . . 48
6.2 Design BMPs . . . . . . . . . . . . . . . . . . . . . . . . . . . . . . . . . . . . . . . . . . . . . . . . . . . . . 496.2.1 Sediment Removal . . . . . . . . . . . . . . . . . . . . . . . . . . . . . . . . . . . . . . . . . . . 496.2.2 Oil and Grease Separators . . . . . . . . . . . . . . . . . . . . . . . . . . . . . . . . . . . . . 516.2.3 Additional Pretreatment System BMPs . . . . . . . . . . . . . . . . . . . . . . . . . . . . 556.2.4 Studies on the Effectiveness of Pretreatment System BMPs . . . . . . . . . . . . . 57
6.3 Operational BMPs . . . . . . . . . . . . . . . . . . . . . . . . . . . . . . . . . . . . . . . . . . . . . . . . . 596.3.1 Source Separation . . . . . . . . . . . . . . . . . . . . . . . . . . . . . . . . . . . . . . . . . . . 596.3.2 Pollution Prevention Planning . . . . . . . . . . . . . . . . . . . . . . . . . . . . . . . . . . . 616.3.3 Spill Response . . . . . . . . . . . . . . . . . . . . . . . . . . . . . . . . . . . . . . . . . . . . . . 636.3.4 Operational BMPs for Common Site Activities . . . . . . . . . . . . . . . . . . . . . . 636.3.5 Monitoring BMPs . . . . . . . . . . . . . . . . . . . . . . . . . . . . . . . . . . . . . . . . . . . 646.3.6 Maintenance BMPs . . . . . . . . . . . . . . . . . . . . . . . . . . . . . . . . . . . . . . . . . . 65
6.4 Education and Outreach BMPs to Prevent Misuse . . . . . . . . . . . . . . . . . . . . . . . . . 656.5 BMPs for Properly Closing, Plugging and Abandoning Storm
Water Drainage Wells . . . . . . . . . . . . . . . . . . . . . . . . . . . . . . . . . . . . . . . . . . . . . . 67
7. Current Regulatory Requirements . . . . . . . . . . . . . . . . . . . . . . . . . . . . . . . . . . . . . . . . . . . . 687.1 Federal Programs . . . . . . . . . . . . . . . . . . . . . . . . . . . . . . . . . . . . . . . . . . . . . . . . . . 68
7.1.1 SDWA . . . . . . . . . . . . . . . . . . . . . . . . . . . . . . . . . . . . . . . . . . . . . . . . . . . 687.1.2 CWA . . . . . . . . . . . . . . . . . . . . . . . . . . . . . . . . . . . . . . . . . . . . . . . . . . . . 707.1.3 CZMA and CZARA . . . . . . . . . . . . . . . . . . . . . . . . . . . . . . . . . . . . . . . . . 717.1.4 FHWA Guidance . . . . . . . . . . . . . . . . . . . . . . . . . . . . . . . . . . . . . . . . . . . . 72
7.2 State and Local Programs . . . . . . . . . . . . . . . . . . . . . . . . . . . . . . . . . . . . . . . . . . . 727.3 Survey of Local Storm Water Utilities . . . . . . . . . . . . . . . . . . . . . . . . . . . . . . . . . . . 73
Attachment A: State and Local Program Descriptions . . . . . . . . . . . . . . . . . . . . . . . . . . . . . . . . . . . 74
References . . . . . . . . . . . . . . . . . . . . . . . . . . . . . . . . . . . . . . . . . . . . . . . . . . . . . . . . . . . . . . . . . . . 88
September 30, 1999 1
STORM WATER DRAINAGE WELLS
The U.S. Environmental Protection Agency (USEPA) conducted a study of Class Vunderground injection wells to develop background information the Agency can use to evaluate the riskthat these wells pose to underground sources of drinking water (USDWs) and to determine whetheradditional federal regulation is warranted. The final report for this study, which is called the Class VUnderground Injection Control (UIC) Study, consists of 23 volumes and five supporting appendices. Volume 1 provides an overview of the study methods, the USEPA UIC Program, and general findings. Volumes 2 through 23 present information summaries for each of the 23 categories of wells that werestudied (Volume 21 covers 2 well categories). This volume, which is Volume 3, covers Class V stormwater drainage wells.
1. SUMMARY
Storm water drainage wells are used extensively throughout the country to remove storm wateror urban runoff (e.g., precipitation and snowmelt) from impervious surfaces such as roadways, roofs,and paved surfaces to prevent flooding, infiltration into basements, etc. The primary types of stormwater drainage wells are bored wells, dug wells, and improved sinkholes. In addition, “lake levelcontrol wells” are used to drain lakes to prevent overflow following heavy precipitation. Subsurfacedisposal of storm water is prevalent in places where there is not enough space for, or site characteristicsdo not allow, retention basins; where there is not a suitable surface water to receive the runoff; orwhere near-surface geologic conditions provide an attractive drainage zone.
The runoff that enters storm water drainage wells may be contaminated with sediments,nutrients, metals, salts, fertilizers, pesticides, and/or microorganisms. Storm water sampling dataindicate that concentrations of antimony, arsenic, beryllium, cadmium, chromium, cyanide, lead,mercury, nickel, nitrate, selenium, and certain organics (e.g., benzene, benzo(a)pyrene, bis(2-ethylhexyl) phthalate, chlordane, dichloromethane, pentachlorophenol, tetrachloroethylene, andtrichloroethylene) in storm water runoff have exceeded primary maximum contaminant levels (MCLs). Available sampling data also show that concentrations of aluminum, chloride, copper, iron, manganese,total dissolved solids (TDS), zinc, and methyl tert-butyl ether have exceeded secondary MCLs orhealth advisory levels (HALs). Water quality data from Florida indicate that lake level control wellinjectate has exceeded primary MCLs or HALs for turbidity, arsenic, pentachlorophenol, and fecalcoliforms, as well as secondary MCLs for iron, manganese, pH, and color. Some of these samestudies, however, report that no adverse effects on ground water were detected. In addition, someindustry representatives assert that the quality of storm water drainage should be better today thanreported in some of these studies, which predate the use of best management practices (BMPs)required under the National Pollutant Discharge Elimination System (NPDES) program.
In general, the point of injection for most storm water drainage wells is into sandy, porous soils,a permeable coarse-grained unit, karst, or a fractured unit because these types of formations can
September 30, 1999 2
readily accept large volumes of fluids. Such hydrogeologic characteristics usually allow contaminants tomigrate readily into ground water without significant attenuation.
Contamination related to storm water drainage wells has been reported to various degrees inOhio, Kansas, Wisconsin, California, Washington, Arizona, Oklahoma, Tennessee, New York,Indiana, Florida, Kentucky, and Maryland. Several studies, however, do not clearly distinguishcontamination from storm water drainage wells versus more general, nonpoint source pollution. Thefollowing three examples demonstrate cases in which storm water drainage wells have contributed to orcaused ground water contamination.
• In 1989, a commercial petroleum facility in Fairborn, Ohio accidentally released 21,000 gallonsof fuel oil that overflowed a diked area and entered two storm water drainage wells.
• In 1980, organic solvent contamination was discovered in drinking water supply wells forLakewood, Washington following the disposal of organic waste solvents and sludge in leachpits and storm water drainage wells at McChord Air Force Base.
• In 1998, the Oak Grove, Kentucky water plant (a ground water system) was shut down due toa sharp increase in raw turbidity following a severe storm event.
Lake level control wells have been associated with two documented contamination incidents. The first occurred in 1993 when private drinking water wells in Lake Orienta, Altamonte Springs,Florida, were contaminated. In 1998, private wells in Lake Johio, Orange County, Florida, werecontaminated by fluids released into lake level control wells.
As illustrated by some of these incidents, storm water drainage wells are generally vulnerable tospills or illicit discharges of hazardous substances, as they are often located in close proximity toroadways, parking lots, and commercial/industrial loading facilities where such substances are handledand potentially released. The use of a number of BMPs can reduce the likelihood of contamination,including siting, design, and operation BMPs as well as education and outreach to prevent misuse, andfinally, proper closure and abandonment. However, the frequency and pattern of BMP use variesacross the country. For example, public commenters on the July 28, 1998 proposed revisions to theClass V UIC regulations cited cases in which citizens have been observed draining used motor oil intostorm water drainage wells, where no measures are in place to prohibit illicit discharges. Some lakesthat are drained by lake level control wells are also vulnerable to spills or illicit discharges.
Based on the state and USEPA Regional survey conducted for this study, there areapproximately 71,015 documented storm water drainage wells and approximately 247,522 stormwater drainage wells estimated to exist in the U.S. About 81 percent of the documented wells are inseven western states: Arizona (14,857), California (3,643), Washington (22,688), Oregon (4,148),Idaho (5,359), Montana (>4,000), and Utah (2,890). Five other states contain approximately 15percent of the total documented wells: Ohio (3,036), Florida (2,153), Michigan (1,301), Maryland(1,678), and Hawaii (2,622). There is considerable uncertainty regarding the exact number of storm
September 30, 1999 3
water drainage wells for several reasons, as described in section 3.2.2. There are approximately 200 -250 lake level control wells in Florida.
In general, the installation of new storm water drainage wells is expected to increasenationwide. Many states are allowing the installation of new wells, and with the increased regulation ofsurface discharge under the NPDES Program, there may be increased use of underground injection todispose of storm water runoff.
Some states with the majority of storm water drainage wells have developed and areimplementing regulatory programs to address these wells. Examples include the following:
• In Idaho, wells #18 feet deep are authorized by rule, while deeper wells are individuallypermitted.
• In Arizona, California, Hawaii, Florida, and Maryland, storm water drainage wells areindividually permitted.
Other states with large numbers of storm water drainage wells, however, are essentially implementingonly the minimum federal UIC requirements. In particular, Washington, Oregon, Montana, Utah, Ohio,and Michigan authorize storm water drainage wells by rule.
The regulatory structure in other states with fewer or no storm water drainage wells in thecurrent inventory is also mixed. For example, Indiana, Illinois, Wyoming, North Dakota, SouthDakota, Colorado, Kansas, Tennessee, and Rhode Island also authorize storm water drainage wells byrule. Alabama, Texas, New Hampshire, and Nebraska have a permit and registration system for stormwater drainage wells. Georgia and North Carolina ban new and existing wells. In Wisconsin, stormwater drainage wells deeper than 10 feet have been prohibited since the 1930's. Shallow storm waterdrainage wells (less than 10 feet deep) in Wisconsin were authorized by rule until 1994; since 1994,construction of any storm water drainage well has been prohibited. Storm water drainage wells thatmeet the definition of a “well” in Minnesota are prohibited. This prohibition only applies to wells thatreach ground water and not to french drains, gravel pockets, or drainfields, which normally would notmeet the definition of a well in Minnesota.
These regulatory programs in the states are augmented to a degree by programs and guidanceat the federal level. The Sole Source Aquifer Program has been used by some regions as a way to limitor prevent the use of storm water drainage wells by reviewing federal financially assisted constructionprojects in sole source aquifer areas. The Federal Highway Administration’s (FHWA’s) highwayrunoff water quality standards indirectly reference storm water. Although these are non-enforceablerecommendations only, FHWA has issued guidance that discusses BMPs, such as wet and drydetention basins, infiltration trenches and basins, and dry wells, for controlling storm water runoff andinfiltration into ground water. The Coastal Zone Management Act and Coastal Nonpoint PollutionControl Program also indirectly reference storm water in nonpoint pollution regulations; however, storm
September 30, 1999 4
water discharges controlled under the NPDES Program are exempt from the coastal nonpoint pollutioncontrol program.
2. INTRODUCTION
The removal of storm water or urban runoff is often accomplished using either detention orretention ponds, which then drain to an underground formation or to an outflow (i.e., stream), amunicipal storm or combined sewer system, or a direct subsurface disposal system (including dry wellsand improved sinkholes). The subsurface disposal of storm water into dry wells, improved sinkholes,and other devices that qualify as injection wells is prevalent in some regions where (1) space, economicfeasibility considerations, or other site characteristics preclude the use of retention basins, storm sewer,or combined sewer systems or (2) where there is no suitable receiving water. In many places, drainingexcess storm water into wells provides valuable flood control or aquifer recharge benefits.
A well is defined by USEPA in 40 CFR §144.3 as a bored, drilled or driven shaft, or a dughole, whose depth is greater than the largest surface dimension. The federal UIC regulations alsospecifically define Class V injection wells to include “drainage wells used to drain surface fluid, primarilystorm runoff, into a subsurface formation” (40 CFR 146.5(e)(4)). It should be noted that for somewells, particularly in the Class V category, fluid is introduced into the subsurface through passiveinfiltration, where it “drains” into the ground at atmospheric pressure utilizing only the head difference(i.e., pressure resulting from the difference in elevation between two points in a body of fluid) betweenthe ground surface and the receiving formation, rather than through forced injection, where fluid ispumped into the ground under pressure.
Although a variety of storm water drainage well configurations exist, dug wells, bored wells,and improved sinkholes are the most common. Lake level control wells, which were categorized as“special drainage wells” in USEPA’s 1987 Class V UIC Report to Congress (USEPA, 1987), are alsoincluded in this volume because their primary purpose is to provide flood control by draining stormwater that would otherwise overflow from lakes.
“Infiltration galleries” are also considered injection wells. These galleries consist of one or morevertical pipes leading to a horizontal, perforated pipe laid within a trench, often backfilled with gravel orsome other permeable material. Such a design is commonly used to return treated ground water ataquifer remediation sites, but is also used to facilitate storm water drainage at some sites. Each of thevertical pipes in such a system, individually or in a series, should be considered an injection well subjectto UIC authorities (Elder and Lowrance, 1992).
Other kinds of systems with a drainfield type of design are also likely to be considered injectionwells, as long as they release fluids underground as opposed to a surface water body or the landsurface. These may include french drains, tiles drains, infiltration sumps, and the like.
Injection wells, however, do not include surface impoundments, trenches, or ditches that arewider than they are deep. Therefore, although such features are commonly used to direct or retain
September 30, 1999 5
storm water runoff, they do not qualify as injection wells themselves. Storm water trenches,nevertheless, are discussed in this volume because they are often integral parts of storm water drainagesystems.
Storm water drainage well designs vary depending on the soil type, geology, and depth to thewater table. For example, storm water drainage wells range in depth from only a few feet to severalhundred feet. In some areas, wells tend to be shallower when the bedrock is near the surface. In otherareas, well depth is more closely related to permeability of the subsurface than to depth of the bedrock. Section 4.2 discusses common design characteristics of storm water drainage wells.
3. PREVALENCE OF WELLS
Many experts believe that the use of storm water drainage wells is widespread across thenation, despite the fact that less than half of the states report these wells in current inventories. Somestate officials say they have failed to identify improved sinkholes accepting storm water runoff as ClassV wells and others have had difficulty locating wells that have been operating for decades. Furthermore, the definition of storm water drainage wells may vary by state. For example, Floridaclassifies lake level control wells as storm water drainage wells. As a result of all of these factors, thepresent inventory likely does not provide an accurate estimate of the number of storm water drainagewells and may underestimate their use across the country.
The use of storm water drainage wells is more prevalent in areas that have poor surfacedrainage and intermittent, high intensity storms. Poor drainage can result from flat topography, a closeddrainage basin, soil characteristics, or the reduction of natural infiltration due to agricultural or urbanactivities (Arizona Department of Water Resources, 1993). In addition, storm water wells are found inareas lacking adequate storm sewer systems and where rapid urban expansion has out-pacedinfrastructure development. Estimates and field observations in Arizona indicate that storm waterdrainage wells are more likely to occur in industrial or commercial areas where there are more pavedsurfaces; however, storm water wells may also be located in residential areas (Arizona Department ofEnvironmental Quality, 1988).
USEPA used three different methods to help determine the numbers and patterns of use ofstorm water drainage wells across the nation. First, a comprehensive review of existing literature wasperformed to examine historical data on the prevalence of storm water wells. Next, USEPA initiated ageneral data collection effort to obtain state-specific data on Class V issues, including the use of stormwater wells. Finally, site visits to designated census tracts across the country were performed to surveystorm water drainage wells and to model their numbers at a national level. Because existing stateinventories may underestimate the actual number of storm water wells, this inventory modeling effortwas designed to provide a more accurate national picture of the prevalence of storm water wells. Discussion of these efforts and their findings follows.
September 30, 1999 6
3.1 Review of Literature
In 1998, USEPA undertook an extensive search and review of existing studies and literature onstorm water drainage wells. Studies were gathered from a variety of sources, including federal, state,and local governments, universities, research institutes, and private companies. USEPA reviewed thesestudies in an effort to gain an understanding of the current prevalence of storm water wells.
Existing literature shows that storm water drainage wells exist in a variety of areas with differingcharacteristics. Certain areas, including some large cities, use many wells. For example, the City ofModesto, California makes extensive use of drain or “rock wells” to serve 70 percent of the city area(Cadmus, 1999). Data shows that highly urbanized sections of Spokane County, Washington achievenearly 100 percent of their ground water recharge through dry well injection (Cadmus, 1999).
At the same time, studies found that little documentation of the number of storm water wellsnationwide exists and that existing counts likely underestimate the number of active wells. Althoughthere are numerous site-specific studies that describe areas using storm wells, existing literature shedslittle light on the national picture.
3.2 General Data Collection
For this study, data on the number of storm water drainage wells were collected through asurvey of state and USEPA Regional UIC Programs. The survey methods are summarized in Section 4of Volume 1 of the Class V Study.
In response to this survey, many state officials estimated that significantly more wells exist intheir state than are shown in their official inventory. State officials believe that many storm water wellsare not documented for a number of reasons, including:
• Wells may be located on private property where they cannot be readily found by state officialswithout assistance from the land owner.
• States may not have located wells built before the state environmental agencies had primacy forthe Class V program.
• Multiple state and local agencies may track storm water wells and coordination between theseagencies is often lacking.
• States may believe that wells have been properly plugged, but have never inspected these wellsto ensure that they are not still operating.
• Many people do not consider improved sinkholes to be Class V wells and thus, in some cases,these wells may not be counted.
Table 1 lists the numbers of storm water drainage wells in each state and USEPA Region, asdetermined from the survey. The Table includes the documented number and the estimated number ofstorm water drainage wells and the source and basis for any estimate, when noted by surveyrespondents. For states not listed in Table 1, no survey was returned or the UIC Program responsible

September 30, 1999 7
for that state indicated in the survey that no storm water drainage wells were present. The respondentsreported 71,015 documented wells nationwide. However, states and USEPA Regions estimate thatthe actual number of operating storm water wells may be closer to 247,522.
Table 1. Inventory of Storm Water Drainage Wells in the U.S.
StateDocumented
Number of Wells
Estimated Number of Wells
Number Source of Estimate and Methodology1
USEPA Region 1
CT 0 NR Number is believed to be low, but no reliable estimate is available.
MA 0 NR No estimate provided, but state suspects some wells exist.
ME 0 NR No estimate provided, but state suspects some wells exist.
NH Unknown Unknown The true documented number of wells is unknown because they arefound only when inspections are performed.
RI 122 NR State unable to give an estimate because it has not initiated acomplete inventory.
VT NR NR N/A
USEPA Region 2
NJ NR NR N/A
NY 84 30,000Best professional judgement by USEPA Region 2 based oninspections and availability of permeable soils in the state.
PR 1 NR N/A
VI 0 1,500USEPA Region 2 estimate based on review of inspection reportsand business directory.
USEPA Region 3
MD 1,678 NR N/A
PA NR NR N/A
VA NR NR N/A
WV 94 >94 Best professional judgement.
USEPA Region 4
AL 13 13 N/A
FL 2,153 >3,112 Best professional judgement and available files. Sinkholes notincluded. Lake level control wells included in estimate.
GA 61 NR State has limited information, but believes there may be additionalwells at older facilities.
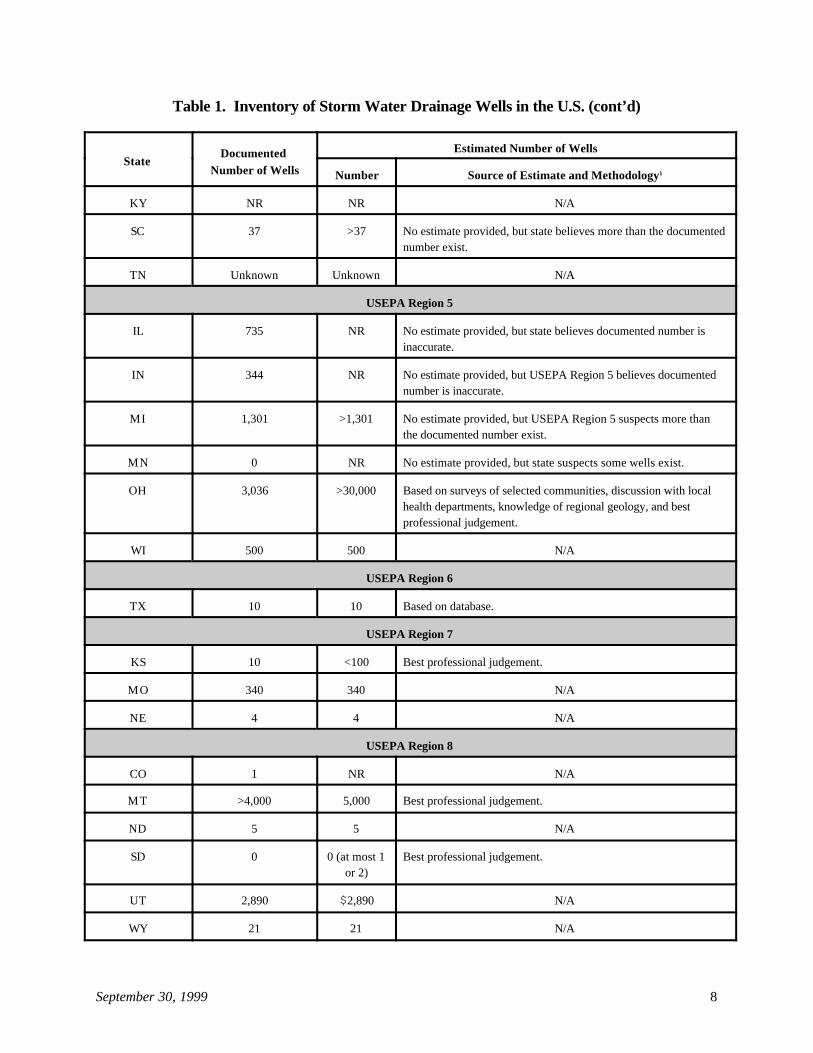
Table 1. Inventory of Storm Water Drainage Wells in the U.S. (cont’d)
StateDocumented
Number of Wells
Estimated Number of Wells
Number Source of Estimate and Methodology1
September 30, 1999 8
KY NR NR N/A
SC 37 >37 No estimate provided, but state believes more than the documentednumber exist.
TN Unknown Unknown N/A
USEPA Region 5
IL 735 NR No estimate provided, but state believes documented number isinaccurate.
IN 344 NR No estimate provided, but USEPA Region 5 believes documentednumber is inaccurate.
MI 1,301 >1,301 No estimate provided, but USEPA Region 5 suspects more thanthe documented number exist.
MN 0 NR No estimate provided, but state suspects some wells exist.
OH 3,036 >30,000 Based on surveys of selected communities, discussion with localhealth departments, knowledge of regional geology, and bestprofessional judgement.
WI 500 500 N/A
USEPA Region 6
TX 10 10 Based on database.
USEPA Region 7
KS 10 <100 Best professional judgement.
MO 340 340 N/A
NE 4 4 N/A
USEPA Region 8
CO 1 NR N/A
MT >4,000 5,000 Best professional judgement.
ND 5 5 N/A
SD 0 0 (at most 1or 2)
Best professional judgement.
UT 2,890 $2,890 N/A
WY 21 21 N/A

Table 1. Inventory of Storm Water Drainage Wells in the U.S. (cont’d)
StateDocumented
Number of Wells
Estimated Number of Wells
Number Source of Estimate and Methodology1
September 30, 1999 9
USEPA Region 9
AZ 14,857 14,857 N/A
CA 3,643 >26,480 Best professional judgement and estimates from three counties.
HI 2,622 2,622 N/A
NV NR 50 - 100 Best professional judgement.
GU 172 172 N/A
AS Unknown NR N/A
USEPA Region 10
AK 86 125 Best professional judgement.
ID 5,359 7,675 USEPA Region 10 estimate based on conversation with statepersonnel.
OR 4,148 20,000 Best professional judgement and draft reports from cities ofPortland, Bend, and Canby.
WA 22,688 100,000 Best professional judgement.
All USEPA Regions
All States 71,015 ± 247,522 The total estimated number counts the documented number whenthe estimate is NR.
1 Unless otherwise noted, the best professional judgement is that of the state or USEPA Regional staffcompleting the survey questionnaire.
N/A Not available.NR Although USEPA Regional, state and/or territorial officials reported the presence of the well type, the
number of wells was not reported, or the questionnaire was not returned.Unknown Questionnaire completed, but number of wells is unknown.
3.3 Inventory Model
Because existing data are believed to be inaccurate, USEPA constructed a model to estimatethe number of storm water drainage wells nationwide. The inventory model was designed to predict thenumber of wells nationally based on geologic, demographic, and other characteristics of specific censustracts. However, there is little theory and virtually no empirical research regarding the factors affectingthe number and location of these wells. USEPA made assumptions based on geologic anddemographic variables in order to pick census tracts to include in the sample. See Section 5 of Volume1 of the Class V Study and Appendix C of the Class V Study for a complete description of thedevelopment and results of this statistical inventory model used by USEPA.
September 30, 1999 10
Under the modeling effort, USEPA’s national estimate of storm water drainage wells is thecombination of two estimates: (1) a model estimate for wells in non-urbanized areas, and (2) stateestimates of the number of wells in urbanized areas. This approach is necessary because of the censusselection strategy. Urbanized areas were excluded from the survey based on the assumption that veryfew storm water drainage wells would be found in urbanized areas. While a few cities make extensiveuse of these wells, USEPA could not adequately represent all urbanized areas in the census survey toaccount for these wells because of the relatively small sample size. Therefore, USEPA relied on stateand other estimates gathered as part of the general data collection effort to account for the wells inurbanized areas, and used the census survey to build a model of the number of wells in non-urbanizedareas. The estimate of the total number of wells in the country is the sum of these two estimates. Themethods and results for these two estimates are summarized below and discussed in more detail inAppendix C of the Class V Study.
Wells in Non-Urbanized Areas
The existence of storm water drainage wells in the census survey is a relatively rare event. Ofthe 99 tracts in the census tract sample, 22 contained storm water drainage wells. Therefore, a two-part model is used to estimate the number of wells in each tract. The first part of the model estimatesthe probability that a given tract contains storm water drainage wells. The second part of the modelestimates the average number of wells in tracts containing wells. The expected number of wells is thenequal to the probability estimated in the first part of the model times the average estimated in the secondpart. The best estimate of the number of wells in non-urbanized areas is approximately 64,000.
Wells in Urbanized Areas
USEPA used the results from the general data collection described above to estimate thenumber of storm water drainage wells in urbanized areas. The location of municipalities in each stateresponding to the survey was mapped to determine which of the reported storm water drainage wellsfell into urbanized areas (as defined by the Census Bureau and this study). Approximately 35,000 wellsare documented in urbanized areas in these states. States estimate an additional 26,500 wells inurbanized areas. This is likely an underestimate for several reasons. First, the states believe theirestimates are lower than the actual number of wells that exist, as discussed in Section 3.2. Second,where a range was provided, USEPA took the lower end of the range. Finally, it could not always bedetermined if the estimated number of wells was in urbanized or non-urbanized areas. Where this wasthe case, these estimates were not counted as part of the urbanized total.
Conclusions
The estimate for the total number of wells in the country is equal to the estimates for urbanizedareas plus the model’s estimate for non-urbanized areas, which totals approximately 125,500. Abreakdown of this total is provided in Table 2.

September 30, 1999 11
Table 2. Inventory Model Results for Storm Water Drainage Wells
Location Number of Storm Water Drainage Wells
Non-urbanized areas (data collected through census tractvisits; modeled)
64,000
Urbanized areas (data collected through general data collection;no modeling)
• Documented by states 35,000
• Estimated by states 26,500
National total 125,500
3.4 Factors Affecting Use and Prevalence of Wells
At the outset of this study, USEPA gathered information from a variety of sources on factorsaffecting the use of storm water drainage wells. These sources generally led USEPA to assume thatstorm water wells are widespread across the nation. The key factors used to determine where stormwater wells existed were geology and demographics. USEPA assumed that areas with karst featuresor other fractured bedrock were most conducive to the use of storm water wells. Furthermore,USEPA assumed areas with very high or low housing or population densities would not have manywells.
The census tract visits shed new light on factors affecting the use and prevalence of wells. Thiseffort showed that storm water drainage wells are not distributed evenly across the nation, but insteadare clustered in certain areas with a range of different characteristics. There are several different factorsthat impact the use of storm water wells. Although the data do not present a clear pattern, severalimportant observations can be made. A discussion of these observations follows.
3.4.1 Housing and Population Density
In the census tract sample, USEPA ruled out tracts with very high or low housing or populationdensities. For example, areas such as Manhattan were not expected to use storm water wells and wereexcluded from the modeling effort. This factor, however, did not always turn out to be a reliableindicator of the use of storm water wells. USEPA learned that storm water wells can be found in bothurban and non-urban areas. Storm water wells are often found in relatively densely populated smallcommunities and suburban areas lacking adequate storm sewer systems. For these communities,injection wells are a relatively inexpensive method of preventing flooding when the infrastructure is notsufficient to handle storm runoff. Storm water wells in these areas are commonly found on the sides ofroads, in parking lots, and in housing developments.
USEPA also found that large cities across the country use storm water wells. Even thoughthese areas are most often sewered, injection wells can be a chosen method of disposal for storm water

September 30, 1999 12
runoff. State and local officials claim that storm water wells are relatively inexpensive and may serve adual purpose of recharging the ground water. Where this has historically been the practice, some largercities continue to use storm water wells as the city expands. In fact, large numbers of storm waterdrainage wells are located in urban areas that rely heavily on their use. For example, nearly 12,000storm water wells are estimated to exist in the Phoenix, Arizona, area. Although most of the city issewered, storm water wells are used as a method of recharging ground water in the area because it getslittle precipitation. Other cities, such as Miami, Florida, find that storm water wells are an effectivemeans of dealing with significant storm events.
3.4.2 Development
Storm water wells are also found in some areas of rapid urban expansion, especially whereexpansion has outpaced infrastructure development. In these areas, storm water wells help preventflooding from impervious surfaces such as parking lots and roads. The development of an area limitsnatural infiltration and increases the potential for flooding; wells are often used as an interim or long-term solution to this problem.
In other cases, development may have occurred in a rural community that traditionally usedstorm water wells. As a nearby city rapidly developed into surrounding communities, existing stormwater wells may not have been properly abandoned or plugged as the area was sewered. In addition,some users, such as strip mall owners, may have chosen not to connect to the sewer lines because ofthe cost. The scenario is most plausible in very large cities that have experienced significant urban andsuburban development around their perimeters.
3.4.3 Historical and Political Practices
USEPA’s data collection and site visit efforts show that the historical and political practices ofan area significantly impact the use of storm wells. For example, in areas where public awareness ofwater conservation issues is strong, storm water wells are a politically popular approach to dealing withrunoff. Additionally, some cities or communities that do not have the infrastructure or funding to installsewer systems require that storm water be handled onsite. Because other methods of storm waterdrainage, such as retention ponds, take up significant space, these communities often use wells instead. For example, state officials in Oregon have indicated that cities such as Portland do not use retentionponds because it is too expensive to buy the land needed from private owners to build the ponds(Cadmus, 1999). USEPA found that adjacent communities with similar geologic characteristics andprecipitation rates may have widely varying use of storm wells based on historical practices and politicalperceptions.
3.4.4 Geological Characteristics and Rainfall
Geological conditions and the amount of rainfall the area receives are other indicators of wherestorm water wells exist. For example, clay formations make the use of injection wells ineffective, whilekarst regions are ideal for their use. The use of storm water drainage wells is prevalent in areas that
September 30, 1999 13
have poor drainage and intermittent, high intensity storms. Poor surface drainage can result from flattopography or the elimination of natural infiltration as a result of urban activities. In areas wheretopographic conditions result in closed drainage basins (e.g., Florida), storm water drainage wells havealso been used to drain storm runoff. There are three basic subsurface geologic factors that positivelyinfluence the location of storm water wells: karst features, other fractured bedrock, and extensivesandy materials, such as an unconfined alluvial aquifer. The occurrence of such conditions near the landsurface can enable the injection and disposal of storm water.
The use of storm water wells in Hawaii, for example, is attributable mainly to geological factors,including slope and grade, and the depth of topsoil. The Island of Hawaii, which is the youngest islandgeologically, has little topsoil. Digging into rock in order to install culverts and ditches has provenimpractical and expensive, so the Island uses many storm water wells instead. On the other hand,Oahu is an older island with more topsoil, making digging easier and less expensive. Oahu operates awell developed storm sewer system and, unlike its sister island, does not rely on storm water wells.
3.5 Future Use of Storm Water Wells
USEPA expects to see a gradual increase in the future number of storm water wells nationwide. This increase can be attributed to several factors. First, many states continue to allow installation ofnew storm water wells. For example, the Florida Department of Environmental Protection receivesabout ten new storm water permit applications a month from Dade County alone for injection intoaquifers that are not USDWs. Permit applications for storm water drainage wells also continue to besubmitted for Monroe County (i.e., Florida Keys) (see Section 7 and Attachment A of this volume for amore complete picture of state programs for storm water drainage wells).
Second, few states have undertaken efforts to close existing storm water drainage wells. Whilestates such as Wisconsin have not allowed the construction of new wells since 1994, wells less than tenfeet deep which were built prior to 1994 continue to operate. Therefore, USEPA predicts that thecurrent number of active wells is unlikely to drop significantly. In addition, even when wells areabandoned by the owner or operator, few states perform inspections of these wells to determine if theyare properly plugged. Some state and local officials report that wells are often abandoned but notproperly plugged and, thus, are still able to accept storm runoff (Cadmus, 1999).
Third, rapidly developing urban areas, such as Phoenix, Arizona and Miami, Florida, plan tocontinue to build storm water wells as a cost-effective way to dispose of runoff and to recharge groundwater (Cadmus, 1999).
Lastly, an increase in the regulation of storm water discharges to surface waters under theNPDES Storm Water Program may make disposal through underground injection a more attractivealternative for storm water runoff.
September 30, 1999 14
4. INJECTATE CHARACTERISTICS AND INJECTIONPRACTICES
4.1 Injectate Characteristics
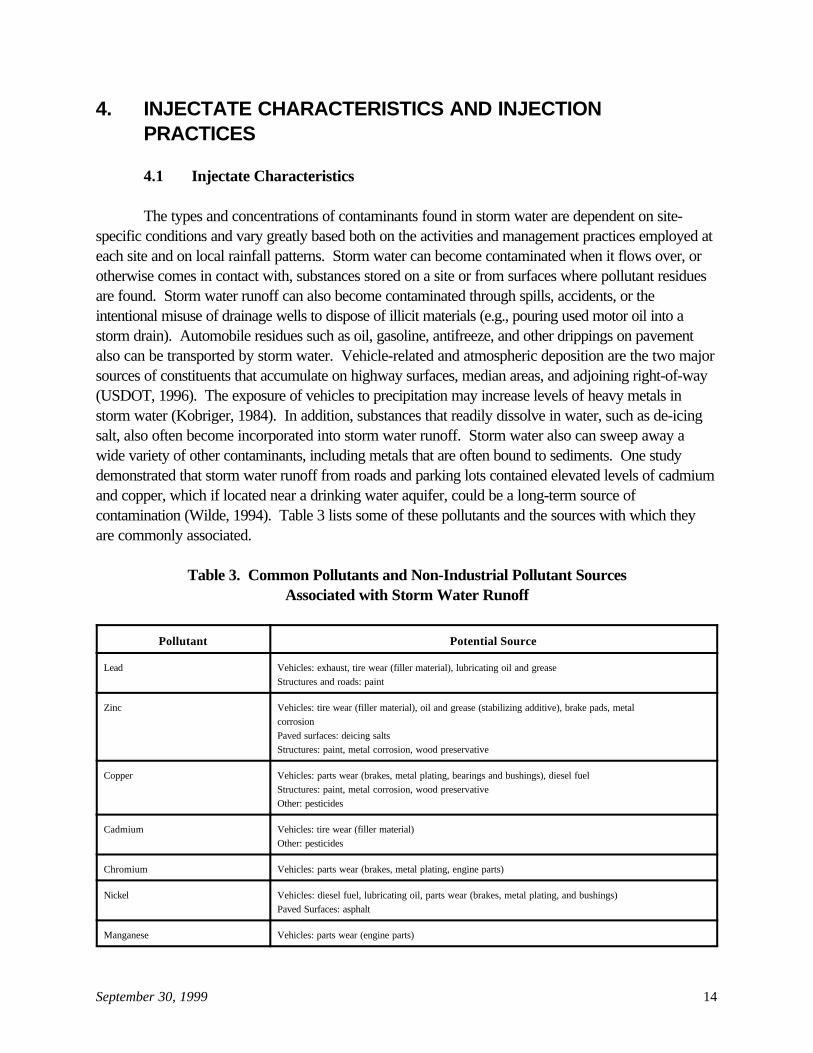
The types and concentrations of contaminants found in storm water are dependent on site-specific conditions and vary greatly based both on the activities and management practices employed ateach site and on local rainfall patterns. Storm water can become contaminated when it flows over, orotherwise comes in contact with, substances stored on a site or from surfaces where pollutant residuesare found. Storm water runoff can also become contaminated through spills, accidents, or theintentional misuse of drainage wells to dispose of illicit materials (e.g., pouring used motor oil into astorm drain). Automobile residues such as oil, gasoline, antifreeze, and other drippings on pavementalso can be transported by storm water. Vehicle-related and atmospheric deposition are the two majorsources of constituents that accumulate on highway surfaces, median areas, and adjoining right-of-way(USDOT, 1996). The exposure of vehicles to precipitation may increase levels of heavy metals instorm water (Kobriger, 1984). In addition, substances that readily dissolve in water, such as de-icingsalt, also often become incorporated into storm water runoff. Storm water also can sweep away awide variety of other contaminants, including metals that are often bound to sediments. One studydemonstrated that storm water runoff from roads and parking lots contained elevated levels of cadmiumand copper, which if located near a drinking water aquifer, could be a long-term source ofcontamination (Wilde, 1994). Table 3 lists some of these pollutants and the sources with which theyare commonly associated.
Table 3. Common Pollutants and Non-Industrial Pollutant SourcesAssociated with Storm Water Runoff
Pollutant Potential Source
Lead Vehicles: exhaust, tire wear (filler material), lubricating oil and greaseStructures and roads: paint
Zinc Vehicles: tire wear (filler material), oil and grease (stabilizing additive), brake pads, metalcorrosionPaved surfaces: deicing saltsStructures: paint, metal corrosion, wood preservative
Copper Vehicles: parts wear (brakes, metal plating, bearings and bushings), diesel fuelStructures: paint, metal corrosion, wood preservativeOther: pesticides
Cadmium Vehicles: tire wear (filler material)Other: pesticides
Chromium Vehicles: parts wear (brakes, metal plating, engine parts)
Nickel Vehicles: diesel fuel, lubricating oil, parts wear (brakes, metal plating, and bushings)Paved Surfaces: asphalt
Manganese Vehicles: parts wear (engine parts)
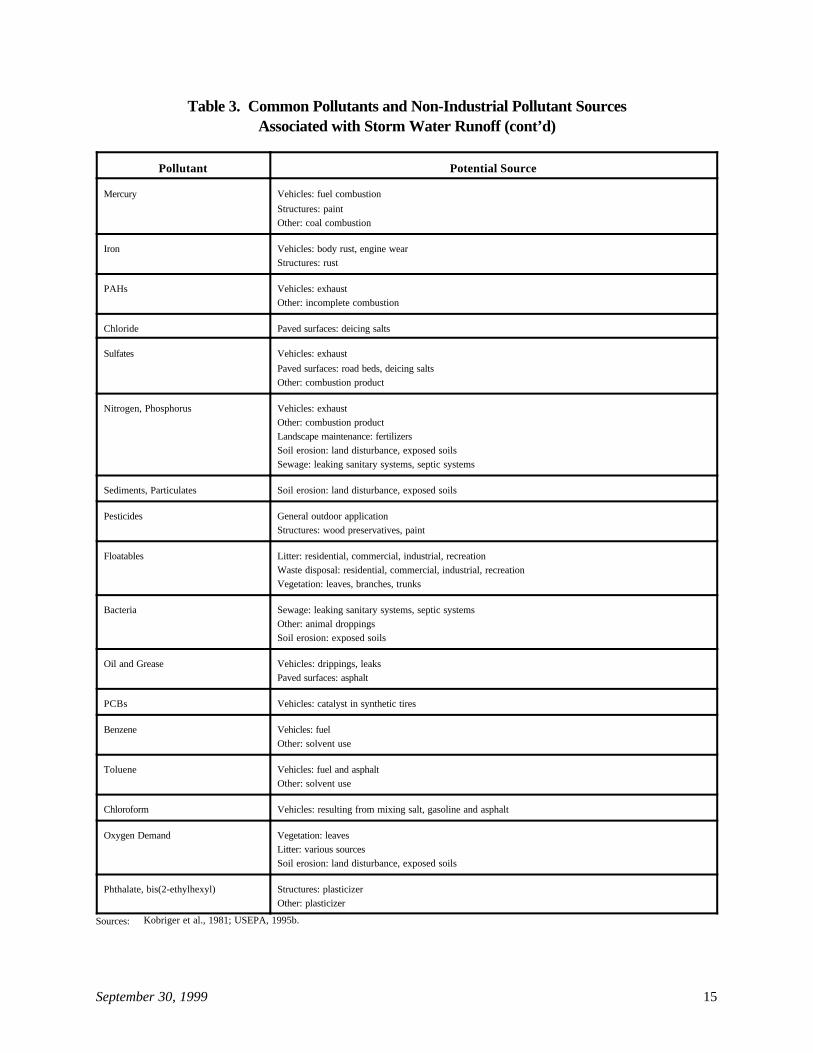
Table 3. Common Pollutants and Non-Industrial Pollutant SourcesAssociated with Storm Water Runoff (cont’d)
Pollutant Potential Source
September 30, 1999 15
Mercury Vehicles: fuel combustion
Structures: paint Other: coal combustion
Iron Vehicles: body rust, engine wearStructures: rust
PAHs Vehicles: exhaustOther: incomplete combustion
Chloride Paved surfaces: deicing salts
Sulfates Vehicles: exhaust
Paved surfaces: road beds, deicing salts Other: combustion product
Nitrogen, Phosphorus Vehicles: exhaustOther: combustion productLandscape maintenance: fertilizersSoil erosion: land disturbance, exposed soilsSewage: leaking sanitary systems, septic systems
Sediments, Particulates Soil erosion: land disturbance, exposed soils
Pesticides General outdoor applicationStructures: wood preservatives, paint
Floatables Litter: residential, commercial, industrial, recreationWaste disposal: residential, commercial, industrial, recreationVegetation: leaves, branches, trunks
Bacteria Sewage: leaking sanitary systems, septic systemsOther: animal droppingsSoil erosion: exposed soils
Oil and Grease Vehicles: drippings, leaksPaved surfaces: asphalt
PCBs Vehicles: catalyst in synthetic tires
Benzene Vehicles: fuelOther: solvent use
Toluene Vehicles: fuel and asphaltOther: solvent use
Chloroform Vehicles: resulting from mixing salt, gasoline and asphalt
Oxygen Demand Vegetation: leavesLitter: various sourcesSoil erosion: land disturbance, exposed soils
Phthalate, bis(2-ethylhexyl) Structures: plasticizerOther: plasticizer
Sources: Kobriger et al., 1981; USEPA, 1995b.
September 30, 1999 16
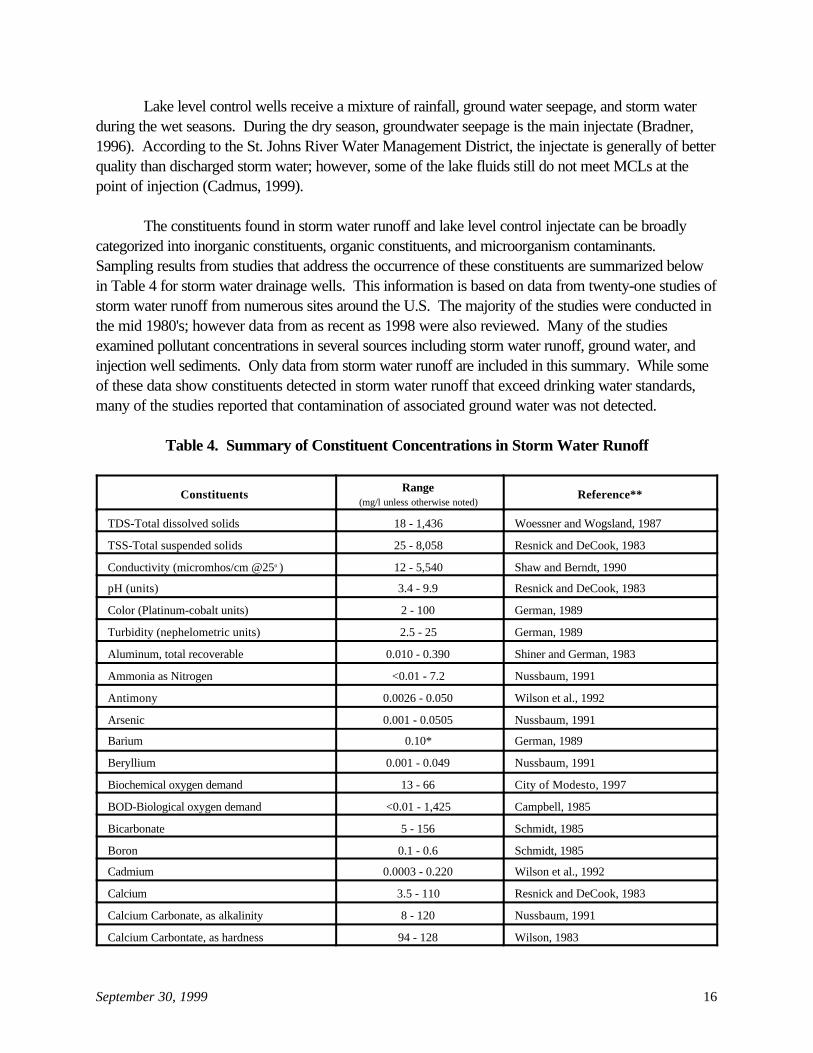
Lake level control wells receive a mixture of rainfall, ground water seepage, and storm waterduring the wet seasons. During the dry season, groundwater seepage is the main injectate (Bradner,1996). According to the St. Johns River Water Management District, the injectate is generally of betterquality than discharged storm water; however, some of the lake fluids still do not meet MCLs at thepoint of injection (Cadmus, 1999).
The constituents found in storm water runoff and lake level control injectate can be broadlycategorized into inorganic constituents, organic constituents, and microorganism contaminants. Sampling results from studies that address the occurrence of these constituents are summarized belowin Table 4 for storm water drainage wells. This information is based on data from twenty-one studies ofstorm water runoff from numerous sites around the U.S. The majority of the studies were conducted inthe mid 1980's; however data from as recent as 1998 were also reviewed. Many of the studiesexamined pollutant concentrations in several sources including storm water runoff, ground water, andinjection well sediments. Only data from storm water runoff are included in this summary. While someof these data show constituents detected in storm water runoff that exceed drinking water standards,many of the studies reported that contamination of associated ground water was not detected.
Table 4. Summary of Constituent Concentrations in Storm Water Runoff
ConstituentsRange
(mg/l unless otherwise noted)Reference**
TDS-Total dissolved solids 18 - 1,436 Woessner and Wogsland, 1987
TSS-Total suspended solids 25 - 8,058 Resnick and DeCook, 1983
Conductivity (micromhos/cm @25o ) 12 - 5,540 Shaw and Berndt, 1990
pH (units) 3.4 - 9.9 Resnick and DeCook, 1983
Color (Platinum-cobalt units) 2 - 100 German, 1989
Turbidity (nephelometric units) 2.5 - 25 German, 1989
Aluminum, total recoverable 0.010 - 0.390 Shiner and German, 1983
Ammonia as Nitrogen <0.01 - 7.2 Nussbaum, 1991
Antimony 0.0026 - 0.050 Wilson et al., 1992
Arsenic 0.001 - 0.0505 Nussbaum, 1991
Barium 0.10* German, 1989
Beryllium 0.001 - 0.049 Nussbaum, 1991
Biochemical oxygen demand 13 - 66 City of Modesto, 1997
BOD-Biological oxygen demand <0.01 - 1,425 Campbell, 1985
Bicarbonate 5 - 156 Schmidt, 1985
Boron 0.1 - 0.6 Schmidt, 1985
Cadmium 0.0003 - 0.220 Wilson et al., 1992
Calcium 3.5 - 110 Resnick and DeCook, 1983
Calcium Carbonate, as alkalinity 8 - 120 Nussbaum, 1991
Calcium Carbontate, as hardness 94 - 128 Wilson, 1983

Table 4. Summary of Constituent Concentrations in Storm Water Runoff (cont’d)
ConstituentsRange
(mg/l unless otherwise noted)Reference**
September 30, 1999 17
Carbon, Total organic 11 - 250 Schmidt, 1985
Carbonate 0 - 0.30 Wilson, 1983
Chemical oxygen demand (COD) 8 - 13,800 Resnick and DeCook, 1983
Chloride 1.0 - 3,550 Shaw and Berndt, 1990
Chromium 0.0006 - 0.610 German, 1989
Copper 0.002 - 1.25 Pitt et al., 1994
Cyanides 0.002 - 0.300 USEPA, 1983
Dissolved oxygen 7.8 - 12.2 Nussbaum, 1991
Fluoride 0.20 - 0.97 Wilson, 1983
Iron 0.07 - 27.3 Marsh, 1993
Lead 0.0001 - 1.869 Wilson et al., 1992
Lead, Dissolved 0.001 - 0.076 German, 1989
Magnesium 0.3 - 35 Resnick and DeCook, 1983
Manganese 0.005 - 0.910 Marsh, 1993
Mercury 0.0006 - 0.0023 Wilson et al., 1992
Nickel 0.001 - 0.900 Wilson et al., 1992
Nitrate 0.1 - 43 Resnick and DeCook, 1983
Nitrate & Nitrite <0.01 - 7.0 Nussbaum, 1991
Nitrogen, Dissolved 0.6 - 6.5 German, 1989
Nitrogen, Total 0.96 - 8.2 Shiner and German, 1983
Nitrogen, Total Kjeldahl (TKN) 0.21 - 45 Nussbaum, 1991
Phosphate 0.38 - 0.91 Wilson, 1983
Phosphorus, Dissolved 0.05 - 0.41 German, 1989
Phosphorus, Total 0.01 - 40 Nussbaum, 1991
Potassium 0.6 - 11 Nussbaum, 1991
Selenium 0.002 - 0.077 USEPA, 1983
Silica 0.1 - 15 Nussbaum, 1991
Silver 0.0002 - 0.020 Wilson et al., 1992
Sodium 1.6 - 988 Shaw and Berndt, 1990
Sulfate <5 - 75 Schmidt, 1985
Thallium 0.001 - 0.014 Nussbaum, 1991
Zinc 0.0018 - 4.398 Wilson et al., 1992
Zinc, Dissolved 0.170 - 0.190 City of Modesto, 1997
Total Coliform (colonies/ 100mL) 1.6 x 10⁶ - 2.0 x 10⁸ Resnick and DeCook, 1983
Fecal Coliform (colonies/100 mL) 1.6 x 10⁵ - 2.0 x 10⁷ Resnick and DeCook, 1983
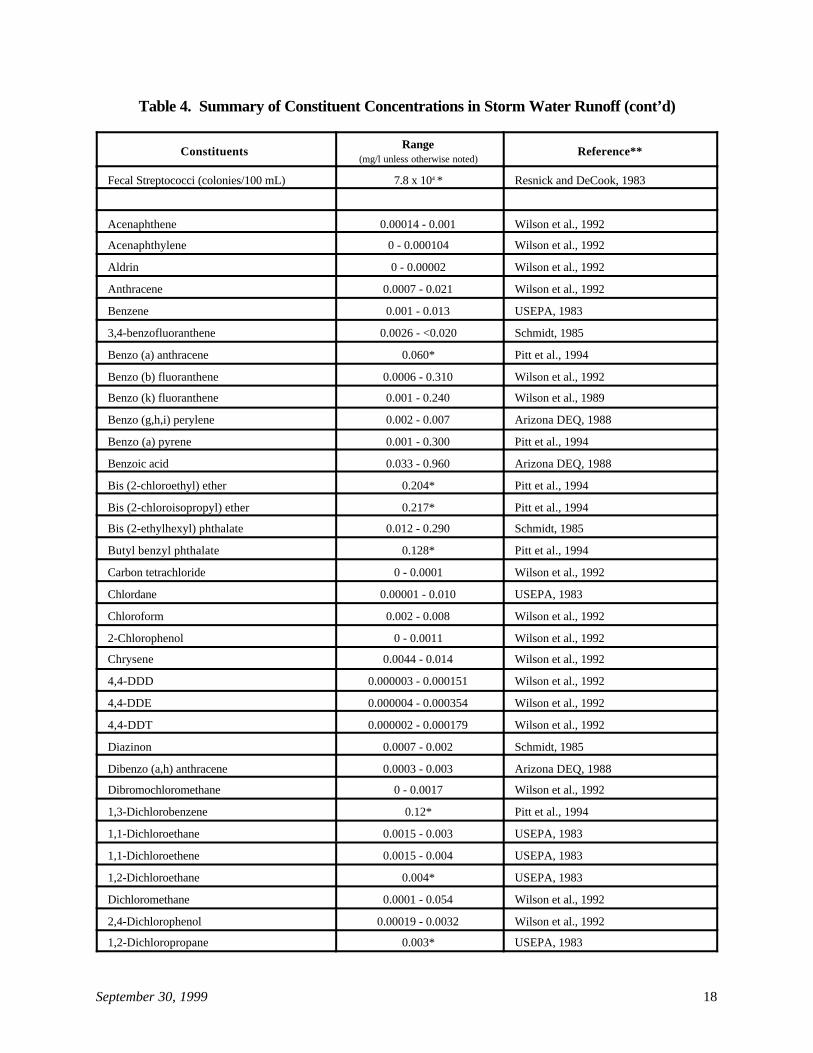
Table 4. Summary of Constituent Concentrations in Storm Water Runoff (cont’d)
ConstituentsRange
(mg/l unless otherwise noted)Reference**
September 30, 1999 18
Fecal Streptococci (colonies/100 mL) 7.8 x 10⁴ * Resnick and DeCook, 1983
Acenaphthene 0.00014 - 0.001 Wilson et al., 1992
Acenaphthylene 0 - 0.000104 Wilson et al., 1992
Aldrin 0 - 0.00002 Wilson et al., 1992
Anthracene 0.0007 - 0.021 Wilson et al., 1992
Benzene 0.001 - 0.013 USEPA, 1983
3,4-benzofluoranthene 0.0026 - <0.020 Schmidt, 1985
Benzo (a) anthracene 0.060* Pitt et al., 1994
Benzo (b) fluoranthene 0.0006 - 0.310 Wilson et al., 1992
Benzo (k) fluoranthene 0.001 - 0.240 Wilson et al., 1989
Benzo (g,h,i) perylene 0.002 - 0.007 Arizona DEQ, 1988
Benzo (a) pyrene 0.001 - 0.300 Pitt et al., 1994
Benzoic acid 0.033 - 0.960 Arizona DEQ, 1988
Bis (2-chloroethyl) ether 0.204* Pitt et al., 1994
Bis (2-chloroisopropyl) ether 0.217* Pitt et al., 1994
Bis (2-ethylhexyl) phthalate 0.012 - 0.290 Schmidt, 1985
Butyl benzyl phthalate 0.128* Pitt et al., 1994
Carbon tetrachloride 0 - 0.0001 Wilson et al., 1992
Chlordane 0.00001 - 0.010 USEPA, 1983
Chloroform 0.002 - 0.008 Wilson et al., 1992
2-Chlorophenol 0 - 0.0011 Wilson et al., 1992
Chrysene 0.0044 - 0.014 Wilson et al., 1992
4,4-DDD 0.000003 - 0.000151 Wilson et al., 1992
4,4-DDE 0.000004 - 0.000354 Wilson et al., 1992
4,4-DDT 0.000002 - 0.000179 Wilson et al., 1992
Diazinon 0.0007 - 0.002 Schmidt, 1985
Dibenzo (a,h) anthracene 0.0003 - 0.003 Arizona DEQ, 1988
Dibromochloromethane 0 - 0.0017 Wilson et al., 1992
1,3-Dichlorobenzene 0.12* Pitt et al., 1994
1,1-Dichloroethane 0.0015 - 0.003 USEPA, 1983
1,1-Dichloroethene 0.0015 - 0.004 USEPA, 1983
1,2-Dichloroethane 0.004* USEPA, 1983
Dichloromethane 0.0001 - 0.054 Wilson et al., 1992
2,4-Dichlorophenol 0.00019 - 0.0032 Wilson et al., 1992
1,2-Dichloropropane 0.003* USEPA, 1983
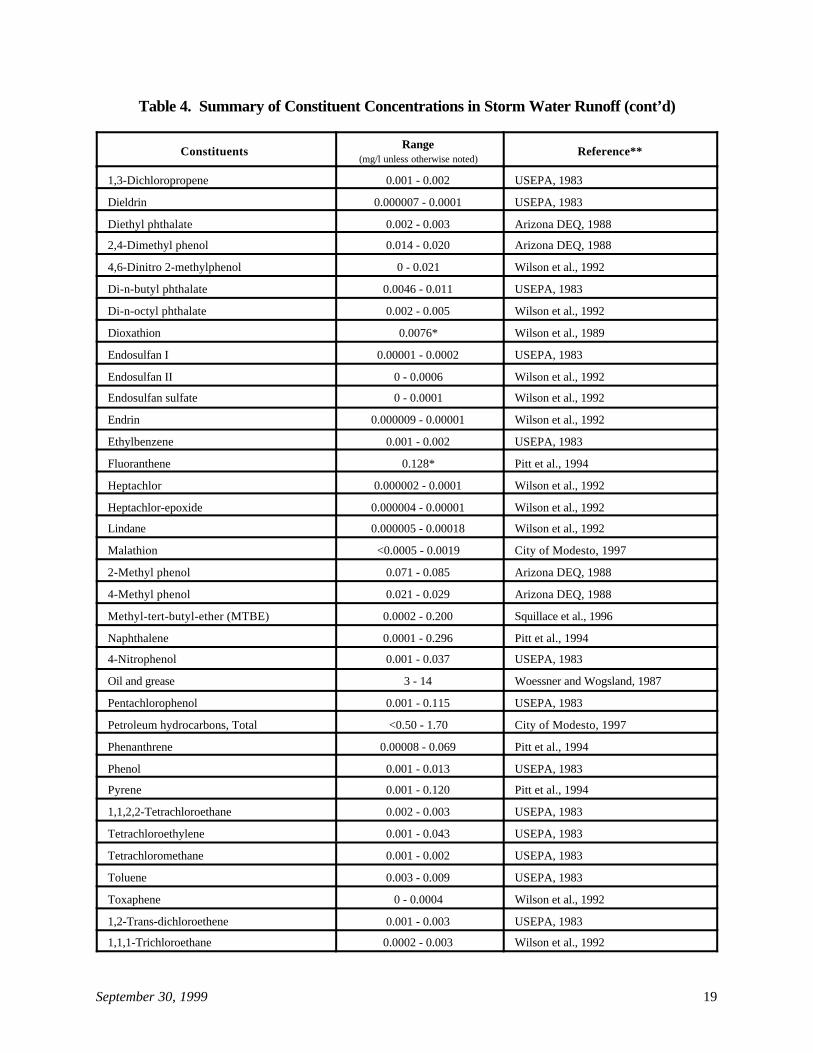
Table 4. Summary of Constituent Concentrations in Storm Water Runoff (cont’d)
ConstituentsRange
(mg/l unless otherwise noted)Reference**
September 30, 1999 19
1,3-Dichloropropene 0.001 - 0.002 USEPA, 1983
Dieldrin 0.000007 - 0.0001 USEPA, 1983
Diethyl phthalate 0.002 - 0.003 Arizona DEQ, 1988
2,4-Dimethyl phenol 0.014 - 0.020 Arizona DEQ, 1988
4,6-Dinitro 2-methylphenol 0 - 0.021 Wilson et al., 1992
Di-n-butyl phthalate 0.0046 - 0.011 USEPA, 1983
Di-n-octyl phthalate 0.002 - 0.005 Wilson et al., 1992
Dioxathion 0.0076* Wilson et al., 1989
Endosulfan I 0.00001 - 0.0002 USEPA, 1983
Endosulfan II 0 - 0.0006 Wilson et al., 1992
Endosulfan sulfate 0 - 0.0001 Wilson et al., 1992
Endrin 0.000009 - 0.00001 Wilson et al., 1992
Ethylbenzene 0.001 - 0.002 USEPA, 1983
Fluoranthene 0.128* Pitt et al., 1994
Heptachlor 0.000002 - 0.0001 Wilson et al., 1992
Heptachlor-epoxide 0.000004 - 0.00001 Wilson et al., 1992
Lindane 0.000005 - 0.00018 Wilson et al., 1992
Malathion <0.0005 - 0.0019 City of Modesto, 1997
2-Methyl phenol 0.071 - 0.085 Arizona DEQ, 1988
4-Methyl phenol 0.021 - 0.029 Arizona DEQ, 1988
Methyl-tert-butyl-ether (MTBE) 0.0002 - 0.200 Squillace et al., 1996
Naphthalene 0.0001 - 0.296 Pitt et al., 1994
4-Nitrophenol 0.001 - 0.037 USEPA, 1983
Oil and grease 3 - 14 Woessner and Wogsland, 1987
Pentachlorophenol 0.001 - 0.115 USEPA, 1983
Petroleum hydrocarbons, Total <0.50 - 1.70 City of Modesto, 1997
Phenanthrene 0.00008 - 0.069 Pitt et al., 1994
Phenol 0.001 - 0.013 USEPA, 1983
Pyrene 0.001 - 0.120 Pitt et al., 1994
1,1,2,2-Tetrachloroethane 0.002 - 0.003 USEPA, 1983
Tetrachloroethylene 0.001 - 0.043 USEPA, 1983
Tetrachloromethane 0.001 - 0.002 USEPA, 1983
Toluene 0.003 - 0.009 USEPA, 1983
Toxaphene 0 - 0.0004 Wilson et al., 1992
1,2-Trans-dichloroethene 0.001 - 0.003 USEPA, 1983
1,1,1-Trichloroethane 0.0002 - 0.003 Wilson et al., 1992

ConstituentsRange
(mg/l unless otherwise noted)Reference**
September 30, 1999 20
1,1,2-Trichloroethane 0.002 - 0.003 USEPA, 1983
Trichloroethylene 0.0003 - 0.012 USEPA, 1983
Trichlorofluoromethane 0.0006 - 0.027 USEPA, 1983
Trichloromethane 0.0002 - 0.012 USEPA, 1983* Single values represent maximum detected concentration when range was not given.** Reference listed is that in which maximum concentration was reported.
Table 5 presents injectate concentrations reported for lake level control wells. This informationis based on data from a total of 14 lake level control wells reported in three studies. One studypresents results of sampling events that took place in 1978, the second study presents data from a lakelevel control well and associated monitoring wells sampled from 1987 to 1988. Table 5 is also basedon data submitted by the Florida Department of Environmental Protection, which includes the results fortwo lake level control wells that were sampled in 1998.
Table 5. Summary of Constituent Concentrations in Lake Level Control Well Injectate
ConstituentsRange
(mg/l unless otherwise noted)Reference**
TDS-Total dissolved solids 92 - 176 Kimrey and Fayard, 1984
TSS-Total suspended solids 1.0 - 3.5 Cadmus, 1999
Conductivity (micromhos/cm @25o ) 140 - 173 Cadmus, 1999
pH (units) 6.16 - 9.1 Bradner, 1991
Color (Platinum-cobalt units) 5 - 20 Cadmus, 1999
Turbidity (nephelometric units) 0.9 - 1.6 Cadmus, 1999
Aluminum, Total recoverable 0.040 - 0.500 Kimrey and Fayard, 1984
Ammonia as Nitrogen 0.02 - 2.0 Kimrey and Fayard, 1984
Antimony <0.0017* Cadmus, 1999
Arsenic 0.001 - 0.027 Kimrey and Fayard, 1984
Barium 0.005* Cadmus, 1999
Beryllium <0.0003* Cadmus, 1999
Cadmium <0.0002 - 0.003 Kimrey and Fayard, 1984
Calcium 17.2 - 21 Bradner, 1991
Calcium Carbontate, as hardness 49.5 - 62 Bradner, 1991
Carbon, Total organic 4.7 - 9.2 Bradner, 1991
Chloride 2.8 - 26 Cadmus, 1999
Chromium <0.001 - 0.020 Kimrey and Fayard, 1984
Copper <0.002 - 0.012 Cadmus, 1999
Cyanide <0.006* Cadmus, 1999
Dissolved oxygen 0.24 - 5.15 Cadmus, 1999
Fluoride 0.10 - 0.20 Bradner, 1991
Iron 0.028 - 2.9 Kimrey and Fayard, 1984
Lead <0.002 - 0.008 Kimrey and Fayard, 1984
Lead, Dissolved <0.005* Bradner, 1991
Magnesium 1.6 - 2.3 Bradner, 1991
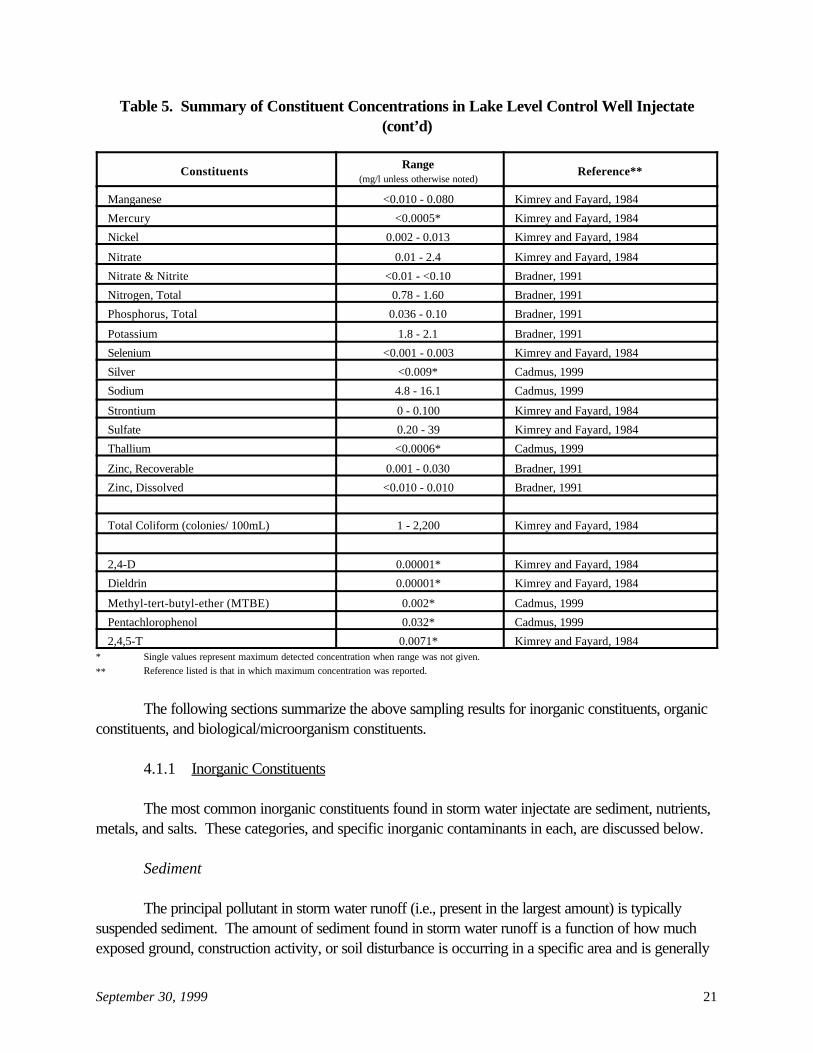
Table 5. Summary of Constituent Concentrations in Lake Level Control Well Injectate(cont’d)
ConstituentsRange
(mg/l unless otherwise noted)Reference**
September 30, 1999 21
Manganese <0.010 - 0.080 Kimrey and Fayard, 1984
Mercury <0.0005* Kimrey and Fayard, 1984
Nickel 0.002 - 0.013 Kimrey and Fayard, 1984
Nitrate 0.01 - 2.4 Kimrey and Fayard, 1984
Nitrate & Nitrite <0.01 - <0.10 Bradner, 1991
Nitrogen, Total 0.78 - 1.60 Bradner, 1991
Phosphorus, Total 0.036 - 0.10 Bradner, 1991
Potassium 1.8 - 2.1 Bradner, 1991
Selenium <0.001 - 0.003 Kimrey and Fayard, 1984
Silver <0.009* Cadmus, 1999
Sodium 4.8 - 16.1 Cadmus, 1999
Strontium 0 - 0.100 Kimrey and Fayard, 1984
Sulfate 0.20 - 39 Kimrey and Fayard, 1984
Thallium <0.0006* Cadmus, 1999
Zinc, Recoverable 0.001 - 0.030 Bradner, 1991
Zinc, Dissolved <0.010 - 0.010 Bradner, 1991
Total Coliform (colonies/ 100mL) 1 - 2,200 Kimrey and Fayard, 1984
2,4-D 0.00001* Kimrey and Fayard, 1984
Dieldrin 0.00001* Kimrey and Fayard, 1984
Methyl-tert-butyl-ether (MTBE) 0.002* Cadmus, 1999
Pentachlorophenol 0.032* Cadmus, 1999
2,4,5-T 0.0071* Kimrey and Fayard, 1984* Single values represent maximum detected concentration when range was not given.
** Reference listed is that in which maximum concentration was reported.
The following sections summarize the above sampling results for inorganic constituents, organicconstituents, and biological/microorganism constituents.
4.1.1 Inorganic Constituents
The most common inorganic constituents found in storm water injectate are sediment, nutrients,metals, and salts. These categories, and specific inorganic contaminants in each, are discussed below.
Sediment
The principal pollutant in storm water runoff (i.e., present in the largest amount) is typicallysuspended sediment. The amount of sediment found in storm water runoff is a function of how muchexposed ground, construction activity, or soil disturbance is occurring in a specific area and is generally
1 Phosphorus is not toxic to humans or animals in the forms commonly found in water; therefore,its presence does not appear to be a significant health concern with regard to ground water contaminationby storm water drainage wells. The primary concern with phosphorus in ground water is its discharge tosurface water, where it may induce eutrophication and other undesirable changes to aquatic ecosystems.
September 30, 1999 22
reported as total suspended solids (TSS). Suspended sediments are composed mainly of relativelyinert materials such as quartz and feldspar, but may pose a public health concern because of theadsorption of other pollutants to the sediments, including heavy metals, organic compounds, andmicroorganisms. Dissolved solids are the minerals, metals, and other compounds in solution in waterand are usually reported as total dissolved solids (TDS). This measurement gives a general indicationof water quality deterioration characteristics such as hardness, seawater intrusion, corrosive ability, andother mineral concentrations.
Particle size, density, size and pattern of fractures or voids in receiving geologic formations, andlocal ground water flow conditions are some of the factors affecting the mobility of dissolved andsuspended solids in storm water runoff. Lighter, smaller sediments, and the pollutants that may beadsorbed to them, may be transported into ground water when introduced into fractured or porousformations.
The USEPA Nationwide Urban Runoff Program (NURP) study in Bellevue, WA reported asediment concentration range in storm water runoff samples of 1 - 2,740 mg/l TSS. Samples takenfrom storm water runoff in the Tucson, AZ region were reported in the range of 25 - 8,058 mg/l TSS(Resnick and DeCook, 1983) while storm water samples from the Phoenix area were reported in therange of 99 - 588 mg/l (Schmidt, 1985). The Idaho Department of Water Resources (1985) collectedground water samples in Boise and Pocatello having TSS concentrations of 17 - 899 mg/l and 226 -1,190 mg/l, respectively. Woessner and Wogsland (1987) reported TDS levels in storm water runofffrom Missoula, MT to be 18 - 1,436 mg/l. The maximum detected levels of TDS in both storm waterrunoff and ground water samples exceed the secondary MCL of 500 mg/l. This secondary MCL is nothealth-based, but rather was established to represent a goal that would prevent most adverse tasteeffects. German (1989) reported MCL exceedances for color and turbidity. Color levels were as highas 100 platinum-cobalt units versus the secondary MCL of 15 platinum-cobalt units. Turbidity levelswere as high as 25 NTU versus the MCL of 0.5 - 1.0 NTU.
Lake level control well water quality data for Lake Azalea and Lake Orienta show relativelyfew exceedances of MCLs and HALs. However, the Lake Orienta drainage well sample exceeded thesecondary MCL for color (15 Pt/Co Units), and measurements for turbidity in the Lake Azaleasamples exceeded the MCL of 0.5 - 1.0 NTU.
Nutrients
Nutrients of primary interest found in urban storm water are the various forms of nitrogen andphosphorus.1 Nutrients originate from many different sources including sanitary sewage, fertilizers forlandscaping and lawn maintenance, septic tank and sewer system leakage, waste decomposition,
September 30, 1999 23
highway runoff, agricultural practices, animal wastes, eroded soil, organic debris, and atmosphericfallout (Nussbaum, 1991). Prych and Ebbert concluded that one third of total nitrogen in storm waterrunoff is from rainfall (in Nussbaum, 1991). Nitrogen concentrations are typically reported as eithertotal nitrogen or as nitrate-nitrite. Nitrates are one of the most frequently found contaminants in groundwater (Pitt et al., 1994). When nitrogen compounds come in contact with soil, nitrate leaching intoground water is possible because of its high solubility. If nitrate leaves the root zone without beingtaken up by plants, it can readily percolate into ground water.
Studies by Schmidt (1985) and Resnick and DeCook (1983) detected nitrate concentrations inground water of 20 - 22 mg/l and in storm water runoff of 0.1 - 43 mg/l respectively; which exceed theMCL of 10 mg/l. In the USEPA NURP study (1983) and in many of the studies mentioned above,nitrates were frequently detected in ground water and storm water samples; however, at levels belowthe MCL.
Metals and Salts
The metals in storm water presenting the greatest potential for USDW contamination arealuminum, arsenic, cadmium, chromium, copper, iron, lead, mercury, nickel, and zinc (Pitt et al., 1994). These metals are a concern because of their high prevalence and potential toxicity. Many of thesemetals are associated with the particulate fraction of storm water and can be removed by sedimentationor filtration. However, metals can adsorb onto the surface of suspended sediments and travel throughporous or fractured soils into ground water.
Lead, zinc, and copper are the metals found with the highest frequencies and concentrations inurban storm water. The NURP study (USEPA, 1983) analyzed 121 samples at 61 sites for 120 ofUSEPA’s priority pollutants. Lead and zinc were detected in 94 percent of the samples taken, withlead concentrations ranging from 0.006 - 0.96 mg/l, which exceeded the 0.015 mg/l drinking waterstandard. Wilson et al. (1992) reported lead levels as high as 1.869 mg/l in storm water runoff. Leadconcentrations have decreased significantly in urban area and highway storm water runoff due to itselimination as an antiknock additive in gasoline (Lee and Taylor, 1998). Concentrations of zinc werereported from 0.0018 - 4.39 mg/l, exhibiting the highest levels for detected metals and exceeding theHAL of 2 mg/l (Wilson et al., 1992). Copper, detected in 91 percent of the samples taken, was foundin concentrations ranging from 0.001 - 0.100 mg/l, with 40 percent of the total copper in soluble form(USEPA, 1983). Pitt et al. (1994) reported copper concentrations as high as 1.25 mg/l, exceeding thesecondary MCL of 1 mg/l.
Other metal contaminants frequently detected in the NURP storm water samples includedchromium (58 percent), arsenic (52 percent), cadmium (48 percent), and nickel (43 percent) (USEPA,1983). German (1989) reported chromium levels in the range of 0.0006 - 0.610 mg/l, exceeding theprimary drinking water standard of 0.10 mg/l. Levels of cadmium were detected in the range of0.0001 - 0.220 mg/l, exceeding the primary drinking water standard of 0.005 mg/l (Wilson et al.,1992). Arsenic concentrations frequently exceeded USEPA human carcinogenic HAL (10-4 risk level)of 0.002 mg/l (USEPA, 1983). Nussbaum (1991) reported arsenic concentrations up to 0.0505 mg/l,
September 30, 1999 24
exceeding the 0.05 mg/l MCL and the 0.002 mg/l HAL. In the NURP study, selenium concentrationsin storm water runoff ranged from 0.002 - 0.077 mg/l, exceeding the 0.05 mg/l drinking water standardin 10 percent of the samples in which it was detected. Shiner and German (1983) reported aluminumconcentrations as high as 0.39 mg/l, exceeding the secondary MCL of 0.05 - 0.20 mg/l. Antimony wasdetected above the primary MCL of 0.006 mg/l at a concentration of 0.05 mg/l by Wilson et al.(1992). Nussbaum (1991) reported beryllium levels of 0.049 mg/l, which exceeded the primary MCLof 0.004 mg/l. The NURP study (USEPA, 1983) reported concentrations of cyanides in the range of0.002 - 0.300 mg/l, exceeding the primary MCL of 0.200 mg/l. The secondary MCL for iron (0.30mg/l) was exceeded by concentrations as high as 27.3 mg/l (Marsh, 1993). Wilson et al. (1992) foundmercury levels of up to 0.0023 mg/l (exceeding the primary MCL of 0.002 mg/l) and nickel levels of upto 0.900 mg/l (exceeding the primary MCL of 0.100 mg/l).
Water quality analyses of samples taken from the Lake Azalea drainage (lake level control) wellindicate that several metals were present but did not violate any HAL or MCL (see Table 5). Only onesample exceeded the secondary MCL of 0.3 mg/l for iron.
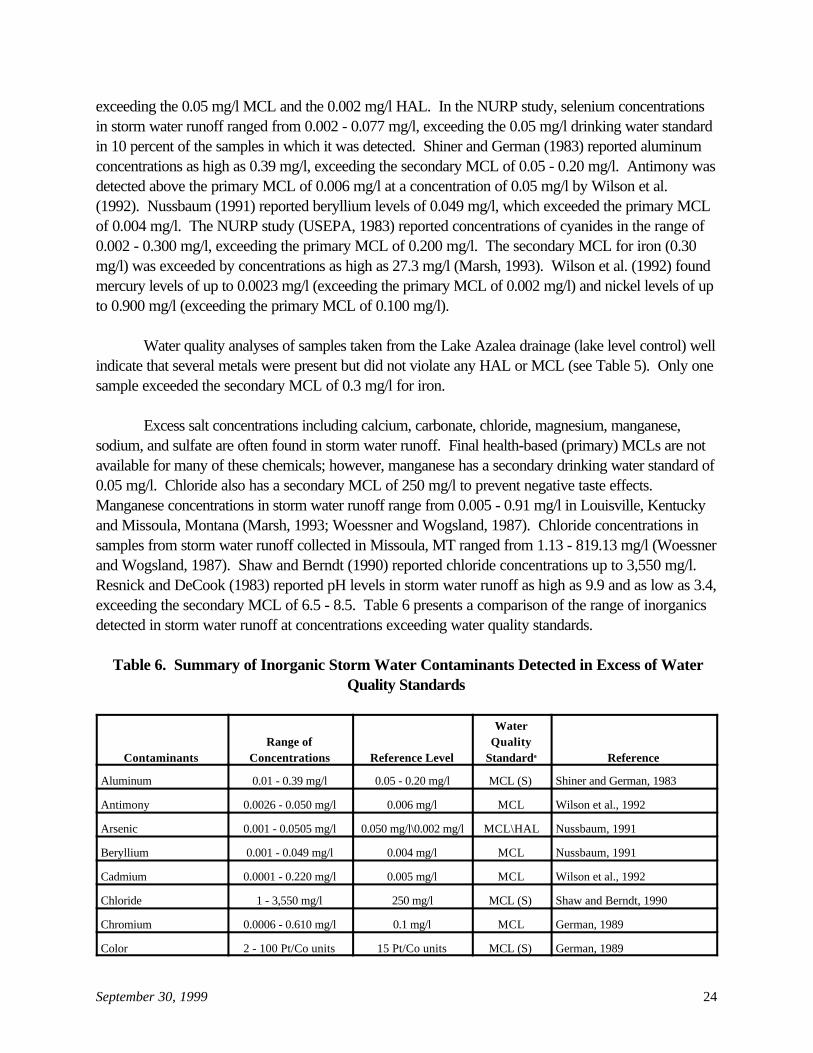
Excess salt concentrations including calcium, carbonate, chloride, magnesium, manganese,sodium, and sulfate are often found in storm water runoff. Final health-based (primary) MCLs are notavailable for many of these chemicals; however, manganese has a secondary drinking water standard of0.05 mg/l. Chloride also has a secondary MCL of 250 mg/l to prevent negative taste effects. Manganese concentrations in storm water runoff range from 0.005 - 0.91 mg/l in Louisville, Kentuckyand Missoula, Montana (Marsh, 1993; Woessner and Wogsland, 1987). Chloride concentrations insamples from storm water runoff collected in Missoula, MT ranged from 1.13 - 819.13 mg/l (Woessnerand Wogsland, 1987). Shaw and Berndt (1990) reported chloride concentrations up to 3,550 mg/l. Resnick and DeCook (1983) reported pH levels in storm water runoff as high as 9.9 and as low as 3.4,exceeding the secondary MCL of 6.5 - 8.5. Table 6 presents a comparison of the range of inorganicsdetected in storm water runoff at concentrations exceeding water quality standards.
Table 6. Summary of Inorganic Storm Water Contaminants Detected in Excess of WaterQuality Standards
ContaminantsRange of
Concentrations Reference Level
WaterQuality
Standarda Reference
Aluminum 0.01 - 0.39 mg/l 0.05 - 0.20 mg/l MCL (S) Shiner and German, 1983
Antimony 0.0026 - 0.050 mg/l 0.006 mg/l MCL Wilson et al., 1992
Arsenic 0.001 - 0.0505 mg/l 0.050 mg/l\0.002 mg/l MCL\HAL Nussbaum, 1991
Beryllium 0.001 - 0.049 mg/l 0.004 mg/l MCL Nussbaum, 1991
Cadmium 0.0001 - 0.220 mg/l 0.005 mg/l MCL Wilson et al., 1992
Chloride 1 - 3,550 mg/l 250 mg/l MCL (S) Shaw and Berndt, 1990
Chromium 0.0006 - 0.610 mg/l 0.1 mg/l MCL German, 1989
Color 2 - 100 Pt/Co units 15 Pt/Co units MCL (S) German, 1989
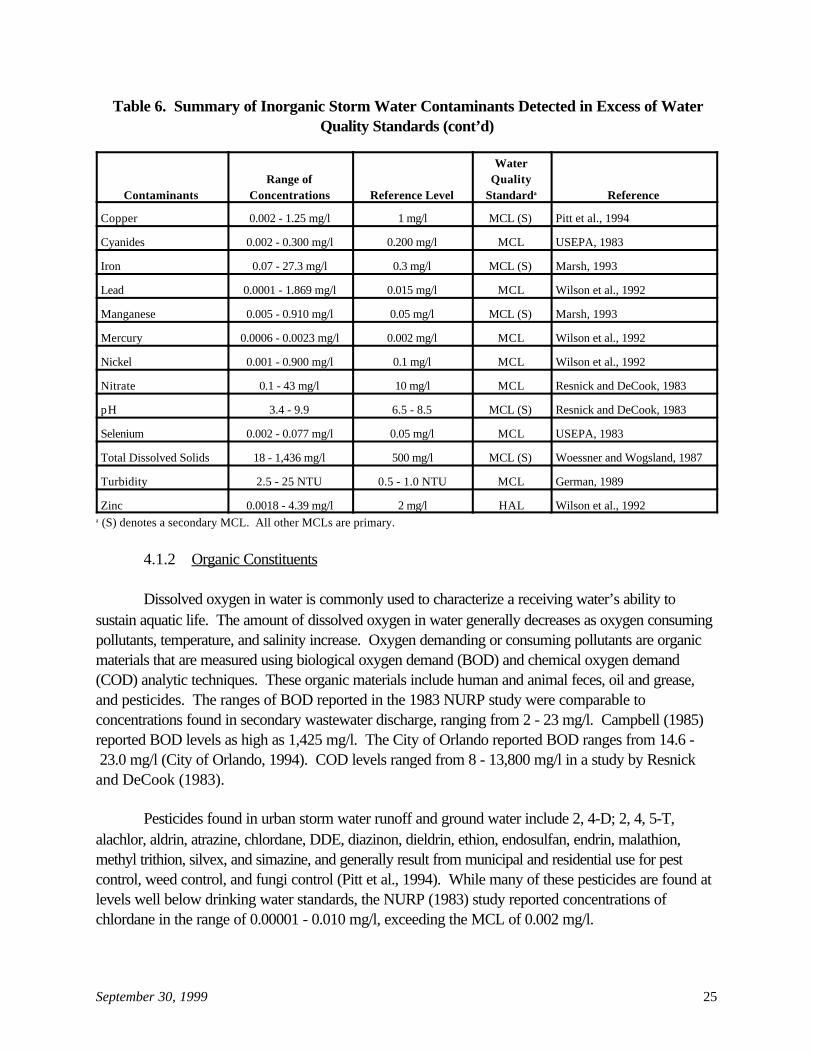
Table 6. Summary of Inorganic Storm Water Contaminants Detected in Excess of WaterQuality Standards (cont’d)
ContaminantsRange of
Concentrations Reference Level
WaterQuality
Standarda Reference
September 30, 1999 25
Copper 0.002 - 1.25 mg/l 1 mg/l MCL (S) Pitt et al., 1994
Cyanides 0.002 - 0.300 mg/l 0.200 mg/l MCL USEPA, 1983
Iron 0.07 - 27.3 mg/l 0.3 mg/l MCL (S) Marsh, 1993
Lead 0.0001 - 1.869 mg/l 0.015 mg/l MCL Wilson et al., 1992
Manganese 0.005 - 0.910 mg/l 0.05 mg/l MCL (S) Marsh, 1993
Mercury 0.0006 - 0.0023 mg/l 0.002 mg/l MCL Wilson et al., 1992
Nickel 0.001 - 0.900 mg/l 0.1 mg/l MCL Wilson et al., 1992
Nitrate 0.1 - 43 mg/l 10 mg/l MCL Resnick and DeCook, 1983
pH 3.4 - 9.9 6.5 - 8.5 MCL (S) Resnick and DeCook, 1983
Selenium 0.002 - 0.077 mg/l 0.05 mg/l MCL USEPA, 1983
Total Dissolved Solids 18 - 1,436 mg/l 500 mg/l MCL (S) Woessner and Wogsland, 1987
Turbidity 2.5 - 25 NTU 0.5 - 1.0 NTU MCL German, 1989
Zinc 0.0018 - 4.39 mg/l 2 mg/l HAL Wilson et al., 1992a (S) denotes a secondary MCL. All other MCLs are primary.
4.1.2 Organic Constituents
Dissolved oxygen in water is commonly used to characterize a receiving water’s ability tosustain aquatic life. The amount of dissolved oxygen in water generally decreases as oxygen consumingpollutants, temperature, and salinity increase. Oxygen demanding or consuming pollutants are organicmaterials that are measured using biological oxygen demand (BOD) and chemical oxygen demand(COD) analytic techniques. These organic materials include human and animal feces, oil and grease,and pesticides. The ranges of BOD reported in the 1983 NURP study were comparable toconcentrations found in secondary wastewater discharge, ranging from 2 - 23 mg/l. Campbell (1985)reported BOD levels as high as 1,425 mg/l. The City of Orlando reported BOD ranges from 14.6 - 23.0 mg/l (City of Orlando, 1994). COD levels ranged from 8 - 13,800 mg/l in a study by Resnickand DeCook (1983).
Pesticides found in urban storm water runoff and ground water include 2, 4-D; 2, 4, 5-T,alachlor, aldrin, atrazine, chlordane, DDE, diazinon, dieldrin, ethion, endosulfan, endrin, malathion,methyl trithion, silvex, and simazine, and generally result from municipal and residential use for pestcontrol, weed control, and fungi control (Pitt et al., 1994). While many of these pesticides are found atlevels well below drinking water standards, the NURP (1983) study reported concentrations ofchlordane in the range of 0.00001 - 0.010 mg/l, exceeding the MCL of 0.002 mg/l.

September 30, 1999 26
Between 1991 and 1995, the U.S. Geological Survey (USGS) collected a total of 592 samplesof storm water from 16 cities and metropolitan areas required to obtain NPDES permits to dischargestorm water from their municipal storm sewer system into surface water (Delzer et al., 1996). Althoughthese data represent storm water that were not injected, they can be used to characterize storm waterquality prior to injection. These data indicated that a total of 62 volatile organic compounds (VOCs)were detected at concentrations below primary and secondary MCLs. Other studies reported thefollowing organic concentrations above MCLs (see Table 7 for specific references): benzene (0.013mg/l versus MCL of 0.005 mg/l); benzo(a)pyrene (0.300 mg/l versus MCL of 0.0002 mg/l); bis(2-ethylhexyl) phthalate (0.290 mg/l versus MCL of 0.006 mg/l); dichloromethane (0.054 mg/l versusMCL of 0.005 mg/l); methyl tert-butyl ether (MTBE) (0.200 mg/l versus HAL of 0.020 mg/l);pentachlorophenol (0.115 mg/l versus MCL of 0.001 mg/l); tetrachloroethylene (0.043 mg/l versusMCL of 0.005 mg/l); and trichloroethylene (0.012 mg/l versus MCL of 0.005 mg/l).
Between 1993 and 1994, the USGS analyzed ground water samples collected from 210shallow urban wells and springs, 549 shallow agricultural wells, and 412 deep wells as part of theirNational Water Quality Assessment program (Squillace et al., 1996). The research focused on thepresence of MTBE in ground water. Of the 210 shallow urban land use wells and springs sampled, 73percent had concentrations less than the method detection level of 0.0002 mg/l, 24 percent had MTBEconcentrations ranging from 0.0002 to 0.020 mg/l, and three percent had concentrations exceeding0.020 mg/l. USEPA set a health advisory level for MTBE at 0.020 mg/l. The USGS data indicate thatMTBE contamination occurs from point and nonpoint sources of pollution. Although they do notdescribe MTBE contamination as directly attributable to storm water injection, they mention stormwater injection wells as a probable source of contamination.
Lake level control well injectate was also sampled for numerous pesticides and organics, few ofwhich were reported above detection limits. Pentachlorophenol was detected in the Lake Orientadrainage well in Altamonte Springs, Florida at a concentration of 0.0032 mg/l, which exceeded theprimary MCL of 0.001 mg/l (Cadmus, 1999). Table 7 presents a summary of organic constituentsdetected in storm water runoff and lake level control wells at concentrations greater than water qualitystandards.
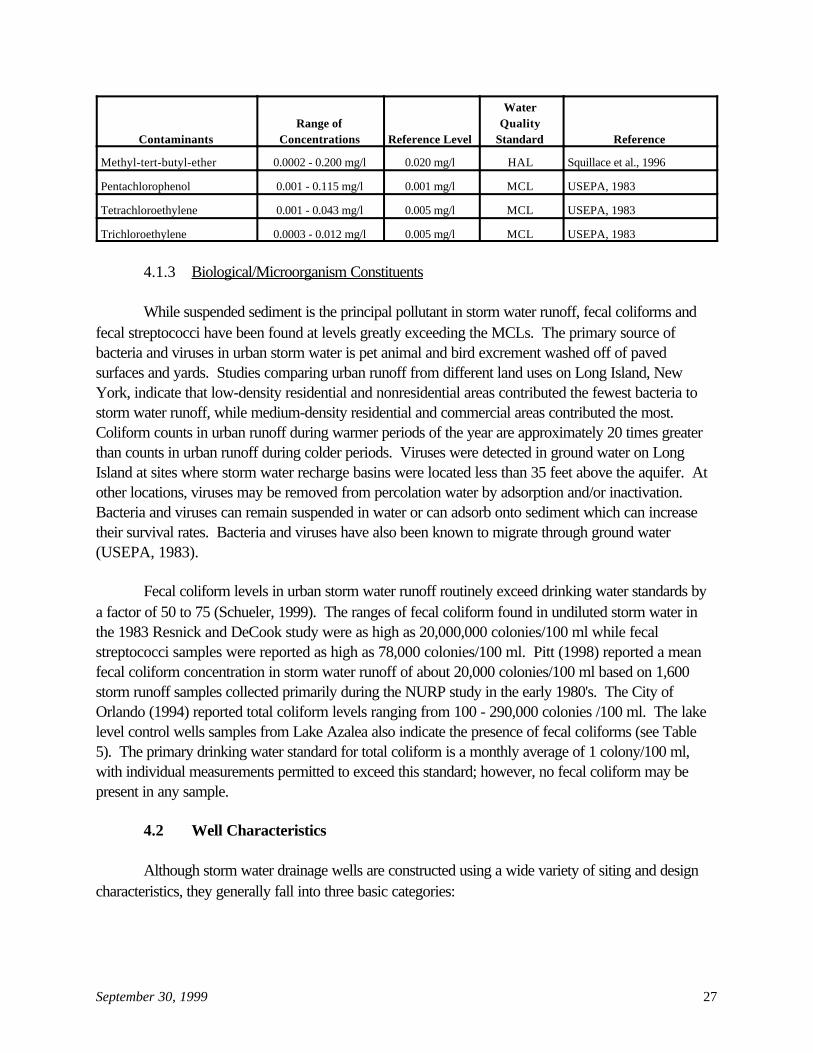
Table 7. Summary of Organic Storm Water Contaminants Detected in Excess of WaterQuality Standards
ContaminantsRange of
Concentrations Reference Level
WaterQuality
Standard Reference
Benzene 0.0001 - 0.013 mg/l 0.005 mg/l MCL USEPA, 1983
Benzo(a)pyrene 0.001 - 0.300 mg/l 0.0002 mg/l MCL Pitt et al., 1994
Bis(2-ethylhexyl) Phthalate 0.012 - 0.290 mg/l 0.006 mg/l MCL Schmidt, 1985
Chlordane 0.00001 - 0.010 mg/l 0.002 mg/l MCL USEPA, 1983
Dichloromethane 0.0001 - 0.054 mg/l 0.005 mg/l MCL Wilson et al., 1992
ContaminantsRange of
Concentrations Reference Level
WaterQuality
Standard Reference
September 30, 1999 27
Methyl-tert-butyl-ether 0.0002 - 0.200 mg/l 0.020 mg/l HAL Squillace et al., 1996
Pentachlorophenol 0.001 - 0.115 mg/l 0.001 mg/l MCL USEPA, 1983
Tetrachloroethylene 0.001 - 0.043 mg/l 0.005 mg/l MCL USEPA, 1983
Trichloroethylene 0.0003 - 0.012 mg/l 0.005 mg/l MCL USEPA, 1983
4.1.3 Biological/Microorganism Constituents
While suspended sediment is the principal pollutant in storm water runoff, fecal coliforms andfecal streptococci have been found at levels greatly exceeding the MCLs. The primary source ofbacteria and viruses in urban storm water is pet animal and bird excrement washed off of pavedsurfaces and yards. Studies comparing urban runoff from different land uses on Long Island, NewYork, indicate that low-density residential and nonresidential areas contributed the fewest bacteria tostorm water runoff, while medium-density residential and commercial areas contributed the most. Coliform counts in urban runoff during warmer periods of the year are approximately 20 times greaterthan counts in urban runoff during colder periods. Viruses were detected in ground water on LongIsland at sites where storm water recharge basins were located less than 35 feet above the aquifer. Atother locations, viruses may be removed from percolation water by adsorption and/or inactivation. Bacteria and viruses can remain suspended in water or can adsorb onto sediment which can increasetheir survival rates. Bacteria and viruses have also been known to migrate through ground water(USEPA, 1983).
Fecal coliform levels in urban storm water runoff routinely exceed drinking water standards bya factor of 50 to 75 (Schueler, 1999). The ranges of fecal coliform found in undiluted storm water inthe 1983 Resnick and DeCook study were as high as 20,000,000 colonies/100 ml while fecalstreptococci samples were reported as high as 78,000 colonies/100 ml. Pitt (1998) reported a meanfecal coliform concentration in storm water runoff of about 20,000 colonies/100 ml based on 1,600storm runoff samples collected primarily during the NURP study in the early 1980's. The City ofOrlando (1994) reported total coliform levels ranging from 100 - 290,000 colonies /100 ml. The lakelevel control wells samples from Lake Azalea also indicate the presence of fecal coliforms (see Table5). The primary drinking water standard for total coliform is a monthly average of 1 colony/100 ml,with individual measurements permitted to exceed this standard; however, no fecal coliform may bepresent in any sample.
4.2 Well Characteristics
Although storm water drainage wells are constructed using a wide variety of siting and designcharacteristics, they generally fall into three basic categories:
September 30, 1999 28
• dug wells• bored wells• improved sinkholes
4.2.1 Dug Wells
In many states, the use of dug wells (also called dry wells) is preferable to other types of stormwater drainage wells because injected waters are typically filtered by vadose zone soil before reachingground water, provided they are constructed above the seasonally high ground water table. Thus, theconcentration of the contaminants in the effluent that eventually reaches the ground water is reduced(actual reduction depends on the physical and chemical characteristics of the specific contaminants) asthe storm water moves through the soil. While infiltration trenches are often categorized with dug wells,they are not Class V wells if their surface dimension is larger than their depth.
Dry Wells
A dry well is usually dug to a depth above the water table so that its bottom and sides aretypically dry except when receiving fluids. Dry wells are constructed by excavating a hole and thenbuilding a chamber either by stacking concrete culvert pipe sections on top of each other or by stackingcurved concrete blocks. Variations on this general design include placing drainage nets on the bottomof the holes before installing the blocks, constructing a dry well and filling the chamber with gravel, orsimply digging a hole and backfilling it with gravel. Figure 1 presents aschematic of a dry well constructed with curved blocks. As shown in Figure 1, this well has no catchbasin and receives storm water through a slotted manhole cover.
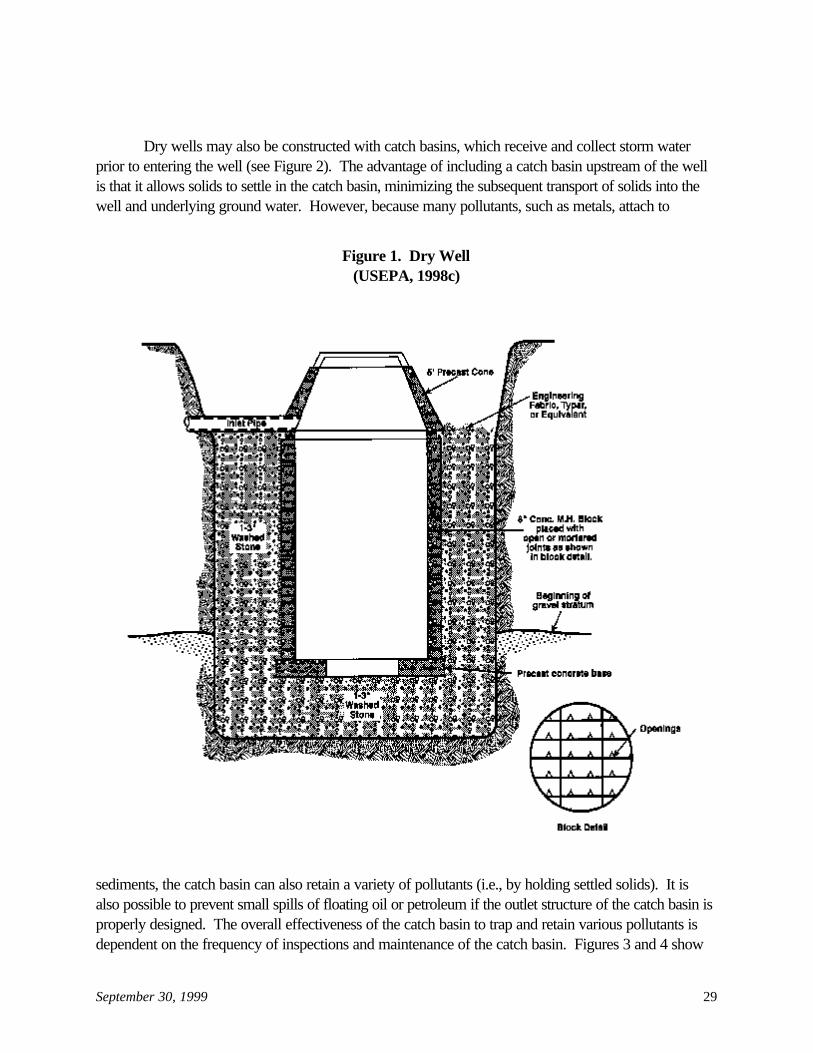
September 30, 1999 29
Figure 1. Dry Well(USEPA, 1998c)
Dry wells may also be constructed with catch basins, which receive and collect storm waterprior to entering the well (see Figure 2). The advantage of including a catch basin upstream of the wellis that it allows solids to settle in the catch basin, minimizing the subsequent transport of solids into thewell and underlying ground water. However, because many pollutants, such as metals, attach to
sediments, the catch basin can also retain a variety of pollutants (i.e., by holding settled solids). It isalso possible to prevent small spills of floating oil or petroleum if the outlet structure of the catch basin isproperly designed. The overall effectiveness of the catch basin to trap and retain various pollutants isdependent on the frequency of inspections and maintenance of the catch basin. Figures 3 and 4 show
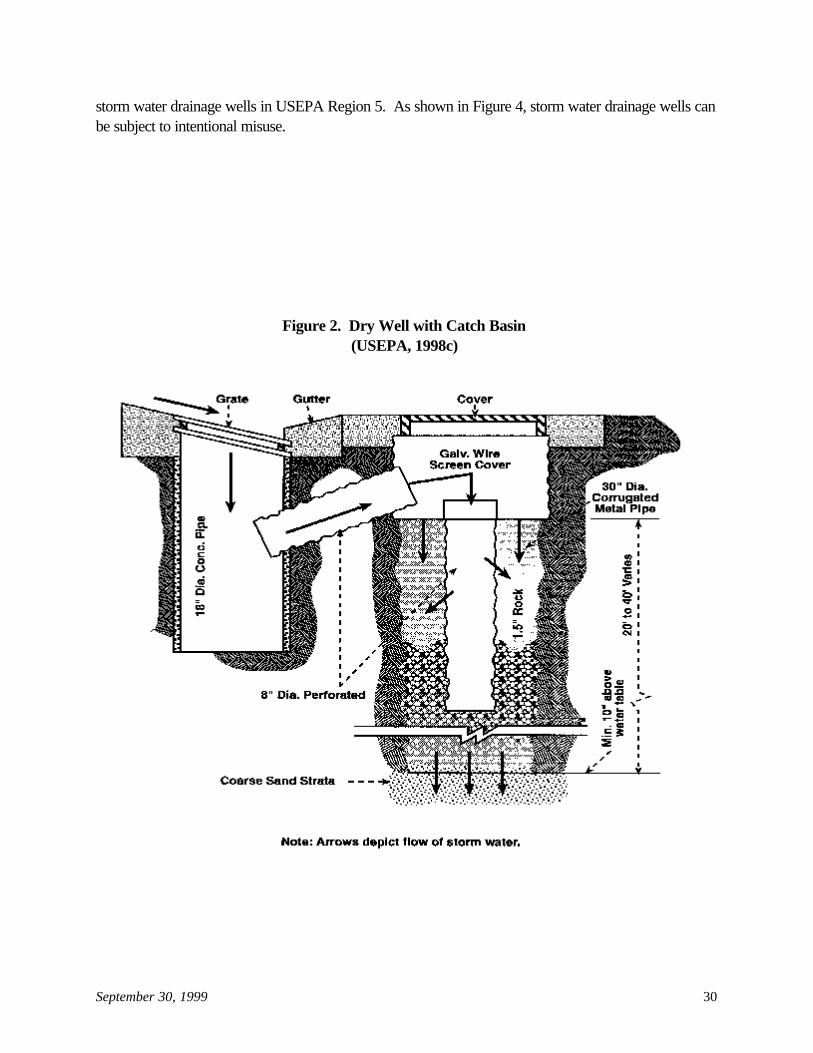
September 30, 1999 30
Figure 2. Dry Well with Catch Basin(USEPA, 1998c)
storm water drainage wells in USEPA Region 5. As shown in Figure 4, storm water drainage wells canbe subject to intentional misuse.

September 30, 1999 31
Figure 4. Storm Water Drainage Well in USEPARegion 5 (USEPA, 1999d)
Figure 5. Storm Water Drainage Well inUSEPA Region 5 (USEPA, 1999d)
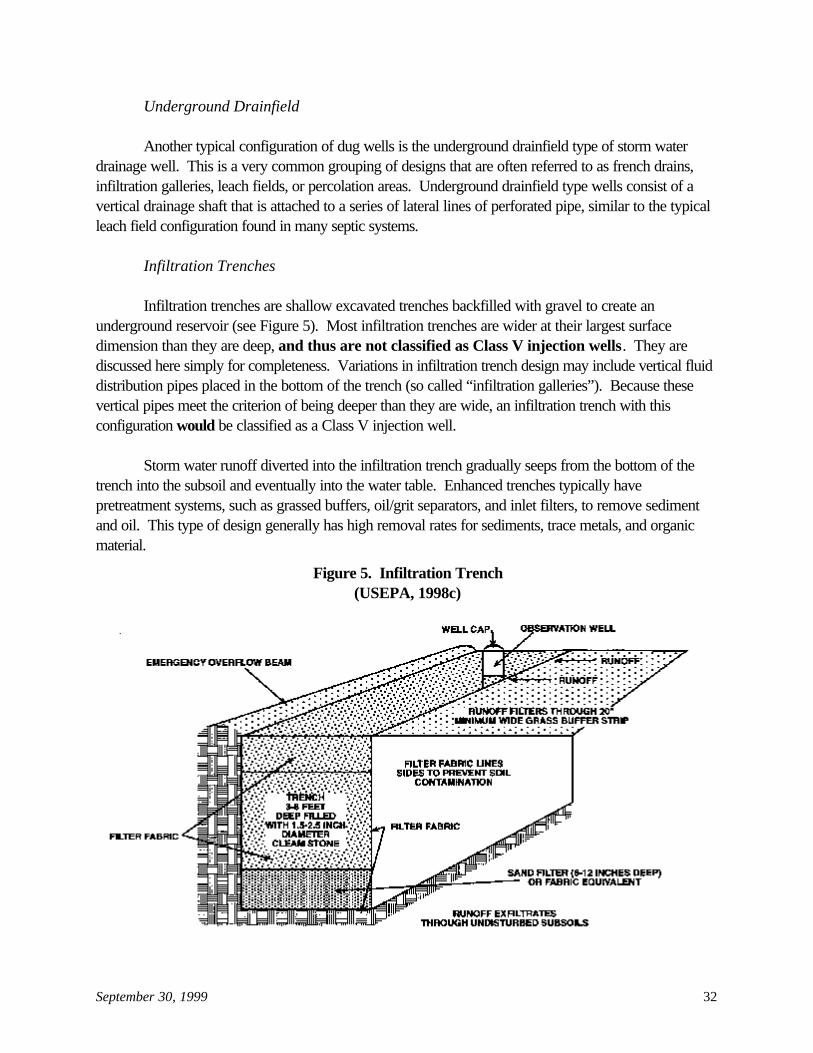
September 30, 1999 32
Figure 5. Infiltration Trench(USEPA, 1998c)
Underground Drainfield
Another typical configuration of dug wells is the underground drainfield type of storm waterdrainage well. This is a very common grouping of designs that are often referred to as french drains,infiltration galleries, leach fields, or percolation areas. Underground drainfield type wells consist of avertical drainage shaft that is attached to a series of lateral lines of perforated pipe, similar to the typicalleach field configuration found in many septic systems.
Infiltration Trenches
Infiltration trenches are shallow excavated trenches backfilled with gravel to create anunderground reservoir (see Figure 5). Most infiltration trenches are wider at their largest surfacedimension than they are deep, and thus are not classified as Class V injection wells. They arediscussed here simply for completeness. Variations in infiltration trench design may include vertical fluiddistribution pipes placed in the bottom of the trench (so called “infiltration galleries”). Because thesevertical pipes meet the criterion of being deeper than they are wide, an infiltration trench with thisconfiguration would be classified as a Class V injection well.
Storm water runoff diverted into the infiltration trench gradually seeps from the bottom of thetrench into the subsoil and eventually into the water table. Enhanced trenches typically havepretreatment systems, such as grassed buffers, oil/grit separators, and inlet filters, to remove sedimentand oil. This type of design generally has high removal rates for sediments, trace metals, and organicmaterial.

September 30, 1999 33
Figure 6. Bored Well(USEPA, 1987)
4.2.2 Bored Wells
A basic bored well is typically at least 40 feet deep and is drilled into consolidated strata suchas limestone or sandstone (USEPA, 1998c). As shown in Figure 6, storm water may pass through ascreen (that filters the injectate), through the well casing, and then seep into underlying aquifers (whichoften are in either limestone or sandstone formations). Thus, the basic bored well does not provide anyopportunity for treatment of the storm water, beyond that which may occur if the storm water passesthrough the vadose zone and enters the aquifer (e.g., adsorption or filtration by soil). In cases wherethe well injects storm water directly into the water table, significant potential for contamination of theaquifer exists. As a result, states such as Arizona allow the use of bored wells only when operated withpollution management measures like a catch basin-type settling chamber and inflow pipes outfitted withdebris shields and petroleum absorbents (see Figure 7).

September 30, 1999 34
Fig
ure
7. B
ored
Wel
l with
Set
tling
Cha
mbe
r(U
SEP
A, 1
998c
)
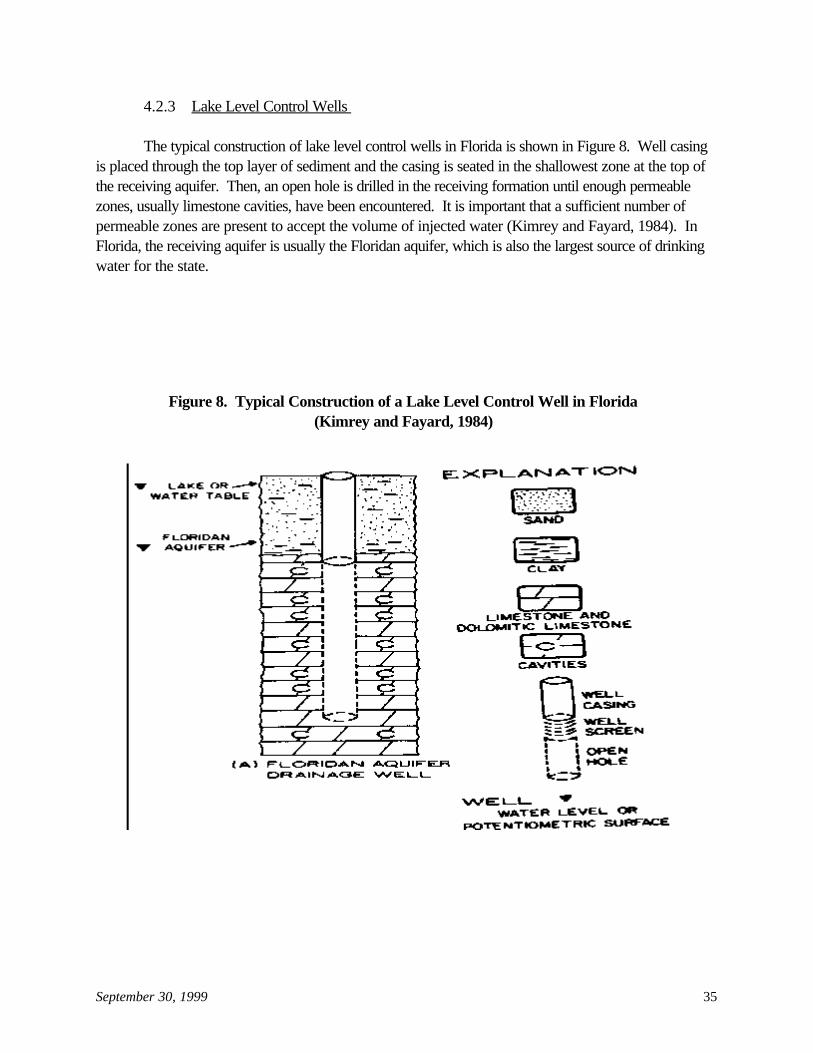
September 30, 1999 35
Figure 8. Typical Construction of a Lake Level Control Well in Florida(Kimrey and Fayard, 1984)
4.2.3 Lake Level Control Wells
The typical construction of lake level control wells in Florida is shown in Figure 8. Well casingis placed through the top layer of sediment and the casing is seated in the shallowest zone at the top ofthe receiving aquifer. Then, an open hole is drilled in the receiving formation until enough permeablezones, usually limestone cavities, have been encountered. It is important that a sufficient number ofpermeable zones are present to accept the volume of injected water (Kimrey and Fayard, 1984). InFlorida, the receiving aquifer is usually the Floridan aquifer, which is also the largest source of drinkingwater for the state.
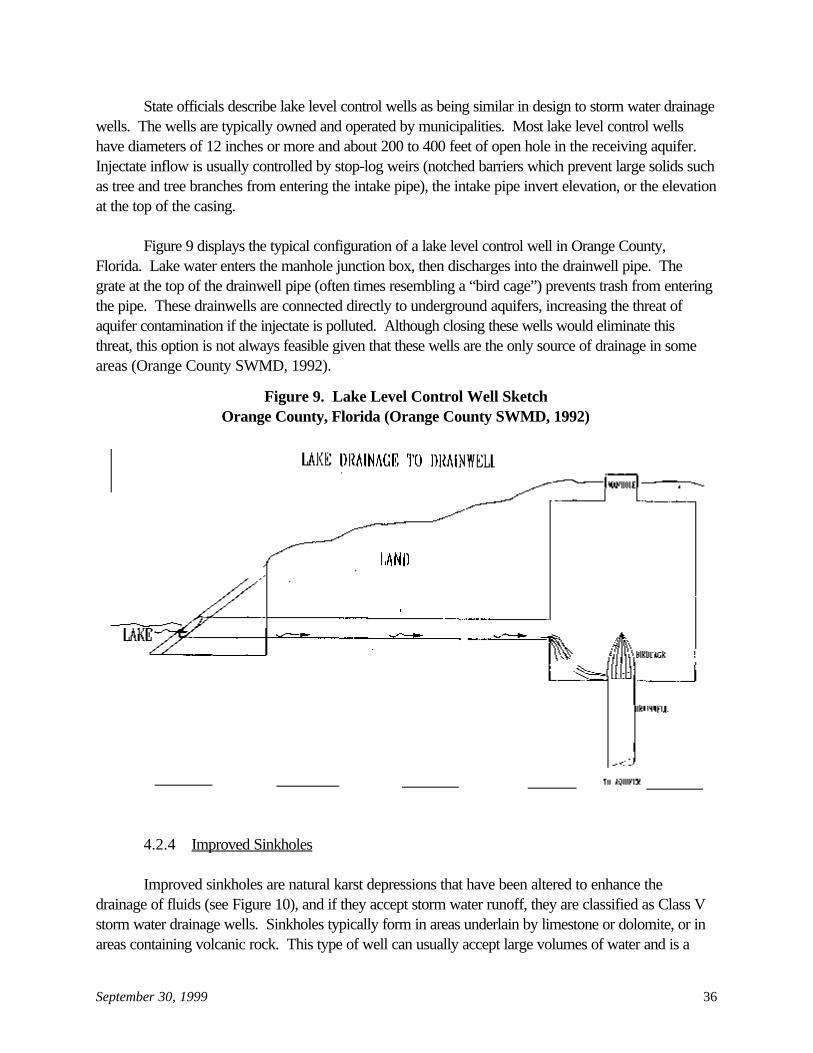
September 30, 1999 36
Figure 9. Lake Level Control Well SketchOrange County, Florida (Orange County SWMD, 1992)
State officials describe lake level control wells as being similar in design to storm water drainagewells. The wells are typically owned and operated by municipalities. Most lake level control wellshave diameters of 12 inches or more and about 200 to 400 feet of open hole in the receiving aquifer. Injectate inflow is usually controlled by stop-log weirs (notched barriers which prevent large solids suchas tree and tree branches from entering the intake pipe), the intake pipe invert elevation, or the elevationat the top of the casing.
Figure 9 displays the typical configuration of a lake level control well in Orange County,Florida. Lake water enters the manhole junction box, then discharges into the drainwell pipe. Thegrate at the top of the drainwell pipe (often times resembling a “bird cage”) prevents trash from enteringthe pipe. These drainwells are connected directly to underground aquifers, increasing the threat ofaquifer contamination if the injectate is polluted. Although closing these wells would eliminate thisthreat, this option is not always feasible given that these wells are the only source of drainage in someareas (Orange County SWMD, 1992).
4.2.4 Improved Sinkholes
Improved sinkholes are natural karst depressions that have been altered to enhance thedrainage of fluids (see Figure 10), and if they accept storm water runoff, they are classified as Class Vstorm water drainage wells. Sinkholes typically form in areas underlain by limestone or dolomite, or inareas containing volcanic rock. This type of well can usually accept large volumes of water and is a
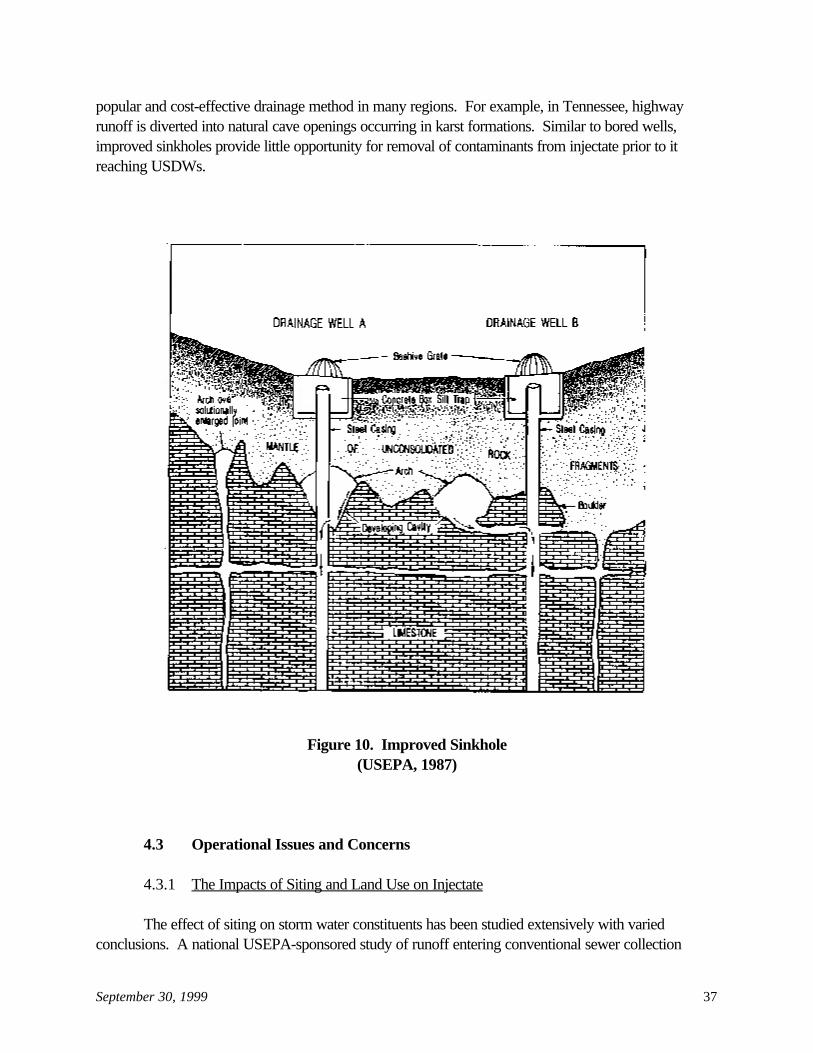
September 30, 1999 37
popular and cost-effective drainage method in many regions. For example, in Tennessee, highwayrunoff is diverted into natural cave openings occurring in karst formations. Similar to bored wells,improved sinkholes provide little opportunity for removal of contaminants from injectate prior to itreaching USDWs.
Figure 10. Improved Sinkhole(USEPA, 1987)
4.3 Operational Issues and Concerns
4.3.1 The Impacts of Siting and Land Use on Injectate
The effect of siting on storm water constituents has been studied extensively with variedconclusions. A national USEPA-sponsored study of runoff entering conventional sewer collection
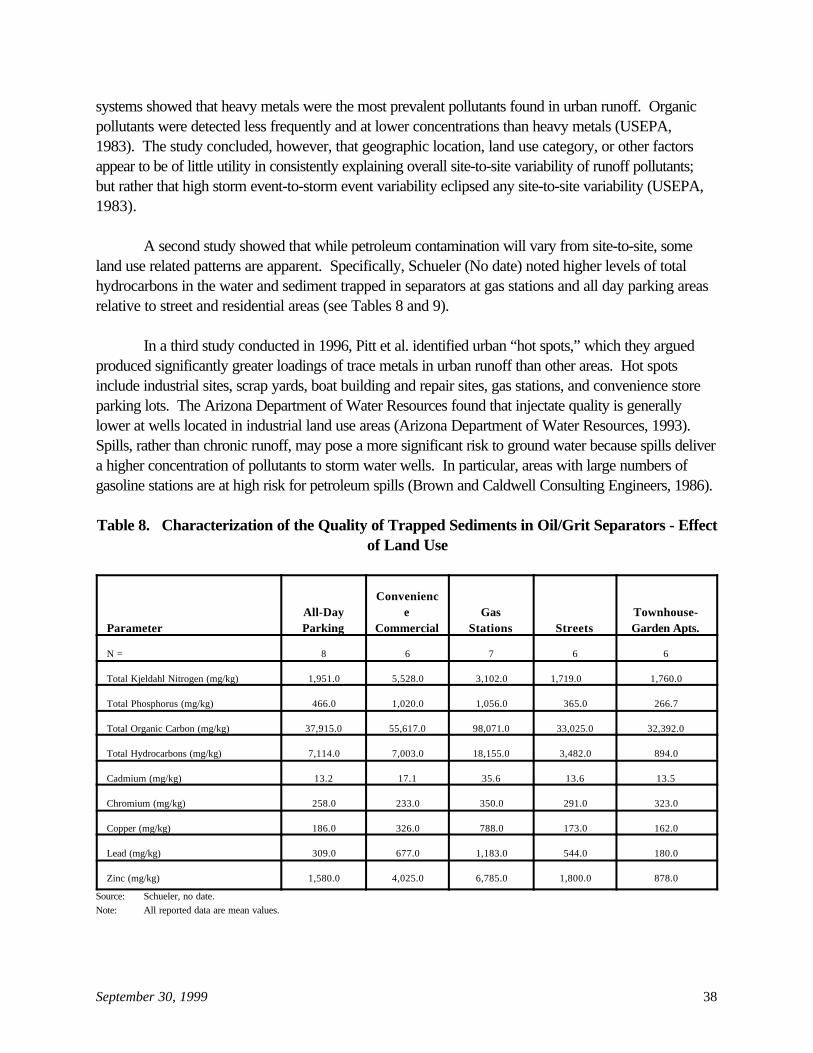
September 30, 1999 38
systems showed that heavy metals were the most prevalent pollutants found in urban runoff. Organicpollutants were detected less frequently and at lower concentrations than heavy metals (USEPA,1983). The study concluded, however, that geographic location, land use category, or other factorsappear to be of little utility in consistently explaining overall site-to-site variability of runoff pollutants;but rather that high storm event-to-storm event variability eclipsed any site-to-site variability (USEPA,1983).
A second study showed that while petroleum contamination will vary from site-to-site, someland use related patterns are apparent. Specifically, Schueler (No date) noted higher levels of totalhydrocarbons in the water and sediment trapped in separators at gas stations and all day parking areasrelative to street and residential areas (see Tables 8 and 9).
In a third study conducted in 1996, Pitt et al. identified urban “hot spots,” which they arguedproduced significantly greater loadings of trace metals in urban runoff than other areas. Hot spotsinclude industrial sites, scrap yards, boat building and repair sites, gas stations, and convenience storeparking lots. The Arizona Department of Water Resources found that injectate quality is generallylower at wells located in industrial land use areas (Arizona Department of Water Resources, 1993). Spills, rather than chronic runoff, may pose a more significant risk to ground water because spills delivera higher concentration of pollutants to storm water wells. In particular, areas with large numbers ofgasoline stations are at high risk for petroleum spills (Brown and Caldwell Consulting Engineers, 1986).
Table 8. Characterization of the Quality of Trapped Sediments in Oil/Grit Separators - Effectof Land Use
ParameterAll-DayParking
Convenience
CommercialGas
Stations StreetsTownhouse-Garden Apts.
N = 8 6 7 6 6
Total Kjeldahl Nitrogen (mg/kg) 1,951.0 5,528.0 3,102.0 1,719.0 1,760.0
Total Phosphorus (mg/kg) 466.0 1,020.0 1,056.0 365.0 266.7
Total Organic Carbon (mg/kg) 37,915.0 55,617.0 98,071.0 33,025.0 32,392.0
Total Hydrocarbons (mg/kg) 7,114.0 7,003.0 18,155.0 3,482.0 894.0
Cadmium (mg/kg) 13.2 17.1 35.6 13.6 13.5
Chromium (mg/kg) 258.0 233.0 350.0 291.0 323.0
Copper (mg/kg) 186.0 326.0 788.0 173.0 162.0
Lead (mg/kg) 309.0 677.0 1,183.0 544.0 180.0
Zinc (mg/kg) 1,580.0 4,025.0 6,785.0 1,800.0 878.0
Source: Schueler, no date.Note: All reported data are mean values.
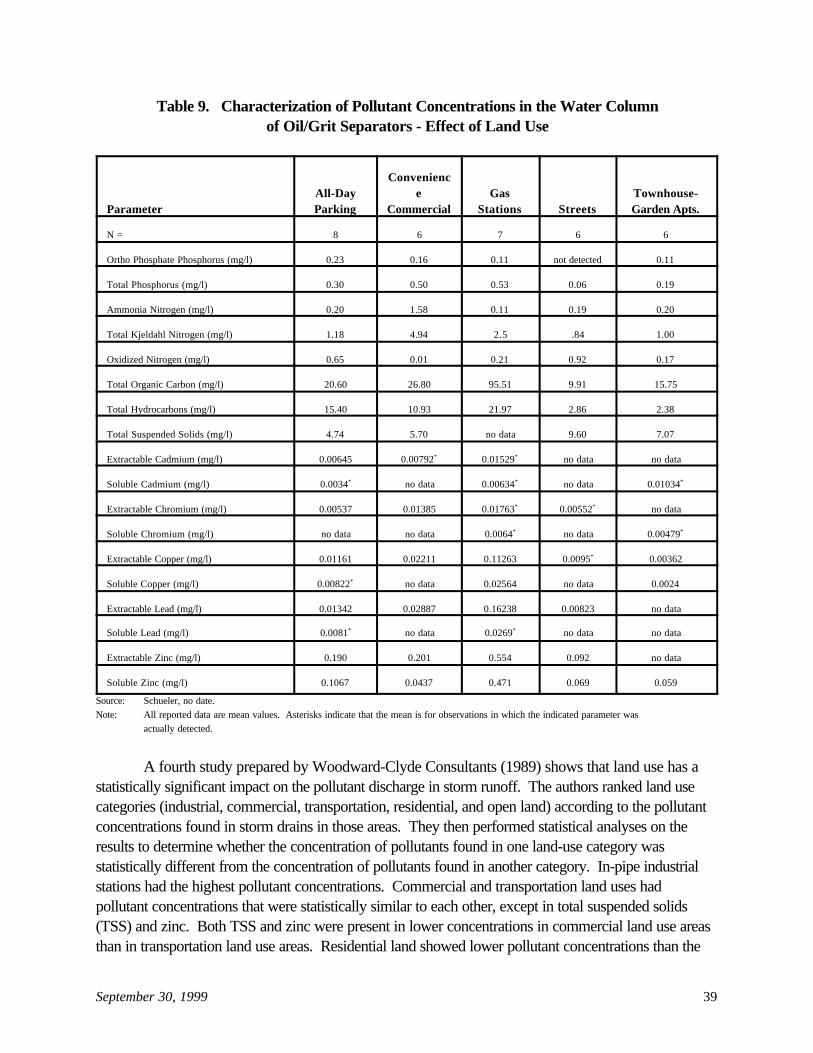
September 30, 1999 39
Table 9. Characterization of Pollutant Concentrations in the Water Columnof Oil/Grit Separators - Effect of Land Use
ParameterAll-DayParking
Convenience
CommercialGas
Stations StreetsTownhouse-Garden Apts.
N = 8 6 7 6 6
Ortho Phosphate Phosphorus (mg/l) 0.23 0.16 0.11 not detected 0.11
Total Phosphorus (mg/l) 0.30 0.50 0.53 0.06 0.19
Ammonia Nitrogen (mg/l) 0.20 1.58 0.11 0.19 0.20
Total Kjeldahl Nitrogen (mg/l) 1.18 4.94 2.5 .84 1.00
Oxidized Nitrogen (mg/l) 0.65 0.01 0.21 0.92 0.17
Total Organic Carbon (mg/l) 20.60 26.80 95.51 9.91 15.75
Total Hydrocarbons (mg/l) 15.40 10.93 21.97 2.86 2.38
Total Suspended Solids (mg/l) 4.74 5.70 no data 9.60 7.07
Extractable Cadmium (mg/l) 0.00645 0.00792* 0.01529* no data no data
Soluble Cadmium (mg/l) 0.0034* no data 0.00634* no data 0.01034*
Extractable Chromium (mg/l) 0.00537 0.01385 0.01763* 0.00552* no data
Soluble Chromium (mg/l) no data no data 0.0064* no data 0.00479*
Extractable Copper (mg/l) 0.01161 0.02211 0.11263 0.0095* 0.00362
Soluble Copper (mg/l) 0.00822* no data 0.02564 no data 0.0024
Extractable Lead (mg/l) 0.01342 0.02887 0.16238 0.00823 no data
Soluble Lead (mg/l) 0.0081* no data 0.0269* no data no data
Extractable Zinc (mg/l) 0.190 0.201 0.554 0.092 no data
Soluble Zinc (mg/l) 0.1067 0.0437 0.471 0.069 0.059
Source: Schueler, no date.Note: All reported data are mean values. Asterisks indicate that the mean is for observations in which the indicated parameter was
actually detected.
A fourth study prepared by Woodward-Clyde Consultants (1989) shows that land use has astatistically significant impact on the pollutant discharge in storm runoff. The authors ranked land usecategories (industrial, commercial, transportation, residential, and open land) according to the pollutantconcentrations found in storm drains in those areas. They then performed statistical analyses on theresults to determine whether the concentration of pollutants found in one land-use category wasstatistically different from the concentration of pollutants found in another category. In-pipe industrialstations had the highest pollutant concentrations. Commercial and transportation land uses hadpollutant concentrations that were statistically similar to each other, except in total suspended solids(TSS) and zinc. Both TSS and zinc were present in lower concentrations in commercial land use areasthan in transportation land use areas. Residential land showed lower pollutant concentrations than the
September 30, 1999 40
in-pipe industrial, commercial, and transportation land use areas. Concentrations from residential landwere not statistically different from concentrations found in open land, except for TSS and dissolvedcopper.
For the purpose of this study, storm water drainage wells are defined as wells that receiveprimarily storm water. However, some storm water wells that are designed to receive only storm waterare located in industrial settings where spills can enter the well or where storm water can pick upcontaminants as it flows over a polluted ground surface. This study defines storm water drainage wellsin which the incoming storm water is not separated from potential pollutant sources, such as loadingdocks and process areas, as industrial waste disposal wells rather than storm water wells, even if theywere originally designed to receive only non-industrial storm water.
Despite this attempt to differentiate between industrial wells and storm water drainage wells,there continues to be concern with both the potential for spilled materials to mix with storm water andenter a storm water drainage well and with the potential for “clean” storm water to be contaminated asit flows on the ground to the storm water well. Any future UIC rulemaking or guidance developmentactivities addressing storm water drainage wells, if determined to be necessary, will attempt to addressthe dividing line between these two well types more specifically.
5. POTENTIAL AND DOCUMENTED DAMAGE TO USDWS
Certain storm water pollutants may pose only minimal risks of ground water contaminationdepending on the type of drainage well used and the characteristics and concentrations of thecontaminants in the injectate. According to the 1987 Class V RTC, the majority of storm waterdrainage wells have been reported to inject surface runoff above USDWs (USEPA, 1987). Stormwater drainage wells that inject directly into USDWs are judged to have the highest relative potential tocontaminate a USDW because suspended materials in the runoff have no opportunity to be filtered bysubsurface sediments or removal through sedimentation before reaching ground water.
5.1 Injectate Constituent Properties
The primary constituent properties of concern when assessing the potential for Class V stormwater drainage wells to adversely affect USDWs are toxicity, persistence, and mobility. The toxicity ofa constituent is the potential of that contaminant to cause adverse health effects if consumed by humans. Appendix D of the Class V Study provides information on the health effects associated withcontaminants found above drinking water standards or health advisory limits in the injectate of stormwater drainage wells and other Class V wells. As discussed in Section 4.1, the contaminants that havebeen observed above drinking water standards or health advisory limits in storm water drainage wellinjectate are aluminum, antimony, arsenic, beryllium, cadmium, chloride, chromium, color, copper,cyanide, iron, lead, manganese, mercury, nickel, nitrate, pH, selenium, TDS, turbidity, zinc, benzene,benzo(a)pyrene, bis(2-ethylhexyl) phtlalate, chlordane, dichloromethane, fecal coliforms, methyl-tert-butyl-ether, pentachlorophenol, tetrachloroethylene, and trichloroethylene.
September 30, 1999 41
Persistence is the ability of a chemical to remain unchanged in composition, chemical state, andphysical state over time. Appendix E of the Class V Study presents published half-lives of commonconstituents in fluids released in storm water drainage wells and other Class V wells. All of the valuesreported in Appendix E are for ground water. Caution is advised in interpreting these values becauseambient conditions have a significant impact on the persistence of both inorganic and organiccompounds. Appendix E also provides a discussion of mobility of certain constituents found in theinjectate of storm water drainage wells and other Class V wells.
University of Arizona researchers analyzed the fate and transport potential of identifiedpollutants in storm water drainage well injectate (Wilson et al., 1992). Using a computer model, theyestablished a ranking matrix relating runoff chemicals, their properties, the properties of representativevadose zone layers, depth to ground water, and recommended depths of dry wells. Using theinteractive model Chemical Modeling in Layered Soils (CMLS), their simulations demonstrated thatorganic rich layers in the dry well sediments and in the vadose zone retarded the movement of all butthe most mobile organic compounds. CMLS predicted that the travel distances of metals are minimal. Wilson et al. (1992) discussed an unpublished master’s thesis that simulated drainage from a dry wellusing the saturated-unsaturated flow model UNSAY 2. Results indicate that greater attenuation anddilution can be expected when dry wells drain into fine-textured materials.
5.2 Observed Impacts
Three distinct types of contamination incidents associated with storm water drainage wells aredescribed in the literature. The first type occurs when residents or commercial businesses intentionallymisuse the storm water wells. The second type of contamination incident occurs when industriesunintentionally misuse storm water drains and the wells become contaminated. The final type involvesthe contamination of storm water wells located at or near industrial sites; these wells are contaminatedbecause of the nature of the runoff (Michael, 1997). Studies show that the most serious risks to publichealth occur when contaminants from industrial sites or spills run into storm water drainage wells.
This section summarizes known contamination incidents involving storm water drainage wellsand lake level control wells, and other studies on ground water impacts associated with these wells.
5.2.1 Storm Water Drainage Well Contamination Incidents
Contamination of USDWs by storm water drainage wells has been reported to varying degreesat locations in Ohio, Kansas, Wisconsin, California, Washington, Oklahoma, Tennessee, New York,Indiana, Florida, Kentucky, and Maryland (Cadmus Group, 1991, 1996; Michael, 1997; Orr, 1993;USEPA, 1997; Wilde, 1994). Haney et al. (1989) report fifteen sites in Arizona with ground watercontamination directly related to dry wells (i.e., storm water drainage wells). In many cases, bothcommunity and noncommunity drinking water supply wells have been contaminated or threatened. Sources of contamination cited in the literature include:
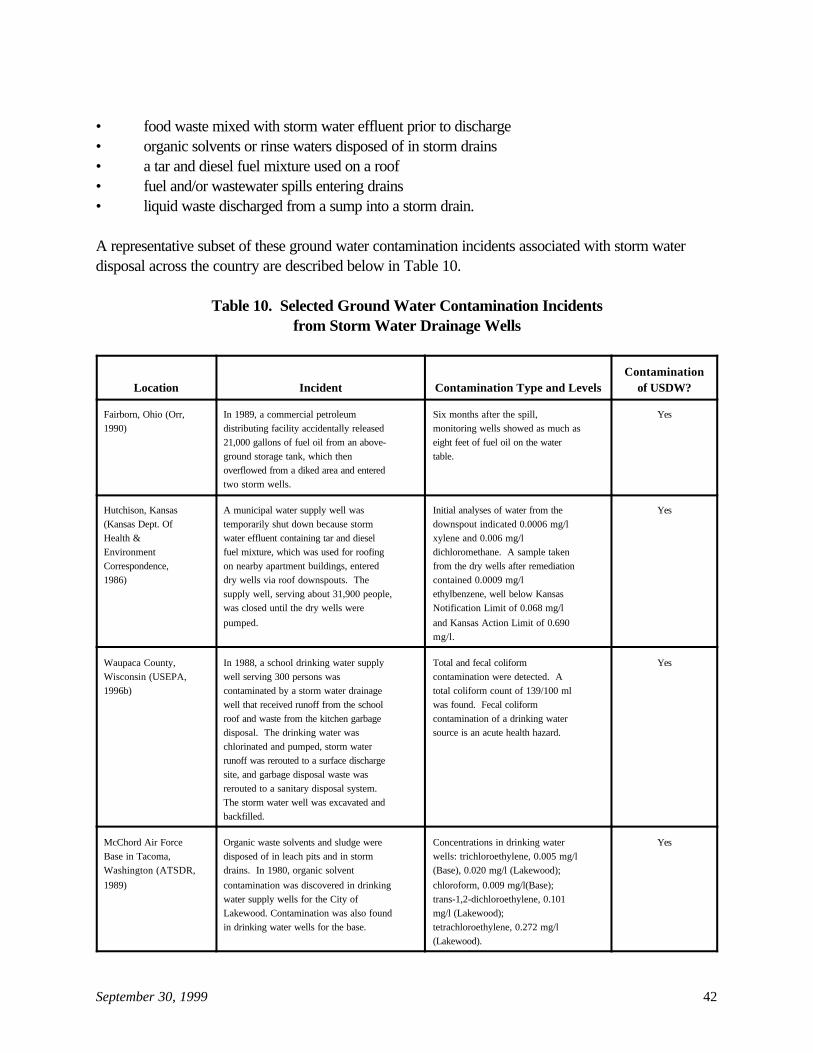
September 30, 1999 42
• food waste mixed with storm water effluent prior to discharge• organic solvents or rinse waters disposed of in storm drains• a tar and diesel fuel mixture used on a roof• fuel and/or wastewater spills entering drains• liquid waste discharged from a sump into a storm drain.
A representative subset of these ground water contamination incidents associated with storm waterdisposal across the country are described below in Table 10.
Table 10. Selected Ground Water Contamination Incidentsfrom Storm Water Drainage Wells
Location Incident Contamination Type and LevelsContamination
of USDW?
Fairborn, Ohio (Orr,1990)
In 1989, a commercial petroleumdistributing facility accidentally released21,000 gallons of fuel oil from an above-ground storage tank, which thenoverflowed from a diked area and enteredtwo storm wells.
Six months after the spill,monitoring wells showed as much aseight feet of fuel oil on the watertable.
Yes
Hutchison, Kansas(Kansas Dept. OfHealth &EnvironmentCorrespondence,1986)
A municipal water supply well wastemporarily shut down because storm water effluent containing tar and dieselfuel mixture, which was used for roofingon nearby apartment buildings, entereddry wells via roof downspouts. Thesupply well, serving about 31,900 people,was closed until the dry wells were
pumped.
Initial analyses of water from thedownspout indicated 0.0006 mg/lxylene and 0.006 mg/ldichloromethane. A sample takenfrom the dry wells after remediationcontained 0.0009 mg/lethylbenzene, well below KansasNotification Limit of 0.068 mg/l
and Kansas Action Limit of 0.690mg/l.
Yes
Waupaca County,Wisconsin (USEPA,1996b)
In 1988, a school drinking water supplywell serving 300 persons wascontaminated by a storm water drainagewell that received runoff from the schoolroof and waste from the kitchen garbagedisposal. The drinking water waschlorinated and pumped, storm waterrunoff was rerouted to a surface dischargesite, and garbage disposal waste wasrerouted to a sanitary disposal system. The storm water well was excavated andbackfilled.
Total and fecal coliformcontamination were detected. Atotal coliform count of 139/100 mlwas found. Fecal coliformcontamination of a drinking watersource is an acute health hazard.
Yes
McChord Air ForceBase in Tacoma,Washington (ATSDR,
1989)
Organic waste solvents and sludge weredisposed of in leach pits and in stormdrains. In 1980, organic solvent
contamination was discovered in drinkingwater supply wells for the City ofLakewood. Contamination was also foundin drinking water wells for the base.
Concentrations in drinking waterwells: trichloroethylene, 0.005 mg/l(Base), 0.020 mg/l (Lakewood);
chloroform, 0.009 mg/l(Base);trans-1,2-dichloroethylene, 0.101mg/l (Lakewood);tetrachloroethylene, 0.272 mg/l(Lakewood).
Yes

Table 10. Selected Ground Water Contamination Incidentsfrom Storm Water Drainage Wells (cont’d)
Location Incident Contamination Type and LevelsContamination
of USDW?
September 30, 1999 43
Oak Grove, Kentucky On April 16, 1998, the city water plantwas shut down due to a severe storm thatcaused a sharp increase in raw turbidity. The area has several storm waterdrainage wells as well as sinkholes andcaves. USEPA is directing storm waterdrainage well owners to run a dye trace todetermine which wells are responsible forthe siltation problem.
Prior to shutdown the raw turbiditywas 6.5 NTU; at start-up the rawturbidity was 1,750 NTU and Alumfeed rates were 344 mg/l. By April19, 1998, the turbidity readings weredown to 13 NTU and the plant wasoperating normally.
Yes
Valparaiso, Indiana Storm water runoff from road salt pilesmaintained by the Indiana Department ofTransportation entered storm waterdrainage wells. This resulted in thecreation of a chloride plume in the
shallow aquifer. The plume is migratingtoward Valparaiso’s public water supplywells.
Maximum concentrations of sodiumchloride found in the ground waterthus far is 10,000 mg/l. Sodiumchloride concentrations average inthe 200 - 400 mg/l range.
Withinapproximately 12months.
Source: Cadmus, 1999
Additional examples of contamination events include the following:
• The Southland Corporation’s dry wells in Los Gatos, CA, which are a part of the storm waterdrainage system, caused significant ground water contamination with gasoline. Specifically,ground water was contaminated with gasoline and other chemicals originating from SouthlandCorporation, a commercial site where it is alleged that surface spills of fuel and other chemicalswashed into the dry wells (Cadmus, 1999).
• Industrial waste water and wash water from Glass-Tek in Morgan Hill, CA were dischargedinto a storm water retention pond with three dry wells in the bottom of the pond. Thecontaminants were volatile organic solvents, primarily TCE, some cis-1,2-DCE, and a littleTCA. TCE concentrations in February 1993 were as high as 2.2 mg/l. (The MCL for TCE is0.005 mg/l.) The ground water plume is over 2,500 feet long and at least 200 feet deep. As ofNovember 13, 1998, the situation is exacerbated by the presence of several storm waterretention ponds and other dry wells in the area above and adjacent to the plume. The potentialfor damage is high because the well is within the sensitive ground water recharge area for SouthCounty where ground water is the only source of water (Cadmus, 1999).
• The presence of chromium, copper, lead, zinc, and motor oil led to the closure of six rock wells(i.e., storm water drainage wells) in Modesto, CA. The rock well monitoring results appear tobe fairly comparable to street sweepings in terms of the levels of the metals. Also, motor oilwas detected in five of the six rock wells sampled. These motor oil results highlight theimportance of the Illicit Discharges Program Element of the City's NPDES Stormwater
September 30, 1999 44
Program which has as its primary goal the elimination of illegal dumping into the City's stormdrain system. In Mountain View, CA, dry wells led to the contamination of ground water andsoil with dichloromethane and pentachlorophenol. The contamination was within three miles ofdrinking water wells that serve 333,000 people (Cadmus, 1999).
• In Bellevue, Ohio, the disposal of raw sewage in wells began in the late 1800's and continueduntil 1971. Nearly every dwelling and industrial plant had a well, ranging from 35 to 270 feetdeep, for disposing of sewage (Orr, 1990). Despite regulations banning the disposal of rawsewage, several drainage wells in Bellevue, Ohio still continue to receive sewage through theconnection of perimeter drains to septic systems. The perimeter drains are then tied intosinkholes or storm water drainage wells. Ground water in an area five miles wide and fifteenmiles long was contaminated, affecting municipal wells and private drinking water wells. Ruralwells outside the city still show contamination and have coliform levels that exceed safe drinkingwater limits. As a result of the contamination, alternative supplies of drinking water needed tobe distributed in the Bellevue area, including the use of cisterns to capture rain water. Inaddition, homeowners with private drinking water wells installed settling tanks to reduce thelevel of mud and debris in their drinking water. Today, only surrounding communities that drawtheir drinking water directly from underground sources via private wells are still affected; thecity of Bellevue now relies on a reservoir for drinking water (Orr, 1990).
5.2.2 Storm Water Drainage Wells: Other Contamination Incidents and Studies
Several contamination incidents have also been reported by the Department of EnvironmentalProtection (DEP) Central District , DEP Southeast District, and Miami-Dade areas in Florida. A totalof 607 drainage wells (lake level control and storm water wells) in the Ocala, Live Oak, Orlando, andother areas were tested. Turbidity, color, total recoverable chromium, iron, lead, and manganese wereequal to or exceeded the standards. Coliform bacteria was also present in varying concentrations. Storm runoff tested at these sites showed similar results (Cadmus, 1999).
A study by the Ohio Environmental Protection Agency documented several cases of intentionalabuse of storm water drainage wells (Orr, 1993). Fairfield, Ohio had an estimated 2,900 stormdrainage wells and catch basins in use. Many individuals routinely used these drainage wells to disposeof a wide variety of wastes, some of which may be hazardous. It is reportedly a common practice forindividuals to dispose of used oil and antifreeze by dumping it into the drainage basins. Street crewsroutinely removed a variety of items from the drainage wells. In one instance, a well contained morethan 20 used oil filters. The high transmissivity of the sand and gravel aquifer in Fairfield suggested thatany contaminants reaching the aquifer are unlikely to be attenuated.
Additionally, Pitt et al. (1993) identified several common “non-storm water” entries to stormwater drainage wells. These included:
September 30, 1999 45
• Sanitary wastewater sources: wastewater from sewage connections improperly hooked up tostorm water drains and exfiltration, leakage, or effluent from improperly operating or designednearby septic tanks.
• Automobile maintenance and operation sources: car wash wastewater, radiator flushingwastewater, degreasing wastes, improper oil disposal, or leaky underground storage tanks.
• Irrigation sources: lawn runoff from over watering or direct spraying of impervious sources.
• Relatively clean sources: infiltrating ground water, water routed from springs or streams, orleakage from water mains.
Sanitary wastewater is the most significant source of bacteria and oxygen-demandingsubstances, while automobile maintenance waste is the most significant source of toxicants (Pitt et al.,1993). Possibly 25 percent of separate storm water drains or systems have water flowing in themduring dry weather, and as many as 10 percent are grossly contaminated with raw sewage and industrial wastewater (Pitt et al., 1996).
5.2.3 Lake Level Control Wells Contamination Incidents
Prior to 1987, a lake level control well was constructed on Lake Johio, in Orange County,Florida, to remove water beneath the land surface and to regulate the lake’s level. Although lake levelcontrol wells are not constructed for the purpose of moving air beneath the land surface, this sometimesoccurs (Watroba, 1999). It was discovered that air pockets trapped beneath the land surface migratedto various wells around Lake Johio and prevented them from yielding water. In 1987, the City ofOcoee annexed properties around Lake Johio, including property containing the lake level control well. Therefore, Orange County transferred custodianship responsibility for the well to the City of Ocoee;however, the city has not accepted responsibility for the well. In early 1998, residents in the JohioShores area issued complaints with the Orange County Health Department that water from their privatewells had the smell and appearance of lake water. The Orange County Health Department sampledfive residential wells in the area and detected some background microorganisms but no coliforms. Water quality analyses of a private well sample near Johio Shores indicated the presence of iron andsulfur reducing bacteria (Crenthrix polyspora and Beggiatoa alba), which have the ability totransform or deposit significant amounts of sulfur, which in turn leads to an objectionable slime in wellwater. Iron bacteria can be associated with fouling and plugging of wells and may result in customercomplaints of red/black and/or gray/tan water. Sulfur bacteria may also cause odor, taste, frothing, andcolor problems in well water. Colonies of Aspergillus and Acinetobacter, which are normally found inair and thus not expected to survive for a significant length of time in a well, were also detected. Afterthese bacteria die off, they become a nutrient source for other bacteria, thus increasing the bacteriacount in the well water. Analyses also indicated the presence of the following algae: Microthamnion,Agenellum, Anacystis, Gleotrichia, and Cladaphora. When algae becomes discolored or viscous, itcan cause clogging in plumbing systems and discolored and/or foul smelling water supplies. Decayedalgae can also be a nutrient for many waterborne bacterial contaminants, thus increasing the bacterialcount in a water supply (Cadmus, 1999).
September 30, 1999 46
The Florida Department of Environmental Protection (DEP) describes another contaminationincident that took place near Lake Orienta, Altamonte Springs, Florida (data from this well are includedin previous sections). In 1993, flooding occurred in Lake Orienta, causing nearby private drinkingwater wells to be contaminated. Because the drainage well injectate did not meet MCLs, the Statecould not issue a permit for the well. To avoid further damage caused by flooding, DEP issued severalemergency authorizations to operate the well from March to November 1993, in January 1996, and inNovember 1996. During November 1996, monitoring was required for the injected fluids during thefirst 30 days and every three months thereafter while using the drainage wells (Cadmus, 1999).
6. BEST MANAGEMENT PRACTICES
A variety of best management practices (BMPs) can be implemented to minimize the potentialfor contamination of USDWs resulting from storm water drainage wells. The BMPs can be organizedinto the following five general categories: (1) siting, (2) design, (3) operation, (4) education andoutreach to prevent misuse, and (5) proper closure, plugging and abandonment. The proper design andsiting of the storm water drainage well minimizes the likelihood of both accidental and routinecontamination resulting from either poor operational practices or misuse. This section assesses some ofthese BMP techniques and their effectiveness in controlling USDW contamination by storm waterrunoff. The following discussion is not exhaustive and does not represent a USEPA preference for anyspecific BMP.
6.1 Siting BMPs
The goal of many agency officials is to minimize the likelihood of contaminants reaching thestorm water drainage well in a concentrated form, and to provide separation horizontally and verticallybetween the storm water disposal device and potential receptors of pollution such as aquifers, drinkingwater wells, and surface waters. Soil and water table conditions must be suitable for infiltration ofstorm water runoff and attenuation of contaminant concentrations. The geology, topography, andclimate of an area greatly impact the effectiveness of a BMP in controlling contamination due to runoff;therefore, selection of BMPs must be made on a site-by-site basis. As a general guideline, the greaterthe separation distance between a storm water drainage well and ground water, the less the threat ofcontamination.
Evidence indicates that proper siting practices have been neglected. For example, in the 1995San Francisco Bay Region Water Quality Control Plan, a survey conducted by the regional board staffand USEPA indicated that a number of municipalities and industries haphazardly installed storm waterdrainage wells and that construction and usage had been prevalent in the area and had gone virtuallyunregulated (San Francisco Bay Region Water Quality Control Plan, no date).
Storm water drainage wells which allow runoff to flow directly into the subsurface (e.g., somedry wells, bored wells, and improved sinkholes) generally pose a greater risk to USDWs than wells thathave permeable barriers that can offer filtering mechanisms (e.g., vegetative infiltration basins). Table
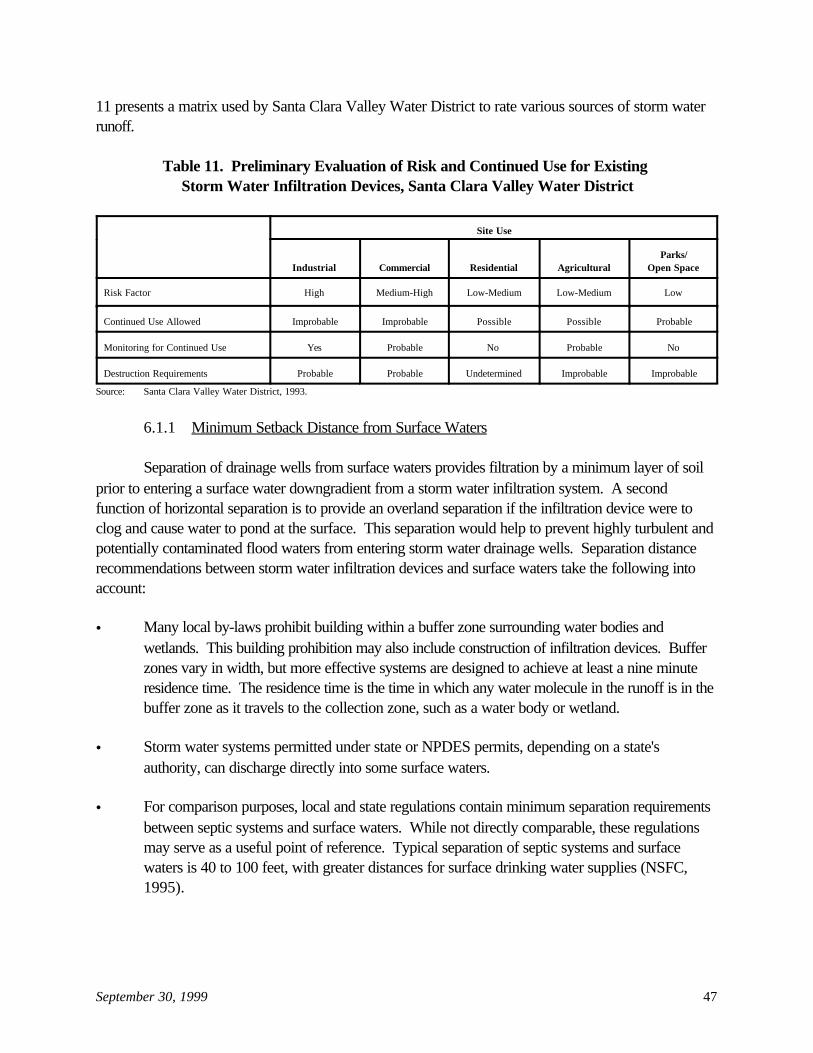
September 30, 1999 47
11 presents a matrix used by Santa Clara Valley Water District to rate various sources of storm waterrunoff.
Table 11. Preliminary Evaluation of Risk and Continued Use for Existing Storm Water Infiltration Devices, Santa Clara Valley Water District
Site Use
Industrial Commercial Residential AgriculturalParks/
Open Space
Risk Factor High Medium-High Low-Medium Low-Medium Low
Continued Use Allowed Improbable Improbable Possible Possible Probable
Monitoring for Continued Use Yes Probable No Probable No
Destruction Requirements Probable Probable Undetermined Improbable Improbable
Source: Santa Clara Valley Water District, 1993.
6.1.1 Minimum Setback Distance from Surface Waters
Separation of drainage wells from surface waters provides filtration by a minimum layer of soilprior to entering a surface water downgradient from a storm water infiltration system. A secondfunction of horizontal separation is to provide an overland separation if the infiltration device were toclog and cause water to pond at the surface. This separation would help to prevent highly turbulent andpotentially contaminated flood waters from entering storm water drainage wells. Separation distancerecommendations between storm water infiltration devices and surface waters take the following intoaccount:
• Many local by-laws prohibit building within a buffer zone surrounding water bodies andwetlands. This building prohibition may also include construction of infiltration devices. Bufferzones vary in width, but more effective systems are designed to achieve at least a nine minuteresidence time. The residence time is the time in which any water molecule in the runoff is in thebuffer zone as it travels to the collection zone, such as a water body or wetland.
• Storm water systems permitted under state or NPDES permits, depending on a state'sauthority, can discharge directly into some surface waters.
• For comparison purposes, local and state regulations contain minimum separation requirementsbetween septic systems and surface waters. While not directly comparable, these regulationsmay serve as a useful point of reference. Typical separation of septic systems and surfacewaters is 40 to 100 feet, with greater distances for surface drinking water supplies (NSFC,1995).
September 30, 1999 48
6.1.2 Minimum Setback Distance from Drinking Water Wells
The distance that a contaminant will travel from its source to a receptor such as a drinkingwater well will vary greatly depending on the depth of injection, volume and rate of rainfall, contaminantconcentration in the injectate, soil characteristics (e.g., texture, pH, ability to remove contaminants), thedirection and velocity of ground water flow, and other factors such as ground water pH and groundwater table fluctuations. A site investigation to determine an optimum distance of separation for eachaffected site may not be practical. Because of the dependence of contaminant transport on localclimate, geology and land use, no one value can be given to define separation distances for the entirecountry. Many states and counties develop guidance on separation distances based on local factors.
6.1.3 Minimum Separation from Water Table
Contaminants that are readily removed by attraction to soil particles are less likely tocontaminate ground water when the injection well does not directly discharge into ground water. Forthis reason, several design recommendations include a minimum separation between the bottom of astorm water drainage well and the seasonal high ground water table. The extent to which contaminantsare removed by soils depends on numerous factors (see Section 5). The height of ground water can bedetermined by examining soil strata for evidence of mottling (i.e., orange or dark reddish/brown spotsformed from the oxidation of iron and manganese). Direct observation of ground water levels is lessreliable because it only provides a snapshot of the ground water level and may not reflect the seasonalhigh level.
6.1.4 Prohibition from Some Areas of Critical Concern
A state or local agency or Indian tribe may find it desirable to prohibit storm water drainagewells from certain critical areas, for example, within drinking water well protection zones (e.g., sourcewater protection areas), near waters of exceptional high quality such as Outstanding National ResourceWaters, or adjacent to wetlands. Other areas where storm water wells may be banned include:brownfields, contaminated site clean-ups, and areas prone to landslides or slope instability. Severalstates actively discourage or prohibit dry wells, depending on site conditions. For example,Washington discourages the use of storm water drainage wells in areas that rely solely on their USDWfor drinking water (see Section 7).
6.1.5 Minimum Engineering Design/Soil Performance Specifications
Many state or local infiltration regulations are based not on environmental protection, but onengineering and drainage specifications contained in plumbing and building codes. Effective methodsfor regulating new construction of storm water drainage wells under consideration by several statesinclude changes to existing plumbing and building codes (see Section 7). In general, good designpractice dictates that infiltration devices are not to be constructed in fill, in soils with high silt/claycontent, and in soils with low infiltration rates. Conversely, the maximum allowed infiltration rate willprevent installation of storm water drainage wells where storm water moves extremely rapidly through

September 30, 1999 49
the soil. These design specifications, based on the infiltration rate, are intended primarily to preventfailure of the infiltration device rather than to protect ground water. High clay content in the soil isdesirable in filtering contaminants, particularly metals, from the storm water. The designer must balancethe infiltration capacity against the filtering ability of the soil when siting an infiltration device. The typeand concentration of contaminants must be considered along with the expected flow rates and volumesin determining whether a site is suitable for an infiltration device. Even in soils with adequate infiltrationrates, a heavy influx of oils, other organic compounds, and sediments introduced into the storm waterdrainage well can decrease the infiltration rate and cause an early failure of the well.
As noted in Section 6.1.3, certain contaminants (e.g., chlorides) do not sorb onto soil particlesand therefore travel readily with ground water. In locales where storm water drainage wells exist alongroadways, the local transportation authority may consider using sand or other gritty materials, ratherthan salt, to provide traction. To prevent clogging of the storm water drainage well in areas where gritmaterials are used in place of road salt, large settling basins and/or filter strips may be included in thewell design. Operators often schedule more frequent maintenance of storm water drainage structures,particularly in the late winter and spring, in areas where sand or grit is used in place of road salt.
6.2 Design BMPs
Design features can minimize the risk of contaminating drinking water sources and are often lessexpensive to install during construction than later as a retrofit. The following discussion of well designsand pretreatment systems is intended to provide a brief overview of the types of systems in use that canreduce the potential for pollution of ground water by storm water injection wells.
6.2.1 Sediment Removal
Sediment carried in storm water runoff will enter a storm water drainage well unless the wellincludes devices for removing that sediment. Sediment poses three problems: (1) it can clog theinfiltration system causing it to fail; (2) contaminants including metals, pesticides, and phosphorus, canattach to sediments and be carried into ground water systems, leading to possible contamination; and(3) wells that directly inject into USDWs may have sediment levels that, for hours or days, render thewater unfit for human consumption in nearby wells. In many instances where the sediment load is veryhigh, the infiltration system will clog and cause an unplanned discharge to surface waters before asignificant amount of contamination can be carried by sediment into the ground water.
Pretreatment methods used for preventing sediment from entering storm water infiltrationdevices include oil/grit separators, settling basins (catch basins or detention or retention basins), andfilter strips and swales.
One of the chief difficulties with many storm water drainage wells lacking pretreatment devicesis that they tend to clog with fine sediment, slowing the rate of infiltration into the soil. In many cases,the sediment enters the basin or dry well during construction of the facility. Measures to preventsediment from entering the infiltration device include temporary diversions such as sediment traps,

September 30, 1999 50
Figure 11. Typical Separator Design(USEPA, 1998c)
roping off the well area to prevent construction equipment or other traffic from compacting soil, andstabilizing the area around the well by planting vegetation. After the site is fully stabilized, the siteoperator can remove the sediment and excavate the remainder of the well.
Oil/Grit Separators
Oil/grit separators, also called water quality inlets, consist of one or more chambers designed toallow sediments to settle out prior to entering the storm water well. Many separator designs alsocontain baffles so that the uppermost layer of water in each of the separator chambers is retained. Material such as oil floating on top of the trapped water is retained and can be removed when theseparator is cleaned. Sediment that is heavier than water will settle out at a rate determined by thedensity and size of the sediment particles and the time allowed for settling. The portion of sediment thatis removed is determined in part by the speed of water flowing through the separator, relative to thesettling speed of the sediment and the depth of the separator. When a separator retains water longenough to allow particles to settle or rise to the surface, it is effective at retaining sediment. If theholding time is too short, particles remain in suspension and are passed to the infiltration system. Atypical separator design is shown in Figure 11. If not properly designed and frequently cleaned,separators may also allow trapped sediment to be resuspended and pass out of the separator duringsubsequent flow events.

September 30, 1999 51
The advantage to using separators is that they employ basic principles that are well understoodand are easily incorporated into the design of the system by storm water engineers. They are relativelysimple to construct, are available as pre-fabricated units or can be custom built from standard fittings,and are relatively easy to maintain. Disadvantages of separators include: increased cost of a stormwater drainage well; required periodic cleaning and maintenance which may necessitate costlyequipment such as a jet pump; and questionable effectiveness, particularly in separating dispersedpetroleum products (which depends greatly on the separator design and its associated holding time).
Filter Strips and Swales
Filter strips and swales are vegetated buffers that trap sediment before it enters infiltrationdevices. Filter strips typically are at least 20 feet wide. The width of the strip is based on flow, sitecharacteristics and pollutant loading. Pollutant removal is achieved by the filtering action of vegetation,settling into low velocity areas, or infiltration into the subsoil. Filter strips are generally graded to lessthan 2 percent so that water flows over them in sheets rather than as a concentrated stream. Sheet flowdecreases the possibility of gully erosion and distributes contaminants over a wider area. Levelspreaders such as slotted curbs may also be used to facilitate sheet flow. Vegetation also protects soilfrom being eroded. Roots and fauna in the soil also provide pore space for infiltration. Nativevegetation requires less maintenance (e.g., pesticides or fertilizers). Filter strips are generally used inagricultural low density development areas and cannot treat high velocity flows (New JerseyDepartments of Environmental Protection and Agriculture, 1994).
Catch Basin Inserts
Catch basins are often used to hold water before it flows to infiltration devices. Catch basininserts can remove oil, grease, and metals in runoff. The inserts consist of several filtration trays thathang down from the inlet grate. The top tray is an oil/grit separator, and the lower trays may beactivated charcoal, which trap pesticides, fertilizers, and metals; reconstituted wood fiber, which trapsoil and grease; or fiberglass insulation. While these inserts can remove potential contaminants, theyrequire at least monthly inspection and maintenance and require more frequent inspection during wetperiods. Additionally, inserts clog easily, preventing passage of storm water, and are hard to removewithout proper equipment.
6.2.2 Oil and Grease Separators
Petroleum products contain components such as benzene, which are known humancarcinogens, that can potentially contaminate ground water. Petroleum can enter a storm waterdrainage well from: (1) accidental spills, (2) intentional misuse through disposal of automotive products(e.g., used motor oil), and (3) oil residue washed from pavement. As discussed above, oil/gritseparators can remove some oil before it enters infiltration devices. These separators, however, are notvery effective in removing oil droplets that are either entrained or dispersed within the flow, as well asmiscible oils.
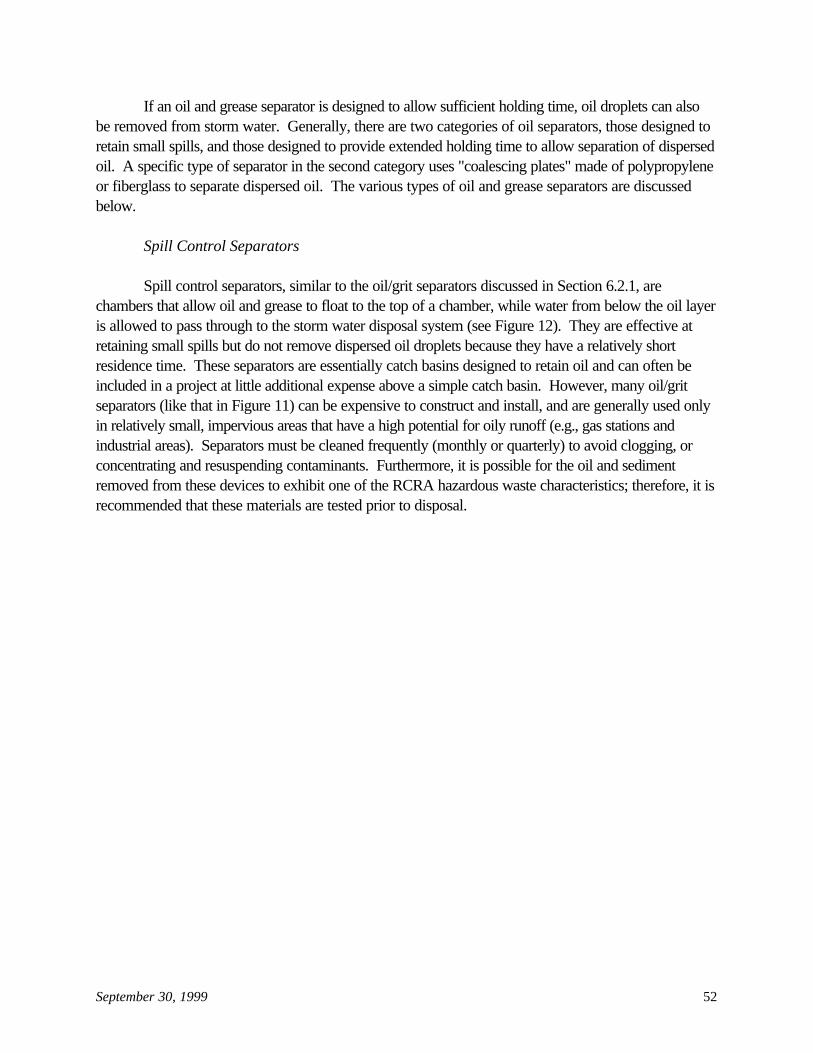
September 30, 1999 52
If an oil and grease separator is designed to allow sufficient holding time, oil droplets can alsobe removed from storm water. Generally, there are two categories of oil separators, those designed toretain small spills, and those designed to provide extended holding time to allow separation of dispersedoil. A specific type of separator in the second category uses "coalescing plates" made of polypropyleneor fiberglass to separate dispersed oil. The various types of oil and grease separators are discussedbelow.
Spill Control Separators
Spill control separators, similar to the oil/grit separators discussed in Section 6.2.1, arechambers that allow oil and grease to float to the top of a chamber, while water from below the oil layeris allowed to pass through to the storm water disposal system (see Figure 12). They are effective atretaining small spills but do not remove dispersed oil droplets because they have a relatively shortresidence time. These separators are essentially catch basins designed to retain oil and can often beincluded in a project at little additional expense above a simple catch basin. However, many oil/gritseparators (like that in Figure 11) can be expensive to construct and install, and are generally used onlyin relatively small, impervious areas that have a high potential for oily runoff (e.g., gas stations andindustrial areas). Separators must be cleaned frequently (monthly or quarterly) to avoid clogging, orconcentrating and resuspending contaminants. Furthermore, it is possible for the oil and sedimentremoved from these devices to exhibit one of the RCRA hazardous waste characteristics; therefore, it isrecommended that these materials are tested prior to disposal.

September 30, 1999 53
Figure 12. Spill Control Separator(USEPA, 1998c)
American Petroleum Institute Oil Separators
This type of separator consists of long vaults designed to retain storm water long enough forfinely dispersed oil droplets to rise to the surface (see Figure 13). Design of these oil separators isdiscussed in American Petroleum Institute (1991). Because of its relative complexity, use of this typeof separator is only recommended where there is a relatively high likelihood of dispersed oilcontamination (e.g., petroleum distribution sites). Otherwise, alternative strategies are typicallyemployed to minimize or eliminate the source of the oil prior to its entry into the storm waterconveyance system.
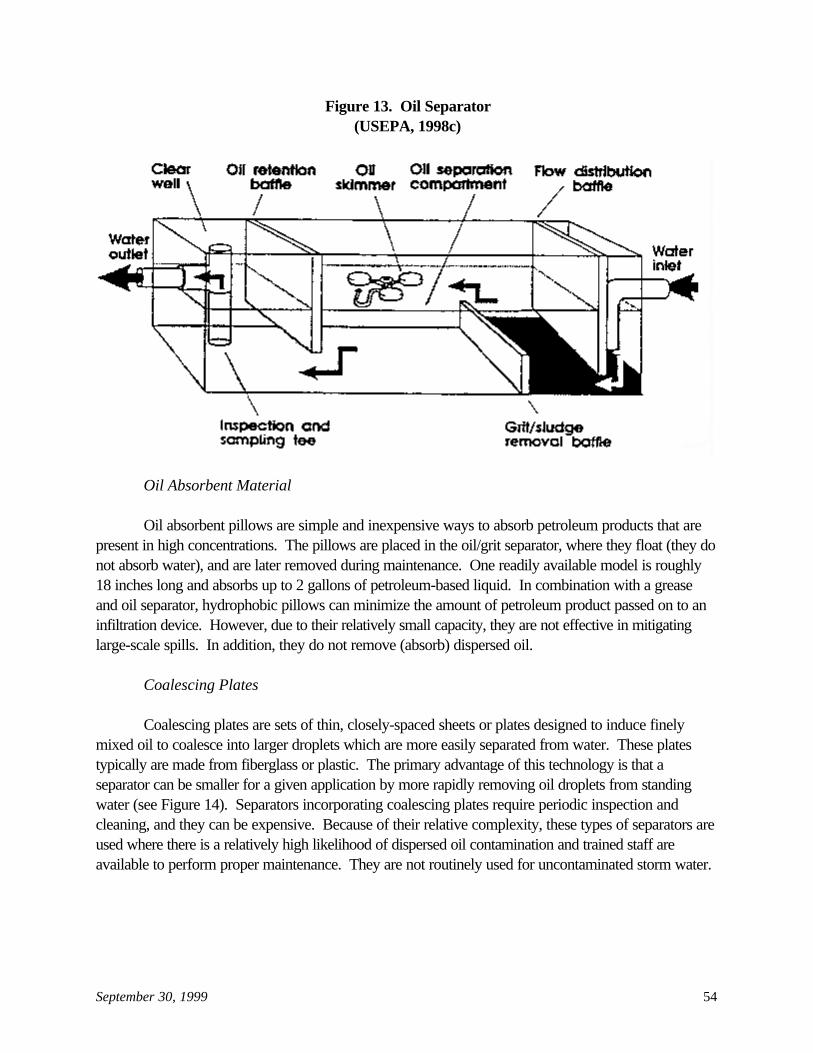
September 30, 1999 54
Figure 13. Oil Separator(USEPA, 1998c)
Oil Absorbent Material
Oil absorbent pillows are simple and inexpensive ways to absorb petroleum products that arepresent in high concentrations. The pillows are placed in the oil/grit separator, where they float (they donot absorb water), and are later removed during maintenance. One readily available model is roughly18 inches long and absorbs up to 2 gallons of petroleum-based liquid. In combination with a greaseand oil separator, hydrophobic pillows can minimize the amount of petroleum product passed on to aninfiltration device. However, due to their relatively small capacity, they are not effective in mitigatinglarge-scale spills. In addition, they do not remove (absorb) dispersed oil.
Coalescing Plates
Coalescing plates are sets of thin, closely-spaced sheets or plates designed to induce finelymixed oil to coalesce into larger droplets which are more easily separated from water. These platestypically are made from fiberglass or plastic. The primary advantage of this technology is that aseparator can be smaller for a given application by more rapidly removing oil droplets from standingwater (see Figure 14). Separators incorporating coalescing plates require periodic inspection andcleaning, and they can be expensive. Because of their relative complexity, these types of separators areused where there is a relatively high likelihood of dispersed oil contamination and trained staff areavailable to perform proper maintenance. They are not routinely used for uncontaminated storm water.
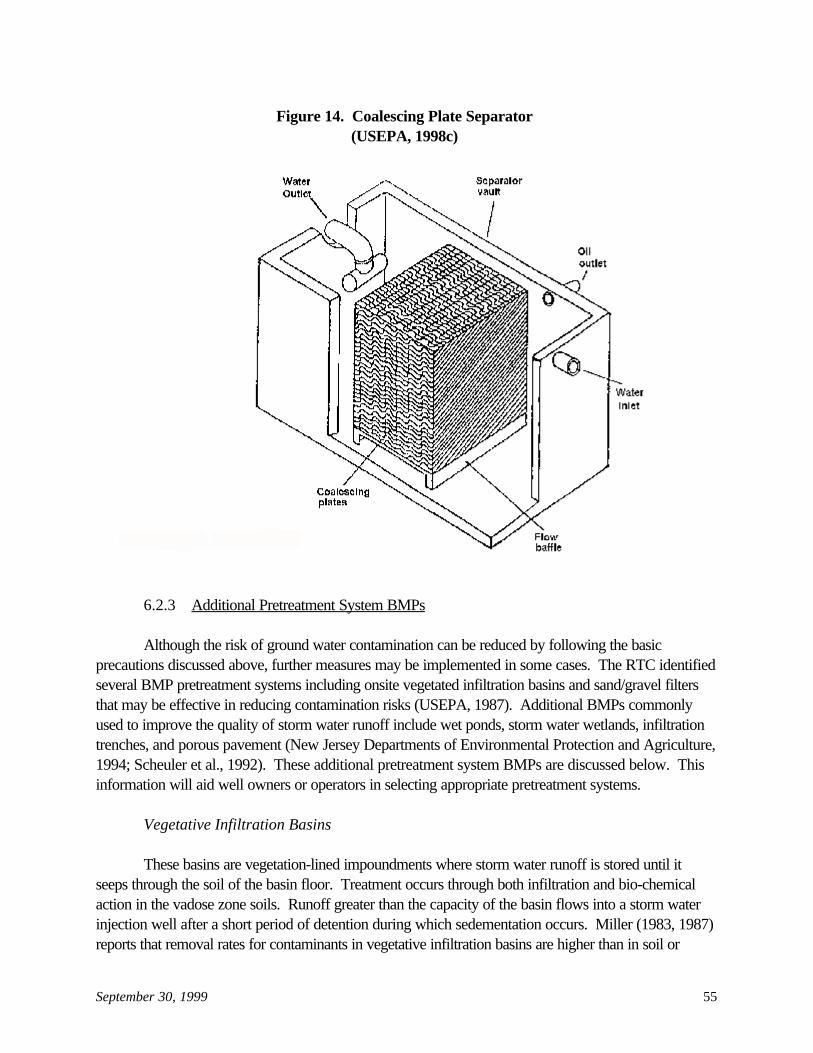
September 30, 1999 55
Figure 14. Coalescing Plate Separator(USEPA, 1998c)
6.2.3 Additional Pretreatment System BMPs
Although the risk of ground water contamination can be reduced by following the basicprecautions discussed above, further measures may be implemented in some cases. The RTC identifiedseveral BMP pretreatment systems including onsite vegetated infiltration basins and sand/gravel filtersthat may be effective in reducing contamination risks (USEPA, 1987). Additional BMPs commonlyused to improve the quality of storm water runoff include wet ponds, storm water wetlands, infiltrationtrenches, and porous pavement (New Jersey Departments of Environmental Protection and Agriculture,1994; Scheuler et al., 1992). These additional pretreatment system BMPs are discussed below. Thisinformation will aid well owners or operators in selecting appropriate pretreatment systems.
Vegetative Infiltration Basins
These basins are vegetation-lined impoundments where storm water runoff is stored until itseeps through the soil of the basin floor. Treatment occurs through both infiltration and bio-chemicalaction in the vadose zone soils. Runoff greater than the capacity of the basin flows into a storm waterinjection well after a short period of detention during which sedementation occurs. Miller (1983, 1987)reports that removal rates for contaminants in vegetative infiltration basins are higher than in soil or
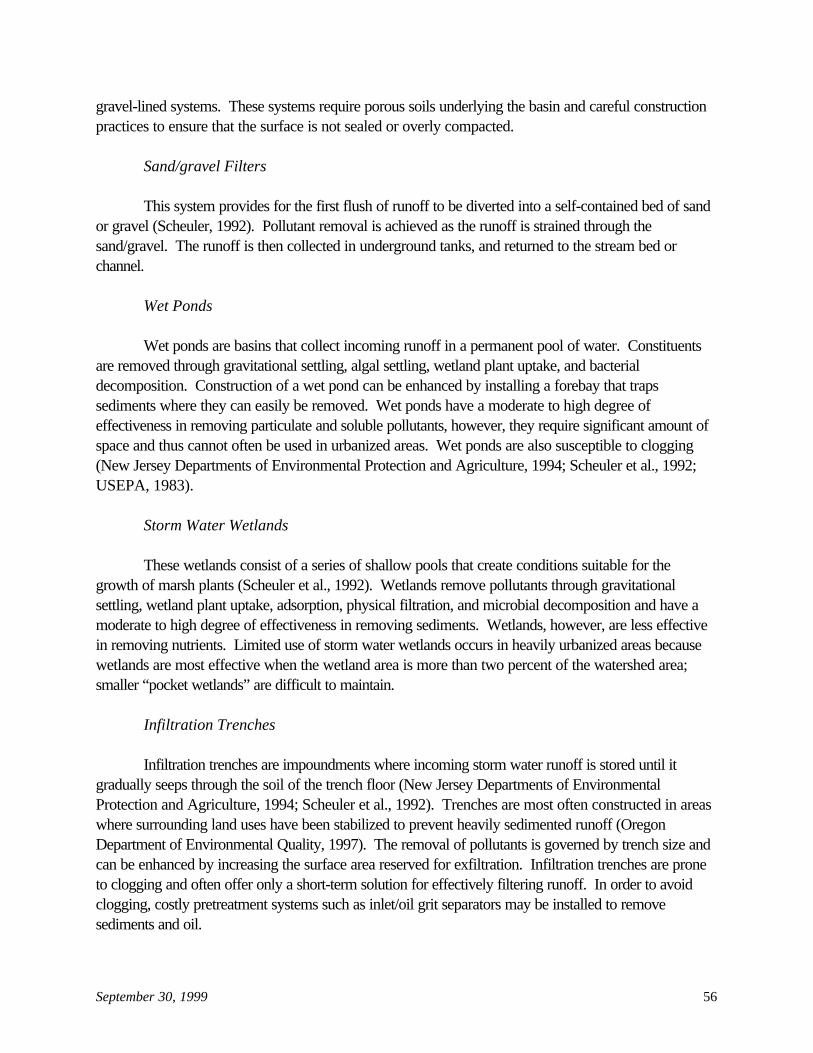
September 30, 1999 56
gravel-lined systems. These systems require porous soils underlying the basin and careful constructionpractices to ensure that the surface is not sealed or overly compacted.
Sand/gravel Filters
This system provides for the first flush of runoff to be diverted into a self-contained bed of sandor gravel (Scheuler, 1992). Pollutant removal is achieved as the runoff is strained through thesand/gravel. The runoff is then collected in underground tanks, and returned to the stream bed orchannel.
Wet Ponds
Wet ponds are basins that collect incoming runoff in a permanent pool of water. Constituentsare removed through gravitational settling, algal settling, wetland plant uptake, and bacterialdecomposition. Construction of a wet pond can be enhanced by installing a forebay that trapssediments where they can easily be removed. Wet ponds have a moderate to high degree ofeffectiveness in removing particulate and soluble pollutants, however, they require significant amount ofspace and thus cannot often be used in urbanized areas. Wet ponds are also susceptible to clogging(New Jersey Departments of Environmental Protection and Agriculture, 1994; Scheuler et al., 1992;USEPA, 1983).
Storm Water Wetlands
These wetlands consist of a series of shallow pools that create conditions suitable for thegrowth of marsh plants (Scheuler et al., 1992). Wetlands remove pollutants through gravitationalsettling, wetland plant uptake, adsorption, physical filtration, and microbial decomposition and have amoderate to high degree of effectiveness in removing sediments. Wetlands, however, are less effectivein removing nutrients. Limited use of storm water wetlands occurs in heavily urbanized areas becausewetlands are most effective when the wetland area is more than two percent of the watershed area;smaller “pocket wetlands” are difficult to maintain.
Infiltration Trenches
Infiltration trenches are impoundments where incoming storm water runoff is stored until itgradually seeps through the soil of the trench floor (New Jersey Departments of EnvironmentalProtection and Agriculture, 1994; Scheuler et al., 1992). Trenches are most often constructed in areaswhere surrounding land uses have been stabilized to prevent heavily sedimented runoff (OregonDepartment of Environmental Quality, 1997). The removal of pollutants is governed by trench size andcan be enhanced by increasing the surface area reserved for exfiltration. Infiltration trenches are proneto clogging and often offer only a short-term solution for effectively filtering runoff. In order to avoidclogging, costly pretreatment systems such as inlet/oil grit separators may be installed to removesediments and oil.
September 30, 1999 57
Porous Pavements
Porous pavements typically divert runoff through a porous asphalt layer into an undergroundstone reservoir (New Jersey Departments of Environmental Protection and Agriculture, 1994; Scheuleret al., 1992), where the stored water gradually infiltrates into the subsoil. Pollutant removal occursthrough adsorption, straining, and microbial decomposition in the subsoil below the underground stonereservoir. A minimum distance of three feet is recommended between the seasonal high water table orbedrock and the stone reservoir. Up to 90 percent of annual rainfall can be diverted to ground waterby using porous pavement. Porous pavements can be highly effective in removing heavy metals fromstorm water runoff and are more feasible on sites with gentle slopes, permeable soils, and deep watertable or bedrock levels. They are, however, prone to clogging, with one study estimating that 75percent of all porous pavement systems become partially or totally clogged within five years (Scheuleret al., 1992). In some cases, porous pavements may actually increase the potential for ground watercontamination due to the leaching of the asphalt materials and hydrocarbons.
6.2.4 Studies on the Effectiveness of Pretreatment System BMPs
A study of sites in Maryland examined ground water beneath and down gradient from threevegetated detention ponds, which function in much the same way as conventional wet ponds (Wilde,1994). The data suggested that pond-bottom materials effectively removed trace metals from stormwater, because concentrations of these metals increased significantly in bottom materials. Despite theaccumulation of pollutants in the pond, primary or secondary MCLs for aluminum, cadmium, chromium,and lead were periodically exceeded in ground water samples. In addition, uncharacteristically highlevels of barium, copper, nickel, strontium, vanadium, and zinc were occasionally detected in theground water. The author explains the presence of trace metals in the ground water by pointing out thatalgal photosynthesis increases the pH of pond water. Because many metals are soluble at high pH, highalgae levels may contribute to high metal concentrations (Wilde, 1994).
Low concentrations of polyorganic compounds were also found in the pond-bottom materialsbut not in ground water. This suggests that the basins also successfully removed these compounds. Consistently high levels of chloride were found in ground water, which indicates that chlorides were notbeing flushed from the aquifers. The study concludes that detention ponds may be effective in removingsome pollutants from storm water, but that this removal may have been limited by the fact that the pH ofpond water was increased by algal photosynthesis, heightening the solubility of trace metals.
McKenzie and Irwing (1988) compared ground water samples below an exfiltration trench anda vegetated swale in Dade County, Florida. Two sites were studied: (1) an employees’ parking lot and(2) a parking lot at a commercial complex of warehouses and businesses. Both sites were drainedthrough an exfiltration trench and a vegetated swale. The exfiltration trenches consisted of a catch basin(which functioned as a sediment filter) and a perforated pipe (which functioned as an exfiltrationconduit). The vegetated swales were simply shallow, vegetated depressions used to filter the stormwater. Samples were taken from ground water wells in the vicinity of the trenches and the swales.
September 30, 1999 58
Results indicated that storm water recharge from the trenches did not significantly affect theground water. In particular, lead and zinc concentrations were significantly higher in storm waterentering the trenches than in the ground water, suggesting that these trace metals were partially removedby the trenches. In the test wells near the swales, results were inconclusive. Researchers found higherconcentrations of major ions, iron, and ammonia in ground water near the swales than in ground waternear the trenches. The high concentrations of Kjedahl nitrogen and ammonia nitrogen in the groundwater at the swales suggest microbial decomposition, causing a release of nitrogen.
Schiffer (1989) studied the effects of three highway runoff detention methods on the waterquality of the surficial aquifer system in central Florida. The three detention methods studied were anexfiltration trench, two ponds (detention and retention), and two swales. Constituent concentrations inground water near each storm water well were compared to concentrations in ground water from anupgradient control site. This was done to ensure that the difference in ground water pollutantconcentrations was not simply due to the difference in background ground water quality. Sampling wasconducted at several wells around each structure, one of which was the control well. The control wellwas located near each storm water well, but far enough away to be out of the zone of influence. Ingeneral, the authors concluded that ground water quality tended to be lowest when the swales wereused as compared to the other methods tested.
Table 12 summarizes the findings of two study evaluations of the effectiveness of certain BMPsin removing key pollutants from storm water runoff.
Table 12. Reported Effectiveness of BMPs for Removal of Pollutants
BestManagement
Practices (BMPs)
Removal Rate ( percent) Comments
Sediments TotalPhosphorus
Lead Copper Zinc TotalNitrogen
Nitrate
Conventional WetPonds
40 - 90 40 - 90 60 - 95 45 - 95 30 -95
40 - 60 60 Long-term removal ratefor sediments may belower due to clogging. Results for phosphorusfluctuate seasonally.Survival rate ofpathogens remainsuncertain.
InfiltrationTrenches
75 - 90 60 65 - 80 80 65 -80
60 Lowremovalrates areexpected
Few studies have beencompleted.
Porous Pavement 80 - 90 60 98 - 99 98 - 99 98 -99
80 No data Limited applicability
Sand Filters 60 - 95 40 50 - 75 50 - 75 50 -75
35 Negative Negative removal mayreflect the nitrificationprocess.
Table 12. Reported Effectiveness of BMPs for Removal of Pollutants (cont’d)
BestManagement
Practices (BMPs)
Removal Rate ( percent) Comments
Sediments TotalPhosphorus
Lead Copper Zinc TotalNitrogen
Nitrate
September 30, 1999 59
Grassed Swales No data No data 50 - 90 50 - 90 50 -90
No data No data Studies show that swalesmay be more effectiveat removing trace metalsthan nutrients.
ExtendedDetention Basins
60 - 70 40 - 50 60 45 30 -50
25 No data
Sources: Schueler et al., 1992; New Jersey, 1994.
6.3 Operational BMPs
The purpose of this section is to discuss BMPs that state and local government officials andIndian tribes can recommend to operators of Class V wells to minimize the threat to USDWs. Ways toreduce or eliminate the contact between storm water runoff and contaminants are discussed. Topicscovered include source separation, pollution prevention, and specific examples of BMPs for commonsite activities.
Industrial sites, construction sites, highway areas, and urban areas may all present varyingsources of contaminants to storm water drainage wells; it is important to determine which managementpractices will be most appropriate and beneficial for a particular site. Wells in these locations may beclassified as industrial wells rather than storm water drainage wells. Regardless of their classification,based on their proximity to contaminant sources, the wells might be required to be either permitted orclosed.
6.3.1 Source Separation
Contaminants released by industrial activities, either as diffuse contamination or as concentratedspills, could be washed into storm water wells by rainfall and storm water runoff. Separating industrialactivities from storm water is a necessary means of minimizing contamination of storm water and groundwater. This can be accomplished by moving activities indoors, installing spill containment devices, andcovering materials stored outdoors. Basic containment methods including curbing, containment dikes,sumps, and covering are discussed below.
Curbing is a type of barrier, usually made of concrete, metal, or other impermeable substance,that can be used to separate potential spill areas from storm water runoff. Curbing is usually used on asmall-scale to prevent spills in areas where liquids are stored or used. Figure 15 shows curbing used toprevent the spread of spills or leaks from storage drums. Grading (i.e., sloping the land surface) withinthe curbing can help facilitate cleanup by concentrating contaminants in one part of the curbed area. Spills cleaned up promptly help to avoid overflow to non-curbed areas and help to minimize residual
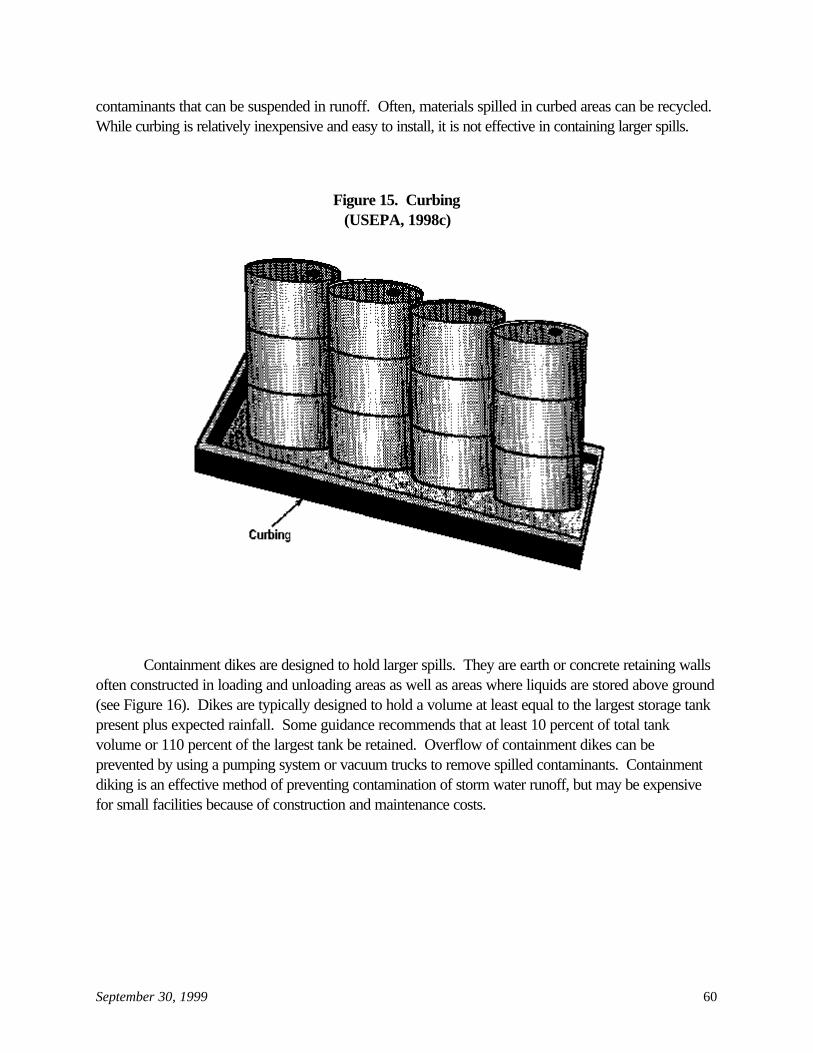
September 30, 1999 60
Figure 15. Curbing(USEPA, 1998c)
contaminants that can be suspended in runoff. Often, materials spilled in curbed areas can be recycled. While curbing is relatively inexpensive and easy to install, it is not effective in containing larger spills.
Containment dikes are designed to hold larger spills. They are earth or concrete retaining wallsoften constructed in loading and unloading areas as well as areas where liquids are stored above ground(see Figure 16). Dikes are typically designed to hold a volume at least equal to the largest storage tankpresent plus expected rainfall. Some guidance recommends that at least 10 percent of total tankvolume or 110 percent of the largest tank be retained. Overflow of containment dikes can beprevented by using a pumping system or vacuum trucks to remove spilled contaminants. Containmentdiking is an effective method of preventing contamination of storm water runoff, but may be expensivefor small facilities because of construction and maintenance costs.

September 30, 1999 61
Figure 16. Containment Dike(USEPA, 1998c)
Sumps are holes or low areas graded so that liquid spills or leaks flow toward a particular partof a containment area. Pumps are often placed in the sump to transfer liquids away from the sump as itfills. Sumps are most often constructed of impermeable materials so as to avoid leaks into thesurrounding subsoil and are positioned at the lowest point in a containment area for maximum efficiency. Sumps are a practical means of collecting storm water in a containment area, but pumps requireperiodic maintenance to avoid clogging.
Covering materials stored outside is an effective way to prevent rainfall and storm water runofffrom contacting potential contaminants. High-risk areas can be covered by tarpaulins, plastic sheeting,roofs, or awnings, and are most effective when routinely inspected for holes.
6.3.2 Pollution Prevention Planning
Proper storm water management is best organized with a pollution prevention plan. A formalstorm water pollution prevention plan (SWPPP) is typically included in NPDES industrial storm waterpermits as required at 40 CFR §122.26 for discharge of industrial site storm water to surface waters. While a formal plan is not required for subsurface discharge of industrial site storm water, organizingstorm water management throughout a facility can increase efficiency of managing storm water, increasethe likelihood of success, and be used to communicate facility policy to site personnel. Benefits ofpollution prevention approaches include reduced future costs of environmental compliance and cleanup. State and local government officials and Indian tribes may find it useful to recommend a SWPPP to well
September 30, 1999 62
operators. The development of a successful SWPPP includes several key components (USEPA,1996b):
• Planning and Organization: As a first step, determine who will be responsible for developingthe plan. This person first evaluates other environmental facility plans (if they exist) to determinewhether there is an overlap of regulations and to establish consistency. For example, somefacilities contain a mix of dry wells and surface discharging storm water systems. They mayhave a National Pollutant Discharge Elimination System SWPPP that addresses the surfacedischarged storm water.
• Assessment: It is important to assess materials and practices that may be contaminant sources. This includes taking an inventory of potential contaminants and identifying potential spill areas; itis often helpful to evaluate past spills to identify potential spill areas. It is helpful to develop asite map showing the location of these contaminant areas and the location of storm waterdrainage areas, including drainage wells, drinking water wells, rivers, ponds, etc., asappropriate.
• BMP Identification: A plan includes both general housekeeping and targeted operationalBMPs, as appropriate. Several "baseline" operational BMPs identified in Storm WaterManagement for Industrial Activities (USEPA, 1992) are: good housekeeping, preventativemaintenance, visual inspections, spill prevention and response, sediment and erosion control,management of runoff, employee training, and recordkeeping and reporting. Targeted BMPsare specific to the type of activity that may contaminate storm water.
• BMP Implementation: BMP implementation often includes annual employee training,education, and hands-on drills for all parts of the SWPPP. Trained employees understand notonly how to perform specific tasks, but why their assigned tasks are important in preventingstorm water and ground water contamination.
• Evaluation/Monitoring: Once the plan has been implemented, it is important to evaluate itssuccess. This includes an annual site inspection, review drills and BMP evaluation by theoperators of a facility. It is important that areas near storm water drains be inspected forevidence of contamination.
• Education/Outreach: Educating employees and the public about the importance of stormwater pollution prevention can not be understated.
In areas adjacent to a water supply well where a Wellhead Protection Plan is required, a stormwater plan is part of the Wellhead Protection Plan.
September 30, 1999 63
6.3.3 Spill Response
It is important that employees are trained and educated in proper spill response proceduresincluding: (1) how to prevent a spill from reaching a drainage well; (2) areas where spilled materialscould potentially flow; (3) who to call for additional help in cleaning up a spill; (4) how to use spillcleanup equipment such as booms, barriers, sweeps, and adsorbents; and (5) how to properly disposeof spilled materials. Response times will be shortened when spill cleanup materials are readily availableat all times. An organized and easy-to-follow spill prevention plan will result in an efficient response toa spill. It is important for cleanup materials to be disposed of properly and for employees to be awareof any local and/or state spill reporting requirements.
USEPA’s regulations in 40 CFR Part 112 (Oil Pollution Prevention) require that a SpillPrevention, Control and Countermeasures (SPCC) plan be prepared and implemented by thosefacilities that are non-transportation related, are located where a spill could reasonably be expected todischarge oil into or upon navigable waters of the U.S., and that have: (1) a total aboveground oilstorage capacity of more than 660 gallons in a single tank; or (2) a total underground oil storagecapacity of more than 42,000 gallons. Employees at facilities with SPCC plans can respond moreeffectively when they are made familiar with the plan. Such plans can be an effective BMP for stormwater drainage wells and, in fact, are supposed to include information on whether an oil spill couldpotentially reach a drainage well.
6.3.4 Operational BMPs for Common Site Activities
This section summarizes operational BMPs for common site activities that can contribute to thecontamination of storm water including loading and unloading materials and maintenance of vehicles andequipment (i.e., washing, fueling, or painting). Implementing proper operational BMPs is often aneffective and inexpensive way of preventing contamination by storm water. USEPA's Storm WaterManagement for Industrial Activities (USEPA, 1992) provides a detailed discussion of BMPs forpreventing storm water pollution to surface waters. As noted earlier, wells located in proximity to theactivities described below may be classified as industrial wells rather than storm water drainage wells. In any event, property owners are strongly discouraged from siting new storm water drainage wells inareas near the activities described below.
Vehicle and Equipment Fueling
There are several aspects of fueling activities that can lead to contamination of storm water. These include spills or leaks during the delivery of fuel and oil to above-ground tanks, spills from vehicletanks during refueling (often caused by "topping off" tanks), contact between rainfall or storm water andthe refueling area, and washing the refueling area. BMPs for these problem areas include installing spilland overfill prevention equipment on storage tanks, discouraging "topping off" of vehicle fuel tanks, andcovering refueling areas with a roof to prevent direct contact with rainfall. Refueling areas paved withconcrete instead of asphalt help to avoid infiltration of spilled fuel and oil into the pavement andunderlying soil. If necessary, the refueling area can be graded and dikes or curbs installed to prevent
September 30, 1999 64
storm water from flowing across the area (see Section 6.3.1). Best practices include directing stormwater runoff from roof downspouts away from refueling areas, avoiding washing or hosing of refuelingareas with large amounts of water where adjacent to storm water wells, and using cloths or specializeddry absorbent materials to clean spills in the refueling area.
Vehicle and Equipment Maintenance
Routine maintenance of vehicles and equipment outdoors can release harmful contaminants suchas oil and grease, automotive fluids, and battery acid, which can enter storm drains. Other potentialproblems include leaks from vehicles and equipment in storage areas and improper disposal ofmaintenance materials such as greasy rags and used oil filters. Best practices include checking vehiclesand equipment for leaking fluids such as oil, using drip pans under leaking vehicles, disposing of drippan contents properly, and separating work areas from areas contacted by rain water.
Equipment Washing
Wash water can contain many harmful contaminants including solvents, oil and grease. Thesecontaminants can migrate to storm water drains after rainfall if vehicles and equipment are washedoutside. BMPs for washing vehicles and equipment include using detergents that are biodegradable andcontain no phosphates, washing vehicles in designated diked and graded areas where the wash waterwill flow to a treatment facility, recycling wash water, and preventing underbody washing in areas whererunoff enters a storm water drainage well.
Material Loading/Unloading
Loading and unloading materials at terminals or loading docks can be a source ofcontamination. Materials that are spilled or that leak from vehicles may enter storm water drains. Specific loading and unloading activities that may cause storm water contamination include transferringmaterial by truck, forklift, or conveyor belt; transferring liquids or gases between a truck or railroad carand a storage facility; and transferring dry chemicals between loading and unloading vehicles. BMPsfor loading areas include checking loading and unloading vehicles for leaks and performingloading/unloading activities in specially designed areas. Limiting exposure to rainfall can be achieved bycovering loading areas with a building overhang or awning. Constructing dikes around loading andunloading areas can greatly reduce the risk of spilled materials reaching storm water drains, as doesdirecting runoff away from loading areas.
6.3.5 Monitoring BMPs
An important part of any pollution management strategy is an adequate monitoring system toevaluate contamination. Storm water monitoring will benefit from a consideration of the intermittentnature of runoff events. Defining the hydrology will allow reliable predictions of the direction and rate offlow of ground water impacted by contaminated storm water in the vicinity of the storm water drainagewell.

September 30, 1999 65
Another important monitoring consideration is the build-up of hazardous or deleteriouscontaminants in the sediments underlying infiltration or storage basins or in the vadose zone underlyingstorm water drainage wells. For example, in California, infiltration basin sediments have accumulatedsufficient levels of heavy metals to warrant handling of the surface layer as a RCRA hazardous waste(Lee and Taylor, 1998).
6.3.6 Maintenance BMPs
Maintenance of the storm water drainage well is critical to the effectiveness of the system. American National Standards Institute (ANSI) recommends that the following elements be included in athorough inspection:
• Inspect wells for accumulated debris, rodents, or other obstacles to flow at inlets and outlets• Check the system interior for roots, mineral deposits, trash, or silt build-up• Inspect the ground surface for signs of subsurface drainage leaks• Check inlet and outlet areas for evidence of erosion, which can impede structural and hydraulic
performance• Examine catch basins, headwalls, and culverts for signs of wear or breakage• Check upstream in the drainage system for backups or ponding of surface water that could
indicate reduced injectate flows (ANSI, 1993).
The guidelines also recommend the use of electronic and optical aids like television cameras or fiberoptic scopes to detect cracks, displacements, and other interior well problems.
Catch basin trap and drywell inspection and frequency will vary with site activities and theamount of sediment typically carried in the storm water runoff. A main purpose of cleaning is to preventthe buildup of a floating oil layer and a bottom sediment layer, which can be drawn into the well duringa significant runoff event. It is also important to remove bulk solids from inlet screens, to removesediment from catch basins and pretreatment devices, and to revegetate vegetative infiltration basinsand grass swales.
Dry wells can be cleaned by a process called jetting, in which wells are partially filled withwater, compressed air is injected at the bottom of the well, and the sediment is forced out the top. Thefrequency with which dry wells are cleaned will vary greatly depending on the sediment load from thesite and the depth of the dry well. Operators of dry wells may have a jet-pump available as standardmaintenance equipment to perform jetting on an as-needed basis. Chemical cleaning of drainage wellsusing biodegradable solutions or neutralizing an acid solution used to dissolve mineral deposits may alsobe used when there is no access for mechanical cleaning (ANSI, 1993).
6.4 Education and Outreach BMPs to Prevent Misuse
Education and outreach to the general public, owners and operators of storm water wells, andstate and local officials and Indian tribes is an important element in storm water pollution prevention.

September 30, 1999 66
An effective education and outreach program can: (1) disseminate information about the effects ofpollution from diffuse sources on ground water, including the loss of drinking water sources; and (2)promote positive environmental results, including the reduction of pollutant loadings from urban andindustrial areas. The goal of a storm water education and outreach program is to (1) promote voluntarycompliance with regulations designed to protect ground waters from pollution and (2) deter intentionalmisuse of storm water wells that introduces contaminants into storm water drainage wells.
For storm water wells located in industrial settings, facility owners and operators can implementa formal storm water pollution prevention education program. Under NPDES, staff training on stormwater issues is required at facilities. Staff education and training on storm water pollution preventiontargeted to drainage wells could be both helpful and combined with NPDES training already beingconducted. Specifically, employee education and training can include the following topics:
• The location of nearby storm water wells• Storm water well contamination leading to the contamination of aquifers• Spill prevention• Procedures that minimize chronic pollution caused by routine activities.
In addition to UIC guidances, owners and operators may also consult NPDES and CoastalZone Act Reauthorization Amendments (CZARA) guidance documents for more information on theabove topics.
Public education about storm water drainage wells by state and local officials and Indian tribescan include organized activities such as:
• Direct Mailings: Informational pamphlets can be sent to community members. Thesepamphlets can include information about storm water drainage wells and can answer basicquestions such as (1) what is a storm water drainage well, (2) what does a storm waterdrainage well look like, (3) what can be done to prevent contaminants from reaching a stormwater drainage well?
• Labeling of Storm Water Drainage Wells: Storm water drainage wells can be clearlylabeled (i.e., stenciling) with such phrases as “No Dumping.” The public can be educated thatstorm water drains usually flow directly to waterways or discharge to ground water withouttreatment, stressing the importance of keeping pollutants out of the storm water drains.
• Community Meetings: Public meetings can be scheduled to inform citizens and local officialsabout storm water drainage wells. Information can be presented regarding federal and stateregulations for Class V storm water drainage wells.
Municipalities required by the regulations at 40 CFR §122.26 to obtain NPDES permits forstorm water discharges from their separate storm sewer systems are typically required to developpublic education programs for reducing pollutants in storm water discharges to surface waters. These
September 30, 1999 67
same programs may be equally effective for educating the public about reducing storm water dischargesto ground water.
The city of Charlotte, NC developed a successful storm water education and outreach programbased on a four-point action model discussed below (Schumacher, 1992).
(1) Define the issues: An important first step in public education is to determine which issuesare most important. Important issues include presenting the need for a storm water programbecause of federal (i.e., USEPA), state, and local regulations, and because of risk posed toUSDWs. It is important for the public to understand the need for pollution prevention in stormwater. Past problems in the community due to polluted storm water can be highlighted as wellas any cleanup costs associated with these problems. It can be clearly stated how an organizedstorm water pollution prevention program will be structured and what it will cost.
(2) Set objectives: An education and outreach program with clear basic objectives will have ahigher likelihood of success (Beech and Drake, 1992). Example objectives include:
• Educate and inform the public• Involve and seek input from the public by encouraging frequent public meetings and
establishing a citizens task force• Evaluate the storm water education program by conducting surveys and monitoring
media responses.
(3) Identify resources: It is important to determine which organizations, citizens groups, andindividuals will work to carry out the objectives of a storm water education and outreachprogram. A project leader is important to organize and assign responsibilities.
(4) Outline and conduct activities and tasks: The effectiveness of particular education andoutreach activities will vary from community to community. However, below is a list of specificactivities that can be considered:
• Conduct surveys on public knowledge and perception of storm water issues• Set up a telephone hot line to answer questions• Distribute literature such as pamphlets, newsletters, and fact sheets• Involve the local media and provide reporters with media kits.
6.5 BMPs for Properly Closing, Plugging and Abandoning Storm Water DrainageWells
Proper closure, plugging and abandonment of storm water drainage wells that either no longerserve their original purpose or are a threat to USDWs is important. Appropriate measures for pluggingand abandoning storm water drainage wells may include:
September 30, 1999 68
• Complete removal of any surface structures such as settling basins, piping, etc.• Complete removal of all casing, gravel, and other filter and/or annular sealing materials• Collection of environmental samples• Backfill and sealing of the resulting borehole.
With regard to lake level control wells, states and localities may be hesitant to close these wellsbecause they are often the only source of drainage to control flooding in a community. There does notappear to be any feasible alternative for these wells at this time.
7. CURRENT REGULATORY REQUIREMENTS
As discussed below, several federal, state, and local programs exist that either directly manageor regulate storm water drainage wells, or impact them indirectly through broad based water pollutionprevention initiatives.
7.1 Federal Programs
On the federal level, management and regulation of storm water drainage wells falls primarilyunder the UIC program authorized by the Safe Drinking Water Act (SDWA). Some states andlocalities have used these authorities, as well as their own authorities, to extend the controls in theirareas to address endemic concerns associated with storm water drainage wells. Other federalprograms that address storm water drainage wells indirectly are implemented under the NationalPollutant Discharge Elimination System (NPDES) under the Clean Water Act (CWA), as well as theCoastal Zone Management Act (CZMA), the Coastal Zone Reauthorization Amendments of 1990(CZARA), and Federal Highway Administration (FHWA) guidelines.
7.1.1 SDWA
Class V wells are regulated under the authority of Part C of SDWA. Congress enacted theSDWA to ensure protection of the quality of drinking water in the United States, and Part C specificallymandates the regulation of underground injection of fluids through wells. USEPA has promulgated aseries of UIC regulations under this authority. USEPA directly implements these regulations for ClassV wells in 19 states or territories (Alaska, American Samoa, Arizona, California, Colorado, Hawaii,Indiana, Iowa, Kentucky, Michigan, Minnesota, Montana, New York, Pennsylvania, South Dakota,Tennessee, Virginia, Virgin Islands, and Washington, DC). USEPA also directly implements all ClassV UIC programs on Tribal lands. In all other states, which are called Primacy States, state agenciesimplement the Class V UIC program, with primary enforcement responsibility.
Storm water drainage wells currently are not subject to any specific regulations tailored just forthem, but rather are subject to the UIC regulations that exist for all Class V wells. Under 40 CFR144.12(a), owners or operators of all injection wells, including storm water drainage wells, areprohibited from engaging in any injection activity that allows the movement of fluids containing any

2 May 2003 is the deadline including an 18-month extension.
September 30, 1999 69
contaminant into USDWs, “if the presence of that contaminant may cause a violation of any primarydrinking water regulation . . . or may otherwise adversely affect the health of persons.”
Owners or operators of Class V wells are required to submit basic inventory information under40 CFR 144.26. When the owner or operator submits inventory information and is operating the wellsuch that a USDW is not endangered, the operation of the Class V well is authorized by rule. Moreover, under section 144.27, USEPA may require owners or operators of any Class V well, inUSEPA-administered programs, to submit additional information deemed necessary to protectUSDWs. Owners or operators who fail to submit the information required under sections 144.26 and144.27 are prohibited from using their wells.
Sections 144.12(c) and (d) prescribe mandatory and discretionary actions to be taken by theUIC Program Director if a Class V well is not in compliance with section 144.12(a). Specifically, theDirector must choose between requiring the injector to apply for an individual permit, ordering suchaction as closure of the well to prevent endangerment, or taking an enforcement action. Because stormwater drainage wells (like other kinds of Class V wells) are authorized by rule, they do not have toobtain a permit unless required to do so by the UIC Program Director under 40 CFR 144.25. Authorization by rule terminates upon the effective date of a permit issued or upon proper closure of thewell.
Separate from the UIC program, the SDWA Amendments of 1996 establish a requirement forsource water assessments. USEPA published guidance describing how the states should carry out asource water assessment program within the state’s boundaries. The final guidance, entitled SourceWater Assessment and Programs Guidance (USEPA 816-R-97-009), was released in August1997.
State staff must conduct source water assessments that are comprised of three steps. First,state staff must delineate the boundaries of the assessment areas in the state from which one or morepublic drinking water systems receive supplies of drinking water. In delineating these areas, state staffmust use “all reasonably available hydrogeologic information on the sources of the supply of drinkingwater in the state and the water flow, recharge, and discharge and any other reliable information as thestate deems necessary to adequately determine such areas.” Second, the state staff must identifycontaminants of concern, and for those contaminants, they must inventory significant potential sourcesof contamination in delineated source water protection areas. Class V wells, including storm waterdrainage wells, should be considered as part of this source inventory, if present in a given area. Third,the state staff must “determine the susceptibility of the public water systems in the delineated area tosuch contaminants.” State staff should complete all of these steps by May 2003 according to the finalguidance.2
September 30, 1999 70
Another relevant program, established by §1424(e) of the SDWA, is the Sole Source Aquifer(SSA) program. The statute provides that any person may petition USEPA, or the USEPAAdministrator may determine, that an area has an aquifer which is the sole or principal drinking watersource for the area, and which, if contaminated, would create a significant hazard to public health. Following such a determination, no commitment for federal financial assistance (through a grant,contract, loan guarantee, or other means) may be entered into for any project that the USEPAAdministrator determines may contaminate the aquifer through a recharge zone so as to create asignificant hazard to public health. Sixty-nine SSAs have been designated since the provision wasenacted in 1974, with the latest designated in July 1998.
Some USEPA Regions have used this Sole Source Aquifer provision to help implement theUIC Program (Terada, 1999). For example, USEPA Region 10 reviews construction anddevelopment projects that receive Federal Highway Administration (FHWA) funds for potentialimpacts to sole source aquifers, particularly from storm water drainage wells. USEPA Region 10 hashad a 90-95 percent success rate in getting projects not to use dry wells for storm water disposal(Terada, 1999).
7.1.2 CWA
In 1972, the CWA amended the Federal Water Pollution Control Act and prohibited thedischarge of any pollutant into waters of the U.S. from a point source unless the discharge is authorizedby a NPDES permit. The NPDES permitting program is designed to track point sources, monitor thedischarge of pollutants from specific sources to surface waters, and to require the implementation ofcontrols necessary to minimize the discharge of pollutants (USEPA, 1999e).
Because the NPDES program is focused on point source discharges to surface waters, Class Vwells are not included within its scope. However, the NPDES Storm Water Program containsprovisions specifically relating to reducing pollutants in storm water runoff, and thus may indirectlyreduce the threat of ground water contamination through Class V storm water drainage wells.
Initial efforts to improve water quality under the NPDES program primarily focused onreducing pollutants in industrial process wastewater and discharges from municipal sewage treatmentplants. As pollution control measures for these sources were implemented and refined, studies showedthat more diffuse sources of water pollution were also significant causes of water quality impairment,specifically storm water runoff. Therefore, in 1987, the CWA was amended by Congress to requireimplementation of a comprehensive national program for addressing problematic non-agriculturalsources of storm water discharges. The NPDES program is being implemented in two phases.
Phase I of the NPDES Storm Water Program targets the most likely sources of wet weatherpollution: medium and large municipal separate storm water systems (MS4s) and eleven categories ofindustrial activity including construction in areas of five acres or greater. These regulated entities mustobtain an NPDES storm water permit and implement storm water pollution prevention plans(SWPPPs) or storm water management programs, both using BMPs, that effectively reduce or prevent

September 30, 1999 71
the discharge of pollutants into receiving waters (USEPA, 1999e). Section 6.3.2 discusses SWPPPs inmore detail
Phase II of the NPDES Storm Water Program targets small MS4s (any MS4 not covered byPhase I) in urbanized areas and construction activity covering areas between one and five acres. Additional small MS4s and smaller construction sites may be brought into the NPDES Storm WaterProgram by the NPDES permitting authority. The requirements for these regulated entities are similarto those for Phase I (USEPA, 1999e).
7.1.3 CZMA and CZARA
The CZMA does not contain language specific to storm water, but does address nonpointpollution. Section 306(d)(16) of the CZMA requires state coastal zone management programs tocontain enforceable policies and mechanisms to implement the applicable requirements of the coastalnonpoint programs. In order to satisfy this requirement, states adopt, at a minimum, enforceablepolicies and mechanisms to implement the guidance management measures and the additionalmanagement measures. These enforceable policies and mechanisms may be state and local regulatorycontrols, and/or non-regulatory incentive programs combined with state enforcement authority.
The CZMA Reauthorization Amendment – Coastal Nonpoint Pollution Control Program alsoaddresses nonpoint pollution. Section 6217 requires states to establish coastal nonpoint programs,which must be approved by both the National Oceanic and Atmospheric Administration (NOAA) andUSEPA. Once approved, the coastal nonpoint programs will be implemented through changes to thestate nonpoint source pollution program approved by USEPA under section 319 of the CWA andthrough changes to the state coastal zone management program approved by NOAA under section 306of the CZMA. Beginning in fiscal year 1996, states that fail to submit an approvable coastal nonpointprogram to NOAA and USEPA face statutory reductions in federal funds awarded under both section306 of the CZMA and section 319 of the CWA. However, Section 6217 excludes all storm waterdischarges covered by Phase I of the NPDES, and any storm water discharges that become coveredby NPDES will be exempt from the coastal nonpoint pollution control program when an NPDESpermit is issued.
Guidance prepared by NOAA and USEPA on implementation of the Coastal NonpointPollution Control Program concentrates on nonpoint sources and does not address storm waterdrainage wells directly. It recommends management measures for agriculture, forestry, urban areas,and marinas. The chapter devoted to urban nonpoint sources discusses over a dozen managementmeasures including measures for situations that would appear to qualify as storm water drainage wells(e.g., septic systems functioning as onsite disposal systems (OSDS) for storm water). The guidancediscusses the requirement to maintain protective separation between such OSDS and the ground watertable. However, the guidance does not discuss the system’s potential impacts on or capacity forprotection of ground water. It is intended for reference use and presents recommended managementmeasures rather than enforceable standards for the protection of USDWs. In addition, the guidance

September 30, 1999 72
pertains only to those areas included in a coastal state’s nonpoint program (i.e., its section 6217management area) (USEPA, 1993b).
7.1.4 FHWA Guidance
Guidance prepared by FHWA on management of highway runoff water quality discusses wetand dry detention basins, infiltration trenches, infiltration basins, dry wells, and other BMPs forcontrolling runoff. Some configurations of these systems could include perforated piping that wouldappear to qualify as a Class V storm water drainage well (e.g., dry wells consisting of verticalperforated pipe within pits backfilled with stone or gravel). The guidance addresses the pollutantremoval capabilities of these systems with tables showing pollutant removal rates and limiting factors fordifferent types of infiltration trenches. It also specifies the distance that the bottom of the trench, drywell, or other structure be constructed from the ground water table. However, the guidance does notdiscuss the system’s potential impacts on ground water or capacity for protection of ground water. Although its purpose is to present the available and appropriate tools for predicting and mitigatinghighway storm water impacts for use during highway project planning and development activities, it isintended for reference use only and presents recommended BMPs rather than enforceable standardsfor the protection of USDWs (U.S. Department of Transportation, 1996).
7.2 State and Local Programs
Storm water drainage wells are managed or regulated by a variety of means, ranging frombroad guidelines with recommended BMPs to general or specific state or local permits to prohibition atthe state or local level. Many local codes prohibit storm water drainage wells within buffer zonessurrounding water bodies and wetlands. Setback distances from water supplies required in variousstate guidelines range from 50 to 400 feet (Cadmus, 1996). Counties may also establish design,construction, and BMP requirements or guidelines based on site-specific concerns. In California, forexample, Regional Water Quality Control Boards, counties, and local jurisdictions play the greatest rolein storm water regulation. Some of these local jurisdictions prohibit storm water drainage wells, othersuse permits to regulate such wells, and still others recommend BMPs. New York, in contrast, regulatesthrough State Pollution Elimination System Permits, for wells posing threats to ground water, andthrough statewide general permits that emphasize BMPs for industrial and construction runoff. SomeDirect Implementation states, of which Arizona is an example, also have ground water protectionprograms that may address storm water runoff wells. Some Primacy states, such as Florida, prohibitstorm water drainage wells in regions of the State where they would drain directly into USDWs, butallow such wells where the ambient water is below USDW quality. Florida does allow storm waterwells where fluids are discharged into low-quality aquifers. This practice occurs primarily in the FloridaKeys and in the coastal areas of southeast Florida (Deurling, 1997). Specific state programdescriptions included in Attachment A of this volume focus on those states in which the largest numbersof storm water drainage wells are documented and estimated.
The following states authorize storm water drainage wells by rule consistent with the existingfederal UIC requirements: Illinois, Indiana, Michigan, Ohio, Wisconsin (prior to 1994 and less than 10
September 30, 1999 73
feet deep only, new wells banned), Montana, Wyoming, North Dakota, South Dakota, Utah,Colorado, Tennessee, Idaho (for wells less than 18 feet deep), Oregon, Washington, Rhode Island,and Kansas. The following states have a permit and registration system for storm water drainage wells:Arizona, Hawaii, Idaho (for wells greater than 18 feet deep), Alabama, Florida, Texas, NewHampshire, Maryland, and Nebraska. North Carolina, Georgia, Minnesota, and Wisconsin (since1994) prohibit storm water drainage wells.
7.3 Survey of Local Storm Water Utilities
A 1996 survey of 230 municipal utility jurisdictions conducted by the National Association ofFlood and Stormwater Management Agencies received 101 responses. Of these, 11 utilities reducedtheir fee for collecting storm water runoff if sites generating the runoff used storm water controls (six forpeak runoff controls, three for implementation of BMPs, and two for obtaining an industrial NPDESpermit).
Of 29 local storm water ordinances provided and republished in the survey report, fourcontained operational requirements. One specified that the utility be provided copies of all plans,drainage studies, and evaluations; two required monitoring and reporting of discharges; and oneincluded maintenance criteria. The balance of the local ordinances concentrated on establishing localstorm water utilities, rates, and administrative procedures (NAFSMA, Survey of Local StormwaterUtilities, 1996).
September 30, 1999 74
ATTACHMENT ASTATE AND LOCAL PROGRAM DESCRIPTIONS
This attachment does not describe every state’s program for storm water drainage wells;instead it focuses on the states where the largest numbers of storm water drainage wells are known toexist. The states covered in this attachment (Arizona, California, Florida, Idaho, Montana, New York,Ohio, Oregon, Utah, and Washington) contain a total of 62,958 documented (and 239,034 estimated)storm water drainage wells, accounting for 89 percent of the documented number (and 97 percent ofthe estimated number) of storm water drainage wells in the U.S.
Arizona
USEPA Region 9 directly implements the UIC program for Class V injection wells in Arizona. In addition, under the State’s ground water protection program, found in Arizona Revised Statutes(Title 49, Chapter 2, Article 3 - Aquifer Protection Permits), any facility that “discharges” is required toobtain an Aquifer Protection Permit (APP) from the Arizona Department of Environmental Quality(ADEQ) (§49-241.A). An injection well is considered a discharging facility and is required to obtainan APP, unless ADEQ determines that it will be “designed, constructed, and operated so that there willbe no migration of pollutants directly to the aquifer or to the vadose zone” (§49-241.B). However,under Rule 18-9-102.A, drywells that are used solely to receive storm runoff, except those that drainareas in which hazardous substances are used, stored, loaded, or treated, are exempt from the APPrequirements. For drywells used solely to receive storm runoff, ADEQ has established specialrequirements under the authority of Arizona Revised Statutes Title 49, Chapter 3, Article 8 - DryWells.
The aquifer protection statute provides that an applicant for an APP may be required to provideinformation on the design, operations, pollutant control measures, hydrogeological characterization,baseline data, pollutant characteristics, and closure strategy. Operators must demonstrate that thefacility will be designed, constructed, and operated as to ensure that discharge will be reduced to thegreatest degree and that aquifer water quality will not be reduced or standards violated. By rule,presumptive best available demonstrated control technology, processes, operating methods, or otheralternatives, in order to achieve discharge reduction and water quality standards, are established byADEQ (§49-243).
An APP may require monitoring, recordkeeping and reporting, contingency planning, dischargelimitations, a compliance schedule, and closure guidelines. The operator may need to furnishinformation, such as past performance and technical and financial competence, relevant to its capabilityto comply with the permit terms and conditions. A facility must demonstrate financial assurance orcompetence before approval to operate is granted. Each owner of an injection well to whom anindividual permit is issued must register the permit with ADEQ each year (§49-243).
ADEQ designates a point or points of compliance for each facility receiving an APP. Thestatute defines this point as the point at which compliance with aquifer water quality standards shall be
September 30, 1999 75
determined and in a vertical plane downgradient of the facility extending through the uppermost aquiferunderlying that facility. If an aquifer is not, or reasonably will not foreseeably be a USDW, monitoringfor compliance may be established in another aquifer. Monitoring and reporting requirements also mayapply for a facility managing pollutants that are determined not to migrate (§49-244).
The requirements pertaining to dry wells that receive storm water runoff, but not from ahazardous waste area, specify that any person who owns an existing dry well that is, or has been, usedfor disposal must register the well on a registration form provided by ADEQ (§49-332). The ADEQ isauthorized to adopt rules establishing standards for new and existing dry wells pertaining toperformance, construction, design, closure, location, and inspection (§49-333). New dry wellconstruction, including modifications to existing dry wells, must be performed by a well driller with a drywell driller’s license (§49-333.C). The statute exempts from its requirements dry wells used inconjunction with golf course maintenance (§49-336).
Permitting
The Arizona Aquifer Protection Permit Rules (Chapter 19, sub-chapter 9, October 1997)define an injection well as “a well which receives a discharge through pressure injection or gravity flow.” Any facility that discharges is required to obtain an individual APP from ADEQ, unless the facility issubject to a general permit or it is a dry well used exclusively to dispose of storm water runoff. Permitapplications must include specified information. This includes topographic maps, facility site plans anddesigns, characteristics of past as well as proposed discharge, and best available demonstrated controltechnology, processes, operating methods, or other alternatives to be employed in the facility. In orderto obtain an individual permit, a hydrogeologic study must be performed. This study must include adescription of the geology and hydrology of the area; documentation of existing quality of water in theaquifers underlying the site; any expected changes in the water quality and ground water as a result ofthe discharge; and the proposed location of each point of compliance (R18-9-108).
Owners of existing dry wells are required by the dry well statutory requirements to register thewells with ADEQ. No regulatory requirements pertaining to registration or permitting of dry wells havebeen promulgated by ADEQ.
By statute, a general permit covers facilities used solely for the management of storm water andthat are regulated by the Clean Water Act, including catchments, impoundments and sumps, providedthat the following conditions are met:
• An NPDES permit has been obtained for any storm water discharges at the facility and thefacility has so notified ADEQ
• The facility has a storm water pollution prevention plan in place.
If ADEQ determines that discharges of storm water from a facility covered by the generalpermit are causing a violation of aquifer water quality standards, the general permit may be revoked andthe facility required to obtain an individual permit under §49-243 (§49-245.01).

September 30, 1999 76
Wells that inject into the vadose zone, and inject only storm water mixed with reclaimedwastewater or ground water, from man-made bodies of water associated with golf courses, parks, andresidential common areas, are also granted a general permit, provided that they meet the followingconditions:
• The wells are registered pursuant to §49-332;• The discharge occurs only in response to storm events;• Water quality analysis, completed initially and at least semiannually, demonstrates compliance
(except for microbiological contaminants) with aquifer water quality standards for the reclaimedwastewater;
• The vadose zone injection wells are located at least 100 feet from any water supply well;• Vertical separation of at least 40 feet exists between the bottom of the vadose zone injection
wells and the water table to allow the aquifer water quality standard for microbiologicalcontaminants to be met in the uppermost aquifer; and
• The vadose zone injection wells are not used for any other purpose.
Siting and Construction
If an APP is required, no injection wells may be constructed unless the APP has beencompleted and approved. Wells are required to be constructed in such as manner as not to impairfuture or foreseeable use of aquifers. Specific construction standards are determined on a case-by-case basis.
ADEQ has not promulgated construction standards for dry wells. ADEQ has issued adocument, “Guidance for Design, Installation, Operation, Maintenance, and Inspection of Dry Wells,”that provides non-mandatory suggested standards and has established a Web site to provide guidanceinformation.
Operating Requirements
Permit-specific operating requirements will be developed for wells required to obtain an APP. All wells must be operated in such a manner that they do not violate any rules under Title 49 of theArizona Revised Statutes, including Article 2, relating to water quality standards, and Article 3, relatingto APPs. Water quality standards must be met in order to preserve and protect the quality of waters inall aquifers for all present and reasonably foreseeable future uses.
Dry wells draining areas where hazardous substances are used, stored, loaded, or treated willbe required by their APP to adopt specified operating practices. An ADEQ publication, “BestManagement Practices Plan (BMPP) Guidance for Dry Wells Draining Areas Associated withIndustrial Activities that Use, Store, Loan, or Treat Hazardous Substances” is available.
ADEQ has not promulgated operating requirements for dry wells that do not drain areasinvolving hazardous substances. ADEQ has issued a document, “Guidance for Design, Installation,
September 30, 1999 77
Operation, Maintenance, and Inspection of Dry Wells,” that provides non-mandatory suggestedstandards and has established a Web site to provide guidance information.
Monitoring Requirements
Storm water wells, including dry wells, required to have an APP will have monitoringrequirements specified in the APP to ensure compliance with APP conditions. Monitoring may includeboth injectate monitoring and monitoring of the injection site. The permit establishes, on a case-by-casebasis, alert levels, discharge limitations, monitoring, reporting, and contingency plan requirements. Alert level is defined as a numeric value, expressed either as a concentration of a pollutant or a physicalor chemical property of a pollutant, which serves as an early warning indicating a potential violation ofany permit condition. If an alert level or discharge limitation is exceeded, an individual permit requiresthe facility to notify ADEQ and implement the contingency plan (R18-9-110).
Dry wells covered by the general permit may not violate aquifer water quality standards, and ifthe ADEQ determines there is a “reasonable probability” of such violation the general permit may berevoked, but no explicit monitoring requirements are included in the general permit provisions.
Plugging and Abandonment
For wells subject to an APP, temporary cessation, closure, and post-closure requirements arespecified on a case-by-case basis. The facilities are required to notify ADEQ before any cessation ofoperations occurs. A closure plan is required for facilities that cease activity without intending toresume. The plan describes the quantities and characteristics of the materials to be removed from thefacility; the destination and placement of material to be removed; quantities and characteristics of thematerial to remain; the methods to treat and control the discharge of pollutants from the facility; andlimitations on future water uses created as a result of operations or closure activities. A post-closuremonitoring and maintenance plan is also required. This plan specifies duration, procedures, andinspections for post-closure monitoring (R-18-9-116).
Financial Assurance
For wells subject to an APP, the permit requires that a owner have and maintain the technicaland financial capability necessary to fully carry out the terms and conditions of the permit. The ownermust maintain a bond, insurance policy, or trust fund for the duration of the permit (R-18-9-117).
California
USEPA Region 9 directly implements the UIC program for Class V injection wells inCalifornia. The California Water Quality Control Act (WQCA), however, establishes broadrequirements for the coordination and control of water quality in the State, sets up a State WaterQuality Control Board, and divides the State into nine regions, with a Regional Water Quality ControlBoard (RWQCB) that is delegated responsibilities and authorities to coordinate and advance water
September 30, 1999 78
quality in each region (Chapter 4 Article 2 WQCA). A RWQCB can prescribe requirements fordischarges (waste discharge requirements or WDRs) into the waters of the State (13263 WQCA). These WDRs can apply to injection wells (13263.5 and 13264(b)(3) WQCA). The statute providesthat no discharge of waste into the waters of the State, even if pursuant to a WDR, creates a vestedright to continue the discharge (13263(g) WQCA). This provision is interpreted as creating authority torequire the closing of storm water drainage wells. In addition, the WQCA specifies that no provision ofthe Act or ruling of the State Board or a Regional Board is a limitation on the power of a city or countyto adopt and enforce additional regulations imposing further conditions, restrictions, or limitations withrespect to the disposal of waste or any other activity which might degrade the quality of the waters ofthe State (13002 WQCA).
Permitting
RWQCBs have the authority under the WQCA to require a person proposing to operate aninjection well (as defined in §13051 WQCA) to file a report of the discharge, containing the informationrequired by the Regional Board, with the appropriate Regional Board (13260(a)(3) WQCA). Furthermore, the Regional Board, after any necessary hearing, may prescribe requirements concerningthe nature of any proposed discharge, existing discharge, or material change in an existing discharge toimplement any relevant regional water quality control plans. The requirements also must take intoaccount the beneficial uses to be protected, the water quality objectives reasonably required for thatpurpose, other waste discharges, and the factors that the WQCA requires the Regional Boards to takeinto account in developing water quality objectives, which are specified in §13241 of the WQCA((13263(a) WQCA). However, a Regional Board may waive the requirements in 13260(a) and13253(a) as to a specific discharge or a specific type of discharge where the waiver is not against thepublic interest (13269(a) WQCA).
RWQCBs and other local jurisdictions have adopted storm water drainage well provisions intheir basin plans or other requirements. Examples of such actions include the following:
• The San Francisco Bay RWQCB adopted the San Francisco Bay Basin Water Quality ControlPlan amendment on Shallow Drainage Wells in 1992. It requires local agencies to develop ashallow drainage well control program consisting of locating existing wells and establishing apermitting program for new and existing wells.
• The Lahontan RWQCB issues WDRs to facilities with potential sources of pollutants in stormwater runoff. The WDRs incorporate discharge specifications, BMPs, monitoringrequirements, and spill contingency plans. The RWQCB also conducts inspections of sites.
• The Santa Clara Valley Water District adopted a Storm Water Infiltration Policy by ordinance. It is also incorporated in the Santa Clara County “Standards for the Construction andDestruction of Wells and Other Deep Excavations in Santa Clara County” (1989). The WaterDistrict has developed a special supplement on storm water infiltration devices (1993). Itincludes general siting and construction requirements and siting restrictions and prohibitions.

September 30, 1999 79
Storm water drainage well construction is allowed only in areas where the jurisdiction hasadopted a Memorandum of Understanding with the Santa Clara Water District for a controlprogram for storm water drainage wells. Setback distances, depth to the water table, and wellmarking procedures are specified. The storm water supplement also includes a section onmaterials and procedures discussing annular space sealing, surface construction features, andrequired reports. It provides destruction standards and special sealing standards.
• Yolo County regulates storm water drainage wells by ordinance. However, the County doesnot issue permits for storm water drainage wells. The County does not define storm water as“liquid waste” or “wastewater” and therefore its requirements pertaining to wastewater systemsdo not apply. The County does not require licensed drillers for the construction of drainagewells.
• Merced County by ordinance prohibits wells from receiving storm water. A permit is requiredfrom the County Health Officer prior to construction, reconstruction, deepening, abandonment,or destruction of any well or soil boring. The construction of dry/drainage wells, defined in partas a well constructed for the purpose of disposing of waste water or drainage water, isprohibited. The Health Officer may make exceptions if it can be shown that the quality of thewater being introduced into the well will not have an undesirable impact on the ground water orthe well’s construction will not permit the intermixing of aquifers or provide a conduit for thevertical movement of known or potential contaminants.
• Stanislaus County establishes standards for construction of dry wells by a policy document,which specifies setback distances and distances from the water table. The County publicworks staff inspects well installations.
• Riverside County flood control districts and building departments review plans and inspectstorm water drainage facilities.
Florida
Florida is a UIC Primacy State for Class V wells. Chapter 62-528 of the FloridaAdministrative Code (FAC), effective June 24, 1997, establishes the UIC program, and Part V (62-528.600 to 62-528.900) addresses criteria and standards for Class V wells. Class V wells aregrouped into eight categories/groups for purposes of permitting. Storm water drainage wells and lakelevel control wells fall into Group 6.
Permitting
Underground injection through a Class V well is prohibited except as authorized by permit bythe Department of Environmental Protection (DEP). Owners and operators are required to obtain aConstruction/Clearance Permit before receiving permission to construct. The applicant is required tosubmit detailed information, including well location and depth, description of the injection system and of
September 30, 1999 80
the proposed injectate, and any proposed pretreatment. When site-specific conditions indicate a threatto a USDW, additional information must be submitted. The State currently does not permit theconstruction of new storm water wells where fluids would be injected directly into a USDW, andtherefore is not permitting new wells in the northwest and central regions (e.g., Orlando), while it willpermit in the Florida Keys and coastal areas of Broward and Dade counties (e.g., the southeast).
Lake level control wells in Florida inject directly into a USDW and so the state has notpermitted any new ones since receiving primacy in 1982. Replacement may be allowed underemergency conditions when methods to remediate an existing well were ineffective and it is determinedthat construction of the new well is essential to prevent flooding. If a new well is constructed, the oldwell must be plugged and abandoned (Cadmus, 1999).
Siting and Construction
Specific construction standards for Class V wells have not been enacted by Florida, because ofthe variety of Class V wells and their uses. Instead, the State requires the well to be designed andconstructed for its intended use, in accordance with good engineering practices, and approves thedesign and construction through a permit. The State can apply any of the criteria for Class I wells tothe permitting of Class V wells, if it determines that without such criteria the Class V well may cause orallow fluids to migrate into a USDW and cause a violation of the State’s primary or secondary drinkingwater standards, which are contained in Chapter 62-550 of the FAC. However, if the injectate meetsthe primary and secondary drinking water quality standards and the minimum criteria contained in Rule62-520-400 of the FAC, Class I injection well permitting standards will not be required.
Class V wells are required to be constructed so that their intended use does not violate thewater quality standards in Chapter 62-520 FAC at the point of discharge, provided that the drinkingwater standards of 40 CFR Part 142 (1994) are met at the point of discharge.
Operating Requirements
All Class V wells are required to be used or operated in such a manner that they do not presenta hazard to a USDW.
Monitoring Requirements
Monitoring generally will be required for Group 6 wells, unless the wells inject fluids that meetthe primary and secondary drinking water standards in 62-550 FAC and the minimum criteria in Rule62-520, and the injection fluids have been processed through a permitted drinking water treatmentfacility (62-528.615 (1)(a)2 FAC). Monitoring frequency will be based on well location and thenature of the injectate and will be addressed in the permit.
September 30, 1999 81
Plugging and Abandonment
The owner or operator of any Class V well must apply for a plugging and abandonment permitwhen the well is no longer used or usable for its intended purpose. Plugging must be performed by alicensed water well contractor.
Idaho
Idaho is a UIC Primacy State for Class V wells and has promulgated regulations for the UICprogram in the Idaho Administrative Code (IDAPA), Title 3, Chapter 3. Deep injection wells aredefined as more than 18 feet in vertical depth below the land surface (37.03.03.010.11 IDAPA). Wells are further classified, with Class V Subclass 5D2 defined as storm runoff wells(37.03.03.025.01.g IDAPA).
Permitting
Construction and use of shallow injection wells is authorized by rule, provided that inventoryinformation is provided and use of the well does not result in unreasonable contamination of a drinkingwater source or cause a violation of water quality standards that would affect a beneficial use(37.03.025.03.d. IDAPA). Construction and use of Class V deep injection wells may be authorizedby permit (37.03.03.025.03.c IDAPA). The regulations outline detailed specifications for theinformation that must be supplied in a permit application (37.03.03.035 IDAPA).
Operating Requirements
Standards for the quality of injected fluids and criteria for location and use are established forrule-authorized wells, as well as for wells requiring permits. The rules are based on the premise that ifthe injected fluids meet MCLs for drinking water for physical, chemical, and radiological contaminantsat the wellhead, and if ground water produced from adjacent points of diversion for beneficial usemeets the water quality standards found in Idaho’s “Water Quality Standards and WastewaterTreatment Requirements,” 16.01.02 IDAPA, administered by the Idaho Department of Health andWelfare, the aquifer will be protected from unreasonable contamination. The State may, when it isdeemed necessary, require specific injection wells to be constructed and operated in compliance withadditional requirements (37.03.03.050.01 IDAPA (Rule 50)). Rule-authorized wells “shall conform tothe drinking water standards at the point of injection and not cause any water quality standards to beviolated at the point of beneficial use” (37.03.03.050.04.d IDAPA).
DEQ has prepared a guidance document entitled “Catalog of Storm Water Best ManagementPractices for Idaho Cities and Counties.” As guidance, these BMPs are not mandatory.
Monitoring, recordkeeping, and reporting may be required if the State finds that the well mayadversely affect a drinking water source or is injecting a contaminant that could have an unacceptableeffect upon the quality of the ground waters of the State (37.03.03.055 IDAPA (Rule 55)).
September 30, 1999 82
Plugging and Abandonment
The Idaho Department of Water Resources (IDWR) has prepared “General Guidelines forAbandonment of Injection Wells,” which are not included in the regulatory requirements. IDWRexpects to approve the final abandonment procedure for each well.
Financial Responsibility
No financial responsibility requirement exists for rule-authorized wells. Permitted wells arerequired by the permit rule to demonstrate financial responsibility through a performance bond or otherappropriate means to abandon the injection well according to the conditions of the permit(37.03.03.35.03.e IDAPA).
Montana
USEPA Region 8 directly implements the UIC program for Class V wells in Montana. NoState regulations apply to storm water drainage wells. Local jurisdictions may regulate storm waterdrainage wells. For example, by city ordinance, Missoula prohibits construction of new storm waterwells, defined as a structure, pit, or hole that primarily receives storm water runoff from paved areas,including, but not limited to, parking lots, streets, residential subdivisions, and highways (MissoulaValley Aquifer Protection Ordinance, §13.26.030.42). The city prohibits storm water injection wellswithin 50 feet of a community or non-transient non-community public water supply well (§13.26.090).
New York
USEPA Region 2 directly implements the UIC program for Class V wells in New York. Inaddition, under the State’s Environmental Conservation Law, the Department of EnvironmentalConservation, Division of Water Resources (DWR) has promulgated regulations in the State CodeRules and Regulations, Title 6, Chapter X, Parts 703, 750 -758. These regulations establish waterquality standards and effluent limitations, create a State Pollutant Discharge Elimination system(SPDES) requiring permits for discharges into the waters of the State, specify that such discharges mustcomply with the standards in Part 703, and provide for monitoring in Part 756.
Permitting
New York has adopted two SPDES general permits for storm water discharges. They are theSPDES General Permit for Storm Water Discharges from Construction Activity, Permit No. GP-93-06(August 1993) and SPDES General Permit for Storm Water Discharges Associated with IndustrialActivity Except Construction Activity, Permit No. GP-98-03 (October 1998). These general permitsare issued pursuant to Article 17, Titles 7 and 8 and Article 70 of the Environmental Conservation Law. To come under the coverage of the general permit, a discharger must submit a Notice of Intent,Transfer, or Termination.
September 30, 1999 83
Both general permits cover all areas of the State where New York implements § 402 of theClean Water Act. Discharge is unlawful unless in compliance with the general permit or with anindividual SPDES permit. Discharges other than storm water must be in compliance with a SPDESpermit. Discharges mixed with sources of non-storm water other than those expressly authorized underthe general permit or a different SPDES permit are prohibited.
The discharge authorized by the general permit may not cause or contribute to a violation ofwater quality standards in Parts 700 through 705 of Title 6 of the New York Code. Operators arerequired to submit a storm water pollution prevention plan, which must address housekeeping,equipment inspections, training, spill prevention and response, and reporting/ recordkeeping.
Operating Requirements
Water quality standards must be met. The industrial general permit specifies additionalrequirements for storm water discharges associated with specifically listed industrial activities.
Ohio
Ohio is a UIC Primacy State for Class V wells. Regulations establishing the UIC program arefound in Chapter 3745-34 of the Ohio Administrative Code (OAC). Class V injection well definitionsinclude drainage wells used to drain surface fluid, primarily storm runoff, into a subsurface formation(3745-34-04(E)(4) OAC).
Permitting
Any underground injection, except as authorized by permit or rule, is prohibited. Theconstruction of any well required to have a permit is prohibited until the permit is issued (3745-34-06OAC).
Injection into Class V injection wells is authorized by rule (3745-34-13 OAC). However, adrilling permit and an operating permit are required for injection into a Class V injection well of sewage,industrial wastes, or other wastes, as defined in § 6111.01 of the Ohio Revised Code, into or above aUSDW (3745-34-13 OAC and 3745-34-14 OAC). Therefore, if the storm water injectate isanticipated to exceed primary drinking water standards (MCLs) or health advisories (HALs), permitsto install and operate the well are required.
Wells required to obtain an individual permit must submit detailed information, includinglocation, formation into which the well is drilled, depth of well, nature of the injectate, and atopographical map showing the facility, other wells in the area, and treatment areas (3475-34-16(E)OAC).
September 30, 1999 84
Siting and Construction
There are no specific regulatory requirements for the siting and construction of storm waterdrainage wells permitted by rule. Wells required to obtain an individual permit must submit sitinginformation and construction records.
Operating Requirements
There are no specific operating or monitoring requirements for storm water drainage wellspermitted by rule. Injectate must meet drinking water standards at the point of injection, unless a permitallows otherwise. Permitted wells will have monthly and quarterly monitoring and reportingrequirements (3745-34-26 (J) OAC). The State has developed a guidance on BMPs and distributed itto local jurisdictions. It includes design recommendations for siting of wells, elevation of points of entry,installation of standpipes and catch basins for sediment settling, drain markings to discourage dumping,and barriers around well entries. Other recommendations include public education, employee training,spill preparedness plans, measures to prevent sediment infiltration, and measures to eliminate disposalof pollutants through storm water wells. Oregon
Oregon is a UIC Primacy State for Class V wells. The UIC program is administered by theDepartment of Environmental Quality (DEQ). Under the State’s Administrative Rules (OAR)pertaining to underground injection, a “waste disposal well” is defined as any bored, drilled, driven ordug hole, whose depth is greater than its largest surface dimension, which is used or is intended to beused for disposal of sewage, industrial, agricultural, or other wastes and includes drain holes, drywells,cesspools and seepage pits, along with other underground injection wells (340-044-0005(22) OAR). Construction and operation of a waste disposal well without a water pollution control facility (WPCF)permit is prohibited. Certain categories of wells are prohibited entirely, including wells used forunderground injection activities that allow the movement of fluids into a USDW if such fluids may causea violation of any primary drinking water regulation or otherwise create a public health hazard or havethe potential to cause significant degradation of public waters. Oregon has established a groundwaterprotection goal of preventing contamination of the state’s groundwater resource. This nondegradationgoal is intended to protect groundwater more stringently than the use of drinking water standardswould do.
Permitting
Storm water drains from residential or commercial areas, which are not affected by toxic orindustrial wastes, do not require a WPCF permit, but are required to satisfy the requirements in 340-044-0050 OAR (i.e., they may not be located closer than 500 feet from a domestic water well) (340-044-0015 OAR).
September 30, 1999 85
Storm water wells that constitute underground injection activity that may cause, or tend tocause, pollution of ground water must be approved by the DEQ, in addition to any other permits orapprovals required by other federal, state, or local agencies (340-044-0055 OAR). Permits are not tobe issued for construction, maintenance, or use of waste disposal wells where any other treatment ordisposal method which affords better protection of public health or water resources is reasonablyavailable or possible (340-044-0030 OAR). Such wells, unless absolutely prohibited, must obtain aWPCF permit (340-044-0035 OAR, 340-045-0015 OAR).
Siting and Construction
The requirements for waste disposal wells for surface drainage specify that such wells may onlybe used in those areas where there is an adequate confinement barrier or filtration medium between thewell and a USDW, and where construction of surface discharging storm sewers is not practical.
New storm drainage disposal wells must be as shallow as possible but may not exceed a depthof 100 feet. They may not be located closer than 500 feet to a domestic water well (340-044-0050OAR).
Operating Requirements
Using a waste disposal well for agricultural drainage is prohibited. Using such a well for surfacedrainage in areas where toxic chemicals or petroleum products are stored or handled is prohibited,unless there is containment around the product area which will prevent spillage or leakage from enteringthe well. A means of temporarily plugging or blocking a waste disposal well for storm drainage in theevent of an accident or spill must be available. Any parking lot drained by waste disposal wells must bekept clean of petroleum products and other organic or chemical wastes as much as practicable tominimize the degree of contamination of the storm water drainage.
Oregon has prepared guidance, “Oregon Storm Water Management Guidelines (for Surfaceand Ground Waters,” (1998) as well as “Department of Environmental Quality UIC Class V BMPs forGroundwater” (1998).
Abandonment and Plugging
Upon discontinuance of use or abandonment a waste disposal well is required to be renderedcompletely inoperable by plugging and sealing the hole.
Utah
Utah is a UIC Primacy State for Class V wells. The Department of Environmental Quality haspromulgated regulations addressing injection wells in R317-7 and R655-1-5 and R655-1-6 of theUtah Administrative Code (UAC). The rules incorporate by reference federal requirements in 40 CFR144, 146, 148, 261, 142, 136 and 124 and 10 CFR Part 20 (R317-7-1 UAC). Drainage wells used
September 30, 1999 86
to drain surface fluid, primarily storm runoff, into a subsurface formation are defined as Class V wells(R317-7-3.3.5.C and D UAC).
Permitting
Underground injection is prohibited except as authorized by permit or by rule. No injectionmay be authorized that endangers a drinking water source. An applicant has the burden of showing thatinjection will not result in the movement of fluid containing contaminants into a USDW or cause aviolation of any primary drinking water regulation (R317-7-5 UAC). Existing and new Class V injectionwells currently are authorized by rule (317-7-6.3 UAC).
Operating Requirements
The State does not specify operating requirements for storm water drainage wells. It doesrecommend to local governments with numerous such wells that they set up local spill response teams. One local government in Utah, the City of Orem, through its storm water utility, charges for storm waterdischarges. The city also has prepared a BMP guidance document and offers credits toward utilitycharges for implementing BMPs.
Washington
Washington is a UIC Primacy State for Class V wells. Chapter 173-218 of the WashingtonAdministrative Code (WAC) establishes the UIC program. Under the program, the policy of theDepartment of Ecology (WDOE) is to maintain the highest possible standards to prevent the injectionof fluids that may endanger ground waters which are available for beneficial uses or which may containfewer than 10,000 mg/l TDS. Consistent with that policy, all new Class V injection wells that injectindustrial, municipal, or commercial waste fluids into or above a USDW are prohibited (172-218-090(1) WAC ).
Permitting
A permit must specify conditions necessary to prevent and control injection of fluids into thewaters of the State, including all known, available, and reasonable methods of prevention, control, andtreatment, applicable requirements in 40 CFR Parts 124, 144, 146, and any conditions necessary topreserve and protect USDW. Any injection well that causes or allows the movement of fluid into aUSDW that may result in a violation of any primary drinking water standard under 40 CFR Part 141 orthat may otherwise adversely affect the beneficial use of a USDW is prohibited (173-218-100 WAC). The State’s Waste Discharge Permit Program, which prohibits the discharge of pollutants into waters ofthe State (which include ground water) without a permit (Chapter 173-216 WAC) does not apply tothe injection of fluids through wells which are regulated by the UIC control program (173-216-010WAC). Storm water wells that conform to Best Management Practices stipulated by WDOE areconsidered to be “non-polluting” and are permitted.

September 30, 1999 87
Siting and Construction
The DEQ has developed guidance for the Puget Sound Basin, “Storm Water Management forthe Puget Sound Basin: the Technical Manual,” (1992) and held training workshops for localgovernment staff. The guidance describes recommended construction and siting by individual facilitydesign. It recommends that infiltration facilities on commercial and industrial sites be no closer than 100feet to drinking water wells, septic tanks or drainfields, and springs used for drinking water supplies. The guidance recommends that such facilities be at least 20 feet downslope and 100 feet upslope frombuilding foundations and that the maximum slope for siting of infiltration facilities be limited.
The State has promulgated minimum standards for construction and maintenance of wells (173-160-010 through -560 WAC). However, injection wells regulated under Chapter 173-218 arespecifically exempted from these constructions standards (173-160-010(3)(e) WAC). Storm waterdrainage wells are specifically identified as exempt from the well construction requirements.
Operators of such facilities must prepare a soils report, conduct periodic monitoring, and logthe speed at which the facility dewaters after large storms. They are also required to submit completerecords describing construction or alteration of a well (173-160-050 and 173-160-055 WAC).
Wells are required to be planned and constructed to be adapted to the geologic and groundwater conditions at the well site and designed to facilitate conservation of ground water (173-160-065WAC).
Operating Requirements
The water quality standards for ground waters establish an antidegradation policy. Theinjectate must meet the State ground water standards at the point of compliance (173-200-030 WAC).
Plugging and Abandonment
All wells not in use must be securely capped so that no contamination can enter the well (173-160-085 WAC).
September 30, 1999 88
REFERENCES
63 Federal Register 40585-40619. July 29, 1998. 40 CFR Parts 144, 145, and 146. Class VInjection Wells Underground Injection Control Regulations, Revisions; Proposed Rule.
Agency for Toxic Substances and Disease Registry (ATSDR). 1999. Toxicity Frequently AskedQuestions (ToxFAQs) Fact Sheets. Atlanta, GA: Agency for Toxic Substances and Disease Registry,Division of Toxicology. http://www.atsdr.cdc.gov/tfacts.html. April 1999.
Agency for Toxic Substances and Disease Registry (ATSDR). 1999. Public Health Statements. Atlanta, GA: Agency for Toxic Substances and Disease Registry, Division of Toxicology. http://www.atsdr.cdc.gov/ToxProfiles. April 1999.
Agency for Toxic Substances and Disease Registry (ATSDR). 1999. Toxicity Frequently AskedQuestions (ToxFAQs) Fact Sheets. Atlanta, GA: Agency for Toxic Substances and Disease Registry,Division of Toxicology. http://www.atsdr.cdc.gov/tfacts.html. March 1999.
American National Standards Institute (ANSI). 1993. Standard Guidelines for Operation andMaintenance of Urban Subsurface Drainage. ANSI/ASCE 14-93. New York: American Society ofCivil Engineers.
Arizona Department of Environmental Quality. 1998. Best Available Demonstrated ControlTechnology (BADCT) Guidance Document for Domestic and Municipal Wastewater Treatment. Draft.Water Quality Division, Aquifer Protection Program.
Arizona Department of Water Resources. 1993. Drywell Recharge and Contaminant Loading inMetropolitan Phoenix, Arizona. Phoenix, AZ.
Arizona Department of Environmental Quality. 1988. Dry Wells in Arizona - A Report to the ArizonaLegislature. Phoenix, AZ. Hydrologic Report No. 1, Kafura, C.J.
Bannerman, R.T., D.W. Owens, R.B. Dodds, and N.J. Hornewer. 1993. “Sources of Pollutants inWisconsin Stormwater,” Water Science and Technology. Volume 26, Number 3-5: 241-259.
Beech, R.M. and A.F. Drake. 1992. “Designing an Effective Communication Program: A Blueprintfor Success.” USEPA/University of Michigan, September 1992.
Bradner, L.A. 1991. Water Quality in the Upper Floridan Aquifer in the Vicinity of Drainage Wells,Orlando, Florida. Water Resources Investigations Report 90-4175. Tallahassee, Florida: USGeological Survey.
September 30, 1999 89
Bradner, L.A. 1996. Estimation of Recharge Through Selected Drainage Wells and Potential Effectsfrom Well Closure, Orange County, Florida. Open File Report 96-316. Denver, Colorado: U. S.Geological Survey, Branch of Information Services.
Brown and Caldwell Consulting Engineers. 1986. Evaluation of Sump Impacts on Ground Water inEast Multnomah County. Portland, OR.
The Cadmus Group. 1991. Storm Water Drainage Wells (5D2). Waltham, MA.
The Cadmus Group. 1996. Storm Water Drainage Well Guidance - Draft. Waltham, MA.
The Cadmus Group. 1999. State-by-State Notebooks Compiling Results from the Class VUnderground Injection Control Study. February 1, 1999.
California State Department of Transportation. 1980. Prepared for Federal Highway Administration. Underground Disposal of Storm Water Runoff Design Guidelines Manual. PB83-180257.
Campbell, L.J. 1985. An Assessment of Shallow Injection Wells in Idaho. Idaho Department ofWater Resources, February 1985.
City of Orlando. 1994. City of Orlando Drainage Well Protection Plan. Public Works Department.
Delzer, G., J. Zogorski, T. Lopes, and R. Bosshart. 1996. “Occurrence of the Gasoline OxygenateMTBE and BTEX Compounds in Urban Storm Water in the United States, 1994 -1995.” USGeological Survey Water Resources Investigations Report 96. [Denver, CO]: US Geological Survey.
Deuerling, R. 1997. Florida Department of Environmental Regulations. Personal Communication toAnhar Karimjee, Office of Water, US Environmental Protection Agency, November 1997,Tallahassee, FL.
Duchene, M., E. McBean, and N. Thomson. 1994. “Modeling of Infiltration from Trenches for StormWater Control.” Journal of Water Resources Planning and Management. 120: 3: 276-293.
Elder, J.R. and S.K. Lowrance. 1992. Directors, USEPA Office of Ground Water and DrinkingWater USEPA Office of Solid Waste (respectively). Classification of Infiltration Galleries Under theUIC and RCRA Programs. Memorandum to USEPA Region 1-10 Water Management DivisionDirectors and Hazardous Waste Management Division Directors.
German, E.R. 1989. Quantity and Quality of Stormwater Runoff Recharged to the Floridan AquiferSystem Through Two Drainage Wells in the Orlando, Florida, Area. US Geological Survey Water-Supply Paper 2344, 51 p.
September 30, 1999 90
Haney, J., M. Leach, and L. Sobchak. 1989. Dry Wells – Solution or Pollution? An Arizona StatusReport. Arizona Department of Environmental Quality, Phoenix, Arizona.
Hopeck, J. 1997. “Adverse Impacts on Ground Water Quality from Stormwater Infiltration at TwoSites in Southern Maine.” Maine Department of Environmental Protection, Bureau of Land and WaterQuality, Maine.
Idaho Bureau of Mines and Geology. 1970. Abegglen, D., A. Wallace, and R. Williams. The Effectsof Drain Wells on the Ground-water Quality of the Snake River Plain. [Boise, ID]: Pamphlet Number148.
Idaho Department of Water Resources. Storm Water Injection Wells. [Boise, ID].
Kansas Department of Health & Environment. 1986. Correspondence provided by Larry Knoche,Bureau of Environmental Remediation, dated Nov., Dec., 1986.
Kimrey, J.O. and L.D. Fayard. 1984. Geohydrologic Reconnaissance of Drainage Wells in Florida. Tallahassee, Florida: Geological Survey, Water Resources Division.
Kobriger, N.P., T.L. Meinholz, M.K. Gupta, and R.W. Agnew. 1981. Constituents of highwayrunoff, Vol. III, Predictive procedure for determining pollutant characteristics in highway runoff: FederalHighway Administration Report, FHWA/RD-81/044, 197 p.
Kobriger, N.P. 1984. Sources and migration of highway runoff pollutants, Volume I: ExecutiveSummary. Federal Highway Administration Report, FHWA/RD-84/057.
Lee, G.F. and S. Taylor. 1998. Development of Appropriate Storm Water Infiltration BMPs: Part 1:Potential Water Quality Impacts, Monitoring, and Efficacy Evaluation. In: “Proceedings of the 1998Ground Water Protection Council Annual Forum,” September 19-23, 1998, Sacramento, CA.
Malmquist, P. and S. Hard. 1981. Groundwater quality changes caused by stormwater infiltration. In:Proceedings of the Second International Conference on Urban Storm Drainage. Urbana, IL; June 15-19, 1981. Littleton, CO, Water Resources Publications. 595 p.
Marsh, J. 1993. “Assessment of Nonpoint Source Pollution Runoff in Louisville,” (Jefferson County) Kentucky, USA.” Archives of Enviromental Contamination and Toxicology. Volume 25, Number 5,p. 446-55.
McKenzie, D. and G. Irwin. 1988. “Effects of Two Storm Water Management Methods on theQuality of Water in the Upper Biscayne Aquifer at Two Commercial Areas in Dade County, Fla.” USGeological Survey: Water Resources Investigations Report 88-4069. [Denver, CO.]: US GeologicalSurvey.
September 30, 1999 91
Michael, E. 1997. St. Joseph County Health Dept. Letter to Alan Melcer, US EnvironmentalProtection Agency, Underground Control Branch, Chicago, IL, September 18, 1997, Mishawaka, IN.
Miller, S. 1983. The Potential of Ground Water Impacts Resulting from Storm Water Runoff Disposalin Spokane County, Final Project Report, Water Quality Management Planning Grant G 83087,Spokane County Cooperation with the Washington Department of Ecology, Spokane, Washington, ascited in Miller, S.A. and B. Galle (1996). “Identification of Ground Water Impacts from Storm WaterInjection and Infiltration Using Direct and Indirect Methods.” In Proceedings of the 1996 GroundWater Protection Council Annual Forum. September 22-25, 1996, St. Paul, Minnesota, pp. 11-20.
Miller, S. 1987. The Treatment Effectiveness of Alternative Cover Materials in Storm RunoffInfiltration Basins, Final Project Report, Water Quality Management Planning Grant G-86-046,Spokane County in Cooperation with the Washington Department of Ecology, Spokane, Washington,25 pp.
Miller, S. and W. Galle. 1996. “Identification of Ground Water Impacts from Storm Water Injectionand Infiltration using Direct and Indirect Methods.” In: Proceedings of the 1996 Ground WaterProtection Council Annual Forum. September 22-25, 1996, St. Paul, Minnesota, pp.11-20.
Morton, L.B. 1987. “Ground Water Contamination Potential of Drainage Wells in Utah: APreliminary Assessment.” In: Proceedings of the International Symposium on Class V Injection WellTechnology. 87-119. Underground Injection Practices Council, Inc.
New Jersey Department of Environmental Protection and Department of Agriculture. 1994. StormWater and Nonpoint Source Pollution Control, December.
Nussbaum, J.C. 1991. Urban Storm Water Runoff and Ground-Water Quality. USEPA Office of theAdministrator. Report No. 101/F-90/046.
Oregon Department of Environmental Quality. 1997. Lower Platte South Natural Resources District. Manual of Erosion and Sediment Control and Storm Water Management Standards. In: DraftLiterature Review on Storm Water Impacts on Ground Water.
Orr, V. J. 1990. Wellhead Protection - Lessons Learned. Underground Injection Practices Council,Summer Meeting, July 22-25, 1990.
Orr, V. J. 1993. “Wellhead Protection - Lessons Learned.” Journal of Applied Ground WaterProtection, Volume 1, Number 1.
Pitt, R., M. Lalor, R. Field, D. Adrian, and D. Barbe. 1993. Investigation of Inappropriate PollutantEntries into Storm Drainage System: A User's Guide. [Washington, DC]: US Environmental ProtectionAgency, Risk Reduction Engineering Laboratory, Office of Research and Development.
September 30, 1999 92
Pitt, R., S. Clark, and K. Parmer. 1994. Potential Ground Water Contamination from Intentional andNon-Intentional Stormwater Infiltration-1993 Research Report. [Washington, DC]: University ofAlabama at Birmingham and US Environmental Protection Agency, Risk Reduction EngineeringLaboratory.
Pitt, R., S. Clark, K. Parmer, and R. Field. 1996. Ground Water Contamination from StormwaterInfiltration. [Chelsea, Ml]: Ann Arbor Press.
Pitt, R. 1998. Epidemiology and Stormwater Management. In Stormwater Quality Management. CRC/Lewis Publishers. New York, NY.
Resnick, S. and K. DeCook. 1983. Hydrological and Environmental Controls on Management on Semiarid Urban Areas - Phase II. University of Arizona. Project Completion Report B-023-ARIZ.
Rochotte, M.L. 1997. Ohio Environmental Protection Agency. Personal Communication to AnharKarimjee, Office of Water, US Environmental Protection Agency, November 1997, Columbus, OH.
Roth, R. 1998. Wisconsin Department of Natural Resources. Personal communication with TheCadmus Group, Inc. October 1998.
Rutledge, A.T. 1987. Effects of land use on groundwater quality in central Florida – preliminaryresults. US Geological Survey Toxic Waste - Ground Water Contamination Program: US GeologicalSurvey Water Resources Investigations Report 86-4163. 49 p.
San Francisco Bay Region Water Quality Control Plan. No date.
Santa Clara Valley Water District. 1993. Santa Clara Valley Water District Well Standards. Supplement to “Standards for the Construction and Destruction of Wells and Other Deep Excavationsin Santa Clara County.” August 1993.
Scheuler, T., P. Kumble, and M. Heraty. 1992. “A Current Assessment of Urban Best ManagementPractices: Techniques for Reducing Nonpoint Source Pollution in the Coastal Zone.” [Washington,DC]: Metropolitan Washington Council of Governors. Prepared for the USEPA, Office of Wetlands,Oceans and Watersheds.
Schueler, T. and D. Shepp. “Hydrocarbon Hotspots in the Urban Landscape.” Department ofEnvironmental Programs, Metropolitan Washington Council of Governments, Washington, DC
Schueler, T. 1999. Microbes and Urban Watersheds: Concentrations, Sources, and Pathways. Watershed Protection Techniques. 3(1): pp. 554 - 565.
September 30, 1999 93
Schiffer, D. 1989. “Effects of Three Highway Runoff Detention Methods on Water Quality of theSurficial Aquifer System in Central Florida.” US Geological Survey: Water Resources InvestigationsReport 88-4170. [Denver, CO.].
Schmidt, K. 1985. Results of Dry Well Monitoring Project for a Commercial Site in the PhoenixUrban Area. [Phoenix, AZ]: Maricopa Association of Governments.
Schmidt, S. and D. Spencer. 1986. “The Magnitude of Improper Waste Discharges in an UrbanStorm Water System,” Journal Water Pollution Control Federation (Volume 58, No. 87), as cited inPitt, R., M. Lalor, R. Field, D. Adrian, and D. Barbe. 1993. Investigation of Inappropriate PollutantEntries Into Storm Drainage System: A User's Guide. [Washington, DC]: US Environmental ProtectionAgency, Risk Reduction Engineering Laboratory, Office of Research and Development.
Seitz, A., M. La Sala, and J. R. Moreland. 1977. Effects of Drain Wells on the Ground-WaterQuality of the Western Snake Plain Aquifer, Idaho. Idaho: United States Department of the Interior,US Geological Survey.
Shaw, B. and J. Berndt. 1990. An Assessment of the Impact of Stormwater Disposal Wells onGroundwater Quality. Stevens Point, WI: University of Wisconsin.
Shiner, G.R. and E.R. German. 1983. Effects of Recharge from Drainage Wells on Quality of Waterin the Floridan Aquifer in the Orlando Area, Central Florida. US Geological Survey, Water ResourcesInvestigations Report 82-4094, 124 p.
Squillace, P., J. Zogorski, W. Wilber, and C. Price. 1996. “Preliminary Assessment of theOccurrence and Possible Sources of MTBE in Ground Water in the United States, 1993-1994.” Environmental Science and Technology, Volume 30, Number 5.
Storm Water Infiltration Device (SWID) Destruction and Closure. Santa Clara Valley Water District.
Streaker, E., B. Wu, and M. Lanelli. 1997. Analysis of Urban Runoff Water Quality Monitoring DataCollected from 1990 to 1996. Portland, OR: Woodward-Clyde Consultants. Prepared for TheOregon Association of Clean Water Agencies.
Terada, C. 1999. Environmental Protection Agency. Ground Water Protection Unit, USEPA Region10. Telephone Conversation with Robert Noecker, ICF Consulting. August 11, 1999.
U.S. Agency for Toxic Substances and Disease Registry. 1989. Health Assessment for McChord AirForce Base. Tacoma Pierce County, Washington, USEPA Region 10. P1390-119454. January1989.
September 30, 1999 94
U.S. Department of Transportation. 1996. Federal Highway Administration, Office of Environmentand Planning, Evaluation of Management of Highway Runoff Water Quality, FHWA-PD-96-032,June 1996.
USEPA. 1983. Water Planning Division. Results of the Nationwide Urban Runoff Program - Volume1, Final Report. [Washington, DC], USEPA P1384-185552.
USEPA. 1984. National Secondary Drinking Water Regulations. USEPA Publication No. 570/9-76-000.
USEPA. 1987. Report to Congress: Class V Injection Wells. USEPA 570/9-87-006. Washington,DC: US Environmental Protection Agency, Office of Water, September 1987.
USEPA. 1992. Storm Water Management for Industrial Activities, USEPA 832-R-92-006, Office ofWater, September 1992.
USEPA. 1993a. Health Advisories for Drinking Water Contaminants. Office of Water HealthAdvisories. Lewis Publishers, Ann Arbor, Michigan.
USEPA. 1993b. Guidance Specifying Management Measures for Sources of Nonpoint Pollution inCoastal Waters, Office of Wetlands, Oceans, and Watersheds, January 1993.
USEPA. 1995a. National Primary Drinking Water Regulations Contaminant Specific Fact SheetsInorganic Chemicals - Technical Version. Washington, DC: Office of Water, Office of Ground Waterand Drinking Water. USEPA 811-95-002-T. http://www.epa.gov/OGWDW/dwh/t-ioc.html.October 1995.
USEPA. 1995b. Report to Congress - Storm Water Discharges Potentially Addressed by Phase II ofthe National Pollutant Discharge Elimination System Storm Water Program. USEPA 833-K-94-002,March 1995.
USEPA. 1996a. Drinking Water Regulations and Health Advisories. Office of Water. USEPA 822-B-96-002.
USEPA. 1996b. Guidance on Storm Water Drainage Wells - Draft for Review, Office of GroundWater & Drinking Water. September 1996.
USEPA. 1997. Superfund Web Site. Available at:http://www.epa.gov/superfund/oerr/impm/products/rodsites andhttp://www.epa.gov/superfund/oerr/impm/products/Cursites/cercinf.htm
USEPA. 1998a. National Primary Drinking Water Regulations. 40 CFR §141.32.

September 30, 1999 95
USEPA. 1998b. National Secondary Drinking Water Regulations. 40 CFR §143.
USEPA. 1998c. Storm Water Drainage Wells, Interim Final Guidance. Office of Ground Water andDrinking Water, September 1998.
USEPA. 1999a. Health Effects Notebook for Hazardous Air Pollutants. Office of Air Quality andPlanning Standards. http://www.epa.gov/ttn/uatw/hapindex.html. April 1999.
USEPA. 1999b. Integrated Risk Information System (IRIS). Cincinnati, OH: Office of Research andDevelopment, National Center for Environmental Assessment.http://www.epa.gov/ngispgm3/iris/index.html. March 1999.
USEPA. 1999c. National Primary Drinking Water Regulations Technical Fact Sheets. Washington,DC: Office of Water, Office of Ground Water and Drinking Water. http://www.epa.gov/OGWDW/hfacts.html. April 1999.
USEPA. 1999d. USEPA Region 5 UIC Program Web Page. Office of Ground Water and DrinkingWater. http://www.epa.gov/r5water/uic.html. August 1999.
USEPA. 1999e. USEPA National Pollutant Discharge Elimination System, Storm Water ProgramWeb Page. Office of Water, Office of Wastewater Management. http://www.epa.gov/owm/sw/about/index.htm. September 1999.
Vandike, J.E. and K. Hass. 1987. “Use of Storm Water Drainage Wells in Missouri.” In:Proceedings of the International Symposium on Class V Injection Well Technology. 160-177. Underground Injection Practices Council, Inc.
Washetnaw County Drain Commissioner. 1988. Huron River Pollution Abatement Project, Summary,as cited in Pitt, R., M. Lalor, R. Field, D. Adrian, and D. Barbe. Investigation of InappropriatePollutant Entries into Storm Drainage System: A User's Guide. [Washington, DC]: US EnvironmentalProtection Agency, Risk Reduction Engineering Laboratory, Office of Research and Development,1993.
Watroba, D. 1999. Florida Department of Environmental Protection. Telephone conversation withStephanie Barrett, ICF Consulting.
Wilde, F. 1994. “Geochemistry and Factors Affecting Ground Water Quality at Three Storm WaterManagement Sites in Maryland.” US Geological Survey Report of Investigations Number 59,[Washington, DC]: US Geological Survey.
Wilson, L.G. 1983. A Case Study of Dry Well Recharge. University of Arizona: The WaterResources Research Center, Tucson, Arizona, September, 1983.
September 30, 1999 96
Wilson, L.G., M.D. Osborn, K.L. Olson, S.M. Maida, and L.T. Katz. 1989. The Ground-WaterPollution Potential of Dry Wells in Pima County, Arizona. University of Arizona: The Water ResourcesResearch Center, Tucson, Arizona.
Wilson, L., R. Bassett, and R. Wallin. 1992. Depths of Storm-water Wells to Minimize Ground-Water Pollution. University of Arizona: Department of Hydrology and Water Resources, 1992.
Woessner, W. and K. Wogsland. 1987. “Effects of Urban Storm Water Injection by Class V Wellson a Potable Ground Water System.” In: Proceedings of the International Symposium on Class VInjection Well Technology, 1987. Underground Injection Practices Council, Inc., pp. 137-159.
Woodward-Clyde Consultants. 1989. Santa Clara Valley Nonpoint Source Study, Volume II:Control Measure Report, Final Draft Report.