the clash between science and the real world: the experiences of the adolescent substance abuse...
TRANSCRIPT

The Clash between Science and the Real The Clash between Science and the Real World: The Experiences of the Adolescent World: The Experiences of the Adolescent
Substance Abuse Prevention StudySubstance Abuse Prevention Study
Zili Sloboda, Sc.D., Principal InvestigatorZili Sloboda, Sc.D., Principal Investigator
September 13, 2005September 13, 2005
VII Meeting of the Expert Group on VII Meeting of the Expert Group on
Demand ReductionDemand Reduction
OAS/CICADOAS/CICAD
Funded by the Robert Wood Johnson Foundation (Grant#s Funded by the Robert Wood Johnson Foundation (Grant#s O39223 and 040371)O39223 and 040371)

The Adolescent Substance The Adolescent Substance Abuse Prevention StudyAbuse Prevention Study
To develop and evaluate an evidence-based To develop and evaluate an evidence-based substance abuse prevention program with substance abuse prevention program with curricula for the 7curricula for the 7thth grade (when children are grade (when children are ages 12 and 13) and 9ages 12 and 13) and 9thth grade (when children grade (when children are ages 14 and 15) to be delivered by DARE are ages 14 and 15) to be delivered by DARE officersofficers
Evaluation consists of following a cohort of Evaluation consists of following a cohort of students from the 7students from the 7thth through the 11 through the 11thth grades grades

Risk Years for Substance Risk Years for Substance UseUse
There is an increase of between 150% There is an increase of between 150% and 200% in the use of all substances and 200% in the use of all substances between the 8between the 8thth (ages 13 and 14) and (ages 13 and 14) and 1010thth grades (ages 15 and 16) grades (ages 15 and 16)
1010thth graders’ rates of substance use graders’ rates of substance use are closer to and parallel to those of are closer to and parallel to those of 1212thth graders graders..

LIFETIME PREVALENCE OF CIGARETTE USE--8TH, 10TH AND 12TH GRADES: 1991-2002 (MONITORING THE FUTURE STUDY)
0
10
20
30
40
50
60
70
1991 1992 1993 1994 1995 1996 1997 1998 1999 2000 2001 2002
YEAR
PERC
ENTA
GE
12th Grade
10th Grade
8th Grade

Why D.A.R.E.?Why D.A.R.E.?
D.A.R.E. is a delivery system of D.A.R.E. is a delivery system of officer/instructors and has a presence in officer/instructors and has a presence in 80% of school districts nationwide80% of school districts nationwide
D.A.R.E. training and monitoring D.A.R.E. training and monitoring strengthens implementation fidelitystrengthens implementation fidelity
Officers are trained to be prevention Officers are trained to be prevention specialists and their coming into the specialists and their coming into the classroom during prescheduled times classroom during prescheduled times insures that classroom time is devoted to insures that classroom time is devoted to preventionprevention
Overview of PresentationOverview of Presentation::
Curriculum Design Curriculum Design Research ElementsResearch Elements MeasuresMeasures ChallengesChallenges Current StatusCurrent Status

CURRICULUM DESIGNCURRICULUM DESIGN
SEVENTH and NINTH GRADESSEVENTH and NINTH GRADES
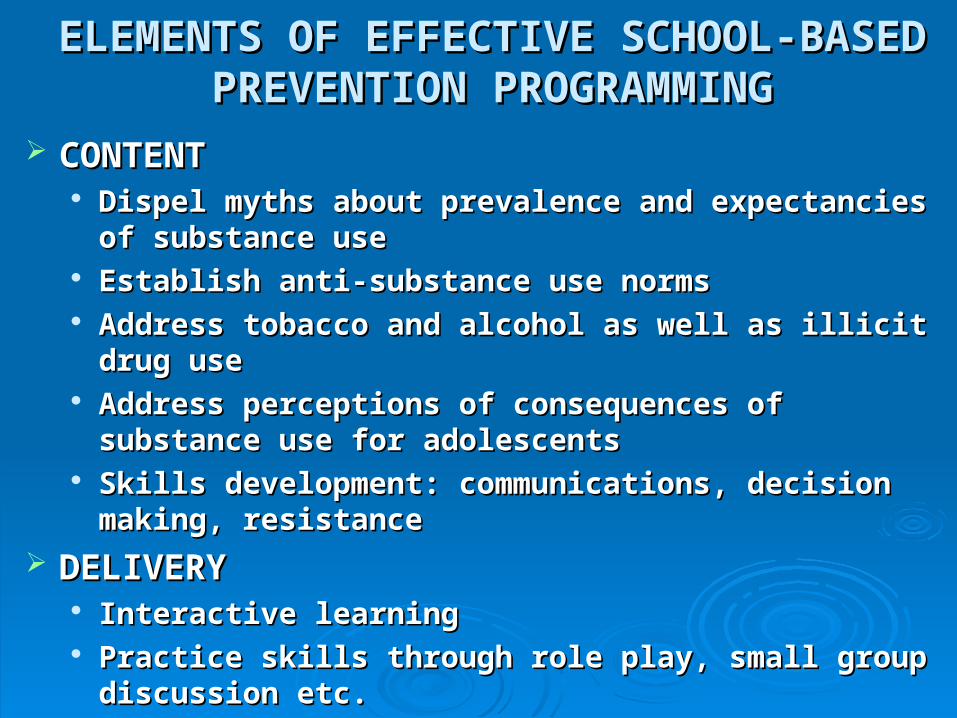
ELEMENTS OF EFFECTIVE SCHOOL-ELEMENTS OF EFFECTIVE SCHOOL-BASED PREVENTION PROGRAMMINGBASED PREVENTION PROGRAMMING
CONTENTCONTENT Dispel myths about prevalence and expectancies of Dispel myths about prevalence and expectancies of
substance usesubstance use Establish anti-substance use normsEstablish anti-substance use norms Address tobacco and alcohol as well as illicit drug useAddress tobacco and alcohol as well as illicit drug use Address perceptions of consequences of substance Address perceptions of consequences of substance
use for adolescentsuse for adolescents Skills development: communications, decision Skills development: communications, decision
making, resistancemaking, resistance
DELIVERYDELIVERY Interactive learningInteractive learning Practice skills through role play, small group Practice skills through role play, small group
discussion etc.discussion etc.

Curriculum Design CriteriaCurriculum Design Criteria Highly engaging problem-based activities.Highly engaging problem-based activities. Authentic problems as organizers.Authentic problems as organizers. Critical thinking skills required.Critical thinking skills required. Spiral sequence of skill development.Spiral sequence of skill development. In 7In 7thth grade-extensive small group grade-extensive small group
deliberations; in 9deliberations; in 9thth grade large group grade large group discussions (limited lecturing) .discussions (limited lecturing) .
Culturally and socially sensitive.Culturally and socially sensitive.

Theory of Planned Behavior Theoretical Model
SubjectiveNorms
Attitudes
Intention Behavior
PerceivedBehavioral
Control
External Variables
Demographics
Attitudes Towards Target
Personality
Beliefs that behavior leads to certain outcomes
Evaluation of outcomes
Beliefs of specific referents as to performance of behavior
Motivation to comply with those referents
Relative Importance of attitudinal and normative considerations
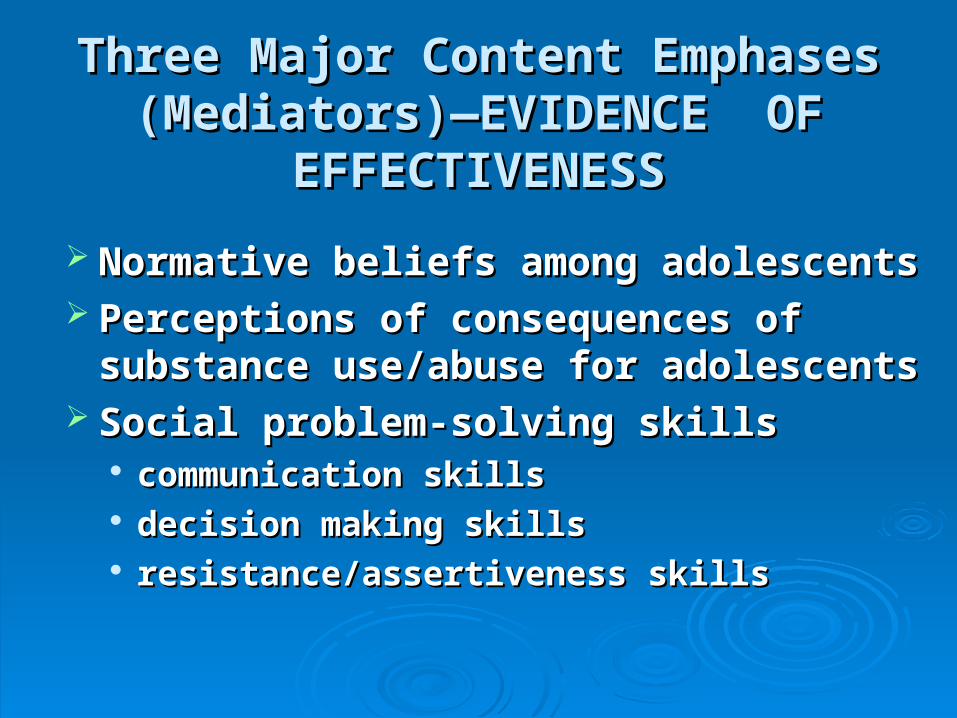
Three Major Content EmphasesThree Major Content Emphases(Mediators)—EVIDENCE OF (Mediators)—EVIDENCE OF
EFFECTIVENESSEFFECTIVENESS
Normative beliefs among adolescentsNormative beliefs among adolescents Perceptions of consequences of Perceptions of consequences of
substance use/abuse for adolescentssubstance use/abuse for adolescents Social problem-solving skillsSocial problem-solving skills
communication skillscommunication skills decision making skillsdecision making skills resistance/assertiveness skillsresistance/assertiveness skills

RESEARCH RESEARCH ELEMENTSELEMENTS

ASAPS Research Questions
Are there differences in the subsequent substance use behaviors of children who receive the program compared to those who were in the control schools?
To what extent is the program’s effectiveness a function of the implementation fidelity of the delivered program?
To what extent is the program’s effectiveness a function of the student’s exposure to the program?
What is the relationship between program mediators (normative beliefs, skills, etc.) and subsequent substance use?
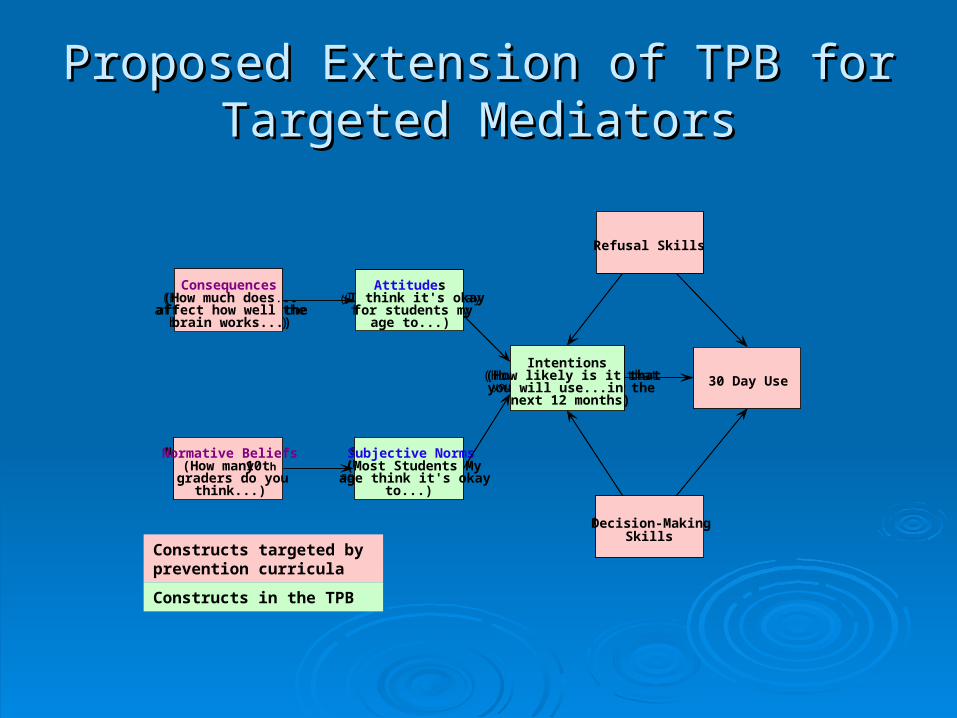
Proposed Extension of TPB for Proposed Extension of TPB for Targeted MediatorsTargeted Mediators
Refusal Skills
Decision-MakingSkills
Subjective Norms(Most Students Myage think it's okay
to...)
Consequences(How much does...affect how well the
brain works...)
Attitudes(I think it's okayfor students my
age to...)
Intentions(How likely is it thatyou will use...in the
next 12 months)
30 Day Use
Normative Beliefs(How many 10thgraders do you
think...)
constructs targeted by preventioncurricula
constructs in the TPB
Refusal Skills
Decision-MakingSkills
Subjective Norms(Most Students Myage think it's okay
to...)
Consequences(How much does...affect how well the
brain works...)
Attitudes(I think it's okayfor students my
age to...)
Intentions(How likely is it thatyou will use...in the
next 12 months)
30 Day Use
Normative Beliefs(How many10thgraders do you
think...)
Constructs targeted by prevention curricula
Constructs in the TPB

Methods—Study PopulationMethods—Study Population
SITES: DETROIT, HOUSTON, LOS ANGELES, NEWARK (NJ), NEW SITES: DETROIT, HOUSTON, LOS ANGELES, NEWARK (NJ), NEW ORLEANS, ST. LOUISORLEANS, ST. LOUIS
Unit of analysis=school clusters made up of a high school and all Unit of analysis=school clusters made up of a high school and all feeder middle schoolsfeeder middle schools
Random assignment of school clusters to two conditions: one Random assignment of school clusters to two conditions: one where the schools receive the new program and the other, not.where the schools receive the new program and the other, not.
Universe stratified by high and low stress (proportion of district Universe stratified by high and low stress (proportion of district students eligible for free lunch and proportion of minority students eligible for free lunch and proportion of minority students)students)
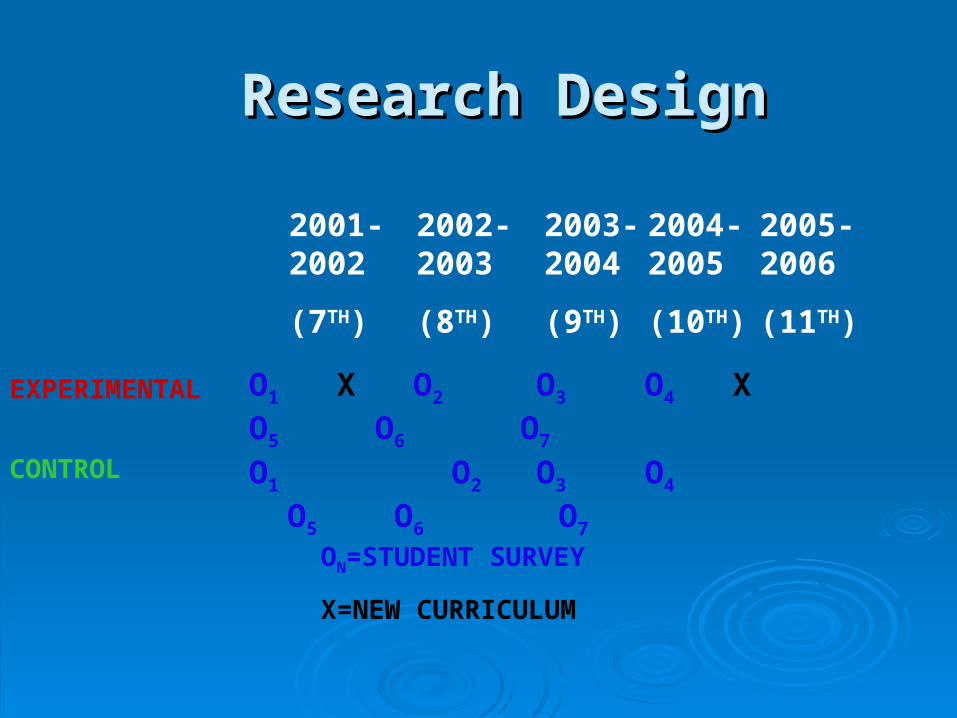
Research DesignResearch Design
2001-2002
(7TH)
2002-2003
(8TH)
2003-2004
(9TH)
2004-2005
(10TH)
2005-2006
(11TH)
EXPERIMENTAL
CONTROL
O1 X O2 O3 O4 X O5 O6 O7
O1 O2 O3 O4 O5 O6 O7
ON=STUDENT SURVEY
X=NEW CURRICULUM
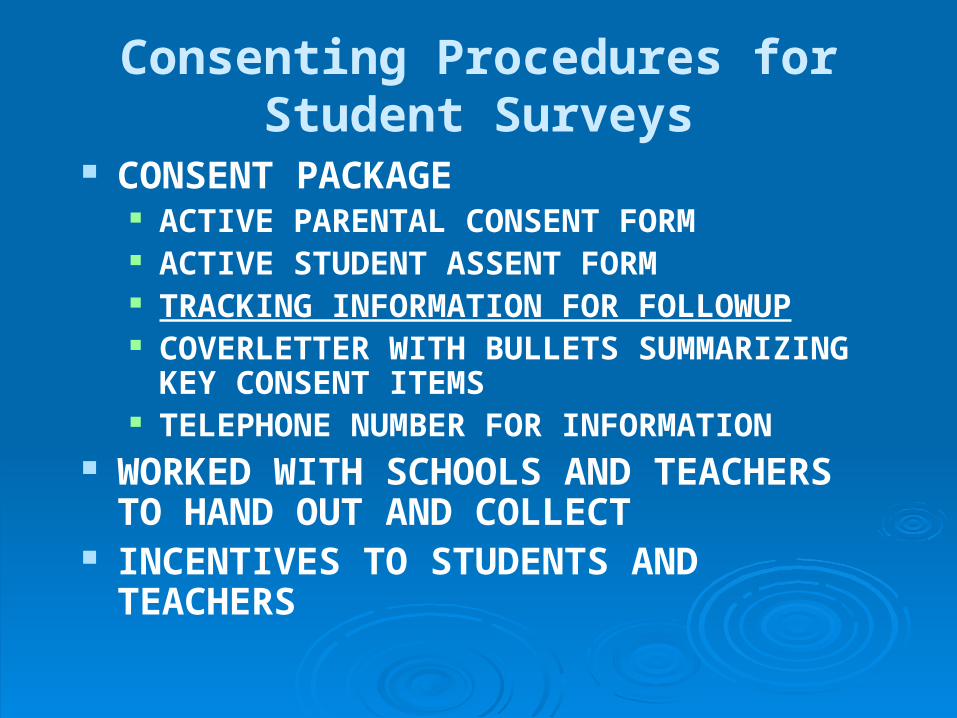
Consenting Procedures for Student Surveys
CONSENT PACKAGE ACTIVE PARENTAL CONSENT FORM ACTIVE STUDENT ASSENT FORM TRACKING INFORMATION FOR FOLLOWUP COVERLETTER WITH BULLETS
SUMMARIZING KEY CONSENT ITEMS TELEPHONE NUMBER FOR INFORMATION
WORKED WITH SCHOOLS AND TEACHERS TO HAND OUT AND COLLECT
INCENTIVES TO STUDENTS AND TEACHERS

Consent Procedure And Survey CompletionConsent Procedure And Survey Completion
TREATMENTTREATMENT CONTROLCONTROLHIGH STRESSHIGH STRESS LOW LOW
STRESSSTRESSHIGH STRESSHIGH STRESS LOW STRESSLOW STRESS
HIGH SCHOOLS (83)HIGH SCHOOLS (83) 2525 1616 2626 1616MIDDLE SCHOOLS MIDDLE SCHOOLS (122)(122)
4141 1818 4545 1818
TOTAL STUDENTS TOTAL STUDENTS (34,198)(34,198)
12,08412,084 5,8185,818 10,53110,531 5,6435,643
CONSENTS CONSENTS RETURNED RETURNED (24,311/71%)(24,311/71%)
8,939 8,939 (74%)(74%)
4,504 4,504 (77.4%)(77.4%)
7,035 7,035 (66.8%)(66.8%)
3,833 3,833 (68%)(68%)
APPROVALSAPPROVALS
% RETURNED/% % RETURNED/% TOTAL (19,272; TOTAL (19,272; 79.3%/56.4%)79.3%/56.4%)
7,4367,436
83.2%/ 83.2%/ 61.5%61.5%
3,6613,661
81.3%/ 81.3%/ 63%63%
5,2235,223
74.2%/ 74.2%/ 50%50%
2,9522,952
77%/ 77%/ 52.3%52.3%
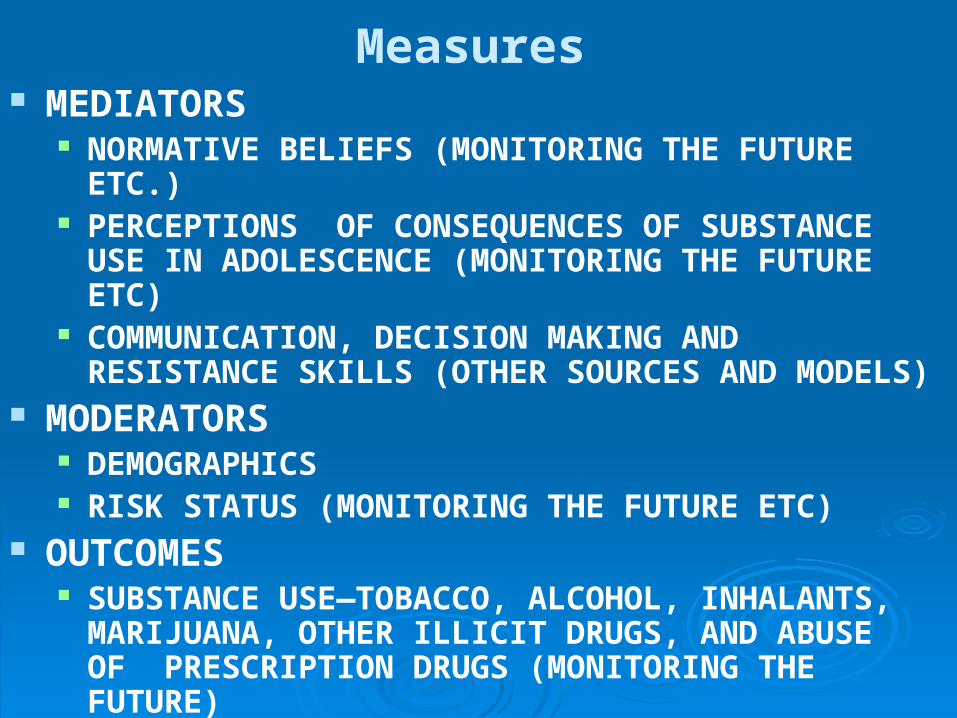
Measures MEDIATORS
NORMATIVE BELIEFS (MONITORING THE FUTURE ETC.)
PERCEPTIONS OF CONSEQUENCES OF SUBSTANCE USE IN ADOLESCENCE (MONITORING THE FUTURE ETC)
COMMUNICATION, DECISION MAKING AND RESISTANCE SKILLS (OTHER SOURCES AND MODELS)
MODERATORS DEMOGRAPHICS RISK STATUS (MONITORING THE FUTURE ETC)
OUTCOMES SUBSTANCE USE—TOBACCO, ALCOHOL, INHALANTS,
MARIJUANA, OTHER ILLICIT DRUGS, AND ABUSE OF PRESCRIPTION DRUGS (MONITORING THE FUTURE)

Survey Administration
Self-administered within a class 40 minutes to complete Supervised by University of Akron
staff (no DARE officer) Confidential (sealed envelope in box)
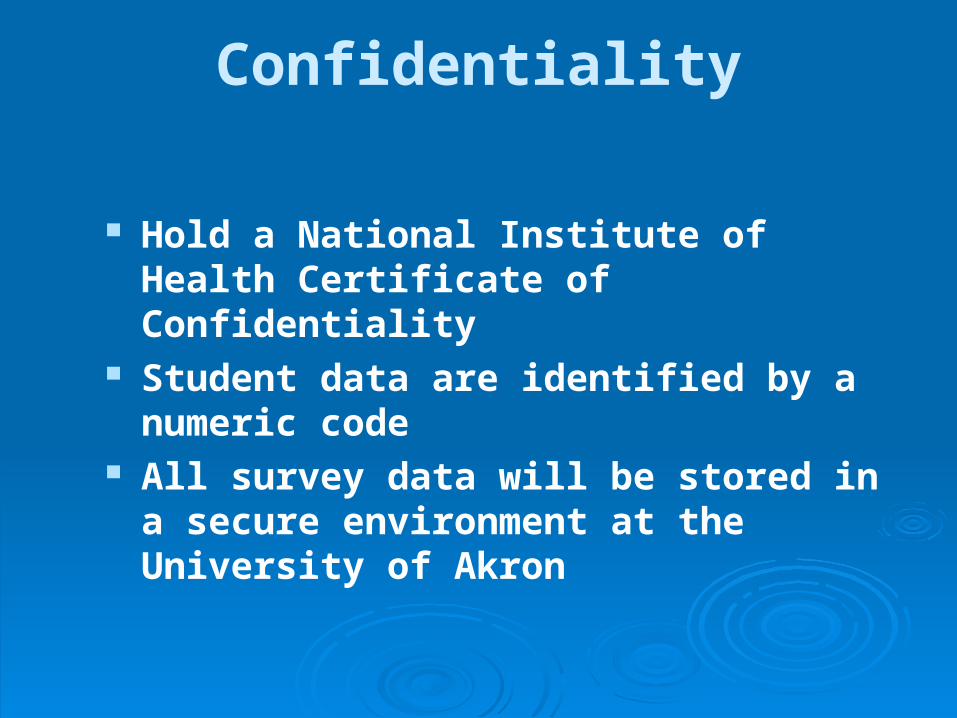
Confidentiality
Hold a National Institute of Health Certificate of Confidentiality
Student data are identified by a numeric code
All survey data will be stored in a secure environment at the University of Akron
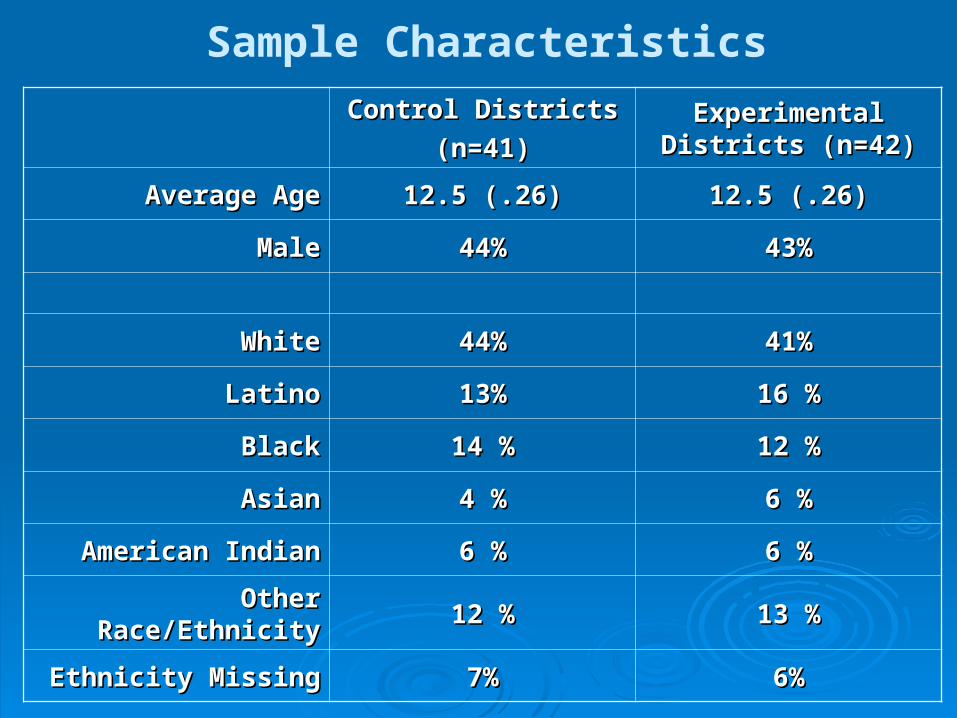
Sample Characteristics
Control Districts Control Districts
(n=41)(n=41)Experimental Districts Experimental Districts
(n=42)(n=42)
Average AgeAverage Age 12.5 (.26)12.5 (.26) 12.5 (.26)12.5 (.26)
MaleMale 44%44% 43%43%
WhiteWhite 44%44% 41%41%
LatinoLatino 13%13% 16 %16 %
BlackBlack 14 %14 % 12 %12 %
AsianAsian 4 %4 % 6 %6 %
American IndianAmerican Indian 6 %6 % 6 %6 %
Other Race/EthnicityOther Race/Ethnicity 12 %12 % 13 %13 %
Ethnicity MissingEthnicity Missing 7%7% 6%6%

30-day Prevalence Of Substance Use 30-day Prevalence Of Substance Use At Pretest (Baseline)At Pretest (Baseline)
SUBSTANCESUBSTANCE CONTROLCONTROL EXPERIMENTALEXPERIMENTAL MTF 8MTF 8THTH
GRADEGRADE
CIGARETTESCIGARETTES 7%7% 6%6% 11%11%
ALCOHOLALCOHOL 14%14% 11%11% 20%20%
GET DRUNKGET DRUNK 5%5% 6%6% 7%7%
MARIJUANAMARIJUANA 4%4% 4%4% 8%8%
INHALANTSINHALANTS 4%4% 4%4% 4%4%

MONITORING FINDINGSMONITORING FINDINGS
YEAR 1-4YEAR 1-4 MEDIATORSMEDIATORS
• Normative beliefs—all 3 years ASAPS better* scoresNormative beliefs—all 3 years ASAPS better* scores• Consequences—Ceiling effects, changed Consequences—Ceiling effects, changed
measurements for 8measurements for 8thth grade, ASAPS better scores at grade, ASAPS better scores at 99thth grade grade
• SkillsSkills Decision making—ASAPS better scores immediately after Decision making—ASAPS better scores immediately after
intervention and at 8intervention and at 8thth grade (changed our measure at 9 grade (changed our measure at 9thth grade survey)grade survey)
Communication—No differencesCommunication—No differences Resistance—ASAPS better scores immediately after Resistance—ASAPS better scores immediately after
interventionsinterventions
*Statistically significant at .05 level*Statistically significant at .05 level

RECRUITMENT:SUPERINTENDENTPRINCIPALS (HIGH
AND MIDDLE
LETTERS OF AGREEMENT TOPARTICIPATE IN
STUDY
RANDOMLY SELECTA REPLACEMENT
EXPERIMENTAL
CONTROL
OFFERED PREVENTION PROGRAM
REMAINED CONTROLS
HI FIDELITYLO FIDELITY
REAL WORLD CHANGES 1
HI ATTENDANCE LO ATTENDANCE HI ATTENDANCE LO ATTENDANCE

Other “Real World” IssuesOther “Real World” Issues
9/119/11 School RiotsSchool Riots Burned down schoolBurned down school Hurricane KatrinaHurricane Katrina No Child Left Behind Law; allowing No Child Left Behind Law; allowing
students to select high schools outside students to select high schools outside of their neighborhoodsof their neighborhoods
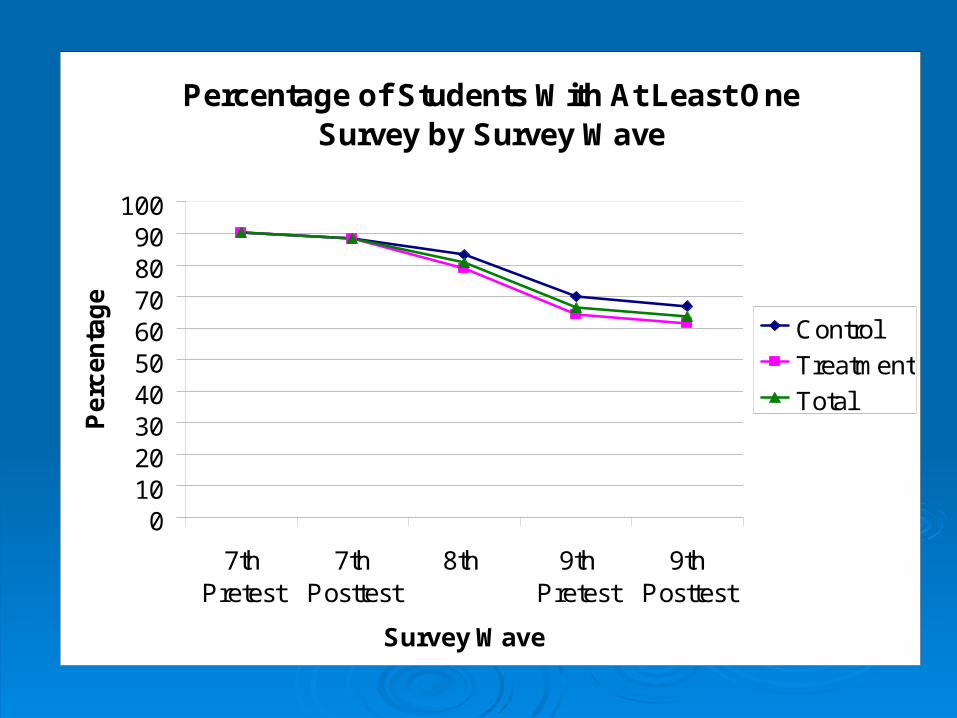
Percentage of Students With At Least One Survey by Survey Wave
0102030405060708090
100
7thPretest
7thPosttest
8th 9thPretest
9thPosttest
Survey Wave
Pe
rce
nta
ge
Control
Treatment
Total
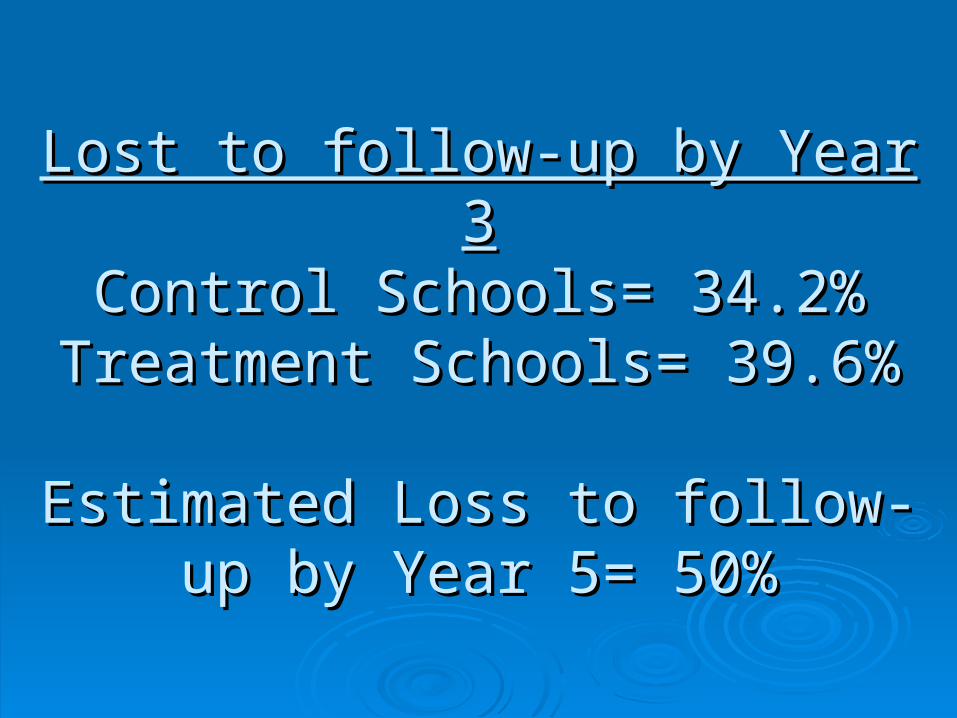
Lost to follow-up by Year 3Lost to follow-up by Year 3Control Schools= 34.2%Control Schools= 34.2%
Treatment Schools= 39.6%Treatment Schools= 39.6%
Estimated Loss to follow-up by Year Estimated Loss to follow-up by Year 5= 50%5= 50%

Examination of Attrition at 9Examination of Attrition at 9thth Grade Grade Post-SurveyPost-Survey
Number of students without 9Number of students without 9thth grade post-survey=6,927 grade post-survey=6,927 Comparison of attrition by condition showed no Comparison of attrition by condition showed no
significant difference (design-based chi square test)significant difference (design-based chi square test) Logistic regression models run to predict substance use Logistic regression models run to predict substance use
(use/no use) at baseline also showed no significant (use/no use) at baseline also showed no significant differences using a multiplicative interaction term differences using a multiplicative interaction term between attrition status and treatment status (although between attrition status and treatment status (although for both groups those who are attritors are more likely to for both groups those who are attritors are more likely to have used substances at baseline)have used substances at baseline)
Examination of gender and ethnicity using logistic Examination of gender and ethnicity using logistic regression models find that males in the treatment regression models find that males in the treatment condition are more likely to be attritors as were American condition are more likely to be attritors as were American Indians in the control conditionIndians in the control condition

Implementation FidelityImplementation Fidelity
Content CoverageContent CoverageOfficer BehaviorOfficer BehaviorTime on ActivityTime on Activity
Officer CharacteristicsOfficer CharacteristicsStudent AssessmentsStudent Assessments

Current StatusCurrent Status
Cleaning up 10Cleaning up 10thth grade survey data grade survey data Running analysesRunning analyses Administration of 11Administration of 11thth grade surveys grade surveys