the chemquest group, inc. · pdf fileadhesives and sealants industry ... the same holds true...
TRANSCRIPT

June 6, 2014
Equity Research
Chemicals
Please see page 28 for rating definitions, important disclosures and required analyst certifications All estimates/forecasts are as of 06/06/14 unless otherwise stated.
Wells Fargo Securities, LLC does and seeks to do business with companies covered in its research reports. As a result, investors should be aware that the firm may have a conflict of interest that could affect the objectivity of the report and investors should consider this report as only a single factor in making their investment decision.
Frank J. Mitsch, Senior Analyst (2 12) 214- 5022
fra n k . m i tsch@we l l s far g o.com Sabina Chatterjee, Associate Analyst
(2 12) 214- 8049 s a bi na.ch a tter j ee @ w el lsf a rgo.c o m
Maggie Cheung, Associate Analyst (2 12) 214- 801 1
ma ggi e. c h eu n g @ w el l s f a rgo . co m
CHEMS060214-150449
The ChemQuest Group, Inc. 8150 Corporate Park Drive, Suite 250 Cincinnati, OH 45242
Phone (513) 469-7555 FAX (513) 469-7779


WELLS FARGO SECURITIES, LLC Paints, Coatings & Adhesives EQUITY RESEARCH DEPARTMENT
3
TABLE OF CONTENTS
Key Points...................................................................................................................................................................................................... 5
Introduction .................................................................................................................................................................................................. 6
Macroeconomic Backdrop .............................................................................................................................................................................7
The Paints and Coatings Industry ...............................................................................................................................................................10
Market Overview.....................................................................................................................................................................................10
Leading Producers .................................................................................................................................................................................. 11
Industry Margin And Raw Materials .....................................................................................................................................................13
Architectural Coatings............................................................................................................................................................................15
Industrial OEM Coatings .......................................................................................................................................................................18
Special-Purpose Coatings.......................................................................................................................................................................21
Adhesives And Sealants Industry ............................................................................................................................................................... 24
Market Overview.................................................................................................................................................................................... 24
Industry Margin..................................................................................................................................................................................... 27

WELLS FARGO SECURITIES, LLC Chemicals EQUITY RESEARCH DEPARTMENT
4
This page intentionally left blank.

WELLS FARGO SECURITIES, LLC Paints, Coatings & Adhesives EQUITY RESEARCH DEPARTMENT
5
Key Points • We were pleased to host The ChemQuest Group (CQ) for our Twelfth Annual Paints,
Coatings, & Adhesives conference call. CEO Dan Murad provided more “color” on the $160 billion global coatings and adhesives industries, including an overview of market conditions, trends, and growth forecasts. One of the key highlights was the expectation of continued margin strength amid a stable global growth environment, supported by innovation across the supply chain, further opportunity in recovering end markets, and muted raw material costs. To the last point, CQ shares PPG’s and VAL’s sentiment that TiO2 pricing is unlikely to increase anytime soon. Industry consolidation continues, though at a moderated pace, but of higher value; the top ten U.S. coatings companies now account for more than 70% of the market, and within architectural, the top five players make up more than 90%. Overall, the tone was upbeat for such coatings producers as PPG, RPM, SHW, and VAL, and less favorable for such TiO2 players as DD, HUN, KRO, and TROX, in our view.
• Further Margin Expansion Potential. In 2013, total U.S. coatings volume grew 1.6%, while price increased 1.8%, for a total sales (value) gain of 3.4%. All segments reported sales growth (led by architectural, at 4.4%) and surpassed previous peaks, helped by modest gains in both volume and price. For 2014, CQ sees equal contribution of 2.3% from volume and price, for a total sales increase of 4.6%. This includes a 5.4% gain in architectural coatings (volume and price up in the high-2% area), a 4.3% increase in industrial OEM (2.6% price, 1.7% volume), and 3.3% growth in special purpose (mid-1% gain in each). CQ notes that major coatings and adhesives manufacturers have been “masterful” at maintaining and increasing their margins by raising prices following the recession and even amid raw material declines. In fact, the delta between the PPI and the PMI as of February 2014 is at “one of its wider points.” The healthy margin picture of 2013 is expected to “definitely” continue into 2014, and possibly even 2015. The same holds true for the adhesives market, curbed modestly by the shift to lighter feedstocks (adhesives use more of the heavier molecules).
• M&A Still An Engine Of Growth. Industry consolidation continues, though at a moderated pace, but of “higher value.” The top ten U.S. coatings companies now account for more than 70% of the market. North America is the most mature coatings market and has seen a high degree of consolidation over the past decade. As a result of the Akzo acquisition (North American architectural coatings), PPG is now the largest global coatings firm. SHW acquired Comex’s North American assets, but the fate of the Mexican operations remains at large, with PPG here too voicing interest. Markets in other regions remain fragmented, particularly in EMEA and China, presenting further opportunity for an improved global industry structure. Growth through acquisition of such adjacent businesses as adhesives and sealants is likely per CQ, and helps coatings producers further leverage the remodeling trend. While Henkel is the dominant adhesives supplier (nearly 3x the No. 2 player), we would not be surprised to see some other consolidation. In fact, PPG specifically mentioned adhesives and sealants as one of its areas of focus (see our May 5, 2014, report entitled, PPG: Growth With No Baggage).
• Major Coatings Trends. In Architectural, the channel mix currently stands at 40:60 DIY to contractor and continues to lean increasingly toward contractors amid higher consumer confidence and home values. The ratio is a complete flip from 1980, and up from recessionary days, when DIY moved up modestly. Zero VOC continues to be a popular trend, along with convenience and color “experiences.” In OEM, demand is growing for products that improve operational efficiencies (greater productivity/lower cycle times), increase sustainability (reduce CO2 footprint), and are innovative (provide insulation, high heat tolerance). Special purpose sales are seeing growth from higher infrastructure spending, oil/gas exploration, and increased productivity (energy-saving coatings, lower operating costs). Trends that leverage innovation and drive greater specialty orientation should also lend support to price increases.
• Sealants Outpacing Adhesives. Adhesives ($44 billion) and sealants ($6 billion) generated about $50 billion of sales in 2013, with Asia and Europe accounting for one-third each. Packaging is the largest end market, followed by building/construction. In 2013, demand from packaging was relatively unchanged from 2012, while construction demand increased, reflecting a recovery in new builds. The cost structure for adhesives companies in 2013 held steady from past years, with raw materials accounting for 53-63% of cost of goods sold (COGS). For 2014, CQ forecasts sales growth of roughly 5.5%, reflecting a roughly 3% increase in price and 2.5% gain in volume. Demand for sealants is expected to outpace that of adhesives as the former is used more in construction and transportation markets, which are slated to show healthy growth.

WELLS FARGO SECURITIES, LLC Chemicals EQUITY RESEARCH DEPARTMENT
6
Introduction
This report is a more detailed follow-up to our May 28, “quick note” on key takeaways from the ChemQuest conference call, as well as from the SHW analyst day on May 23 and PPG’s deep-dive on architectural coatings on May 15. We include further details on architectural, original equipment manufacturers (OEM), and special-purpose coatings businesses, as well as the adhesives and sealants industry.
We were pleased to host The ChemQuest Group for our Twelfth Annual Paints, Coatings, & Adhesives conference call. CEO Dan Murad provided insight into the $109 billion global coatings industry, including an overview of market conditions, trends, and growth forecasts. Overall, the tone was upbeat and the outlook is favorable for such coatings names as PPG, RPM, SHW, and VAL, and less so for such TiO2 players as DD, HUN, KRO and TROX, in our view. Coatings producers are expected to post continued margin expansion amid a stable global growth environment, benign raw material inflation, lower structural costs, continued consolidation, and still-recovering end markets. After posting volume and pricing growth of 1.6-1.8% in 2013, CQ forecasts 2.3% gains for each driver in 2014, for a total sales growth estimate of 4.6%.
Exhibit 1. Coatings Volume And Price Trend, 2010-14F
(4%)
(2%)
0%
2%
4%
6%
8%
2010 2011 2012 2013 2014F
Yr/Y
r % C
hang
e
Volume Price
Source: The ChemQuest Group estimates and Wells Fargo Securities, LLC
Looking across the three major types of coatings, sales growth was greatest for the architectural segment in 2013, at 4.4%, helped by a pricing gain of 2.5% and volume growth of nearly 2%. The industrial OEM and special-purpose segments posted sales growth of 2.6% and 2.2%, with volume up roughly 1% and price up about 1.5%, respectively. For 2014, growth is expected to be led by the architectural segment, at 5.4%, although both volume and prices should improve nicely in the OEM and special-purpose segments.
Exhibit 2. Sales Growth Across Coatings Types
2013A 2014F
0.0%
0.5%
1.0%
1.5%
2.0%
2.5%
3.0%
Architectural OEM Spec Purp
2013
% C
hang
e
Volume Price
0.0%
0.5%
1.0%
1.5%
2.0%
2.5%
3.0%
Architectural OEM Spec Purp
2014
% C
hang
e
Volume Price
F=Forecast Source for both charts: The ChemQuest Group estimates and Wells Fargo Securities, LLC
WELLS FARGO SECURITIES, LLC Paints, Coatings & Adhesives EQUITY RESEARCH DEPARTMENT
7
Macroeconomic Backdrop
The global macroeconomic environment has been one of slow growth in recent years and is characterized as “stable” by most accounts. North America has shown steady but moderate growth, while Europe appears to be showing inklings of a recovery off trough-like conditions. Growth in Asia has moderated, but rates of 6-7% are still healthy. In North America, 2013 GDP grew 1.9% and is forecast to increase 2.3% for 2014 (according to Wells Fargo Securities economists). Industrial production is improving, with most sectors showing growth, particularly automotive and certain household-related sectors.
Major End Markets
Construction
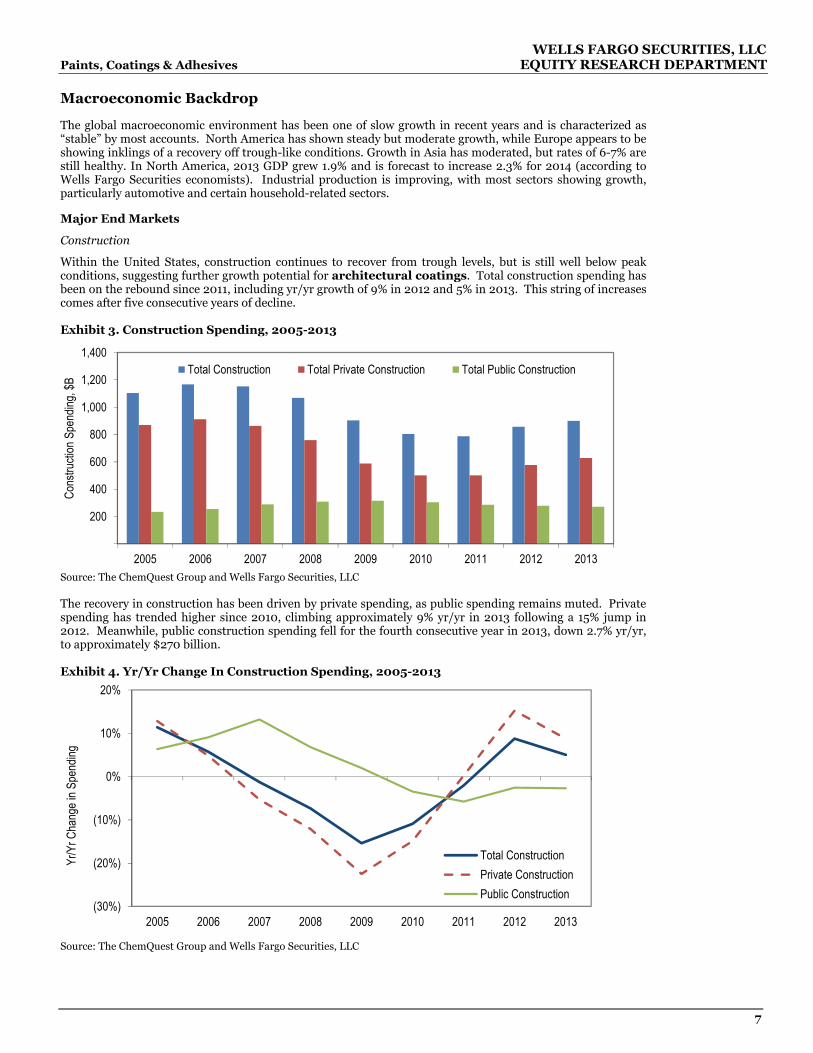
Within the United States, construction continues to recover from trough levels, but is still well below peak conditions, suggesting further growth potential for architectural coatings. Total construction spending has been on the rebound since 2011, including yr/yr growth of 9% in 2012 and 5% in 2013. This string of increases comes after five consecutive years of decline. Exhibit 3. Construction Spending, 2005-2013
200
400
600
800
1,000
1,200
1,400
2005 2006 2007 2008 2009 2010 2011 2012 2013
Cons
tructi
on S
pend
ing, $
B
Total Construction Total Private Construction Total Public Construction
Source: The ChemQuest Group and Wells Fargo Securities, LLC The recovery in construction has been driven by private spending, as public spending remains muted. Private spending has trended higher since 2010, climbing approximately 9% yr/yr in 2013 following a 15% jump in 2012. Meanwhile, public construction spending fell for the fourth consecutive year in 2013, down 2.7% yr/yr, to approximately $270 billion. Exhibit 4. Yr/Yr Change In Construction Spending, 2005-2013
(30%)
(20%)
(10%)
0%
10%
20%
2005 2006 2007 2008 2009 2010 2011 2012 2013
Yr/Y
r Cha
nge i
n Spe
nding
Total ConstructionPrivate ConstructionPublic Construction
Source: The ChemQuest Group and Wells Fargo Securities, LLC

WELLS FARGO SECURITIES, LLC Chemicals EQUITY RESEARCH DEPARTMENT
8
Although construction spending is mixed, other construction indicators are more positive. Well Fargo economists forecast 2014 housing starts to reach 1.03 million units, up 12% from 920,000 units in 2013, and potentially increasing to 1.19 million units in 2015. So far in 2014, adverse weather conditions delayed the start of the construction season, but a return of warmer weather has kick-started activity. The seasonally adjusted annual rate (SAAR) of housing starts for April rang in at 1.1 million, up 26% yr/yr and up 13% sequentially. Exhibit 5. Housing Starts And Completions, 1991 to Present
0
500
1,000
1,500
2,000
2,500
'94 '96 '98 '00 '02 '04 '06 '08 '10 '12 '14
Hous
ing S
tarts
& Un
its C
omple
ted
(000
) SAA
R
Starts Completions
Source: U.S. Census Bureau and Wells Fargo Securities, LLC
Compared to housing starts, existing home sales (EHS) are a more relevant indicator and driver of coatings demand; 75-80% of coatings are tied to existing home sales and remodeling, with the balance being new homes. EHS were relatively unchanged in 2013, while new home sales increased nearly 8%. Exhibit 6. Existing Home Sales And New Home Sales, 2003-Present
200
400
600
800
1,000
1,200
1,400
3.0
4.0
5.0
6.0
7.0
8.0
9.0
Jan-03 Jan-05 Jan-07 Jan-09 Jan-11 Jan-13
New
Home
Sale
s (SA
AR),
000
Exist
ing H
ome S
ales (
SAAR
), MM
s Existing Home Sales New Home Sales
Source: U.S. Census Bureau and Wells Fargo Securities, LLC
Remodeling activity continues to advance, but the pace never really moderated during the recession, as consumers continued to remodel on their own (DIY) rather than employ higher-cost professionals. Exhibit 7. Homeowner Improvements, Q1 2007-Q4 2014E
(20%)
(15%)
(10%)
(5%)
0%
5%
10%
15%
20%
100
110
120
130
140
150
160
170
Q1 07 Q1 08 Q1'09 Q1'10 Q1'11 Q1'12 Q1'13 Q1'14
4 Qtr
Movin
g Rate
of C
hang
e
$ Billi
ons
Homeowner Improvements
4 Qtr Moving Rate of Change
Source: U.S. Census Bureau and The ChemQuest Group estimates

WELLS FARGO SECURITIES, LLC Paints, Coatings & Adhesives EQUITY RESEARCH DEPARTMENT
9
Transportation
Infrastructure spending and auto-related trends are important drivers for both the OEM and special-purpose coatings segments. For the latter, automotive refinish accounts for more than one-third of sales. Auto and light-truck sales have recovered nicely from a trough of 9.5 million units in early 2009, having reached a seasonally adjusted rate of roughly 16 million units as of April 2014. Exhibit 8. Light-Vehicle Sales Versus Auto Production, 2005 to Present
0
50
100
150
200
250
300
350
400
450
5
10
15
20
25
Jan-05 Jan-07 Jan-09 Jan-11 Jan-13
Dome
stic A
uto P
rodu
ction
, 000
SA
AR
New,
Ligh
t Veh
icle
Sales
, MM
SAAR
Light Vehicle SalesAuto Production
August '09
Source: Bureau of Economic Analysis and Wells Fargo Securities, LLC Industrial
Industrial production in the United States continues to improve. In Q1, industrial production rose an average of 4% yr/yr, while capacity utilization was relatively unchanged in the high-70% area. Continued recovery in this area bodes well for industrial OEM coatings, which benefits from strength in U.S. manufacturing. Exhibit 9. Industrial Production And Capacity Utilization, 2000 to Present
60
65
70
75
80
85
90
75
80
85
90
95
100
105
2000 2002 2004 2006 2008 2010 2012 2014
Cap
acity
Utiliz
atio
n (
%)
Indust
rial
Pro
duct
ion (
%)
Industrial Production Capacity Utilization
Source: U.S. Census Bureau and Wells Fargo Securities, LLC

WELLS FARGO SECURITIES, LLC Chemicals EQUITY RESEARCH DEPARTMENT
10
The Paints And Coatings Industry Market Overview The paints and coatings industry can be categorized into three markets: architectural (aka: decorative), OEM, and special purpose. In the United States, architectural accounts for nearly 60% of industry sales, and earnings are highly correlated with the health of the housing/construction market. Industrial OEM benefits from a pickup in industrial production, while special purpose has greater correlation with auto (refinish and traffic marking paints) and industrial maintenance. Exhibit 10. United States Paints And Coatings Market Breakdown By Volume, 2013
Architectural58%
OEM29%
Special Purpose
13%
SherwinPPGBher (Masco)Benjamin MooreValsparAkzoNobel (ex-North Am)
PPGBASFValsparSherwinAkzoNobel
PPGAxaltaRPMSherwinAkzoNobelBASF
Source: The ChemQuest Group and Wells Fargo Securities, LLC The global breakdown of the paints and coatings market differs from that of the United States as architectural accounts for a smaller piece of the pie in other regions, while OEM is considerably larger. Specifically, architectural accounts for slightly less than 40% of sales on a global basis, significantly less than the 60% it represents in the United States. OEM accounts for a larger portion of demand worldwide, slightly more than 40%, compared to less than 30% in the United States. Finally, special-purpose sales accounted for roughly 20% of global paint sales, but only 13% in the United States. Exhibit 11. Global Paints And Coatings Market Breakdown, 2013
OEM42%
Architectural37%
Special Purpose
21%
Source: SHW and Wells Fargo Securities, LLC

WELLS FARGO SECURITIES, LLC Paints, Coatings & Adhesives EQUITY RESEARCH DEPARTMENT
11
By region, Asia is the leading coatings consumer, accounting for more than 35% of global demand, followed by Europe at 28%, and North America, at 22%. Exhibit 12. Global Coatings Regional Breakdown
Asia37%
W. Europe22%
E. Europe6%
U.S.20%
Canada2%
Middle East5%
S. America5%
Mexico2%
Africa1%
Europe
North America
Source: The ChemQuest Group and Wells Fargo Securities, LLC Leading Producers Exhibit 13 lists the top ten global coatings companies by revenue for 2013, with some historical perspective. Currently, the top three players far outpace sales of the remaining top players, reflecting active consolidation in recent years. A decade ago, players were at greater parity, separated by relatively modest revenue gaps. In 2013, PPG took the lead with $12.8 billion in sales, followed closely by AkzoNobel, at $12.3 billion. Sherwin Williams rounds out the top three, at $10.2 billion. The top ten players account for roughly 50% of global sales, and the top three players account for more than 30%. Exhibit 13. Top Ten Global Coatings Companies by Revenue $ Billions 2003 2008 2013PPG 4.8 10.1 12.8Akzo Nobel 6.3 14.2 12.3Sherwin Williams 5.4 8.0 10.2Axalta/(DuPont) 3.7 4.1 4.2Valspar 2.3 3.3 4.1BASF 2.4 3.3 3.7Kansai Paint * 1.9 3.1Jotun * 1.6 2.0Masco (Behr) * * 1.9Nippon Paint 1.9 2.0 1.5
*Outside top ten Note: 2013 pro forma for the AkzoNobel’s North American coatings sale to PPG Source: The ChemQuest Group Consolidation has been popular in the coatings industry, helping change the landscape and market share of participants over the past decade. In recent years, we have seen SHW acquire Comex’s North American assets, DD divest Performance Coatings to Carlyle, AkzoNobel divest its North American architectural paints business to PPG, and VAL acquire Ace Hardware’s paints business.

WELLS FARGO SECURITIES, LLC Chemicals EQUITY RESEARCH DEPARTMENT
12
Exhibit 14. Global Coatings Industry, 2002 Versus 2012
2002 2012
PPG
AkzoNobel
Sherwin Williams
DuPont (sold to Carlyle)
5%
BASF
Valspar
Kansai
Masco (Behr)
Nippon Paint
RPM
Other
Note: 2012 pro forma for the AkzoNobel’s North American coatings sale to PPG Source for both charts: PPG, ChemQuest, and Wells Fargo Securities, LLC By end market, PPG is the only global player that participates in all major categories. Pro forma for the sale of AkzoNobel’s North American architectural coatings business to PPG, Akzo now ranks as the No. 2 global coatings player, participating in all markets except auto OEM. On the architectural front, PPG, Akzo, and SHW are tied for the top spot, depending on sales during the quarter. Although SHW is No. 1 on the architectural front, it is No. 4+ in most other markets and does not participate in auto OEM or packaging.
Exhibit 15. Global Competitive Positions Of Coatings Companies
*Pro forma for PPG’s acquisition of AkzoNobel’s North American architectural coatings business and SHW’s acquisition of Comex North America Source: PPG SHW is the No. 1 architectural paint supplier in the United States, with the highest paint brand awareness. PPG ranks No.2, with Olympic being its most recognizable brand, but the Akzo deal also brought the popular Glidden brand. In 1999, Masco acquired Behr, which is sold exclusively at Home Depot. Behr produces interior products (paints, primers, and faux and decorative finishes), as well as exterior products. Berkshire Hathaway owns Benjamin Moore, which has a large independent retail network. VAL is a leading global paint and coatings supplier, and its largest customer is Lowe’s. Comparing the margins of major coatings producers, PPG has remained the leader among its competitors, sporting a 16.5% margin in strictly coatings. VAL is a close second with 15% margin, while remaining competitors SHW, Akzo, and RPM all range between 12% and 14%.

WELLS FARGO SECURITIES, LLC Paints, Coatings & Adhesives EQUITY RESEARCH DEPARTMENT
13
Exhibit 16. Coatings Peers’ EBITDA Margin, 2013
15.5% 16.5%15.0%
13.6% 12.8% 12.6% 12.4%
0%
4%
8%
12%
16%
20%
Total PPG PPG Coatings Total VAL Total SHW Total Akzo Akzo Paints/Coatings Total RPM
2013
EBI
TDA
Marg
in
Source: PPG and Wells Fargo Securities, LLC Industry Margin And Raw Materials The cost structure for a U.S. coatings company has been relatively unchanged over the past few years. On average, raw materials account for 45-53% of sales in 2013 and 2012, down from earlier years of TiO2 inflation. Other major raw materials include acrylics, phenol, and other pigments. In 2013, EBIT margin ranged from 8-15%, unchanged from 2012, but modestly higher from the 6-15% range in 2011. Exhibit 17. Comparison Of Average United States Companies Cost Structure
2013 2012 2011 2009 2005Income 100% 100% 100% 100% 100%
Cost of Goods SoldRaw Materials 45-53% 45-53% 47-53% 45-49% 50-55%Labor 5% 5% 5% 5% 6%Energy 2% 2% 2% 2% 2%Overhead, Taxes, Ins., Dep., Pkg. 6% 6% 6% 6% 7%Total 58-66% 58-66% 60-66% 58-62% 65-70%
Gross Margin 32-42% 34-42% 34-40% 38-42% 30-35%
SG&A 19-34% 19-34% 19-34% 19-34% 20-30%
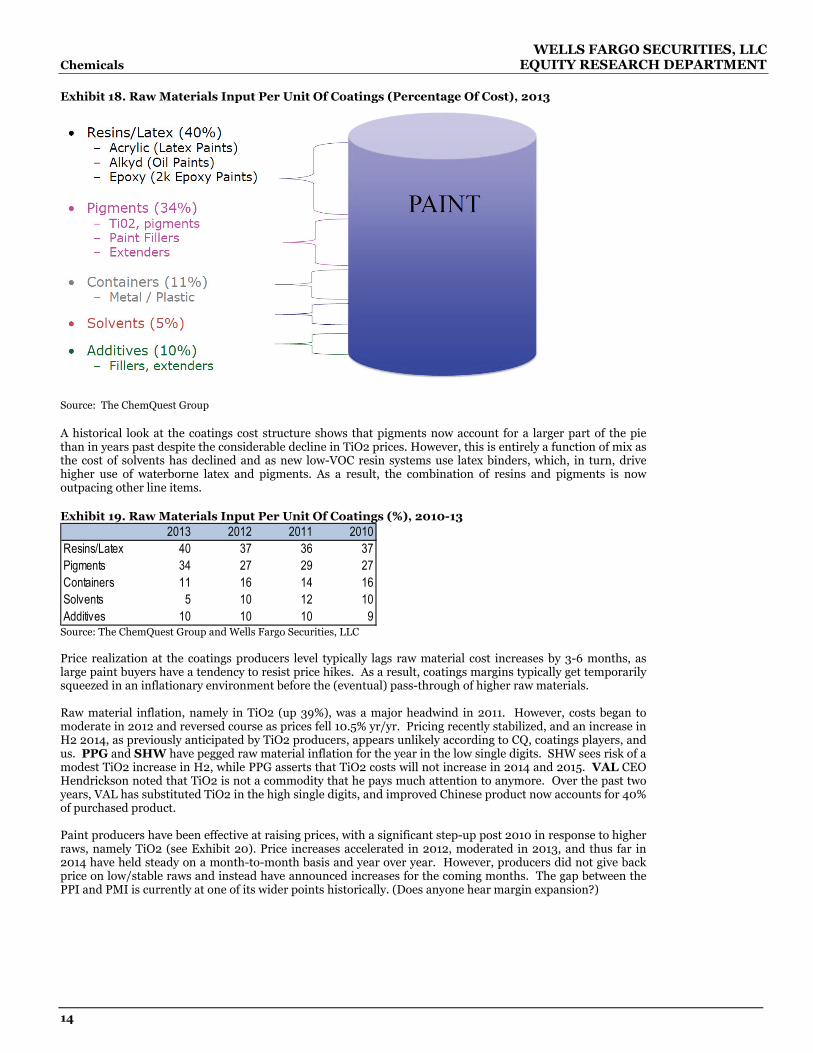
EBIT 8-15% 8-15% 6-15% 11-17% 7-12% Source: The ChemQuest Group estimates Exhibit 18 shows the breakdown of the various raw materials found in a can of paint. In 2013, resins/latex represented 40% of the total cost, followed by pigments, at 34%; containers, at 11%; additives, at 10%; and solvents, at 5%.
WELLS FARGO SECURITIES, LLC Chemicals EQUITY RESEARCH DEPARTMENT
14
Exhibit 18. Raw Materials Input Per Unit Of Coatings (Percentage Of Cost), 2013
Source: The ChemQuest Group A historical look at the coatings cost structure shows that pigments now account for a larger part of the pie than in years past despite the considerable decline in TiO2 prices. However, this is entirely a function of mix as the cost of solvents has declined and as new low-VOC resin systems use latex binders, which, in turn, drive higher use of waterborne latex and pigments. As a result, the combination of resins and pigments is now outpacing other line items. Exhibit 19. Raw Materials Input Per Unit Of Coatings (%), 2010-13
2013 2012 2011 2010Resins/Latex 40 37 36 37Pigments 34 27 29 27Containers 11 16 14 16Solvents 5 10 12 10Additives 10 10 10 9
Source: The ChemQuest Group and Wells Fargo Securities, LLC Price realization at the coatings producers level typically lags raw material cost increases by 3-6 months, as large paint buyers have a tendency to resist price hikes. As a result, coatings margins typically get temporarily squeezed in an inflationary environment before the (eventual) pass-through of higher raw materials. Raw material inflation, namely in TiO2 (up 39%), was a major headwind in 2011. However, costs began to moderate in 2012 and reversed course as prices fell 10.5% yr/yr. Pricing recently stabilized, and an increase in H2 2014, as previously anticipated by TiO2 producers, appears unlikely according to CQ, coatings players, and us. PPG and SHW have pegged raw material inflation for the year in the low single digits. SHW sees risk of a modest TiO2 increase in H2, while PPG asserts that TiO2 costs will not increase in 2014 and 2015. VAL CEO Hendrickson noted that TiO2 is not a commodity that he pays much attention to anymore. Over the past two years, VAL has substituted TiO2 in the high single digits, and improved Chinese product now accounts for 40% of purchased product. Paint producers have been effective at raising prices, with a significant step-up post 2010 in response to higher raws, namely TiO2 (see Exhibit 20). Price increases accelerated in 2012, moderated in 2013, and thus far in 2014 have held steady on a month-to-month basis and year over year. However, producers did not give back price on low/stable raws and instead have announced increases for the coming months. The gap between the PPI and PMI is currently at one of its wider points historically. (Does anyone hear margin expansion?)

WELLS FARGO SECURITIES, LLC Paints, Coatings & Adhesives EQUITY RESEARCH DEPARTMENT
15
Exhibit 20. PPI And PMI, Paints And Coatings Manufacturing
120
160
200
240
280
2005 2006 2007 2008 2009 2010 2011
PPI a
nd P
MI, I
ndex
ed to
1982
PPI PMI
Source: Bureau of Labor Statistics and Wells Fargo Securities, LLC Manufacturing costs and raw material inputs vary for architectural coatings and industrial coatings. Architectural paints use more TiO2, as decorative paints require more opacity. Industrial coatings use a larger amount of other such raws as resins, latex, solvents, and pigments. Another major difference is that architectural coatings employ a two-step (versus one-) distribution process. In terms of packaging, architectural is typically sold in one-gallon paint cans and five-gallon buckets, while industrial coatings are mainly sold in 2,000-liter totes. Exhibit 21. Coatings Cost Comparison
Source: PPG Architectural Coatings In 2013, U.S. architectural coatings generated $10.3 billion in sales (up 4.4% yr/yr), representing 685 million gallons by volume (up 1.9%) and 2.5% higher prices. For 2014, CQ forecasts sales growth of 5.4%, including increases in the high 2% area for both volume and price. The end-market breakdown in 2013 was similar to in years past, with interior paints accounting for the bulk of demand at nearly 60% of sales. The exterior paints end market is a distant second, at about 30%. The remaining 10% is includes stains, clears, lacquers, varnishes, and others. Major producers include SHW, PPG, Behr (Masco), Benjamin Moore, VAL, and AkzoNobel (ex-North America).

WELLS FARGO SECURITIES, LLC Chemicals EQUITY RESEARCH DEPARTMENT
16
Exhibit 22. Architectural Coatings End Markets
Interior Paints57%
Exterior Paints31%
Stains7%
Clears2%
Lacquers/ Varnishes
1%Others
2%
Source: The ChemQuest Group and Wells Fargo Securities, LLC During the peak of the housing and construction cycles, between 750 and 800 million gallons of paint were sold annually. This plunged to less than 600 million gallons during the prime of the recession. Volume has recovered since then and in 2013, reached roughly 700 million gallons, up roughly 20% from recessionary levels. Exhibit 23. Millions Of Gallons Of Architectural Coatings Sold, 2000-2013
500
550
600
650
700
750
800
850
2000 2002 2004 2006 2008 2010 2012
Mill
ions
of G
allo
ns
Source: SHW and Wells Fargo Securities, LLC Regionally, EMEA and Asia each account for one-third of global architectural coatings sales. North America is the third largest, at about one-fourth, while Latin America is a small wedge, at 11%. Exhibit 24. Architectural Coatings Sales By Region
Asia Pacific33%
Europe33%
North America23%
Central/ South America
11%
Source: PPG and Wells Fargo Securities, LLC

WELLS FARGO SECURITIES, LLC Paints, Coatings & Adhesives EQUITY RESEARCH DEPARTMENT
17
Regardless of region, architectural coatings sales are largely driven by the residential market. However, in the United States, the residential market currently accounts for a larger portion of sales as the nonresidential market has yet to show meaningful recovery. Exhibit 25. U.S. Architectural Market Customer Breakdown, 2013 United States Global
DIY42%
Residential Repaint (Pro)
25%
New Residential
11%
Non-Residential
Repaint16%
New Non-Residential
6%
Residential
Non-Residential
Remodel/ Repaint
49%
New Construction
16%
Remodel/ Repaint
21%
New Construction
14%
Residential
Non-Residential
Source for both graphs: SHW, PPG, and Wells Fargo Securities, LLC Over the past several years (and punctuated during the recession), there has been a moderate shift toward DIY as economically conscious customers forego higher cost professional contractors. The majority of DIY purchases occur through such home centers as Home Depot and Lowe’s. Paint stores are a distant second, at 17%, and hardware stores account for 9% of sales. In contrast, contractors make a majority of their purchases at paint stores. Exhibit 26. U.S. Channel Share Do-It-Yourself Contractor
Home Centers59%Paint Stores
17%
Mass Merchants13%
Hardware9%
Lumber/Building Supply
2%
Paint Stores90%
Home Centers6%
Discount/Other2%
Hardware2%
Source for both charts: SHW and Wells Fargo Securities, LLC Globally, the architectural coatings customer mix is evenly distributed, for the most part. Independent distributors and company-owned stores each account for about one-third of sales, and regional home centers like Lowe’s, Home Depot, or Bunnings, account for slightly less (30%). As customer purchasing behavior varies by region, so too does channel mix. Asians have a strong preference for independent dealers, while Europeans tend to favor professional networks.
WELLS FARGO SECURITIES, LLC Chemicals EQUITY RESEARCH DEPARTMENT
18
Exhibit 27. Global Architectural Coatings, Customer Mix
Independent Distributors
35%
Company-Owned Stores
35%
Regional Home Centers/Sheds
30%
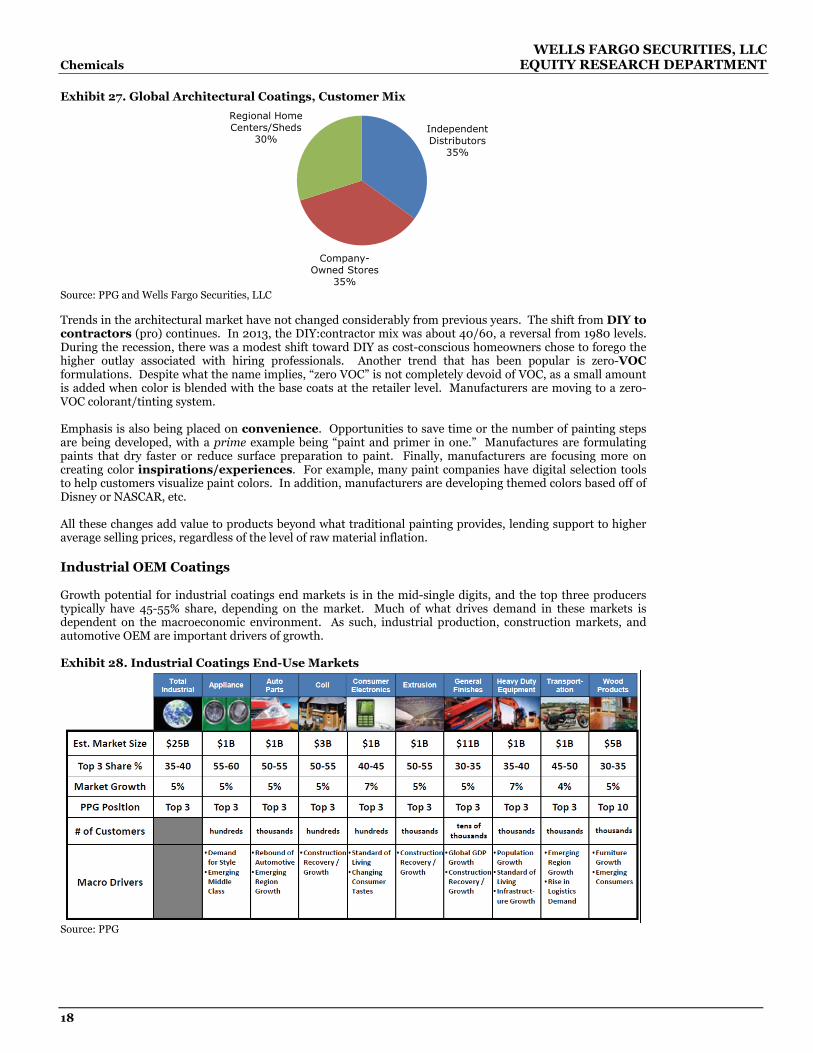
Source: PPG and Wells Fargo Securities, LLC Trends in the architectural market have not changed considerably from previous years. The shift from DIY to contractors (pro) continues. In 2013, the DIY:contractor mix was about 40/60, a reversal from 1980 levels. During the recession, there was a modest shift toward DIY as cost-conscious homeowners chose to forego the higher outlay associated with hiring professionals. Another trend that has been popular is zero-VOC formulations. Despite what the name implies, “zero VOC” is not completely devoid of VOC, as a small amount is added when color is blended with the base coats at the retailer level. Manufacturers are moving to a zero-VOC colorant/tinting system. Emphasis is also being placed on convenience. Opportunities to save time or the number of painting steps are being developed, with a prime example being “paint and primer in one.” Manufactures are formulating paints that dry faster or reduce surface preparation to paint. Finally, manufacturers are focusing more on creating color inspirations/experiences. For example, many paint companies have digital selection tools to help customers visualize paint colors. In addition, manufacturers are developing themed colors based off of Disney or NASCAR, etc. All these changes add value to products beyond what traditional painting provides, lending support to higher average selling prices, regardless of the level of raw material inflation. Industrial OEM Coatings Growth potential for industrial coatings end markets is in the mid-single digits, and the top three producers typically have 45-55% share, depending on the market. Much of what drives demand in these markets is dependent on the macroeconomic environment. As such, industrial production, construction markets, and automotive OEM are important drivers of growth. Exhibit 28. Industrial Coatings End-Use Markets
Source: PPG
WELLS FARGO SECURITIES, LLC Paints, Coatings & Adhesives EQUITY RESEARCH DEPARTMENT
19
In 2013, industrial coatings generated $6.4 billion in sales (or 352 million gallons by volume). After posting sales growth of 2.6% in 2013, industrial OEM coatings could increase 4.3% in 2014, with pricing and volume up, 2.6% and 1.7%, respectively. As of 2013, volume (finally) returned to 2008 levels, and sales have climbed more than 9% since then. Exhibit 29 shows the numerous markets served by OEM coatings. Powder coatings is the largest category, at almost 25% of sales, followed by transportation (auto, truck, etc.), at slightly less than 20%. Sales in auto/light truck grew more than 10% yr/yr, and the healthy trend is forecast to continue through 2014. Industrial coatings can serve functional (hardness, corrosion resistance) and decorative purposes in such appliances as refrigerators, HVAC, fireplaces, microwaves, and vacuum cleaners, and in such automotive parts as bumpers, axles, brake systems, and rigid and flexible exterior trim systems. They can also be used in electronic devices including mobile phones, laptops, and tablets. Exhibit 29. Industrial OEM Coatings End Markets
Powder Coatings23%
Auto/ Light Truck/ SUV14%
Heavy Truck/ Bus/ RV2%
Other Trans2%Container & Closure
Finishes13%
Wood Furniture, Cabinet11%
Coil coatings11%
Non-Wood Furn & Fixture7%
Machinery & Equip3%
Paper, Film & Coil3%
Wood, Comp, Flat Stock2%
Appliance/HVAC1%
Elec Insulation1%
Other Industrial7%
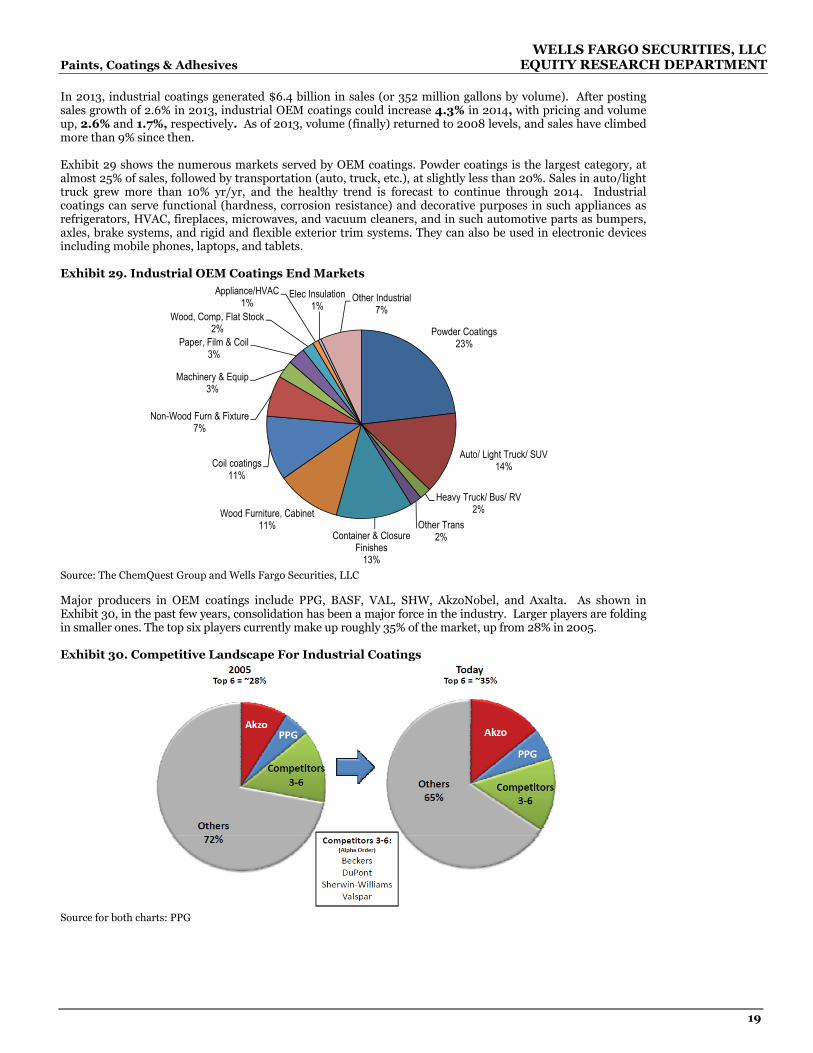
Source: The ChemQuest Group and Wells Fargo Securities, LLC Major producers in OEM coatings include PPG, BASF, VAL, SHW, AkzoNobel, and Axalta. As shown in Exhibit 30, in the past few years, consolidation has been a major force in the industry. Larger players are folding in smaller ones. The top six players currently make up roughly 35% of the market, up from 28% in 2005. Exhibit 30. Competitive Landscape For Industrial Coatings
Source for both charts: PPG

WELLS FARGO SECURITIES, LLC Chemicals EQUITY RESEARCH DEPARTMENT
20
More than 45% of industrial coatings sales are in Asia, followed by nearly 30% in Europe. This compares to only 30% from Asia. North America accounts for only 17% of industrial coatings sales (down from 19% a year ago). Exhibit 31. Industrial Coatings Demand By Region, 2013
Asia46%
Europe28%
North America17%
Latin America6%
Middle East/Africa
3%
Source: SHW and Wells Fargo Securities, LLC There are four main technology offerings in industrial coatings (liquid, powder, pretreatment, and electrocoat), and PPG is the only producer that offers all options. Liquid, which consists of traditional primers and topcoats, is by far the largest, accounting for more than 75% of technology applications. Powder, for which a solid coating is applied by electrostatic spray, follows at about 15%. Pretreatment and electrocoat are about 5% each; the former includes cleaners and phosphate chemicals to condition metal before paint is applied, while the latter applies coatings by electrically charged immersion. Exhibit 32. Industrial Coatings Demand By Technology
Source: PPG All major coatings producers offer liquid solutions, many offer powder, a handful offer E-coat, and only PPG offers pretreatment. Pretreatment is a primary technical solution in appliances, auto parts, general finishes, and heavy duty equipment.

WELLS FARGO SECURITIES, LLC Paints, Coatings & Adhesives EQUITY RESEARCH DEPARTMENT
21
Exhibit 33. Competitive Technology Profile
Source: PPG Some notable trends in industrial coatings include the desire for products that improve operational efficiencies (increase productivity/reduce labor/lower cycle times), increase sustainability (reduce CO2 footprint), and innovation (coatings that provide insulation, withstand high heat, and provide vapor transmission). Special-Purpose Coatings In 2013, the special-purpose coatings segment generated $4.3 billion in sales (or 161 million gallons), with volume up 0.9% and pricing up 1.3%. For 2014, CQ forecasts sales growth of 3.3%, supported by a 1.6% volume gain and 1.7% price lift. Exhibit 36 shows the markets served by special-purpose coatings, far fewer than those served by industrial OEM coatings, but which typically carry higher margin. Major end markets for special-purpose coatings include automotive refinish (33% of sales), industrial maintenance (30%), and traffic-marking paints (slightly more than 20%). Aerosol and marine paints are both less than 10%, with the latter seeing particularly subdued demand in recent years with the decline in shipbuilding activity. Key producers include PPG, Axalta (formerly DD, now owned by Carlyle), RPM, SHW, AkzoNobel, and BASF. Exhibit 34. Special-Purpose Coatings End Markets, 2013
Automotive Refinish
33%
Industrial Maintenance
30%
Traffic Marking Paints22%
Aersol Paint9%
Marine Paints6%
Source: The ChemQuest Group and Wells Fargo Securities, LLC Vehicle miles traveled is an important metric for auto refinish, as repair/refinish activity picks up with increased driving (which means more accidents!). VMT typically slows in the early months of the year, as cold weather curbs travel. In 2014, adverse weather limited driving in January and February, with VMT falling 7% and 5% month over month. With the thawing in March, driving activity has reaccelerated and VMT rebounded 17% over February. Interesting factoid: one out of every four cars in China is involved in an accident each year.

WELLS FARGO SECURITIES, LLC Chemicals EQUITY RESEARCH DEPARTMENT
22
Exhibit 35. Vehicle Miles Traveled, January 2008 to March 2014
(4%)
(3%)
(2%)
(1%)
0%
1%
2%
3%
4%
200
210
220
230
240
250
260
270
280
Jan-08 Jan-09 Jan-10 Jan-11 Jan-12 Jan-13 Jan-14
Yr/
Yr
% C
han
ge
Mile
s D
rive
n,
000s
Miles Driven, 000s Yr/Yr Change
Source: U.S. Department of Transportation and Wells Fargo Securities, LLC Over the past few years, growth in special-purpose coatings has been challenged by limited infrastructure spending and slower automotive refinish activity. The former reflects less cash availability to municipalities. Despite federal stimulus, austerity measures by municipalities make additional infrastructure investment in the coming years uncertain. Refinish coatings demand has also softened as the cost of car repairs has increased significantly. There has also been a trend toward consolidation of collision repair shops in the United States, as shown in Exhibit 36. Exhibit 36. Domestic Collision Repair Shops, 2001-2012
36,000
38,000
40,000
42,000
44,000
46,000
48,000
2001 2002 2003 2004 2005 2006 2007 2008 2009 2010 2011 2012
Total
# of
U.S.
Collis
ion R
epair
Shop
s
Source: SHW and Wells Fargo Securities, LLC The protective and marine market is believed to be $12.4 billion globally (approximately 65% protective and 35% marine). More than 50% of sales are from Asia. PPG and others have stated that marine new-build activity has been weak for the past few years. The sector continues to suffer from vessel overbuilding and is unlikely to recover until 2015, at the earliest.

WELLS FARGO SECURITIES, LLC Paints, Coatings & Adhesives EQUITY RESEARCH DEPARTMENT
23
Exhibit 37. Protective And Marine Sales By Region, 2013
Asia52%
Europe30%
North America15%
South America3%
Source: SHW and Wells Fargo Securities, LLC

WELLS FARGO SECURITIES, LLC Chemicals EQUITY RESEARCH DEPARTMENT
24
Adhesives and Sealants Industry Market Overview In 2013, the global adhesives and sealants industry generated roughly $50 billion in sales, with adhesives accounting for roughly $44 billion and sealants about $6 billion. North America, for which trends in sales and volume is shown in Exhibit 38, represents less than a third of the market. Since the 2008/2009 period of declines for both product types in North America, volume and pricing have been recovering, though at a gradual rate. For 2014, CQ projects overall value for adhesives to grow 3.9%, and 7.3% for sealants. Exhibit 38. North American Adhesives And Sealants Industry, 2004-2014E
Adhesives
0
4
8
12
16
0.0
2.0
4.0
6.0
8.0
04 05 06 07 08 09 10 11 12 13 14f
Value
, $B
Volum
e, MM
lbs
Value Volume
Sealants
0.0
0.5
1.0
1.5
2.0
2.5
0.0
0.4
0.8
1.2
1.6
2.0
04 05 06 07 08 09 10 11 12 13 14f
Value
, $B
Volum
e, MM
lbs
Value Volume
F=Forecast Source for both charts: The ChemQuest Group Regionally, Asia represents the biggest market for adhesives and sealants, at 34%. Europe follows, at 32% (predominantly Western Europe); and North America is third, at 27%. South America and the Middle East are smaller markets, in the single-digit percentages.

WELLS FARGO SECURITIES, LLC Paints, Coatings & Adhesives EQUITY RESEARCH DEPARTMENT
25
Exhibit 39. Global Adhesives and Sealants Sales By Region, 2013
Asia 34%
Western Europe27%
Eastern Europe
5%
North America27%
South America4%
Middle East & Africa3%
Source: Company reports and Wells Fargo Securities, LLC The top adhesives producers are shown in Exhibit 40, where we compare 2013 to the landscape in 2004. Over the past decade, Henkel has retained its leading position and nearly doubled revenue. And unlike in the coatings market, where top players have similar market shares, the leader here far outpaces its nearest competitor. Exhibit 40. Top Adhesives Producers By Sales, 2013 Versus 2004
0.50.70.91.01.1
2.02.0
3.13.8
10.4
0.0 2.0 4.0 6.0 8.0 10.0 12.0
LordDow
MapeiITW
RPMH.B. Fuller
Bostik3M
SikaHenkel
Sales ($B)
0.7
1.4
1.4
1.4
2.2
5.3
0.0 1.0 2.0 3.0 4.0 5.0 6.0
Rohm and Haas
Bostik
H.B. Fuller
National Starch
3M
Henkel
Sales ($B)
Source for both charts: The ChemQuest Group and Wells Fargo Securities, LLC The major markets for adhesives/sealants are packaging (34%); building and construction, at nearly 20%; and sealants and woodworking at 12% and 11%, respectively. The remaining markets are smaller at 10% or less of demand.

WELLS FARGO SECURITIES, LLC Chemicals EQUITY RESEARCH DEPARTMENT
26
Exhibit 41. Adhesives And Sealants Strategic Market Sectors
Packaging34%
Building & Construction
18%
Sealants12%
Woodworking11%
Assembly10%
Transportation 7%
Consumer5%
Other3%
Source: The ChemQuest Group In construction, improved building standards are a strong driver of demand. Using adhesives and sealants as a substitute for concrete or brick is more cost effective and project cycle time is shorter (highways and bridges can be reopened faster, as repair time is condensed). Products are also more eco-friendly, whereas for every ton of concrete produced, 1.4 tons of carbon dioxide is released. Finally, adhesives also offer such desired traits as flexibility, ease of repair, and strength. The increasing presence of adhesives and sealants in the transportation industry is driven in part by fuel efficiency. U.S. manufacturers are following trends toward vehicle downsizing and light-weighting, which potentially could lead producers to shed about 850lbs per automobile. In order to meet these goals, manufacturers continue to replace metals with plastics, composites, and lighter metals. These products cannot be put together with traditional mechanical fastening, and instead require adhesives to assemble various layers. At the same time, these adhesives must provide heat shielding and have enough strength to replace mechanical fasteners, etc. In 2013, most end markets showed improvement, while packaging and consumer markets were flat. The transportation end market saw gains from continued growth in auto, while construction benefited from new builds. The tapes end market was up on better transportation, electronics, and product assembly demand, while construction was flat. Higher domestic industrial production supported growth in product assembly. Exhibit 42. End-Market Performance, 2013 SECTOR TREND COMMENT
PackagingFood and beverage up slightlyPaper and corrugated containers down slightly
TransportationAuto and Light Truck builds strong, aerospace strong and moving towards adhesive bondingNeed to lower weight to meet fuel requirements will increase the use of adhesive
ConstructionNewly built construction recovering
ConsumerConsumer adhesives flat
TapesTapes for construction flat, but improvement in transportation, electronics, and product assembly
Product AssemblyIncreased domestic industrial production
Source: The ChemQuest Group

WELLS FARGO SECURITIES, LLC Paints, Coatings & Adhesives EQUITY RESEARCH DEPARTMENT
27
Industry Margin Raw materials are the largest component of costs, representing 53-63% of cost of goods sold (COGS), compared to 45-53% in the coatings industry). Adhesives use a lot of higher molecular weight products, which generally includes higher crude inputs. Similar to coatings producers, adhesives producers have been successful in passing through raw material price increases. In addition, producers have rationalized and shed less strategic customers, which midsized players have picked up. As such, margins should stay stable in 2014. Exhibit 43. Average United States Adhesive Company’s Cost Structure
2013 2012 2011 2009 2005Revenue 100% 100% 100% 100% 100%
Cost of Goods SoldRaw Materials* 53-63% 53-63% 53-63% 52-60% 53-59%Packaging 0% 0% 1% 2% 2%Labor 3% 3% 3% 2-3% 5-7%Energy 1% 1% 1% 1% 2%Overhead, Taxes, Ins., Dep., Pkg. 6% 6% 5% 5-7% 5%Total COGS 63-73% 63-73% 63-73% 62-72% 67-75%
Gross Margin 27-37% 27-37% 27-37% 28-38% 25-33%
SG&A 15-21% 15-21% 15-21% 15-21% 19-25%
EBIT 6-22% 6-22% 6-22% 7-23% 6-14% Source: The ChemQuest Group Adhesives pricing has increased steadily over the past decade. In 2009, despite the recession, continued pricing momentum coupled with lower resin costs helped margin expansion. However, since then, costs have trended slightly higher. Exhibit 44. Adhesives And Resin PPI And Cost Index (Indexed to 2005)
80
90
100
110
120
130
140
150
2006 2007 2008 2009 2010 2011 2012 2013
Index for Input and Output Pricing
Adhesives PPI Adhesives Material Cost Index Resin PPI
Source: The ChemQuest Group
WELLS FARGO SECURITIES, LLC Chemicals EQUITY RESEARCH DEPARTMENT
28
Required Disclosures
Additional Information Available Upon Request
I certify that: 1) All views expressed in this research report accurately reflect my personal views about any and all of the subject securities or issuers discussed; and 2) No part of my compensation was, is, or will be, directly or indirectly, related to the specific recommendations or views expressed by me in this research report.
Wells Fargo Securities, LLC does not compensate its research analysts based on specific investment banking transactions. Wells Fargo Securities, LLC’s research analysts receive compensation that is based upon and impacted by the overall profitability and revenue of the firm, which includes, but is not limited to investment banking revenue. STOCK RATING 1=Outperform: The stock appears attractively valued, and we believe the stock's total return will exceed that of the market over the next 12 months. BUY 2=Market Perform: The stock appears appropriately valued, and we believe the stock's total return will be in line with the market over the next 12 months. HOLD 3=Underperform: The stock appears overvalued, and we believe the stock's total return will be below the market over the next 12 months. SELL
SECTOR RATING O=Overweight: Industry expected to outperform the relevant broad market benchmark over the next 12 months. M=Market Weight: Industry expected to perform in-line with the relevant broad market benchmark over the next 12 months. U=Underweight: Industry expected to underperform the relevant broad market benchmark over the next 12 months.
VOLATILITY RATING V = A stock is defined as volatile if the stock price has fluctuated by +/-20% or greater in at least 8 of the past 24 months or if the analyst expects significant volatility. All IPO stocks are automatically rated volatile within the first 24 months of trading.
As of: June 6, 2014
50% of companies covered by Wells Fargo Securities, LLC Equity Research are rated Outperform.
Wells Fargo Securities, LLC has provided investment banking services for 44% of its Equity Research Outperform-rated companies.
47% of companies covered by Wells Fargo Securities, LLC Equity Research are rated Market Perform.
Wells Fargo Securities, LLC has provided investment banking services for 35% of its Equity Research Market Perform-rated companies.
3% of companies covered by Wells Fargo Securities, LLC Equity Research are rated Underperform.
Wells Fargo Securities, LLC has provided investment banking services for 7% of its Equity Research Underperform-rated companies.
Important Information for Non-U.S. Recipients
EEA – The securities and related financial instruments described herein may not be eligible for sale in all jurisdictions or to certain categories of investors. For recipients in the EEA, this report is distributed by Wells Fargo Securities International Limited (“WFSIL”). WFSIL is a U.K. incorporated investment firm authorized and regulated by the Financial Conduct Authority. For the purposes of Section 21 of the UK Financial Services and Markets Act 2000 (“the Act”), the content of this report has been approved by WFSIL a regulated person under the Act. WFSIL does not deal with retail clients as defined in the Markets in Financial Instruments Directive 2007. The FCA rules made under the Financial Services and Markets Act 2000 for the protection of retail clients will therefore not apply, nor will the Financial Services Compensation Scheme be available. This report is not intended for, and should not be relied upon by, retail clients.

WELLS FARGO SECURITIES, LLC Paints, Coatings & Adhesives EQUITY RESEARCH DEPARTMENT
29
Australia – Wells Fargo Securities, LLC is exempt from the requirements to hold an Australian financial services license in respect of the financial services it provides to wholesale clients in Australia. Wells Fargo Securities, LLC is regulated under U.S. laws which differ from Australian laws. Any offer or documentation provided to Australian recipients by Wells Fargo Securities, LLC in the course of providing the financial services will be prepared in accordance with the laws of the United States and not Australian laws.
Hong Kong – This report is issued and distributed in Hong Kong by Wells Fargo Securities Asia Limited (“WFSAL”), a Hong Kong incorporated investment firm licensed and regulated by the Securities and Futures Commission to carry on types 1, 4, 6 and 9 regulated activities (as defined in the Securities and Futures Ordinance, “the SFO”). This report is not intended for, and should not be relied on by, any person other than professional investors (as defined in the SFO). Any securities and related financial instruments described herein are not intended for sale, nor will be sold, to any person other than professional investors (as defined in the SFO).
Japan – This report is distributed in Japan by Wells Fargo Securities (Japan) Co., Ltd, registered with the Kanto Local Finance Bureau to conduct broking and dealing of type 1 and type 2 financial instruments and agency or intermediary service for entry into investment advisory or discretionary investment contracts. This report is intended for distribution only to professional investors (Tokutei Toushika) and is not intended for, and should not be relied upon by, ordinary customers (Ippan Toushika).
The ratings stated on the document are not provided by rating agencies registered with the Financial Services Agency of Japan (JFSA) but by group companies of JFSA-registered rating agencies. These group companies may include Moody’s Investors Services Inc, Standard & Poor’s Rating Services and/or Fitch Ratings. Any decisions to invest in securities or transactions should be made after reviewing policies and methodologies used for assigning credit ratings and assumptions, significance and limitations of the credit ratings stated on the respective rating agencies’ websites.
About Wells Fargo Securities, LLC Wells Fargo Securities is the trade name for the capital markets and investment banking services of Wells Fargo & Company and its subsidiaries, including but not limited to Wells Fargo Securities, LLC, a U.S. broker-dealer registered with the U.S. Securities and Exchange Commission and a member of NYSE, FINRA, NFA and SIPC, Wells Fargo Institutional Securities, LLC, a member of FINRA and SIPC, Wells Fargo Prime Services, LLC, a member of FINRA, NFA and SIPC, Wells Fargo Bank, N.A. and Wells Fargo Securities International Limited, authorized and regulated by the Financial Conduct Authority.
Wells Fargo Securities, LLC is a U.S. broker-dealer registered with the U.S. Securities and Exchange Commission and a member of the New York Stock Exchange, the Financial Industry Regulatory Authority and the Securities Investor Protection Corp.
This report is for your information only and is not an offer to sell, or a solicitation of an offer to buy, the securities or instruments named or described in this report. Interested parties are advised to contact the entity with which they deal, or the entity that provided this report to them, if they desire further information. The information in this report has been obtained or derived from sources believed by Wells Fargo Securities, LLC, to be reliable, but Wells Fargo Securities, LLC, does not represent that this information is accurate or complete. Any opinions or estimates contained in this report represent the judgment of Wells Fargo Securities, LLC, at this time, and are subject to change without notice. For the purposes of the U.K. Financial Conduct Authority's rules, this report constitutes impartial investment research. Each of Wells Fargo Securities, LLC, and Wells Fargo Securities International Limited is a separate legal entity and distinct from affiliated banks.. Copyright © 2014 Wells Fargo Securities, LLC.
SECURITIES: NOT FDIC-INSURED/NOT BANK-GUARANTEED/MAY LOSE VALUE