the changing australian debt landscape...to determine how this changing landscape is likely to...
TRANSCRIPT

The changing Australian debt landscape
November 2019
Stuart Dear, Deputy Head of Fixed Income
For professional investors and advisers only. Not for distribution to retail clients
There are two dramatic changes underway that are altering the Australian fixed income landscape. The first is the move to a near-zero policy and bond yield environment. The second is the significant shift towards non-bank funding channels for private sector borrowing. This paper assesses the impact of these on the ability of Australian fixed income to meet the future requirements of investors.
At a glanceOur key conclusions are that:
– Fixed income is likely to be even more relevant for delivering low-risk income in a low yield world, due to the certainty of cashflows.
– The ability to diversify risk, both within fixed income portfolios and between fixed income and other asset classes, is challenged. This may actually result in more stable permanent demand for fixed income.
– Australian private debt is a welcome enlargement to the local opportunity set. However, while we believe Australian debt is underutilised to a degree, we continue to expect investors to search for opportunity and diversification offshore.
– Fixed income solutions targeting particular investor requirements will be increasingly demanded.
– Active management will be even more valuable with future beta returns lower, alpha potentially harder to capture and volatility management more difficult.
1. Why do investors want fixed income?To determine how this changing landscape is likely to impact investor decision-making, we first need to understand why investors typically hold fixed income investments.
The key strategic reasons to hold fixed income are:
– As a source of low-risk income.
– For diversification, particularly against equity risk.
The future return and risk distributions of different assets (and combinations of assets) are always uncertain. As a result fixed income plays a useful strategic role – both as a reliable income generator (given the known cashflows from high-quality debt) and as a source of differentiated returns that are predictable over the long term and typically lowly correlated through periods of equity stress.
There are also tactical reasons to hold fixed income, mostly related to concern about riskier asset performance. In a cyclical downturn or other periods of stress where riskier assets come under pressure, the short-term payoff profile for safer bonds likely shifts to the right of the return distribution bell curve; if not, at least liquidity and capital stability are preserved in times of uncertainty.
Finally, the certainty of cashflows make high quality fixed income integral to specific investment solutions, including situations where an investor has a certain time horizon in mind, requires a specific income profile, or (especially) wants to immunise their portfolio against time and cashflow liability risks.
In a low-yield, low-growth world, fixed income is set to become even more important as a source of reliable cashflow and as a portfolio stabiliser – although active management is likely to prove essential as beta falls and alpha becomes harder to capture.
2The changing Australian debt landscape

Fixed income plays an important strategic role in investor portfolios both as a reliable income generator with known cashflows, and as a source of differentiated
returns that are typically lowly correlated through periods of equity stress.
2. The challenges of near-zero yieldsNear-zero yields threaten the income and diversification properties of fixed income in several ways. Here are some of the most significant.
2.1 Lower income
Clearly, income is lower. The yield on a bond relates coupons to price. While current coupons may still be high relative to yields, over time the cashflows from coupons should converge lower towards yields, as new debt is issued with lower coupons. Since income drives total return from fixed income over time and is the only return component on a hold-to-maturity basis in the absence of default, this means lower future returns from bonds.
2.2 Changes in the return distribution
With income and total returns lower over time as a result of lower yields, the distribution of returns is affected in several key ways:
– The return distribution shifts to the left, with negative central tendency outcomes if yields are sub-zero.
– Even if the expected return is positive over time, with yields above zero, there will be more periods of losses over short time-frames, as there is a lower income buffer to absorb changes in capital value.
– The breadth of the distribution may actually narrow. The experience of Japan is that yield volatility is actually lower as yields fall, despite high debt levels and inherent sensitivity to shocks. Although the capital value change increases at lower yields due to convexity, lower volatility of yields overcompensates for this increase, such that total return volatility is lower.
– Although it’s tempting to think that the only way yields can move is up, and hence that there is an asymmetry in short-term returns with yields at low levels, the early evidence suggests there is no discernible change in skew as yields move lower.
Figure 1: The return distribution shifts with yields
-2
Freq
uenc
y
Medium - term returns (% pa)
The return distribution shifts to theleft as the starting yield falls
0 2 4 6 8
Source: Schroders, indicative only
3The changing Australian debt landscape

Figure 2 provides some historical evidence that volatility falls as yields fall, while the distribution of returns stays reasonably symmetric.
Figure 2: Lower volatility and unchanged skew at lower yield levels
Yield Level Yield Volatility Yield Skew
Averages by decade JGBs Treasuries Bunds JGBs Treasuries Bunds JGBs Treasuries Bunds
60s – 4.8 – – 2.8 – – 0.1 –
70s – 7.5 – – 5.0 – – 0.1 –
80s 5.1 10.6 6.9 6.6 11.8 2.0 0.0 0.2 0.0
90s 4.0 6.7 6.6 6.0 6.5 5.9 0.0 0.0 -0.1
00s 1.5 4.4 4.2 2.5 5.3 4.2 0.1 0.0 -0.1
10s 0.5 2.4 1.2 1.4 4.6 3.9 -0.2 -0.1 0.0
Source: Schroders, Bloomberg
The observation that skew is little affected by yield levels is supported by two recent events:
– Options pricing in the US was skewed for many years after the global financial crisis (GFC) to reflect expectations of higher rates, as puts were perennially more expensive than calls. However, it eventually shifted to accept a more symmetric outlook as rates stayed ‘lower for longer’ (see Figure 3).
– More recently, expectations for the European Central Bank cash rate have rebalanced in a similar way, with rates stalled at sub-zero levels.
Recent history suggests that, as yields fall, so does volatility, narrowing the distribution of returns, with no discernible change in skew.
Figure 3: Skew in rates: after initial shocks, expectations adjust to lower yields
Source: Bloomberg, Schroders
Large debt loads make rate rises painful while reinforcing low growth, in the classic liquidity trap.
20
15
10
5
0
-5
-10
Jul 04 Jul 06 Jul 08 Jul 10 Jul 12 Jul 14 Jul 16 Jul 18
Following the GFC, puts were more expensive for some time, before symmetry was restored
Skew the US Swation Pricing (3m10y25bps put implied vol - call implied vol)
4The changing Australian debt landscape

2.3 Persistence of low yields
These observations on the shape of the distribution in terms of breadth and skew both presume, to a degree, the persistence of low yields. This presumption is underpinned by:
– Downward structural trends in inflation and potential growth, due to well-known demographic and technology factors.
– Large debt loads, which make rate rises too painful – but which also reinforce low growth, as high indebtedness limits credit creation, in the classic liquidity trap. This has been the case in Japan, even though progressively more debt is owed by the government, and effectively funded by the central bank, so in theory crowding out has been minimised.
– The policy frameworks of central banks, which target narrowly defined consumer inflation, and the bluntness of the tools at their disposal. Despite limited success, central banks are in the process of ‘doubling down’ on policy accommodation and appear unlikely to meaningfully change regimes – at least before another crisis.
– An array of non-economic buyers. Central banks and regulated financial institutions (both insurance companies and banks) are effectively forced to hold home currency sovereigns, while sovereign wealth and reserve managers typically buy bonds of other countries, somewhat insensitive to price. The true ‘free float’ of bonds excluding these buyers is significantly lower than notional outstanding bonds on issue.
At lower yield levels, relative rates of return are likely to become more important in determining fixed income allocations.
2.4 Relative rates of return
With persistent low yields, economic buyers need ongoing valid reasons to hold bonds. At face value, buying a bond for a certain loss over time seems irrational. However, there are still justifications for buying such a bond, including:
– Short-term capital gains, as yields can move more negative.
– As a deflation hedge, since the nominal loss on the bond may be converted to a real (after-inflation) gain over time.
– Currency-related reasons, including:
– Where a negative yielding bond may offer a hedged pickup into a higher yielding currency – for example, JGBs hedged back to AUD currently offer a higher positive yield than Australian government bonds.
– Where investing on an unhedged basis offers the potential for positive returns including currency effects. There is also the special case of currency re-denomination risk within the Eurozone – for example, Bunds would reprice higher into Deutschmarks if the Euro reverted to its constituent currencies.
– Where cheaper funding (achieved by borrowing at a more negative short-term rate) allows you to make a profit. This, after all, is what banks do – fund at cheap short-term rates and lend long at higher rates.
These examples demonstrate that relative rates of return – compared to inflation, return available in other currencies, and funding costs – matter as much as absolutes. At lower yield levels, relative rates of return are likely to become more important in determining fixed income allocations.
2.5 Compression of yields
Lower volatility, persistence and relative value assessments all suggest compression of yields, which can occur in multiple ways – including between countries, along yield curves and between ratings qualities. Although we’re already seeing this phenomenon, it has the potential to run much further, as the ‘reach for yield’ dynamic drives further compression on relative valuation arguments.
5The changing Australian debt landscape

Figure 4: Compression in yields and spreads as yields move lower
Source: Schroders, Bloomberg
As global assets converge towards zero yields and potentially lower volatility, it becomes harder to generate alpha and manage risk,
making these skills more valuable.
2.6 Reduced diversification potential
These observations suggest that fixed income has reduced diversification potential at low yields, as a result of:
– Reduced ‘power’ of duration. Even when yield moves are symmetric, if volatility is lower at low yields, then upside return from bonds in periods of stress will be lower.
– Increasing correlations between bonds and equities. If central bank liquidity supports all assets, but has little impact on real economy outcomes, it will perpetuate ‘low for longer’ yields and (ultimately) returns across all assets. Not only do bonds and equities likely move together, but preference within equities will shift towards bond-like sectors.
– Fixed income portfolios becoming more equity-like. Given reach for yield into lower-quality assets or extension of duration, fixed income portfolios may take on some of the risk–return characteristics of equities. They may also take on other risks in order to generate returns, including leverage into interest rates or other factors, which comes at the cost of lower liquidity.
– Reduced diversification within fixed income portfolios. As global assets converge towards zero yields and potentially lower volatility, the opportunity set narrows. Because this makes it harder to generate alpha and manage risk, these skills become more valuable.
AU 10y yield US HY Credit Spread
AU 10y Semi Spread (rhs)
AU 3s-10s curve (rhs)
EU Periphery Spread (10y IT-DE) (rhs)AU 10y spread to US (rhs)
AU IG Credit Spread (rhs)
10 6
5
4
3
2
1
0
-1
-2
9
8
7
6
5% %
4
3
2
1
0Dec 11 Dec 12 Dec 13 Dec 14 Dec 15 Dec 16 Dec 17 Dec 18
6The changing Australian debt landscape

2.7 Vulnerability to shocks
In a cyclical sense, despite occasional brief periods during which yields spike as overbought conditions are unwound, there doesn’t seem a material risk of yields reverting to significantly higher levels. This is because growth is softening, inflation is muted, central banks are easing, and riskier assets are also reasonably fully valued.
However, does a low yield, low growth, high debt world make both economies and markets more vulnerable to shock?
Sustainability of high debt levels likely requires an extended period where central banks and governments need to keep nominal yields well below nominal income. As such, aggressive central bank purchases may still be in their early stages.
At face value, high debt, accompanied by central bank accommodation, appears to reduce growth volatility. This can be good for fixed cashflow investments (as long as growth is high enough to meet commitments), and may support some relative valuation arguments, since the required risk premium may fall. However, any investment that relies on an assumed rebound to higher rates of growth is subject to downwards re-rating (for example, equities and riskier credit).
Beyond cashflows reliant on higher growth, there are three obvious candidates for shocks to fixed income in a low yield world:
1. Inflation. Inflation is always the enemy of fixed nominal cashflows. Against structural headwinds, aggressive ongoing central bank accommodation supported by fiscal policy may eventually be successful in lifting inflation of goods and services in developed economies. In contrast, ongoing disinflation or deflation appears an equally likely risk.
2. Central bank regime change. As mentioned earlier, this appears unlikely without greater coordination with governments, which would involve higher use of fiscal policy to stimulate demand, and revision of central bank mandates. The shock of unwinding central bank involvement in markets would likely see both yields and volatility higher.
3. Illiquidity. In a low-yield world, liquidity is increasingly dependent on government sectors where debt has grown most. As a result, illiquidity in credit is not properly priced and is potentially exacerbated as investors reach for return. A liquidity shock probably requires a trigger event, such as bank or hedge fund collapse. While financial system leverage is probably not near pre-GFC levels yet, this risk is somewhat unquantifiable in advance.
The world is currently experiencing the highest debt per capita in history.
3. Shifting funding channels and debt supplyLargely unrelated to the level of yields, a significant change is underway in the supply of investable Australian debt, with a shift towards non-bank funding channels for private sector borrowers. Increased supply, especially of non-financial corporate and household forms of debt, improves income and breadth opportunities.
Contrary to the thesis that economies will be required to deleverage, the post-GFC era has seen an increase in global debt levels, driven by debt growth in developing economies, particularly China. The world is currently experiencing the highest debt per capita in history.
With debt levels already high prior to the GFC, the last decade has mostly been one of compositional change within developed countries. Across Europe and the US, private sector deleveraging has been offset by increased government borrowing.
Australia bucked the trend: from a better fiscal starting point, both government and household debt has grown – with no recession forcing private sector debt reduction, and with lower policy rates effective in stimulating housing borrowing. At 236% of GDP in aggregate economy-wide debt (or AUD$4.2 trillion), we now have similar debt levels to developed economy peers.
7The changing Australian debt landscape

Compositionally, we have higher household debt, about average corporate debt levels and lower government debt. The latter may partly be the counterweight to high household debt, given the economy’s reliance on housing and its implicit support from the government.
On the face of it, the large stock of outstanding economy-wide debt that needs to be funded and managed suggests that fixed income fund managers should be kept busy for the foreseeable future.
Figure 5: Economy-wide debt by borrower type
Source: Schroders, Bloomberg, IMF (household debt), BIS (NFC and govt debt), RBA (securities on issue).
3.1 Trends in economy-wide debt
Looking at both the aggregate level of debt and its composition, we believe that two broad trends are likely to play out over time:
– Private sector credit growth will slow. As system credit growth converges to income growth, debt ratios – relative to income and GDP – will stabilise. This is largely due to households reaching ‘debt saturation’ limits, even at lower interest rates. At a micro level, this contention is supported by the elevated income verification process and tighter lending standards relative to income that banks are applying. Corporates may also contribute to this effect via the compositional shift within the economy towards sectors with capital-light business models – although Australia’s sectoral composition suggests this trend will lag other countries. Government debt is likely to increase further. Due to demographic burden, as there is plenty of fiscal space to increase government debt, and as policy onus eventually shifts back to fiscal policy in light of the diminished effectiveness of monetary policy.
Figure 6: Private sector credit growth converging to income growth
20.0%
18.0%
16.0%
14.0%
12.0%
10.0%
8.0%
6.0%
4.0%
2.0%
0.0%
Sep 05 Sep 07 Sep 09 Sep 11 Sep 13 Sep 15 Sep 17
-
20
40
60
80
100
120
140
160
200
180
Housing Loan Growth yoy
Wage growth yoy
Basic Variable Mortgage Rate
Household debt to income (rhs)
Source: Schroders, ABS, RBA.
400
300
200
100 214112 111
100
85143
57
8659
85
114
100
99
73
78
40
75
122
0
% o
f GD
P
Japan UK France Canada US Australia
Government Non-financial corporates Households
8The changing Australian debt landscape

3.2 Low supply of investable Australian debt
Relative to the high – and likely growing – levels of debt in the Australian economy, there is surprisingly little debt in security form available for investment:
– Household debt is largely not in investable form, being mostly on bank balance sheets, with bank funding dominated by deposits and only a small reliance on wholesale funding through public markets. In turn, the majority of deposits are transaction account balances, which are not ‘investable’ even in the way a term deposit is.
– Corporate debt has historically been intermediated by banks or sourced offshore, leaving little for the domestic public market.
– Government debt, compared to private sector debt, is relatively abundant and dominates local benchmarks and trading activity. However, Australian government debt is both relatively low by international standards and local investor engagement with the market is somewhat limited, as most of the debt is held by foreigners. Better interaction with the superannuation system is likely required to support a larger government bond market.
Figure 7: Low supply of public debt securities relative to total economy debt
Public debt issued by Australian entities
400
350
300
250
200
% o
f GD
P
150
100
50
0
AUD Non-AUD Total
Government Non-financial corporations ABS (inc RMBS) Financials
‘Gap’ to total economy debt level is funded
by bank balance sheet and private debt
Source: Schroders, Bloomberg, RBA (securities on issue).
With total debt across the private sector now growing slowly, the rise of private debt funding comes at the expense of both limited public supply and even slower growth
in bank-funded debt.
3.3 Increased supply of private debt
While the supply of public forms of household and corporate-borrower debt is relatively low compared to the quantum of debt borrowed by these sectors of the economy, supply of private forms is growing rapidly. With total debt across the private sector now growing slowly, the rise of private debt funding comes at the expense of both limited public supply and even slower growth in bank funded debt.
9The changing Australian debt landscape

Figure 8 shows our estimates of the funding sources for total household and non-financial debt. While bank lending still dominates both categories, especially for households, non-bank private sources supply as least as much funding in each category as the public securities market.
Figure 8: Funding of household and corporate debt is shifting to private sources
Household debt
$-
$500
Public Securities(ABS/RMBS)
Bank Lending Private Debt
$1,000
AUD
Bill
ions
$1,500
$2,000
Non-financial corporate debt
$-
$500
Public Bonds Bank Lending Private Debt
$1,000
AUD
Bill
ions
$1,500
$2,000
Source: Schroders, Bloomberg, APRA (bank lending). Data as at December 2017.
The shift of corporate and household debt funding into the private space is driven by:
– Increased regulation of banks. Australia is, to a degree, playing catchup with other jurisdictions. There are two key aspects of greater regulation:
– APRA’s capital adequacy framework imposed on ADIs, which has seen banks narrow their focus of lending to the areas that are most profitable relative to the cost of capital required to support that lending. The domestic banks, particularly the majors, have not been prepared to lower their return on equity targets in the way that other competitors have – including the foreign banks. Banks primarily favour high quality housing loans to the detriment of lending to corporates, particularly to SMEs. Banks have been keen to retain corporate relationships to capture ancillary business such as arranging lending and transactional banking, including interest rate and foreign exchange hedging. However, the key role of actually providing the lending to corporates is now less important to banks.
– APRA’s increased macroprudential oversight of residential mortgage lending by ADIs between 2014 and 2018 – which restricted higher-risk lending by banks in the housing market but saw some of this borrowing shift to non-banks.
– Tightening of bank lending standards. Lending standards have further tightened as a result of greater scrutiny following the banking Royal Commission, which created spill-over demand for loans from non-banks.
– Increased competition from large foreign banks. Foreign banks are usually prepared to accept a lower return on equity.
– The different funding models of non-bank lenders. Non-bank lenders typically source funds via investment vehicles available to the public, whereas banks fund via deposits. Because a large volume of deposits sits in transaction accounts at very low interest rates, the shift to funding via investment vehicles is a new avenue of attractive investment.
– Higher costs. A greater burden of disclosures has driven costs higher for companies in the public domain.
– Company preferences. Companies often prefer to work with strategic investors able to commit large volumes of funding for long time-frames in private form, and the increased appetite of super funds in particular to be such investors.
– A rise in available capital. Given attractive returns on offer versus public securities.
– Growth of private equity and associated debt funded buyouts. Private equity is to a degree challenging both banks and public markets as sources of funds.
– Technology and the internet. The internet is an enabler of both access and granularity (for example, peer-to-peer lending).
While many of these drivers are linked to regulation of banks, low yields are also likely important in pushing capital to previously untapped areas.
10The changing Australian debt landscape
Private debt offers an expanded opportunity set that can help meet investors’ need for income generation and liability matching while potentially resolving some of the
diversification and capacity limitations of the domestic public market.
3.4 Expanded opportunity set via private debt
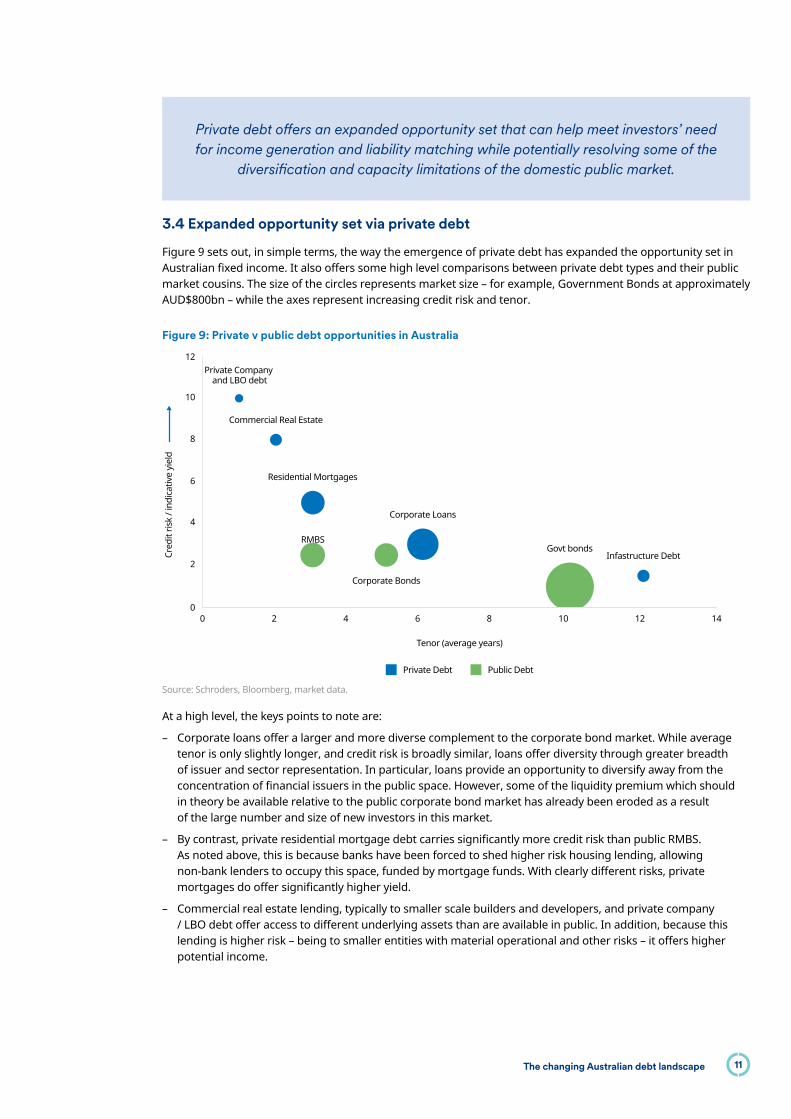
Figure 9 sets out, in simple terms, the way the emergence of private debt has expanded the opportunity set in Australian fixed income. It also offers some high level comparisons between private debt types and their public market cousins. The size of the circles represents market size – for example, Government Bonds at approximately AUD$800bn – while the axes represent increasing credit risk and tenor.
Figure 9: Private v public debt opportunities in Australia
00
2
4
6
8
10
12
2 4 6 8 10 12 14
Cred
it ris
k / i
ndic
ativ
e yi
eld
Tenor (average years)
Corporate Loans
Corporate Bonds
Govt bondsInfastructure Debt
RMBS
Residential Mortgages
Commercial Real Estate
Private Company and LBO debt
Private Debt Public Debt
Source: Schroders, Bloomberg, market data.
At a high level, the keys points to note are:
– Corporate loans offer a larger and more diverse complement to the corporate bond market. While average tenor is only slightly longer, and credit risk is broadly similar, loans offer diversity through greater breadth of issuer and sector representation. In particular, loans provide an opportunity to diversify away from the concentration of financial issuers in the public space. However, some of the liquidity premium which should in theory be available relative to the public corporate bond market has already been eroded as a result of the large number and size of new investors in this market.
– By contrast, private residential mortgage debt carries significantly more credit risk than public RMBS. As noted above, this is because banks have been forced to shed higher risk housing lending, allowing non-bank lenders to occupy this space, funded by mortgage funds. With clearly different risks, private mortgages do offer significantly higher yield.
– Commercial real estate lending, typically to smaller scale builders and developers, and private company / LBO debt offer access to different underlying assets than are available in public. In addition, because this lending is higher risk – being to smaller entities with material operational and other risks – it offers higher potential income.
11The changing Australian debt landscape

– Infrastructure debt offers the attraction of a long tenor and stable income stream – and is particularly suitable for long-term liability matching. Governments at state and federal levels remain closely linked to infrastructure debt supply either through privatisation deals, or public-private partnerships. However, credit risk for infrastructure is higher than for government debt, owing to the specific nature of projects and the lack of explicit government backing. Since infrastructure debt can be considered as funding for an asset that may have otherwise been comingled on a government’s balance sheet, true diversification is perhaps overstated.
Figure 10: Corporate bond v corporate loan sector representation
Source: Schroders, ANZ, CBA.
The expanded opportunity set that private debt offers can help meet investors’ need for income generation and liability matching. It may also help resolve some of the diversification and capacity limitations of the domestic public market.
With banks have forced to become more conservative and private funding taking up the slack, private debt borrowers are generally of lower quality than bank customers
– which means private debt is of lower quality than the debt it replaces.
However, there are a number of obstacles:
– Private debt is difficult to access. Secondary markets are typically not established and only industry ‘insiders’ have access to primary deals, while restricted information availability keeps barriers to entry for new market participants high. In this sense, ‘private’ applies both to information about the debt, as well as its form.
– Although private debt tends to be more bespoke – tailored to both borrower and lender requirements – it lacks some of the standardised features of public debt which certain investors require. For example, private debt is prohibitive for insurers to hold if unrated, as it carries a high prudential asset risk charge.
– A lack of secondary trading means market-value pricing is usually estimated. While spreads should be wider to compensate for illiquidity, lower price visibility masks the true volatility of underlying assets – leaving this risk often under-priced.
– Because banks have been forced to become more conservative in their lending, and private funding has taken up some of the slack, private debt borrowers are generally of lower quality than bank customers – which means private debt is therefore of lower quality than the debt it replaces. Additionally, lightly-regulated private debt originators need strong commercial discipline to maintain the standards of their lending books. On the flip side, bank balance sheets may now be of better quality but are arguably more concentrated.
Utility & Energy
Transportation
Real Estate / Property
Finance
Consumer
Telecommunications
Construction / Building
Healthcare
Mining
92%
17%
20%
11%24%
7%
10%
10%
2%3%
2% 1%
1%
Corporate LoansCorporate Bonds
12The changing Australian debt landscape

3.5 Challenges to bank funding models
Figure 11: Composition of bank funding
Source: APRA
Banks have historically been funded largely via deposits, which has provided the benefits of:
– Low cost, especially with respect to deposits at call, which attract low or token interest rates.
– Surety, as deposits are quite sticky.
However, there are two challenges to this.
Firstly, low yields make non-interest bearing deposits on call less valuable to banks, as they reduce the cost difference between this form of funding and others. In the case of a negative rate environment, this form of funding actually becomes undesirable.
Secondly, low yields may see both large and small investors move away from interest bearing deposits in search of better returns. This would presumably force banks to issue more debt in wholesale markets to shore up funding – although deposit levels are yet to show much adverse response to falling rates. With loan growth slow, banks need to access wholesale markets for significantly less funding at present. Alternatively, it is possible for banks to change funding models, or indeed business models, in a more radical way, if the regulator allows the flexibility to do so.
While the growth of private debt has partly been due to the differences between bank and non-bank funding models, and the differing regulation between the entity types, these distinctions may become more blurred in future. The gaps between banks and non-banks may close from both directions, with banks seeking more investor-based funding, and non-banks becoming more heavily regulated. Similarly, banks may look to change business models even further, by shifting towards a fee-based rather than lending model for households, as they have already done for corporates.
Australia has a large housing sector, and also a large banking sector, relative to the total economy. These naturally go together, as evidenced by a similar situation in Canada. While housing is likely to remain large in Australia due to cultural and taxation factors, the identified shift of lending funding from bank balance sheets should see banks become less important in debt and equity market indices.
The gaps between banks and non-banks may close from both directions, with banks seeking more investor-based funding, and non-banks becoming
more heavily regulated.
Deposits on call
Term deposits
Certificates of deposit
Wholesale: Short-term borrowings
Wholesale: Long-term borrowings
39%
28%
7%
8%
18%
13The changing Australian debt landscape

3.6 Response of borrowers to low yields
In addition to the challenges outlined above, low yields are likely to impact borrowers in the following ways:
– The lower rates go, the more bank profitability is affected, as net interest margin compresses. This is partly due to much of banks’ deposit funding costs already being floored at virtually zero. Additionally, as mentioned earlier, securing bank funding may become more difficult as deposits potentially shift in the search of higher returns. Minimising effects like these which impede the efficient transmission of policy through banks will be a key consideration for the RBA in assessing the need and form of QE in Australia.
– Corporates appear unlikely to significantly increase borrowing for genuine investment – both because investment hurdle rates are probably still too high relative to the low growth world, and because there is little need to expand capacity materially with growth so low. Though borrowing for financial engineering may increase – for example, to fund share buybacks – in general Australian corporates have retained a conservative approach to gearing levels in memory of the stress of the GFC.
– Governments may consider increasing supply significantly to lock in a low interest bill. Where nominal GDP growth is greater than the interest rate, then government debt is theoretically sustainable. Globally, no bonds have yet been issued with negative coupons where the investor would need to pay coupons to the borrower. In the extreme at zero coupon rates, serviceability becomes a non-issue as there are no interest payments, and rollover risk dominates. There may also be a temptation to extend tenor dramatically. In the extreme form, large government supply is funded by the central bank, as proponents of Modern Monetary Theory would argue should occur, or government perpetual bonds – neither of which are repaid.
Extension of government debt may well make sense for economic reasons, but for investors in Australian fixed income, the advantages are less obvious. We already have a well-developed, if somewhat underutilised, domestic government market, and in the extreme forms described above government bonds take on some equity-like characteristics. Increased longer-dated corporate supply would more neatly tap unrequited demand for longer-dated yielding assets, which has been satisfied to a degree in recent years by investment in bond-like alternatives.
3.7 Other likely supply changes
Australian debt supply is likely to change in other ways, based on the evolving requirements of society, including more specific funding of:
– Infrastructure – especially where linked to productivity enhancement.
– Environmental and social projects – via green and social bonds.
– Innovations in high-value industries – such as technology and medicine.
Other innovations are also occurring in the way debt is made available to investors. These largely relate to improved access via exchanges, especially benefiting small investors – for example, the listing of corporate bonds and associated reductions in minimum parcel size, and the advent of ETFs and other exchange-listed fund vehicles.
Such innovations help improve both access and liquidity, and will likely be supportive of the development of the private debt market. However, they will clearly begin to blur some of the boundaries with public debt and are likely to further erode private debt’s relative attractiveness.
Risk premia for riskier assets may decline due to compression and reach for yield – in contrast to what we think should occur,
given the better stability and certainty of fixed income cashflows.
14The changing Australian debt landscape

4. Meeting investor needsHow will these changes impact the ability of fixed income investments to meet investor needs?
There are many possible implications of low yields and shifting local supply, impacting both the key strategic reasons to hold fixed income (low-risk income generation and diversification), and the ability to generate beta and alpha within fixed income holdings. We’ve summarised some of the key impacts below.
4.1 Income
– Fixed income will generate lower average returns and more periods of losses – but likely at lower volatility and still with symmetric risk distributions for high quality debt.
– The certainty of high-quality fixed income cashflows, without dilution of their risk characteristics, makes them especially valuable in a low-growth environment, relative to riskier income generating strategies which rely on higher growth.
– Reach into other assets in search of income is likely to intensify further. As a result of lower volatility, persistence and relative value assessments, we are likely to see ongoing compression of the opportunity set, including convergence of yield curves and credit spreads.
– The development of the private debt market in Australia expands the opportunity set with access to a greater range of Australian credit. This will help address some of the limitations of the domestic public market, providing access to higher income, a wider array of underlying assets, and a larger, more diverse pool of borrower names. These benefits come with reduced liquidity and other complications.
– Any increase in longer-tenor corporate and credit supply as the private debt market develops will be useful in helping match liabilities for certain investors – notably long duration liability insurers who have some appetite for higher yield and are happy to accept the illiquidity.
– More long duration government supply is not necessarily helpful for improving the opportunity set in its own right, as this market is already large and well developed. It does, however, provide a useful liquidity complement to the growing private debt market.
– In the absence of shocks, required risk premia on safe bonds should not change significantly at lower yields. For long duration bonds, higher premia to compensate for inflation risk may shift to lower premia for deflation protection – which we are arguably already witnessing. For riskier assets, risk premia may decline due to compression and reach for yield – in contrast to what we think should occur, given the better stability and certainty of fixed income cashflows. This includes compression in risk premia in Australian private debt.
– The use of fixed income is likely to shift towards a larger role in safe income generation at the expense of its role as a diversifier of broader portfolio risk that favours short duration income solutions.
– We consider diversified, defensive fixed income solutions a reasonable home for part of a portfolio’s cash allocation, as a way of sensibly enhancing yield a little without compromising too much on the liquidity and certainty that cash provides.
4.2 Strategic diversification
– While strategic diversification has diminished as a rationale for holding long duration bonds, the income from traditional fixed remains a key strategic attraction due to its protection against deflation and its other defensive characteristics, including certainty of income, liquidity and capital stability over time.
– The standalone defensiveness of fixed income is likely to be impaired as portfolios shift to higher credit risk and lower interest rate risk. Dependent of time-frames, volatility management may become even more important within fixed income portfolios.
– Investors are likely to seek longevity in other ways – for example, by taking duration in equities rather than taking interest rate risk. This idea has limitations, because a bond’s duration is finite and cashflows are known. In contrast to the perpetual nature of uncertain equity cash flows, these alternate approaches to duration are quite different.
– Bond proxies may offer higher income but little true underlying diversification – for example, infrastructure debt versus government debt.
– Illiquidity in private debt is seen as attractive for return but assumes other parts of the portfolio can manage risk.
15The changing Australian debt landscape

– Despite the development of the local private debt market, Australian debt will still only represent a small portion of the broader global fixed income opportunity set. Although we believe Australian debt is underutilised to a degree, we continue to expect investors to search for opportunities and diversification offshore.
– We argue that where equity risk diversification options are more limited, investors are better to hold less equity risk rather than deallocate from fixed income. In turn, this would mean a reduced need to shift allocations into fixed income for tactical de-risking, and a more stable permanent demand for bonds.
– A key asset allocation risk is that the suggested equity deallocation shift does not occur, but that fixed income portfolios become more equity-like in pursuit of returns.
4.3 Alpha versus beta in fixed income
– In addition to the total portfolio reasons to hold fixed income, it is still a very large universe containing plenty of opportunities.
– Within fixed income, relative rates of return are likely to become more important, compared to absolute levels, in determining outcomes.
– By definition, beta returns will be lower at low yields. But alpha generation opportunities are likely also to be lower as a result of convergence, and the management of volatility will be more difficult as correlations rise with convergence.
– This potentially makes both alpha generation and risk management more valuable. We may see a re-allocation of active fee budgets back towards traditional fixed income – where the predominant shift has been towards passive – to reward the value of alpha.
– Alpha generation is likely to see greater use of derivatives to access relative value opportunities, making risk and liquidity management crucial.
The gaps between banks and non-banks may close from both directions, with banks seeking more investor-based funding, and non-banks becoming
more heavily regulated.
16The changing Australian debt landscape

Important InformationThis article is intended for professional investors and financial advisers only and is not suitable for distribution to retail clients. Opinions, estimates and projections in this article constitute the current judgement of the author(s) as at the date of this article. They do not necessarily reflect the opinions of Schroder Investment Management Australia Limited, ABN 22 000 443 274, AFS Licence 226473 ("Schroders") or any member of the Schroders Group and are subject to change without notice. In preparing this article, we have relied upon and assumed, without independent verification, the accuracy and completeness of all information available from public sources or which was otherwise reviewed by us. Schroders does not give any warranty as to the accuracy, reliability or completeness of information which is contained in this article. Except insofar as liability under any statute cannot be excluded, Schroders and its directors, employees, consultants or any company in the Schroders Group do not accept any liability (whether arising in contract, in tort or negligence or otherwise) for any error or omission in this article or for any resulting loss or damage (whether direct, indirect, consequential or otherwise) suffered by the recipient of this article or any other person. This article does not contain, and should not be relied on as containing any investment, accounting, legal or tax advice. Schroders may record and monitor telephone calls for security, training and compliance purposes. You should note that past performance is not a reliable indicator of future performance. Schroders may record and monitor telephone calls for security, training and compliance purposes.
Schroder Investment Management Australia LimitedLevel 20, 123 Pitt Street, Sydney, NSW 2000T +612 9210 9200
schroders.com.au