the changing abundance of moths in a tussock …
TRANSCRIPT

E.G. WHITE 5
Centre for Resource Management, P.O. Box 56, Lincoln University, Canterbury, New Zealand.Present address: 74 Toorak Avenue, Christchurch 4, New Zealand.
THE CHANGING ABUNDANCE OF MOTHS IN A TUSSOCKGRASSLAND, 1962-1989, AND 50- TO 70-YEAR TRENDSSummary: Species-rich moth faunas at two sites in a montane tussock grassland at Cass show major declines inthe abundance of many common species between 1961-63 and 198'7-89, furthering a 50- to 70-year trend. Therecent faunal record (202 species) is quantified by a 3-point light-trapping methodology based on independenceof serial samples, minimised sample variability and a posteriori data standardisation. An historical record ofvegetation change is also presented, pointing to a major decline in endemic herb species with the advances of anadventive grass, Agrostis capillaris. Site differences feature in the analysis of vegetation and faunal changes. Atthe site with the greater loss of herbs and the 93% grass cover (a doubling in 26 years), the respectiveabundances of common herb- and grass-feeding moth species have declined 88% and 74% since 1961-63. Agreater residual floral diversity at the other site (13% herb cover, 71% grasses) has to date favoured a lesserdecline in grass-feeders (56%). Data analyses suggest that few common endemic grassland moths can survive asoligophages, most depending on feeding diversity. In the face of reducing diversity, the thrust of faunalconservation in induced Agrostis associations should be to manage the vegetation using adventive animals asallies. The evidence of the study supports and extends the author's earlier conservation guidelines.
Keywords: Lepidoptera; moth fauna; abundance; population trends; light-trapping; grasslands; Agrostis;polyphagy; conservation.
IntroductionThe long-term status of insect faunas in NewZealand's indigenous tussock grasslands has attractedminimal research. Time frames and processes ofchange are poorly understood and have received scantinvestigation. While some fragmentary evidence ofdeclining insect trends has been noted (White, 1987),these are merely a pointer to faunal history overrecent time. Quantitative measures are absent. Thepresent study attempts to quantify change in faunalelements of tussock grasslands that have been invadedby the widespread adventive grass Agrostis capillarisL. (browntop). The choice of a 'representative' faunalelement is desirable in ecosystems with rich faunasthat can reach 1000 insect species alone (see Burrows,1977). Of the primary insect taxa, Lepidoptera(notably moths) are a dominant herbivore group, andadults are readily sampled. Insofar as all life-stagescomprise a major prey resource for invertebrates andbirds, the taxon may also be a prime indicator of thelikely dynamics of other faunal elements. Thenumerous difficulties in quantifying moth dynamicsacross species phenologies have tended, however, tohinder precise faunal monitoring, and thereby therecording of long-term changes in abundance.Light-trapping measures are dependent on mothbehaviour and local flight variables (see Southwood,1978; Bowden, 1982), and such data have twonumerical weaknesses: catches are not unit-area
samples; and sampling bias is always present andseldom constant. To minimise these weaknesses andaddress the biases of continuous removal sampling(when population size itself is repeatedly modified byremovals), a 3-point light-trapping methodology hasbeen adopted:
probability theory is used to prescribe an optimalinterval between samples (based on adultlongevities) so that each sample in a series isdrawn from population cohorts unmodified byprevious removals (White, 1988, discontinuoussampling); sampling-area variability between sitesand trapping occasions is minimised (as far aspractical) by a 360° field of non-obstructed trapvisibility to a distance of potential flight response(up to 700 m; Bowden, 1982); an a posteriorimethod is used to standardise samples for thecollective impacts of weather variables (primarilywind), based on the serial sample compositionsof different flight classes of moth.
MethodsThe study area is a montane short-tussock grasslandin the Cass Basin, Waimakariri River catchment,South Island (Figs. 1, 2). Climate is described byGreenland (1977). At Cass Field Station, 566m a.s.l.a mean annual rainfall of 1300 mm (1918-1965) isuniformly distributed throughout the year, and typicalmonthly mean air temperatures range from 1.6oC
New Zealand Journal of Ecology (1991) 15(1): 5-22 ©New Zealand Ecological Society

6 NEW ZEALAND JOURNAL OF ECOLOGY, VOL. 15, NO. 1, 1991
Figure 1: Study area location south of Waimakariri River,
South Island, New Zealand.
(July) to 15.7∞C (February). Frosts can occur in allmonths and weather patterns are dominated bynorth-westerly rain-bearing or desiccating fˆhn-likewinds. Snow lies for some days each winter and thesurrounding mountains feature a winter snowline at1200-1400 m a.s.l. at midslope.
The study had two phases, 1961-63 and 1987-89,and two light-trapping sites, Ribbonwood Fan (site R)and Mt Sugarloaf Fan (site S). The sites are 4 kmapart, and each is marked by a 7 cm tall woodensurvey peg inscribed 'W62'. Respective grid referencesare 234124 and 234169 (NZMS1, S66). The site R pegis 65m approximately from a local supply power pole(towards the grid power line); and site S is 360mapproximately from the smaller laboratory of the CassField Station, and 20m above the present ChiltonValley vehicle track. The latter peg marks the 1987-89site only, but is close to the 1961-63 site (notre-located, but probably within ± 20m upslope and ±5m across slope).
Sites Rand S both lie on 5-10∞ slopes withinlarge debris flow fans; respective aspects are 340∞ and235∞, with traps at altitudes of 640m and 610m a.s.l.Both fans have been grazed by sheep since settlementin the late 1850s, and sheep numbers in the regionpeaked at 92 000 in 1895 and then fell to two-thirdsby 1919 ("Grasmere" data in Cumberland, 1944;Scott, Dick and Hunter, 1988). Stocking rates wereespecially high during snow periods at higher
altitudes. More recently, site management historieshave diverged.
Site R was accidentally burnt in January, 1956.Within 6 months it was topdressed and oversownwith white clover (Trifolium repens L), alsike (T.hybridum L) and Montgomery red clover (T. pratenseL), and was thereafter managed more intensively(including increased numbers of cattle), with 2- or3-yearly topdressings and light clover oversowingsuntil the mid-1970s (D. and I. McLeod, pers. comm.).Traditional set-stocking became mob-stocking throughthe 19805 (after cattle removal) because of increases inbrowntop from the late 1970s, but reverted toset-stocking in 1987 with the removal of most stockthroughout the moth-trapping period. An increase ofrank sward followed. There was one topdressing inthe mid-1980s (D. Harcourt, pers. comm.).
Site S was grazed in early years by sheep, and inthe winter, by cattle (Malcolm, 1925), but there havebeen low stocking rates of sheep (and seldom anycattle) from about 1930. Recovery from an accidentalfire in 1947 was slow (Burrows, 1977, p. 207) andthere has never been topdressing or oversowing.
Early series of vegetation analyses exist for site R(unpublished North Canterbury Catchment Boardannual records, February 1957-62), and for site S(Malcolm, 1925; Burrows, 1977). Site S was againassessed in February 1988 (Shanks et al., 1990), andboth sites in February 1990 (present study). The 1990analysis re-surveyed 5 chains (100.6m) of the 1957-62transect at site R (grid reference 238118), using theoriginal point analysis method at 10-inch centres(25.4cm) and recording the basal node of the plantnearest to the needle point at ground level. The samemethod was used at site S on a 120m transect fromthe survey peg, in the direction of Chilton Valley atthe apex of the fan (lower slopes shown Fig. 2B). Themethod emphasises species ground-cover rather thanspecies mass.
TrappingLight trapping at both sites was as far as possibleidentical in the two study periods. Robinson lighttraps (Fig. 2) with 60W 12V tungsten opaque lampswere positioned to give 360∞ visibility at each site,interrupted only by distant topography. Over onequadrant, local topography created interruption zonesbeyond 150m, but these were near ground level only.There were no competing light sources, and trapswere operated for 3 hours from dusk, using battery ormains power. The effective cross-section area ofbaffles above the rim-line of the cone was 1000 cm2 x2 faces, including the lamp but excluding areasvertically beyond the 37.5cm rim diameter (1961-63design). Baffle dimensions (but not cross-sectionalareas) varied slightly between traps, and lamp

WHITE: CHANGES IN GRASSLAND MOTH ABUNDANCE 7
Figure 2: (A) Ribbonwood Fan site R in February. 1963. (B)
Mt Sugarloaf Fan site S in March(?) 1988; note scattered
Cassinia bushes.
elevation above the rim was comparable on traps ofboth study periods. Trapping was timed by automaticdevices or manually, and both sites could be sampledsimultaneously if desired.
In 1961-63, the collecting compartment wasbelow ground and contained potassium cyanidecrystals (KCN) in a protective chamber (White, I 964b;Southwood, 1978, Fig. 7.11). In 1981-89, the collectingcompartment was above ground and the trap moreelevated (mean sward heights were greater than in1961-63). The safer substitute for KCN wasDichlorvos 200g Kg-1 in the form of Shell 'Vapona'or 'Black Flag' pest strips. Two strips were placed inthe compartment 1 hour before trapping, in additionto strips of paper sprayed with a pyrethroid contactinsecticide 'Slay' (tetramethrin 3.3g 1-1, d-phenothrinO.8g 1-1, piperonyl butoxide 7.7g 1-1 in aerosol form).Although 1987-89 knockdown time was slower thanwith the earlier KCN, observation of moth behavioursuggested a comparable capture efficiency. Mothsalighting on baffles (like those impacting, entering andre-entering) tended to sink lower into the trap after
increasing exposure time to Dichlorvos emissionsfrom below.
Trapping nights were selected according toelapsed time since last sample, operator availability,weather suitability and degree of vegetation wetness(dry conditions being preferred). On-site winds duringthe hour to dusk usually controlled the final choice ofnight, and sampling was at times terminated if flightconditions later deteriorated.
The sampling frequency target (White, 1989) wasone representative sample every 14 days, with aminimum interval of 10 days and preferred upperlimit of 18 days (based on a literature review of mothlongevities, W.E. Miller, pers. comm.). When possible,sampling was repeated within three nights if flightconditions seriously limited a catch (see 'Dataanalysis'). Interference by cattle and automationfailures shortened the site R sequences in 1961-63, anda substitution of spring 1989 sampling was made atsite S for the absence of spring 1988 data (Table 1).Species abundances in the two Novembers wereclosely matching.
For future reference, nearly all voucher specimensof moth species recorded in the study are deposited inthe Entomology Department collection, LincolnUniversity. The remaining few are held in the NewZealand Arthropod Collection.
Data analysis
Given an exposed montane environment in whichwind velocities may fluctuate widely by the minuteand shift dramatically by the hour. moth flightconditions are at times very changeable across a 3 htrapping period. Species catches, therefore, appear notonly to be a function of wind velocity relative tomoth size and manner of flight (e.g.. Mizutani, 1984).but also of lag-time thresholds under pulsing flightconditions. Non-continuous wind records thereby failto explain flight potentials over such periods. andcontinuous data were unavailable.
Catches themselves provide biological indicatorsof wind influence a posteriori. and data series werescreened to select the samples representing theleast-limiting sampling ocr.asions (i.e.. those nearest tounit-area samples; see 'Introduction'). Three screeningcriteria were adopted.
Sample compositionThree flight classes were recognised. and observationof body size x sample composition over many sampleswas used to assign every species to a class:'heavy fliers' (typically Hepialidae and Noctuidae)
were the faster-flying species. and the last to remainactive with increasing wind velocities (class A);
'medium fliers' (primarily most Crambidae andGeometridae, with some Oecophoridae andTortricidae) had intermediate flight powers and

8 NEW ZEALAND JOURNAL OF ECOLOGY, VOL.15, NO.1, 1991
Table 1: Site sampling dates and statistics for each flight year1. The more favourable sampling periods are standardised(according to flight class) by a sample index of 1.00 (see text).1Statistics are in part influenced by weather differences between flight-years:1961-62 - all seasons mild; rather dry August-April; hot summer; sampling nights often quite windy;1962-63 - very wet October; dry but cool summer; greater sampling frequency of less windy nights;1987-88 - very wet, cool and windy year; delayed spring; cold autumn nights; suitable sampling nights often widely spaced;1988-89 - all seasons mild; dry, warm summer; higher frequency of suitable sampling nights than other years;1989 - spring - mild; dry; sampling frequency as 1988-89.
Ribbonwood Fan (R) Mt Sugarloaf Fan (S)Flight year
(1961-)62 1962-63 1981-88 1988-89 Total 1961-62 1962-63 1981-88 1988-89 1989(-90) TotalTrapping dates: start 16 Jan 16 Nov 8 Dec 11 Nov 1 Dec 14 Sep 11 Nov 11 Nov 16 Sep
finish 21 Apr 21 Mar 26Apr 16 May 16 May 21 Mar 26 Apr 11 May 25 Nov
No. of sampling periods 8 9 8 13 38 13 14 10 14 5 56
No. of samples 9 11 9 18 47 19 20 17 23 5 84
No. of periods indexed 1.00
*Heavy fliers (class A) 4 6 8 11 29 8 7 8 13 36*Medium fliers (class B) 4 4 3 10 21 4 5 4 12 25*Light fliers (class C) 4 4 2 8 18 3 4 2 10 19
body size, and remained active in light breezes(class B). Class B moths were frequently sampledwith class A moths when light breezes persisted forthe full sampling duration or were intermittentbetween windier conditions;
'light fliers' (small moths in a wide range of families)were only sampled with larger species in conditionsof faint breezes or calm (class C).
All samples were screened by classes using a 3-stepscale of trapping success (relative to time of year):
class well represented / sub-standard / absent.
Sampling conditionsAll available information was related to each sample.This included general observations of weather (windpatterns, temperatures, precipitation, moonlight, cloudcover and darkness), screen temperatures (onoccasions), vegetation dampness over the duration ofa sample, and the abundance of other 'class C'micro-insects in the sample and/or at the light. Wherethe joint evidence of the 3-step scaling (above) and theprevailing conditions suggested a favourable samplingof moth classes B and/or C, it was also concludedthat the heavier classes A and/or B were favourablysampled, regardless of their moth numbers. Eachmoth class in the sample was then ranked on thefollowing scale of trapping standards:
ideal/good / good in part / reasonable / fair /poor/failed
where 'ideal' and 'good' represent (respectively) noknown limitations and low-impact limitations over 3h;'good in part' is their equivalent over a partialduration of less than 3h; and 'reasonable' to 'failed'refers to limiting flight conditions of increasingseverity and/or duration.
Class weighting factors for sub-standard samplesWeighting factors were then derived for each class ina sample to standardise class relativities between
sampling periods (in periods of repeated sampling, the'3 h sample' comprised the highest single count foreach species in order to retain maximal informationfor the period). The classes were indexed in threesteps:
a) samples scaled 'ideal' - these were indexed 1.00;b) samples scaled 'good' or 'good in part' - thesewere indexed 1.00 only if the plotted sample wouldfurther maximise or extend the line joiningconsecutive plots in step (a) above; e.g., four plotsin Fig. 3B are 'ideal' and two plots (16 November,17 December) extend the line over time;c) all remaining samples - each was multiplied by aweighting factor to match the combined graph ofsteps (a) and (b) (e.g., Fig. 3B shows indices of2.24 and 2.0 I), and the index was accepted asrobust if its value did not exceed 3.00 (Classes Aand C) or 3.50 (Class B).All weighting factors were determined on the
basis of total sample size, by classes, but are appliedto individual species counts within classes.Non-accepted samples were rejected as measures ofstandardised abundance, but could be cited inevidence of species absence before and after the flightspans as identified by the accepted samples. Table 1lists numbers of samples indexed 1.00, and thedifference between these counts and the total numberof sampling periods (same column, top row)represents the maximum number of indices greaterthan 1.00. In most sequences, rejected samplesreduced this number; e.g., Fig. 3B includes only eightsamples of the nine listed in Table 1 (site R, 1962-63)and both graph and table show there to be six class Aplots indexed 1.00. The performance of the screeningprocedure identified closely with observed conditions,weighting or rejecting nights of prolonged moonlight,low temperatures and unfavourable winds.

WHITE: CHANGES IN GRASSLAND MOTH ABUNDANCE9
Figure 3: Class A moth flight periods. (A) Bimodality of
Noctuidae alone as a composite of ideal nights for 2 sites x 3
flight years. (B) Indexing of all class A species at site R in1962-1963. showing six ideal nights and two extrapolated
indices (see text).
The independence of serial samples (when mothsindividually are shorter-lived than sampling intervals)means that estimates of abundance are unbiased bymoth removals. Thus discontinuous removal samplingand data standardisation jointly compensate for majorsources of sampling variability across speciesphenologies. The measured population is a sub-set ofthe full population, and comprises its trappablemembers only. These members are those responsive tothe light source under 'ideal' trapping conditions ifsuch were to be always attained, i.e., from throughouteach species' maximised trapping range.(undefined butsite-specific; White 1989). Graphs of indexed samplesare the standardised estimates of moth frequencies xtime, and define non-disrupted phenologydistributions. Hence the integration of a species graph(i.e., the area under a graph) accounts for alltrappable individuals, including .uncaught membersthat are present on non-trapping nights. White (1989)defines the graph area as 'moth-nights', wheremoth-nights = generation numbers x naturallongevities. Should a species include individuals that
are longer-lived than sampling intervals, the benefit ofpseudo-independent samples is still a gain. White(1988, Fig 1) contrasts the outcomes of disruptive andnon-disruptive sampling based on probability theory.
Results
Moth abundance (non-standardised)
Table 2 presents summary trapping statistics. Thetotals exclude a further 39 moth species (see White,1964a), plus five 1987-89 species (Asaphodes aegrota(Butler), Austrocidaria arenosa (Howes), Heterocrossamorbida (Meyrick), Orocrambus catacaustus (Meyrick),O. corruptus (Butler)) recorded beyond the range ofthe two light traps or not attracted to light.
Appendix I lists species trapping records byfamilies (after Dugdale, 1988) and flight-classes. Directcomparisons are merited within the majority ofspecies as each study period had similar samplingspans apart from later autumn sampling in the finalyear (Table 1). Species clearly under-represented bylesser sampling effort are indicated by italicisednumerals or captioned notations; e.g., if sampling wasomitted, limiting or delayed over critical periods in aspecies' phenology. Most spring-occurring species aredirectly comparable for only one year per studyperiod (Table 1).
Known larval foods are cited if recorded invegetation analyses of the two sites (Appendix 2) orlisted locally (Burrows, 1977). Estimates of minimumdistances from very localised foods to a light-trap(Appendix I) are based on direct observations and donot imply that a food or habitat type is common orwidespread. In some instances only single patches arepresent, such as aquatic herbs within riparian stripsand two small Nothofagus forest patches at site S,greater than 300m from the trap. In other instances,no positive recording was made and therefore theminimum distances represent the limits of searching.Estimated distances are not intended as statements ofmoth response distances to light, and larval foodcitations are drawn from the 20 asterisked references,from specimen records in the New ZealandArthropod Collection, J.S. Dugdale pers. comm., orfrom B.H. Patrick pers. comm.
The important note of Appendix 2 emphasisesdifferences in vegetation analyses. With the possibleexception of Method V, no method was appliedextensively enough to fully represent species diversity.In the grasses sampled in 1990, 'other species' referswholly to the adventive Festuca rubra L. It is notlisted separately to avoid confusion with Appendix Irefcrenccs to endemic Festuca species (principally F.novae-zelandiae Ckn.). In Method 1, note that 0.3%,numerical cover for Festuca represents 15.2 tussocksm-2 (where total species = 4366 plants m-2). An

10 NEW ZEALAND JOURNAL OF ECOLOGY, VOL. 15, NO. 1, 1991
Table 2: Comparison of trapping records over the two study periods.* = some species in common to both periods.
No. of moths trappedNo. of species trappedNo. of species recorded in one period onlyNo. of species recorded at one site onlyNo. of species recorded with only 1 moth period-.No. of species with nearest food plants
>300 m from light
Total
44606202
908156
41
1961-63
31032153* 41 43* 29*
25*
1987-89
13574160* 49 55* 40*
30*
Change
-56%+5%
+20% +28% +38%
+20%
overall decrease of 56% in moth numbers between thetwo study periods (Table 2) does not occur uniformlyacross taxa. Contingency table analyses of Appendix 1subtotals against collective residual totals (sitescombined within periods) further indicates significantproportional declines in Geometridae, Crambidae -Crambinae and Scopariinae - and in Noctuidae whenTmetolophota spp. are excluded (X2=77.6, 4683.9,623.7,417.4 respectively, P<0.005, df=1).Tmetolophota spp. are excluded because, collectively,they increase rather than decline, and the proportionalchange in their abundance is even more significant(X2=8906.0). A few species are dominant in thesechanges, viz. Helastia corcularia (Geometridae),Orocrambus cyclopicus, 0. vittellus, Eudoniasubmarginalis (Crambidae), Graphania mutans andTmetolophota propria (Noctuidae). Two other notabledeclines are Coleophora trifolii (Coleophoridae) andCapua semiferana (Tortricidae), and many lessabundant species also conform to this overall trend.
The decline does not appear to be an artifact ofsampling or chance variability between study periods.The 1988-89 flight year had the greatest samplingeffort, and between-year variability across the 4trap-years of each study period (2 sites x 2 flightyears) was seldom great. Strongly differential changesamong taxa (above) discount any suggestion of lesseffective killing agents in 1987-89, and it is unlikelythat broad-spectrum pathogens and predators couldaccount for the observed mix of site similarities anddifferences at species levels. The predatory adventivewasps Vespula germanica (F.) and V. vulgaris (L.) arenot present.
Despite declining abundance, Table 2 indicatesthat species richness has not lessened (row 2) even ifspecies composition appears changed (row 3). Tworecent adventives were present in 1987-89, Leucopteraspartifoliella (Lyonetiidae) and Chloroclystis filata(Geometridae) but no other 1987-89 species can beaffirmed as definitely absent in 1961-63. A goodexample is Eudonia luminatrix (Crambidae), known in1961-63 only from a forest margin, its traditionallyrecognised habitat, but now strongly intrusive at bothgrassland sites (site R is 1.2 km from the nearestforest). Seven other non-adventive species recorded at
both sites for the first time in 1987-89 were Anisoplacan.sp. (Gelechiidae), Leptocroca sp. (Oecophoridae),Bactra noteraula (Tortricidae), Eudonia octophora(Crambidae), Helastia cymozeucta, H. expolita andHydriomena purpurifera (Geometridae). Some of the15 species no longer evident at either site in 1987-89are cited later (see 'Trends in abundance'). Otherspecies making up row 3 (Table 2) are known fromone site only and from few specimens. Rows 4 and 5present statistics for low-frequency species, and mostof these data are fully independent. Thus in row 4, 59species were recorded exclusively at one or other siteand in only one or other period (excluding specieswithout adequate sampling at site R), and 50 of thesespecies also belonged to the grouping listed in row 5.Contingency table analyses of both sub-sets, 2 periodsx 2 sites for 59 species and 50 species, shownon-significance (X2 = 0.798, 0.363 respectively, df =1). Because the sub-sets account for two-thirds of allspecies in the groupings of rows 3-6, the very low X2
values infer that none of the % species changes inTable 2 can be significant. The greater number of1987-89 species might only reflect increased samplingeffort, and both study periods undoubtedly hadnon-recorded scarce species.
Thus species richness has been maintained over26 years (Table 2, row 2) despite apparent shifts in thefaunal composition of scarcer species, and a fall inmoth abundance (row 1). The fall itself is highlysignificant between sites (test of Appendix I grandtotals), with the proportional decline at site Rexceeding site S (X2=44.38, P<0.005, df=l; X2=479.8when Tmetolophota spp. are removed). A lesser site Rdifference is shown when moth totals are tested forspecies caught in one period only (X2=6.26, P<0.025).
In seeking an explanation for these changes, it isimportant to note that both of the sites and theirsurrounding grasslands and shrublands have remainedextensive and essentially non-fragmented since the firststudy period.
Trends in abundance (standardised)
An example of standardised faunal phenologies (Fig.3A) shows a strong bimodality of class A moths inNoctuidae, the dominant family in this class. Six data

WHITE: CHANGES IN GRASSLAND MOTH ABUNDANCE 1l
sets are superimposed (2 sites x 3 flight years) to showthe 49 samples with index 1.00 (= class A summationin Table 1, excepting 1987-88 because the delayedspring moved the earlier modality to the right,narrowing the normal January trough). While somespecies are bimodal, most fly within one modalityalone. In contrast, the standardised abundance ofclass B moths (dominated by Crambidae, flyingNovember to March) shows a unimodal peak towardslate February. Unlike Noctuidae above, the annualpattern is dependent on relative species abundancesrather than on inherent biology. Class C phenologypatterns from October to March are without anyconsistent peaks (taxa are diverse), and good data arefewer because flight is so wind-restricted.
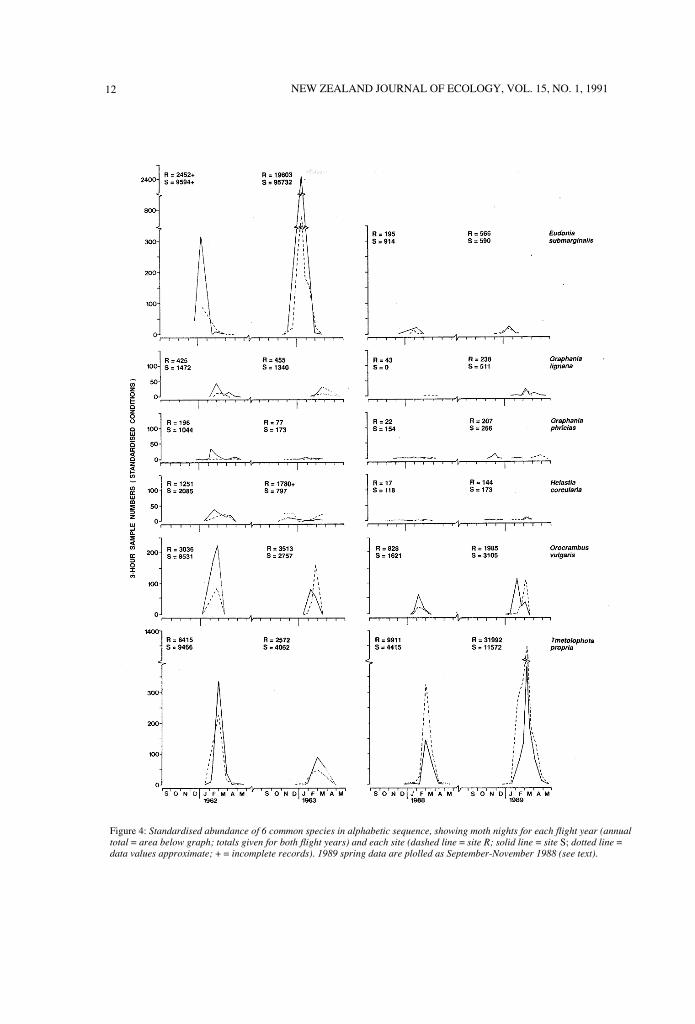
Figure 4 illustrates standardised abundance datafor 6 species, and the 2-year summations may bedirectly compared with the trapping records for eachstudy period in Appendix 1. Such comparisonsdemonstrate that trapping records do not alwaysreflect the relative abundances obtained by datastandardisation. For example, by summingTmetolophota propria moth-nights (Fig. 4) to matchthe column sequence from left to right of "Numberstrapped" in Appendix I data, the raw data ratio(1 :8:2:3) is halved by standardisation (l :4: 1: 1.5).Similar shifts of -50% to +100% over one, two orthree ratio values in other Fig. 4 species point tosome sizeable changes in site and trapping periodrelativities. Because such trapping period comparisonsare based on the means of 2-year summations,standardised comparisons between individual yearsinclude shifts exceeding -50% and + 100% in someyears.
All species are open to sizeable shifts bystandardisation because the same serial catches over atime continuum of variable trapping conditions canbe phased differently for different species, eachresponding in its own way to the continuum variables.Hence, while one peak coincides with an 'ideal'trapping sample, another species' peak may coincidewith a sub-standard sample and be substantiallyweighted by an index> 1.00. Figure 4 includes specieswith the greatest shifts based on 2-year summations. .
Table 3: Changes in abundance of 40 common species from1961-63 to 1987-89 grouped according to feedingcategories. Percentages are based on moth-nights.
Site R Site S
Known grass feeders (n= 14) -74% -56%
Known herb feeders (n=8) -88% -84%Shrub feeders (n=2) and unknown -72% -82%
(n= 16)Mean (n=40) -74% -70%
Table 3 presents an analysis of standardisedspecies abundance according to major feedingcategories (see Appendix I for specific known foods).The 40 species account for 96.8% of all site R mothsand 93.4% of site S, and their respective declines of74% and 70% (n=40) contrast with the earliernon-standardised mean of 56% (Table 2, 100%samples). The additional margin of 14-18% isattributable to data standardisation.
A log-linear model analysis of moth-nights forthe three-way table (Fienberg, 1980), sites x studyperiods x feeding classes, shows first- andsecond-order interactions to be highly significant(P<0.0001). Of the first-order interactions, site xfeeding class contributed most to the deviance, andthe largest contribution was by the grass feeders(Table 3, row 1), including five Orocrambus spp. (O.cydopicus, O flexuosellus, O. ramosellus, O. vittellus,O. vulgaris). Row 3 species, including shrub feeders(n=2), also contributed strongly and could includefurther species of all three feeding classes. The leastcontribution to the deviance (but the greatest changebetween study periods) is observed for herb feeders(row 2).
When Table 3 and Appendix 2 are takentogether, long-term increases in % grass compositionreaching 93% (site R) and 71% (site S) by 1990 showa highly negative correlation with observed decreasesin grass feeders. Although site S grass feeders declinedless, this site retains a moderate abundance ofendemic herb species despite their strong decline from1972 (Method V, Appendix 2; note the species thatwere not recorded subsequently). In contrast, onlyadventive herbs are now conspicuous at site R(cspecially clover species), and % herb cover is onlyone-third of the site S level.
Of the 40 species, the known herb feeders areAludonia cataxesta, Graphania mutans, Helastiacorcularia and Hydriomena deltoidata. Three haveseemingly disappeared (Appendix 1) along with othergrassl~nd species known to be herb feeders(Orocrambus xanthogrammus, Scopula rubraria andAletia cuneata) or known to be likely so (Kiwaiaschematica). Thus at least half of the 15 non-recordedspecies of 1987-89 are herb feeders.
Of shrub feeders and forest species (Appendix I),Harmologa spp. (Tortricidae) have increased inabundance with their food plant Discaria, butMnesictcna flavidalis (Crambidae) and the winter mothZermizinga indocilisaria (Geometridae) have noticeablydecreased. At site S, fewer Graphania homosda(Noctuidae) were recorded than in 1961-63, yet theknown food plant Cassinia is surely increasing (c.f.site R). Of forest' species, the most notable 1987-89absence was the noctuid Meterana dotata, and hereinis a caution that faunal diversity changes in extensive
12 NEW ZEALAND JOURNAL OF ECOLOGY, VOL. 15, NO. 1, 1991
Figure 4: Standardised abundance of 6 common species in alphabetic sequence, showing moth nights for each flight year (annual
total = area below graph; totals given for both flight years) and each site (dashed line = site R; solid line = site S; dotted line =data values approximate; + = incomplete records). 1989 spring data are plolled as September-November 1988 (see text).

13
grasslands may in part represent changes in adjacentvegetation (note distances greater than 1 km tonearest known food sources, Appendix 1).
Longer-term evidence of grassland faunal trendsis given in Fig. 5. The observations of Hilgendorf(1918) and Dick (1940) in the environs of site S areindexed against present site S data, assuming thatfaunal abundance in 1917 and 1939 equalled (ratherthan exceeded) 1961-63 abundance. This assumption isbelieved to be highly conservative and an exampleillustrates the conversion of 1939 data (collected inlate February; R.D. Dick, pers. comm.) from a 1-5scale to 1961-63 light-trap equivalents. Species withFebruary phenologies were present in 1962 and 1963catches as follows (summed by families, figuresrounded):
Geometridae 200Noctuidae 2700Crambidae 4750Of the 4750 Crambidae specimens, 3190 were
Orocrambus vittellus, and of these, late February 3 hcatches (one in each year) totalled 1650 moths ( x = 825,Fig. 5). Corresponding moth numbers for 1939 wereapproximated by allocating 4750 crambids (seeassumption above) among the three site S specieswhich Dick recorded. The allocations, adjusted forphenological timing, were based on an indexing of his1-5 scaling for each family against a 1:7:15 familyweighting (Geometridae:Noctuidae:Crambidae)derived from the 1961-63 trapping ratios (Appendix1). Thus, by adopting an expanded 1-15 scale for thecrambids, the first species, O. vittellus, was estimatedas 15/31 of the crambid total (where 31 equals thesummation of the values for the three species on theexpanded scale), and a 1939 '3 h catch' as
4750 x 15 1650
31 2 x 3190
= 594 moths (Fig.5)
Figure 5: Site S trends in the abundance of some late-summer
species projected over 50 to 70 years (see text for
assumptions). The 1917 projections are based on an
interpretation of non-quantitative data. The arrow refers to the
fire of 1947.
WHITE: CHANGES IN GRASSLAND MOTH ABUNDANCE
In this way, 50- and 70-year trends oflate-summer species were plotted as mean seasonalindices of abundance, using assumed familyabundances pre-1961. In Crambidae, the large declinesin Orocrambus flexuosellus and O. 'simplex' (=O.lewisi/O. ordishi complex, Appendix 1) may be anoutcome of the 1947 fire, but fire impacts on anygiven species are unknown (d. site R after the 1956fire). Two patterns are evident among the grassmoths: major early declines have occurred in somespecies while others (O. vittellus, O. vulgaris, andprobably O. cyclopicus, not shown) have morerecently peaked and declined. The majority of species,however, emphasise earlier declines, even if some 1917observations include taxonomic errors; e.g.,Hilgendorf did not record O. vittellus (not necessarily

14 NEW ZEALAND JOURNAL OF ECOLOGY, VOL. 15, NO.1, 1991
an error - see species above with peaking abundance)and his Venusia undosata = Asaphodes abrogata (seeWhite, 1987). The prolonged decline of known herbfeeders is pronounced (note geometrid species andGraphania mutans, though less so for Aletia moderata),and is paralleled by many grass feeders (the fourcrambid species of 1917 and the noctuids Persectaniaaversa, Tmetolophota atristriga and Agrotis ipsilonaneituma). The notable exception is T. propria,adapting well to dominantly grassed swards (also Fig.4, site R).
Discussion
The fauna-sward dynamic
The local record of sward changes (Appendix 2) fitsin a long-term context of spreading adventive species(Dobson, 1977). Detailed descriptions of habitatassociations in the Cass district (Cockayne andFoweraker, 1915; Burrows, 1977) amplify thequantitative grassland record of the region (Sewell,1947; Wilton, 1948; Moffat, 1957; Rose, 1983; Scott etal., 1988). A dominant species in widespread change isAgrostis capillaris, not recorded at site S in 1925, butnoted nearby by 1944 and by the 1970s a dominantinter-tussock species (Dobson, 1977). Since that timethe increase has been dramatic (Appendix 2, bothsites; also see 'Methods'), and given the rhizomatoushabit, few localised patches now remain without itssmothering dominance. The 70% Agrostis frequencyrecorded in 1972 (Appendix 2, Method V) hadreached 99%+ by 1990 (visual assessment). In earlierstages of invasion, the inter-tussock sward remainsopen (see Fig. 2A) but in later dominant stages, thereis a heavy reduction in endemic species, especiallyherbs.
Qualitative changes in grasses, e.g., shifts in theapparent vitality of Festuca swards, offer at best apartial explanation for decreases in grass feeders(Table 3, Fig. 5). Disappearance of the semi-moribundtussocks of 1961-63 (site S) may reflect a gradual lossof larval habitat and food quality/diversity during thewidespread decline of F. novae-zelandiae over 30+years (see Scott et al., 1988). Explanations of diseaseand predation have been discounted (see 'Mothabundance') and climate changes can only be small.By induction, it would appear that there is only oneadequate hypothesis to explain observed declines: fewof the common endemic grassland moths can surviveas oligophages, most depending rather on feedingdiversity as obligate polyphages (e.g., see White, 1978,p. 39). In support (Appendix 1), it is significant tonote that species known to feed on Agrostis (Wiseanamimica (Hepialidae); Orocrambus enchophorus, O.flexuosellus, O. vittellus (Crambidae); and Persectaniaaversa (Noctuidae)) have themselves declined.
Enforced browntop monophagy is not theiradaptation for survival (d. endemic monophagy;Dugdale, 1975). Nor does the observed maintenanceof moth species diversity (despite heavily reduced herbpopulations) fit a classic explanation of faunal declinewith losses of specialist feeders. Scarce moth species,some almost certainly 'specialists', have survivedwithout apparent change to their abundance whilepopulations of common 'generalist' feeders (notepolyphagy, Appendix 1) have collapsed.
An explanation is seen to lie in the dynamics ofplant invasions and the statistics of plant abundancefrequency distributions (e.g., see Hengeveld, 1989).Heavy invasions of Agrostis depress the densities ofmost pre-invasion plant species. The emergingAgrostis/grass dominance has been further aided byother 'disturbance' factors at site R (a regime ofoversowing and topdressing) lowering many herbfrequencies toward zero. At site S, in contrast, nomajor secondary disturbances have been evident, andfew if any herbs are likely to have reached zeroabundance. Here, both specialist and generalist feedersmay still find their food plants (even if scarce) andsurvive.
An explanation of the general collapse ofcommon moth species is therefore suggested asfollows. With increasing food scarcity, the searchingranges of feeding polyphagous larvae are increasinglyextended to locate adequate food mixes (at times'concealed' among the invasive plants), whereasfood-specific larvae need only remain with locatedfood-plants. Polyphagy (especially if obligate in theabove sense of precluding enforced oligophagy ormonophagy) may therefore ultimately become aliability with the progress of plant invasions, leadingto the collapse of many generalist moth species.Specialists, on the other hand, remain more directlylimited by food supplies per se than by proximitiesbetween food plants, and their relative abundancesmay be sustained for longer.
The roles of other fauna are also relevant here.Lord (1990) has demonstrated the selective impact ofstock grazing (principally sheep) on the floristiccomposition of a semi-natural short-tussock grassland.A cessation of grazing promotes fewer sward species(indigenous and adventive) but higher adventive cover.Many surviving indigenous species tend to decrease inabundance, and a few adventive species assumedominance.
The permanently low sheep numbers at site Shave long favoured trends in this direction, andthereby exert an indirect but strong influence on theavailability of food plants for the endemic mothfauna. Adventive grasses are best contained byadventive animals, as illustrated by mob-stockingmanagement at site R in the early 1980s (see'Methods'). Yet domestic stock may not be the sole

WHITE: CHANGES IN GRASSLAND MOTH ABUNDANCE 15
adventive agents of browntop management, therein'assisting' the moth fauna. At site S, scatteredvegetation patches of 1-3m2, with well-definedmargins, are without rank Agrostis and offer a greaterfrequency of low herbs and low shrubs than insurrounding rank areas (visual assessment). Harefaecal pellets are frequently conspicuous in these 'haregardens', and similar open patches are found withCanada goose pellets. (Rabbits are not present.)Faecal cuticle analysis of small random samples(recent pellets taken in February 1989) showed a highfrequency of Agrostis: hares - 62% of cuticlefrequencies; Canada geese - 100%. The seasonalterritoriality of such herbivores at site S, also given anincrease in sheep numbers, might yet act as a residualbuffer against total Agrostis dominance and thepervasive losses of Lepidoptera foods.
ConservationInvasive Agrostis is widespread in many low-tussockmontane grasslands and study findings point to fourconclusions pertinent to conservation:a) ongoing vegetation changes are directly modifying
the prevalence of the endemic moth fauna;b) more intensive pastoralism, as at site R, hastens
the changes;c) the more abundant moth species are in general the
first to be noticeably affected by changingvegetation composition when invasive swardspecies displace endemic species;
d) the increasing scarcity of some endemic food-plants, and especially of herbs, ultimately implies species loss to local faunas dependent on them.
The conclusions confirm and amplify earlierevidence and conservation theory drawn from tussockgrassland insects (White, 1987). Three of the fourearlier conclusions on conservation management aredirectly endorsed by this study, whereby:a) monitoring of common species is shown to give
early signals (and more sensitive measures) of possible shifts in the abundances of scarce species;
b) a goal of maintaining systems rather than scarce species is shown to favour species' chances of survival while species-specific knowledge ofmanagement requirements remains uncertain;
c) a changing species abundance (and ultimately the risk of local extinction) is shown to be unrelated to scarcity status per se, but rather to habitat changes that select between survival strategies (such as monophagy verSus oligophagy versus polyphagy).
From current evidence, a further managementconclusion is also offered: conservation managementshould draw on the impacts of all grazing animals forthe better management of conserved species or ofendemic local faunas.
Some herbs have been all but lost fromgrasslands through selective grazing in the historicpast. Those losses cannot be now redeemed. But otherherbs in induced Agrostis swards may yet be retainedby direct management in specific habitats ofconservation interest. The prime objective is tooptimise the grazing of Agrostis (to keep the swardopen) while limiting other losses due to theover-grazing of endemic species.
Note that an opposite conclusion (maximumprotection against all grazing) may be equally validfor other grassland types and for other invadingspecies, e.g., Hieracium in some tall-tussock grasslands(Treskonova, 1991). The controlling processes ofecosystem change must be specifically characterisedbefore conservation management initiatives can beclarified.
Improved Agrostis management at the two studysites (and especially site S) would favour futureretention of current species-richness in the mothfauna. Unless new disturbances or site fragmentationpose earlier threats, another sampling of the long-termfaunal record by 2010 appears warranted, and thepotential value of re-sampling within 10 years mightbe considered, taking full account of elapsed changesin Agrostis dominance. The results of simplevegetation monitoring might thus become the primebasis for decisions on critical faunal sampling.
AcknowledgementsThis paper is dedicated to R.D. (Doug) Dick, whosemoth observations of 1939 afford today'skaleidoscope across time.
Over both phases of the study, thanks areexpressed to the Plant and Microbial SciencesDepartment, University of Canterbury, for use of theCass Field Station, the runholders of 'Grasmere'Station for their co-operation, and the Miss E.L.Hellaby Indigenous Grasslands Research Trust forfunding field work in 1961-63 and granting 1990assistance towards publication. In the second studyphase, the Protected Natural Areas Programme teamat Cass assisted with 1987-88 sampling (StephenPhillipson, Jenny Steven), and the Centre forResource Management, Lincoln University, fundedfield work and provided work facilities.
Numerous others have given invaluable help,including John Dugdale, Carol Muir, Brian Patrick(moth curation and taxonomy), Alister Robertson,Alister Suren (field samples), Jim Stone (vegetationanalysis), Joy Talbot (faecal cuticle analysis), Dr DickSed cole (log-linear analysis), Kim Pemberton (figures),Carmel Edlin and Shona Wilson (word processing).Editorial and referees' comments led to helpfulclarifications of the text.

16 NEW ZEALAND JOURNAL OF ECOLOGY, VOL. 15, NO. 1, 1991
References* = reference source for the listing of known larval
foods in Appendix 1.Allan, H.H. 1982. Flora of New Zealand. Vol. 1.
Indigenous Tracheophyta. Government Printer,Wellington, New Zealand. 1085 pp.
*Anon, 1985 (unpublished). Entomological survey ofthe Garvie Mountains. Otago section of theEntomological Society of New Zealand, Inc,Dunedin. 31 pp.
*Barratt, B.I.P.; Patrick, R.H. 1987. Insects of snowtussock grassland on the East Otago Plateau.New Zealand Entomologist 10: 69-98.
Bowden, J. 1982. An analysis of factors affectingcatches of insects in light-traps. Bulletin ofEntomological Research 72: 535-556.
Burrows, C.J. 1977. Cass: History and science in theCass district, Canterbury, New Zealand.Department of Botany, University of Canterbury,Christchurch, New Zealand. 418 pp.
Cheeseman, T.F. 1925. Manual of the New Zealandflora. 2nd edition. Government Printer,Wellington, New Zealand. 1163 pp.
Cockayne, L.; Foweraker, C.E. 1915. Notes from theCanterbury College Mountain Biological Station.No.4 - The principal plant associations in theimmediate vicinity of the station. Transactions ofthe New Zealand Institute 48: 166-186.
Connor, H.E.; Egdar, E. 1987. Name changes in theindigenous New Zealand flora. New ZealandJournal of Botany 25: 115-170.
*Cowley, J.M. 1982. Preliminary observations on sodwebworms (Lepidoptera: Pyralidae) of hillcountry pasture. New Zealand Entomologist 7: 293-295.
*Craw, R.C. 1987. Revision of the genus Helastiasensu stricto with description of a new genus
(Lepidoptera: Geometridae: Larentiinae). NewZealand Journal of Zoology 14: 269-293. :
Cumberland, K.B. 1944. High-country 'Run'. Thegeography of extensive pastoralism in NewZealand. Economic Geography 20: 204-220.
*Dick, R.D. 1940. Observations on insect-life inrelation to tussock-grassland deterioration. NewZealand Journal of Science and Technology 22A:19-29.
Dobson, A.T. 1977. Adventive plants. In: Burrows,C.l. (Editor), Cass: History and science in theCass district. Canterbury, New Zealand, pp.271-278. Department of Botany, University ofCanterbury, Christchurch, New Zealand. 418 pp.
*Dugdale, J.S. 1966. A revision of New ZealandSchoenotenini and Cnephasiini (Lepidoptera:Tortricidae: Tortricinae). New Zealand Journal ofScience 9: 731-775.
Dugdale, J.S. 1975. The insects in relation to plants.In: Kuschel, G. (Editor), Biogeography andecology in New Zealand, pp. 561-589. Junk, TheHague, The Netherlands. 689 pp.
Dugdale, J.S. 1988. Lepidoptera - annotatedcatalogue, and keys to family-group taxa. Faunaof New Zealand 14: 1-262.
Fienberg, S.E. 1980. The analysis of cross-classifiedcategorical data. MIT Press, Cambridge,Massachusetts, U.S.A. 198 pp.
*Gaskin, D.E. 1966. New Zealand Noctuidae(Lepidoptera): summary of known host plantsand a bibliography relevant to the biology of thegroup. New Zealand Entomologist 3: 19-27.
*Gaskin, D.E. 1970. Analysis of light trap catches ofLepidoptera from Palmerston North, NewZealand in 1966-68. New Zealand Journal ofScience 13: 482-499.
*Gaskin, D.E. 1975. Revision of the New ZealandCrambini (Lepidoptera: Pyralidae: Crambinae).New Zealand Journal of Zoology 2: 265-363.
*Gaskin, D.E. 1987. Supplement to New ZealandCrambinae (Lepidoptera: Pyralidae) - correctionsdescription of females of two species, and noteson structure, biology, and distribution. NewZealand Journal of Zoology 14: 113-121.
Greenland, D.E. 1977. Weather and climate at CassoIn: Burrows, C.J. (Editor), Cass: History andscience in the Cass district, Canterbury, NewZealand, pp. 93-113. Department of Botany,University of Canterbury, Christchurch, NewZealand. 418 pp.
Hengeveld, R. 1989. Dynamics of biological invasions.Chapman and Hall, London, U.K. 160 pp.
Hilgendorf, F.W. 1918. Notes from CanterburyMountain Biological Station. No.6 - Theinsect-life. Transactions of the New ZealandInstitute 50: 135-144.
*Kelsey, J.M. 1957. Insects attacking tussock. NewZealand Journal of Science 38A: 638-643.
Lambrechtsen, N.C. 1986. What grass is that? A guideto identification of some introduced grasses inNew Zealand by vegetative characters.Department of Scientific and Industrial Research,Government Printing Office, Wellington, NewZealand. 151 pp.
Lord, J.M. 1990. The maintenance of Poa citagrassland by grazing. New Zealand Journal ofEcology 13: 43-49.
Malcolm, N.A. 1925 (unpublished). Montane tussockgrassland, with special reference to the effect ofspelling. M.Sc. thesis, University of CanterburyLibmry, Christchurch, New Zealand.
*Mark, A.F. Dickinson, K.l.M.; Patrick, RH.;Barratt, B.I.P.; Loh, G.; McSweeney, G.D.;Meurk, C.D.; Timmins, S.; Simpson, N.C. 1987

WHITE: CHANGES IN GRASSLAND MOTH ABUNDANCE 17
(unpublished). Eyre ecological district. Mavoraecological region. An ecological survey of thecentral part. Report to the New ZealandProtected Natural Areas Programme,Department of Conservation, Wellington, NewZealand. 59 pp.
Mizutani, M. 1984. The influences of weather andmoonlight on the light trap catches of moths.Applied Entomology and Zoology 19: 133-141.
Moffat, R.W. 1957 (unpublished). Ecological studies onmontane tussock grassland M.Agr.Sc. Thesis,Lincoln University Library, Canterbury, N.Z.
Myers, S.c.; Park, G.N.; Overmars, F.B. 1987. Aguidebook for the rapid ecological survey ofnatural areas. New Zealand Biological ResourcesCentre Publication No.6, Wellington, NewZealand. 113 pp. .
*Patrick, B.H. 1989 (unpublished). Lepidoptera,Cicadidae. Acrididae of the Manorburn ecologicaldistrict. Science and Research internal ReportNo. 60, Department of Conservation, Wellington,New Zealand. 16 pp.
*Patrick, B.H.; Barratt, B.I.P.; Rance, B.; Heads, M.;Tangney, R. 1986. Entomological survey of theSiopedown Range. New Zealand Forest ServiceMiscellaneous Report No.3.
*Patrick, B.H.; Rance, B.D.; Barratt, B.I.P.; Tangney,R. 1987 (unpublished). Entomological survey ofthe Longwood Range. Longwood ecological region.Te Wae Wae ecological region. Report of theDepartment of Conservation, New Zealand. 86pp.
*Patrick, B.H.; Rance, B.; Lyford, B.; Barratt, B.1987. Entomological survey of Snowdon PeakState Forest, Livingstone ecological district.Mavora ecological region. Report to theDepartment of Conservation, Invercargill, N.Z.
Rose, A.B. 1983. Succession in fescue (Festucanovae-zelandiae) grasslands of the Harper-Avocacatchment, Canterbury, New Zealand. NewZealand Forest Research Institute Bulletin No. 16.35 pp.
Sainsbury, G.O.K. 1955. A handbook of the NewZealand mosses. Royal Society of New Zealand,Wellington, New Zealand. 490 pp.
Scott, D.; Dick, R.D.; Hunter, G.G. 1988. Changes inthe tussock grasslands in the central WaimakaririRiver basin, Canterbury, New Zealand,194'7-1981. New Zealand Journal of Botany 26:197-222.
Sewell, T.G. 1947 (unpublished). A study of montanetussock grassland with special reference to thegrowth. seeding and behaviour of the principaltussocks and grasses. M.Agr.Sc. thesis, LincolnUniversity Library, Canterbury, N.Z.
Shanks, A.; Glenny, D.; Gibson, R.; Rosser, K.;Roozen, D.; Phillipson, S.; Steven, J.; Arand, J.
1990 (unpublished). Coleridge. Craigieburn andCass ecological districts. Survey Report for theNew Zealand Protected Natural AreasProgramme, No. 10, Department ofConservation, Wellington, New Zealand. 306 pp.
Southwood, T.R.E. 1978. Ecological methods withparticular reference to the study of insectpopulations. Chapman and Hall, London. 524 pp.
*Spiller, D.; Wise, K.A.J. 1982. A catalogue(1860-1960) of New Zealand insects and theirhost plants. Department of Scientific andIndustrial Research. Bulletin 231, Wellington, NewZealand. 260 pp.
*Sweney, w.J. 1980 (unpublished). Insects of MountCook National Park. M.Agr.Sc. thesis, LincolnUniversity Library, Canterbury, New Zealand.
Treskonova, M. 1991. Changes in the structure oftall-tussock grasslands and infestation by speciesof Hieracium in the Mackenzie Country, NewZealand. New Zealand Journal of Ecology, 15(1).
Webb, C.J.; Sykes, W.R.; Garnock-Jones; P.J. 1988.Flora of New Zealand Vol. IV. Naturalisedpteridophytes. gymnosperms, dicotyledons. BotanyDivision, Department of Scientific and IndustrialResearch, Christchurch, New Zealand. 1365 pp.
*White, E.G. 1964a (unpublished). A survey andinvestigation of the insect fauna associated withsome tussock grasslands. M.Agr.Sc. (Hort.) thesis,Lincoln University Library, Canterbury, NewZealand.
White, E.G. I 964b. A design for the effective killingof insects caught in light traps. New ZealandEntomologist 3: 25-27.
White, E.G. 1978. Energetics and consumption ratesof alpine grasshoppers (Orthoptera: Acrididae) inNew Zealand. Oecologia 33: 17-44.
White, E.G. 1987. Ecological time frames and theconservation of grassland insects. New ZealandEntomologist 10: 146-145.
White, E.G. 1988. Sampling efficiency and theanalysis of light-trapping data. New ZealandEntomologist 11: 81-84.
White, E.G. 1989. Light-trapping frequency and dataanalysis - a reply. New Zealand Entomologist 12:91-94.
Wilton, H.J. 1948 (unpublished). A critical study ofcomparative methods of botanical analysis ofpastures with special reference to theirmathematical reliability: The application of thesemethods to selected grassland associations in NewZealand M.Sc. thesis, Victoria UniversityLibrary, Wellington, New Zealand.
*Wood, J. 1977. Arthropoda collected in light traps atWinchmore. Winchmore Irrigation ResearchStation Technical Report No. 10, Ministry ofAgriculture and Fisheries, Ashburton, NewZealand. 59 pp.

18 NEW ZEALAND JOURNAL OF ECOLOGY, VOL. 15, NO. 1, 1991
Appendix 1: Species list and cumulative site trapping records for each study period. Also shown are species flightclass (see text), recorded flight months (including observations additional to trap records), known larval foods (iflocally present) and ecological comment (including minimum distances from localised foods to light - see text). . =adventive species; n/a = data not available for the known flight period; c = circa; italic numerals = data under-represented by lesser sampling effort; t = species not trapped but observed in trapping vicinity; so. D J f. . . =serial months September-May, main flight months in upper case, other records lower case; A = Appendix 2.
Family and species Flight Numbers trapped Flight Known larval foodsclass Site R Site S period and ecological comment
1961-3 1987.9 1961-3 1987-9 (months)
HEPIALIDAE LEAVES. "PORINA MOTHS"
Wiseana copularis (Meyrick) A 107 62 11 22 . . n d J f . . . Polyphagous on sward spp.W. mimica (Philpott) A n/a 17 c390 151 . ON. . . . . . As above. including A AgrostisW. umbraculata (Guenée) A 3 3 I . . n D J . . . . Damp swards >300m from light
SUBTOTAL 110 79 c404 174
TINElDAE SAPROPHAGESArchyala /erranea (Butler) B 1 . . . . i . . . . ?dry plant debris* Monopis ethelella (Newman) C 4 1 6 4 . . . d j f m a . Animal fibres, including soiled woolGRACILLARIIDAE "LEAF MINERS"Caloptilia elaeas (Meyrick) C n/a 73 7 22 . O N . . f . . . Coriaria, site R >5OOmC. linearis (Butler) C 1 3 14 5 . O n . i f . . . Coriaria, site R > 5OOmC. selenitis (Meyrick) C 1 . . n . . . . . . Nothofagus >300mC. n.sp. C I . . n . . . . . . A GaultheriaYPONOMEUTIDAE LEA VESOrthenches porphyritis Meyrick C n/a n/a 1 . o . . . . . . . Podocarpus. Phyllodadus > 300mPlutella psammochroa (Meyrick) C 16 1 22 2 . O N . i f . . .P. xylostella (L.) C n/a 3 t 14 . O n d i . . . . Nasturtium, site R >8OOmRhigognostis sera (Meyrick) C 1 1 . o . . . f . . . Cruciferae (as Nasturtium above)GLYPHIPTERIGlDAE MINERS IN TILLERSGlyphipherix acrothecta (Meyrick) C t 2 . . . . j F m . . Monocotyledons)G. cionophora (Meyrick) C 1 t 1 . . . . j f m . . As above ) Molhs rarelyG. oxymachaera (Meyrick) C 1 . . n D J F . . . As above ) attracted to lightG. triselena (Meyrick) C 1 . . . . . f . . . As above )L YONETIIDAE MINERS* Leucoptera spartifoliella (Hubner) C 63 1 . . . . J . . . . * Cytisus >500m, site R > 1.5km
SUBTOTAL 22 147 53 52
GELECHIIDAE SPUN LEAVES. SHOOTSAnisoplaca ptyoptera (Meyrick) B 5 3 2 3 . . n d i F m . . A Carmlehaelia [Ulex >500m]A. n.sp. C 1 1 . . . . . . m a . Hoheria >8OOm, site S>3kmKiwaia lithodes (Meyrick) C 14 4 12 10 . o n d J f m . . A Raoulia, site R >8OOm 1987-9K. monophragma (Meyrick) C 2 2 2 . . n d i . . . .K. porapleura (Meyrick) C 4 12 2 . . . d J F . . .K. schematica (Meyrick) C 5 5 . . . d J F m . . Cushion herbsBA TRACHEDRlDAE SAPROPHAGESBatrachedra tristictica Meyrick C t 1 . . . . i . . . . Juncus seedheads, >300mCOLEOPHORlDAE "CASEBEARERS"* Coleophora spissicornis (Haworth) C 5 46 1 11 . . . D J . . . . A Trifolium* C. trifolii (Curtis) C 205 53 . . n . J f m . . A Trifolium* C. vcrsurella (Zeller) C 1 . . . d . . . . . Chenopodiaceae >?600mMOMPHlDAE MINERSZllpyrastra stellata (Philpott) C I . . . . i . . . . A Muehlenbeckia leaves
SUBTOTAL 240 55 87 31
OECOPHORlDAE - Oecophorinae SAPROPHAGES
Atomotricha ommatias Meyrick B n/a n/a 3 . o n . . . . . .* Endrosis sarcitrella (L.) C 1 2 s . n . . f . . . Dried vegetation, domestic refuseGymnobathra sarcoxantha Meyrick B 1 . . . . . f . . . (Leaf) litterHierodoris n.sp., nr eleetriea (Meyrick) C 1 . . . . j . . . . Litter under shrubs* Hofmannophila pseudosprelella
(Stainton) B t 1 . . . . j f . . . Bird nests, domestic itemsLeptocroca sp., nr lindsayi Philpott C 2 1 . . . . i . . . . LitterTingena sp., T. chloradelpha sp. group C 1 . . n . . . . . . LitterT. chloritis (Meyrick) C 1 . . n . . . . . . LitterT. macarella (Meyrick) C 1 1 1 . . n d i f . . . Litter (?including A Festuca)T. ombrodella (Hudson) B 1 . . . . j . . . . LitterT. oporaea (Meyrick) B 1 3 .. . . j f . . . LitterT. seelusa (Philpott) C 1 . . . . . f . . . LitterTrachypepla conspicuella (Walker) C 1 . . . . j . . . . Forest litter ~ 300mOECOPHORlDAE - Depressariinae PHYTOPHAGESPhaeosaces apocrypta Meyrick B 6 1 5 . . . . j f . . . Lichens on shrubsProteodes earnifex (Butler) B 3 1 . . . . . f m . . Nothofagus >300m, site R > 1.2kmELACHISTlDAE LEAVES, STEMS, SEEDS. MINERSCosmioles helonoma (Meyrick) C 1 1 . . . . j F M a . Grasses. Moths rarely at lightC. ochroleuL'a (Meyrick) C 2 . . . . j . . . . A Festuca (?also above sp.), PoaElachista gerasmia Meyrick C 1 . . . . j . . . . Juncus > 300m
SUBTOTAL 8 12 10 15
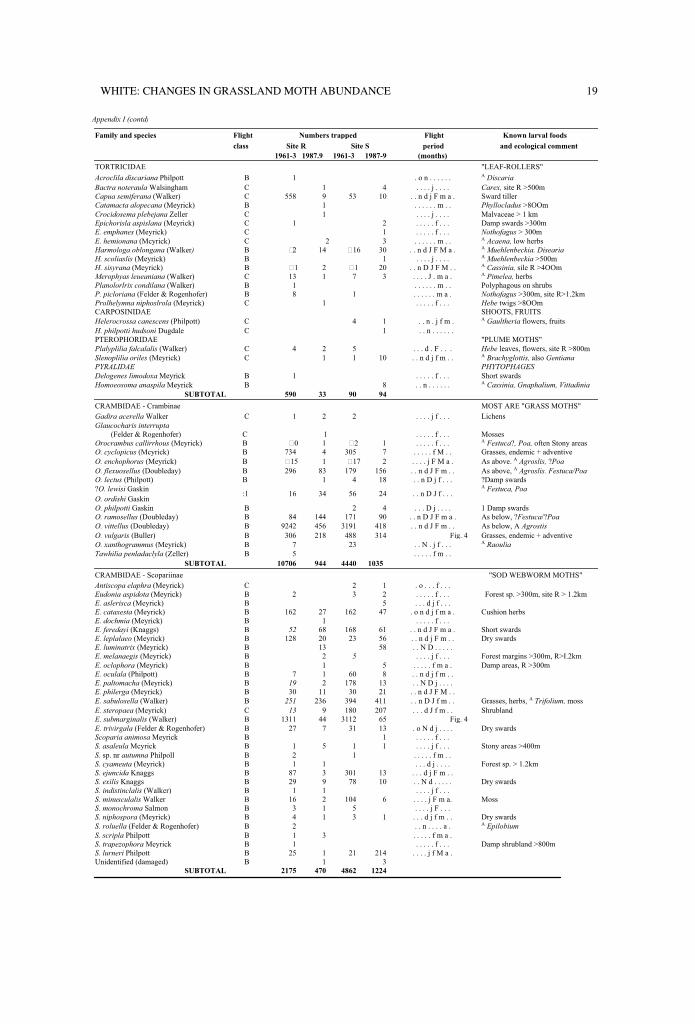
WHITE: CHANGES IN GRASSLAND MOTH ABUNDANCE 19
Appendix I (contd)
Family and species Flight Numbers trapped Flight Known larval foods
class Site R Site S period and ecological comment
1961-3 1987.9 1961-3 1987-9 (months)
TORTRICIDAE "LEAF-ROLLERS"
Acroclila discariana Philpott B 1 . o n . . . . . . A Discaria
Bactra noteraula Walsingham C 1 4 . . . . j . . . . Carex, site R >500m
Capua semiferana (Walker) C 558 9 53 10 . . n d j F m a . Sward tiller
Catamacta alopecana (Meyrick) B 1 . . . . . . m . . Phyllocladus >8OOm
Crocidosema plebejana Zeller C 1 . . . . j . . . . Malvaceae > 1 km
Epichorisla aspislana (Meyrick) C 1 2 . . . . . f . . . Damp swards >300m
E. emphanes (Meyrick) C 1 . . . . . f . . . Nothofagus > 300m
E. hemionana (Mcyrick) C 2 3 . . . . . . m . . A Acaena, low herbs
Harmologa oblongana (Walker) B �2 14 �16 30 . . n d J F M a . A Muehlenbeckia. Disearia
H. scoliaslis (Meyrick) B 1 . . . . j . . . . A Muehlenbeckia >500m
H. sisyrana (Meyrick) B �1 2 �1 20 . . n D J F M . . A Cassinia, sile R >4OOm
Merophyas leueaniana (Walker) C 13 1 7 3 . . . . J . m a . A Pimelea, herbs
Planolorlrix condilana (Walker) B 1 . . . . . . m . . Polyphagous on shrubs
P. picloriana (Felder & Rogenhofer) B 8 1 . . . . . . m a . Nothofagus >300m, site R>1.2km
Prolhelymna niphoslrola (Meyrick) C 1 . . . . . f . . . Hebe twigs >8OOm
CARPOSINIDAE SHOOTS, FRUITS
Helerocrossa canescens (Philpott) C 4 1 . . n . j f m . A Gaultheria flowers, fruits
H. philpotti hudsoni Dugdale C 1 . . n . . . . . .
PTEROPHORIDAE "PLUME MOTHS"
Plalyplilia falcalalis (Walker) C 4 2 5 . . . d . F . . . Hebe leaves, flowers, site R >800m
Slenoplilia oriles (Meyrick) C 1 1 10 . . n d j f m . . A Brachyglottis, also Gentiana
PYRALIDAE PHYTOPHAGES
Delogenes limodoxa Meyrick B 1 . . . . . f . . . Short swards
Homoeosoma anaspila Meyrick B 8 . . n . . . . . . A Cassinia, Gnaphalium, Vittadinia
SUBTOTAL 590 33 90 94
CRAMBIDAE - Crambinae MOST ARE "GRASS MOTHS"
Gadira acerella Walker C 1 2 2 . . . . j f . . . Lichens
Glaucocharis interrupta
(Felder & Rogenhofer) C 1 . . . . . f . . . Mosses
Orocrambus callirrhous (Meyrick) B �0 1 �2 1 . . . . . f . . . A Festuca?, Poa, often Stony areas
O. cyclopicus (Mcyrick) B 734 4 305 7 . . . . . f M . . Grasses, endemic + adventive
O. enchophorus (Meyrick) B �15 1 �17 2 . . . . j F M a . As above. A Agroslis, ?Poa
O. flexuosellus (Doubleday) B 296 83 179 156 . . n d J F m . . As above, A Agroslis. Festuca/Poa
O. lectus (Philpott) B 1 4 18 . . n D j f . . . ?Damp swards
?O. lewisi Gaskin A Festuca, Poa
O. ordishi Gaskin:1 16 34 56 24 . . n D J f . . .
O. philpotti Gaskin B 2 4 . . . D j . . . . 1 Damp swards
O. ramosellus (Doubleday) B 84 144 171 90 . . n D J F m a . As below, ?Festuca/?Poa
O. vittellus (Doubleday) B 9242 456 3191 418 . . n d J F m . . As below, A Agrostis
O. vulgaris (Buller) B 306 218 488 314 Fig. 4 Grasses, endemic + adventive
O. xanthogrammus (Meyrick) B 7 23 . . N . j f . . . A Raoulia
Tawhilia penladaclyla (Zeller) B 5 . . . . . f m . .
SUBTOTAL 10706 944 4440 1035
CRAMBIDAE - Scopariinae "SOD WEBWORM MOTHS"
Antiscopa elaphra (Meyrick) C 2 1 . o . . . f . . .
Eudonia aspidota (Meyrick) B 2 3 2 . . . . . f . . . Forest sp. >300m, site R > 1.2km
E. aslerisca (Meyrick) B 5 . . . d j f . . .
E. cataxesta (Meyrick) B 162 27 162 47 . o n d j f m a . Cushion herbs
E. dochmia (Meyrick) B 1 . . . . . f . . .
E. feredayi (Knaggs) B 52 68 168 61 . . n d J F m a . Short swards
E. leplalaeo (Meyrick) B 128 20 23 56 . . n d j F m . . Dry swards
E. luminatrix (Meyrick) B 13 58 . . N D . . . . .
E. melanaegis (Meyrick) B 2 5 . . . . j f . . . Forest margins >300m, R>I.2km
E. oclophora (Meyrick) B 1 5 . . . . . f m a . Damp areas, R >300m
E. oculala (Philpott) B 7 1 60 8 . . n d j f m . .
E. paltomacha (Meyrick) B 19 2 178 13 . . N D j . . . .
E. philerga (Meyrick) B 30 11 30 21 . . n d J F M . .
E. sabulosella (Walker) B 251 236 394 411 . . n D J f m . . Grasses, herbs, A Trifolium, moss
E. steropaea (Meyrick) C 13 9 180 207 . . . d J f m . . Shrubland
E. submarginalis (Walker) B 1311 44 3112 65 Fig. 4
E. trivirgala (Felder & Rogenhofer) B 27 7 31 13 . o N d j . . . . Dry swards
Scoparia animosa Meyrick B 1 . . . . . f . . .
S. asaleula Mcyrick B 1 5 1 1 . . . . j f . . . Stony areas >400m
S. sp. nr autumna Philpoll B 2 1 . . . . . f m . .
S. cyameuta (Meyrick) B 1 1 . . . d j . . . . Forest sp. > 1.2km
S. ejuncida Knaggs B 87 3 301 13 . . . d j F m . .
S. exilis Knaggs B 29 9 78 10 . . N d . . . . . Dry swards
S. indistinclalis (Walker) B 1 1 . . . . j f . . .
S. minusculalis Walker B 16 2 104 6 . . . . j F m a. Moss
S. monochroma Salmon B 3 1 5 . . . . j F . . .
S. niphospora (Meyrick) B 4 1 3 1 . . . d j f m . . Dry swards
S. roluella (Felder & Rogenhofer) B 2 . . n . . . . a . A Epilobium
S. scripla Philpott B 1 3 . . . . . f m a .
S. trapezophora Meyrick B 1 . . . . . f . . . Damp shrubland >800m
S. lurneri Philpott B 25 1 21 214 . . . . j f M a .
Unidentified (damaged) B 1 3
SUBTOTAL 2175 470 4862 1224
20 NEW ZEALAND JOURNAL OF ECOLOGY, VOL. I5, NO. 1, 1991
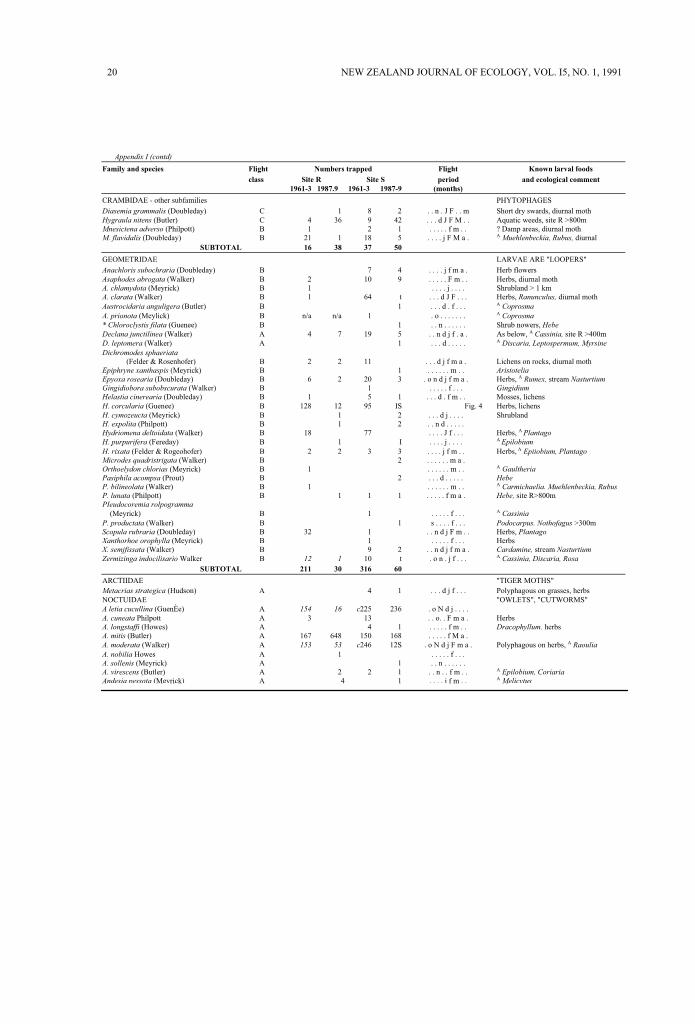
Appendix I (contd)
Family and species Flight Numbers trapped Flight Known larval foods
class Site R Site S period and ecological comment
1961-3 1987.9 1961-3 1987-9 (months)
CRAMBIDAE - other subfamilies PHYTOPHAGES
Diasemia grammalis (Doubleday) C 1 8 2 . . n . J F . . m Short dry swards, diurnal mothHygraula nitens (Butler) C 4 36 9 42 . . . d J F M . . Aquatic weeds, site R >800mMnesictena adverso (Philpott) B 1 2 1 . . . . . f m . . ? Damp areas, diurnal mothM. flavidalis (Doubleday) B 21 1 18 5 . . . . j F M a . A Muehlenbeckia, Rubus, diurnal
SUBTOTAL 16 38 37 50
GEOMETRIDAE LARVAE ARE "LOOPERS"
Anachloris subochraria (Doubleday) B 7 4 . . . . j f m a . Herb flowersAsaphodes abrogata (Walker) B 2 10 9 . . . . . F m . . Herbs, diurnal mothA. chlamydota (Meyrick) B 1 . . . . j . . . . Shrubland > 1 kmA. clarata (Walker) B 1 64 t . . . d J F . . . Herbs, Ranunculus, diurnal mothAustrocidaria anguligera (Butler) B 1 . . . d . f . . . A Coprosma
A. prionota (Meylick) B n/a n/a 1 . o . . . . . . . A Coprosma
* Chloroclystis filata (Guenee) B 1 . . n . . . . . . Shrub nowers, Hebe
Declana junctilinea (Walker) A 4 7 19 5 . . n d j f . a . As below, A Cassinia, site R >400mD. leptomera (Walker) A 1 . . . d . . . . . A Discaria, Leptospermum, Myrsine
Dichromodes sphaeriata
(Felder & Rosenhofer) B 2 2 11 . . . d j f m a . Lichens on rocks, diurnal mothEpiphryne xanthaspis (Meyrick) B 1 . . . . . . m . . Aristotelia
Epyoxa rosearia (Doubleday) B 6 2 20 3 . o n d j f m a . Herbs, A Rumex, stream Nasturtium
Gingidiobora subobscurata (Walker) B 1 . . . . . f . . . Gingidium
Helastia cinerearia (Doubleday) B 1 5 1 . . . d . f m . . Mosses, lichensH. corcularia (Guenee) B 128 12 95 IS Fig. 4 Herbs, lichensH. cymozeucta (Meyrick) B 1 2 . . . d j . . . . ShrublandH. expolita (Philpott) B 1 2 . . n d . . . . .Hydriomena deltoidata (Walker) B 18 77 . . . . J f . . . Herbs, A Plantago
H. purpurifera (Fereday) B 1 I . . . . j . . . . A Epilobium
H. rixata (Felder & Rogeohofer) B 2 2 3 3 . . . . j f m . . Herbs, A Epiiobium, Plantago
Microdes quadristrigata (Walker) B 2 . . . . . . m a .Orthoelydon chlorias (Meyrick) B 1 . . . . . . m . . A Gaultheria
Pasiphila acompsa (Prout) B 2 . . . d . . . . . Hebe
P. bilineolata (Walker) B 1 . . . . . . m . . A Carmichaelia. Muehlenbeckia, Rubus
P. lunata (Philpott) B 1 1 1 . . . . . f m a . Hebe, site R>800mPIeudocoremia rolpogramma
(Meyrick) B 1 . . . . . f . . . A Cassinia
P. productata (Walker) B 1 s . . . . f . . . Podocarpus. Nothofagus >300mScopula rubraria (Doubleday) B 32 1 . . n d j F m . . Herbs, Plantago
Xanthorhoe orophylla (Meyrick) B 1 . . . . . f . . . HerbsX. semjfissata (Walker) B 9 2 . . n d j f m a . Cardamine, stream Nasturtium
Zermizinga indocilisario Walker B 12 1 10 t . o n . j f . . . A Cassinia, Discaria, Rosa
SUBTOTAL 211 30 316 60
ARCTIIDAE "TIGER MOTHS"Metacrias strategica (Hudson) A 4 1 . . . d j f . . . Polyphagous on grasses, herbsNOCTUIDAE "OWLETS", "CUTWORMS"A letia cucullina (GuenÈe) A 154 16 c225 236 . o N d j . . . .A. cuneata Philpott A 3 13 . . o. . F m a . HerbsA. longstaffi (Howes) A 4 1 . . . . . f m . . Dracophyllum. herbsA. mitis (Butler) A 167 648 150 168 . . . . . f M a .A. moderata (Walker) A 153 53 c246 12S . o N d j F m a . Polyphagous on herbs, A Raoulia
A. nobilia Howes A 1 . . . . . f . . .A. sollenis (Meyrick) A 1 . . n . . . . . .A. virescens (Butler) A 2 2 1 . . n . . f m . . A Epilobium, Coriaria
Andesia pessota (Meyrick) A 4 1 . . . . j f m . . A Melicytus

WHITE: CHANGES IN GRASSLAND MOTH ABUNDANCE 21
Appendix I (contd)
Family and species Flight Numbers trapped Flight Known larval foodsclass Site R Site S period and ecological comment
1961-3 1987.9 1961-3 1987-9 (months)
Bityla defigurata (Walker) A n/a n/a 2 t . o . . . . . . m A Muehlenbeckia leaves, site S >500mB. sericea Butler A 1 t . . . . . . m . . A Muehlenbeckia leaves, site S >500mEuxoa admiralionis (Guenée) A 18 3 18 46 . . N d j . . . .Graphania agoraslis (Meyrick) A 10 43 72 253 . . . d j F M a .G. averilla (Hudson) A 1 4 1 . . n . j f . . . Herbs, A PlantagoG. disjungens (Walker) A 436 291 967 653 . . N D j f . . . A Festuca / PoaG. homoscia (Meyrick) A 1 10 33 4 . o n d . f m A m A Cassinia, site R >400mG. infensa (Walker) A 1 2 . . n d . . . . . Carex, Uncinia. [*Bromus]G. sp., nr insignis (Walker) A 3 . o . . . f . . . Herbs, A RumexG. lignana (Walker) A 34 22 102 30 Fig. 4G. lithias (Meyrick) A 41 39 105 50 . . N D . F M a . A Melicy/usG. morasa (Butler) A 2 6 . . . . . f m . . Adventive grasses, A HolcusG. mutans (Walker) A 186 17 c554 92 . o N D j F M a m Herbs, A PlantagoG. nullifera (Walker) A 1 3 2 . . . d j f m a . A Aciphylla rootsG. olivea (Watt) A 1 . . . . j . . . .G. omicron (Hudson) A 2 3 2 5 . . n d j . . . .G. omoplaca (Meyrick) A 2 2 4 28 . . N D j . . . . A Plantago, PoaG. paracausla (Meyrick) A 4 4 3 33 . o N. . . . . . Adventive grassesG. phricias (Meyrick) A 12 11 84 33 Fig. 4 A DiscariaG. plena (Walker) A 1 1 . o . d . f . . . Forest margins, Fuchsia >?1 kmG. prionistis (Meyrick) A 1 1 . . . d . f . . .G. rubescens (Butler) A 5 1 19 2 . . . . j F m a . Herbs, A Luzula, sedgesG. sculala (Meyrick) A 2 2 16 3 . . . . . . . A . A PlanlagoG. uslislriga (Walker) A 1 1 5 3 . o n . . f m a . Polyphagous, A MuehlenbeckiaIchneutica marmorata (Hudson) A 2 . . n . . . . . . Chionochloa >600mMelerana roeleno (Hudson) A n/a n/a 3 s o . . . . . . . Muehlenbeckia >300mM. dolala (Walker) A 6 7 . . . . j f m . . Nothofagus >300m, site R>1.2kmM. meyricci (Hampson) A 1 . . . . . . m a m A PimeleaM. ochlhislis (Meyrick) A 1 2 2 . o n d . . . . . Polyphagous, Hebe, RubusM. larlarea (Butler) A 1 3 . . . . . . m a . A CoprosmaM. viliasa (Butler) A 1 . . . . . . . a . A CoprosmaPerseclania aversa (Walker) A 181 21 c283 53 . o N d j F M a m Grasses, A Agrostis, Festuca, ?PoaPhyselica caerulea (Guenée) A 11 1 92 13 . o N D J F m . .Rictonis comma (Walker) A 1 6 7 33 . . n D . . . . . A Brachyglollis, Taraxacum, grassesSchrankia costaestrigalis (Stephens) A 1 . , . . j . . . . LitterUnidentified (damaged 26-10-62) A c75
PART SUBTOTAL 1433 1201 c3160 1885Tmelolophola aeonlislis (Meyrick) A 115 301 c163 885 . o N d . . . . . A Elymus, Festuca, ? PoaT. alopa (Meyrick) A 1 3 . . . . . f m . .T. arolis (Meyrick) A n/a n/a 1 6 . o n . . . . . . Phormium >300mT. alrislriga (Walker) A 81 37 367 64 . . n d j F M a . Grasses, A Festuca / PoaT. propria (Walker) A 404 3221 795 1272 Fig. 4 Grasses, endemic + adventiveT. semivillala (Walker) A I 28 2 . . n . j F m . . A Fesluca / Poa, Carex, JuncusT. sleropasJjs (Meyrick) A 1 t . . . d j f . . . Phormium >300mT. unica (Walker) A 19 33 53 127 . . n D j . . . . Grasses
PART SUBTOTAL 631 3592 c1411 2356SUBTOTAL 2064 4793 c4571 4141
GRAND TOTAL 16152 6601 c14880 6976
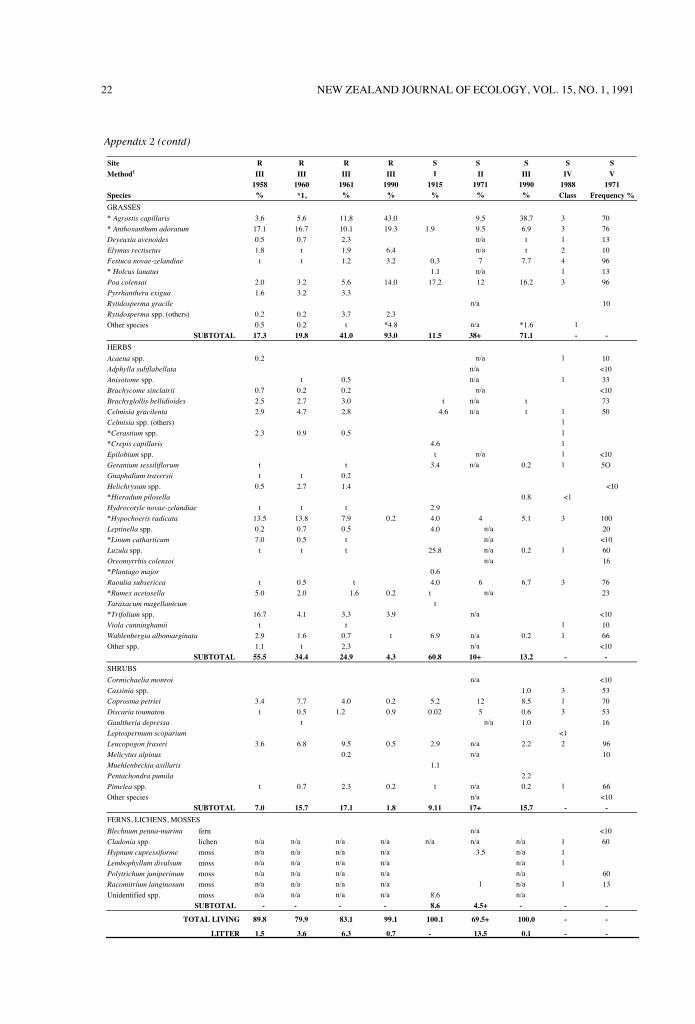
Appendix 2: Site histories of vegetation species composition, based on five recording methods.1 The numberingsequence I - V represents a gradation from the most local to the most extensive sampling of a debris flow fan.* =adventive species; n/a = data not available; t = species observed but not recorded. Nomenclature follows Allan(1982), Cheeseman (1925), Connor and Edgar (1987), Lambrechtsen (1986), Sainsbury (1955), and Webb et aI.(1988).1The five methods are not directly comparable but the sampling sequence provides strong evidence in support of major trends.Method I (numerical cover): Quadrat analysis by species classes, all plants recorded by basal sections at ground level over ten 1 x 1 m quadrats (for Festuca novae-zelandiae), two 1 x 0.02 m quadrats (other frequent species) and a 2 x 1 m enlargement of one quadrat (infrequent species), total plants = 4366 m-2 (Malcolm, 1925. datarecalculated).Method II (canopy cover): Point analysis, first hits of needle, five needles per frame at 5 cm intervals, randomly-placed frames, 200 points per sample, mean of two site Ssamples (Burrows, 1977, Table 13G, selected data only).Method III (basal cover): Point analysis, basal node of the plant nearest to the needle point at ground level, three needles per frame at 25.4 cm intervals along a transect,site R mean sample 438 points, site S 495 points (present study, see Methods).Method IV (cover-abundance, subjective): All species observed within a 13-minute search of a representative area, records allocated to height tiers (0-30 cm, 30 cm-1 m, 1-2 m above ground), tiers and species within tiers assigned to cover abundance classes where < 1 = present and rare, 1 = present and common, 2 = 1.5%, 3 = 5-15%, 4 =15-30% (Myers, Park and Overmars, 1987, Appendix III; Shanks et al. (1990), unpublished plot sheets (Department of Conservation, Canterbury Conservancy).Method V (extent of occurrence): Quadrat analysis, all species recorded within 1 x 1 m quadrat, 30 randomly-placed quadrats, mean frequencies of occurrence over totalsample (Burrows, 1977, Table 13F).
22 NEW ZEALAND JOURNAL OF ECOLOGY, VOL. 15, NO. 1, 1991
Site R R R R S S S S SMethod1 III III III III I II III IV V
1958 1960 1961 1990 1915 1971 1990 1988 1971Species % *1, % % % % % Class Frequency %
GRASSES
* Agrostis capillaris 3.6 5.6 11.8 43.0 9.5 38.7 3 70
* Anthoxanthum adoratum 17.1 16.7 10.1 19.3 1.9 9.5 6.9 3 76
Deyeuxia avenoides 0.5 0.7 2.3 n/a t 1 13
Elymus rectisetus 1.8 t 1.9 6.4 n/a t 2 10
Festuca novae-zelandiae t t 1.2 3.2 0.3 7 7.7 4 96
* Holcus lanatus 1.1 n/a 1 13
Poa colensai 2.0 3.2 5.6 14.0 17.2 12 16.2 3 96
Pyrrhanthera exigua 1.6 3.2 3.3
Rytidosperma gracile n/a 10
Rytidosperma spp. (others) 0.2 0.2 3.7 2.3
Other species 0.5 0.2 t *4.8 n/a *1.6 1
SUBTOTAL 17.3 19.8 41.0 93.0 11.5 38+ 71.1 - -
HERBS
Acaena spp. 0.2 n/a 1 10
Adphylla subflabellata n/a <10
Anisotome spp. t 0.5 n/a 1 33
Brachycome sinclairii 0.7 0.2 0.2 n/a <10
Brachyglollis bellidioides 2.5 2.7 3.0 t n/a t 73
Celmisia gracilenta 2.9 4.7 2.8 4.6 n/a t 1 50
Celmisia spp. (others) 1
*Cerastium spp. 2.3 0.9 0.5 1
*Crepis capillaris 4.6 1
Epilobium spp. t n/a 1 <10
Geranium sessiliflorum t t 3.4 n/a 0.2 1 5O
Gnaphalium traversii t t 0.2
Helichrysum spp. 0.5 2.7 1.4 <10
*Hieradum pilosella 0.8 <1Hydrocotyle novae-zelandiae t t t 2.9
*Hypochoeris radicata 13.5 13.8 7.9 0.2 4.0 4 5.1 3 100
Leptinella spp. 0.2 0.7 0.5 4.0 n/a 20
*Linum catharticum 7.0 0.5 t n/a <10
Luzula spp. t t t 25.8 n/a 0.2 1 60
Oreomyrrhis colensoi n/a 16
*Plantago major 0.6
Raoulia subsericea t 0.5 t 4.0 6 6.7 3 76
*Rumex acetosella 5.0 2.0 1.6 0.2 t n/a 23
Taraxacum magellanicum t
*Trifolium spp. 16.7 4.1 3.3 3.9 n/a <10
Viola cunninghamii t t 1 10
Wahlenbergia albomarginata 2.9 1.6 0.7 t 6.9 n/a 0.2 1 66
Other spp. 1.1 t 2.3 n/a <10
SUBTOTAL 55.5 34.4 24.9 4.3 60.8 10+ 13.2 - -
SHRUBS
Cormichaelia monroi n/a <10
Cassinia spp. 1.0 3 53
Coprosma petriei 3.4 7.7 4.0 0.2 5.2 12 8.5 1 70
Discaria toumatou t 0.5 1.2 0.9 0.02 5 0.6 3 53
Gaultheria depressa t n/a 1.0 16
Leptospermum scoparium <1Leucopogon fraseri 3.6 6.8 9.5 0.5 2.9 n/a 2.2 2 96
Melicytus alpinus 0.2 n/a 10
Muehlenbeckia axillaris 1.1
Pentachondra pumila 2.2
Pimelea spp. t 0.7 2.3 0.2 t n/a 0.2 1 66
Other species n/a <10
SUBTOTAL 7.0 15.7 17.1 1.8 9.11 17+ 15.7 - -
FERNS, LICHENS, MOSSES
Blechnum penna-marina fern n/a <10
Cladonia spp. lichen n/a n/a n/a n/a n/a n/a n/a 1 60
Hypnum cupressiforme moss n/a n/a n/a n/a 3.5 n/a 1
Lembophyllum divulsum moss n/a n/a n/a n/a n/a 1
Polytrichum juniperinum moss n/a n/a n/a n/a n/a 60
Racomitrium langinosum moss n/a n/a n/a n/a 1 n/a 1 13
Unidentified spp. moss n/a n/a n/a n/a 8.6 n/a
SUBTOTAL - - - - 8.6 4.5+ - - -
TOTAL LIVING 89.8 79.9 83.1 99.1 100.1 69.5+ 100.0 - -
LITTER 1.5 3.6 6.3 0.7 - 13.5 0.1 - -
Appendix 2 (contd)