thestateof britain’s larger moths...
TRANSCRIPT
The State of Britain’sLarger Moths 2013
The Swallow-tailed Moth Ourapteryx sambucariadeclined by 60% over the period 1968-2007Photograph R. Thompson

Eyed Hawk-moths Smerinthus ocellata R.ThompsonEyed Hawk-moths Smerinthus ocellata R.Thompson

n Moths are an extremely diverse and species-rich groupof insects that occur in a wide range of habitats andplay vital roles in the functioning of ecosystems both asimportant components of the food chain and as plantpollinators. They are also fascinating and beautiful insectsthat are increasingly popular with the public.
n Over 2,500 moth species have been recorded in GreatBritain, of which around 900 are so called larger moths(macro-moths), and 1,600 micro-moths. This reportsummarises the current state of knowledge about largermoths in Britain, based on the world-leading RothamstedInsect Survey and the recording and conservation workundertaken by Butterfly Conservation and others.
n Across Britain, the total abundance of larger mothsdeclined significantly, by 28%, during the 40-year periodfrom 1968 to 2007.
n In the southern half of Britain, total counts of largermoths decreased significantly, by 40%. In contrast,moth numbers showed no significant change innorthern Britain, where declining species are balancedby species spreading north.
n Two-thirds of 337 species of common and widespreadlarger moths declined over the 40-year study. 37% ofthe 337 species decreased by at least 50%. One-thirdof species became more abundant with 53 species(16% of the total) more than doubling their populationlevels over the 40 years.
n This overall decline is indicative of the rapid loss of insectbiodiversity in Britain, and other countries, which mayhave substantial impacts on other wildlife and affect thedelivery of some ecosystem services.
n Generally, the rates of decline of moths have tendedto moderate a little since the previous report in 2006.However, regardless of this, the broad patterns of changein moth biodiversity revealed in this report are similar tothose in the previous assessment.
n In addition to 62 moth species (macro and micro-moths)that became extinct in Britain during the twentieth century,a further four species may now be extinct here (OrangeUpperwing, Bordered Gothic, Brighton Wainscot and,possibly, Stout Dart).
n In contrast, this century, more than 100 moth species(macros and micros) have been recorded for the firsttime in Britain and 27 moth species are considered tohave colonised Britain from the year 2000 onwards.Immigration also appears to be increasing.
n The causes of change among Britain’s moths are notyet fully understood. Habitat changes, especially thoserelated to agricultural intensification, changing woodlandmanagement and urbanisation, appear to have hadsubstantial, largely negative impacts on moths. Climatechange, on the other hand, seems to have had bothpositive and negative effects. It is still unclear whetherother factors such as nutrient enrichment and light pollutionhave had significant impacts on moth populations.
n Conservation action for some of the rarer moths in Britainhas expanded considerably over the past decade underthe impetus of the UK Biodiversity Action Plan, withmany notable successes. It is vital that targeted speciesconservation programmes continue, both at a local andlandscape scale, in order to prevent future extinctions –an ecosystem approach alone will not be sufficient toconserve many threatened moths and prevent theongoing loss of biodiversity in Britain.
n However, a focus on threatened moth species, whileessential to prevent further loss of biodiversity, is notenough. Pervasive environmental degradation and thedecline of common species demand the recreation ofa rural and urban landscape that is much more hospitableto biodiversity. Carefully targeted and properly resourcedagri-environment and woodland management schemeswould be a significant step towards repairing Britain’snatural heritage and safeguarding the ecosystem servicesthat underpin human welfare.
Executive summary
1

Recording and monitoring Britain’s mothsMoths provide a rare opportunity to measure and understand change in a large and diverse group of insects.
1 Thomas et al. 2004a2 Conrad et al. 20073 Conrad et al. 2006
4 Mattila et al. 2006, 2008, Groenendijk & Ellis, 20115 Fox et al. 2006
2
Rothamsted light-trap Rothamsted Research
Although insects account for a high proportion of the earth’sbiodiversity and play crucial roles in ecosystems that underpinthe welfare of the human race, we still know little about how theyare faring. Knowledge tends to be limited to a few high-profile groups, such as butterflies, in the most developed countries. While this may provide an important indication of wider trends1,there is an urgent need to quantify patterns of biodiversity changein other insect groups. Larger (macro-) moths provide such anopportunity in Britain, thanks to long-term population monitoringand distribution recording schemes supported by thousands ofamateur naturalists. With some 900 species recorded in Britain,larger moths greatly exceed the species richness of otherintensively-monitored wildlife groups, as well as being vitalcomponents of food webs (providing essential food for manybirds and bats) and important plant pollinators.
Moth population monitoringThe Rothamsted Insect Survey (RIS) monitors nocturnal largermoth populations through a national network of standardisedand automated light-traps that are run every night of the year.From 1968 to the present day, these traps have been run atover 525 sites, covering a variety of habitats, from gardens toupland moor using, on average, 97 traps per year. Moths areidentified and counted on site by amateur experts or centrally by professional scientists, before the records are computerised.Through this network, Rothamsted Research has amassed a unique database, with around nine million moths recordedin Britain, over a period spanning more than four decades2.
Previous detailed analysis of 35 years of RIS data (1968-2002)uncovered, for the first time, significant decreases amongBritain’s larger moths, mirroring declines already discovered for butterflies. The total abundance of larger moths in Britainhad decreased significantly (by 31%) and the decline insouthern Britain was even worse (44% decrease)3.
Two-thirds of 337 common and widespread larger moths,for which national population trends could be determined, haddecreased, many severely. Similar patterns of decline among larger moths have since been reported from the Netherlands andFinland4. Here we extend the analysis of larger moth populationtrends in Britain by including a further five years of RIS data (2003-2007). More recent data were still incomplete at the time ofanalysis due to inevitable time lags in dealing with so many records(from each trap each night). These new 40-year trends providean updated snap-shot of the state of Britain’s larger moths.We used the same methods of data selection and analysis, andfocussed on the same 337 species as the previous study, to ensure that this report is directly comparable with its predecessor5.
Map showing the location of 411 RISlight-traps contributing to the 40-yearassessment (1968-2007).
6 Fox et al. 2011a
3
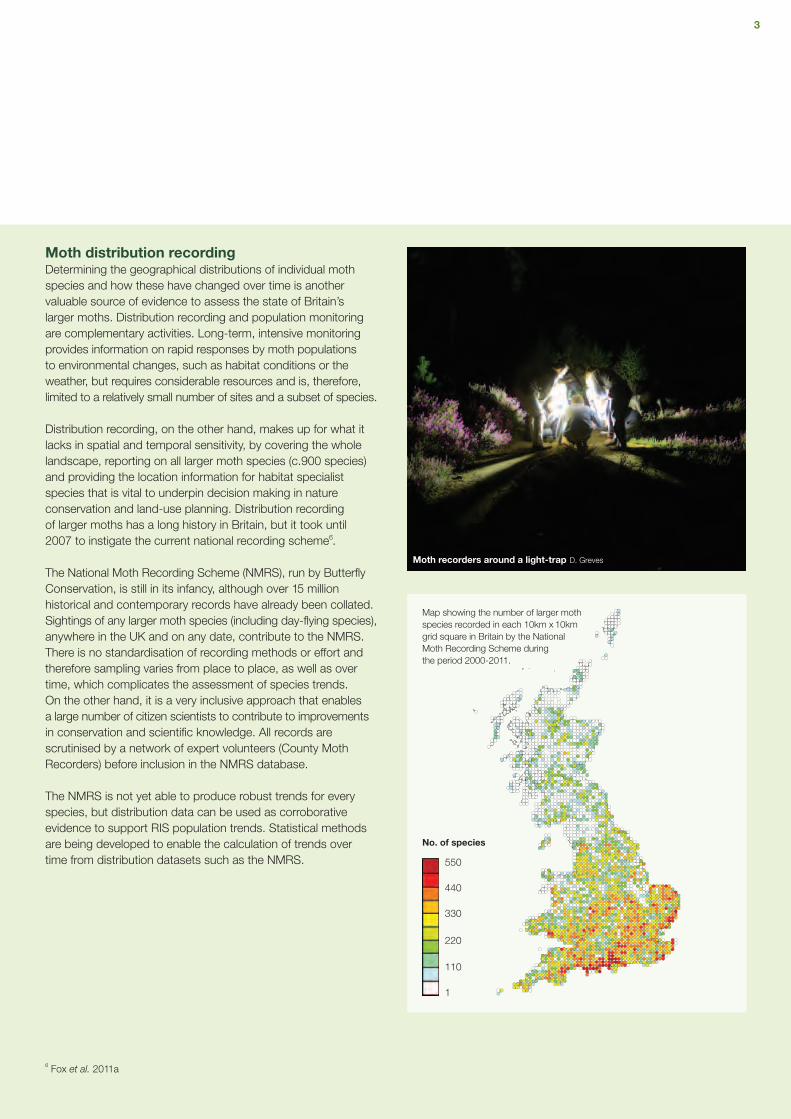
Moth distribution recordingDetermining the geographical distributions of individual mothspecies and how these have changed over time is anothervaluable source of evidence to assess the state of Britain’slarger moths. Distribution recording and population monitoringare complementary activities. Long-term, intensive monitoringprovides information on rapid responses by moth populationsto environmental changes, such as habitat conditions or theweather, but requires considerable resources and is, therefore,limited to a relatively small number of sites and a subset of species.
Distribution recording, on the other hand, makes up for what itlacks in spatial and temporal sensitivity, by covering the wholelandscape, reporting on all larger moth species (c.900 species)and providing the location information for habitat specialistspecies that is vital to underpin decision making in natureconservation and land-use planning. Distribution recordingof larger moths has a long history in Britain, but it took until2007 to instigate the current national recording scheme6.
The National Moth Recording Scheme (NMRS), run by ButterflyConservation, is still in its infancy, although over 15 millionhistorical and contemporary records have already been collated.Sightings of any larger moth species (including day-flying species),anywhere in the UK and on any date, contribute to the NMRS.There is no standardisation of recording methods or effort andtherefore sampling varies from place to place, as well as overtime, which complicates the assessment of species trends.On the other hand, it is a very inclusive approach that enablesa large number of citizen scientists to contribute to improvementsin conservation and scientific knowledge. All records arescrutinised by a network of expert volunteers (County MothRecorders) before inclusion in the NMRS database.
The NMRS is not yet able to produce robust trends for everyspecies, but distribution data can be used as corroborativeevidence to support RIS population trends. Statistical methodsare being developed to enable the calculation of trends overtime from distribution datasets such as the NMRS.
Map showing the number of larger mothspecies recorded in each 10km x 10kmgrid square in Britain by the NationalMoth Recording Scheme duringthe period 2000-2011.
No. of species
550
440
330
220
110
1
Moth recorders around a light-trap D. Greves

The changing moth fauna of BritainMoth populations and distributions are in constant flux. During the twentieth century, 62 moth speciesbecame extinct in Britain and several more have followed since 2000. In contrast, over 100 mothspecies have been newly recorded in Britain this century and 27 have become resident.
4
7 Parsons 2003
In recent years, there has been a netincrease in the moth fauna, with thenumber of new species colonisingBritain greatly exceeding the numberbecoming extinct.
ExtinctionsSixty-two species of moths (includingmicro-moths) became extinct in Britainduring the twentieth century7 and severalmore are now thought to have been lost.Proving the extinction of a species is oftendifficult, but evidence suggests that theOrange Upperwing Jodia croceago,Bordered Gothic Heliophobus reticulata,Brighton Wainscot Oria musculosaand, possibly, Stout Dart Spaelotis ravidaare no longer resident in Britain (althoughthey may occur as rare immigrants).
Additions and colonisationsAlready this century over 100 speciesof moths (including micro-moths) havebeen recorded for the first time in Britain.A few are previously-overlooked residentspecies; Ectoedemia heckfordi, for example,was described as new to science in 2010and its entire, known global distribution isa small area of Devon! Some of the newarrivals have appeared only as occasionalimmigrants, while others have establishedbreeding colonies and become residentspecies (e.g. Horse Chestnut Leaf-minerCameraria ohridella, Cosmopterixpulchrimella, Clancy’s Rustic Platyperigeakadenii and Sombre Brocade Dryobotodestenebrosa). Incredibly, a total of 27 mothspecies are considered to have colonisedBritain from the year 2000 onwards.
Meanwhile many of the 89 species thatcolonised Britain during the twentiethcentury7 have continued to spread(e.g. Pammene aurita, Cypress CarpetThera cupressata, Varied Coronet Hadena compta (see box opposite) andToadflax Brocade Calophasia lunula).
Many, but not all, of these colonisersutilise non-native plants as hosts fortheir caterpillars. As a result of humanactivity, Britain’s gardens, parks and,increasingly, countryside contain plantsfrom all corners of the world and,not surprisingly, either by accidentalimportation or natural colonisation,specialist moth herbivores have followed.
2000 to 2011
Clancy's RusticClancy’s Rustic
2000 to 2011Stout Dart
2000 to 20111968 to 1999
Stout Dart
1968 to 19992000 to 2011
Bordered Gothic Heliophobus reticulata D. Green
Orange Upperwing Jodia croceago P. Sansum

ImmigrationEvidence suggests that both the abundance and diversityof immigrant moths arriving in Britain are increasing over time,probably due to climate change8. Recent years have witnessedsubstantial influxes of scarce immigrants such as Spoladearecurvalis, Antigastra catalaunalis, Crimson Speckled Utetheisapulchella and Small Marbled Eublemma parva. Many, but notall, of our regular immigrants have increased in abundance(e.g. Vestal Rhodometra sacraria 925% increase in populationlevels over the period 1968-2007). Those bucking the trendinclude the Dark Sword-grass Agrotis ipsilon and Silver YAutographa gamma (62% and 46% decreases respectivelyin population levels over the period 1968-2007).
Recent advances, particularly the use of vertical-lookingradar, have revolutionised our knowledge of moth migration9.Moths are not simply blown along passively by the wind, buthave sophisticated ways of getting to their desired destination.Silver Y and other moths make use of high altitude winds toachieve fast speeds (up to 55mph) and appropriate directionsfor their migratory movements10. Surprisingly, by selecting themost favourable airstreams, several hundred metres abovethe ground, and by orientating their bodies to compensatefor crosswind drift, moths are able to migrate with similarspeed and efficiency as songbirds11.
5
8 Sparks et al. 2005, Morecroft et al. 20099 Chapman et al. 2011
10 Chapman et al. 201011 Alerstam et al. 2011
Silver Y Autographa gamma R. Thompson
1940 to 1999
Varied Coronet
The Varied Coronet colonised Britain in 1948 in Kent, and has since spreadrapidly across southern and easternEngland. The moth’s caterpillars feedmainly on Sweet-William, a non-nativeplant widely grown in gardens.
1940 to 1969
Varied Coronet1940 to 2011
Varied Coronet
Varied Coronet Hadena compta P. Maton
Varied Coronet
1940 to 1969 1940 to 1999 1940 to 2011

Utilising annual counts from the Rothamsted Insect Surveylight-trap network, 40-year national population trends werecalculated using the software TRIM for 337 common andwidespread species of larger moths in Britain.
These trends cover the period 1968-2007 and are thelongest-running national population trends of insect speciesknown anywhere in the world. The 337 moth species are thesame as were used in a previous study12 (so that comparisonscould be made, see p16) and were selected because thesespecies have been caught sufficiently frequently to enablethe calculation of robust population trends. While many ofthe species are common moths frequently caught in gardens,not all of the species occur throughout Britain.
Two of the 337 species in the study are in fact aggregates,where data for two species were combined before analysisinto a single aggregate taxon: Deep-brown Dart Aporophylalutulenta / Northern Deep-brown Dart A. lueneburgensis,because there is scientific uncertainty as to which of thesespecies occur in Britain, and Lead Belle Scotopteryx mucronata/July Belle S. luridata, which are difficult to distinguish.
Moth abundanceThe total abundance of larger moths caught in the Rothamstedlight-trap network decreased by 28% over the 40-year period(Fig.1). This trend towards lower moth abundance over timewas statistically significant13. However, there was a cleardifference between total abundance trends in northern andsouthern Britain. In the north (traps situated to the north of the 4500 N grid line, which equates approximately with thelocations of the cities of Lancaster and York), there wasno significant change, whereas in southern Britain, mothabundance decreased significantly, by 40% (Fig.1).
Trends of common and widespread mothsThe total abundance of moths decreased by 28% over the period 1968-2007. Losses in southern Britain were greater, at 40%, whereas in northern Britain losses were offset by gains.
6
12 Conrad et al. 2006, Fox et al. 2006 13 Trends in total larger moth abundance were significant across Britain(t = 8.30(38), P < 0.001) and in southern Britain (t = 11.98(38), P < 0.001),but not in the north (t = 0.54(38), P = 0.50).
TR
IM a
nn
ual
ind
ex
Year
Britain-0.4
1965 1970 1975 1980 1985 1990 1995 2000 2005 2010
-0.3
-0.2
-0.1
0.0
0.1
0.2
TR
IM a
nn
ual
ind
ex
Year
North-0.4
1965 1970 1975 1980 1985 1990 1995 2000 2005 2010
-0.3
-0.2
-0.1
0.0
0.1
0.2
TR
IM a
nn
ual
ind
ex
Year
South-0.4
1965 1970 1975 1980 1985 1990 1995 2000 2005 2010
-0.3
-0.2
-0.1
0.0
0.1
0.2
Figure 1 Change in the total abundance of all larger mothscaught in the Rothamsted light-trap network 1968-2007.

7
14 Analysis of variance (ANOVA) of the difference betweenestimated annual change rates of species in southern andnorthern Britain (mean = -0.017, F = 100.43(1,233), P < 0.001).
Figure 2 Frequency distribution of the population changes of 337 British larger moths. The size of population change is given as the average 10-year rate of change, calculatedfrom the annual rate of change estimated to occur over the period 1968-2007. The redline shows the 10-year median change. X-axis labels are the upper limits of each group.
Trends for individual speciesCommon and widespread larger moths declinedover the period 1968-2007 (Fig. 2). Forty-yearnational population trends showed that 227species decreased in abundance, two-thirds(67%) of the larger moths assessed. The remaining110 species (33%) became more abundant overthe 40 years. The median change for the 40-yearperiod was -36%.
61 species (18% of the total) decreased by at least75% between 1968 and 2007 (see Table 1 on p8).
A further 63 larger moth species decreased byover 50% and an additional 64 species by at least25%. Overall, 188 species (56% of the total)declined by at least 25%.
In contrast, 91 common and widespread moths(27% of the total) increased in abundance byover 25%. Of these, 53 species (16% of the total)more than doubled their population levels overthe 40 years.
Twice as many larger moths declinedas increased in Britain over 40 years.
Species’ 40-year population trends were alsocalculated separately in northern Britain (north ofthe 4500 N grid line) and southern Britain (Fig. 3).In northern Britain, trends were calculated for259 species: 138 species (53%) decreased and120 species (46%) increased, with one speciesshowing no change. The median percentagechange for larger moths in northern Britain was-11% over the period 1968-2007.
The picture was very different in southern Britain.Here trends were calculated for 308 species; 211 species (69%) decreased in abundance while97 species (31%) increased. The median 40-yearpopulation change in southern Britain was -43%.
On average, moths analysed in both regions hadsignificantly greater declines or lower increasesin the south than in the north14.
Nu
mb
er o
f sp
ecie
s
Percentage change over 10 years
0
10
20
30
40
50
60
-50
-40
-30
-20
-10 0 10 20 30 40 50 60 70 80 90 100
>10
060
Nu
mb
er o
f sp
ecie
s
Percentage change over 10 years
North50
40
30
20
10
0
-50
-40
-30
-20
-10 0 10 20 30 40 50 60 70 80 90 100
>10
0
60
Nu
mb
er o
f sp
ecie
s
Percentage change over 10 years
South50
40
30
20
10
0
-50
-40
-30
-20
-10 0 10 20 30 40 50 60 70 80 90 100
>10
0
Figure 3 Frequency distributions of the population changes of larger moth species innorthern and southern Britain. The size of population change is given as the average10-year rate of change, calculated from the annual rate of change estimated to occur overthe period 1968-2007. The red lines show the 10-year median change. X-axis labels arethe upper limits of each group.

% ChangeSpecies over 40 years
V-moth Macaria wauaria -99Garden Dart Euxoa nigricans -98Double Dart Graphiphora augur -98Dusky Thorn Ennomos fuscantaria -98Hedge Rustic Tholera cespitis -97Figure of Eight Diloba caeruleocephala -96Spinach Eulithis mellinata -96Dark Spinach Pelurga comitata -96Heath Rustic Xestia agathina -95Anomalous Stilbia anomala -94Dusky-lemon Sallow Xanthia gilvago -94White-line Dart Euxoa tritici -94Flounced Chestnut Agrochola helvola -94Brindled Ochre Dasypolia templi -94Autumnal Rustic Eugnorisma glareosa -94Rosy Minor Mesoligia literosa -93Lackey Malacosoma neustria -93Grass Rivulet Perizoma albulata -93Large Nutmeg Apamea anceps -93Beaded Chestnut Agrochola lychnidis -93Garden Tiger Arctia caja -92Haworth's Minor Celaena haworthii -92Dark-barred Twin-spot Carpet Xanthorhoe ferrugata -91Dot Moth Melanchra persicariae -91Grey Mountain Carpet Entephria caesiata -91Broom-tip Chesias rufata -90Pale Eggar Trichiura crataegi -90Feathered Gothic Tholera decimalis -89Oak Lutestring Cymatophorima diluta -88Red Carpet Xanthorhoe decoloraria -88Pretty Chalk Carpet Melanthia procellata -88
Table 1Sixty-one species of larger moth declined by 75% or more over 40 years (1968-2007)
8
Spinach Eulithis mellinata 96% decrease R. Leverton Pale Eggar Trichiura crataegi 90% decrease P. Clement

Brindled Beauty Lycia hirtaria -87Small Square-spot Diarsia rubi -87September Thorn Ennomos erosaria -87Sprawler Asteroscopus sphinx -87Rosy Rustic Hydraecia micacea -86Sallow Xanthia icteritia -85Latticed Heath Chiasmia clathrata -85August Thorn Ennomos quercinaria -85Oblique Carpet Orthonama vittata -85Mouse Moth Amphipyra tragopogonis -85Broom Moth Melanchra pisi -84Mottled Rustic Caradrina morpheus -84Large Wainscot Rhizedra lutosa -83Brown-spot Pinion Agrochola litura -82Minor Shoulder-knot Brachylomia viminalis -82Green-brindled Crescent Allophyes oxyacanthae -81Deep-brown/Northern Deep-brown Dart agg. Aporophyla lutulenta /luneburgensis -81Lead/July Belle agg. Scotopteryx mucronata/luridata -81Small Autumnal Moth Epirrita filigrammaria -81Grey Chi Antitype chi -80Buff Arches Habrosyne pyritoides -80Galium Carpet Epirrhoe galiata -79Rustic Hoplodrina blanda -78Oak Hook-tip Watsonalla binaria -78Gothic Naenia typica -76Heart and Dart Agrotis exclamationis -76Neglected Rustic Xestia castanea -76Knot Grass Acronicta rumicis -75Black Rustic Aporophyla nigra -75Garden Carpet Xanthorhoe fluctuata -75
9
% ChangeSpecies over 40 years
Latticed Heath Chiasmia clathrata 85% decrease C. Brett Green-brindled Crescent Allophyes oxyacanthae 81% decrease G. Barlow

Grey Chi
2000 to 2011
1968 to 1999
Grey Chi Antitype chi is a widespreadnorthern species found commonly ina range of habitats including moorland,grassland and gardens. It has suffered an 80% decrease in population over40 years, with particularly steep declinessince 2003.
There is also an indication of distributiondecline, especially at the southernedge of its range e.g. Herefordshire,Northamptonshire, Warwickshire andWorcestershire, but population declineshave taken place in northern Britain aswell as in the south.
TR
IM a
nn
ual
ind
ex
Year
-1.2
-1.4
-1.6
-1.81965 1970 1975 1980 1985 1990 1995 2000 2005 2010
-1.0
-0.8
-0.6
-0.4
-0.2
0.0
Grey Chi
1968 to 19992000 to 2011
Grey Chi Antitype chi M. Skevington
Many of the severely declining moths are still, correctly, regardedas common species and they include some of the most frequentlarger moths caught in light-traps, including Small Square-spotDiarsia rubi (87% decrease over 40 years), Heart and Dart Agrotisexclamationis (76% decrease), Knot Grass Acronicta rumicis (75%decrease), Garden Carpet Xanthorhoe fluctuata (75% decrease),Lychnis Hadena bicruris (72% decrease) and Centre-barredSallow Atethmia centrago (70% decrease).
Others have rapidly become much scarcer species – mothsthat were once commonly encountered which today are specialfinds for many moth recorders, such as Garden Dart Euxoanigricans (98% decrease), Spinach Eulithis mellinata (96%decrease) and Garden Tiger Arctia caja (92% decrease). Someexamples of declining moths are given in further detail below.
Moths in declineCommon and widespread moths have declined considerably in Britain over the past four decades.Two-thirds (227 species) of the larger moths for which 40-year national populations trends were calculateddecreased in abundance. Table 1 (p8-9) lists species with the most severe population declines.
10
V-Moth
2000 to 2011
1968 to 1999
V-moth Macaria wauaria shows thegreatest 40-year population decline ofall the 337 larger moth species that wereanalysed. It decreased by 99% in theRothamsted light-trap network over theperiod 1968-2007. Much of this declinehas taken place since 1996.
The V-moth’s distribution has also declinedsubstantially at the national scale as canbe seen from the National Moth RecordingScheme map. The moth may now be extinctin several southern counties, includingBedfordshire, Devon, Hampshire andWarwickshire. The V-moth utilises currantsand gooseberry as larval foodplants andits decline, therefore, might be associatedwith decreased cultivation of these plantsand increased use of insecticides.
TR
IM a
nn
ual
ind
ex
Year
-2.0
-2.51965 1970 1975 1980 1985 1990 1995 2000 2005 2010
-1.5
-1.0
-0.5
0.0
0.5
1.0
V-moth
1968 to 19992000 to 2011
V-moth Macaria wauaria C. Manley

August Thorn Ennomos quercinaria 85% decrease R. Thompson
11
TR
IM a
nn
ual
ind
ex
Year
-0.8
-1.0
-1.2
-1.41965 1970 1975 1980 1985 1990 1995 2000 2005 2010
-0.6
-0.4
-0.2
0.0
0.2
0.4
TR
IM a
nn
ual
ind
ex
Year
-0.8
-1.0
-1.2
-1.41965 1970 1975 1980 1985 1990 1995 2000 2005 2010
-0.6
-0.4
-0.2
0.0
0.2
0.4
TR
IM a
nn
ual
ind
ex
Year
-0.8
-1.0
-1.2
-1.41965 1970 1975 1980 1985 1990 1995 2000 2005 2010
-0.6
-0.4
-0.2
0.0
0.2
0.4
Garden Tiger Arctia caja 92% decrease M. Parsons
Mouse Moth Amphipyra tragopogonis 85% decrease P. Maton
August Thorn Ennomos quercinaria 85% decrease R. Thompson

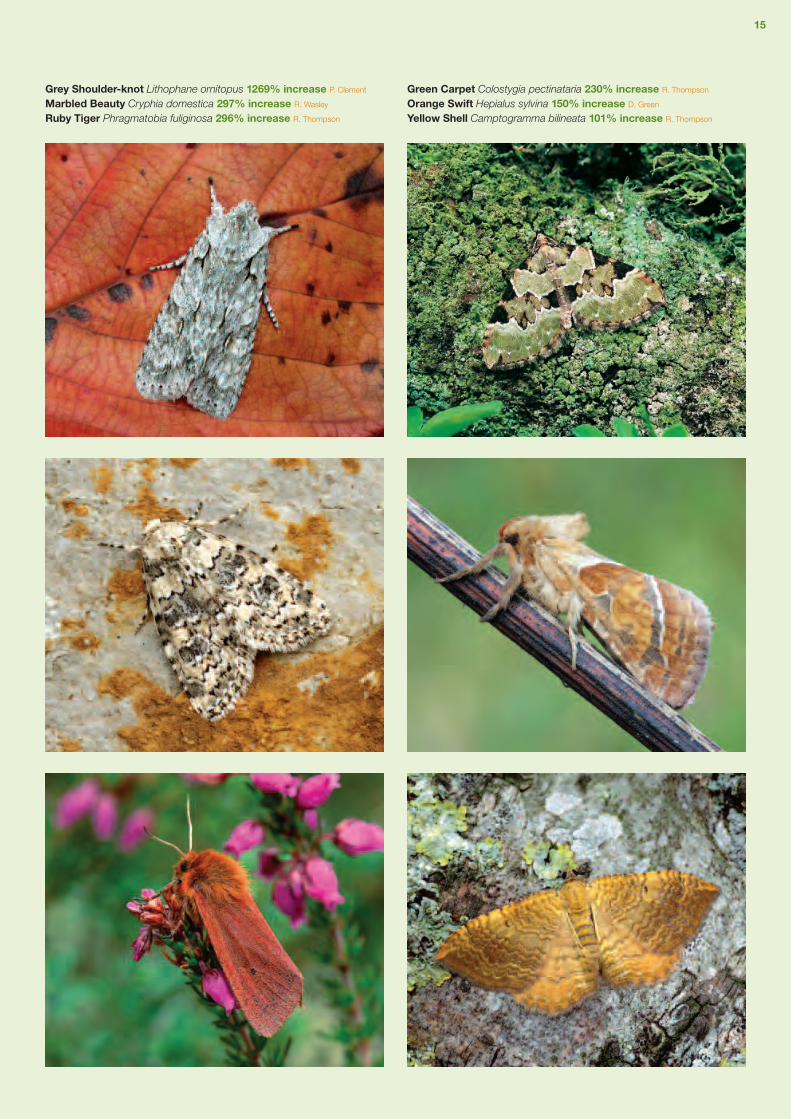
Moths on the increaseAlthough most of the widespread and common larger moths decreased in abundance during the 40-year study, a substantial minority (one-third of the 337 species studied) increased. Fifty-threespecies (16%of the total) more than doubled their population levels over the 40 years (Table 2 on p14).Many of the species that have become more abundant have also become more widespread byexpanding their distributions, dramatically in some cases (see examples below).
12
1991 to 2011
1968 to 1990
Least Carpet
New squares
Least Carpet Idaea rusticata populationlevels increased enormously duringthe 1968-2007 period, with a 40-yearincrease of 74,684%! The main increasein population levels appeared to occurduring the 1980s and 1990s. Since the1970s, the moth has also dramaticallyincreased its British distribution, spreadingout from the London area into East Anglia,the Midlands and south-west England.
TR
IM a
nn
ual
ind
ex
Year
0.0
-0.5
-1.0
-1.51965 1970 1975 1980 1985 1990 1995 2000 2005 2010
0.5
1.0
1.5
2.0
2.5
Least CarpetNew Squares
1991 to 20111968 to 1990
1991 to 2011
1968 to 1990
Dingy Footman
New squares
Dingy Footman Eilema griseola is oneof a number of moths with caterpillarsthat feed on lichens and algae that haveincreased spectacularly over the 40-yearperiod. Population levels of Dingy Footmanhave increased by 1,851% and itsdistribution has expanded markedly insouthern Britain since the 1970s.
Once a restricted species typically foundin fens and marshy areas, the moth isnow common across a wide variety ofhabitats including gardens. In addition tomuch in-filling of its previous range, theDingy Footman has also spread rapidlynorthwards, colonising much of Yorkshireand Lancashire since the year 2000.
TR
IM a
nn
ual
ind
ex
Year
-0.5
-1.0
-1.51965 1970 1975 1980 1985 1990 1995 2000 2005 2010
0.0
0.5
1.0
1.5
2.0
Dingy FootmanNew Squares
1991 to 20111968 to 1990
Least Carpet Idaea rusticata M. Parsons
Dingy Footman Eilema griseola S. Taylor

13
1991 to 2011
1968 to 1990
Marbled White Spot
New squares
Marbled White Spot Protodeltotepygarga is a grass-feeding species foundin a range of grassy habitats fromwoodland to moor. Its population levelshave fluctuated considerably over the40-year period, showing a decreasingtrend until 1981 followed by a majorrecovery. Overall the population trend is a 195% increase for the period 1968-2007.The moth has also shown a substantialincrease in distribution since the 1970s,colonising much of England and Wales.
TR
IM a
nn
ual
ind
ex
Year
-0.8
-0.6
-0.4
-0.2
-1.0
-1.21965 1970 1975 1980 1985 1990 1995 2000 2005 2010
0.0
0.2
0.4
0.6
Marbled White SpotNew Squares
1991 to 20111968 to 1990
Marbled White Spot Protodeltote pygarga D. Green
Vine’s Rustic Hoplodrina ambiguais a resident and im migrant species foundin a wide range of habitats. Its populationlevels have fluctuated from year to year,as expected of a migratory species,but show an increase of 433% over the40-year period. In keeping with thisincrease, the resident distribution of theVine’s Rustic has expanded dramaticallyaway from the south coast and HomeCounties to occupy much of southern and eastern England. Recently the mothhas started to spread into Lancashire,Yorkshire and Northumberland.
TR
IM a
nn
ual
ind
ex
Year
0.2
0.4
0.6
1.0
0.0
-0.21965 1970 1975 1980 1985 1990 1995 2000 2005 2010
0.8
1.2
1.4
Vine’s RusticNew Squares
1991 to 20111968 to 1990
Vine’s Rustic Hoplodrina ambigua P. Clement

% ChangeSpecies over 40 years
Least Carpet Idaea rusticata 74,684Blair's Shoulder-knot Lithophane leautieri 7,878Treble Brown Spot Idaea trigeminata 4,312Buff Footman Eilema depressa 3,884Scarce Footman Eilema complana 3,590Satin Beauty Deileptenia ribeata 2,928Peacock Moth Macaria notata 2,409Dingy Footman Eilema griseola 1,851Spruce Carpet Thera britannica 1,731Devon Carpet Lampropteryx otregiata 1,279Grey Shoulder-knot Lithophane ornitopus 1,269Dotted Carpet Alcis jubata 1,009Broad-bordered Yellow Underwing Noctua fimbriata 984Vestal Rhodometra sacraria 925Juniper Carpet Thera juniperata 836Red-green Carpet Chloroclysta siterata 739Olive Ipimorpha subtusa 698Plain Wave Idaea straminata 634Dwarf Cream Wave Idaea fuscovenosa 599Rosy Footman Miltochrista miniata 488Vine's Rustic Hoplodrina ambigua 433Blue-bordered Carpet Plemyria rubiginata 388Pine Beauty Panolis flammea 345Pine Carpet Thera firmata 336Marbled Beauty Cryphia domestica 297Ruby Tiger Phragmatobia fuliginosa 296Barred Chestnut Diarsia dahlii 288Brindled Green Dryobotodes eremita 287Pale Mottled Willow Paradrina clavipalpis 275Maiden's Blush Cyclophora punctaria 240Green Carpet Colostygia pectinataria 230Early Tooth-striped Trichopteryx carpinata 220Dingy Shell Euchoeca nebulata 214Common Lutestring Ochropacha duplaris 203Least Black Arches Nola confusalis 198Marbled White Spot Protodeltote pygarga 195Large Yellow Underwing Noctua pronuba 186Small Waved Umber Horisme vitalbata 167Black Arches Lymantria monacha 164Small Dusty Wave Idaea seriata 155Green Arches Anaplectoides prasina 154Orange Swift Hepialus sylvina 150Green Silver-lines Pseudoips prasinana 144Slender Brindle Apamea solopacina 137Lunar Underwing Omphaloscelis lunosa 137Yellow-barred Brindle Acasis viretata 131Barred Umber Plagodis pulveraria 128Lunar Marbled Brown Drymonia ruficornis 117Satellite Eupsilia transversa 116Muslin Footman Nudaria mundana 113Spectacle Abrostola tripartita 108V-Pug Chloroclystis v-ata 103Yellow Shell Camptogramma bilineata 101
Table 2Fifty-three species of larger moth increased by 100% or more over 40 years (1968-2007)
14
15
Grey Shoulder-knot Lithophane ornitopus 1269% increase P. Clement
Marbled Beauty Cryphia domestica 297% increase R. Wasley
Ruby Tiger Phragmatobia fuliginosa 296% increase R. Thompson
Green Carpet Colostygia pectinataria 230% increase R. Thompson
Orange Swift Hepialus sylvina 150% increase D. Green
Yellow Shell Camptogramma bilineata 101% increase R. Thompson

Comparison between35-year and 40-year trendsMoth declines have ameliorated a little butoverall patterns of change remain similar.
16
Figure 4 A comparison of the proportion of species in different broad categoriesof 10-year rates of population change between the 40-year analysis (1968-2007)(blue bars) and the 35-year analysis (1968-2002) (red bars). Categories are:Very strongly declining = >50% 10-year decrease, Strongly declining = >30%decrease, Declining = <30% decrease, Increasing = <30% increase, Stronglyincreasing = >30 % increase, Very strongly increasing = >50% increase.
15 Fox et al. 200616 Analysis of variance (ANOVA) for differences in rates of population change between 35 and 40-year analyses, within species categories, for: a) Britain; all (F = 20.25(1,336),
P < 0.001), very strongly/strongly declining (F = 24.37(1,70), P < 0.001), declining (F = 28.28(1,154), P < 0.001), increasing (F = 1.49(1,76), P = 0.23) and very strongly/stronglyincreasing (F = 8.55(1,33), P < 0.01); b) southern Britain; all (F = 6.14(1,297), P < 0.05), very strongly/strongly declining (F = 29.60(1,76), P < 0.001), declining (F = 12.87(1,145),P < 0.001), increasing (F = 4.55(1,49), P < 0.05) and very strongly/strongly increasing (F = 0.13(1,23), P = 0.72), and c) northern Britain; all (F = 1.50(1,256), P = 0.22),very strongly/strongly declining (F = 13.28(1,50), P < 0.001), declining (F = 7.44(1,88), P < 0.01), increasing (F = 20.42(1,67), P < 0.001) and very strongly/strongly increasing(F = 10.50(1,48), P < 0.01).
A previous study calculated 35-year (1968-2002) nationalpopulation trends for the same group of 337 larger moths andthese formed the core of the first State of Britain’s Larger Mothsreport published in 2006
15. Comparing these previous trends
to the new 40-year (1968-2007) trends provides some insightinto the changing state of these widespread larger moths.However, it is important to realise that the percentage changefigures cannot be compared directly: percentage change over35 years for a particular species cannot be compared simplyto change over 40 years. Rate of change, however, can becompared, over the same duration. For each moth species anannual rate of change was calculated for both the 35-year andthe 40-year time periods, and each of these annual rates ofchange was then converted into a 10-year rate of change (trend).Such trends do not apply to a specific 10-year period such as1981-1990, but are an average rate of change for any given10-year period, which is derived from the overall rate of changeestimated from the whole time period being analysed.
Following the calculation of equivalent 10-year trends for eachspecies in the two studies, the general pattern of change canbe examined. Generally, the strength of trends moderated inthe 40-year analysis compared to the 35-year one, with ratesof decline in particular becoming a little less pronounced. Figure4 shows the proportion of moth species in broad categories ofchange for each analysis. Smaller proportions of moths werein the very strongly and strongly declining categories, and in thevery strongly increasing category in the 40-year assessmentcompared with the 35-year study. Thus, a greater proportionof species showed lower rates of change over 40 years thanover 35 years. For example, in the previous 35-year analysis,71 species (21% of the total) had decreased strongly or verystrongly, whereas in the 40-year analysis 56 species (17% ofthe total) were in these categories.
By comparing the average change for species in each of these broad categories between the two studies, we were ableto test statistically whether these differences were significant.Figure 5 (on p17) shows the results and confirms that decliningand severely declining species (those in the very strongly and strongly declining categories) fared less badly over the40-year period than the 35-year period. This was also true forthe separate southern Britain and northern Britain analyses.Indeed in each case, trends for severely declining speciesameliorated by more than declining species.
The situation is more complex for increasing species. Species inthe strongly and very strongly increasing categories were increasingtheir numbers at slightly, but significantly, lower rates in the 40-yearassessment compared with the 35-year one in Britain overall andin northern Britain, but there was no significant change for thesespecies in the southern analysis
16. The rest of the increasing species
showed no significant difference between the two date periodsin Britain overall. However, in southern Britain these speciesincreased their numbers at significantly greater rates than in the35-year period, while conversely, in northern Britain the samespecies were increasing at significantly less strong rates in the40-year assessment.
Overall, moth trends moderated significantly over the 40-year periodcompared with the 35-year period in Britain. This was also the casein the separate southern analysis, but not in the north (where thechange was not significant). The actual changes in these rates arecomparatively small, but where they are statistically significant it isdue to these differences being rather consistent across species.This suggests a trend towards rates of change (both positive andnegative) becoming somewhat ameliorated with the addition of thedata for the years 2003-2007 (the additional years included in the40-year analysis). However, it should be emphasised that the effecton long-term changes, although consistent, is relatively small andmost species continued to show long-term declines.
Trend category
% s
pec
ies
wit
hin
tim
e-se
ries
0V. strongly declining
Strongly declining
Declining
Increasing
Strongly increasing
V. strongly increasing
5
10
15
20
25
30
35
40
45
50
55
40 year series
35 year series

17
Figure 5 The mean of the differences between individual species’ annual ratesof change, within broad categories, in the 35-year analysis (1968-2002) and the40-year analysis (1968-2007). Values above zero indicate a difference in the rateof change leading to lower moth abundance regardless of trend direction (i.e.a higher rate of decline or a lower rate of increase), whereas points below zeroindicate a difference leading to higher abundance (i.e. lower rates of decline orhigher rates of increase). Error bars show 95% confidence intervals of the meandifferences: if they do not cross the dashed line at zero, the trend is significant(see footnote for test results). Red symbols show the all Britain assessment(B in the x-axis labels), blue show southern Britain (S) and green show northernBritain (N). Symbol shapes represent categories of trend as defined in Fig. 4.
White Ermine Spilosoma lubricipedapopulations improved considerably in the mostrecent years of the assessment from a lowpoint in the late 1990s. Although numbersare still well below the peaks in the earlydecades of the study, this recent recoveryhas improved the trend for this widespreadearly-summer species.
Drinker Euthrix potatoria was categorised as a declining species inthe 35-year study, but its populationincreased markedly in recent years,and its overall trend is now an increase.The four best years for Drinker moth since monitoring began in 1968occurred between 2003 and 2006.
Sharp-angled Carpet Euphyiaunangulata has also undergone a majorimprovement in population levels, withhigh abundance in all five of the mostrecent years in the study. This has changedquite a steep decline over the 35-yearperiod into a slight increase over 40 years.
White Ermine Spilosoma lubricipeda R. Scopes
Drinker Euthrix potatoria R. Hatcliffe
Sharp-angled Carpet Euphyia unangulata P. Harris
The average improvement of moth trends as a result of adding anextra five years of national population data has not been reflected in all species. The graphs for some rapidly declining species, such asV-moth, Grey Chi and August Thorn (see p10-11), show that the mostrecent years were very poor for these moths. However, the trendsfor 15 species, previously categorised as strongly or very stronglydeclining, have ameliorated to the extent that these species are nowin the declining category. These include the Cinnabar Tyria jacobaeae,Small Emerald Hemistola chrysoprasaria, White Ermine Spilosomalubricipeda (see below), Buff Ermine Spilosoma luteum, Ghost MothHepialus humuli and Ear Moth Amphipoea oculea, all of which wereamong the most rapidly declining species in the 35-year analysis
15. None
of these moths remain in the strongly declining category in the 40-yearstudy. However, the 40-year trends of the Cinnabar (67% decrease),Small Emerald (64% decrease), White Ermine (70% decrease), BuffErmine (68% decrease) and Ghost Moth (62% decrease) are stillworrying. In contrast, Ear Moth populations have recovered to suchan extent that this species now shows little overall change during the40-year period. Some other species that were in decline (albeit not strongdecline) have improved substantially in the new analysis (see below).
Mea
n d
iffer
ence
bet
wee
n 35
/40
yr s
lop
es
All (B)
All (N)
VS/S declining (B)
Declining (B)
Increasing (B)
VS/S Increasing (B)
VS/S declining (S)
VS/S declining (N)
VS/S increasing (S)
VS/S increasing (N)
Declining (S)
Declining (N)
Increasing (S)
Increasing (N)
All (S)
-0.010
-0.005
0.005
0.010
0.000

Biodiversity loss and human wellbeingThe world is facing a biodiversity crisis with profoundconsequences for human wellbeing. The decline and extinctionof species is occurring at a rapid rate17, described by somescientists as the sixth mass extinction event to occur during theearth’s history18 (the previous one put paid to the dinosaurs some65 million years ago). There is little indication that the rate ofbiodiversity loss is slowing, despite high-profile political promises19.
Humans are not passive bystanders in this process. All of theprincipal causes of current biodiversity loss are directly relatedto human activity20 and this loss threatens natural processes upon which the human race depends21. They include ‘ecosystemservices’ such as pollination, nutrient cycling and the provision ofclean water22. To put it simply, we cannot live without biodiversity.
Wider moth declinesThe significant declines of larger moths in Britain, revealedby studies of the Rothamsted light-trap network data,provided the first evidence of national-scale population trendsin this species-rich insect group23. However, similar patterns of decline among moths have also now been reported fromother European countries. In the Netherlands, for example,71% of 733 larger moth species decreased in abundanceand the total abundance of moths decreased by one-thirdover the period 1980-200924; strikingly similar results to theBritish findings. In Finland, analysis of long-term distributionrecords showed significant overall decreases in the distributionof larger moths in the families Geometridae and Noctuidae(590 species in total)25. Preliminary analysis of the newNational Moth Recording Scheme dataset in the UK alsoindicated severe contractions in the distributions of somelarger moths26.
Taken together, these studies provide overwhelming evidenceof moth declines on a large geographical scale and mirrorprevious studies of butterflies. Such losses are likely to havesubstantial impacts on other organisms, because of theimportance of moths as herbivores, pollinators and prey items27
and, therefore, affect the delivery of some ecosystem services.
Declines of other insectsAlthough insects make up the majority of global animalbiodiversity, little is known about their trends28. Thankfully, this isstarting to change, at least for a few well-studied insect groupsin developed countries. Assessments have been carried outinitially for butterflies29, but now also for some bees30, beetles31
and, of course, larger moths.
The results are unequivocal: insect biodiversity isdeclining rapidly and, in many cases, it is specialistspecies that are being lost, while a relatively smallnumber of generalist species come to dominateonce-diverse wildlife communities.
Wider contextDeclines in moth populations add to growing evidence that theworld is undergoing substantial declines in its biodiversity.
18
17 Thomas et al. 2004a, May 201018 Barnosky et al. 201119 Butchart et al. 201020 UK National Ecosystem Assessment 201121 Chapin et al. 2000, Balmford & Bond 2005,Rockström et al. 2009, UK National EcosystemAssessment 2011
22 Cardinale et al. 2006, Isbell et al. 201123 Conrad et al. 200624Groenendijk & Ellis 201125Mattila et al. 2006, 200826 Fox et al. 2011a27 see refs. in Young 2002, Fox et al. 2006,Devoto et al. 2011
28 Dunn 2005, Thomas 200529Warren et al. 2001, van Swaay et al. 2006,Van Dyck et al. 2009, Fox et al. 2011b
30 Biesmeijer et al. 2006, Goulson et al. 2008,Cameron et al. 2011
31 Kotze & O’Hara 2003, Brooks et al. 2012
Wheatear eating an Emperor moth Saturnia pavonia S. Batt

Understanding of the major factors that are driving thechanges revealed in this report remains limited. There is littledirect evidence linking moth population (or distribution) trendsto particular drivers of change. However, information continuesto accumulate, and gradually a clearer understanding of thecomplex situation is starting to emerge. A comprehensivereview of the evidence has recently been published32, andthe main potential causes of change are summarised here.
Habitat changeHabitat loss (including degradation of habitat quality andthe effects of fragmentation) is a major cause of biodiversityloss in Britain and worldwide. It would be extraordinaryif widespread larger moths had not been affected by themassive habitat changes in the British countryside broughtabout by agricultural intensification, changing woodlandmanagement and urbanisation over the past 40 years.
Several studies have shown higher abundance and speciesrichness of moths associated with lower intensity farmingpractices implemented as part of organic conversion,agri-environment schemes or experimental treatments33.In particular, moths benefit from the presence of field marginsand boundary features, including mature trees34. Conversely,we might assume that the general intensification of agriculturalmanagement that has taken place since the 1950s, whichhas included widespread loss of hedgerows, boundary treesand botanically-rich field margins, as well as the intensiveuse of pesticides, will have impacted negatively on moths.
In broad-leaved woodland, changing management overrecent decades has led to greatly reduced open space withinwoods and increased shade. The subsequent changes inplant communities, micro-climates and vegetation structureappear to have been detrimental to a wide range of woodlandwildlife including birds, butterflies and plants. Some woodlandspecialist moths may have benefitted from these changesin management, but many generalist species or moths thatrequire open conditions in woods are likely to have declined35.Past and future threats to native tree species, such asDutch Elm Disease, Ash Dieback Disease and Sudden OakDeath, may have substantial impacts on associated moths.
In contrast, the widespread planting of coniferous trees forcommercial forestry and as ornamentals has provided a greatlyincreased habitat resource for larger moths with caterpillarsthat feed on these trees. Blair’s Shoulder-knot Lithophaneleautieri (7878% population increase over 40 years), SatinBeauty Deileptenia ribeata (2928% increase), Spruce CarpetThera britannica (1731% increase), Juniper Carpet T. juniperata(836% increase), Pine Beauty Panolis flammea (345% increase)and Pine Carpet T. firmata (336% increase) will all have benefittedfrom increased planting of native and non-native conifers.
Nutrient enrichmentThe fertility of soil and water is increasing (eutrophication)as a result of nutrients released into the environment (e.g. byagriculture, vehicle emissions). The impacts are pervasive andsubstantial, altering plant communities and vegetation structure,and generally have a detrimental effect on biodiversity36.Moths associated with low nutrient habitats and larval foodplantsthat are unable to compete in high fertility conditions are likelyto have declined, but this remains to be proven.
Causes of change for Britain’s larger mothsThere are a number of possible causes for the observed changes in moth biodiversity;principally degradation of habitat quality and climate change. However, more research isneeded to adequately explain changes in Britain’s larger moth fauna.
19
32 Fox 201233Wickramasinghe et al. 2004, Littlewood 2008, Taylor & Morecroft 2009, Fuentes-Montemayoret al. 2011, Merckx et al. 2012a
34 Pocock & Jennings 2008, Merckx et al. 2009,Merckx et al. 2012a
35 Broome et al. 2011, Clarke et al. 2011,Merckx et al. 2012b
36 Bobbink et al. 1998, Stevens et al. 2004, UKEcosystem Assessment 2011
Pine Beauty Panolis flammea 345% increase P. Withers

Climate changeClimate change is causing numerouschanges in the geographical range,abundance, phenology, ecology andinteractions of species37 and is widelyperceived as a significant and increasingrisk to global biodiversity38. Evidence ofmoth responses to climate change includeuphill shifts39, changes in voltinism andphenology40, potential disruption of foodchains41 and increasing immigration42.
In Britain, evidence of the impact of climatechange on moth populations and distributionsis emerging. There are numerous examplesof larger moths that are expanding theirdistributions northwards, for which climatechange is the most likely or only plausible
explanation43 (e.g. Fig. 6). Some of thesespecies also have increasing 40-yearpopulation trends, including Least Carpetand Marbled White Spot (see p12-13),Shuttle-shaped Dart Agrotis puta (seebelow), Red-green Carpet Chloroclystasiterata, Black Arches Lymantria monachaand Yellow-barred Brindle Acasis viretata.
Meanwhile other species may be decliningin response to changing climatic patterns.The Garden Tiger is the best studiedexample, with population levels negativelycorrelated with higher winter rainfall andspring temperature44, but other studieshave found population declines amongmoths with northerly distributions45.
Climate change is also affecting thetiming and, indeed, number of mothgenerations during the year for somespecies especially in northern parts ofBritain. In Yorkshire, species such asGreen Carpet Colostygia pectinataria,Flame Shoulder Ochropleura plecta,Setaceous Hebrew Character Xestiac-nigrum, Common Wainscot Mythimnapallens, Straw Dot Rivula sericealis andSnout Hypena proboscidalis have allbecome regularly double brooded inrecent decades46.
20
37Walther et al. 2002, Root et al. 2003, Hicklinget al. 2006, Parmesan 2006, Chen et al. 2011
38 Thomas et al. 2004b, Thuiller et al. 2005,Maclean & Wilson 2011
39 Chen et al. 2009, Dieker et al. 201140 Altermatt 2010, Pöyry et al. 201141 Both et al. 200942 Sparks et al. 2005
43 Fox et al. 2011a44 Conrad et al. 200245 Conrad et al. 2004, Morecroft et al. 200946 Fletcher 2006
1991 to 2011
1968 to 1990
Shuttle-shaped Dart
New squares1991 to 2011
1968 to 1990
Pale Pinion
New squares1991 to 2011
1968 to 1990
Red Underwing
New squares
Pale PinionNew Squares
1991 to 20111968 to 1990
Shuttle-shaped DartNew Squares
1991 to 20111968 to 1990
Red UnderwingNew Squares
1991 to 20111968 to 1990
Figure 6 The distributions of Pale Pinion Lithophane hepatica, Shuttle-shaped Dart Agrotis puta and Red Underwing Catocala nupta have increased northwards substantially, probably as a result of climate change.

21
47 van Asch & Visser 200748WallisDeVries & van Swaay 2006
There are many ways in which changing climate could influencethe population levels or distributions of larger moths. Someare obvious, for example if mortality is directly related to climaticconditions (e.g. cold temperatures) or if a certain threshold ofwarmth is needed over a certain duration of time in order tocomplete larval development. Others may be much morecomplex, such as mismatches in timing between moths andtheir larval foodplants as a result of differing rates of phenologicalchange47 or longer growing seasons for plants leading to changes in vegetation structure and micro-climates48.
For many widespread larger moths, the warming climate shouldimprove conditions in Britain leading to longer flight periods,additional generations (see box on p22), and an increase in theextent of the landscape that is suitable for habitation, leading toincreased distribution and population sizes. However, climatechange also brings much uncertainty and concerns for moths thatoccur at high altitude or latitude and those that occur on low-lyingcoastal habitats such as salt marshes and fens. In addition,climate change may make Britain more hospitable to mothsthat are pests in agriculture or forestry.
Jersey Tiger Euplagia quadripunctaria spread rapidly in Britainover the past two decades. It originally became established insouth Devon c.1880 and this situation persisted with little changefor a century, although occasional immigrant individuals occurredalong the south coast of England. However, in the 1990s themoth started to spread westwards and northwards within Devonand into Dorset. This accelerated during the 2000s, with furtherspread across Dorset and establishment in Somerset. Elsewhere,Jersey Tiger became firmly established on the Isle of Wight inthe 1990s, and formed a small colony in east Sussex.
After the millennium, the moth became established in Kent,first on the coast and later in north Kent and south London.Just in the last few years, Jersey Tiger has spread very rapidlyin south London, from the leafy Kent and Surrey suburbs rightthrough the inner city to start appearing in north London andbeyond (first Hertfordshire record in 2012).
Although some introductions of this species have taken place,the overall spread of this moth in Britain seems most likely to bedriven by climate change.
Jersey Tiger Euplagia quadripunctaria L. Sebastiani
Jersey TigerNew Squares
1991 to 20111968 to 1990

22
49 Bruce-White & Shardlow 201150 Davies et al. 2012
Light pollutionLight pollution has long been recognisedas a potential problem for moths and otherwildlife49. It can alter moths’ behaviour,life cycles and predation rates, as well as, in some cases, killing moths directlythrough contact with hot bulbs or glass.However, there are no studies that havemeasured the impact of outdoor lightingon moth populations and communities.Thus we do not know whether themassive increase in background lightlevels in Britain has made any contributionto the trends reported here. Hopefully,this situation will change in the nearfuture as there is increasing interest inand concern about the impact of lightpollution on biodiversity. For example,recent work has shown effects of streetlighting on the numbers and types ofground-dwelling invertebrates in Britain50,the first time that light has been shownto affect wildlife communities.
Moth around light L. NilssonL. Nilsson
Light Emerald Campaea margaritata has become much more strongly doublebrooded over recent decades, presumably in response to climate change. Datafrom the National Moth Recording Scheme show that almost all Light Emeraldsightings in the 1970s were during a single main flight period from the beginningof June until mid-August, with only a small proportion of later, second generationindividuals. This has changed substantially, with a prominent second generation now recorded from mid-August through to early October, as well as a slightlyearlier emergence and peak of the first generation.
Light Emerald Campaea margaritata D. Green
900
800
700
15 16 17 18 19 20 21 22 23 24 25 26 27 28 29 30 31 32 33 34 35 36 37 38 39 40 41 42 43 44 45
600
500
400
300
200
100
0
1970-1979
Week number
Num
ber
of
reco
rds
7000
6000
15 16 17 18 19 20 21 22 23 24 25 26 27 28 29 30 31 32 33 34 35 36 37 38 39 40 41 42 43 44 45
5000
4000
3000
2000
1000
0
Num
ber
of
reco
rds
Week number
2000-2010

Moth conservationOver the past 15 years, action to conserve moths in Britain has increased substantially.Spearheaded by Butterfly Conservation’s Action for Threatened Moths project, but involving numerousorganisations, local groups and individuals, dozens of projects have been undertaken to improveknowledge, habitat and land management to benefit Britain’s most endangered larger moths51.
23
51 Parsons et al. 201152 Parsons & Davis 200753 Fox et al. 2006
At the beginning of this century there were 53 moths listed asPriority Species in the UK Biodiversity Action Plan (BAP), all butone of which were larger moths. When the UK BAP was revisedin 2007, this number rose to 81 (of which 25 were micro-moths)and, in addition, 71 widespread but rapidly declining larger mothswere added52. This latter group were species identified from the35-year population trends assessed in the first State of Britain’sLarger Moths report53 and were included in the UK BAP as“research only” with the aim of stimulating research into thecauses of decline among common moths.
The inclusion of so many moths in the UK BAP had enormousbenefits for moth conservation, raising awareness of threatenedspecies, stimulating habitat management and generating fundingfrom government for surveys, monitoring, ecological studiesand direct conservation action. Many other non-target wildlifespecies have also benefitted.
Progress has been made for 69 threatened moth species,ranging from improved distribution information through to activeprogrammes of habitat creation and management, speciesreintroductions and advice to landowners51. Highly targeted grantschemes, such as higher-level agri-environment schemes andwoodland grants, and land-fill tax projects have benefitted manyUK BAP moths.
Sadly, the UK BAP has now been replaced with a governmentfocus on ecosystem services and funding for targeted speciesconservation has been reduced. Nevertheless, vital work toconserve individual threatened species continues. In England,142 moth species (all of those previously included in the UK BAP)are listed as Species of Principal Importance in England underSection 41 of the Natural Environment and Rural CommunitiesAct. In addition, 97 moths are listed on the equivalent list inWales (Section 42 list) and 29 species are included in theScottish Biodiversity List.
Some notable examples of conservation action for threatenedmoths are given on p25.
Annual monitoring and regular site management adviceis needed to maintain the handful of Black-veined MothSiona lineata populations in Britain. M. Parsons
Map showing the number of UK BAPlarger moth priority species (excludingthe “research only” species) recordedin each 10km x 10km grid square inBritain during the period 2000-2011.
No. of species
87654321

24
Landscape-scale conservationOver the past decade, conservationists have realised thatmany threatened species are best conserved by landscape-scale projects (see box right). This approach aims to co-ordinatehabitat management and restoration across many sites inthe local landscape, rather than treating each in isolation. This improves the chances of species’ survival in the long termby increasing the amount of suitable habitat in the landscape,maximising both the size and number of colonies54 and byallowing the natural processes of colonisation and extinctionto occur at individual sites.
Landscape-scale conservation also brings other benefitsincluding improvements in the cost efficiency and logisticsof habitat management, employment, partnerships betweenorganisations from statutory, private and non-governmentalsectors, and far greater involvement of local communities.
Targeted conservation of rare speciesWhile landscape-scale conservation is a good approachfor many species and biodiversity as a whole, rare speciesstill need targeted conservation on specific sites if they are tosurvive. Many, such as the Reddish Buff Acosmetia caliginosa,Marsh Moth Athetis pallustris, New Forest Burnet Zygaenaviciae and Sussex Emerald Thalera fimbrialis, are reducedto one or a few isolated sites that need to be protectedand managed appropriately.
Moth conservation in the wider countrysideWhile site-based and landscape-scale conservation projectsprovide the focus for ongoing efforts to prevent the extinctionof threatened moths, the rapid declines of widespread (and insome cases still common) larger moths described in this reportnecessitate the restoration of habitats and adoption of lessenvironmentally-damaging activities on a massive scale.
Mass-participation ‘entry level’ agri-environment schemes, for example, could deliver significant improvements, but onlyif such schemes are evidence-based, properly resourced,targeted and monitored. To date, such schemes appear to havehad little measurable benefit for moths or other wildlife, despitelarge investment of public money55. In particular, there is a vitalneed to ensure that habitats created or managed under suchgovernment grants are capable of providing sufficient breedinghabitat and other important resources to enable local mothpopulations to increase. This will require new research tounderstand the effects of different management options onmoth populations.
Heavy machinery creating Breckland plots S. Hearle
The first ever landscape-scale conservation project focussingon moths started in the Breckland of East Anglia in 2008.Butterfly Conservation led a partnership of organisations andvolunteers to recreate the traditional disturbed ground habitatsof Breckland, which are vital to the survival of many scarcewildlife species including threatened moths such as the GreyCarpet Lithostege griseata, Basil Thyme Case-bearer Coleophoratricolor, Lunar Yellow Underwing Noctua orbona, Marbled Clover Heliothis viriplaca and Forester Adscita statices.
Fifty-nine large strips of bare ground were created, trialling avariety of techniques from rotovation to turf stripping. Follow-upsurveys showed a rapid and highly successful colonisation ofthe bare ground plots by plants and target moths. During threeyears of surveys, target moths were recorded on over 50% ofthe plots, with Grey Carpet and Lunar Yellow Underwing larvaefound on 13% and 27% of all plots respectively56.
Breckland plot with Viper’s Bugloss S. Hearle
54 Hodgson et al. 201155 Kleijn et al. 201156 Ellis et al. 2012
25
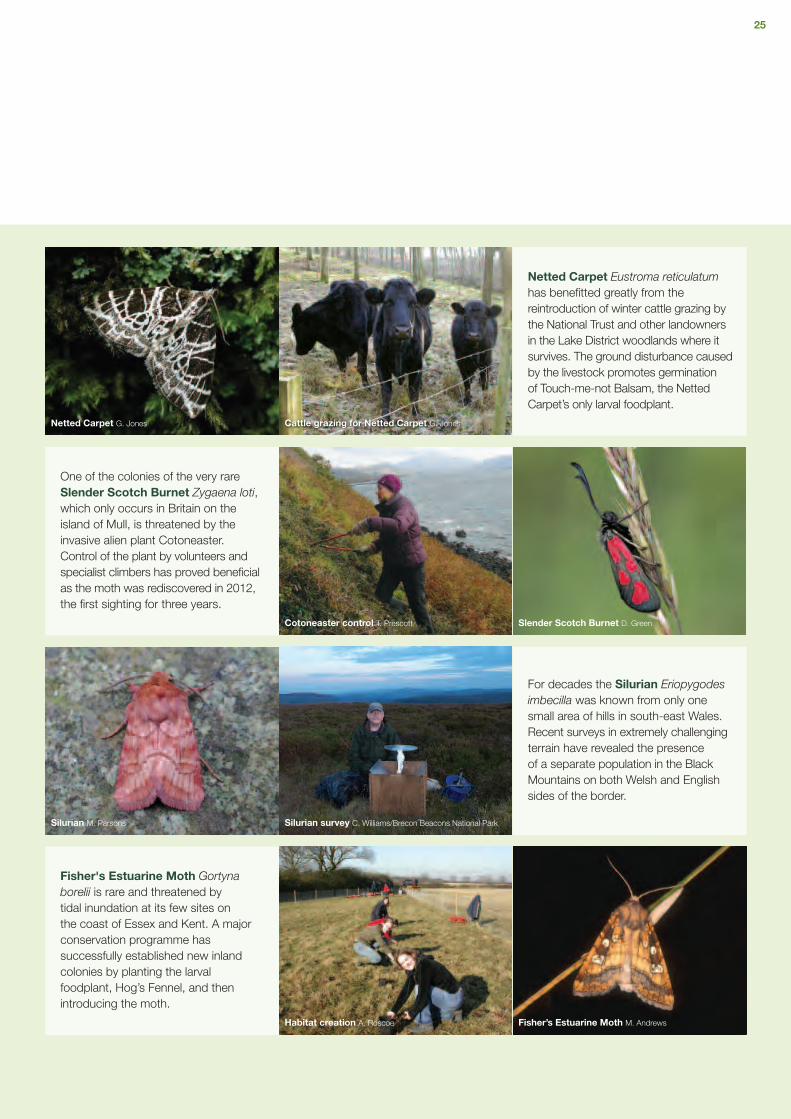
Netted Carpet Eustroma reticulatumhas benefitted greatly from thereintroduction of winter cattle grazing bythe National Trust and other landownersin the Lake District woodlands where itsurvives. The ground disturbance causedby the livestock promotes germination of Touch-me-not Balsam, the NettedCarpet’s only larval foodplant.
One of the colonies of the very rareSlender Scotch Burnet Zygaena loti,which only occurs in Britain on theisland of Mull, is threatened by theinvasive alien plant Cotoneaster.Control of the plant by volunteers andspecialist climbers has proved beneficialas the moth was rediscovered in 2012,the first sighting for three years.
For decades the Silurian Eriopygodesimbecilla was known from only onesmall area of hills in south-east Wales.Recent surveys in extremely challengingterrain have revealed the presenceof a separate population in the BlackMountains on both Welsh and Englishsides of the border.
Fisher's Estuarine Moth Gortynaborelii is rare and threatened bytidal inundation at its few sites onthe coast of Essex and Kent. A majorconservation programme hassuccessfully established new inlandcolonies by planting the larvalfoodplant, Hog’s Fennel, and thenintroducing the moth.
Netted Carpet G. Jones Cattle grazing for Netted Carpet G. Jones
Cotoneaster control T. Prescott Slender Scotch Burnet D. Green
Silurian M. Parsons Silurian survey C. Williams/Brecon Beacons National Park
Habitat creation A. Roscoe Fisher’s Estuarine Moth M. Andrews

26
With over 2,500 species recorded, moths comprise a substantialpart of Britain’s biodiversity and play important roles in foodchains. Although a species-rich group, there is considerablepublic and scientific interest in moths and moth recording.The Rothamsted Insect Survey and National Moth RecordingScheme provide long time-series of data collected by thousandsof volunteer naturalists. Through these world-class schemes,reliable population and distribution information can be assessedfor hundreds of larger moths. This is important as mostassessments of insect biodiversity loss rely heavily on a fewcharismatic but species-poor groups, such as butterflies andbumblebees, which may be less representative of other insects.
The substantial decline of Britain’s larger moths is one of theclearest signals yet of potentially catastrophic biodiversity losscaused by human impacts on the environment, which is of greatconservation concern and potentially threatens some of theecosystem services upon which the human race depends.
It is tempting to focus on the minority of moth species thatare faring well, spreading northwards, increasing in abundanceor arriving more frequently as immigrants. However, this wouldbe to ignore the bigger picture; there are significantly fewerindividual moths in Britain now than 40 years ago and, whilemany rapidly declining moths are still regularly recorded in backgardens and other habitats across the country, their populationsare a shadow of their former selves. Like the House Sparrow,Hedgehog and Small Tortoiseshell butterfly, moths that wereonce taken for granted, such as V-moth and Garden Tiger,are now unusual sightings in many people’s gardens.
The future for Britain’s moths is uncertain. Conservation effortstargeted at threatened species have yielded positive results, butmore is needed. Funding cuts and shifting government policy(away from the species-focussed UK BAP approach) threaten thishard-fought progress. Likewise, for more widespread species, theoptimism that ‘entry level’ agri-environment schemes would seethe restoration of wildlife-friendly habitats on a massive scale acrossthe landscape has melted away. The need remains, but tax-payers’money needs to be spent more judiciously on managementoptions with proven benefits for wildlife and the environment.
What is certain is that change will continue. Moth populationsare naturally dynamic, responding to short-term weatherand long-term climate variation, as well as other environmentalfactors. Over time species have waxed and waned, new onescontinue to arrive and some will inevitably be lost. However,we are witnessing a period of increased change, driven largelyby human activity, with increasing numbers of new arrivalsand significant declines in many of our native species. It is vitalthat increased conservation effort is undertaken to ensure thenet effect of this change is positive rather than negative.
ConclusionsThe new 40-year national population trends and other results presented here provideoverwhelming evidence of moth declines. This reinforces previous findings for British moths57
and mirrors declines recorded in other wildlife groups.
Archer’s Dart Agrotis vestigialis 68% decrease C. Manley
Pink-barred Sallow Xanthia togata 58% decrease R. Thompson
57 Fox et al. 2006

27
Alerstam, A., Chapman, J.W., Bäckman, J., Smith,A.D., Karlsson, H., Nilsson, C., Reynolds, D.R.,Klaassen, R.H.G. & Hill, J.K. (2011) Convergentpatterns of long-distance nocturnal migration innoctuid moths and passerine birds. Proceedingsof the Royal Society B, 278, 3074–3080.
Altermatt, F. (2010) Climatic warming increasesvoltinism in European butterflies and moths.Proceedings of the Royal Society B, 277,1281–1287.
Balmford, A. & Bond, W. (2005) Trends in thestate of nature and their implications for humanwell being. Ecology Letters, 8, 1218–1234.
Barnosky, A.D., et al. (2011) Has the Earth’ssixth mass extinction already arrived? Nature,471, 51–57.
Biesmeijer, J.C., et al. (2006) Parallel declines inpollinators and insect-pollinated plants in Britainand the Netherlands. Science, 313, 351–354.
Bobbink, R., Hornung, M. & Roelofs, J.G.M.(1998) The effects of air-borne nitrogen pollutantson species diversity in natural and semi-naturalEuropean vegetation. Journal of Ecology,86, 717–738.
Both, C., van Asch, M., Bijlsma, R., van den Berg,A.B. & Visser, M.E. (2009) Climate change andunequal phenological changes across four trophiclevels: constraints or adaptations? Journal ofAnimal Ecology, 78, 73–83.
Brooks, D.R., Bater, J.E., Clark, S.J., Monteith,D.T., Andrews, C., Corbett, S.J., Beaumont, D.A.& Chapman, J.W. (2012) Large carabid beetledeclines in a United Kingdom monitoring networkincreases evidence for a widespread loss in insectbiodiversity. Journal of Applied Ecology, 49,1009–1019.
Broome, A., Clarke, S., Peace, A. & Parsons, M.(2011) The effect of coppice management onmoth assemblages in an English woodland.Biodiversity and Conservation, 20, 729–749.
Bruce-White, C. & Shardlow, M. (2011) A Reviewof the Impact of Artificial Light on Invertebrates.Buglife, Peterborough, UK.
Butchart, S.H.M., et al. (2010) Global biodiversity:indicators of recent declines. Science, 328,1164–1168.
Cameron, S.A., Lozier, J.D., Strange, J.P., Koch,J.B., Cordes, N., Solter, L.F. & Griswold, T.L.(2011) Patterns of widespread decline in NorthAmerican bumble bees. Proceedings of theNational Academy of Sciences, 108, 662–667.
Cardinale, B.J., Srivastava, D.S., Duffy, J.E.,Wright, J.P., Downing, A.L., Sankaran, M. &Jouseau, C. (2006) Effects of biodiversity on thefunctioning of trophic groups and ecosystems.Nature, 443, 989–992.
Chapin III, F., et al. (2000) Consequences ofchanging biodiversity. Nature, 405, 234–242.
Chapman, J.W., Drake, V.A. & Reynolds, D.R.(2011) Recent insights from radar studies of insectflight. Annual Review of Entomology, 56, 337–356.
Chapman, J.W., Nesbit, R.L., Burgin, L.E.,Reynolds, D.R., Smith, A.D., Middleton, D.R. & Hill,J.K. (2010) Flight orientation behaviours promoteoptimal migration trajectories in high-flying insects.Science, 327, 682–685.
Chen, I-C., Hill, J.K., Ohlemüller, R., Roy, D.B.& Thomas, C.D. (2011) Rapid range shifts ofspecies associated with high levels of climatewarming. Science, 333, 1024–1026.
Chen, I-C., Shiu, H-J., Benedick, S., Holloway,J.D., Khen Chey, V., Barlow, H.S., Hill, J.K. &Thomas, C.D. (2009) Elevation increases in mothassemblages over 42 years on a tropical mountain.Proceedings of the National Academy of Sciences,106, 1479–1483.
Clarke, S.A., Green, D.G., Bourn, N.A. & Hoare,D.J. (2011) Woodland Management for Butterfliesand Moths: A Best Practice Guide. ButterflyConservation, Wareham, UK.
Conrad, K.F., Fox, R. & Woiwod, I.P. (2007)Monitoring biodiversity: measuring long-termchanges in insect abundance. Insect ConservationBiology (ed. by A.J.A. Stewart, T.R. New andO.T. Lewis), pp. 203–225. CABI publishing,Wallingford, UK.
Conrad, K.F., Warren, M., Fox, R., Parsons, M.& Woiwod, I.P. (2006) Rapid declines of common,widespread British moths provide evidence of aninsect biodiversity crisis. Biological Conservation,132, 279–291.
Conrad, K.F., Woiwod, I.P., Parsons, M., Fox, R.& Warren, M. (2004) Long-term population trendsin widespread British moths. Journal of InsectConservation, 8, 119–136.
Conrad, K.F., Woiwod, I.P. & Perry, J.N. (2002)Long-term decline in abundance and distributionof the garden tiger moth (Arctia caja) in GreatBritain. Biological Conservation, 106, 329–337.
Davies, T.W., Bennie, J. & Gaston, K.J. (2012)Street lighting changes the composition ofinvertebrate communities. Biology Letters,8, 764–767.
Devoto, M., Bailey, S. & Memmott, J. (2011)The ‘night-shift’: nocturnal pollen-transportnetworks in a boreal pine forest. EcologicalEntomology, 36, 25–35.
Dieker. P., Drees, C. & Assmann, T. (2011)Two high-mountain burnet moth species(Lepidoptera, Zygaenidae) react differently tothe global change drivers climate and land-use.Biological Conservation, 144, 2810–2818.
Dunn, R.R. (2005) Modern insect extinctions,the neglected majority. Conservation Biology,19, 1030–1036.
Ellis, S., Bulman, C.R. & Bourn, N.A.D. (2012)Landscape-scale conservation for butterfliesand moths: lessons from the UK. ButterflyConservation, Wareham, Dorset.
Fletcher, C.H. (2006) Changes in the behaviourof double-brooded macro moths in Yorkshire.Entomologist’s Record and Journal of Variation,118, 105–113.
Fox, R. (2012) The decline of moths inGreat Britain: a review of possible causes.Insect Conservation and Diversity, DOI:10.1111/j.1752-4598.2012.00186.x
Fox, R., Brereton, T.M., Roy, D.B., Asher, J.& Warren, M.S. (2011b) The State of the UK’sButterflies 2011. Butterfly Conservation andthe Centre for Ecology & Hydrology, Wareham,Dorset, UK.
Fox, R., Conrad, K.F., Parsons, M.S., Warren,M.S. & Woiwod, I.P. (2006) The State of Britain’sLarger Moths. Butterfly Conservation andRothamsted Research, Wareham, UK.
Fox, R., Randle, Z., Hill, L., Anders, S., Wiffen, L.& Parsons, M.S. (2011a) Moths Count: recordingmoths for conservation in the UK. Journal ofInsect Conservation, 15, 55–68.
Fuentes-Montemayor, E., Goulson, D. & Park, K.(2011) The effectiveness of agri-environmentschemes for the conservation of farmland moths:assessing the importance of a landscapescalemanagement approach. Journal of AppliedEcology, 48, 532–542.
Goulson, D., Lye, G.C. & Darvill, B. (2008)Decline and conservation of bumble bees.Annual Review of Entomology, 53, 191–208.
Groenendijk, D. & Ellis, W.N. (2011) The stateof the Dutch larger moth fauna. Journal of InsectConservation, 15, 95–101.
Hickling, R., Roy, D.B., Hill, J.K., Fox, R. &Thomas, C.D. (2006) The distributions of a wide range of taxonomic groups are expandingpolewards. Global Change Biology, 12, 450–455.
References
28
Hodgson, J.A., Moilanen, A., Wintle, B.A. &Thomas, C.D. (2011) Habitat area, quality andconnectivity: striking the balance for efficientconservation. Journal of Applied Ecology, 48,148–152.
Isbell, F., et al. (2011) High plant diversity isneeded to maintain ecosystem services. Nature,477, 199–202.
Kleijn, D., Rundlöf, M., Scheper, J., Smith, H.G.& Tscharntke, T. (2011) Does conservation onfarmland contribute to halting the biodiversitydecline? Trends in Ecology & Evolution, 26,474–481.
Kotze, D.J. & O’Hara, R.B. (2003) Speciesdecline – but why? Explanations of carabid beetle(Coleoptera, Carabidae) declines in Europe.Oecologia, 135, 138–148.
Littlewood, N.A. (2008) Grazing impacts on mothdiversity and abundance on a Scottish uplandestate. Insect Conservation and Diversity, 1,151–160.
Maclean, I.M.D. & Wilson, R.J. (2011) Recentecological responses to climate change supportpredictions of high extinction risk. Proceedingsof the National Academy of Sciences, 108,12337–12342.
Mattila, N., Kaitala, V., Komonen, A., Kotiaho,J.S. & Päivinen, J. (2006) Ecological determinantsof distribution decline and risk of extinction inmoths. Conservation Biology, 20, 1161–1168.
Mattila, N., Kotiaho, J.S., Kaitala, V. & Komonen,A. (2008) The use of ecological traits in extinctionrisk assessments: a case study on geometridmoths. Biological Conservation, 141, 2322–2328.
May, R.M. (2010) Ecological science andtomorrow’s world. Philosophical Transactionsof the Royal Society B, 365, 41–47.
Merckx, T., Feber, R.E., Riordan, P., Townsend,M.C., Bourn, N.A.D., Parsons, M.S. & Macdonald,D.W. (2009) Optimizing the biodiversity gain fromagri-environment schemes. Agriculture,Ecosystems and Environment, 130, 177–182.
Merckx, T., Marini, L., Feber, R.E. & Macdonald,D.W. (2012a) Hedgerow trees and extended-widthfield margins enhance macro-moth diversity:implications for management. Journal of AppliedEcology, doi: 10.1111/j.1365-2664.2012.02211.x
Merckx, T., Feber, R.E., Hoare, D.J., Parsons,M.S., Kelly, C.J., Bourn, N.A.D. & Macdonald,D.W. (2012b) Conserving threatened Lepidoptera:Towards an effective woodland managementpolicy in landscapes under intense humanland-use. Biological Conservation, 149, 32–39.
Morecroft, M.D., et al. (2009) The UKEnvironmental Change Network: emergingtrends in the composition of plant and animalcommunities and the physical environment.Biological Conservation, 142, 2814–2832.
Parmesan, C. (2006) Ecological and evolutionaryresponses to recent climate change. AnnualReview of Ecology, Evolution and Systematics,37, 637–669.
Parsons, M.S. (2003) The changing moth fauna ofBritain during the twentieth century. Entomologist’sRecord and Journal of Variation, 115, 49–66.
Parsons, M. & Davis, T. (2007) Revisions to themoths included within the UK Biodiversity ActionPlan. Atropos, 32, 4–11.
Parsons, M., Hearle, S., Noake, B., Prescott,T., Rosenthal, A. & Bourn, N. (2011) Mothconservation at Butterfly Conservation – tenyears of progress. Atropos, 43, 55–72.
Pocock, M.J.O. & Jennings, N. (2008) Testingbiotic indicator taxa: the sensitivity of insectivorousmammals and their prey to the intensification oflowland agriculture. Journal of Applied Ecology,45, 151–160.
Pöyry, J., Leinonen, R., Söderman, G., Nieminen,M., Heikkinen, R.K. & Carter, T.R. (2011) Climate-induced increase of moth multivoltinism in borealregions. Global Ecology and Biogeography,20, 289–298.
Rockström, J., et al. (2009) A safe operatingspace for humanity. Nature, 461, 472–475.
Root, T.L., Price, J.T., Hall, K.R., Schneider, S.H.,Rosenzweig, C. & Pounds, J.A. (2003) Fingerprintsof global warming on wild animals and plants.Nature, 421, 57–60.
Sparks, T.H., Roy, D.B. & Dennis, R.L.H. (2005)The influence of temperature on migration ofLepidoptera into Britain. Global Change Biology,11, 507–514.
Stevens, C.J., Dise, N.B., Mountford, J.O.& Gowing, D.J. (2004) Impact of nitrogendeposition on the species richness of grasslands.Science, 303, 1876–1879.
Taylor, M.E. & Morecroft, M.D. (2009) Effectsof agri-environment schemes in a long-termecological time series. Agriculture, Ecosystemsand Environment, 130, 9–15.
Thomas, C.D., et al. (2004b) Extinction risk fromclimate change. Nature, 427, 145–148.
Thomas, J.A. (2005) Monitoring change in theabundance and distribution of insects usingbutterflies and other indicator groups.Philosophical Transactions of the Royal SocietyB, 360, 339–357.
Thomas, J.A., Telfer, M.G., Roy, D.B., Preston,C.D., Greenwood, J.J.D., Asher, J., Fox, R.,Clarke, R.T. & Lawton, J.H. (2004a) Comparativelosses of British butterflies, birds, and plantsand the global extinction crisis. Science, 303,1879–1881.
Thuiller, W., Lavorel, S., Araújo, M.B., Sykes, M.T.& Prentice, I.C. (2005) Climate change threatsto plant diversity in Europe. Proceedings of theNational Academy of Sciences, 102, 8245–8250.
UK National Ecosystem Assessment (2011) TheUK National Ecosystem Assessment: Synthesis ofthe Key Findings. UNEP-WCMC, Cambridge, UK.
van Asch, M. & Visser, M.E. (2007) Phenologyof forest caterpillars and their host trees: theimportance of synchrony. Annual Review ofEntomology, 52, 37–55.
Van Dyck, H., van Strien, A.J., Maes, D. & vanSwaay, C.A.M. (2009) Declines in common,widespread butterflies in a landscape under intensehuman use. Conservation Biology, 23, 957–965.
van Swaay, C., Warren, M.S. & Lois, G. (2006)Biotope use and trends of European butterflies.Journal of Insect Conservation, 10, 189–209.
WallisDeVries, M.F. & van Swaay, C.A.M. (2006)Global warming and excess nitrogen may inducebutterfly decline by microclimatic cooling. GlobalChange Biology, 12, 1620–1626.
Warren, M.S., et al. (2001) Rapid responses ofBritish butterflies to opposing forces of climateand habitat change. Nature, 414, 65–69.
Walther, G.R., et al. (2002) Ecological responsesto recent climate change. Nature, 416, 389–395.
Wickramasinghe, L.P., Harris, S., Jones, G.& Jennings, N. (2004) Abundance and speciesrichness of nocturnal insects on organic andconventional farms: effects of agriculturalintensification on bat foraging. ConservationBiology, 18, 1283–1292.
Young, H.J. (2002) Diurnal and nocturnalpollination of Silene alba (Caryophyllaceae).American Journal of Botany, 89, 433–440.

29
AcknowledgementsWe are extremely grateful to all of the recorders who contribute to the Rothamsted Insect Survey and NationalMoth Recording Scheme, without whom an assessmentof the state of Britain’s larger moths would be impossible.
We thank Kelvin Conrad, Philip Gould, Richard Harrington, Chris Shortalland Paul Verrier for assistance with the Rothamsted Insect Survey and dataanalysis and Les Hill & Zoë Randle for the data and maps from the NationalMoth Recording Scheme.
The Rothamsted Insect Survey is a BBSRC-supported National Capabilitywith additional funding from the Lawes Agricultural Trust. We are grateful tothe many volunteers who operate traps and identify samples.
The National Moth Recording Scheme is funded by Butterfly Conservation,Countryside Commission for Wales, Forest Services, Forestry CommissionEngland, Natural England, Northern Ireland Environment Agency, TheRedwing Trust, Royal Entomological Society and Scottish Natural Heritage.
The analysis and production of this report were made possible thanksto a generous grant from the Esmée Fairbairn Foundation.
We would also like to thankMicky Andrews, Garry Barlow, Steve Batt, Charlotte Brett, Patrick Clement,Dave Green, Dom Greves, Paul Harris, Roger Hatcliffe, Sharon Hearle,Graham Jones, Roy Leverton, Chris Manley, Peter Maton, Luke Nilsson,Mark Parsons, Tom Prescott, Alan Roscoe, Philip Sansum, Rachel Scopes,Luigi Sebastiani, Mark Skevington, Steve Taylor, Robert Thompson, RogerWasley, Clive Williams/Brecon Beacons National Park and Pete Withers for kind permission to use their excellent photographs in this report.Les Hill kindly prepared all of the species distribution maps.
CitationThis report should be referenced as:Fox, R., Parsons, M.S., Chapman, J.W., Woiwod, I.P.,Warren, M.S. & Brooks, D.R. (2013)The State of Britain’s Larger Moths 2013.Butterfly Conservation and Rothamsted Research, Wareham, Dorset, UK.

Butterfly Conservation is the UK charity workingtowards a world where moths and butterflies can thrivefor future generations to enjoy. Through conservationprogrammes on threatened species, management of nature reserves, survey and monitoring, education,training, raising awareness and carrying out research,Butterfly Conservation’s work contributes not onlyto the conservation of biodiversity but also to thecreation of a healthier world in which we all can live.
Butterfly ConservationManor Yard, East Lulworth,Wareham, Dorset BH20 5QPTelephone: 01929 400209 Email: [email protected]
Rothamsted Research is the longest runningagricultural research station in the world, providingcutting-edge science and innovation for nearly170 years. Our mission is to deliver the knowledgeand new practices to increase crop productivity andquality and to develop environmentally sustainablesolutions for food and energy production.
Rothamsted Research Harpenden, Hertfordshire, AL5 2JQwww.rothamsted.ac.uk
Butterfly Conservation. Company limited by guarantee, registered in England and Wales (2206468).Registered office: Manor Yard, East Lulworth, Wareham, Dorset, BH20 5QP. Charity registered in England and Wales (254937) and in Scotland (SCO39268).
Printed on 100% recycled paper using vegetable based inks. Designed and produced by www.nectarcreative.com 01942 681648
Elephant Hawk-moth Deilephila elpenor R. Scopes