the centennial centre of science and technology · general real estate portfolio ... toronto 2015...
TRANSCRIPT
Volume 2b
P U B L I CA C C O U N T S
of
O N T A R I O
2012–2013
Ministry of Finance
FINANCIAL STATEMENTS OF
GOVERNMENT ORGANIZATIONS
(CONT’D)

i
TABLE OF CONTENTS Page Volume 2a General
Responsible Ministry for Government Agencies ..................................................................................................... iv A Guide to the Public Accounts ............................................................................................................................... vi
FINANCIAL STATEMENTS
Section 1 ─ Government Organizations
AgriCorp ................................................................................................. March 31, 2013 ..................................... 1-1 Agricultural Research Institute of Ontario .............................................. March 31, 2013 ................................... 1-23 Algonquin Forestry Authority ................................................................. March 31, 2013 ................................... 1-43 Cancer Care Ontario ................................................................................ March 31, 2013 ................................... 1-59 Education Quality and Accountability Office ......................................... March 31, 2013 ................................... 1-81 eHealth Ontario ....................................................................................... March 31, 2013 ................................... 1-93 Forest Renewal Trust .............................................................................. March 31, 2013 ................................. 1-109 General Real Estate Portfolio .................................................................. March 31, 2013 ................................. 1-111 Independent Electricity System Operator ................................................ December 31, 2012 ........................... 1-129 Legal Aid Ontario ................................................................................... March 31, 2013 ................................. 1-149 Local Health Integration Network – Central ........................................... March 31, 2013 ................................. 1-171 Local Health Integration Network – Central East ................................... March 31, 2013 ................................. 1-187 Local Health Integration Network – Central West .................................. March 31, 2013 ................................. 1-203 Local Health Integration Network – Champlain...................................... March 31, 2013 ................................. 1-219 Local Health Integration Network – Erie St. Clair .................................. March 31, 2013 ................................. 1-237 Local Health Integration Network – Hamilton Niagara Haldimand Brant ............................................. March 31, 2013 ................................. 1-251 Local Health Integration Network – Mississauga Halton ........................ March 31, 2013 ................................. 1-267 Local Health Integration Network – North East ...................................... March 31, 2013 ................................. 1-285 Local Health Integration Network – North Simcoe Muskoka ................. March 31, 2013 ................................. 1-301 Local Health Integration Network – North West..................................... March 31, 2013 ................................. 1-317 Local Health Integration Network – South East ...................................... March 31, 2013 ................................. 1-333 Local Health Integration Network – South West..................................... March 31, 2013 ................................. 1-353 Local Health Integration Network – Toronto Central.............................. March 31, 2013 ................................. 1-369 Local Health Integration Network – Waterloo Wellington ..................... March 31, 2013 ................................. 1-391 Metrolinx ................................................................................................. March 31, 2013 ................................. 1-409 Metropolitan Toronto Convention Centre Corporation ........................... March 31, 2013 ................................. 1-435 Niagara Parks Commission ..................................................................... October 31, 2012 ............................... 1-455 Government Organizations continued in Volume 2b
ii
TABLE OF CONTENTS Page Volume 2b General
Responsible Ministry for Government Agencies ..................................................................................................... iv A Guide to the Public Accounts ............................................................................................................................... vi
FINANCIAL STATEMENTS
Section 1 ─ Government Organizations – Cont’d
Northern Ontario Heritage Fund Corporation ......................................... March 31, 2013 ..................................... 1-1 Ontario Agency for Health Protection & Promotion ............................... March 31, 2013 ................................... 1-15 Ontario Capital Growth Corporation ....................................................... March 31, 2013 ................................... 1-31 Ontario Clean Water Agency .................................................................. December 31, 2012 ............................. 1-49 Ontario Council for the Arts .................................................................... March 31, 2013 ................................... 1-61 Ontario Educational Communications Authority (TVO) ........................ March 31, 2013 ................................... 1-83 Ontario Electricity Financial Corporation ............................................... March 31, 2013 ................................. 1-103 Ontario Energy Board ............................................................................. March 31, 2013 ................................. 1-119 Ontario Financing Authority ................................................................... March 31, 2013 ................................. 1-135 Ontario French-Language Educational Communications Authority ....... March 31, 2013 ................................. 1-151 Ontario Immigrant Investor Corporation ................................................. March 31, 2013 ................................. 1-179 Ontario Infrastructure and Lands Corporation ........................................ March 31, 2013 ................................. 1-189 Ontario Mortgage and Housing Corporation ........................................... March 31, 2013 ................................. 1-221 Ontario Northland Transportation Commission ...................................... March 31, 2013 ................................. 1-233 Ontario Place Corporation ....................................................................... December 31, 2012 ........................... 1-253 Ontario Power Authority ......................................................................... December 31, 2012 ........................... 1-269 Ontario Racing Commission ................................................................... March 31, 2013 ................................. 1-291 Ontario Science Centre............................................................................ March 31, 2013 ................................. 1-307 Ontario Securities Commission ............................................................... March 31, 2013 ................................. 1-323 Ontario Tourism Marketing Partnership Corporation ............................. March 31, 2013 ................................. 1-353 Ontario Trillium Foundation ................................................................... March 31, 2013 ................................. 1-367 Ornge....................................................................................................... March 31, 2013 ................................. 1-383 Ottawa Convention Centre ...................................................................... March 31, 2013 ................................. 1-413 Royal Ontario Museum ........................................................................... March 31, 2013 ................................. 1-431 Toronto 2015 Pan/Parapan American Games Organizing Committee .... March 31, 2013 ................................. 1-451 Toronto Waterfront Revitalization Corporation ...................................... March 31, 2013 ................................. 1-463
iii
TABLE OF CONTENTS Page Volume 2c General
Responsible Ministry for Government Agencies ..................................................................................................... iv A Guide to the Public Accounts ............................................................................................................................... vi
FINANCIAL STATEMENTS
Section 2 ─ Government Business Enterprises
Hydro One Inc. ........................................................................................ December 31, 2012 ............................... 2-1 Liquor Control Board of Ontario ............................................................. March 31, 2013 ................................... 2-57 Ontario Lottery and Gaming Corporation ............................................... March 31, 2013 ................................... 2-85 Ontario Power Generation Inc. ................................................................ December 31, 2012 ........................... 2-141
Section 3 ─ Trusts and Miscellaneous Statements Deposit Insurance Corporation of Ontario .............................................. December 31, 2012 ............................... 3-1 Motor Vehicle Accident Claims Fund ..................................................... March 31, 2013 ................................... 3-21 Ontario Pension Board ............................................................................ December 31, 2012 ............................. 3-35 Pension Benefits Guarantee Fund ........................................................... March 31, 2013 ................................... 3-63 Provincial Judges Pension Fund .............................................................. March 31, 2013 ................................... 3-75 The Public Guardian and Trustee for the Province of Ontario ................ March 31, 2013 ................................... 3-81 Workplace Safety and Insurance Board .................................................. December 31, 2012 ........................... 3-113 Losses Deleted from the Accounts .......................................................... March 31, 2013 ................................. 3-167 Revenue Remissions ............................................................................... March 31, 2013 ................................. 3-169
PUBLIC ACCOUNTS, 2012-2013
iv
RESPONSIBLE MINISTRY FOR GOVERNMENT BUSINESS ENTERPRISES, ORGANIZATIONS, TRUSTS & MISCELLANEOUS FINANCIAL STATEMENTS
Ministry of Agriculture and Food/Rural Affairs AgriCorp Agricultural Research Institute of Ontario Ontario Racing Commission Ministry of the Attorney General Legal Aid Ontario The Public Guardian and Trustee for the Province of Ontario Ministry of Economic Development, Trade and Employment/Research and Innovation Ontario Capital Growth Corporation Ontario Immigrant Investor Corporation Ministry of Education Education Quality and Accountability Office Ontario Educational Communications Authority (TVO) Ontario French-Language Educational Communications Authority Ministry of Energy Hydro One Inc. Independent Electricity System Operator Ontario Energy Board Ontario Power Authority Ontario Power Generation Inc. Ministry of the Environment Ontario Clean Water Agency Ministry of Finance Deposit Insurance Corporation of Ontario Liquor Control Board of Ontario Losses deleted from the accounts Motor Vehicle Accident Claims Fund Ontario Electricity Financial Corporation Ontario Financing Authority Ontario Lottery and Gaming Corporation Ontario Securities Commission Pension Benefits Guarantee Fund Provincial Judges Pension Fund Revenue remissions Ministry of Government Services Ontario Pension Board Ministry of Infrastructure Ontario Infrastructure and Lands Corporation General Real Estate Portfolio Toronto Waterfront Revitalization Corporation
PUBLIC ACCOUNTS, 2012-2013
v
RESPONSIBLE MINISTRY FOR GOVERNMENT BUSINESS ENTERPRISES, ORGANIZATIONS, TRUSTS & MISCELLANEOUS FINANCIAL STATEMENTS
Ministry of Health and Long-Term Care Cancer Care Ontario eHealth Ontario Local Health Integration Network – Central Local Health Integration Network – Central East Local Health Integration Network – Central West Local Health Integration Network – Champlain Local Health Integration Network – Erie St. Clair Local Health Integration Network – Hamilton Niagara Haldimand Brant Local Health Integration Network – Mississauga Halton Local Health Integration Network – North East Local Health Integration Network – North Simcoe Muskoka Local Health Integration Network – North West Local Health Integration Network – South East Local Health Integration Network – South West Local Health Integration Network – Toronto Central Local Health Integration Network – Waterloo Wellington Ontario Agency for Health Protection & Promotion Ornge Ministry of Labour Workplace Safety and Insurance Board Ministry of Municipal Affairs and Housing Ontario Mortgage and Housing Corporation Ministry of Natural Resources Algonquin Forestry Authority Forest Renewal Trust Ministry of Northern Development and Mines Northern Ontario Heritage Fund Corporation Ontario Northland Transportation Commission Ministry of Tourism, Culture and Sport Metropolitan Toronto Convention Centre Corporation Niagara Parks Commission Ontario Council for the Arts Ontario Place Corporation Ontario Science Centre Ontario Tourism Marketing Partnership Corporation Ontario Trillium Foundation Ottawa Convention Centre Royal Ontario Museum Ministry of Transportation Metrolinx
PUBLIC ACCOUNTS, 2012-2013
vi
A GUIDE TO THE PUBLIC ACCOUNTS
1. SCOPE OF THE PUBLIC ACCOUNTS
The 2012-2013 Public Accounts of the Province of Ontario comprise the Annual Report and Consolidated Financial Statements and three volumes:
Volume 1 contains ministry statements and detailed schedules of debt and other items. The ministry statements reflect
the financial activities of the government’s ministries on the accrual basis of accounting, providing a comparison of appropriations with actual spending. Ministry expenses include all expenses that are subject to appropriation approved by the Legislative Assembly, but exclude adjustments arising from consolidation of government organizations whose expenses are not appropriated.
Volume 2 contains the financial statements of Government Organizations and Business Enterprises that are part of the
government’s reporting entity and other miscellaneous financial statements.
Volume 3 contains the details of payments made by ministries to vendors (including sales tax) and transfer payment recipients that are not deemed to be prohibited by the Freedom of Information and Protection of Privacy Act.
2. A GUIDE TO VOLUME 2 OF THE PUBLIC ACCOUNTS
The financial statements of the selected crown corporations, boards and commissions are for fiscal periods ending within the Province’s own fiscal period April 1, 2012 to March 31, 2013. They are presented in the same detail as the approved, audited financial statements and as nearly as possible in the same form. The statements have been presented in the order shown in the Table of Contents. In addition, a listing is provided which groups the crown corporations, boards and commissions by ministerial responsibility.
GOVERNMENT ORGANIZATIONS (CONT'D)

NORTHERN ONTARIO HERITAGE FUND CORPORATION Responsibility for Financial Reporting The accompanying financial statements of the Northern Ontario Heritage Fund Corporation (NOHFC) have been prepared in accordance with Canadian public sector accounting standards, and are the responsibility of management. The preparation of financial statements necessarily involves the use of estimates based on management’s judgment, particularly when transactions affecting the current accounting period cannot be finalized with certainty until future periods. The financial statements have been properly prepared within reasonable limits of materiality and in light of information available up to June 26, 2013. Management is responsible for the integrity of the financial statements and maintains a system of internal controls designed to provide reasonable assurance that the assets are safeguarded and that reliable financial information is available on a timely basis. The system includes formal policies and procedures and an organizational structure that provides for appropriate delegation of authority and segregation of responsibilities. The Board, through the Audit Committee, is responsible for ensuring that management fulfills its responsibilities for financial reporting and internal controls. The Audit Committee, comprised of members who are not employees/officers of NOHFC generally meets periodically with management and the Office of the Auditor General to satisfy itself that each group has properly discharged its respective responsibility. The financial statements have been audited by the Office of the Auditor General of Ontario. The Auditor’s responsibility is to express an opinion on whether the financial statements are fairly presented in accordance with Canadian public sector accounting standards. The Auditor’s Report outlines the scope of the Auditor’s examination and opinion.
________________________ ___________________________ D. Bruce Strapp Susan E. Richichi, CPA CA Executive Director Manager Financial Services (Acting) NOHFC NOHFC
PUBLIC ACCOUNTS, 2012-2013 1-1
Independent Auditor’s Report To the Northern Ontario Heritage Fund Corporation and to the Minister of Northern Development and Mines I have audited the accompanying financial statements of the Northern Ontario Heritage Fund Corporation, which comprise the statement of financial position as at March 31, 2013 and the statements of operations, changes in net financial assets and cash flows for the year then ended, and a summary of significant accounting policies and other explanatory information.
Management’s Responsibility for the Financial Statements Management is responsible for the preparation and fair presentation of these financial statements in accordance with Canadian public sector accounting standards, and for such internal control as management determines is necessary to enable the preparation of financial statements that are free from material misstatement, whether due to fraud or error.
Auditor’s Responsibility My responsibility is to express an opinion on these financial statements based on my audit. I conducted my audit in accordance with Canadian generally accepted auditing standards. Those standards require that I comply with ethical requirements and plan and perform the audit to obtain reasonable assurance about whether the financial statements are free from material misstatement. An audit involves performing procedures to obtain audit evidence about the amounts and disclosures in the financial statements. The procedures selected depend on the auditor’s judgment, including the assessment of the risks of material misstatement of the financial statements, whether due to fraud or error. In making those risk assessments, the auditor considers internal control relevant to the entity’s preparation and fair presentation of the financial statements in order to design audit procedures that are appropriate in the circumstances, but not for the purpose of expressing an opinion on the effectiveness of the entity’s internal control. An audit also includes evaluating the appropriateness of accounting policies used and the reasonableness of accounting estimates made by management, as well as evaluating the overall presentation of the financial statements. I believe that the audit evidence I have obtained is sufficient and appropriate to provide a basis for my opinion.
Opinion In my opinion, these financial statements present fairly, in all material respects, the financial position of the Northern Ontario Heritage Fund Corporation as at March 31, 2013, and the results of its operations, changes in its net financial assets and its cash flows for the year then ended in accordance with Canadian public sector accounting standards.
Toronto, Ontario Susan Klein, CPA, CA, LPA June 26, 2013 Acting Deputy Auditor General
1-2 PUBLIC ACCOUNTS, 2012-2013
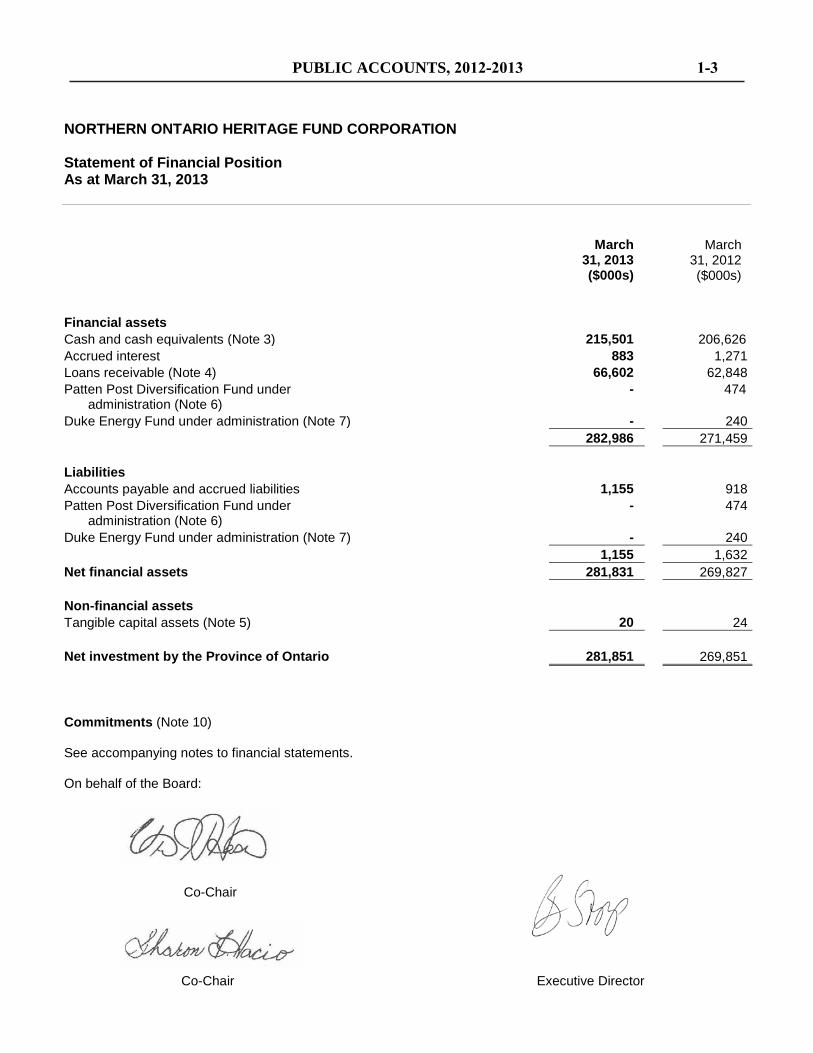
NORTHERN ONTARIO HERITAGE FUND CORPORATION Statement of Financial Position As at March 31, 2013
March 31, 2013 ($000s)
March 31, 2012 ($000s)
Financial assets Cash and cash equivalents (Note 3) 215,501 206,626 Accrued interest 883 1,271 Loans receivable (Note 4) 66,602 62,848 Patten Post Diversification Fund under
administration (Note 6) - 474
Duke Energy Fund under administration (Note 7) - 240 282,986 271,459
Liabilities Accounts payable and accrued liabilities 1,155 918 Patten Post Diversification Fund under
administration (Note 6) - 474
Duke Energy Fund under administration (Note 7) - 240 1,155 1,632 Net financial assets 281,831 269,827 Non-financial assets Tangible capital assets (Note 5) 20 24 Net investment by the Province of Ontario 281,851 269,851 Commitments (Note 10) See accompanying notes to financial statements. On behalf of the Board:
Co-Chair
Co-Chair Executive Director
PUBLIC ACCOUNTS, 2012-2013 1-3
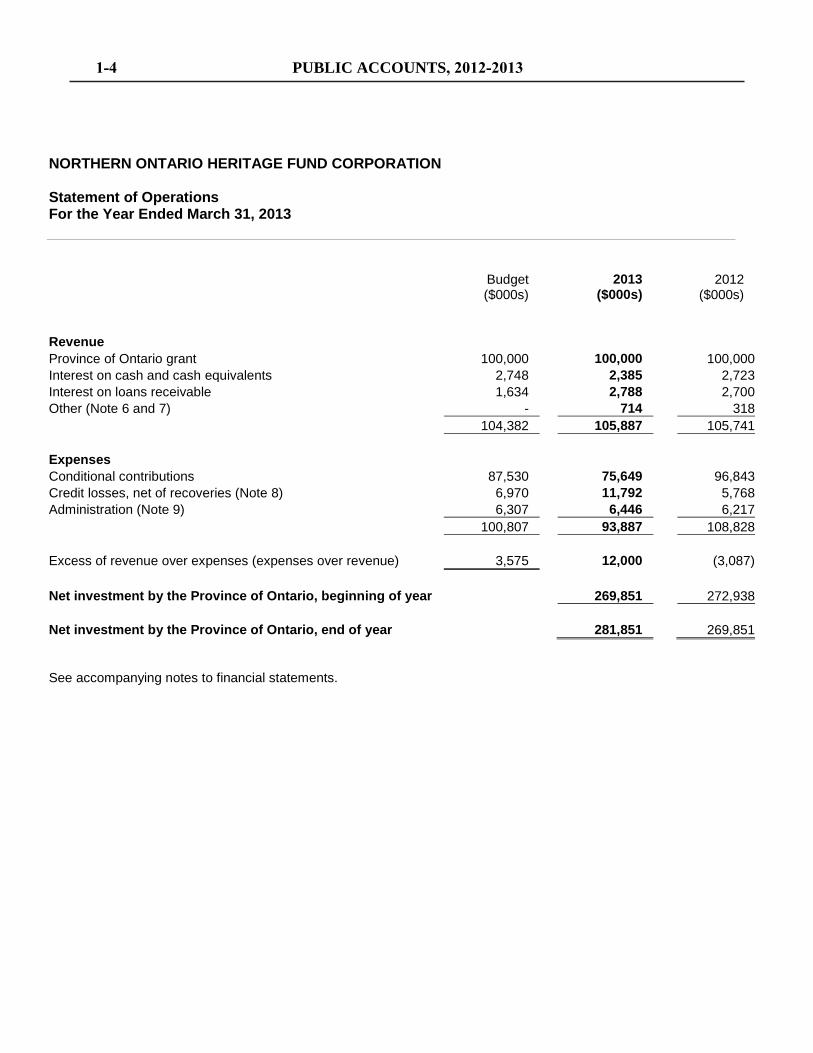
NORTHERN ONTARIO HERITAGE FUND CORPORATION Statement of Operations For the Year Ended March 31, 2013
Budget ($000s)
2013 ($000s)
2012 ($000s)
Revenue Province of Ontario grant 100,000 100,000 100,000 Interest on cash and cash equivalents 2,748 2,385 2,723 Interest on loans receivable 1,634 2,788 2,700 Other (Note 6 and 7) - 714 318 104,382 105,887 105,741 Expenses Conditional contributions 87,530 75,649 96,843 Credit losses, net of recoveries (Note 8) 6,970 11,792 5,768 Administration (Note 9) 6,307 6,446 6,217 100,807 93,887 108,828 Excess of revenue over expenses (expenses over revenue) 3,575 12,000 (3,087) Net investment by the Province of Ontario, beginning of year 269,851 272,938 Net investment by the Province of Ontario, end of year 281,851 269,851 See accompanying notes to financial statements.
1-4 PUBLIC ACCOUNTS, 2012-2013
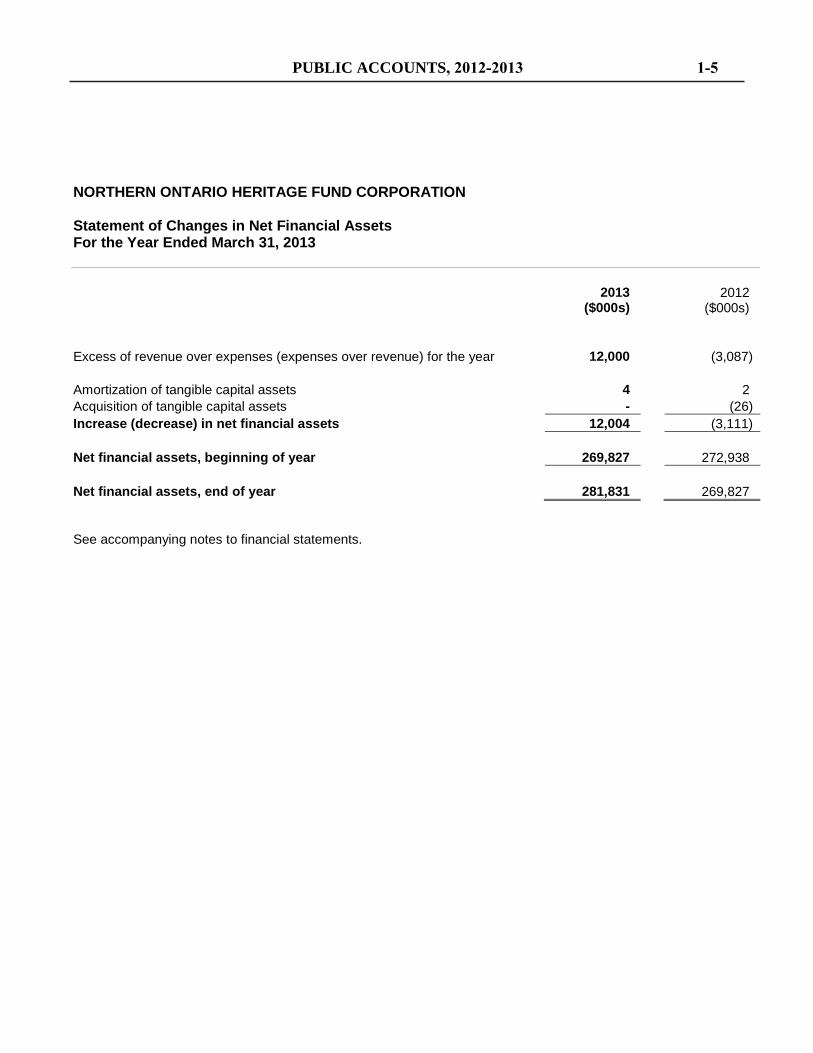
NORTHERN ONTARIO HERITAGE FUND CORPORATION Statement of Changes in Net Financial Assets For the Year Ended March 31, 2013
2013 ($000s)
2012 ($000s)
Excess of revenue over expenses (expenses over revenue) for the year 12,000 (3,087) Amortization of tangible capital assets 4 2 Acquisition of tangible capital assets - (26) Increase (decrease) in net financial assets 12,004 (3,111) Net financial assets, beginning of year 269,827 272,938 Net financial assets, end of year 281,831 269,827 See accompanying notes to financial statements.
PUBLIC ACCOUNTS, 2012-2013 1-5
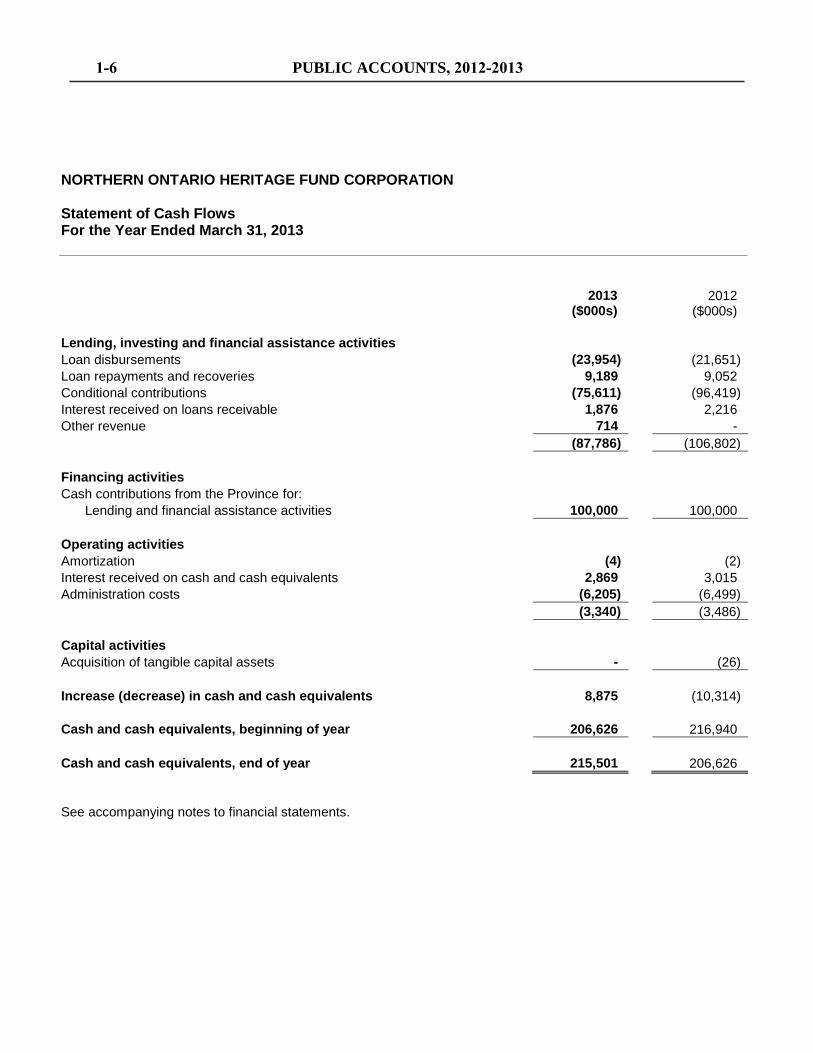
NORTHERN ONTARIO HERITAGE FUND CORPORATION Statement of Cash Flows For the Year Ended March 31, 2013
2013 ($000s)
2012 ($000s)
Lending, investing and financial assistance activities Loan disbursements (23,954) (21,651) Loan repayments and recoveries 9,189 9,052 Conditional contributions (75,611) (96,419) Interest received on loans receivable 1,876 2,216 Other revenue 714 - (87,786) (106,802) Financing activities Cash contributions from the Province for:
Lending and financial assistance activities 100,000 100,000 Operating activities Amortization (4) (2) Interest received on cash and cash equivalents 2,869 3,015 Administration costs (6,205) (6,499) (3,340) (3,486) Capital activities Acquisition of tangible capital assets - (26) Increase (decrease) in cash and cash equivalents 8,875 (10,314) Cash and cash equivalents, beginning of year 206,626 216,940 Cash and cash equivalents, end of year 215,501 206,626 See accompanying notes to financial statements.
1-6 PUBLIC ACCOUNTS, 2012-2013
NORTHERN ONTARIO HERITAGE FUND CORPORATION Notes to Financial Statements March 31, 2013
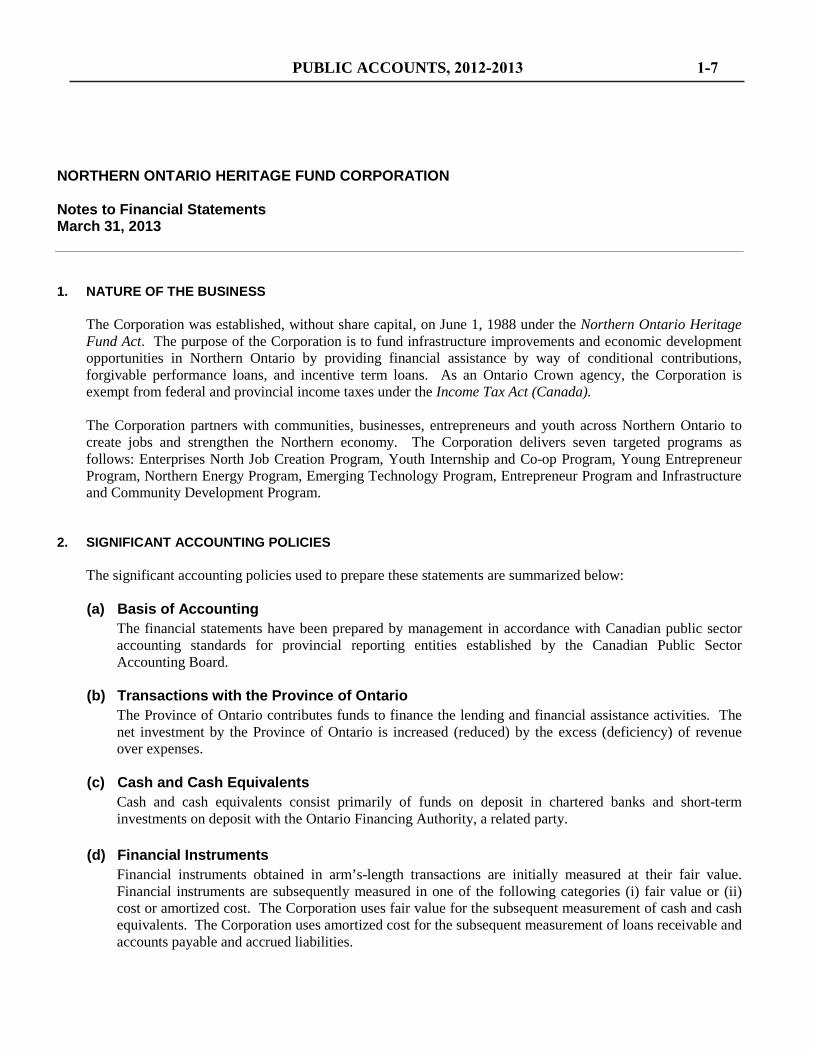
1. NATURE OF THE BUSINESS The Corporation was established, without share capital, on June 1, 1988 under the Northern Ontario Heritage Fund Act. The purpose of the Corporation is to fund infrastructure improvements and economic development opportunities in Northern Ontario by providing financial assistance by way of conditional contributions, forgivable performance loans, and incentive term loans. As an Ontario Crown agency, the Corporation is exempt from federal and provincial income taxes under the Income Tax Act (Canada). The Corporation partners with communities, businesses, entrepreneurs and youth across Northern Ontario to create jobs and strengthen the Northern economy. The Corporation delivers seven targeted programs as follows: Enterprises North Job Creation Program, Youth Internship and Co-op Program, Young Entrepreneur Program, Northern Energy Program, Emerging Technology Program, Entrepreneur Program and Infrastructure and Community Development Program.
2. SIGNIFICANT ACCOUNTING POLICIES
The significant accounting policies used to prepare these statements are summarized below: (a) Basis of Accounting
The financial statements have been prepared by management in accordance with Canadian public sector accounting standards for provincial reporting entities established by the Canadian Public Sector Accounting Board.
(b) Transactions with the Province of Ontario The Province of Ontario contributes funds to finance the lending and financial assistance activities. The net investment by the Province of Ontario is increased (reduced) by the excess (deficiency) of revenue over expenses.
(c) Cash and Cash Equivalents Cash and cash equivalents consist primarily of funds on deposit in chartered banks and short-term investments on deposit with the Ontario Financing Authority, a related party.
(d) Financial Instruments
Financial instruments obtained in arm’s-length transactions are initially measured at their fair value. Financial instruments are subsequently measured in one of the following categories (i) fair value or (ii) cost or amortized cost. The Corporation uses fair value for the subsequent measurement of cash and cash equivalents. The Corporation uses amortized cost for the subsequent measurement of loans receivable and accounts payable and accrued liabilities.
PUBLIC ACCOUNTS, 2012-2013 1-7
NORTHERN ONTARIO HERITAGE FUND CORPORATION Notes to Financial Statements March 31, 2013 2. SIGNIFICANT ACCOUNTING POLICIES (continued)
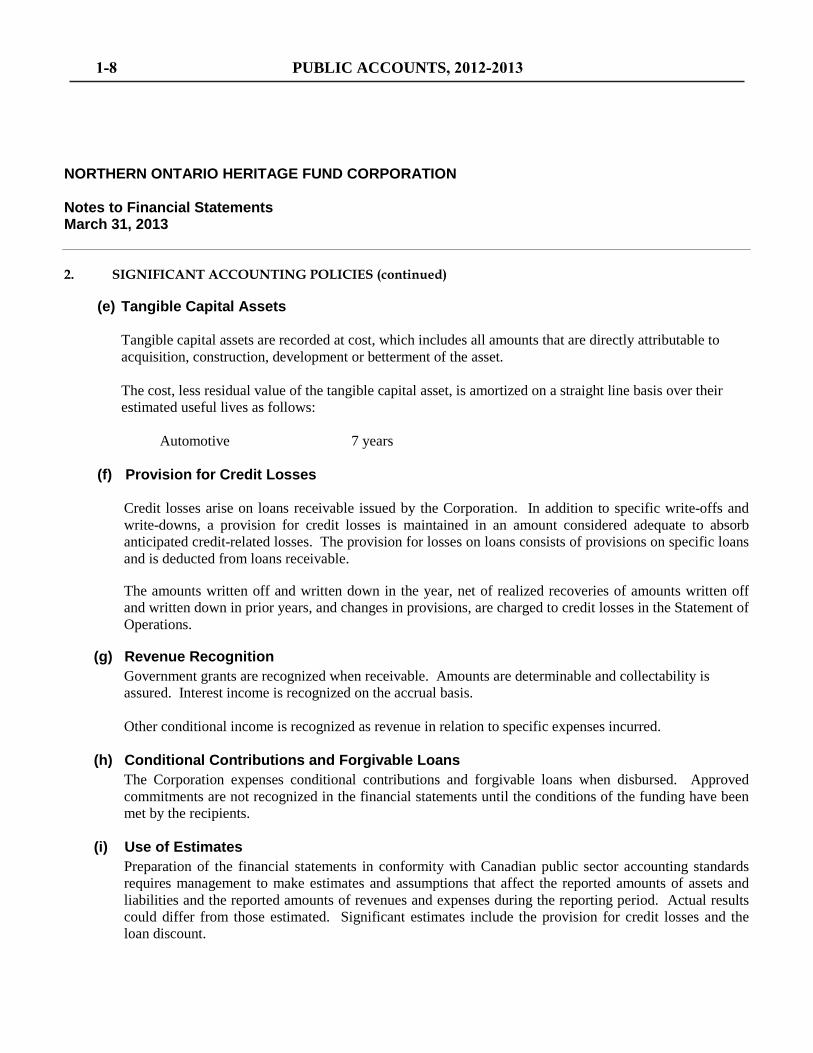
(e) Tangible Capital Assets Tangible capital assets are recorded at cost, which includes all amounts that are directly attributable to acquisition, construction, development or betterment of the asset. The cost, less residual value of the tangible capital asset, is amortized on a straight line basis over their estimated useful lives as follows: Automotive 7 years
(f) Provision for Credit Losses
Credit losses arise on loans receivable issued by the Corporation. In addition to specific write-offs and write-downs, a provision for credit losses is maintained in an amount considered adequate to absorb anticipated credit-related losses. The provision for losses on loans consists of provisions on specific loans and is deducted from loans receivable.
The amounts written off and written down in the year, net of realized recoveries of amounts written off and written down in prior years, and changes in provisions, are charged to credit losses in the Statement of Operations.
(g) Revenue Recognition
Government grants are recognized when receivable. Amounts are determinable and collectability is assured. Interest income is recognized on the accrual basis. Other conditional income is recognized as revenue in relation to specific expenses incurred.
(h) Conditional Contributions and Forgivable Loans The Corporation expenses conditional contributions and forgivable loans when disbursed. Approved commitments are not recognized in the financial statements until the conditions of the funding have been met by the recipients.
(i) Use of Estimates
Preparation of the financial statements in conformity with Canadian public sector accounting standards requires management to make estimates and assumptions that affect the reported amounts of assets and liabilities and the reported amounts of revenues and expenses during the reporting period. Actual results could differ from those estimated. Significant estimates include the provision for credit losses and the loan discount.
1-8 PUBLIC ACCOUNTS, 2012-2013
NORTHERN ONTARIO HERITAGE FUND CORPORATION Notes to Financial Statements March 31, 2013 3. CASH AND CASH EQUIVALENTS
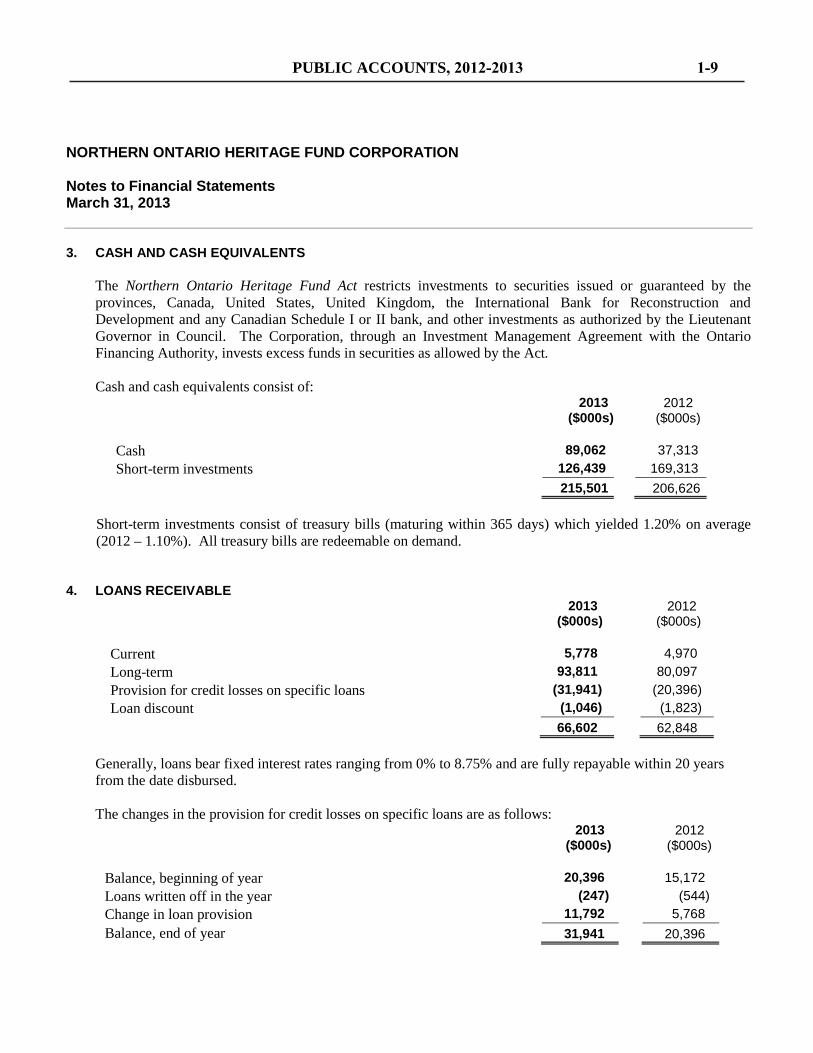
The Northern Ontario Heritage Fund Act restricts investments to securities issued or guaranteed by the provinces, Canada, United States, United Kingdom, the International Bank for Reconstruction and Development and any Canadian Schedule I or II bank, and other investments as authorized by the Lieutenant Governor in Council. The Corporation, through an Investment Management Agreement with the Ontario Financing Authority, invests excess funds in securities as allowed by the Act. Cash and cash equivalents consist of:
2013 2012 ($000s) ($000s)
Cash 89,062 37,313 Short-term investments 126,439 169,313
215,501 206,626
Short-term investments consist of treasury bills (maturing within 365 days) which yielded 1.20% on average (2012 – 1.10%). All treasury bills are redeemable on demand.
4. LOANS RECEIVABLE 2013 2012 ($000s) ($000s) Current 5,778 4,970 Long-term 93,811 80,097 Provision for credit losses on specific loans (31,941) (20,396) Loan discount (1,046) (1,823) 66,602 62,848
Generally, loans bear fixed interest rates ranging from 0% to 8.75% and are fully repayable within 20 years from the date disbursed. The changes in the provision for credit losses on specific loans are as follows:
2013 2012 ($000s) ($000s) Balance, beginning of year 20,396 15,172 Loans written off in the year (247) (544) Change in loan provision 11,792 5,768 Balance, end of year 31,941 20,396
PUBLIC ACCOUNTS, 2012-2013 1-9
NORTHERN ONTARIO HERITAGE FUND CORPORATION Notes to Financial Statements March 31, 2013 4. LOANS RECEIVABLE (CONTINUED)
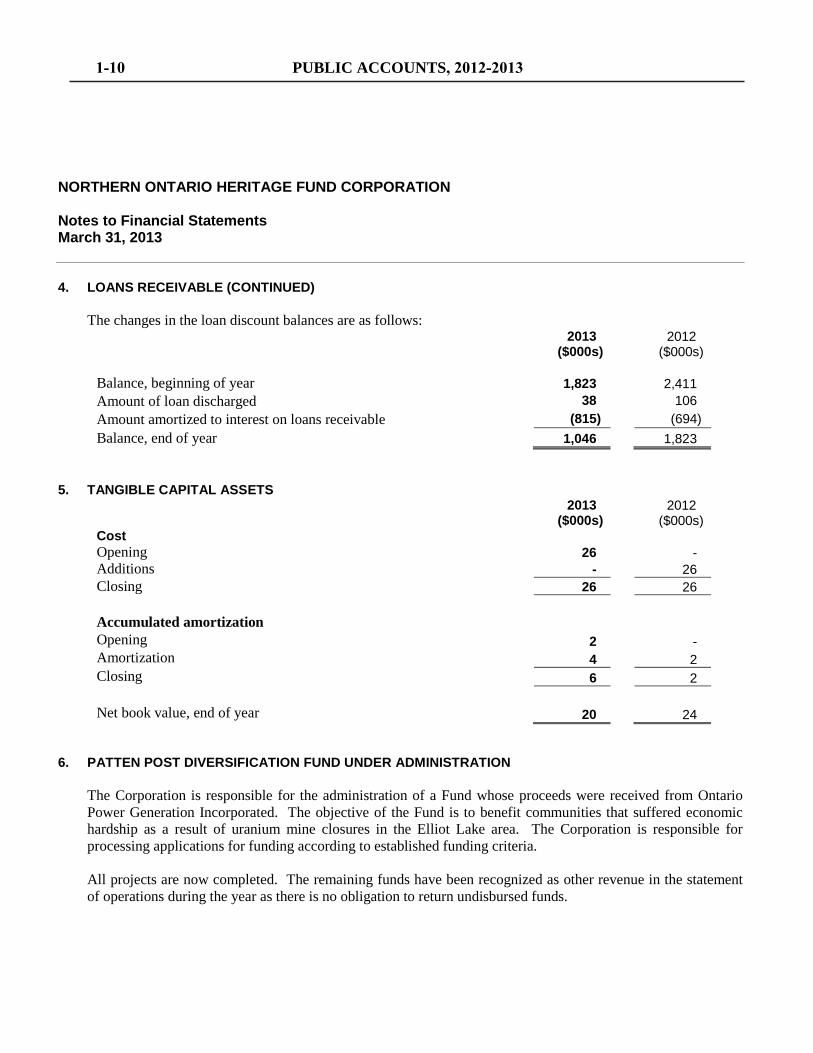
The changes in the loan discount balances are as follows:
2013 2012 ($000s) ($000s) Balance, beginning of year 1,823 2,411 Amount of loan discharged 38 106 Amount amortized to interest on loans receivable (815) (694) Balance, end of year 1,046 1,823
5. TANGIBLE CAPITAL ASSETS 2013 2012 ($000s) ($000s) Cost Opening 26 - Additions - 26 Closing 26 26 Accumulated amortization Opening 2 - Amortization 4 2 Closing 6 2 Net book value, end of year 20 24
6. PATTEN POST DIVERSIFICATION FUND UNDER ADMINISTRATION
The Corporation is responsible for the administration of a Fund whose proceeds were received from Ontario Power Generation Incorporated. The objective of the Fund is to benefit communities that suffered economic hardship as a result of uranium mine closures in the Elliot Lake area. The Corporation is responsible for processing applications for funding according to established funding criteria. All projects are now completed. The remaining funds have been recognized as other revenue in the statement of operations during the year as there is no obligation to return undisbursed funds.
1-10 PUBLIC ACCOUNTS, 2012-2013
NORTHERN ONTARIO HERITAGE FUND CORPORATION Notes to Financial Statements March 31, 2013 6. PATTEN POST DIVERSIFICATION FUND UNDER ADMINISTRATION (CONTINUED)
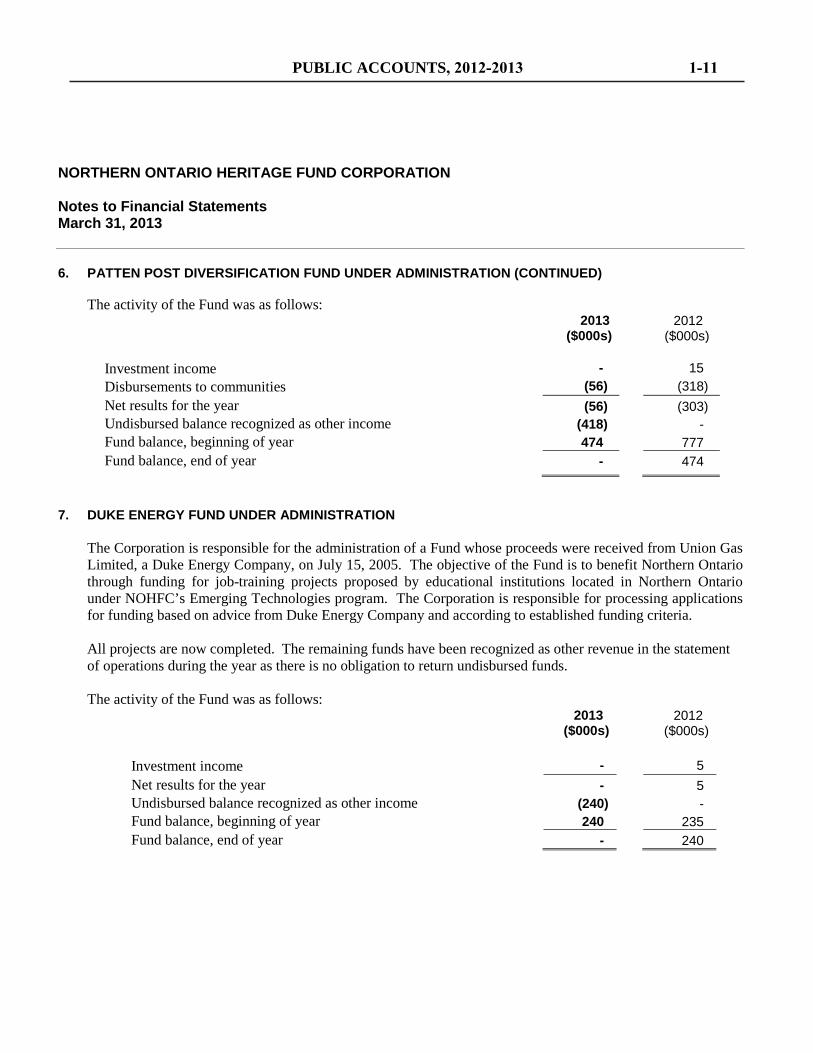
The activity of the Fund was as follows: 2013 2012 ($000s) ($000s)
Investment income - 15 Disbursements to communities (56) (318) Net results for the year (56) (303) Undisbursed balance recognized as other income (418) - Fund balance, beginning of year 474 777 Fund balance, end of year - 474
7. DUKE ENERGY FUND UNDER ADMINISTRATION
The Corporation is responsible for the administration of a Fund whose proceeds were received from Union Gas Limited, a Duke Energy Company, on July 15, 2005. The objective of the Fund is to benefit Northern Ontario through funding for job-training projects proposed by educational institutions located in Northern Ontario under NOHFC’s Emerging Technologies program. The Corporation is responsible for processing applications for funding based on advice from Duke Energy Company and according to established funding criteria. All projects are now completed. The remaining funds have been recognized as other revenue in the statement of operations during the year as there is no obligation to return undisbursed funds. The activity of the Fund was as follows:
2013 2012 ($000s) ($000s)
Investment income - 5 Net results for the year - 5 Undisbursed balance recognized as other income (240) - Fund balance, beginning of year 240 235 Fund balance, end of year - 240
PUBLIC ACCOUNTS, 2012-2013 1-11
NORTHERN ONTARIO HERITAGE FUND CORPORATION Notes to Financial Statements March 31, 2013 8. CREDIT LOSSES
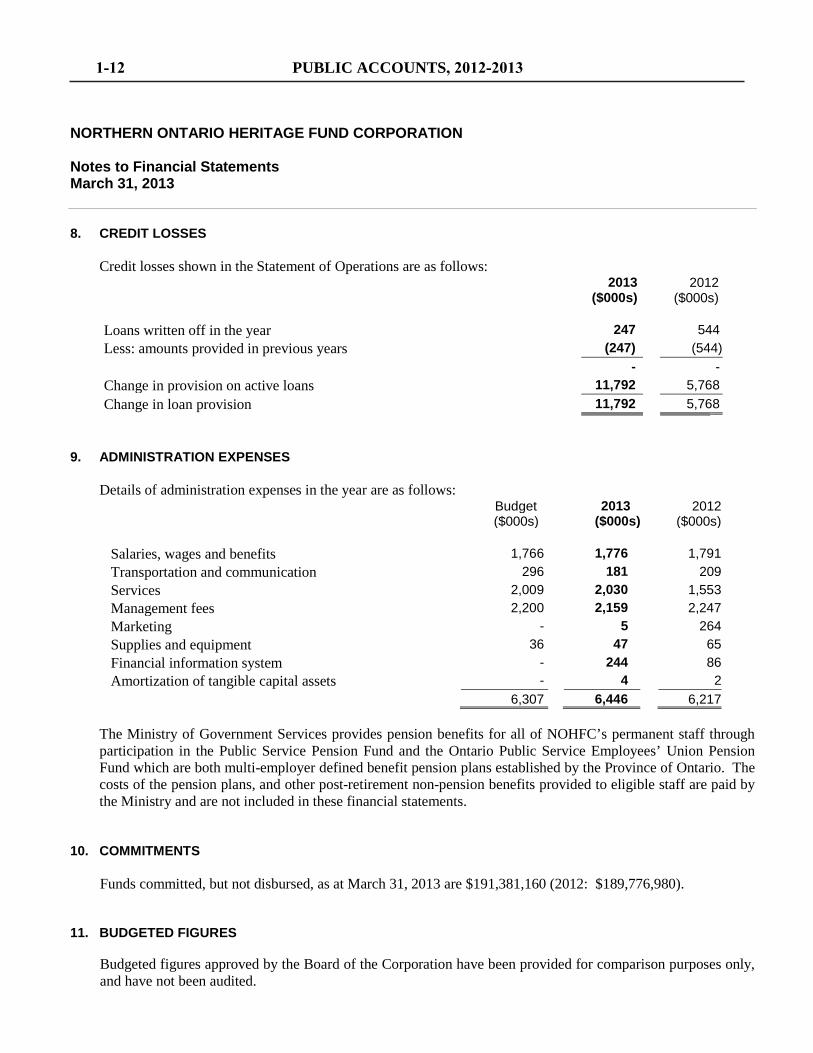
Credit losses shown in the Statement of Operations are as follows:
2013 2012 ($000s) ($000s)
Loans written off in the year 247 544 Less: amounts provided in previous years (247) (544) - - Change in provision on active loans 11,792 5,768 Change in loan provision 11,792 5,768
9. ADMINISTRATION EXPENSES
Details of administration expenses in the year are as follows:
Budget 2013 2012 ($000s) ($000s) ($000s) Salaries, wages and benefits 1,766 1,776 1,791 Transportation and communication 296 181 209 Services 2,009 2,030 1,553 Management fees 2,200 2,159 2,247 Marketing - 5 264 Supplies and equipment 36 47 65 Financial information system - 244 86 Amortization of tangible capital assets - 4 2 6,307 6,446 6,217
The Ministry of Government Services provides pension benefits for all of NOHFC’s permanent staff through participation in the Public Service Pension Fund and the Ontario Public Service Employees’ Union Pension Fund which are both multi-employer defined benefit pension plans established by the Province of Ontario. The costs of the pension plans, and other post-retirement non-pension benefits provided to eligible staff are paid by the Ministry and are not included in these financial statements.
10. COMMITMENTS Funds committed, but not disbursed, as at March 31, 2013 are $191,381,160 (2012: $189,776,980).
11. BUDGETED FIGURES
Budgeted figures approved by the Board of the Corporation have been provided for comparison purposes only, and have not been audited.
1-12 PUBLIC ACCOUNTS, 2012-2013
NORTHERN ONTARIO HERITAGE FUND CORPORATION Notes to Financial Statements March 31, 2013 12. FINANCIAL INSTRUMENTS
Effective April 1, 2012, the Corporation adopted the new Public Sector Handbook Standard 3450 – Financial Instruments, which requires all financial instruments to be valued at fair value, cost or amortized cost. The new standard provides comprehensive requirements for the recognition, measurement, presentation and disclosure of financial instruments. The Corporation’s financial instruments consist of cash and cash equivalents, loans receivable and accounts payable and accrued liabilities. The adoption of this new standard did not have a financial impact on the financial statements of the Corporation. The main risks that the Corporation’s financial instruments are exposed to are credit risk, liquidity risk and market risk. Credit risk Credit risk is the risk that the counterparty to a financial instrument may fail to discharge an obligation or commitment that it has entered into. The Corporation provides credit to its loan portfolio clients in the normal course of operations. To mitigate the risk, the Corporation screens loan applicants, registers security on the loans and maintains provisions for contingent credit losses. Liquidity risk The Corporation’s exposure to liquidity risk is minimal as all operating and capital expenses are recovered by the Province of Ontario and therefore liquidity risk is low. Market risk Market risk is comprised of currency risk, interest rate risk and other price risk and the Corporation is not exposed to market risk. The Corporation does not conduct any significant transactions that are denominated in foreign currency. The Corporation’s loans receivable bear fixed interest rates. The Corporation’s cash equivalents are held at fixed rates and are not exposed to market prices that will affect the value of the financial instruments.
PUBLIC ACCOUNTS, 2012-2013 1-13

Public HeaJ th
OntariO PARTNERS FOR HEALTH
Sante publi.que
OntariO PARTENAIRES POUR LA SANTe
MANAGEMENT RESPONSIBILITY REPORT
Ontario Agency for Health Protection and Promotion (OAHPP) management is responsible for preparing the accompanying financial statements in conformity with Canadian public sector accounting standards for government not-for-profit organizations as established by the Public Sector Accounting Board (PSAB) of the Canadian Institute of Chartered Accountants.
In preparing these financial statements management selects appropriate accounting policies and uses its judgment and best estimates to report events and transactions as they occur. Management has determined such amounts on a reasonable basis in order to ensure that the financial statements are presented fairly in all material respects. Financial data included throughout this Annual Report is prepared on a basis consistent with that of the financial statements.
OAHPP maintains a system of internal accounting controls designed to provide reasonable assurance, at a reasonable cost, that assets are safeguarded and that transactions are executed and recorded in accordance with OAHPP policies for doing business.
The Board of Directors is responsible for ensuring that management fulfills its responsibility for financial reporting and internal control, and is ultimately responsible for reviewing and approving the financial statements. The Board carries out this responsibility principally through its Audit and Finance Standing Committee. The Committee meets at least four times annually to review audited and unaudited financial information. Ernst & Young LLP has full and free access to the Audit and Finance Standing Committee.
Management acknowledges its responsibility to provide financial information that is representative of OAHPP operations, is consistent and reliable, and is relevant for the informed evaluation of OAHPP activities.
Vivek Goel President and CEO
June 27, 2013
Norma ees, CA Chief Financial Officer
480 University Avenue, Su ite 300, Toronto, ON M5G 1V2 OffiCE 6472607100 FAX 6472607600 www.publlchealthontario.ca
480, avenue University, Toronto, ON M5G 1V2 BUREAU 6472607100 TELEcoPIEUR 6472607600 www.publichealthontario.ca
f;.:> Ontario Agency fot Health Protection and Promotion Agon", do protection ot de promotion de la sante
PUBLIC ACCOUNTS, 2012-2013 1-15
INDEPENDENT AUDITORS' REPORT
To the Members of Ontario Agency for Health Protection and Promotion We have audited the accompanying financial statements of Ontario Agency for Health Protection and Promotion [operating as Public Health Ontario], which comprise the statement of financial position as at March 31, 2013 and the statements of operations and changes in net assets and cash flows for the year then ended, and a summary of significant accounting policies and other explanatory information. Management's responsibility for the financial statements Management is responsible for the preparation and fair presentation of these financial statements in accordance with Canadian public sector accounting standards, and for such internal control as management determines is necessary to enable the preparation of financial statements that are free from material misstatement, whether due to fraud or error. Auditors' responsibility Our responsibility is to express an opinion on these financial statements based on our audit. We conducted our audit in accordance with Canadian generally accepted auditing standards. Those standards require that we comply with ethical requirements and plan and perform the audit to obtain reasonable assurance about whether the financial statements are free from material misstatement. An audit involves performing procedures to obtain audit evidence about the amounts and disclosures in the financial statements. The procedures selected depend on the auditors' judgment, including the assessment of the risks of material misstatement of the financial statements, whether due to fraud or error. In making those risk assessments, the auditors consider internal control relevant to the entity's preparation and fair presentation of the financial statements in order to design audit procedures that are appropriate in the circumstances, but not for the purpose of expressing an opinion on the effectiveness of the entity's internal control. An audit also includes evaluating the appropriateness of accounting policies used and the reasonableness of accounting estimates made by management, as well as evaluating the overall presentation of the financial statements.
1-16 PUBLIC ACCOUNTS, 2012-2013
We believe that the audit evidence we have obtained is sufficient and appropriate to provide a basis for our audit opinion. Opinion In our opinion, the financial statements present fairly, in all material respects, the financial position of Ontario Agency for Health Protection and Promotion [operating as Public Health Ontario] as at March 31, 2013 and the results of its operations and its cash flows for year then ended in accordance with Canadian public sector accounting standards.
Toronto, Canada, Chartered Accountants June 27, 2013 Licensed Public Accountants
PUBLIC ACCOUNTS, 2012-2013 1-17
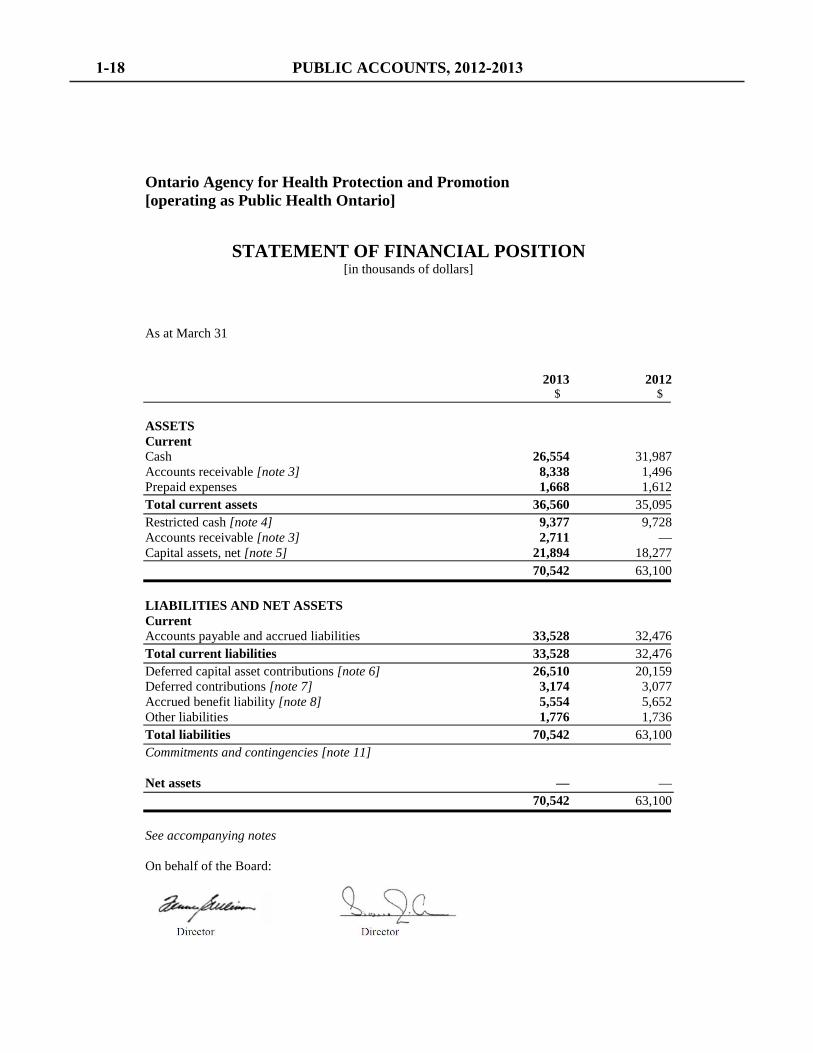
Ontario Agency for Health Protection and Promotion [operating as Public Health Ontario]
STATEMENT OF FINANCIAL POSITION [in thousands of dollars]
As at March 31 2013 2012 $ $ ASSETS Current Cash 26,554 31,987 Accounts receivable [note 3] 8,338 1,496 Prepaid expenses 1,668 1,612 Total current assets 36,560 35,095 Restricted cash [note 4] 9,377 9,728 Accounts receivable [note 3] 2,711 — Capital assets, net [note 5] 21,894 18,277 70,542 63,100 LIABILITIES AND NET ASSETS Current Accounts payable and accrued liabilities 33,528 32,476 Total current liabilities 33,528 32,476 Deferred capital asset contributions [note 6] 26,510 20,159 Deferred contributions [note 7] 3,174 3,077 Accrued benefit liability [note 8] 5,554 5,652 Other liabilities 1,776 1,736 Total liabilities 70,542 63,100 Commitments and contingencies [note 11] Net assets — — 70,542 63,100 See accompanying notes On behalf of the Board:
1-18 PUBLIC ACCOUNTS, 2012-2013
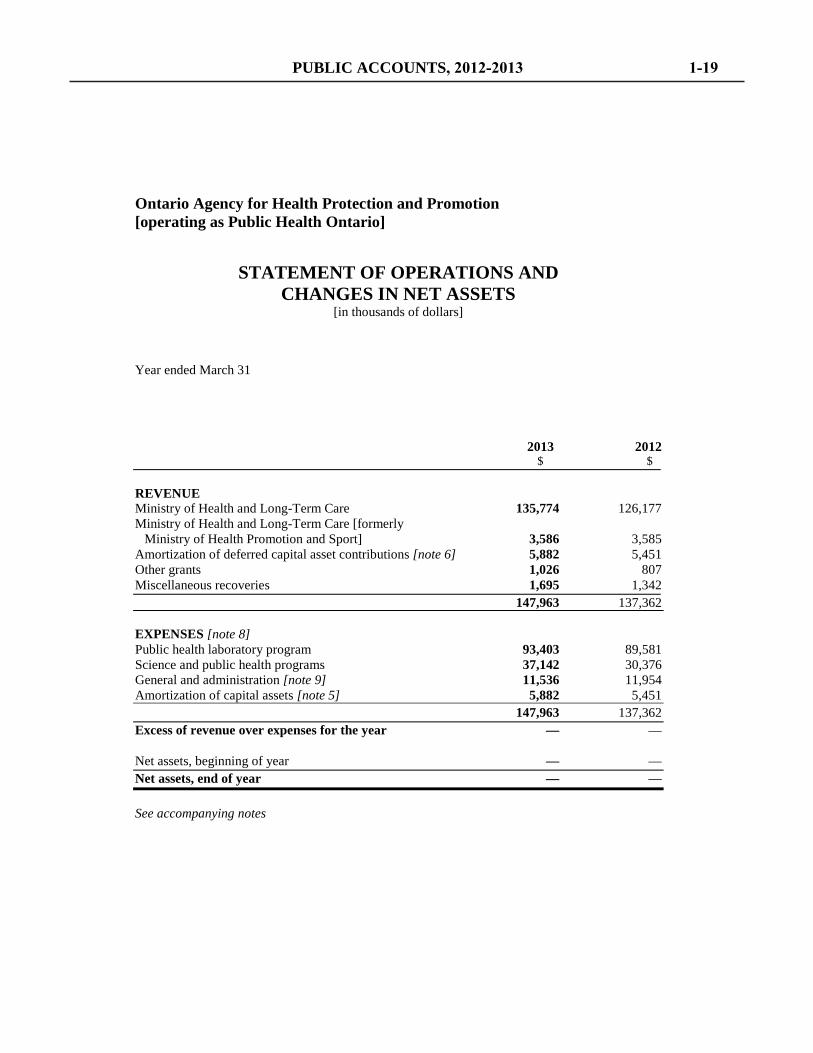
Ontario Agency for Health Protection and Promotion [operating as Public Health Ontario]
STATEMENT OF OPERATIONS AND CHANGES IN NET ASSETS
[in thousands of dollars] Year ended March 31 2013 2012 $ $ REVENUE Ministry of Health and Long-Term Care 135,774 126,177 Ministry of Health and Long-Term Care [formerly Ministry of Health Promotion and Sport] 3,586 3,585 Amortization of deferred capital asset contributions [note 6] 5,882 5,451 Other grants 1,026 807 Miscellaneous recoveries 1,695 1,342 147,963 137,362 EXPENSES [note 8] Public health laboratory program 93,403 89,581 Science and public health programs 37,142 30,376 General and administration [note 9] 11,536 11,954 Amortization of capital assets [note 5] 5,882 5,451 147,963 137,362 Excess of revenue over expenses for the year — — Net assets, beginning of year — — Net assets, end of year — — See accompanying notes
PUBLIC ACCOUNTS, 2012-2013 1-19
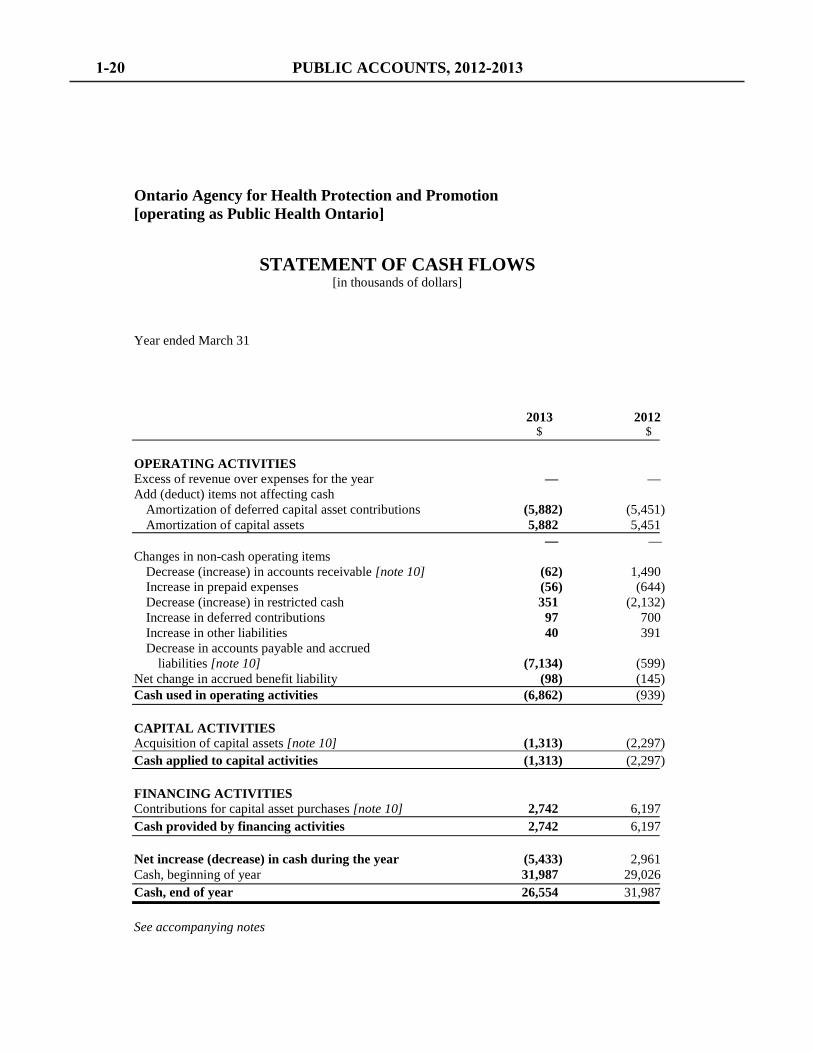
Ontario Agency for Health Protection and Promotion [operating as Public Health Ontario]
STATEMENT OF CASH FLOWS [in thousands of dollars]
Year ended March 31 2013 2012 $ $ OPERATING ACTIVITIES Excess of revenue over expenses for the year — — Add (deduct) items not affecting cash
Amortization of deferred capital asset contributions (5,882) (5,451) Amortization of capital assets 5,882 5,451
— — Changes in non-cash operating items
Decrease (increase) in accounts receivable [note 10] (62) 1,490 Increase in prepaid expenses (56) (644) Decrease (increase) in restricted cash 351 (2,132) Increase in deferred contributions 97 700 Increase in other liabilities 40 391 Decrease in accounts payable and accrued
liabilities [note 10] (7,134) (599) Net change in accrued benefit liability (98) (145) Cash used in operating activities (6,862) (939) CAPITAL ACTIVITIES Acquisition of capital assets [note 10] (1,313) (2,297) Cash applied to capital activities (1,313) (2,297) FINANCING ACTIVITIES Contributions for capital asset purchases [note 10] 2,742 6,197 Cash provided by financing activities 2,742 6,197 Net increase (decrease) in cash during the year (5,433) 2,961 Cash, beginning of year 31,987 29,026 Cash, end of year 26,554 31,987 See accompanying notes
1-20 PUBLIC ACCOUNTS, 2012-2013
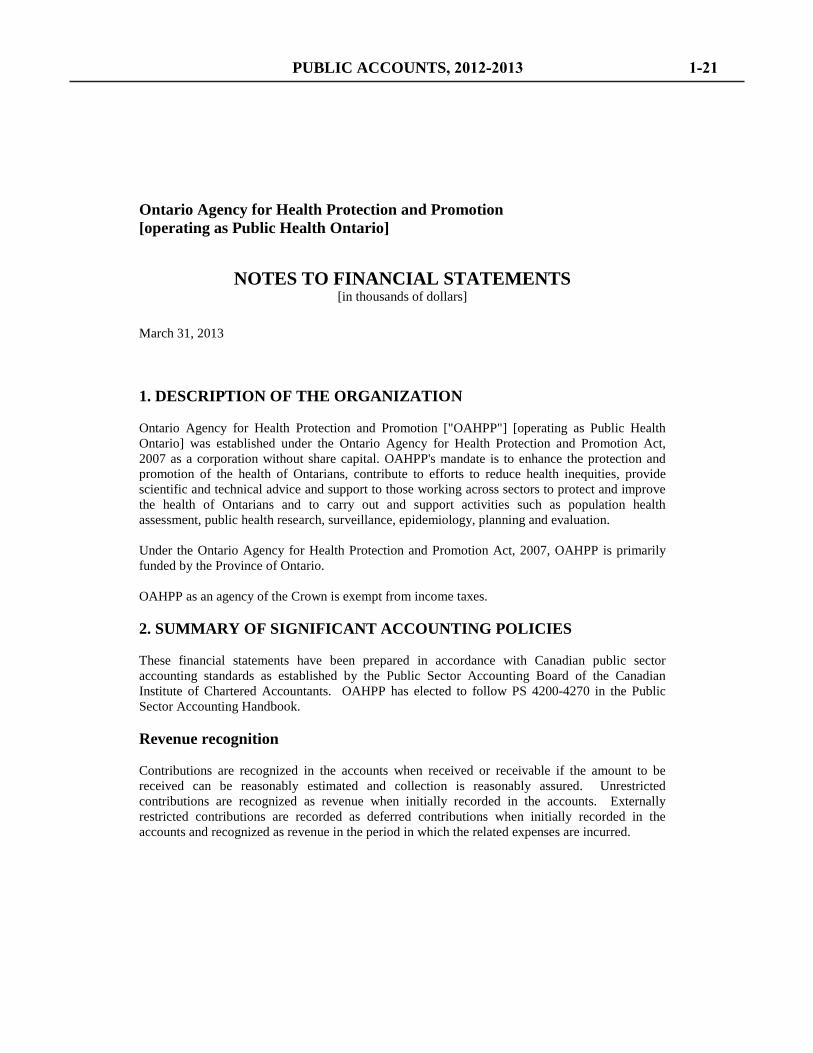
Ontario Agency for Health Protection and Promotion [operating as Public Health Ontario]
NOTES TO FINANCIAL STATEMENTS [in thousands of dollars]
March 31, 2013 1. DESCRIPTION OF THE ORGANIZATION Ontario Agency for Health Protection and Promotion ["OAHPP"] [operating as Public Health Ontario] was established under the Ontario Agency for Health Protection and Promotion Act, 2007 as a corporation without share capital. OAHPP's mandate is to enhance the protection and promotion of the health of Ontarians, contribute to efforts to reduce health inequities, provide scientific and technical advice and support to those working across sectors to protect and improve the health of Ontarians and to carry out and support activities such as population health assessment, public health research, surveillance, epidemiology, planning and evaluation. Under the Ontario Agency for Health Protection and Promotion Act, 2007, OAHPP is primarily funded by the Province of Ontario. OAHPP as an agency of the Crown is exempt from income taxes. 2. SUMMARY OF SIGNIFICANT ACCOUNTING POLICIES These financial statements have been prepared in accordance with Canadian public sector accounting standards as established by the Public Sector Accounting Board of the Canadian Institute of Chartered Accountants. OAHPP has elected to follow PS 4200-4270 in the Public Sector Accounting Handbook. Revenue recognition Contributions are recognized in the accounts when received or receivable if the amount to be received can be reasonably estimated and collection is reasonably assured. Unrestricted contributions are recognized as revenue when initially recorded in the accounts. Externally restricted contributions are recorded as deferred contributions when initially recorded in the accounts and recognized as revenue in the period in which the related expenses are incurred.
PUBLIC ACCOUNTS, 2012-2013 1-21
Ontario Agency for Health Protection and Promotion [operating as Public Health Ontario]
NOTES TO FINANCIAL STATEMENTS [in thousands of dollars]
March 31, 2013 Capital assets Capital assets are recorded at acquisition cost. Contributed capital assets are recorded at fair market value at date of contribution. Amortization is provided on a straight-line basis based upon the estimated useful service lives of the assets as follows: Building service equipment 5-30 years Other equipment 5-10 years Furniture 5-20 years Leasehold improvements Over the term of the lease Inventory and other supplies held for consumption Inventory and other supplies held for consumption are expensed when acquired. Employee future benefits Contributions to multi-employer, defined benefit pension plans are expensed on an accrual basis. Other employee future benefits are non-pension benefits that are provided to certain employees and are accrued as the employees render the service necessary to earn these future benefits. The cost of these future benefits is actuarially determined using the projected unit credit method, prorated on service and management's best estimate of expected salary escalation and retirement ages of employees. Net actuarial gains and losses related to the employee future benefits are amortized over the average remaining service life of the related employee group. Employee future benefit liabilities are discounted using the average interest cost for the Province of Ontario's net new debt obligations with maturities that correspond to the duration of the liability. Allocation of expenses The costs of each function include the costs of personnel and other expenses that are directly related to the function. General support and other costs are not allocated. Contributed materials and services Contributed materials and services are not recorded in the financial statements.
1-22 PUBLIC ACCOUNTS, 2012-2013
Ontario Agency for Health Protection and Promotion [operating as Public Health Ontario]
NOTES TO FINANCIAL STATEMENTS [in thousands of dollars]
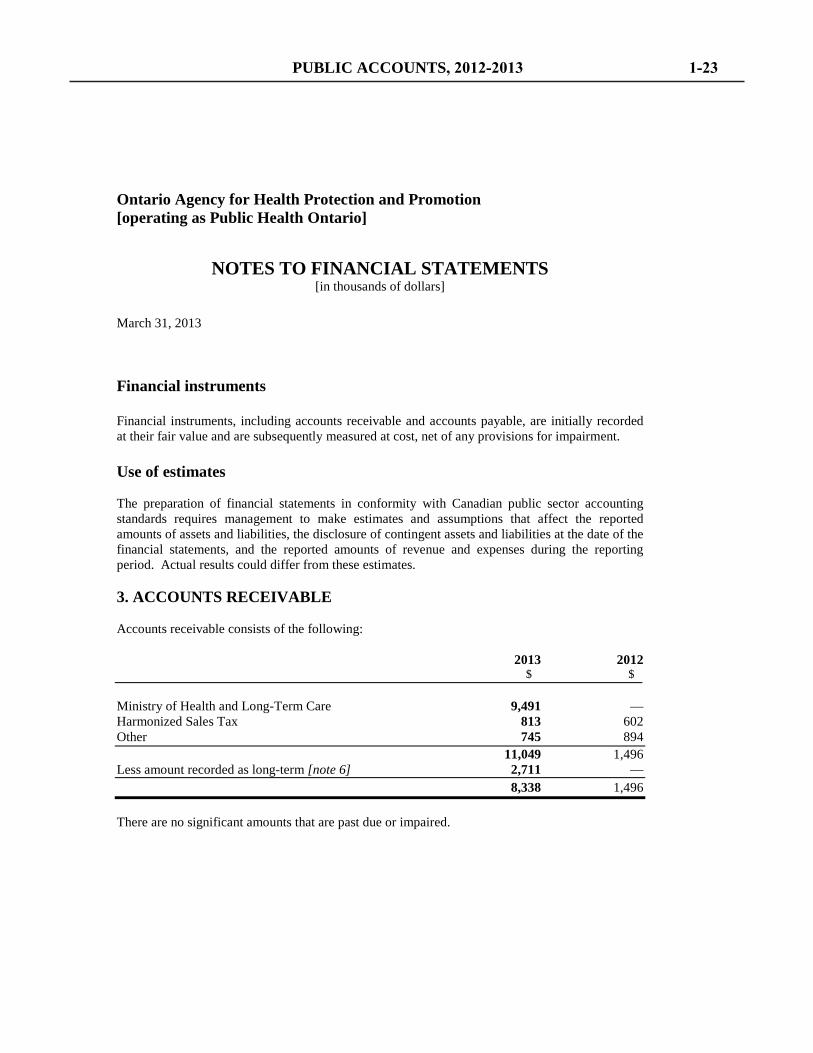
March 31, 2013 Financial instruments Financial instruments, including accounts receivable and accounts payable, are initially recorded at their fair value and are subsequently measured at cost, net of any provisions for impairment. Use of estimates The preparation of financial statements in conformity with Canadian public sector accounting standards requires management to make estimates and assumptions that affect the reported amounts of assets and liabilities, the disclosure of contingent assets and liabilities at the date of the financial statements, and the reported amounts of revenue and expenses during the reporting period. Actual results could differ from these estimates. 3. ACCOUNTS RECEIVABLE Accounts receivable consists of the following: 2013 2012 $ $ Ministry of Health and Long-Term Care 9,491 — Harmonized Sales Tax 813 602 Other 745 894 11,049 1,496 Less amount recorded as long-term [note 6] 2,711 — 8,338 1,496 There are no significant amounts that are past due or impaired.
PUBLIC ACCOUNTS, 2012-2013 1-23
Ontario Agency for Health Protection and Promotion [operating as Public Health Ontario]
NOTES TO FINANCIAL STATEMENTS [in thousands of dollars]
March 31, 2013 4. RESTRICTED CASH [a] Restricted cash consists of the following:
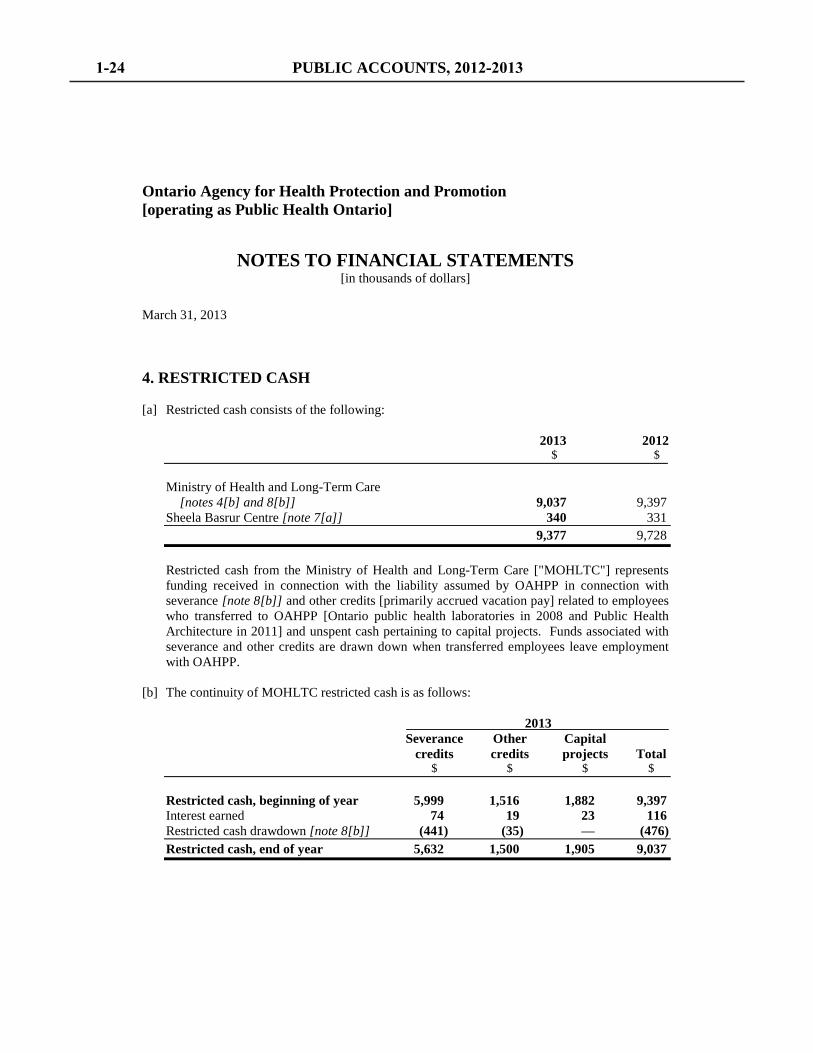
2013 2012 $ $ Ministry of Health and Long-Term Care [notes 4[b] and 8[b]] 9,037 9,397 Sheela Basrur Centre [note 7[a]] 340 331 9,377 9,728 Restricted cash from the Ministry of Health and Long-Term Care ["MOHLTC"] represents funding received in connection with the liability assumed by OAHPP in connection with severance [note 8[b]] and other credits [primarily accrued vacation pay] related to employees who transferred to OAHPP [Ontario public health laboratories in 2008 and Public Health Architecture in 2011] and unspent cash pertaining to capital projects. Funds associated with severance and other credits are drawn down when transferred employees leave employment with OAHPP.
[b] The continuity of MOHLTC restricted cash is as follows:
2013 Severance Other Capital credits credits projects Total $ $ $ $ Restricted cash, beginning of year 5,999 1,516 1,882 9,397 Interest earned 74 19 23 116 Restricted cash drawdown [note 8[b]] (441) (35) — (476) Restricted cash, end of year 5,632 1,500 1,905 9,037
1-24 PUBLIC ACCOUNTS, 2012-2013

Ontario Agency for Health Protection and Promotion [operating as Public Health Ontario]
NOTES TO FINANCIAL STATEMENTS [in thousands of dollars]
March 31, 2013
2012 Severance Other Capital credits credits projects Total $ $ $ $ Restricted cash, beginning of year 5,966 1,316 — 7,282 Restricted cash received 309 211 1,882 2,402 Interest earned 75 17 — 92 Restricted cash drawdown [note 8[b]] (351) (28) — (379) Restricted cash, end of year 5,999 1,516 1,882 9,397
5. CAPITAL ASSETS Capital assets consist of the following: 2013 Net Accumulated book Cost amortization value $ $ $ Building service equipment 369 155 214 Other equipment 25,706 16,448 9,258 Furniture 2,072 1,565 507 Leasehold improvements 7,130 2,740 4,390 Construction in progress 7,525 — 7,525 42,802 20,908 21,894
PUBLIC ACCOUNTS, 2012-2013 1-25
Ontario Agency for Health Protection and Promotion [operating as Public Health Ontario]
NOTES TO FINANCIAL STATEMENTS [in thousands of dollars]
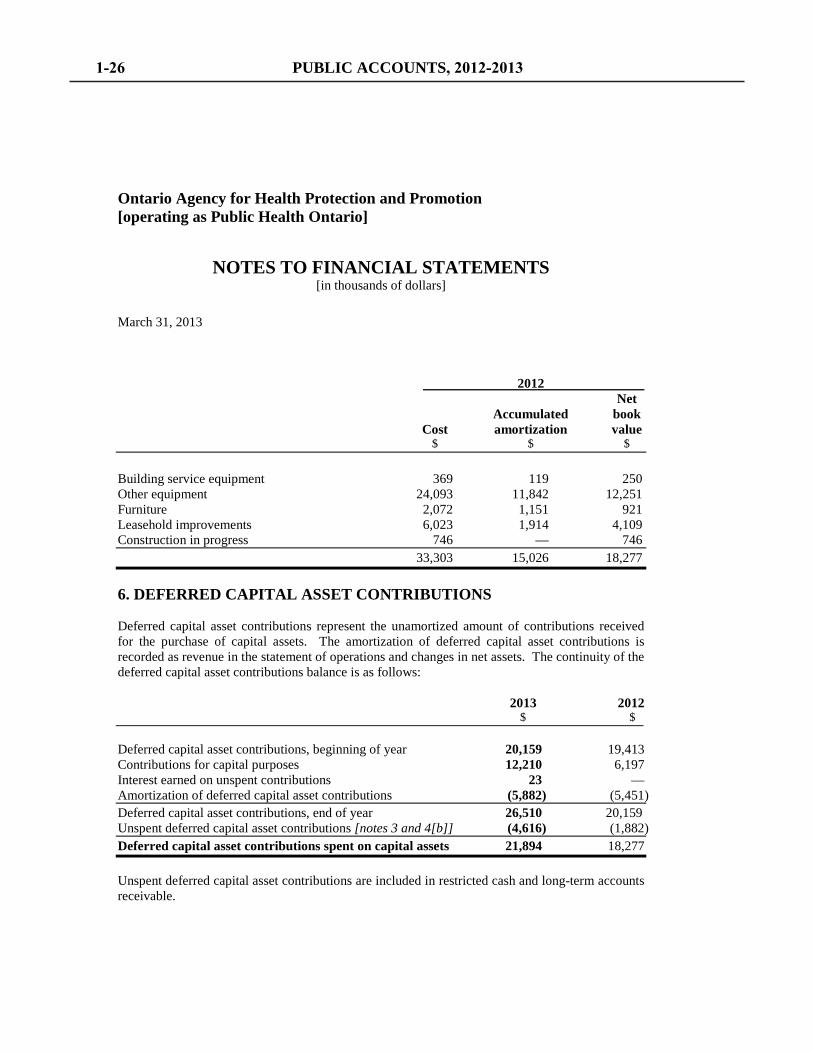
March 31, 2013 2012 Net Accumulated book Cost amortization value $ $ $ Building service equipment 369 119 250 Other equipment 24,093 11,842 12,251 Furniture 2,072 1,151 921 Leasehold improvements 6,023 1,914 4,109 Construction in progress 746 — 746 33,303 15,026 18,277 6. DEFERRED CAPITAL ASSET CONTRIBUTIONS Deferred capital asset contributions represent the unamortized amount of contributions received for the purchase of capital assets. The amortization of deferred capital asset contributions is recorded as revenue in the statement of operations and changes in net assets. The continuity of the deferred capital asset contributions balance is as follows: 2013 2012 $ $ Deferred capital asset contributions, beginning of year 20,159 19,413 Contributions for capital purposes 12,210 6,197 Interest earned on unspent contributions 23 — Amortization of deferred capital asset contributions (5,882) (5,451) Deferred capital asset contributions, end of year 26,510 20,159 Unspent deferred capital asset contributions [notes 3 and 4[b]] (4,616) (1,882) Deferred capital asset contributions spent on capital assets 21,894 18,277 Unspent deferred capital asset contributions are included in restricted cash and long-term accounts receivable.
1-26 PUBLIC ACCOUNTS, 2012-2013
Ontario Agency for Health Protection and Promotion [operating as Public Health Ontario]
NOTES TO FINANCIAL STATEMENTS [in thousands of dollars]
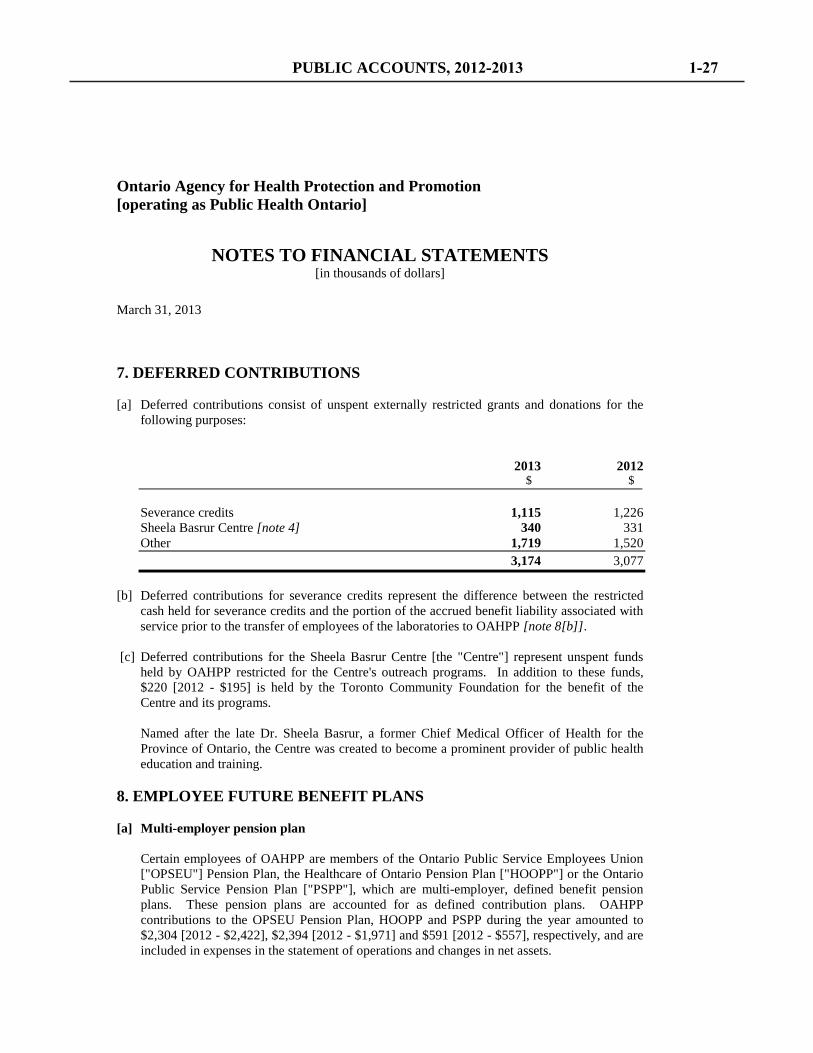
March 31, 2013 7. DEFERRED CONTRIBUTIONS [a] Deferred contributions consist of unspent externally restricted grants and donations for the
following purposes: 2013 2012 $ $ Severance credits 1,115 1,226 Sheela Basrur Centre [note 4] 340 331 Other 1,719 1,520 3,174 3,077
[b] Deferred contributions for severance credits represent the difference between the restricted cash held for severance credits and the portion of the accrued benefit liability associated with service prior to the transfer of employees of the laboratories to OAHPP [note 8[b]].
[c] Deferred contributions for the Sheela Basrur Centre [the "Centre"] represent unspent funds held by OAHPP restricted for the Centre's outreach programs. In addition to these funds, $220 [2012 - $195] is held by the Toronto Community Foundation for the benefit of the Centre and its programs. Named after the late Dr. Sheela Basrur, a former Chief Medical Officer of Health for the Province of Ontario, the Centre was created to become a prominent provider of public health education and training.
8. EMPLOYEE FUTURE BENEFIT PLANS [a] Multi-employer pension plan
Certain employees of OAHPP are members of the Ontario Public Service Employees Union ["OPSEU"] Pension Plan, the Healthcare of Ontario Pension Plan ["HOOPP"] or the Ontario Public Service Pension Plan ["PSPP"], which are multi-employer, defined benefit pension plans. These pension plans are accounted for as defined contribution plans. OAHPP contributions to the OPSEU Pension Plan, HOOPP and PSPP during the year amounted to $2,304 [2012 - $2,422], $2,394 [2012 - $1,971] and $591 [2012 - $557], respectively, and are included in expenses in the statement of operations and changes in net assets.
PUBLIC ACCOUNTS, 2012-2013 1-27
Ontario Agency for Health Protection and Promotion [operating as Public Health Ontario]
NOTES TO FINANCIAL STATEMENTS [in thousands of dollars]
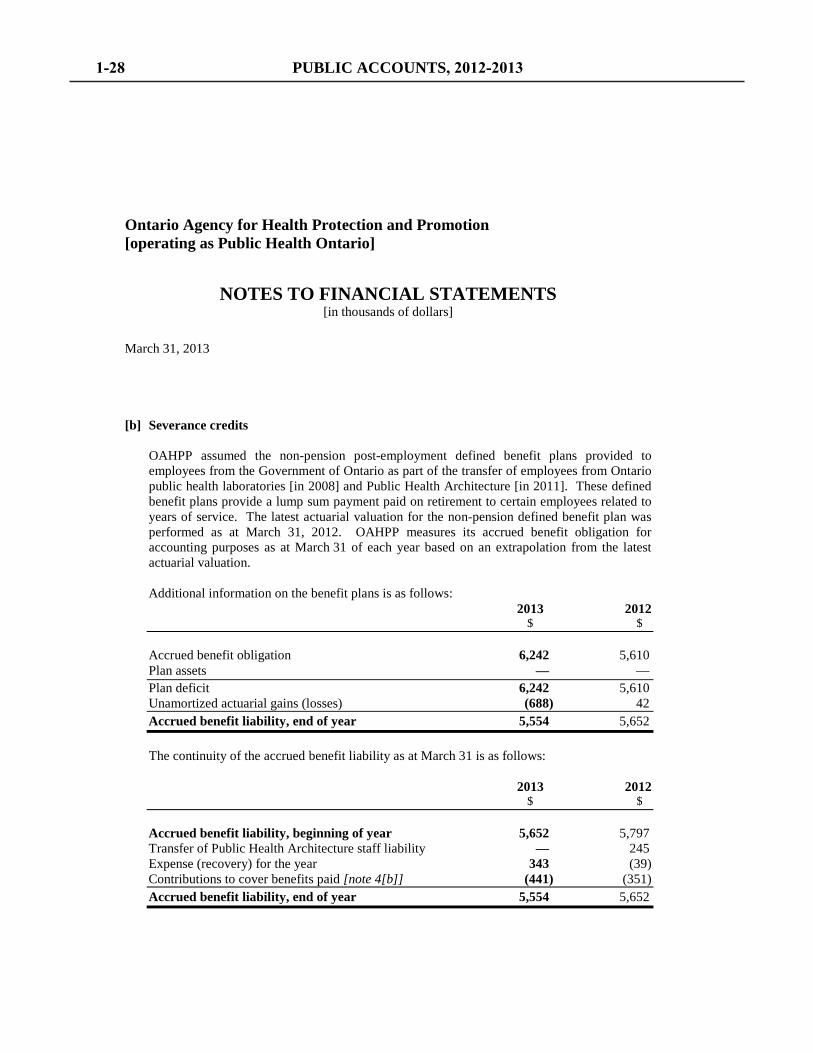
March 31, 2013 [b] Severance credits OAHPP assumed the non-pension post-employment defined benefit plans provided to
employees from the Government of Ontario as part of the transfer of employees from Ontario public health laboratories [in 2008] and Public Health Architecture [in 2011]. These defined benefit plans provide a lump sum payment paid on retirement to certain employees related to years of service. The latest actuarial valuation for the non-pension defined benefit plan was performed as at March 31, 2012. OAHPP measures its accrued benefit obligation for accounting purposes as at March 31 of each year based on an extrapolation from the latest actuarial valuation.
Additional information on the benefit plans is as follows: 2013 2012 $ $ Accrued benefit obligation 6,242 5,610 Plan assets — — Plan deficit 6,242 5,610 Unamortized actuarial gains (losses) (688) 42 Accrued benefit liability, end of year 5,554 5,652 The continuity of the accrued benefit liability as at March 31 is as follows: 2013 2012 $ $ Accrued benefit liability, beginning of year 5,652 5,797 Transfer of Public Health Architecture staff liability — 245 Expense (recovery) for the year 343 (39) Contributions to cover benefits paid [note 4[b]] (441) (351) Accrued benefit liability, end of year 5,554 5,652
1-28 PUBLIC ACCOUNTS, 2012-2013
Ontario Agency for Health Protection and Promotion [operating as Public Health Ontario]
NOTES TO FINANCIAL STATEMENTS [in thousands of dollars]
March 31, 2013
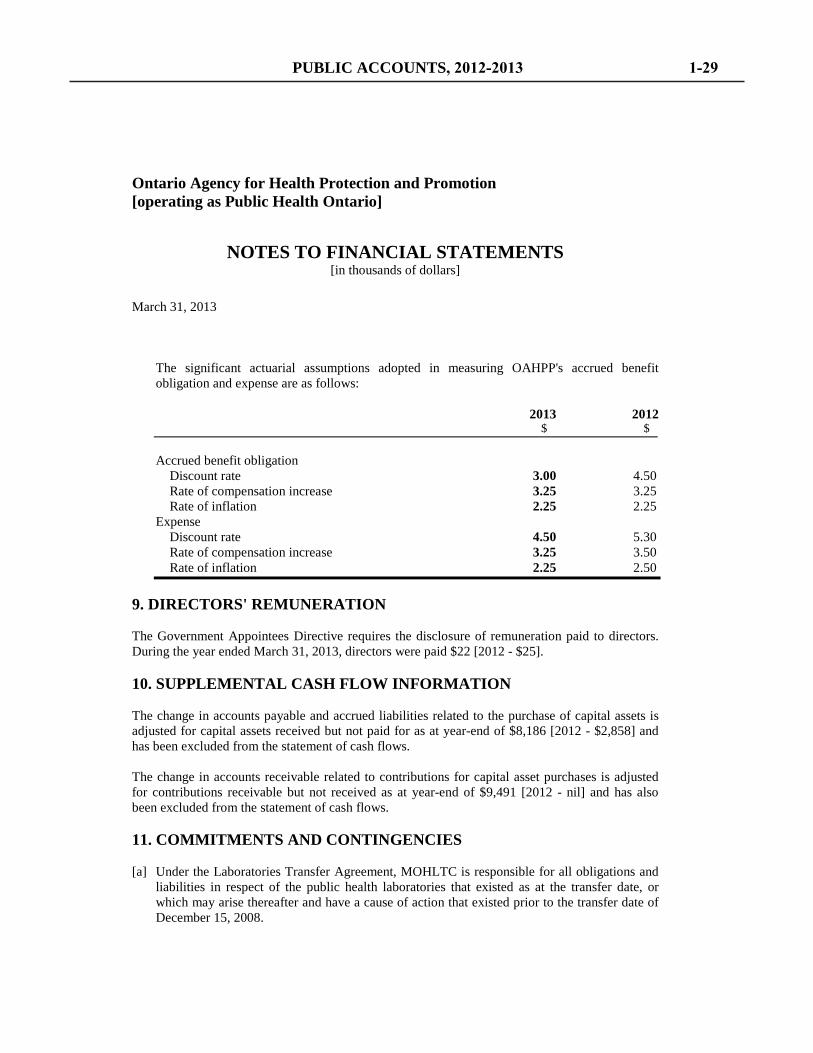
The significant actuarial assumptions adopted in measuring OAHPP's accrued benefit obligation and expense are as follows:
2013 2012 $ $ Accrued benefit obligation Discount rate 3.00 4.50 Rate of compensation increase 3.25 3.25 Rate of inflation 2.25 2.25 Expense Discount rate 4.50 5.30 Rate of compensation increase 3.25 3.50 Rate of inflation 2.25 2.50
9. DIRECTORS' REMUNERATION The Government Appointees Directive requires the disclosure of remuneration paid to directors. During the year ended March 31, 2013, directors were paid $22 [2012 - $25]. 10. SUPPLEMENTAL CASH FLOW INFORMATION The change in accounts payable and accrued liabilities related to the purchase of capital assets is adjusted for capital assets received but not paid for as at year-end of $8,186 [2012 - $2,858] and has been excluded from the statement of cash flows. The change in accounts receivable related to contributions for capital asset purchases is adjusted for contributions receivable but not received as at year-end of $9,491 [2012 - nil] and has also been excluded from the statement of cash flows. 11. COMMITMENTS AND CONTINGENCIES [a] Under the Laboratories Transfer Agreement, MOHLTC is responsible for all obligations and
liabilities in respect of the public health laboratories that existed as at the transfer date, or which may arise thereafter and have a cause of action that existed prior to the transfer date of December 15, 2008.
PUBLIC ACCOUNTS, 2012-2013 1-29
Ontario Agency for Health Protection and Promotion [operating as Public Health Ontario]
NOTES TO FINANCIAL STATEMENTS [in thousands of dollars]
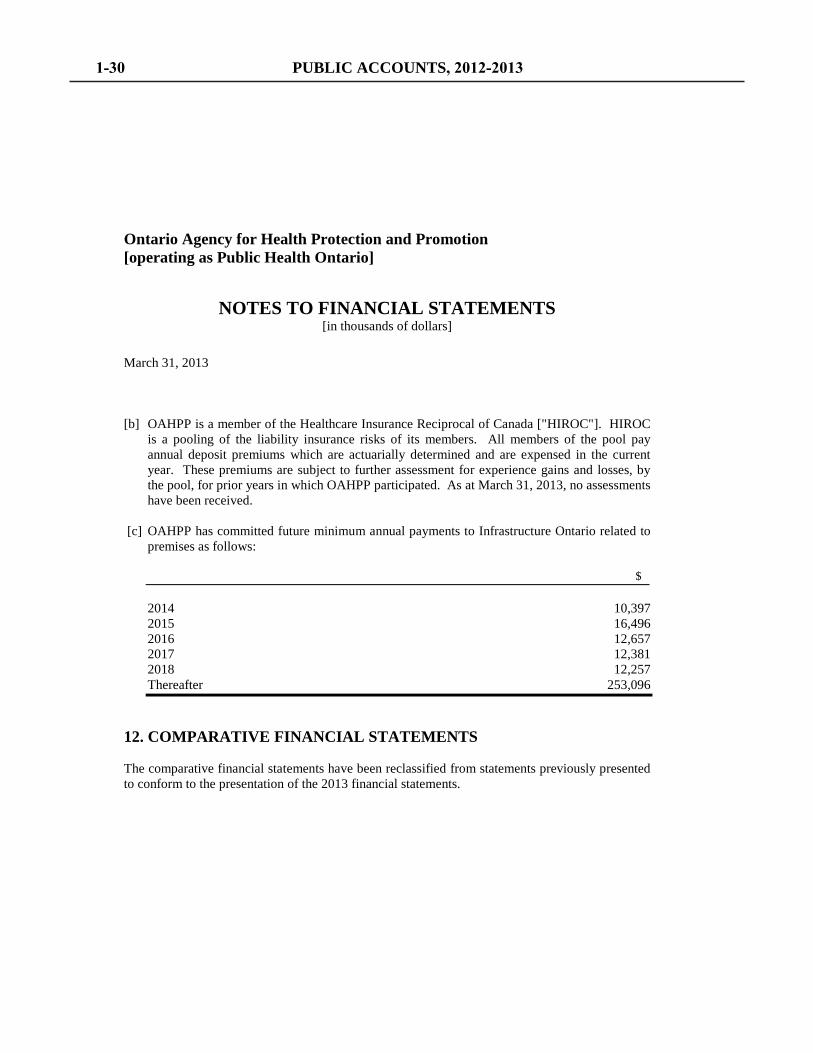
March 31, 2013 [b] OAHPP is a member of the Healthcare Insurance Reciprocal of Canada ["HIROC"]. HIROC
is a pooling of the liability insurance risks of its members. All members of the pool pay annual deposit premiums which are actuarially determined and are expensed in the current year. These premiums are subject to further assessment for experience gains and losses, by the pool, for prior years in which OAHPP participated. As at March 31, 2013, no assessments have been received.
[c] OAHPP has committed future minimum annual payments to Infrastructure Ontario related to
premises as follows:
$ 2014 10,397 2015 16,496 2016 12,657 2017 12,381 2018 12,257 Thereafter 253,096
12. COMPARATIVE FINANCIAL STATEMENTS The comparative financial statements have been reclassified from statements previously presented to conform to the presentation of the 2013 financial statements.
1-30 PUBLIC ACCOUNTS, 2012-2013
Ontario Capital Growth Corporation June 17, 2013 Management’s Responsibility for Financial Reporting The accompanying financial statements of the Ontario Capital Growth Corporation (OCGC) have been prepared in accordance with Canadian public sector accounting standards and are the responsibility of Management. The preparation of financial statements necessarily involves the use of estimates based on Management’s judgment, particularly when transactions affecting the current accounting period cannot be finalized with certainty until future periods. The financial statements have been properly prepared within reasonable limits of materiality and in light of information available up to June 17, 2013.
Management maintains a system of internal controls designed to provide a reasonable assurance that the assets are safeguarded and that reliable financial information is available on a timely basis. The system includes formal policies and procedures and an organizational structure that provide for appropriate de legation of authority and segregation of responsibilities. The Ontario Internal Audit Division of the Ministry of Finance has the ability to independently evaluate the effectiveness of these internal controls on an ongoing basis and, as applicable, report its findings to Management and the Audit and Risk Committee of the Board of Directors.
The Board of Directors is responsible for ensuring that Management fulfills its responsibilities for financial reporting and internal controls. The Audit and Risk Committee assists the Board of Directors in carrying out these responsibilities. It meets periodically with Management, internal auditors and the external auditor, as applicable, to deal with issues raised by them and to review the financial statements before recommending approval by the Board of Directors.
The financial statements have been audited by an independent auditor, PricewaterhouseCoopers LLP. The auditor’s responsibility is to express an opinion on whether OCGC’s financial statements fairly represent OCGC’s financial position in accordance with Canadian public sector accounting standards. The auditor’s report, which appears on the following page, outlines the scope of the auditor’s examination and its opinion.
On behalf of Management:
John Marshall, President and Chief Executive Officer
PUBLIC ACCOUNTS, 2012-2013 1-31
June 17, 2013 Independent Auditor’s Report To the Board of Directors of Ontario Capital Growth Corporation We have audited the accompanying financial statements of Ontario Capital Growth Corporation, which comprise the statements of financial position as at March 31, 2013 and 2012 and the statements of operations and changes in accumulated operating surplus, remeasurement gains and losses, changes in net assets and cash flows for the years then ended, and the related notes, which comprise a summary of significant accounting policies and other explanatory information. Management’s responsibility for the financial statements Management is responsible for the preparation and fair presentation of these financial statements in accordance with Canadian public sector accounting standards, and for such internal control as management determines is necessary to enable the preparation of financial statements that are free from material misstatement, whether due to fraud or error. Auditor’s responsibility Our responsibility is to express an opinion on these financial statements based on our audits. We conducted our audits in accordance with Canadian generally accepted auditing standards. Those standards require that we comply with ethical requirements and plan and perform the audit to obtain reasonable assurance about whether the financial statements are free from material misstatement. An audit involves performing procedures to obtain audit evidence about the amounts and disclosures in the financial statements. The procedures selected depend on the auditor’s judgment, including the assessment of the risks of material misstatement of the financial statements, whether due to fraud or error. In making those risk assessments, the auditor considers internal control relevant to the entity’s preparation and fair presentation of the financial statements in order to design audit procedures that are appropriate in the circumstances, but not for the purpose of expressing an opinion on the effectiveness of the entity’s internal control. An audit also includes evaluating the appropriateness of accounting policies used and the reasonableness of accounting estimates made by management, as well as evaluating the overall presentation of the financial statements. We believe that the audit evidence we have obtained in our audits is sufficient and appropriate to provide a basis for our audit opinion.
PricewaterhouseCoopers LLP PwC Tower, 18 York Street, Suite 2600, Toronto, Ontario, Canada M5J 0B2 T: +1 416 863 1133, F: +1 416 365 8215 “PwC” refers to PricewaterhouseCoopers LLP, an Ontario limited liability partnership.
1-32 PUBLIC ACCOUNTS, 2012-2013
Opinion In our opinion, the financial statements present fairly, in all material respects, the financial position of Ontario Capital Growth Corporation as at March 31, 2013 and 2012 and the results of its operations, its remeasurement gains and losses, changes in its net assets and its cash flows for the years then ended in accordance with Canadian public sector accounting standards.
Chartered Accountants, Licensed Public Accountants
PUBLIC ACCOUNTS, 2012-2013 1-33
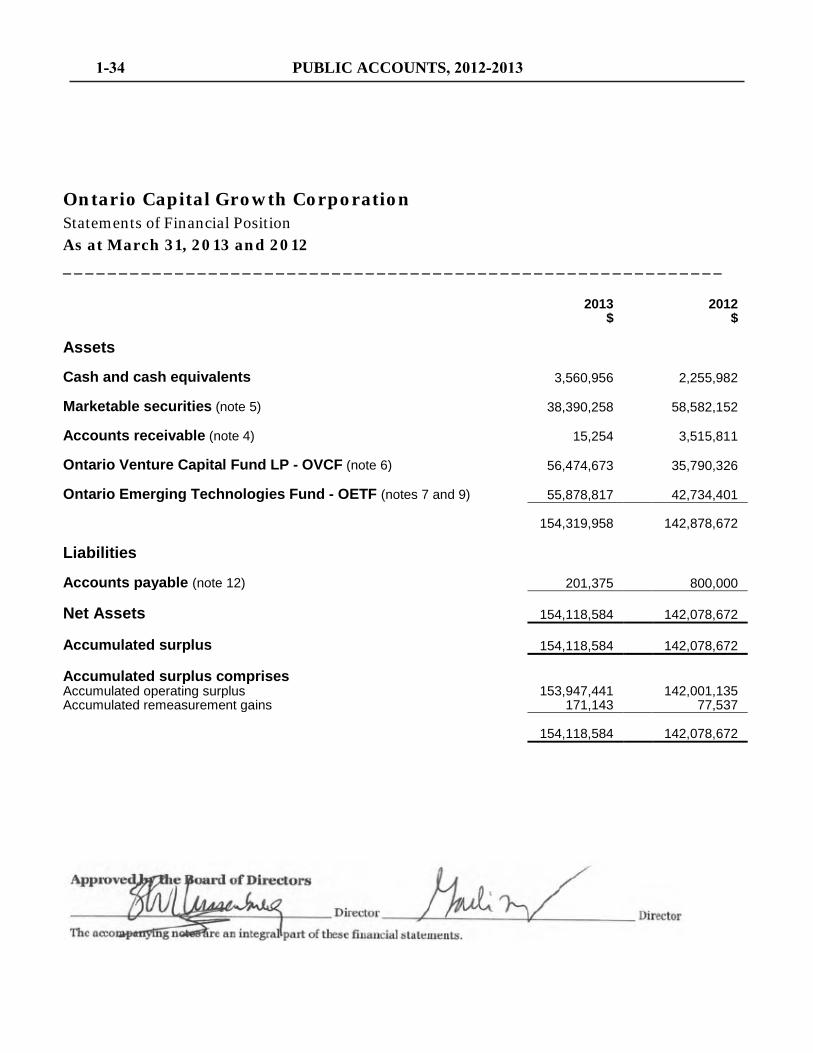
Ontario Capital Growth Corporation Statements of Financial Position As at March 31, 2013 and 2012 ___________________________________________________________
2013
$ 2012
$
Assets Cash and cash equivalents 3,560,956 2,255,982 Marketable securities (note 5) 38,390,258 58,582,152 Accounts receivable (note 4) 15,254 3,515,811 Ontario Venture Capital Fund LP - OVCF (note 6) 56,474,673 35,790,326 Ontario Emerging Technologies Fund - OETF (notes 7 and 9) 55,878,817 42,734,401 154,319,958 142,878,672 Liabilities Accounts payable (note 12) 201,375 800,000 Net Assets 154,118,584 142,078,672 Accumulated surplus 154,118,584 142,078,672 Accumulated surplus comprises Accumulated operating surplus 153,947,441 142,001,135 Accumulated remeasurement gains 171,143 77,537 154,118,584 142,078,672
1-34 PUBLIC ACCOUNTS, 2012-2013
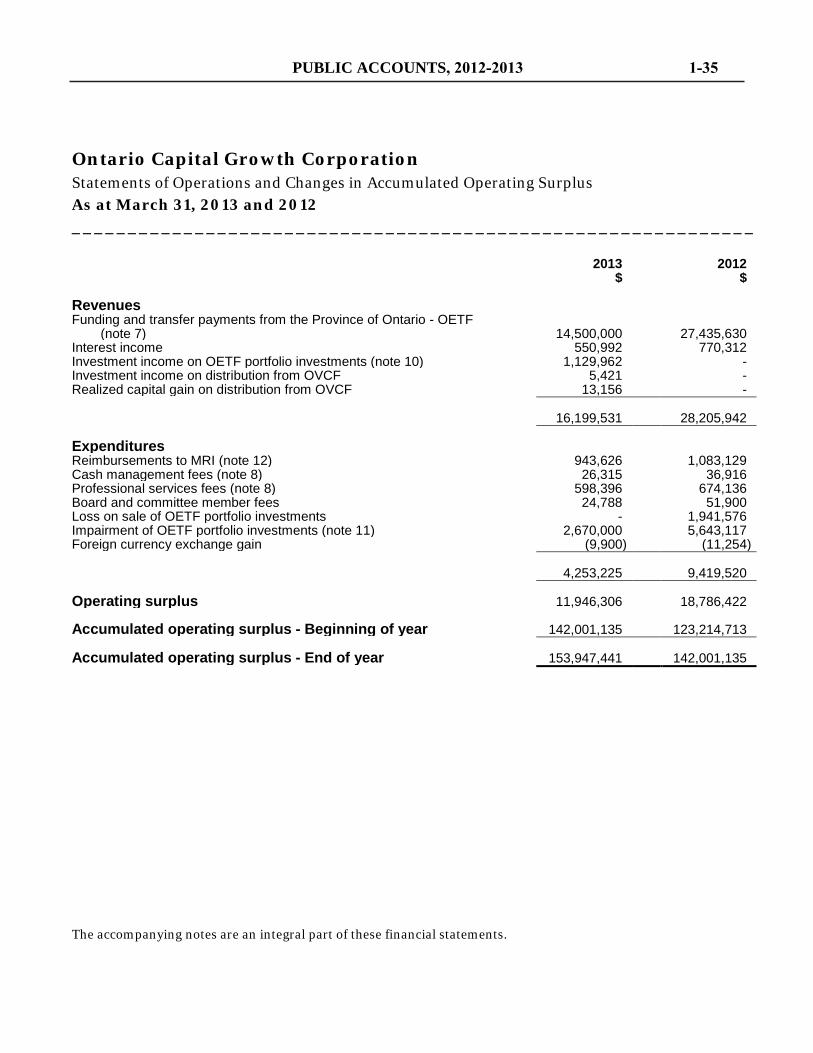
Ontario Capital Growth Corporation Statements of Operations and Changes in Accumulated Operating Surplus As at March 31, 2013 and 2012 _____________________________________________________________
The accompanying notes are an integral part of these financial statements.
2013
$ 2012
$
Revenues Funding and transfer payments from the Province of Ontario - OETF
(note 7) 14,500,000 27,435,630 Interest income 550,992 770,312 Investment income on OETF portfolio investments (note 10) 1,129,962 - Investment income on distribution from OVCF 5,421 - Realized capital gain on distribution from OVCF 13,156 - 16,199,531 28,205,942 Expenditures Reimbursements to MRI (note 12) 943,626 1,083,129 Cash management fees (note 8) 26,315 36,916 Professional services fees (note 8) 598,396 674,136 Board and committee member fees 24,788 51,900 Loss on sale of OETF portfolio investments - 1,941,576 Impairment of OETF portfolio investments (note 11) 2,670,000 5,643,117 Foreign currency exchange gain (9,900) (11,254) 4,253,225 9,419,520 Operating surplus 11,946,306 18,786,422 Accumulated operating surplus - Beginning of year 142,001,135 123,214,713 Accumulated operating surplus - End of year 153,947,441 142,001,135
PUBLIC ACCOUNTS, 2012-2013 1-35
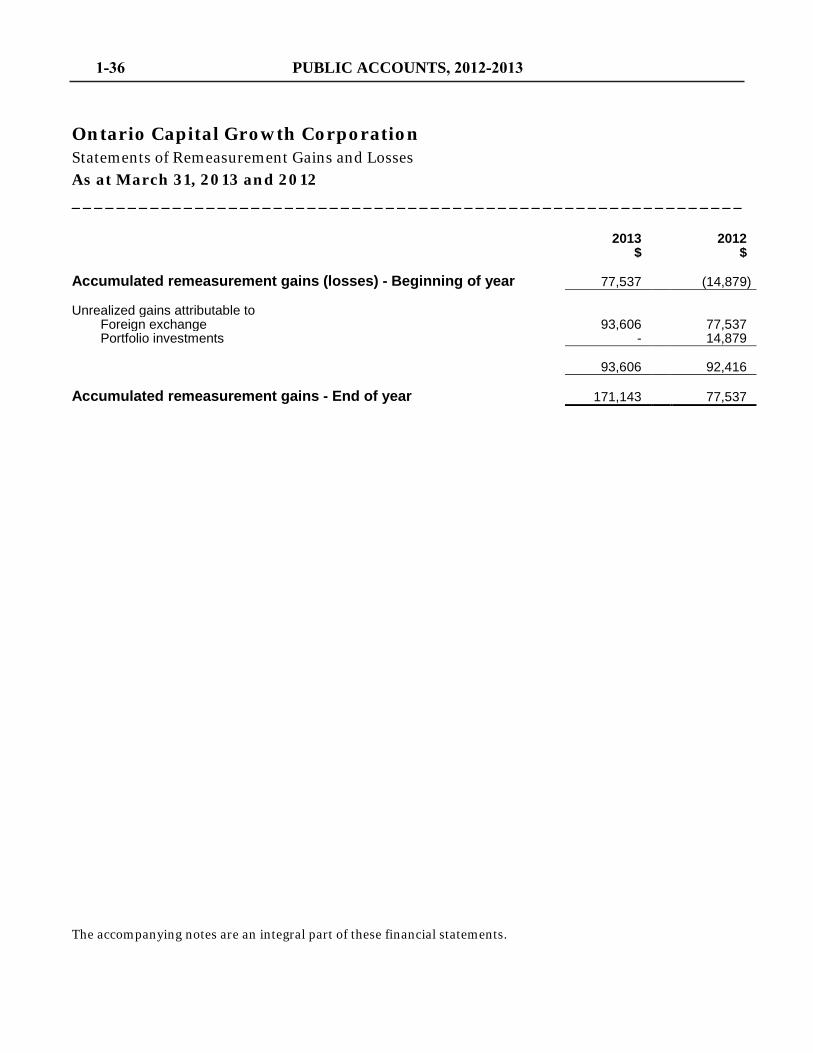
Ontario Capital Growth Corporation Statements of Remeasurement Gains and Losses As at March 31, 2013 and 2012 ____________________________________________________________
2013
$ 2012
$
Accumulated remeasurement gains (losses) - Beginning of year 77,537 (14,879) Unrealized gains attributable to
Foreign exchange 93,606 77,537 Portfolio investments - 14,879
93,606 92,416 Accumulated remeasurement gains - End of year 171,143 77,537
The accompanying notes are an integral part of these financial statements.
1-36 PUBLIC ACCOUNTS, 2012-2013
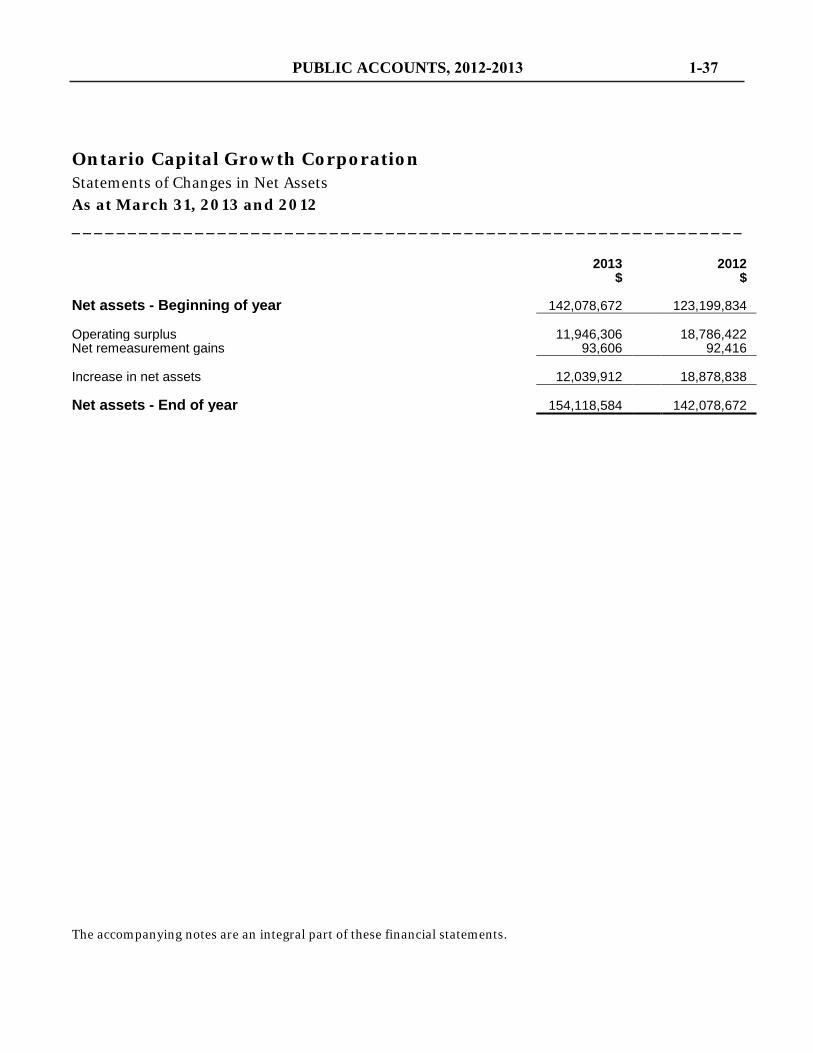
Ontario Capital Growth Corporation Statements of Changes in Net Assets As at March 31, 2013 and 2012 ____________________________________________________________
The accompanying notes are an integral part of these financial statements.
2013
$ 2012
$
Net assets - Beginning of year 142,078,672 123,199,834 Operating surplus 11,946,306 18,786,422 Net remeasurement gains 93,606 92,416 Increase in net assets 12,039,912 18,878,838 Net assets - End of year 154,118,584 142,078,672
PUBLIC ACCOUNTS, 2012-2013 1-37
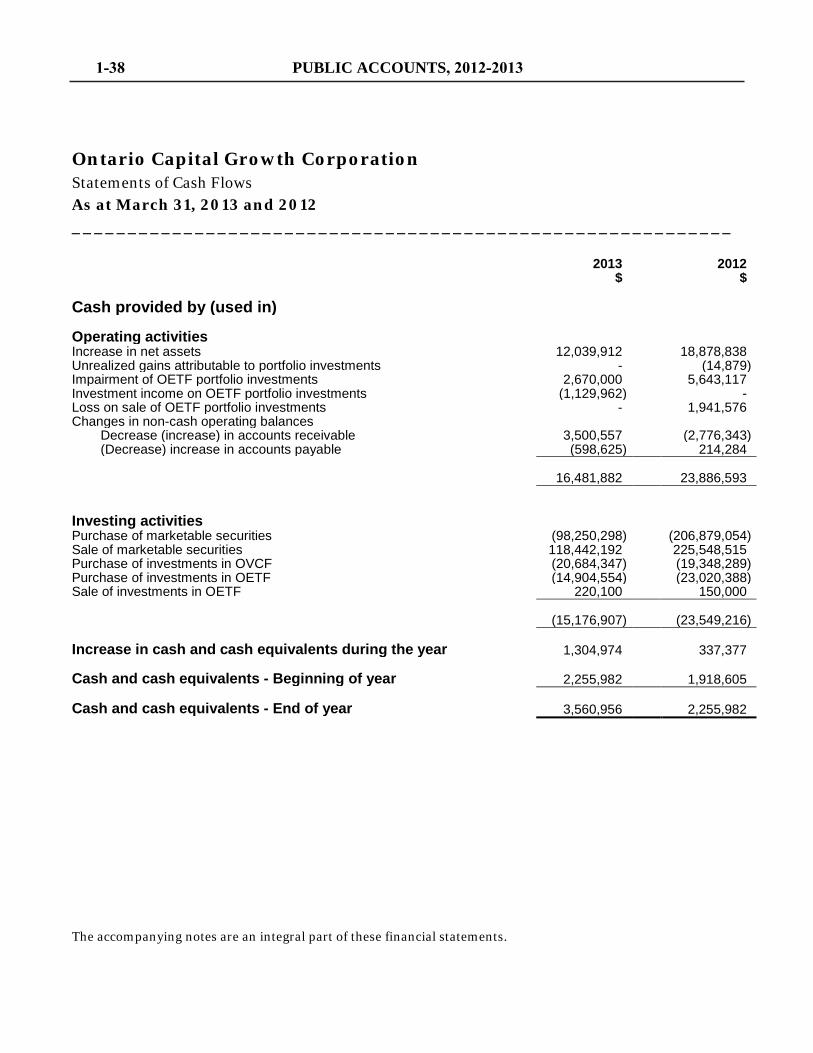
Ontario Capital Growth Corporation Statements of Cash Flows As at March 31, 2013 and 2012 ___________________________________________________________
The accompanying notes are an integral part of these financial statements.
2013
$ 2012
$
Cash provided by (used in) Operating activities Increase in net assets 12,039,912 18,878,838 Unrealized gains attributable to portfolio investments - (14,879) Impairment of OETF portfolio investments 2,670,000 5,643,117 Investment income on OETF portfolio investments (1,129,962) - Loss on sale of OETF portfolio investments - 1,941,576 Changes in non-cash operating balances
Decrease (increase) in accounts receivable 3,500,557 (2,776,343) (Decrease) increase in accounts payable (598,625) 214,284
16,481,882 23,886,593 Investing activities Purchase of marketable securities (98,250,298) (206,879,054) Sale of marketable securities 118,442,192 225,548,515 Purchase of investments in OVCF (20,684,347) (19,348,289) Purchase of investments in OETF (14,904,554) (23,020,388) Sale of investments in OETF 220,100 150,000 (15,176,907) (23,549,216) Increase in cash and cash equivalents during the year 1,304,974 337,377 Cash and cash equivalents - Beginning of year 2,255,982 1,918,605 Cash and cash equivalents - End of year 3,560,956 2,255,982
1-38 PUBLIC ACCOUNTS, 2012-2013
Ontario Capital Growth Corporation Notes for Financial Statements As at March 31, 2013 and 2012 ___________________________________________________________
1 Description of business
Ontario Capital Growth Corporation (OCGC or the Corporation) is a corporation without share capital, established under the Ontario Capital Growth Corporation Act, 2008 (the Act), which was proclaimed in force as of February 1, 2009 as an agency of the Ministry of Research and Innovation (MRI). As of March 31, 2013, OCGC is responsible to the Minister of Research and Innovation.
The legislative authority of the Corporation is set out in the Act. Under Section 4 of the Act, the objectives of the Corporation are:
a) to receive, hold, administer and otherwise deal with the interest of the Government of Ontario in the limited partnership known as the Ontario Venture Capital Fund LP (OVCF);
b) to receive, hold and deal with property, whether real or personal, in connection with the objectives described in Section 4(a); and
c) to carry out the other objectives that are prescribed by Ontario Regulation 278/09 (the Regulations).
Under Section 1 of the Regulations, made under the Act, the following are prescribed as additional objectives of the Corporation:
a) to acquire, manage and otherwise deal with a portfolio of investments in businesses that the Corporation considers constitute emerging technologies businesses, which portfolio is known in English as the Ontario Emerging Technologies Fund (OETF) and in French as Fonds ontarien de développement des technologies émergentes; and
b) to receive, hold, invest, sell or otherwise deal with property, whether real or personal, in connection with the objectives described in clause 1(a).
On February 19, 2013, in the Ontario Throne Speech, Ontario committed up to $50 million to a new Ontario venture capital fund. OCGC has been given the mandate to work with the federal government and private sector to establish the fund. Ontario and the federal government would each invest up to $50 million to leverage private sector investment to create an up to $300 million “fund of funds”. Similar to the existing OVCF, a private sector general partner will be selected by the limited partners to manage the fund.
As required by the Agency Establishment and Accountability Directive, the Corporation and MRI have entered into a memorandum of understanding, which outlines the operational, administrative, financial and other relationships that exist between OCGC and MRI.
OCGC is classified as an Operational Enterprise Agency. OCGC is responsible for fulfilling the Province of Ontario’s contractual obligations as a limited partner in the OVCF. OCGC is also responsible to establish, hold, manage and administer the OETF.
PUBLIC ACCOUNTS, 2012-2013 1-39
Ontario Capital Growth Corporation Notes for Financial Statements As at March 31, 2013 and 2012 ___________________________________________________________
OVCF is a joint initiative between the Province of Ontario and leading institutional investors. It is structured as a fund-of-funds that invests primarily in Ontario-based and Ontario-focused venture capital and growth funds, which, in turn, makes investments in innovative, high-growth companies. OVCF was established to provide investment funding to venture capital and growth equity managers capable of generating superior returns by investing in enterprises with a view to creating large, globally competitive companies.
OETF is structured as a direct co-investment fund that will only make investments in innovative high-potential companies alongside other qualified investor(s) with a proven track record of success. OETF is an initiative of the Government of Ontario to invest in innovative high-potential companies with an Ontario footprint in three strategic sectors: (a) clean technology; (b) digital media and information and communications technologies; and (c) life sciences and advanced health technologies.
OCGC claims exemption from federal and provincial income taxes under paragraph 149(1)(d) of the Income Tax Act (Canada). OCGC also claims exemption from the federal goods and services tax imposed by the Excise Tax Act (Canada). In November 2009, the Canada Revenue Agency confirmed exemption from the goods and services tax effective February 1, 2009.
As part of the change to the harmonized sales tax (HST) and in accordance with the HST agreement between the Governments of Ontario and Canada, provincial government entities (ministries and agencies) no longer have an exemption from paying the GST/HST. As of July 1, 2010, a pay and rebate model applies. This means that OCGC now pays the 13% HST on taxable supplies, and then applies for a rebate of the full 13% amount.
OCGC operates in the same fiscal year ending March 31 as the Government of Ontario.
2 Summary of significant accounting policies
The Corporation’s functional and presentation currency is the Canadian dollar. All financial statement disclosures have been prepared in accordance with Canadian public sector accounting standards (PSAS) established by the Canadian Public Sector Accounting Board. The more significant accounting policies of the Corporation are summarized below.
Cash and cash equivalents
Cash and cash equivalents include demand deposits that are readily convertible to known amounts of cash and that are subject to an insignificant risk of change in value.
Marketable securities
Marketable securities quoted in an active market are measured at fair value as at the dates of the statements of financial position with any unrealized gain or loss recognized on the statements of remeasurement gains and losses. Remeasurement gains and losses related to a particular investment are reclassified to the statements of operations and changes in operating surplus when that investment is settled. Fair value includes the value of accrued interest, as applicable.
1-40 PUBLIC ACCOUNTS, 2012-2013
Ontario Capital Growth Corporation Notes for Financial Statements As at March 31, 2013 and 2012 ___________________________________________________________
Portfolio investments that are not traded in an active market are measured at cost. Impairment losses, which are other than temporary, are recognized in the statements of operations and changes in accumulated operating surplus when they occur.
Ontario Venture Capital Fund LP
The investment in OVCF is classified as a financial instrument and carried at cost based on the capital calls made by the general partner of OVCF. The investment in OVCF is not traded in an active market; therefore, fair value of the investment is not readily determinable. OVCF investments are subsequently tested for impairment on each statement of financial position date and any losses due to impairment are recognized in the statements of operations and changes in accumulated operating surplus on that date.
Ontario Emerging Technologies Fund
Investments in OETF are classified as financial instruments and carried at cost or measured at fair value based on whether or not there exists of an active market for the securities. OETF investments quoted in an active market are measured at fair value as at the statements of financial position dates with any unrealized gain or loss recognized on the statements of remeasurement gains and losses. Remeasurement gains and losses are reclassified to the statements of operations and changes in accumulated operating surplus when an investment becomes impaired or is derecognized. Impairment losses that are other than temporary are recorded to the statements of operations and changes in accumulated operating surplus when recognized. Fair value includes the value of accrued interest or dividends payable, as applicable.
When an OETF investment is not traded in an active market, it is measured at cost. OETF investments are tested for impairment on each statement of financial position date and any impairment losses are recognized in the statements of operations and changes in accumulated operating surplus on those dates.
Accrued interest and dividends on OETF investments are recorded as described below under revenue recognition. If the Corporation has evidence that the amounts owing will be collected, these amounts are accrued as receivable; otherwise, a reserve is taken against these amounts. If, in a future year, the Corporation receives an amount that had been written off, it is recorded as a recovery of interest that had been previously deemed uncollectible. Amounts written off or recovered are recognized in the statements of operations and changes in accumulated operating surplus in the year in which they occur.
Revenue recognition
Interest income is recognized as it is earned. For marketable securities and OETF investments, interest income is accrued using the effective interest rate method.
Dividend income is recognized in the year that the Corporation becomes entitled to receive the dividend as per the terms and conditions of the share issuance.
Revenue on distributions from OVCF are recognized in the year that the Corporation becomes entitled to receive the distribution as per the terms and conditions of OVCF limited partnership agreement.
OETF funding received represents monies transferred from MRI to the Corporation, as described note 7.
PUBLIC ACCOUNTS, 2012-2013 1-41
Ontario Capital Growth Corporation Notes for Financial Statements As at March 31, 2013 and 2012 ___________________________________________________________
Expense categories
Cash management fees primarily represent fees paid to the Ontario Financing Authority (OFA) for cash management and related services.
Professional fees relate to fees paid to third party service providers.
Board and committee member expenses represent monies paid to board and committee members according to the Board and Committee Members Remuneration Policy, which conforms with the Government Appointees Directive of Management Board of Cabinet (May 1, 2011).
Reimbursements to MRI represent direct OCGC expenses paid by MRI on its behalf for administrative purposes only.
Foreign currency translation
Foreign currency gains and losses on monetary items are recognized immediately in the statements of operations and changes in accumulated operating surplus. Unrealized foreign currency gains and losses on portfolio investments, OVCF investments, and OETF investments are recognized in the statements of remeasurement gains and losses. Unrealized foreign currency exchange gains and losses are reclassified from the statements of remeasurement gains and losses to the statements of operations and changes in accumulated operating surplus when the financial instrument is derecognized.
Measurement uncertainty
The preparation of financial statements in accordance with PSAS requires management to make estimates and assumptions that affect the reported amounts of assets and liabilities, the disclosure of contingent assets and liabilities at the dates of the financial statements and the reported amounts of revenues and expenses during the reporting period. Such estimates are based on the best information available at the time of preparation of the financial statements and are periodically reviewed to reflect new information as it becomes available. Actual results could differ from these estimates.
3 Financial instruments
Credit risk
Credit risk arises from the potential that a counterparty will fail to perform its obligations. The Corporation is currently exposed to credit risk through its holdings of convertible debt instruments in OETF. The Corporation considers obligations of the Governments of Ontario and Canada to be relatively risk-free (note 5).
1-42 PUBLIC ACCOUNTS, 2012-2013
Ontario Capital Growth Corporation Notes for Financial Statements As at March 31, 2013 and 2012 ___________________________________________________________
Fair value
The Corporation’s carrying values of cash and cash equivalents, accounts receivable and accounts payable approximate their fair values due to the immediate or short-term nature of these financial instruments.
The fair value of the investment in OVCF is not readily determinable and has been recorded at cost. OVCF does not have a quoted market price in an active market.
The co-investments made in OETF are recorded at cost, which represent fair value at the time of acquisition. Investments that are quoted in an active market are measured at fair value at the statements of financial position dates. Any unrealized gain or loss at this date is recognized in the statements of remeasurement gains and losses until the investment is derecognized or other than temporarily impaired. All other OETF investments are measured at cost or amortized cost. As part of the reporting process to the Province of Ontario, the Corporation is required to carry out periodic valuations of OETF portfolio investments to determine whether there has been an other than temporary loss in value that would indicate impairment. If the investments are determined to be impaired, they are written down to the new carrying value and the resultant impairment expense is recognized immediately in the statements of operations and changes in accumulated operating surplus. Furthermore, to the extent that a security held in OETF represents a compound financial instrument with an embedded derivative, such as an equity conversion option, the value of that derivative at acquisition should be measured at fair value unless that derivative is linked to and must be settled by delivery of unquoted equity instruments, in which case, would require the derivative to be measured at cost. For derivatives classified to the fair value category, value is first determined by referencing a quoted price in an active market, or, in absence of this, applying a suitable valuation technique.
Currency risk
Currency risk is the risk to the Corporation’s results of operations that arises from fluctuations of foreign currency exchange rates and the degree of volatility of these rates. The Corporation’s exposure to foreign currency exchange risk is limited to holding US dollar cash and cash equivalents and holding OETF investments denominated in US dollars. OCGC does not hedge its US dollar exposure. The Corporation had a net exposure of $5,669,025 to the US dollar as at March 31, 2013 (2012 - $5,889,580). A 5% increase (5% decrease) of the Canadian dollar against the US dollar as at March 31, 2013 would result in an impact of $283,451 on the statements of remeasurement gains and losses (2012 - $294,479) with no impact on the operating surplus. In practice, the actual trading results may differ from this sensitivity analysis and the impact could be material.
Interest rate risk
Interest rate risk is the risk the value of a financial instrument might be adversely affected by a change in the interest rates. In seeking to minimize the risks from interest rate fluctuations, the Corporation manages exposure through its normal operating and financing activities. The Corporation is exposed to interest rate risk primarily through its short-term marketable securities and OETF portfolio. Risks from interest rate fluctuations for marketable securities are minimal due to the investments being held for a term of three years or less to match the OVCF drawdowns projected by the OVCF fund manager. The impact of interest rate fluctuations on OETF investments are considered minimal as these instruments are primarily held for purposes of capital appreciation.
PUBLIC ACCOUNTS, 2012-2013 1-43
Ontario Capital Growth Corporation Notes for Financial Statements As at March 31, 2013 and 2012 ___________________________________________________________
Other price risk
Other price risk is the risk the value of financial instruments will fluctuate as a result of changes in market prices or from factors specific to an individual investment. The maximum risk resulting from the financial instruments is equivalent to their fair value. The marketable securities consist of treasury bills that are not subject to significant price risk. As at March 31, 2013, if the value of the investments in OVCF and OETF had increased or decreased by 5%, all other variables held constant, the value of the investments would have changed by $5,617,675 (2012 - $3,926,236). Investments made through OVCF or in OETF are highly illiquid, do not have a readily determinable market price, and are generally in early stage companies where the ultimate value that may be realized by OCGC on eventual disposition is inherently unpredictable.
Returns on these investments will depend on factors specific to each company (such as financial performance, product viability and quality of management), and external forces (such as the economic environment and technological progress by competitors). The carrying value of the OETF portfolio is measured at cost less changes for any other than temporary impairment in value at the statements of financial position dates; however, the amounts that may ultimately be realized could be materially different.
4 Accounts receivable
For each fiscal year ending March 31, disbursements under OETF transfer payment agreement to the Corporation may be overdue from the Province of Ontario due to year-end payment processing delays. For the years ended March 31, 2013 and 2012, overdue payments of $nil and $3,500,000 were received in full subsequent to the year-ends, respectively.
As a Schedule A provincial agency, OCGC is required to follow the pay and rebate model with respect to HST applied to direct purchases. The Corporation pays the HST on its purchases and, subsequently, files a monthly rebate claim with the Canada Revenue Agency for the HST paid. HST rebates receivable as at March 31, 2013 amounted to $15,254 (2012 - $15,811).
5 Marketable securities
OCGC may temporarily invest any monies not immediately required to carry out its objectives in:
a) debt obligations of or guaranteed by the Government of Canada or a province of Canada; or
b) interest bearing accounts and short-term certificates of deposit issued or guaranteed by a chartered bank, trust company, credit union or caisse populaire.
1-44 PUBLIC ACCOUNTS, 2012-2013
Ontario Capital Growth Corporation Notes for Financial Statements As at March 31, 2013 and 2012 ___________________________________________________________
The value of portfolio investments as at March 31 is as follows:
2013 2012
Par value
$ Fair value
$ Par value
$ Fair value
$
Province of Ontario treasury bill, due on June 12, 2013, average coupon rate of 0.000% 38,495,000 38,390,258 58,814,000 58,582,152
Fair value includes any accrued interest owing on the treasury bills.
The fair value of the marketable securities may fluctuate depending on changes in interest rates. For the year ended March 31, 2013, a change in interest rates of 1.00% would result in an impact of $0.080 million (2012 - $0.22 million) to the results of operations.
6 Ontario Venture Capital Fund LP
The investment in OVCF is carried at cost, based on the capital calls made by the general partner of OVCF. OVCF is not traded in an active market and the fair value of the investment is not readily determinable.
7 Province of Ontario - Ontario Emerging Technologies Fund
The investment in OETF was launched in July 2009 with a commitment from the Province of Ontario to provide funding of $250 million. OETF, as a direct co-investment fund, will only make investments into innovative high-potential companies alongside other qualified investor(s) with a proven track record of success. Investments will be in: (a) clean technology; (b) digital media and information and communication technologies; and (c) life sciences and advanced health technologies.
On May 30, 2012, the Corporation implemented a pause on any new investments under OETF for an indefinite period of time. This decision did not affect the Corporation’s ability to continue to make follow-on investments into existing portfolio companies and did not affect investments-in-process that had already been approved by OCGC’s Board of Directors but had not yet closed.
PUBLIC ACCOUNTS, 2012-2013 1-45
Ontario Capital Growth Corporation Notes for Financial Statements As at March 31, 2013 and 2012 ___________________________________________________________
8 Contractual commitments
OCGC has the following contractual commitments:
a) In accordance with a financial service agreement between OFA and OCGC, OFA conducts investment and cash management services and activities for OCGC. OFA is the agency of the Province of Ontario responsible for providing financial and centralized cash management services for the government. OCGC pays OFA a fee for these services based on assets under management and reimburses for other related activities on a cost recovery basis.
b) Pursuant to the OVCF limited partnership agreement, OCGC is committed to making capital contributions on notice of capital calls. As at March 31, 2013, the total uncalled commitment is $33,515,843 to be drawn down over the remaining years of the limited partnership.
c) In accordance with the contract between Ernst & Young LLP (E&Y) and OCGC, E&Y conducts due diligence services and activities to qualify OETF co-investors. OCGC pays both a fixed rate and hourly rates for these services and activities, respectively.
d) In accordance with the contract between Covington Capital Inc. (Covington) and OCGC, Covington conducts services and activities to qualify, monitor, and exit OETF’s investments. OCGC pays both a fixed rate and hourly rates for these services and activities, respectively.
e) In accordance with the contract between Weiler & Company (Weiler) and OCGC, Weiler performs accounting functions relating to the operations of OCGC, OVCF investments, and OETF investments. OCGC pays an hourly rate for these services.
9 Investments in OETF
The investment portfolio of OETF as at March 31, 2013 and 2012 is summarized as follows:
2013 2012
Acquisition cost
$
Carrying value
$ Contingent*
$
Acquisition cost
$
Carrying value
$ Contingent
$
Canadian investments 52,902,089 50,662,051 2,856,949 38,914,000 37,714,100 5,086,927
US investments 9,084,044 5,216,766 78,901 9,591,371 5,020,301 1,346,563 61,986,133 55,878,817 2,935,850 48,505,371 42,734,401 6,433,490
* Represents follow-on investments committed to by the Corporation but not yet executed
1-46 PUBLIC ACCOUNTS, 2012-2013
Ontario Capital Growth Corporation Notes for Financial Statements As at March 31, 2013 and 2012 ___________________________________________________________
Investments in OETF can take the form of shares or convertible debt. All investments have been made in accordance with OETF guidelines. As at March 31, 2013, the OETF portfolio consisted of investments in 23 different companies, ranging from 0.11% to 5.19% of net assets. The percentage calculations exclude impaired investments in companies with a nominal or $nil carrying value (if any).
10 Investment income on OETF portfolio investments
During the years ended March 31, 2013 and 2012, the Corporation recognized $1,129,962 and $nil, respectively, of accrued interest income on certain OETF portfolio investments on the exchange of existing debt instruments into new debt instruments with revised terms or conversion of existing debt instruments into equity shares. The accrued interest realized was reinvested into the new securities of the respective OETF portfolio companies as part of the exchange or conversion and is reflected in the cost basis of these securities.
11 Impairment of OETF portfolio investments
For the years ended March 31, 2013 and 2012, impairment charges of $2,670,000 and $5,643,117, respectively, in OETF portfolio investments were identified by management and were recognized in the statements of operations and changes in accumulated operating surplus.
12 Accounts payable
The Corporation and MRI carry out their respective operations on a shared-cost basis. The Corporation reimburses MRI for certain expenses incurred on its behalf. These expenses may include but are not limited to staff salaries, benefits, information technology and rent allocations per staff member, external legal services, website development, French language translation, and other services.
Recognition and measurement of any reimbursement is subject to annual reconciliation between the Corporation and MRI, and approval of the extent and scope of MRI services to be provided. For each fiscal year ending March 31, the Corporation will seek certification from the MRI that any further potential financial liability with respect to eligible expenses incurred on behalf of the Corporation is fully satisfied without further recourse. Any financial liability to MRI with respect to reimbursements of eligible expenses incurred prior to March 31, 2013 has been extinguished.
The Corporation accrues eligible expenses reimbursable to MRI under accounts payable based on estimates provided by MRI that can be independently verified by the Corporation. Reimbursement payable in arrears as at March 31, 2013 amounted to $65,587 (2012 - $645,921).
The remaining balance as at March 31, 2013 in the amount of $135,788 represents payables in arrears to miscellaneous service providers (2012 - $146,827).
PUBLIC ACCOUNTS, 2012-2013 1-47
Ontario Capital Growth Corporation Notes for Financial Statements As at March 31, 2013 and 2012 ___________________________________________________________
13 Province of Ontario - a new Ontario venture capital fund
Effective March 27, 2013, MRI entered into the Ontario VC Fund Transfer Payment Agreement (the TPA) with OCGC to invest into a new Ontario venture capital fund. The new fund has a targeted $300 million close with capital commitments from the Government of Ontario, Government of Canada and the private sector.
Ontario has committed to provide funding up to $50 million to OCGC to launch the new fund pursuant to the terms of the TPA.
1-48 PUBLIC ACCOUNTS, 2012-2013
Ontario Clean Water Agency / 2012 Annual Report 23
information presented in this annual report. The financial statements have been prepared by management
in accordance with Canadian public sector accounting standards.
has a sound set of internal financial controls and procedures that balance benefits and costs. Management
and management practices to provide reasonable assurance of the reliability of financial information in
accordance with the bylaws of the Agency. Internal audits are conducted to assess management systems
auditor’s report and recommend them to the Minister of the Environment for approval.
and opinion.
Management’s Responsibility for Financial Information
PUBLIC ACCOUNTS, 2012-2013 1-49
Ontario Clean Water Agency / 2011 Annual Report28
Toronto, OntarioMarch 28, 2013
Jim McCarter, FCAAuditor GeneralLicensed Public Accountant
Office of the Auditor General of OntarioBureau du vérificateur général de l’Ontario
Independent Auditor’s Report
To the Ontario Clean Water Agency,the Minister of the Environment,and to the Minister of Finance
������������������� ��������������������������� ����������� �������������������������� ����� the balance sheet as at December 31, 2012, and the statements of operations and changes in net assets, and ����� � ��� � �� ���� ����� ����� ��� �� �������� �� ��������� ��� ������ � ����� ��� ����� �������� ���information.
Management’s Responsibility for the Financial Statements
!���������� �� ���� ��"��� � �� ���� �������� �� ��� ���� ��������� �� �� ������ �������� ����������� ����� �������������������"������� ����� ������������������� ���������������� ��� ������������������������� �� ���������� � � ���"��� ���� �������� �� �� �������� ����������� ����� ���� ����� �� �� ��������������������������������� ������ ����� �#
Auditor’s Responsibility
!������ ��"������� ������������ �� �� ���������������������������"���� ��������#���� �������� ���� ����� ������������������������������������������������#�$� �������������%���� ������ � ����� ���� ������� ��%��������� ��� ����� ��� ���� ��� ���� ���� � � "���� ���� ��"��� ���������� �" ��������������������������������������������� ���������������������#
An audit involves performing procedures to obtain audit evidence about the amounts and disclosures in the ������������������#�$����� �������������������� ��������� �&��'������������������������������ � ������(�� ���������������������� �������������������������������������� ������ ����� �#������(����� �� ��(� ������������� ���� ��� �� � ������ �������� � ��� �� ��������� � � ���� �����&�� �������� �� ��� ��� ��������� �� �� ���� �������� ����������� �� ���� � � ����� ���� �� ������� ����� ���� ���� ������ �� ������������������"���� ��� ���������� ��� ��������������� �� �� ������������������� �����������&��������� control. An audit also includes evaluating the appropriateness of accounting policies used and the ���� ��"������� ����� �������������������"��������������������������������������� ���������������� �� ������������������������#
��"��������������������������������� "����������������������� ������� ��� �����"����� ���������opinion.
Opinion
������ �� ������������������������������������������������������������������������������ �� �� ����� Ontario Clean Water Agency as at December 31, 2012, and the results of its operations, changes in its net �������� ��� ��� ����� � ��� � �� ���� ����� ����� ���� �� ��� ������ ������� ��"��� ���� �� ��� ����� standards.
Box 105, 15th Floor20 Dundas Street West
Toronto, OntarioM5G 2C2
416-327-2381fax 416-326-3812
B.P. 105, 15e étage20, rue Dundas ouest
Toronto (Ontario)M5G 2C2
416-327-2381télécopieur 416-326-3812
www.auditor.on.ca
1-50 PUBLIC ACCOUNTS, 2012-2013
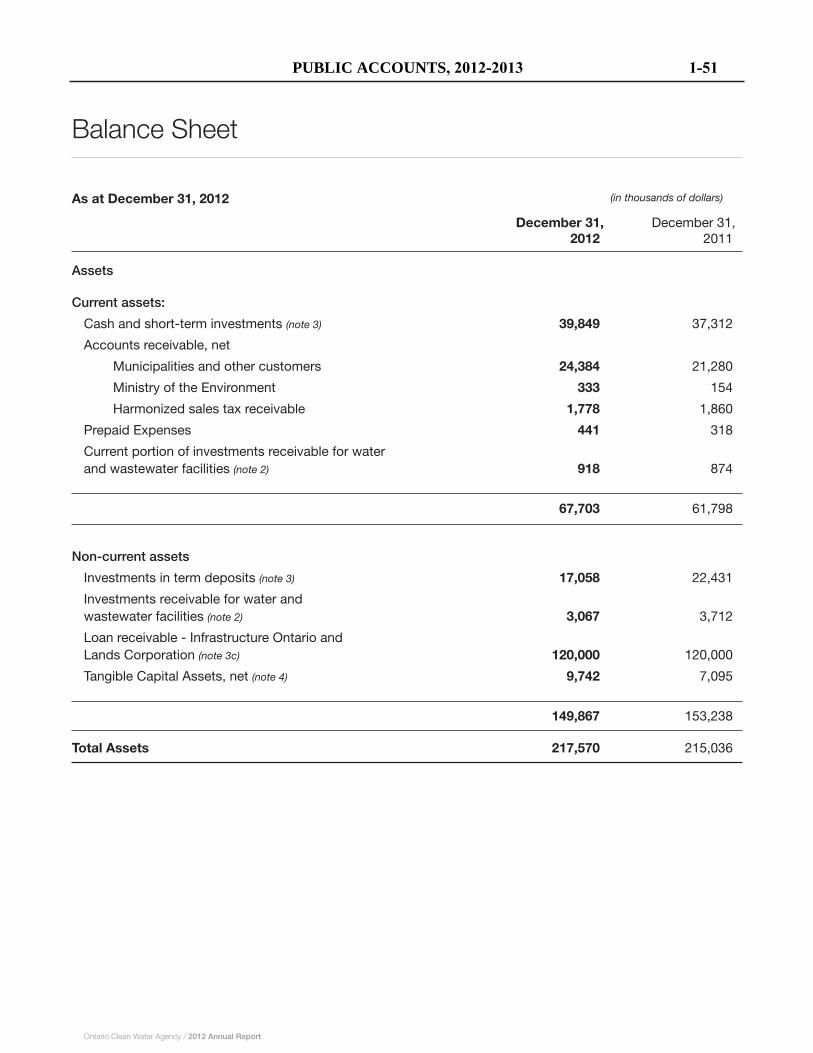
Balance Sheet
As at December 31, 2012
December 31, December 31, 2012 2011
Assets
Current assets:
Cash and short-term investments (note 3) 39,849 37,312
Accounts receivable, net
Municipalities and other customers 24,384 21,280
Ministry of the Environment 333 154
Harmonized sales tax receivable 1,778 1,860
Prepaid Expenses 441 318
Current portion of investments receivable for water and wastewater facilities (note 2) 918 874
67,703 61,798
Non-current assets
Investments in term deposits (note 3) 17,058 22,431
Investments receivable for water and wastewater facilities (note 2) 3,067 3,712
Loan receivable - Infrastructure Ontario and Lands Corporation (note 3c) 120,000 120,000
Tangible Capital Assets, net (note 4) 9,742 7,095
149,867 153,238
Total Assets 217,570 215,036
(in thousands of dollars)
26 Ontario Clean Water Agency / 2012 Annual Report
PUBLIC ACCOUNTS, 2012-2013 1-51
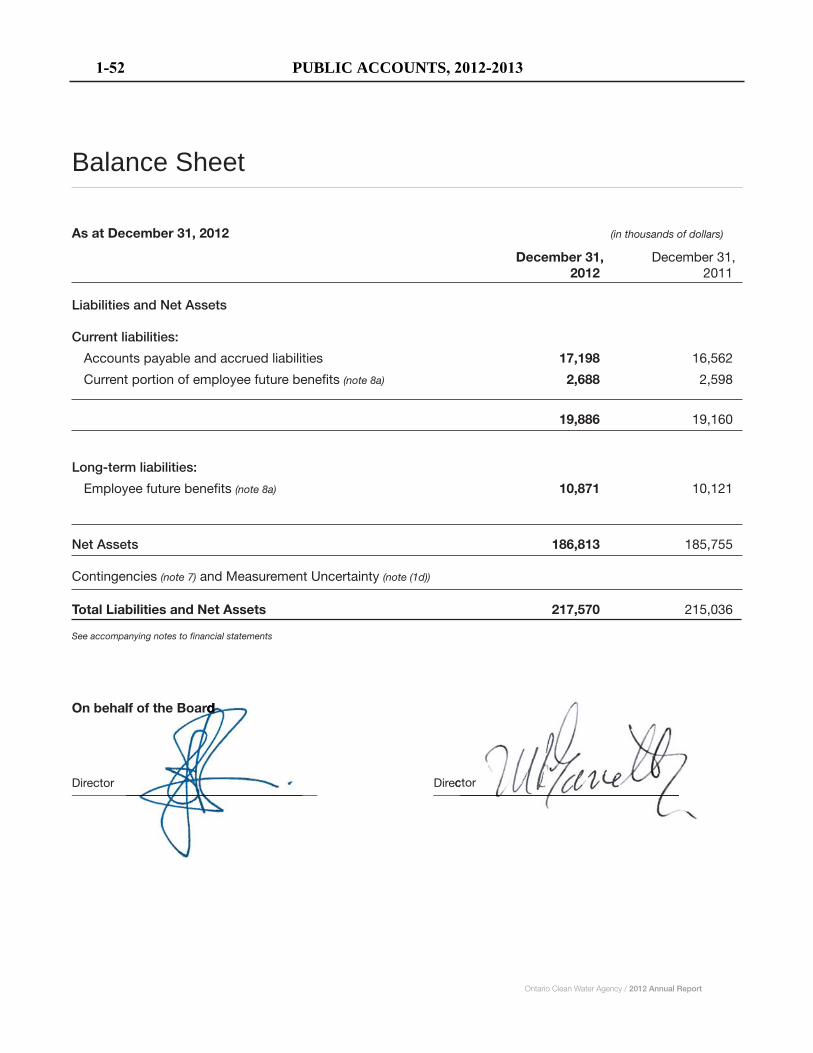
Ontario Clean Water Agency / 2012 Annual Report 27
Balance Sheet
As at December 31, 2012
December 31, December 31, 2012 2011
Liabilities and Net Assets
Current liabilities:
Accounts payable and accrued liabilities 17,198 16,562
Current portion of employee future benefits (note 8a) 2,688 2,598
19,886 19,160
Long-term liabilities:
Employee future benefits (note 8a) 10,871 10,121
Net Assets 186,813 185,755
Contingencies (note 7) and Measurement Uncertainty (note (1d))
Total Liabilities and Net Assets 217,570 215,036
See accompanying notes to financial statements
On behalf of the Board
Director Director
(in thousands of dollars)
lf of the Boarddd
ctor
1-52 PUBLIC ACCOUNTS, 2012-2013

28 Ontario Clean Water Agency / 2012 Annual Report
For the year ended December 31, 2012
December 31, December 31, 2012 2011
Utility Operations Revenues:
Utility operations 147,217 137,416
Fees 2,828 2,371
Total Operating Revenues 150,045 139,787
Operating Expenses:
Salaries and benefits (note 8a and note 8b) 67,544 62,976
Other operating expenses 81,410 76,195
Amortization of tangible capital assets 2,878 2,278
Total Operating Expenses 151,832 141,449
Deficiency of revenue over expenses – Utility Operations (1,787) (1,662)
Interest from investments and loans receivable 2,845 2,777
Excess of revenue over expenses 1,058 1,115
Net Assets, opening balance 185,755 184,318
Adjustments to Net Assets (note 6) - 322
Net Assets, ending balance 186,813 185,755
See accompanying notes to financial statements
(in thousands of dollars)
PUBLIC ACCOUNTS, 2012-2013 1-53
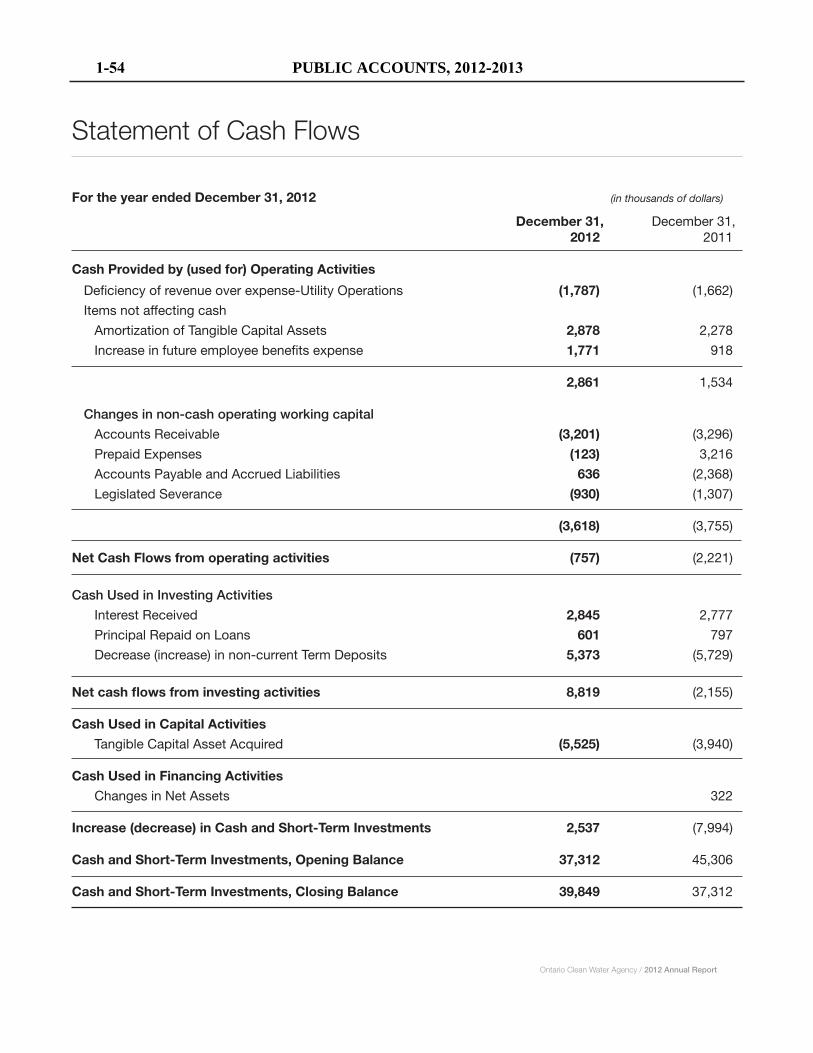
Statement of Cash Flows
For the year ended December 31, 2012
December 31, December 31, 2012 2011
Cash Provided by (used for) Operating Activities
Deficiency of revenue over expense-Utility Operations (1,787) (1,662)
Items not affecting cash
Amortization of Tangible Capital Assets 2,878 2,278
Increase in future employee benefits expense 1,771 918
2,861 1,534
Changes in non-cash operating working capital
Accounts Receivable (3,201) (3,296)
Prepaid Expenses (123) 3,216
Accounts Payable and Accrued Liabilities 636 (2,368)
Legislated Severance (930) (1,307)
(3,618) (3,755)
Net Cash Flows from operating activities (757) (2,221)
Cash Used in Investing Activities
Interest Received 2,845 2,777
Principal Repaid on Loans 601 797
Decrease (increase) in non-current Term Deposits 5,373 (5,729)
Net cash flows from investing activities 8,819 (2,155)
Cash Used in Capital Activities
Tangible Capital Asset Acquired (5,525) (3,940)
Cash Used in Financing Activities
Changes in Net Assets 322
Increase (decrease) in Cash and Short-Term Investments 2,537 (7,994)
Cash and Short-Term Investments, Opening Balance 37,312 45,306
Cash and Short-Term Investments, Closing Balance 39,849 37,312
(in thousands of dollars)
Ontario Clean Water Agency / 2012 Annual Report 29
1-54 PUBLIC ACCOUNTS, 2012-2013
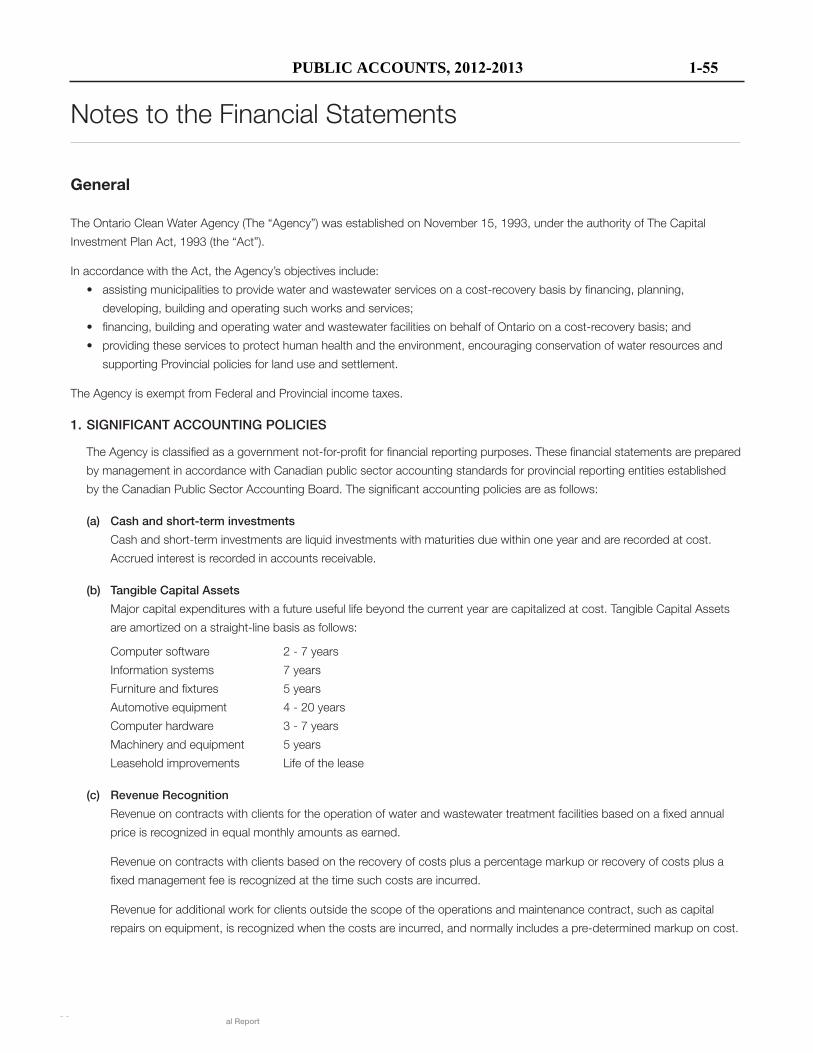
General
supporting Provincial policies for land use and settlement.
1. SIGNIFICANT ACCOUNTING POLICIES
The Agency is classified as a government not-for-profit for financial reporting purposes. These financial statements are prepared
by management in accordance with Canadian public sector accounting standards for provincial reporting entities established
(a) Cash and short-term investments
Accrued interest is recorded in accounts receivable.
(b) Tangible Capital Assets
Information systems 7 years
Leasehold improvements Life of the lease
(c) Revenue Recognition
30 Ontario Clean Water Agency / 2012 Annual Report
PUBLIC ACCOUNTS, 2012-2013 1-55
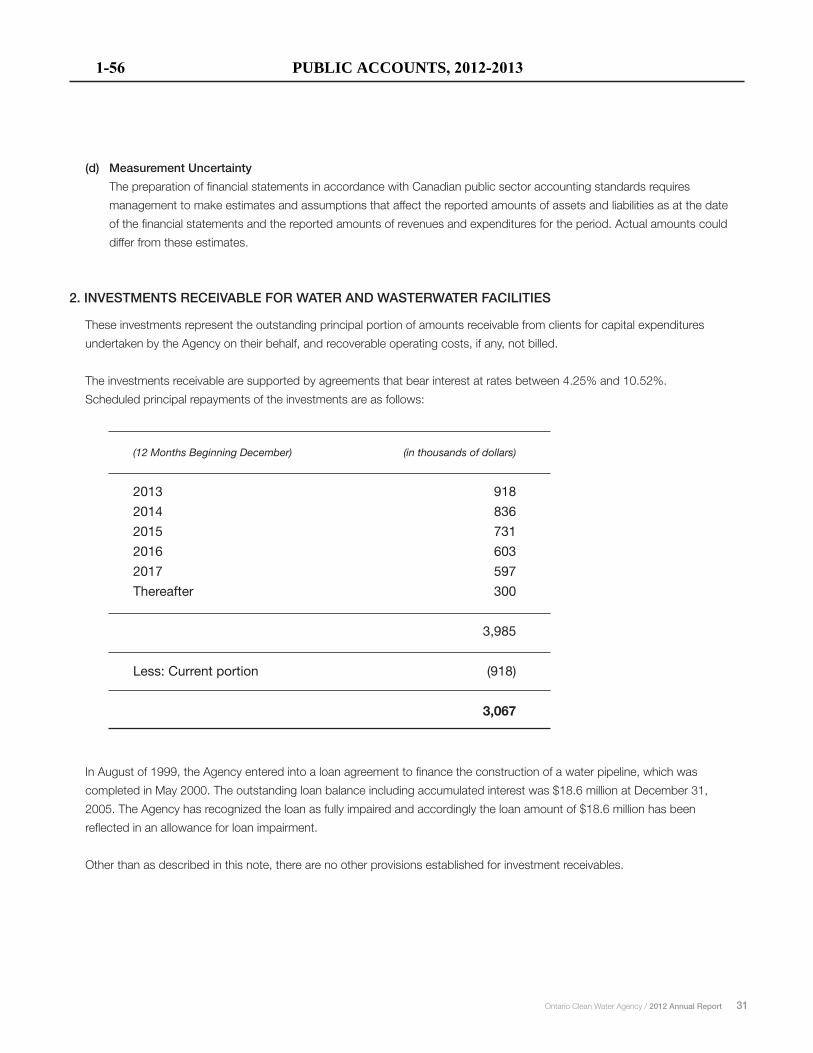
(d) Measurement Uncertainty
The preparation of financial statements in accordance with Canadian public sector accounting standards requires
management to make estimates and assumptions that affect the reported amounts of assets and liabilities as at the date
of the financial statements and the reported amounts of revenues and expenditures for the period. Actual amounts could
differ from these estimates.
2. INVESTMENTS RECEIVABLE FOR WATER AND WASTERWATER FACILITIES
These investments represent the outstanding principal portion of amounts receivable from clients for capital expenditures
undertaken by the Agency on their behalf, and recoverable operating costs, if any, not billed.
The investments receivable are supported by agreements that bear interest at rates between 4.25% and 10.52%.
Scheduled principal repayments of the investments are as follows:
In August of 1999, the Agency entered into a loan agreement to finance the construction of a water pipeline, which was
completed in May 2000. The outstanding loan balance including accumulated interest was $18.6 million at December 31,
2005. The Agency has recognized the loan as fully impaired and accordingly the loan amount of $18.6 million has been
reflected in an allowance for loan impairment.
Other than as described in this note, there are no other provisions established for investment receivables.
Ontario Clean Water Agency / 2012 Annual Report 31
(12 Months Beginning December) (in thousands of dollars)
2013 918
2014 836
2015 731
2016 603
2017 597
Thereafter 300
3,985
Less: Current portion (918)
3,067
1-56 PUBLIC ACCOUNTS, 2012-2013
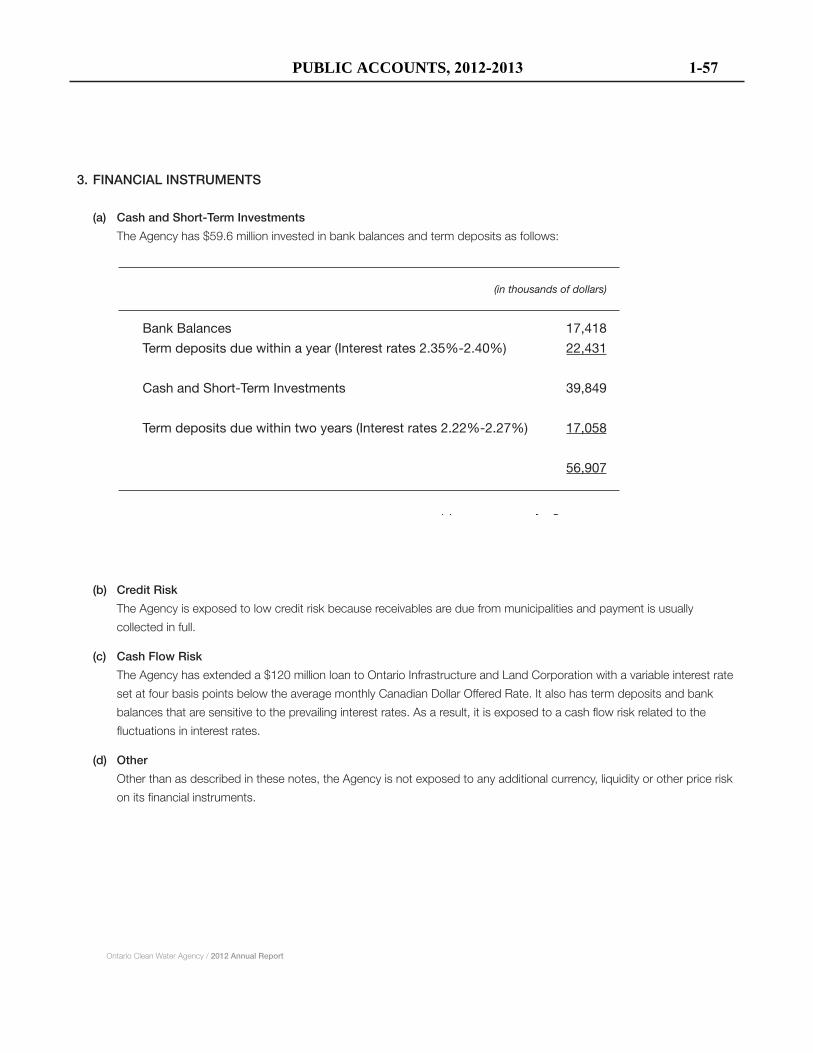
3. FINANCIAL INSTRUMENTS
(a) Cash and Short-Term Investments
The Agency has $59.6 million invested in bank balances and term deposits as follows:
(b) Credit Risk
The Agency is exposed to low credit risk because receivables are due from municipalities and payment is usually
collected in full.
(c) Cash Flow Risk
The Agency has extended a $120 million loan to Ontario Infrastructure and Land Corporation with a variable interest rate
set at four basis points below the average monthly Canadian Dollar Offered Rate. It also has term deposits and bank
balances that are sensitive to the prevailing interest rates. As a result, it is exposed to a cash flow risk related to the
fluctuations in interest rates.
(d) Other
Other than as described in these notes, the Agency is not exposed to any additional currency, liquidity or other price risk
on its financial instruments.
(in thousands of dollars)
Bank Balances 17,418
Term deposits due within a year (Interest rates 2.35%-2.40%) 22,431
Cash and Short-Term Investments 39,849
Term deposits due within two years (Interest rates 2.22%-2.27%) 17,058
56,907
The fair value of cash and short-term investment approximate carrying value.
32 Ontario Clean Water Agency / 2012 Annual Report
PUBLIC ACCOUNTS, 2012-2013 1-57
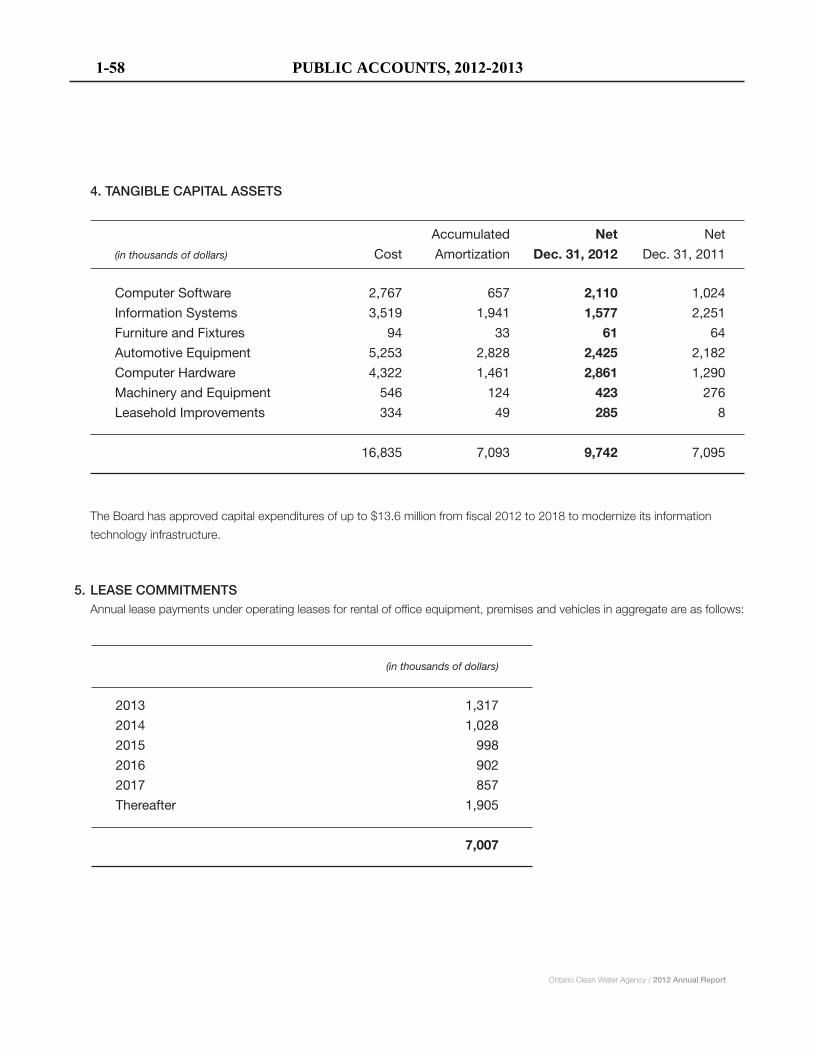
4. TANGIBLE CAPITAL ASSETS
The Board has approved capital expenditures of up to $13.6 million from fiscal 2012 to 2018 to modernize its information
technology infrastructure.
5. LEASE COMMITMENTS Annual lease payments under operating leases for rental of office equipment, premises and vehicles in aggregate are as follows:
Computer Software 2,767 657 2,110 1,024
Information Systems 3,519 1,941 1,577 2,251
Furniture and Fixtures 94 33 61 64
Automotive Equipment 5,253 2,828 2,425 2,182
Computer Hardware 4,322 1,461 2,861 1,290
Machinery and Equipment 546 124 423 276
Leasehold Improvements 334 49 285 8
16,835 7,093 9,742 7,095
Accumulated Net Net
(in thousands of dollars) Cost Amortization Dec. 31, 2012 Dec. 31, 2011
(in thousands of dollars)
2013 1,317
2014 1,028
2015 998
2016 902
2017 857
Thereafter 1,905
7,007
Ontario Clean Water Agency / 2012 Annual Report 33
1-58 PUBLIC ACCOUNTS, 2012-2013
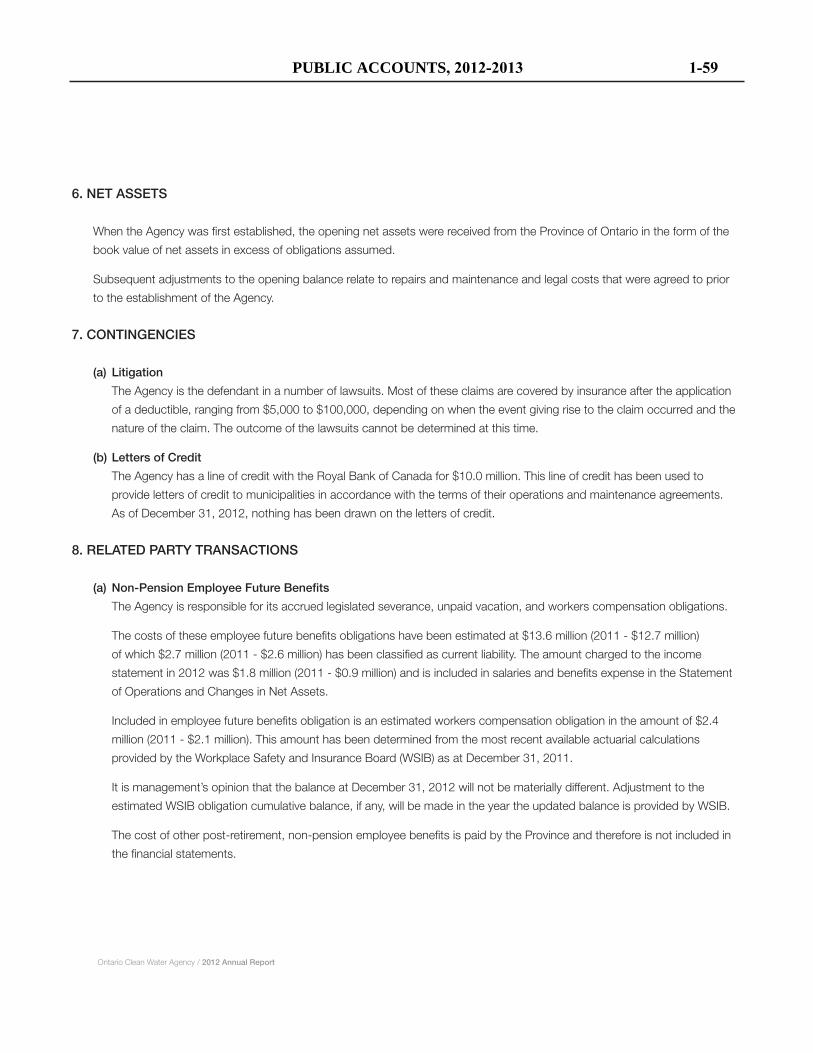
34 Ontario Clean Water Agency / 2012 Annual Report
6. NET ASSETS
When the Agency was first established, the opening net assets were received from the Province of Ontario in the form of the
book value of net assets in excess of obligations assumed.
Subsequent adjustments to the opening balance relate to repairs and maintenance and legal costs that were agreed to prior
to the establishment of the Agency.
7. CONTINGENCIES
(a) Litigation
The Agency is the defendant in a number of lawsuits. Most of these claims are covered by insurance after the application
of a deductible, ranging from $5,000 to $100,000, depending on when the event giving rise to the claim occurred and the
nature of the claim. The outcome of the lawsuits cannot be determined at this time.
(b) Letters of Credit
The Agency has a line of credit with the Royal Bank of Canada for $10.0 million. This line of credit has been used to
provide letters of credit to municipalities in accordance with the terms of their operations and maintenance agreements.
As of December 31, 2012, nothing has been drawn on the letters of credit.
8. RELATED PARTY TRANSACTIONS
(a) Non-Pension Employee Future Benefits
The Agency is responsible for its accrued legislated severance, unpaid vacation, and workers compensation obligations.
The costs of these employee future benefits obligations have been estimated at $13.6 million (2011 - $12.7 million)
of which $2.7 million (2011 - $2.6 million) has been classified as current liability. The amount charged to the income
statement in 2012 was $1.8 million (2011 - $0.9 million) and is included in salaries and benefits expense in the Statement
of Operations and Changes in Net Assets.
Included in employee future benefits obligation is an estimated workers compensation obligation in the amount of $2.4
million (2011 - $2.1 million). This amount has been determined from the most recent available actuarial calculations
provided by the Workplace Safety and Insurance Board (WSIB) as at December 31, 2011.
It is management’s opinion that the balance at December 31, 2012 will not be materially different. Adjustment to the
estimated WSIB obligation cumulative balance, if any, will be made in the year the updated balance is provided by WSIB.
The cost of other post-retirement, non-pension employee benefits is paid by the Province and therefore is not included in
the financial statements.
PUBLIC ACCOUNTS, 2012-2013 1-59
Ontario Clean Water Agency / 2012 Annual Report 35
(b) Pension Plan
The Agency’s full-time employees participate in the Public Service Pension Fund (PSPF) and the Ontario Public Service
Employees’ Union Pension Fund (OPSEU-PF), which are defined benefit pension plans for employees of the Province and
many provincial agencies. The Province of Ontario, which is the sole sponsor of the PSPF and a joint sponsor of the OPSEU-
PF, determines the Agency’s annual payments of the funds. As the sponsors are responsible for ensuring that the pension
funds are financially viable, any surpluses or unfunded liabilities arising from statutory actuarial funding valuations are not assets
or obligations of the agency. The Agency’s annual payments of $4.0 million (2011 - $3.5 million), are included in salaries and
benefits in the Statement of Operations and Changes in Net Assets.
(c) Other
As a result of the relationship of the Agency with the Province, the following related party transactions exist:
(i) The Agency received revenue of $2.5 million (2011 - $2.6 million) from the Ontario Infrastructure and Lands corporation for
water and wastewater treatment services OCWA has provided. The services were provided at competitive rates similar to
those of other OCWA clients.
(ii) The Agency received revenue of $2.8 million (2011 - $2.7 million) from the Ministry of the Environment for water and
wastewater treatment services OCWA has provided. The services were provided at competitive rates similar to those of
other OCWA clients. In addition, the Agency received $0.3 million (2011 - $0.3 million) for the Emergency Preparedness
Funding.
(iii) The Agency received revenue of $0.5 million (2011 - $0.6 million) from the Ministry of the Northern Development and Mines
for water and wastewater treatment services OCWA has provided. The services were provided at competitive rates similar
to those of other OCWA clients.
(iv) The Agency has a $120 million loan receivable with Ontario Infrastructure and Land Corporation, as described in note 3 (c).
(v) The Agency relies on the Province to process its payroll and administer its benefits, and to obtain some internal audit and
legal services. The Province absorbs some of these administrative costs.
(vi) The Agency has a $1.4 million (2011 - $1.0 million) accounts payable to the Ministry of the Environment for rent proceeds
it collects for a property, net of realty taxes paid, managed on behalf of the Ministry.
1-60 PUBLIC ACCOUNTS, 2012-2013
Province of Ontario Council for the Arts Management’s Responsibility for Financial Information The accompanying financial statements of the Province of Ontario Council for the Arts (the OAC) are the responsibility of management and have been prepared in accordance with Canadian public sector accounting standards. Management maintains a system of internal controls designed to provide reasonable assurance that financial information is accurate and that assets are protected. The Board of Directors ensures that management fulfils its responsibilities for financial reporting and internal control. The Finance and Audit Committee and the Board of Directors meet regularly to oversee the financial activities of the OAC, and annually to review the audited financial statements and the external auditor’s report thereon. The financial statements have been audited by the Office of the Auditor General of Ontario, whose responsibility is to express an opinion on the financial statements. The Auditor’s Report that appears as part of the financial statements outlines the scope of the Auditor’s examination and opinion. On behalf of management:
Peter Caldwell Director and CEO
Jim Grace, CPA, CA, CMA Director of Finance and Administration June 26, 2013
PUBLIC ACCOUNTS, 2012-2013 1-61
II.
Office of the Auditor General of OntarioBureau du vériflcateur general de l’Ontario
IndependentAuditor’s Report
To the Province of Ontario Council for the Arts andto the Minister of Tourism and Culture and Sport
I have audited the accompanying financial statements of the Province of Ontario Council for the Arts(operating as Ontario Arts Council), which comprise the statement of financial position as at March 31,2013 and the statements of operations and changes in fund balances, re-measurment gains and losses andcash flows for the year then ended, and a summary of significant accounting policies and otherexplanatory information.
Management’s Responsibility for thc Financial Statements
Management is responsible for the preparation and fair presentation of these financial statements inaccordance with Canadian public sector accounting standards, and for such internal control asmanagement determines is necessary to enable the preparation of financial statements that are free frommaterial misstatement, whether due to fraud or error.
Auditor’s Responsibility
My responsibility is to express an opinion on these financial statements based on my audit. I conductedmy audit in accordance with Canadian generally accepted auditing standards. Those standards requirethat I comply with ethical requirements and plan and perform the audit to obtain reasonable assuranceabout whether the financial statements are free from material misstatement.
An audit involves performing procedures to obtain audit evidence about the amounts and disclosures inthe financial statements. The procedures selected depend on the auditor’s judgment, including theassessment of the risks of material misstatement of the financial statements, whether due to fraud orerror. In making those risk assessments, the auditor considers internal control relevant to the entity’spreparation and fair presentation of the financial statements in order to design audit procedures that areappropriate in the circumstances, but not for the purpose of expressing an opinion on the effectiveness ofthe entity’s internal control. An audit also includes evaluating the appropriateness of accounting policiesused and the reasonableness of accounting estimates made by management, as well as evaluating theoverall presentation of the financial statements.
I believe that the audit evidence I have obtained is sufficient and appropriate to provide a basis for myopinion.
Opinion
Box 105, 15th Floor In my opinion, the financial statements present fairly, in all material respects, the financial position of20 Dundas Street West the Province of Ontario Council for the Arts (operating as Ontario Arts Council) as at March 31, 2013,
oront~n ~ and the results of its operations, its changes in fund balances, its re-measurment gains and losses and its
416-327-2381 cash flows for the year then ended in accordance with Canadian public sector accounting standards.fax 416-326-3812
B.P. 105, lseétage20, rue Dundas ouest
Toronto (Ontario)M5G 2C2 Toronto, Ontario Susan Klein, CPA, CA, LPA
416-327-2381 June 26, 2013 Acting Deputy Auditor Generaltelecopieur 416-326-3812
www.auditor.on ca
1-62 PUBLIC ACCOUNTS, 2012-2013
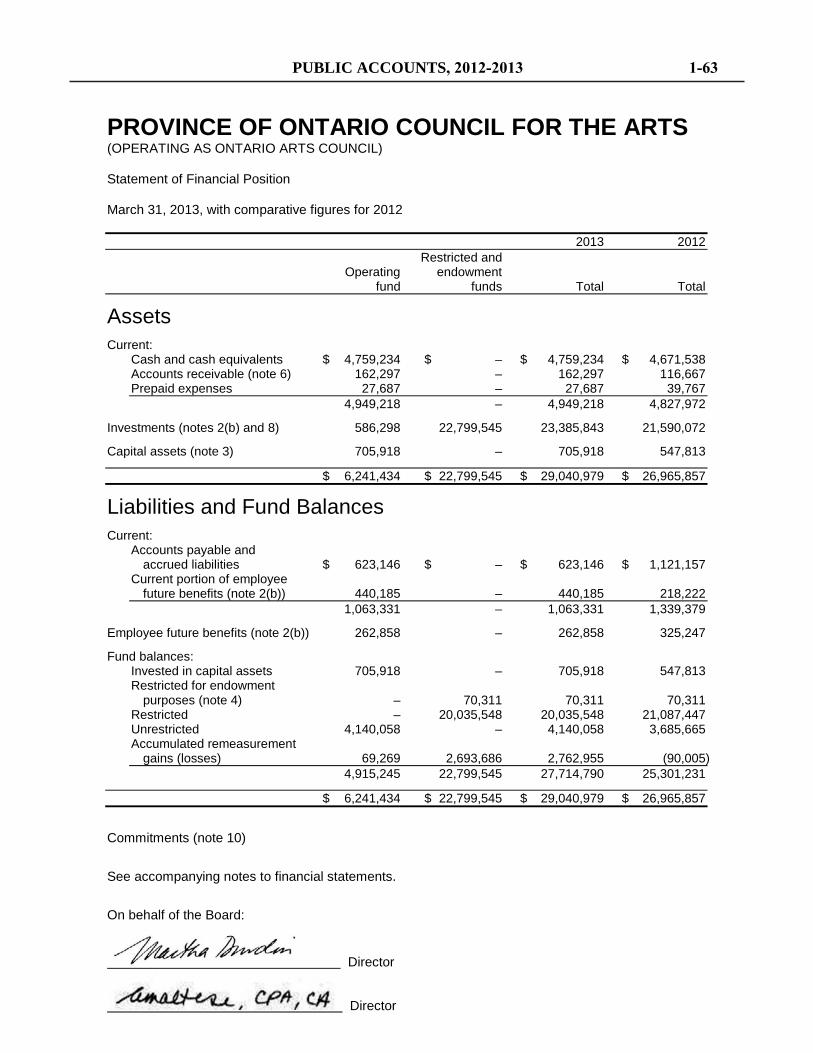
PROVINCE OF ONTARIO COUNCIL FOR THE ARTS (OPERATING AS ONTARIO ARTS COUNCIL) Statement of Financial Position March 31, 2013, with comparative figures for 2012 2013 2012 Restricted and Operating endowment fund funds Total Total
Assets
Current: Cash and cash equivalents $ 4,759,234 $ – $ 4,759,234 $ 4,671,538 Accounts receivable (note 6) 162,297 – 162,297 116,667 Prepaid expenses 27,687 – 27,687 39,767 4,949,218 – 4,949,218 4,827,972
Investments (notes 2(b) and 8) 586,298 22,799,545 23,385,843 21,590,072
Capital assets (note 3) 705,918 – 705,918 547,813
$ 6,241,434 $ 22,799,545 $ 29,040,979 $ 26,965,857
Liabilities and Fund Balances
Current: Accounts payable and
accrued liabilities $ 623,146 $ – $ 623,146 $ 1,121,157 Current portion of employee
future benefits (note 2(b)) 440,185 – 440,185 218,222 1,063,331 – 1,063,331 1,339,379
Employee future benefits (note 2(b)) 262,858 – 262,858 325,247
Fund balances: Invested in capital assets 705,918 – 705,918 547,813 Restricted for endowment
purposes (note 4) – 70,311 70,311 70,311 Restricted – 20,035,548 20,035,548 21,087,447 Unrestricted 4,140,058 – 4,140,058 3,685,665 Accumulated remeasurement
gains (losses) 69,269 2,693,686 2,762,955 (90,005) 4,915,245 22,799,545 27,714,790 25,301,231
$ 6,241,434 $ 22,799,545 $ 29,040,979 $ 26,965,857
Commitments (note 10)
See accompanying notes to financial statements.
On behalf of the Board:
Director
Director
PUBLIC ACCOUNTS, 2012-2013 1-63
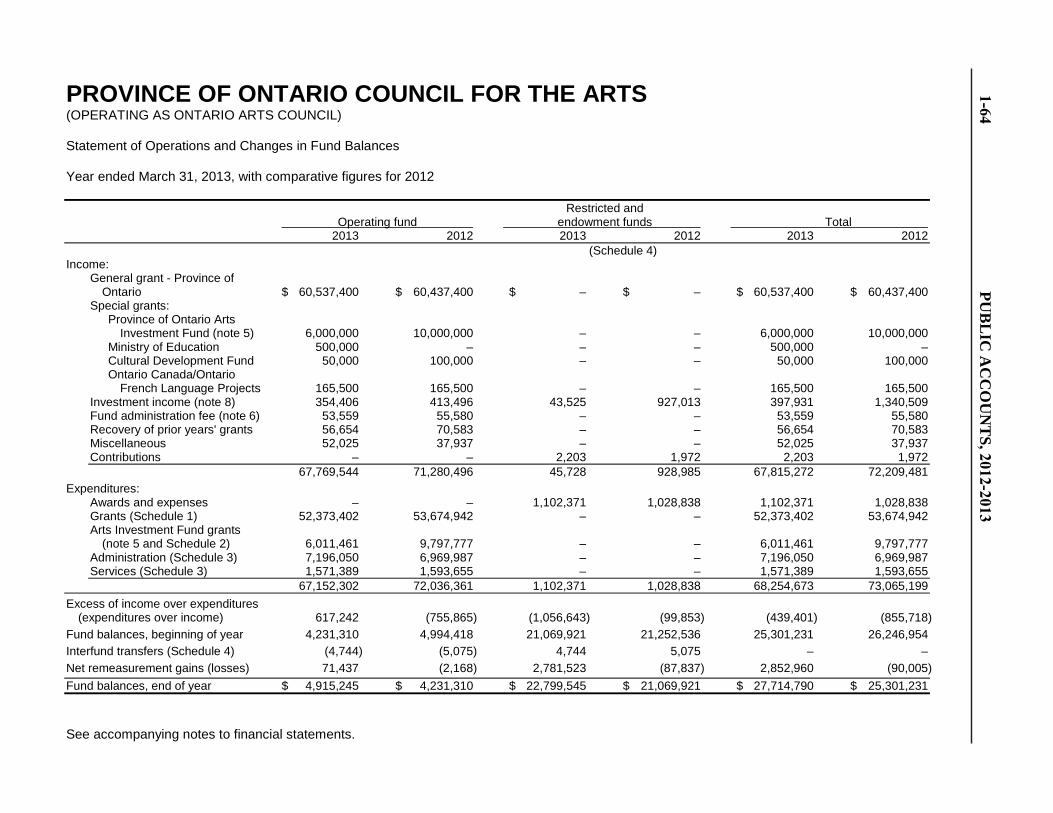
PROVINCE OF ONTARIO COUNCIL FOR THE ARTS (OPERATING AS ONTARIO ARTS COUNCIL) Statement of Operations and Changes in Fund Balances Year ended March 31, 2013, with comparative figures for 2012 Restricted and Operating fund endowment funds Total 2013 2012 2013 2012 2013 2012 (Schedule 4) Income:
General grant - Province of Ontario $ 60,537,400 $ 60,437,400 $ – $ – $ 60,537,400 $ 60,437,400
Special grants: Province of Ontario Arts
Investment Fund (note 5) 6,000,000 10,000,000 – – 6,000,000 10,000,000 Ministry of Education 500,000 – – – 500,000 – Cultural Development Fund 50,000 100,000 – – 50,000 100,000 Ontario Canada/Ontario
French Language Projects 165,500 165,500 – – 165,500 165,500 Investment income (note 8) 354,406 413,496 43,525 927,013 397,931 1,340,509 Fund administration fee (note 6) 53,559 55,580 – – 53,559 55,580 Recovery of prior years' grants 56,654 70,583 – – 56,654 70,583 Miscellaneous 52,025 37,937 – – 52,025 37,937 Contributions – – 2,203 1,972 2,203 1,972 67,769,544 71,280,496 45,728 928,985 67,815,272 72,209,481
Expenditures: Awards and expenses – – 1,102,371 1,028,838 1,102,371 1,028,838 Grants (Schedule 1) 52,373,402 53,674,942 – – 52,373,402 53,674,942 Arts Investment Fund grants
(note 5 and Schedule 2) 6,011,461 9,797,777 – – 6,011,461 9,797,777 Administration (Schedule 3) 7,196,050 6,969,987 – – 7,196,050 6,969,987 Services (Schedule 3) 1,571,389 1,593,655 – – 1,571,389 1,593,655 67,152,302 72,036,361 1,102,371 1,028,838 68,254,673 73,065,199
Excess of income over expenditures (expenditures over income) 617,242 (755,865) (1,056,643) (99,853) (439,401) (855,718)
Fund balances, beginning of year 4,231,310 4,994,418 21,069,921 21,252,536 25,301,231 26,246,954
Interfund transfers (Schedule 4) (4,744) (5,075) 4,744 5,075 – –
Net remeasurement gains (losses) 71,437 (2,168) 2,781,523 (87,837) 2,852,960 (90,005)
Fund balances, end of year $ 4,915,245 $ 4,231,310 $ 22,799,545 $ 21,069,921 $ 27,714,790 $ 25,301,231
See accompanying notes to financial statements.
1-64PU
BLIC ACCOUNTS, 2012-2013

PROVINCE OF ONTARIO COUNCIL FOR THE ARTS (OPERATING AS ONTARIO ARTS COUNCIL) Statement of Remeasurement Gains and Losses Year ended March 31, 2013, with comparative figures for 2012 2013 2012 Accumulated remeasurement gains (losses), beginning of year $ (90,005) $ – Unrealized gains (losses) attributed to:
Portfolio investments 2,137,132 (95,214) Amount reclassified to the statements of operations:
Portfolio investments 715,828 5,209 Changes in net remeasurement gains (losses) for the year 2,852,960 (90,005) Accumulated remeasurement gains (losses), end of year $ 2,762,955 $ (90,005)
See accompanying notes to financial statements.
PUBLIC ACCOUNTS, 2012-2013 1-65
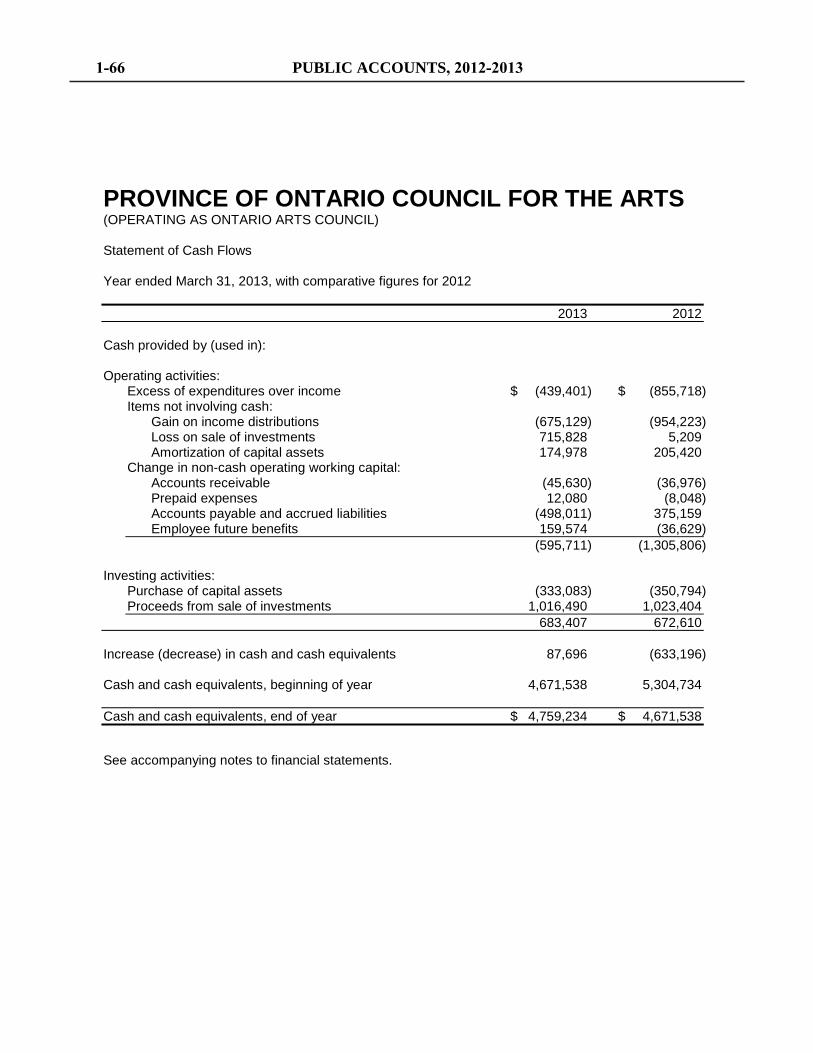
PROVINCE OF ONTARIO COUNCIL FOR THE ARTS (OPERATING AS ONTARIO ARTS COUNCIL) Statement of Cash Flows Year ended March 31, 2013, with comparative figures for 2012 2013 2012 Cash provided by (used in): Operating activities:
Excess of expenditures over income $ (439,401) $ (855,718) Items not involving cash:
Gain on income distributions (675,129) (954,223) Loss on sale of investments 715,828 5,209 Amortization of capital assets 174,978 205,420
Change in non-cash operating working capital: Accounts receivable (45,630) (36,976) Prepaid expenses 12,080 (8,048) Accounts payable and accrued liabilities (498,011) 375,159 Employee future benefits 159,574 (36,629)
(595,711) (1,305,806) Investing activities:
Purchase of capital assets (333,083) (350,794) Proceeds from sale of investments 1,016,490 1,023,404 683,407 672,610
Increase (decrease) in cash and cash equivalents 87,696 (633,196) Cash and cash equivalents, beginning of year 4,671,538 5,304,734 Cash and cash equivalents, end of year $ 4,759,234 $ 4,671,538
See accompanying notes to financial statements.
1-66 PUBLIC ACCOUNTS, 2012-2013
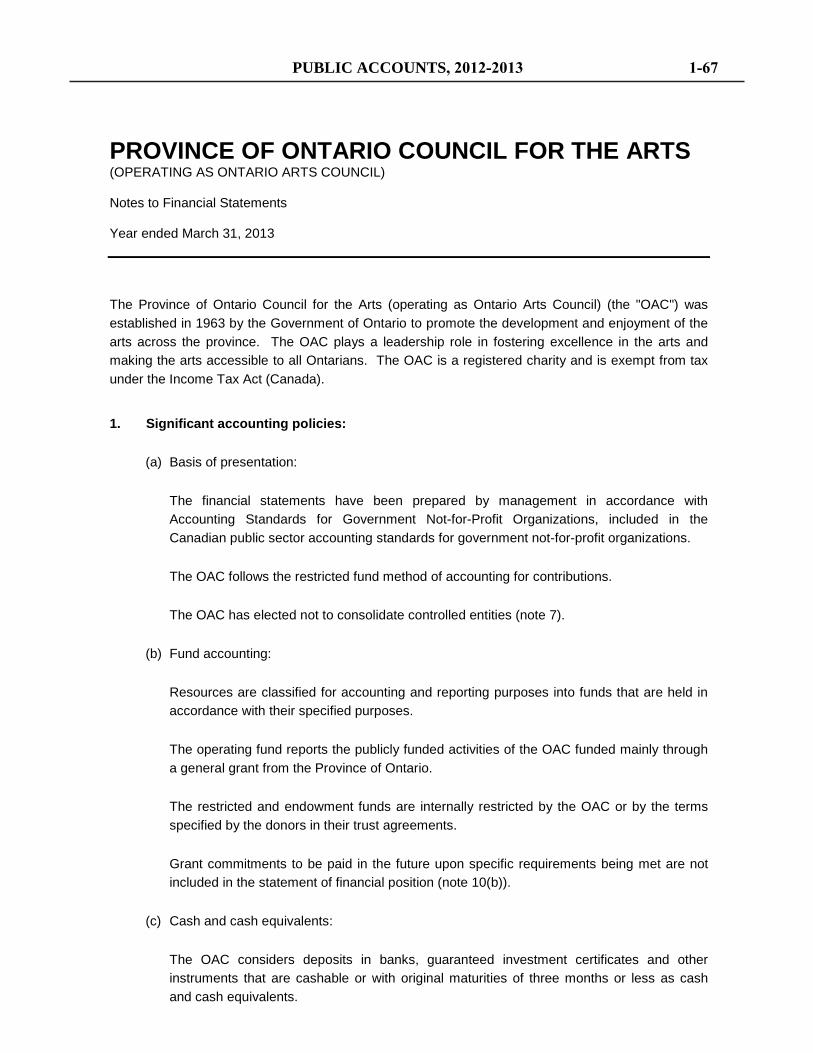
PROVINCE OF ONTARIO COUNCIL FOR THE ARTS (OPERATING AS ONTARIO ARTS COUNCIL) Notes to Financial Statements Year ended March 31, 2013
The Province of Ontario Council for the Arts (operating as Ontario Arts Council) (the "OAC") was established in 1963 by the Government of Ontario to promote the development and enjoyment of the arts across the province. The OAC plays a leadership role in fostering excellence in the arts and making the arts accessible to all Ontarians. The OAC is a registered charity and is exempt from tax under the Income Tax Act (Canada).
1. Significant accounting policies:
(a) Basis of presentation:
The financial statements have been prepared by management in accordance with Accounting Standards for Government Not-for-Profit Organizations, included in the Canadian public sector accounting standards for government not-for-profit organizations.
The OAC follows the restricted fund method of accounting for contributions.
The OAC has elected not to consolidate controlled entities (note 7).
(b) Fund accounting:
Resources are classified for accounting and reporting purposes into funds that are held in accordance with their specified purposes.
The operating fund reports the publicly funded activities of the OAC funded mainly through a general grant from the Province of Ontario.
The restricted and endowment funds are internally restricted by the OAC or by the terms specified by the donors in their trust agreements.
Grant commitments to be paid in the future upon specific requirements being met are not included in the statement of financial position (note 10(b)).
(c) Cash and cash equivalents:
The OAC considers deposits in banks, guaranteed investment certificates and other instruments that are cashable or with original maturities of three months or less as cash and cash equivalents.
PUBLIC ACCOUNTS, 2012-2013 1-67
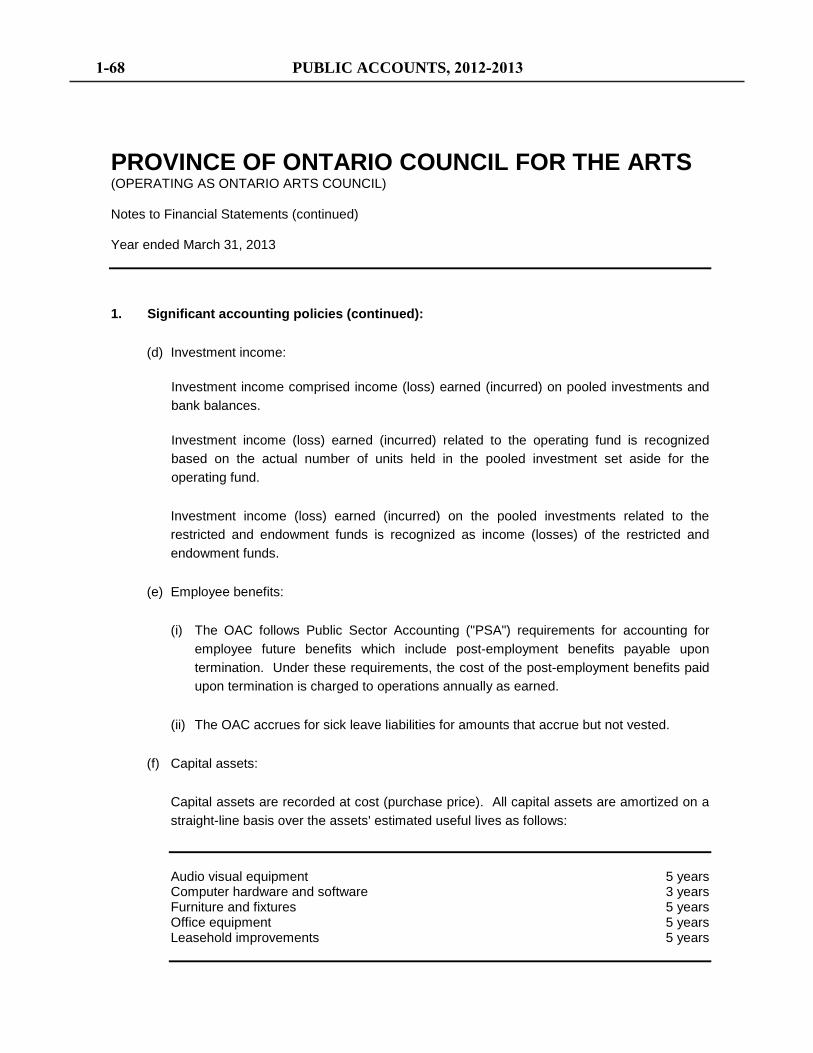
PROVINCE OF ONTARIO COUNCIL FOR THE ARTS (OPERATING AS ONTARIO ARTS COUNCIL) Notes to Financial Statements (continued) Year ended March 31, 2013
1. Significant accounting policies (continued):
(d) Investment income:
Investment income comprised income (loss) earned (incurred) on pooled investments and bank balances.
Investment income (loss) earned (incurred) related to the operating fund is recognized based on the actual number of units held in the pooled investment set aside for the operating fund.
Investment income (loss) earned (incurred) on the pooled investments related to the restricted and endowment funds is recognized as income (losses) of the restricted and endowment funds.
(e) Employee benefits:
(i) The OAC follows Public Sector Accounting ("PSA") requirements for accounting for employee future benefits which include post-employment benefits payable upon termination. Under these requirements, the cost of the post-employment benefits paid upon termination is charged to operations annually as earned.
(ii) The OAC accrues for sick leave liabilities for amounts that accrue but not vested.
(f) Capital assets:
Capital assets are recorded at cost (purchase price). All capital assets are amortized on a straight-line basis over the assets' estimated useful lives as follows:
Audio visual equipment 5 years Computer hardware and software 3 years Furniture and fixtures 5 years Office equipment 5 years Leasehold improvements 5 years
1-68 PUBLIC ACCOUNTS, 2012-2013
PROVINCE OF ONTARIO COUNCIL FOR THE ARTS (OPERATING AS ONTARIO ARTS COUNCIL) Notes to Financial Statements (continued) Year ended March 31, 2013 1. Significant accounting policies (continued):
(g) Financial instruments:
Financial instruments are recorded at fair value on initial recognition. Derivative instruments and equity instruments that are quoted in an active market are reported at fair value. All other financial instruments are subsequently recorded at cost or amortized cost unless management has elected to carry the instruments at fair value. Management has elected to record all investments at fair value as they are managed and evaluated on a fair value basis.
Unrealized changes in fair value are recognized in the statement of remeasurement gains and losses until they are realized, when they are transferred to the statement of operations and changes in fund balances.
Transaction costs incurred on the acquisition of financial instruments measured subsequently at fair value are expensed as incurred. All other financial instruments are adjusted by transaction costs incurred on acquisition and financing costs, which are amortized using the straight-line method.
All financial assets are assessed for impairment on an annual basis. When a decline is determined to be other than temporary, the amount of the loss is reported in the statement of operations and changes in fund balances and any unrealized gain is adjusted through the statement of remeasurement gains and losses.
When the asset is sold, the unrealized gains and losses previously recognized in the statement of remeasurement gains and losses are reversed and recognized in the statement of operations and changes in fund balances.
The standards require an organization to classify fair value measurements using a fair value hierarchy, which includes three levels of information that may be used to measure fair value:
• Level 1 - Unadjusted quoted market prices in active markets for identical assets or liabilities;
• Level 2 - Observable or corroborated inputs, other than Level 1, such as quoted prices for similar assets or liabilities in inactive markets or market data for substantially the full term of the assets or liabilities; and
PUBLIC ACCOUNTS, 2012-2013 1-69
PROVINCE OF ONTARIO COUNCIL FOR THE ARTS (OPERATING AS ONTARIO ARTS COUNCIL) Notes to Financial Statements (continued) Year ended March 31, 2013
1. Significant accounting policies (continued):
• Level 3 - Unobservable inputs that are supported by little or no market activity and that are significant to the fair value of the assets and liabilities.
The fair value of measurements for all of the investments held by OAC are categorized as Level 2.
Derivative financial instruments and portfolio investments in equity instruments, that are quoted on an active market and included on the statement of financial position, are measured at fair value upon inception.
Transaction costs related to financial instruments in the fair value category that are directly attributable to the acquisition of issue of the financial asset or financial liability are expensed as incurred. Transaction costs related to financial instruments in the cost or amortized cost category are added to the carrying value of the items when they are initially recognized.
(h) Foreign currency:
• Foreign currency transactions are recorded at the exchange rate at the time of the transaction.
• Assets and liabilities denominated in foreign currencies are recorded at fair value using the exchange rate at the financial statement date. Unrealized foreign exchange gains and losses are recognized in the statement of remeasurement gains and losses. In the period of settlement, the realized foreign exchange gains and losses are recognized in the statement of operations and changes in fund balances and the unrealized balances are reversed from the statement of remeasurement gains and losses.
1-70 PUBLIC ACCOUNTS, 2012-2013
PROVINCE OF ONTARIO COUNCIL FOR THE ARTS (OPERATING AS ONTARIO ARTS COUNCIL) Notes to Financial Statements (continued) Year ended March 31, 2013
1. Significant accounting policies (continued):
(i) Use of estimates:
The preparation of financial statements requires management to make estimates and assumptions that affect the reported amounts of assets and liabilities and disclosure of contingent assets and liabilities at the date of the financial statements and the reported amounts of income and expenditures during the year. Actual results could differ from those estimates.
2. Employee future benefits:
(a) Pension benefits:
The OAC's full-time employees participate in the Public Service Pension Fund ("PSPF"), which is a defined benefit pension plan for employees of the Province of Ontario and many provincial agencies. The Province of Ontario, which is the sole sponsor of the PSPF, determines the OAC's annual payments to the PSPF. Since the OAC is not a sponsor of the PSPF, gains and losses arising from statutory actuarial funding valuations are not assets or obligations of the OAC, as the sponsor is responsible for ensuring that the PSPF is financially viable. The annual payments to the PSPF of $300,913 (2012 - $293,036) are included in salaries and benefits in Schedule 3.
(b) Non-pension benefits:
The cost of post-retirement non-pension employee benefits is paid by the Ministry of Government Services and is not included in the statement of operations and changes in fund balances.
The OAC also provides termination benefits earned by eligible employees. The amount of severance payments and unused vacation pay accrued at year end was $592,736 (2012 - $440,096), of which $329,878 (2012 - $114,849) has been classified as a current liability.
The OAC has set aside funds to meet these liabilities and invested these funds in the same pooled investments as the restricted and endowment funds. As at March 31, 2013, this investment has a market value of $586,298 (2012 - $520,151) and is shown under the operating fund as investments.
PUBLIC ACCOUNTS, 2012-2013 1-71
PROVINCE OF ONTARIO COUNCIL FOR THE ARTS (OPERATING AS ONTARIO ARTS COUNCIL) Notes to Financial Statements (continued) Year ended March 31, 2013
3. Capital assets:
2013 2012 Accumulated Net book Net book Cost amortization value value Audio visual equipment $ 79,473 $ 61,878 $ 17,595 $ 32,926 Computer hardware and
software 616,594 545,586 71,008 121,672 Furniture and fixtures 118,147 73,926 44,221 49,313 Office equipment 64,711 46,998 17,713 25,520 Leasehold improvements 272,395 207,766 64,629 105,778 Assets under development 490,752 – 490,752 212,604 $ 1,642,072 $ 936,154 $ 705,918 $ 547,813
4. Fund balances restricted for endowment purposes:
2013 2012 The Oskar Morawetz Memorial Fund $ 26,000 $ 26,000 Canadian Music Centre John Adaskin
Memorial Fund 17,998 17,998 Dr. Heinz Unger Scholarship Fund 17,235 17,235 The Leslie Bell Scholarship Fund 9,078 9,078 $ 70,311 $ 70,311
5. Arts Investment Fund:
On September 23, 2010, the Government of Ontario announced a new three-year $27,000,000 Arts Investment Fund to be administered by the OAC to strengthen not-for-profit arts organizations receiving operating grants from the OAC. This fund will help the arts sector to grow, become more competitive, pursue programming and other activities to reach new audiences and boost revenue. The $27,000,000 is being paid out over three years as follows: $11,000,000 in 2010-11, $10,000,000 in 2011-12 and $6,000,000 in 2012-13.
Eligible arts organizations were required to execute transfer payment agreements and to submit proposals to receive funding.
1-72 PUBLIC ACCOUNTS, 2012-2013
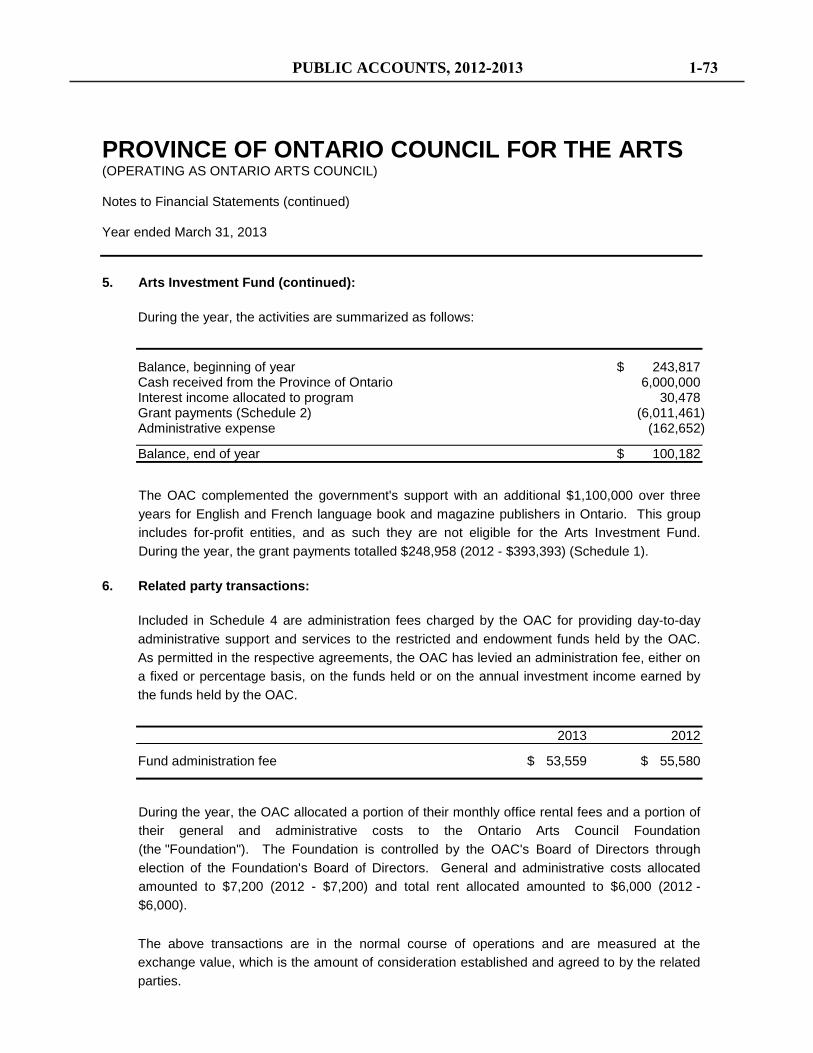
PROVINCE OF ONTARIO COUNCIL FOR THE ARTS (OPERATING AS ONTARIO ARTS COUNCIL) Notes to Financial Statements (continued) Year ended March 31, 2013 5. Arts Investment Fund (continued):
During the year, the activities are summarized as follows:
Balance, beginning of year $ 243,817 Cash received from the Province of Ontario 6,000,000 Interest income allocated to program 30,478 Grant payments (Schedule 2) (6,011,461) Administrative expense (162,652)
Balance, end of year $ 100,182
The OAC complemented the government's support with an additional $1,100,000 over three years for English and French language book and magazine publishers in Ontario. This group includes for-profit entities, and as such they are not eligible for the Arts Investment Fund. During the year, the grant payments totalled $248,958 (2012 - $393,393) (Schedule 1).
6. Related party transactions:
Included in Schedule 4 are administration fees charged by the OAC for providing day-to-day administrative support and services to the restricted and endowment funds held by the OAC. As permitted in the respective agreements, the OAC has levied an administration fee, either on a fixed or percentage basis, on the funds held or on the annual investment income earned by the funds held by the OAC.
2013 2012
Fund administration fee $ 53,559 $ 55,580
During the year, the OAC allocated a portion of their monthly office rental fees and a portion of their general and administrative costs to the Ontario Arts Council Foundation (the "Foundation"). The Foundation is controlled by the OAC's Board of Directors through election of the Foundation's Board of Directors. General and administrative costs allocated amounted to $7,200 (2012 - $7,200) and total rent allocated amounted to $6,000 (2012 - $6,000).
The above transactions are in the normal course of operations and are measured at the exchange value, which is the amount of consideration established and agreed to by the related parties.
PUBLIC ACCOUNTS, 2012-2013 1-73
PROVINCE OF ONTARIO COUNCIL FOR THE ARTS (OPERATING AS ONTARIO ARTS COUNCIL) Notes to Financial Statements (continued) Year ended March 31, 2013
7. Ontario Arts Council Foundation:
The Foundation was incorporated under the Ontario Corporations Act on October 15, 1991 and is a registered charity under the Income Tax Act (Canada). The Foundation was established:
• to receive and maintain a fund or funds and to apply all or part of the principal and income therefrom to charitable organizations which are also registered charities under the Income Tax Act (Canada);
• to provide through the OAC and other appropriate organizations for grants, scholarships or loans to persons in Ontario for study or research in the arts in Ontario or elsewhere or to persons in other provinces or territories of Canada or any other countries for study or research in the arts in Ontario; and
• to make awards to persons in Ontario for outstanding accomplishments in the arts.
As defined by The Canadian Institute of Chartered Accountants' Accounting Standards Board accounting recommendations for not-for-profit organizations, the OAC technically controls the Foundation in that the OAC's Board of Directors controls the election of the Foundation's Board of Directors.
The Foundation's financial statements have not been consolidated in the OAC's financial statements. There are no restrictions on the resources of the Foundation, nor are there significant differences from the accounting policies used by the OAC.
The majority of the fund balances, $45,923,563, represents the balances of the individual arts endowment funds held by the Foundation under the Arts Endowment Fund program of the Government of Ontario for a number of arts organizations. Under this program, money contributed and matched is held in perpetuity. The Board of Directors of the Foundation determines the amount of income that may be paid annually.
1-74 PUBLIC ACCOUNTS, 2012-2013
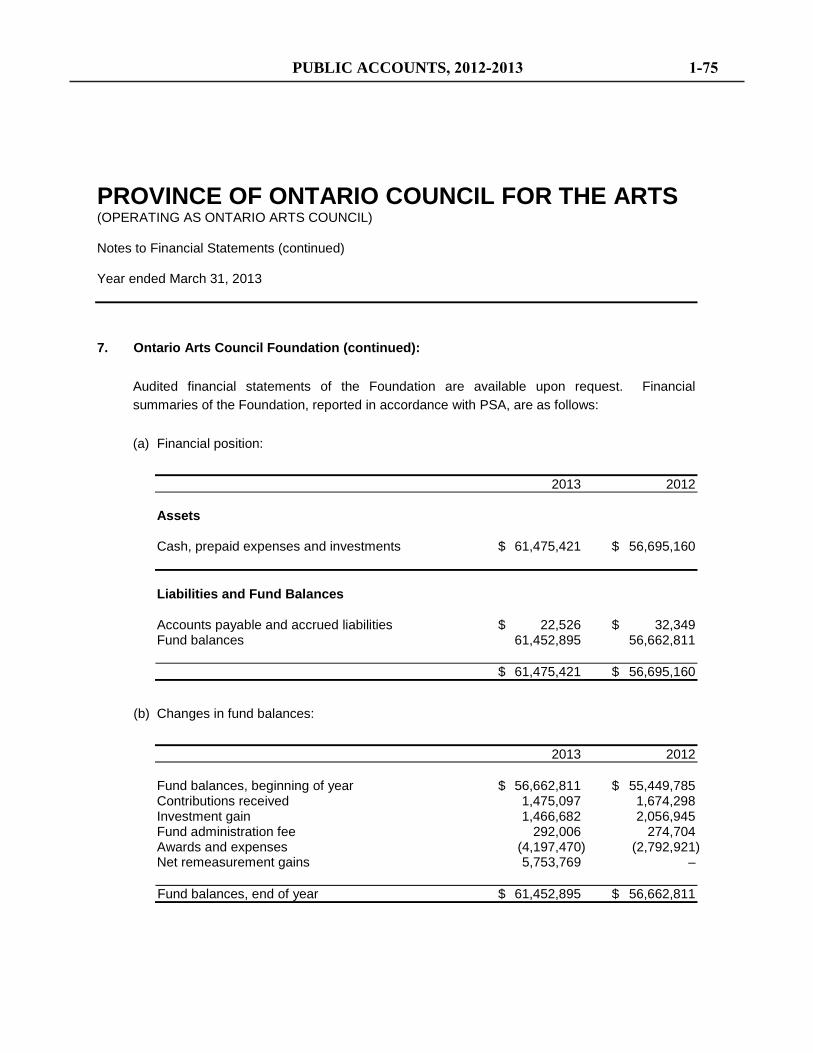
PROVINCE OF ONTARIO COUNCIL FOR THE ARTS (OPERATING AS ONTARIO ARTS COUNCIL) Notes to Financial Statements (continued) Year ended March 31, 2013
7. Ontario Arts Council Foundation (continued):
Audited financial statements of the Foundation are available upon request. Financial summaries of the Foundation, reported in accordance with PSA, are as follows:
(a) Financial position:
2013 2012 Assets Cash, prepaid expenses and investments $ 61,475,421 $ 56,695,160 Liabilities and Fund Balances Accounts payable and accrued liabilities $ 22,526 $ 32,349 Fund balances 61,452,895 56,662,811 $ 61,475,421 $ 56,695,160
(b) Changes in fund balances:
2013 2012 Fund balances, beginning of year $ 56,662,811 $ 55,449,785 Contributions received 1,475,097 1,674,298 Investment gain 1,466,682 2,056,945 Fund administration fee 292,006 274,704 Awards and expenses (4,197,470) (2,792,921) Net remeasurement gains 5,753,769 – Fund balances, end of year $ 61,452,895 $ 56,662,811
PUBLIC ACCOUNTS, 2012-2013 1-75
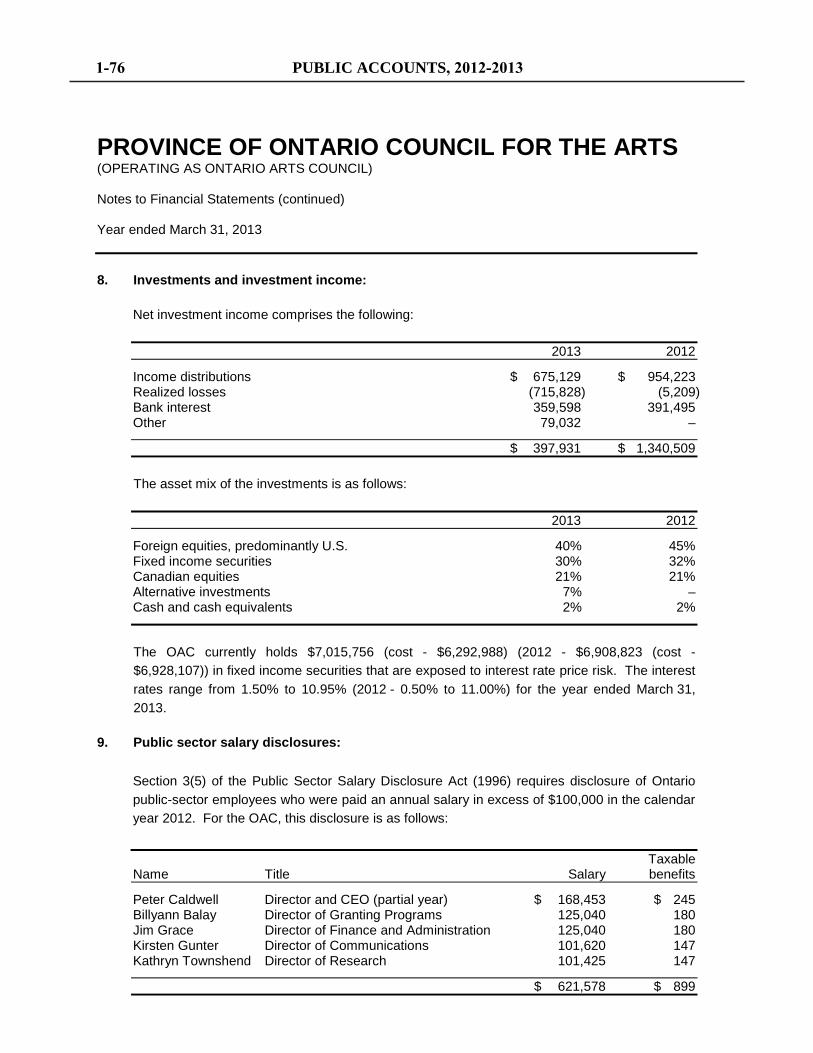
PROVINCE OF ONTARIO COUNCIL FOR THE ARTS (OPERATING AS ONTARIO ARTS COUNCIL) Notes to Financial Statements (continued) Year ended March 31, 2013 8. Investments and investment income:
Net investment income comprises the following: 2013 2012
Income distributions $ 675,129 $ 954,223 Realized losses (715,828) (5,209) Bank interest 359,598 391,495 Other 79,032 –
$ 397,931 $ 1,340,509
The asset mix of the investments is as follows: 2013 2012
Foreign equities, predominantly U.S. 40% 45% Fixed income securities 30% 32% Canadian equities 21% 21% Alternative investments 7% – Cash and cash equivalents 2% 2%
The OAC currently holds $7,015,756 (cost - $6,292,988) (2012 - $6,908,823 (cost - $6,928,107)) in fixed income securities that are exposed to interest rate price risk. The interest rates range from 1.50% to 10.95% (2012 - 0.50% to 11.00%) for the year ended March 31, 2013.
9. Public sector salary disclosures:
Section 3(5) of the Public Sector Salary Disclosure Act (1996) requires disclosure of Ontario public-sector employees who were paid an annual salary in excess of $100,000 in the calendar year 2012. For the OAC, this disclosure is as follows:
Taxable Name Title Salary benefits
Peter Caldwell Director and CEO (partial year) $ 168,453 $ 245 Billyann Balay Director of Granting Programs 125,040 180 Jim Grace Director of Finance and Administration 125,040 180 Kirsten Gunter Director of Communications 101,620 147 Kathryn Townshend Director of Research 101,425 147
$ 621,578 $ 899
1-76 PUBLIC ACCOUNTS, 2012-2013
PROVINCE OF ONTARIO COUNCIL FOR THE ARTS (OPERATING AS ONTARIO ARTS COUNCIL) Notes to Financial Statements (continued) Year ended March 31, 2013
10. Commitments:
(a) Lease commitments:
The OAC leases office premises and office equipment under operating leases. The future annual minimum lease payments are as follows:
2014 $ 235,862 2015 166,369 $ 402,231
(b) Grant commitments:
The OAC has approved grants of approximately $758,505 (2012 - $696,847), which will be paid in future years once the conditions of the grants have been met. These amounts are not reflected in the statement of operations and changes in fund balances.
11. Economic dependence:
The OAC is dependent on the Province of Ontario for the provision of funds to provide awards and grants and to cover the cost of operations.
12. Financial instruments:
(a) Interest rate and foreign currency risk:
The OAC is exposed to interest rate and foreign currency risk arising from the possibility that changes in interest rates and foreign exchange rates will affect the value of fixed income and foreign currency-denominated investments. The OAC currently does not use any hedging strategies to mitigate the exposure.
PUBLIC ACCOUNTS, 2012-2013 1-77
PROVINCE OF ONTARIO COUNCIL FOR THE ARTS (OPERATING AS ONTARIO ARTS COUNCIL) Notes to Financial Statements (continued) Year ended March 31, 2013
12. Financial instruments (continued):
(b) Market risk:
Market risk arises as a result of trading equities and fixed income securities. Fluctuations in the market expose the OAC to a risk of loss. The OAC uses two professional investment managers to advise on investment risks, asset selection and mix to achieve an appropriate balance between risks and returns. The Finance and Audit Committee of the Board of Directors of the OAC monitors investments decisions and results and meets regularly with the managers.
(c) Liquidity risk:
Liquidity risk is the risk that the OAC will be unable to fulfill its obligations on a timely basis or at a reasonable cost. The OAC manages its liquidity risk by monitoring its operating requirements. The OAC prepares budget and cash forecasts to ensure it has sufficient funds to fulfill its obligations. Accounts payable and accrued liabilities are generally due within 30 days of receipt of an invoice.
1-78 PUBLIC ACCOUNTS, 2012-2013
PROVINCE OF ONTARIO COUNCIL FOR THE ARTS (OPERATING AS ONTARIO ARTS COUNCIL) Schedule 1 - Grants Year ended March 31, 2013, with comparative figures for 2012 2013 2012 Organizations:
Music $ 9,994,675 $ 10,039,095 Theatre 9,239,317 9,477,883 Dance 5,525,994 5,623,870 Visual and media arts 5,052,759 5,456,040 Francophone arts 3,005,602 2,752,195 Community and multi-disciplinary 2,750,649 2,842,451 Literature 2,218,366 2,251,567 Touring 1,628,583 1,215,072 Arts service organizations 1,241,959 1,628,583 Arts education 1,228,553 1,287,871 Aboriginal arts 471,200 577,137 Compass (consulting, mentoring and
technical assistance) 233,294 463,065 Publishers and periodicals* (note 5) 248,958 393,393 42,839,909 44,008,222
Individuals:
Visual and media arts 2,749,983 3,049,546 Literature 1,805,080 1,798,584 Community and multi-disciplinary 1,033,463 902,589 Arts education 759,677 834,854 Francophone arts 752,150 667,711 Music 723,909 764,940 Theatre 548,600 487,034 Aboriginal arts 523,800 419,473 Touring 489,871 582,260 Dance 135,000 120,249 Compass (consulting, mentoring and
technical assistance) 11,960 39,480 9,533,493 9,666,720
$ 52,373,402 $ 53,674,942 *Incremental to the OAC funding for Literature, the $248,958 represents additional OAC support for publishers and periodicals (organizations that are not eligible through the Arts Investment Fund). See note 5 for full details.
PUBLIC ACCOUNTS, 2012-2013 1-79
PROVINCE OF ONTARIO COUNCIL FOR THE ARTS (OPERATING AS ONTARIO ARTS COUNCIL) Schedule 2 - Arts Investment Fund Grants Year ended March 31, 2013, with comparative figures for 2012 2013 2012 Organizations:
Theatre $ 2,071,154 $ 3,448,247 Music 1,400,937 2,292,365 Visual and media arts 883,111 1,433,954 Dance 624,600 1,024,563 Community and multi-disciplinary 462,358 743,789 Francophone arts 221,834 333,936 Arts service organizations 185,900 280,175 Arts education 115,572 178,042 Literature 45,995 62,706
$ 6,011,461 $ 9,797,777
1-80 PUBLIC ACCOUNTS, 2012-2013
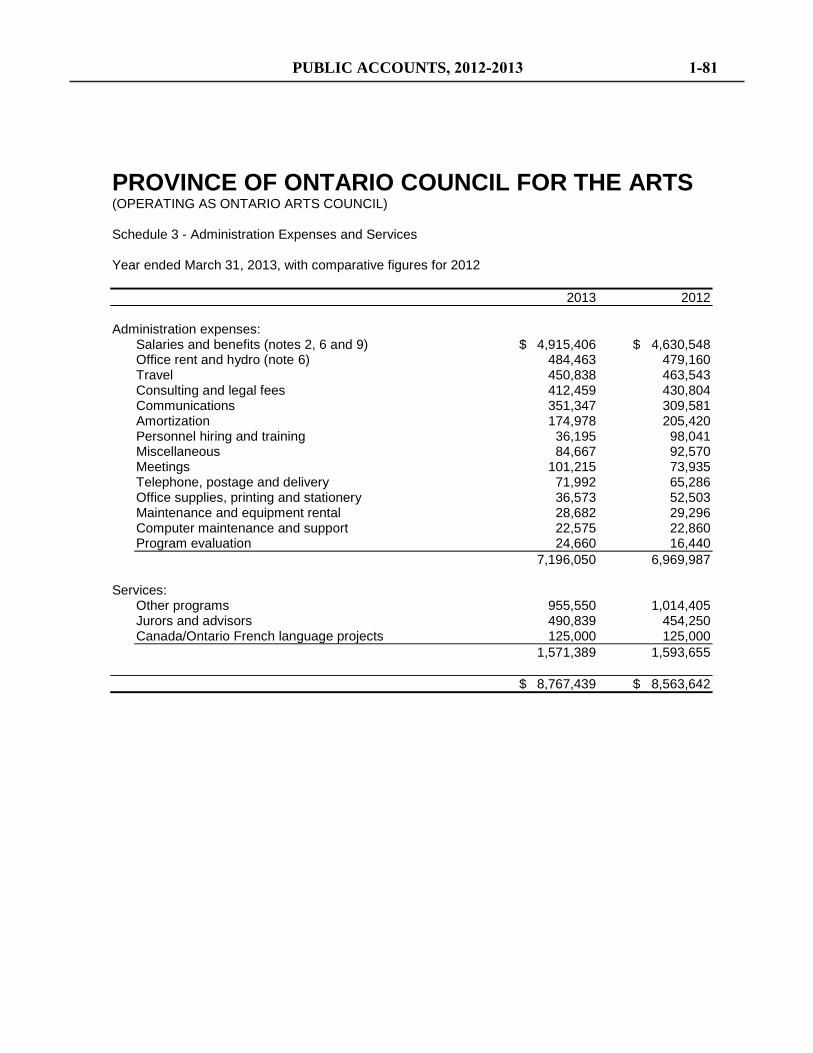
PROVINCE OF ONTARIO COUNCIL FOR THE ARTS (OPERATING AS ONTARIO ARTS COUNCIL) Schedule 3 - Administration Expenses and Services Year ended March 31, 2013, with comparative figures for 2012 2013 2012 Administration expenses:
Salaries and benefits (notes 2, 6 and 9) $ 4,915,406 $ 4,630,548 Office rent and hydro (note 6) 484,463 479,160 Travel 450,838 463,543 Consulting and legal fees 412,459 430,804 Communications 351,347 309,581 Amortization 174,978 205,420 Personnel hiring and training 36,195 98,041 Miscellaneous 84,667 92,570 Meetings 101,215 73,935 Telephone, postage and delivery 71,992 65,286 Office supplies, printing and stationery 36,573 52,503 Maintenance and equipment rental 28,682 29,296 Computer maintenance and support 22,575 22,860 Program evaluation 24,660 16,440 7,196,050 6,969,987
Services:
Other programs 955,550 1,014,405 Jurors and advisors 490,839 454,250 Canada/Ontario French language projects 125,000 125,000 1,571,389 1,593,655
$ 8,767,439 $ 8,563,642
PUBLIC ACCOUNTS, 2012-2013 1-81
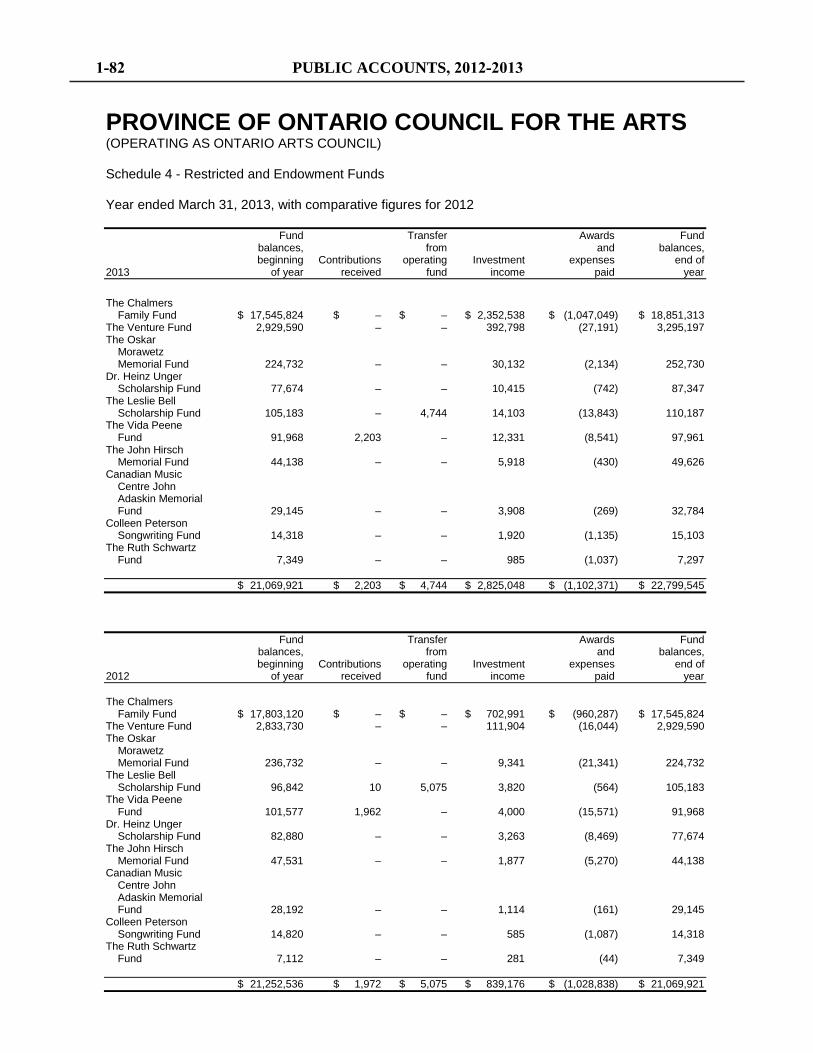
PROVINCE OF ONTARIO COUNCIL FOR THE ARTS (OPERATING AS ONTARIO ARTS COUNCIL) Schedule 4 - Restricted and Endowment Funds Year ended March 31, 2013, with comparative figures for 2012 Fund Transfer Awards Fund balances, from and balances, beginning Contributions operating Investment expenses end of 2013 of year received fund income paid year
The Chalmers
Family Fund $ 17,545,824 $ – $ – $ 2,352,538 $ (1,047,049) $ 18,851,313 The Venture Fund 2,929,590 – – 392,798 (27,191) 3,295,197 The Oskar
Morawetz Memorial Fund 224,732 – – 30,132 (2,134) 252,730
Dr. Heinz Unger Scholarship Fund 77,674 – – 10,415 (742) 87,347
The Leslie Bell Scholarship Fund 105,183 – 4,744 14,103 (13,843) 110,187
The Vida Peene Fund 91,968 2,203 – 12,331 (8,541) 97,961
The John Hirsch Memorial Fund 44,138 – – 5,918 (430) 49,626
Canadian Music Centre John Adaskin Memorial Fund 29,145 – – 3,908 (269) 32,784
Colleen Peterson Songwriting Fund 14,318 – – 1,920 (1,135) 15,103
The Ruth Schwartz Fund 7,349 – – 985 (1,037) 7,297
$ 21,069,921 $ 2,203 $ 4,744 $ 2,825,048 $ (1,102,371) $ 22,799,545
Fund Transfer Awards Fund balances, from and balances, beginning Contributions operating Investment expenses end of 2012 of year received fund income paid year The Chalmers
Family Fund $ 17,803,120 $ – $ – $ 702,991 $ (960,287) $ 17,545,824 The Venture Fund 2,833,730 – – 111,904 (16,044) 2,929,590 The Oskar
Morawetz Memorial Fund 236,732 – – 9,341 (21,341) 224,732
The Leslie Bell Scholarship Fund 96,842 10 5,075 3,820 (564) 105,183
The Vida Peene Fund 101,577 1,962 – 4,000 (15,571) 91,968
Dr. Heinz Unger Scholarship Fund 82,880 – – 3,263 (8,469) 77,674
The John Hirsch Memorial Fund 47,531 – – 1,877 (5,270) 44,138
Canadian Music Centre John Adaskin Memorial Fund 28,192 – – 1,114 (161) 29,145
Colleen Peterson Songwriting Fund 14,820 – – 585 (1,087) 14,318
The Ruth Schwartz Fund 7,112 – – 281 (44) 7,349
$ 21,252,536 $ 1,972 $ 5,075 $ 839,176 $ (1,028,838) $ 21,069,921
1-82 PUBLIC ACCOUNTS, 2012-2013
Management’s Responsibility for Financial Statements
The accompanying financial statements of the Ontario Educational Communications Authority have been prepared in accordance with Canadian public sector accounting standards and are the responsibility of management. The preparation of financial statements necessarily involves the use of estimates based on management’s judgement, particularly when transactions affecting the current accounting period cannot be finalized with certainty until future periods. The financial statements have been properly prepared within reasonable limits of materiality and in light of information available up to June 25, 2013.
Management maintains a system of internal controls designed to provide reasonable assurance that the assets are safeguarded and that reliable financial information is available on a timely basis. The system includes formal policies and procedures and an organizational structure that provides for appropriate delegation of authority and segregation of responsibilities. The Internal Audit Department independently evaluates the effectiveness of these internal controls on a periodic basis and reports its findings to management and to the Board of Directors.
The Board of Directors is responsible for ensuring that management fulfills its responsibilities for financial reporting and internal controls. The Board reviews and approves the financial statements. The Audit Committee of the Board meets periodically with management, Internal Audit, and the Office of the Auditor General of Ontario to discuss audit, internal control, accounting policy, and financial reporting matters.
The financial statements have been audited by the Office of the Auditor General of Ontario. The Auditor General’s responsibility is to express an opinion on whether the financial statements are fairly presented in accordance with generally accepted accounting principles. The Independent Auditor’s Report, which appears on the following page, outlines the scope of the Auditor General’s examination and opinion.
On behalf of Management:
Lisa de Wilde Chief Executive Officer
PUBLIC ACCOUNTS, 2012-2013 1-83
Independent Auditor’s Report
To the Ontario Educational Communications Authority and to the Minister of Education I have audited the accompanying financial statements of the Ontario Educational Communications Authority, which comprise the statements of financial position as at March 31, 2013, March 31, 2012 and April 1, 2011 and the statements of operations, statements of changes in net assets and statements of cash flows for the years ended March 31, 2013 and March 31, 2012, and a summary of significant accounting policies and other explanatory information.
Management’s Responsibility for the Financial Statements
Management is responsible for the preparation and fair presentation of these financial statements in accordance with Canadian public sector accounting standards, and for such internal control as management determines is necessary to enable the preparation of financial statements that are free from material misstatement, whether due to fraud or error.
Auditor’s Responsibility
My responsibility is to express an opinion on these financial statements based on my audits. I conducted my audits in accordance with Canadian generally accepted auditing standards. Those standards require that I comply with ethical requirements and plan and perform the audit to obtain reasonable assurance about whether the financial statements are free from material misstatement.
An audit involves performing procedures to obtain audit evidence about the amounts and disclosures in the financial statements. The procedures selected depend on the auditor’s judgment, including the assessment of the risks of material misstatement of the financial statements, whether due to fraud or error. In making those risk assessments, the auditor considers internal control relevant to the entity’s preparation and fair presentation of the financial statements in order to design audit procedures that are appropriate in the circumstances, but not for the purpose of expressing an opinion on the effectiveness of the entity’s internal control. An audit also includes evaluating the appropriateness of accounting policies used and the reasonableness of accounting estimates made by management, as well as evaluating the overall presentation of the financial statements.
I believe that the audit evidence I have obtained in my audits is sufficient and appropriate to provide a basis for my audit opinion.
Opinion
In my opinion, the financial statements present fairly, in all material respects, the financial position of the Ontario Educational Communications Authority as at March 31, 2013, March 31, 2012 and April 1, 2011 and the results of its operations, changes in net assets, and its cash flows for the years ended March 31, 2013 and March 31, 2012 in accordance with Canadian public sector accounting standards. Toronto, Ontario Susan Klein, CPA, CA, LPA June 25, 2013 Acting Deputy Auditor General
1-84 PUBLIC ACCOUNTS, 2012-2013
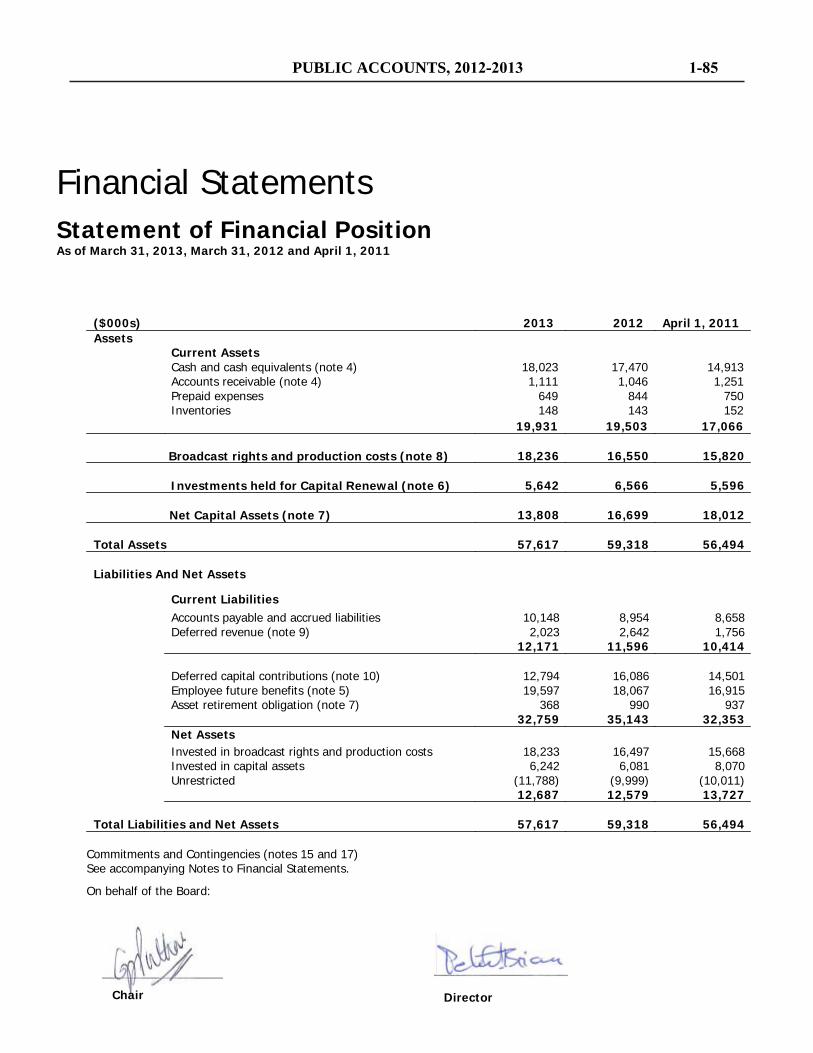
Financial Statements
Statement of Financial Position As of March 31, 2013, March 31, 2012 and April 1, 2011
($000s)
2013
2012
April 1, 2011
Assets Current Assets
Cash and cash equivalents (note 4) 18,023 17,470 14,913 Accounts receivable (note 4) 1,111 1,046 1,251 Prepaid expenses 649 844 750 Inventories 148 143 152
19,931 19,503 17,066
18,236 16,550 15,820
5,642 6,566 5,596
13,808 16,699 18,012 Total Assets 57,617 59,318 56,494
Liabilities And Net Assets
Current Liabilities
Accounts payable and accrued liabilities
10,148
8,954 8,658 Deferred revenue (note 9) 2,023 2,642 1,756
12,171 11,596 10,414
Deferred capital contributions (note 10) 12,794 16,086 14,501 Employee future benefits (note 5) 19,597 18,067 16,915
Asset retirement obligation (note 7) 368 990 937 32,759 35,143 32,353 Net Assets
Invested in broadcast rights and production costs 18,233 16,497 15,668 Invested in capital assets 6,242 6,081 8,070 Unrestricted (11,788) (9,999) (10,011)
12,687 12,579 13,727
Total Liabilities and Net Assets 57,617 59,318 56,494
Commitments and Contingencies (notes 15 and 17) See accompanying Notes to Financial Statements.
On behalf of the Board:
Chair Director
PUBLIC ACCOUNTS, 2012-2013 1-85
Broadcast rights and production costs (note 8)
Investments held for Capital Renewal (note 6)
Net Capital Assets (note 7)
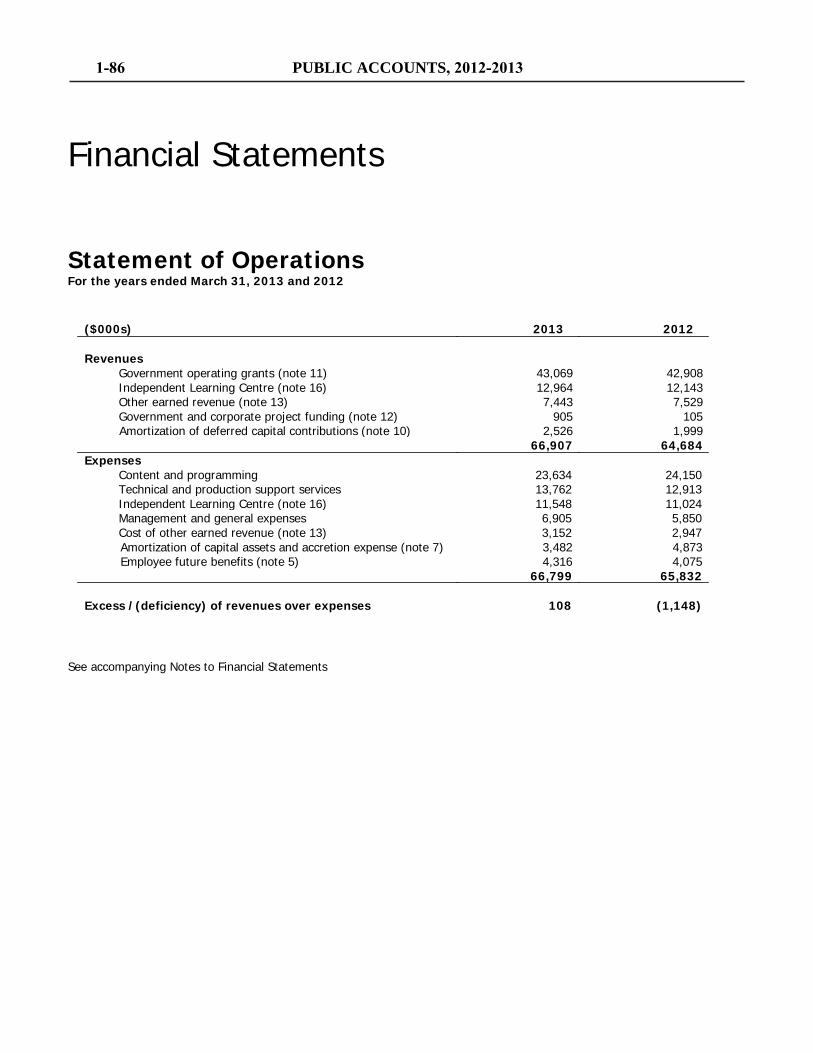
Financial Statements
Statement of Operations For the years ended March 31, 2013 and 2012
($000s)
2013
2012
Revenues
Government operating grants (note 11) 43,069 42,908 Independent Learning Centre (note 16) 12,964 12,143 Other earned revenue (note 13) 7,443 7,529 Government and corporate project funding (note 12) 905 105 Amortization of deferred capital contributions (note 10) 2,526 1,999
66,907 64,684 Expenses
Content and programming 23,634 24,150 Technical and production support services 13,762 12,913 Independent Learning Centre (note 16) 11,548 11,024 Management and general expenses 6,905 5,850 Cost of other earned revenue (note 13) 3,152 2,947 Amortization of capital assets and accretion expense (note 7) 3,482 4,873 Employee future benefits (note 5) 4,316 4,075
66,799 65,832 Excess /(deficiency) of revenues over expenses 108 (1,148)
See accompanying Notes to Financial Statements
1-86 PUBLIC ACCOUNTS, 2012-2013
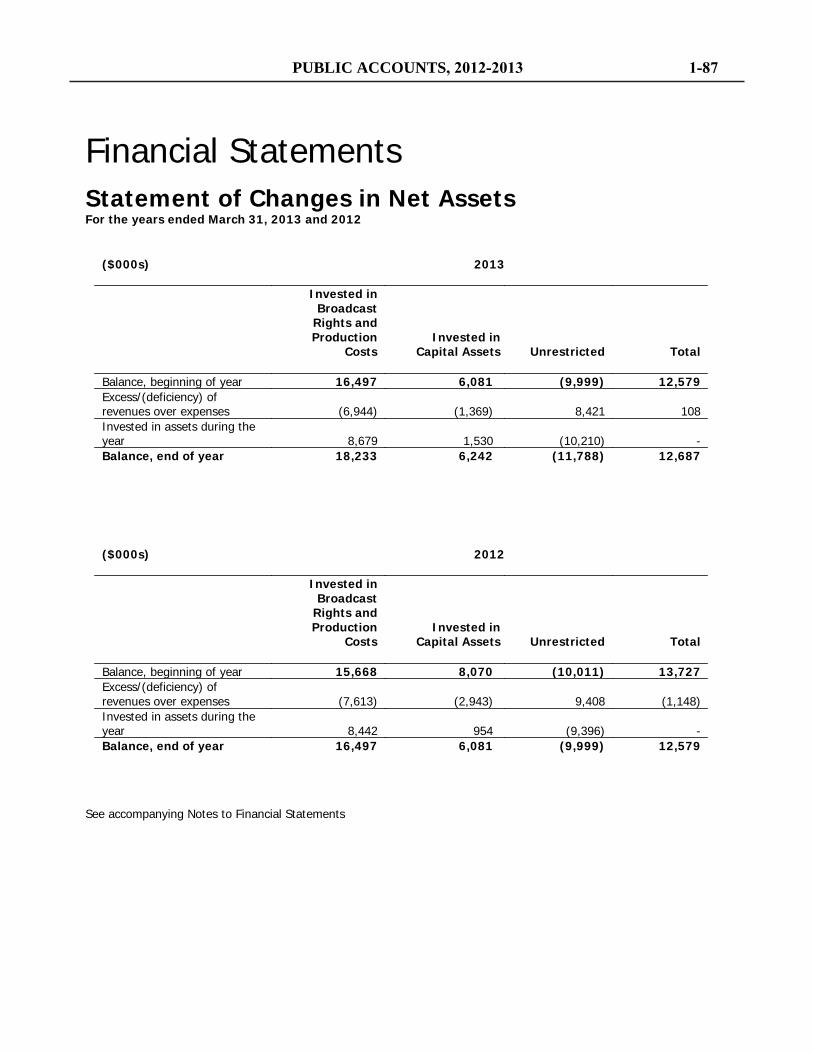
Financial Statements
Statement of Changes in Net Assets For the years ended March 31, 2013 and 2012
($000s)
2013
Invested in
Broadcast Rights and Production
Costs
Invested in
Capital Assets
Unrestricted
Total
Balance, beginning of year 16,497 6,081 (9,999) 12,579 Excess/(deficiency) of revenues over expenses (6,944) (1,369) 8,421 108 Invested in assets during the year 8,679 1,530 (10,210) - Balance, end of year 18,233 6,242 (11,788) 12,687
($000s)
2012
Invested in
Broadcast Rights and Production
Costs
Invested in
Capital Assets
Unrestricted
Total
Balance, beginning of year 15,668 8,070 (10,011) 13,727 Excess/(deficiency) of revenues over expenses (7,613) (2,943) 9,408 (1,148) Invested in assets during the year 8,442 954 (9,396) - Balance, end of year 16,497 6,081 (9,999) 12,579
See accompanying Notes to Financial Statements
PUBLIC ACCOUNTS, 2012-2013 1-87
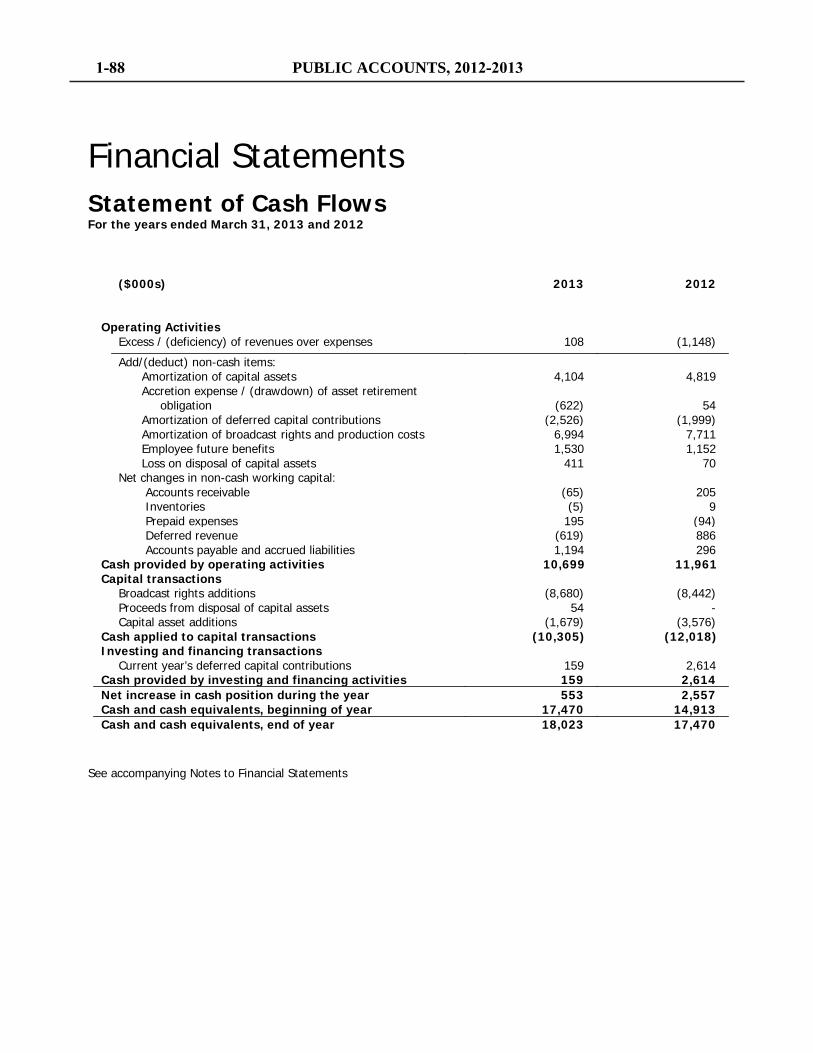
Financial Statements
Statement of Cash Flows For the years ended March 31, 2013 and 2012
($000s)
2013
2012
Operating Activities Excess / (deficiency) of revenues over expenses 108 (1,148)
Add/(deduct) non-cash items: Amortization of capital assets 4,104 4,819 Accretion expense / (drawdown) of asset retirement
obligation
(622)
54 Amortization of deferred capital contributions (2,526) (1,999) Amortization of broadcast rights and production costs 6,994 7,711 Employee future benefits 1,530 1,152 Loss on disposal of capital assets 411 70
Net changes in non-cash working capital: Accounts receivable (65) 205 Inventories (5) 9 Prepaid expenses 195 (94) Deferred revenue (619) 886 Accounts payable and accrued liabilities 1,194 296
Cash provided by operating activities 10,699 11,961 Capital transactions Broadcast rights additions (8,680) (8,442) Proceeds from disposal of capital assets 54 - Capital asset additions (1,679) (3,576) Cash applied to capital transactions (10,305) (12,018) Investing and financing transactions Current year’s deferred capital contributions 159 2,614 Cash provided by investing and financing activities 159 2,614 Net increase in cash position during the year 553 2,557 Cash and cash equivalents, beginning of year 17,470 14,913 Cash and cash equivalents, end of year 18,023 17,470
See accompanying Notes to Financial Statements
1-88 PUBLIC ACCOUNTS, 2012-2013
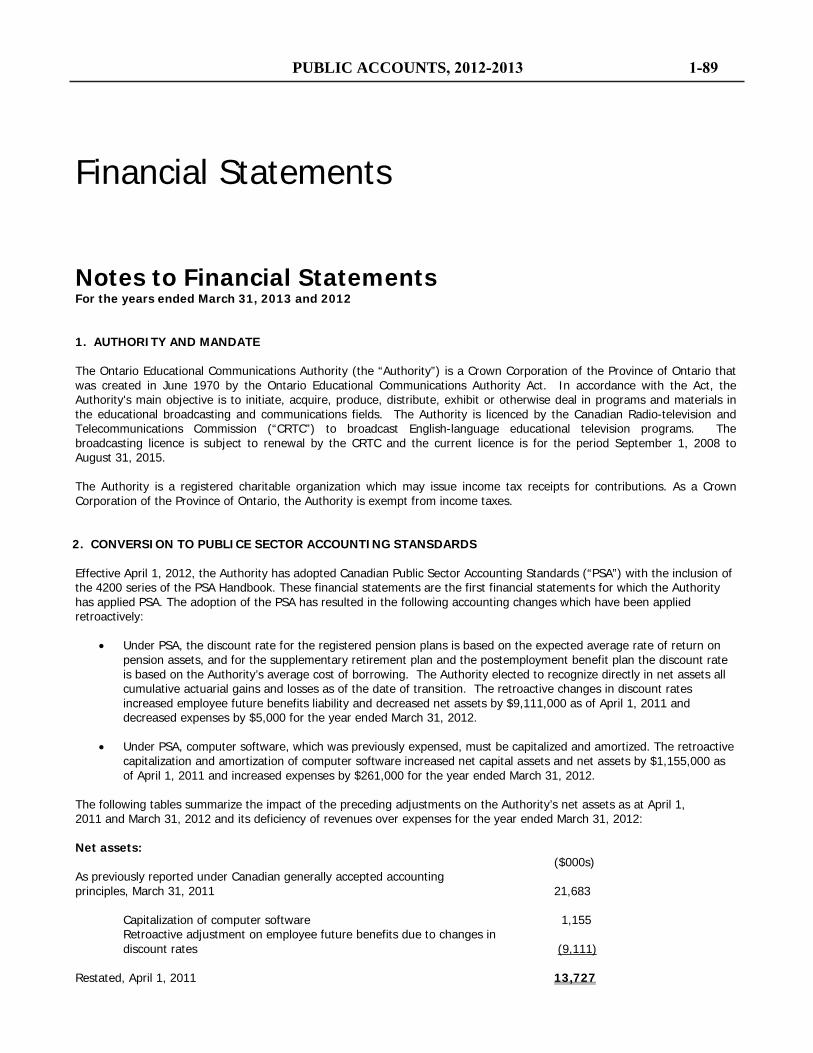
Financial Statements
Notes to Financial Statements For the years ended March 31, 2013 and 2012
1. AUTHORITY AND MANDATE
The Ontario Educational Communications Authority (the “Authority”) is a Crown Corporation of the Province of Ontario that was created in June 1970 by the Ontario Educational Communications Authority Act. In accordance with the Act, the Authority's main objective is to initiate, acquire, produce, distribute, exhibit or otherwise deal in programs and materials in the educational broadcasting and communications fields. The Authority is licenced by the Canadian Radio-television and Telecommunications Commission (“CRTC”) to broadcast English-language educational television programs. The broadcasting licence is subject to renewal by the CRTC and the current licence is for the period September 1, 2008 to August 31, 2015.
The Authority is a registered charitable organization which may issue income tax receipts for contributions. As a Crown Corporation of the Province of Ontario, the Authority is exempt from income taxes.
Effective April 1, 2012, the Authority has adopted Canadian Public Sector Accounting Standards (“PSA”) with the inclusion of the 4200 series of the PSA Handbook. These financial statements are the first financial statements for which the Authority has applied PSA. The adoption of the PSA has resulted in the following accounting changes which have been applied retroactively:
• Under PSA, the discount rate for the registered pension plans is based on the expected average rate of return on pension assets, and for the supplementary retirement plan and the postemployment benefit plan the discount rate is based on the Authority’s average cost of borrowing. The Authority elected to recognize directly in net assets all cumulative actuarial gains and losses as of the date of transition. The retroactive changes in discount rates increased employee future benefits liability and decreased net assets by $9,111,000 as of April 1, 2011 and decreased expenses by $5,000 for the year ended March 31, 2012.
• Under PSA, computer software, which was previously expensed, must be capitalized and amortized. The retroactive
capitalization and amortization of computer software increased net capital assets and net assets by $1,155,000 as of April 1, 2011 and increased expenses by $261,000 for the year ended March 31, 2012.
The following tables summarize the impact of the preceding adjustments on the Authority’s net assets as at April 1, 2011 and March 31, 2012 and its deficiency of revenues over expenses for the year ended March 31, 2012: Net assets: ($000s) As previously reported under Canadian generally accepted accounting principles, March 31, 2011 21,683 Capitalization of computer software 1,155
Retroactive adjustment on employee future benefits due to changes in discount rates (9,111) Restated, April 1, 2011 13,727
PUBLIC ACCOUNTS, 2012-2013 1-89
2. CONVERSION TO PUBLICE SECTOR ACCOUNTING STANSDARDS
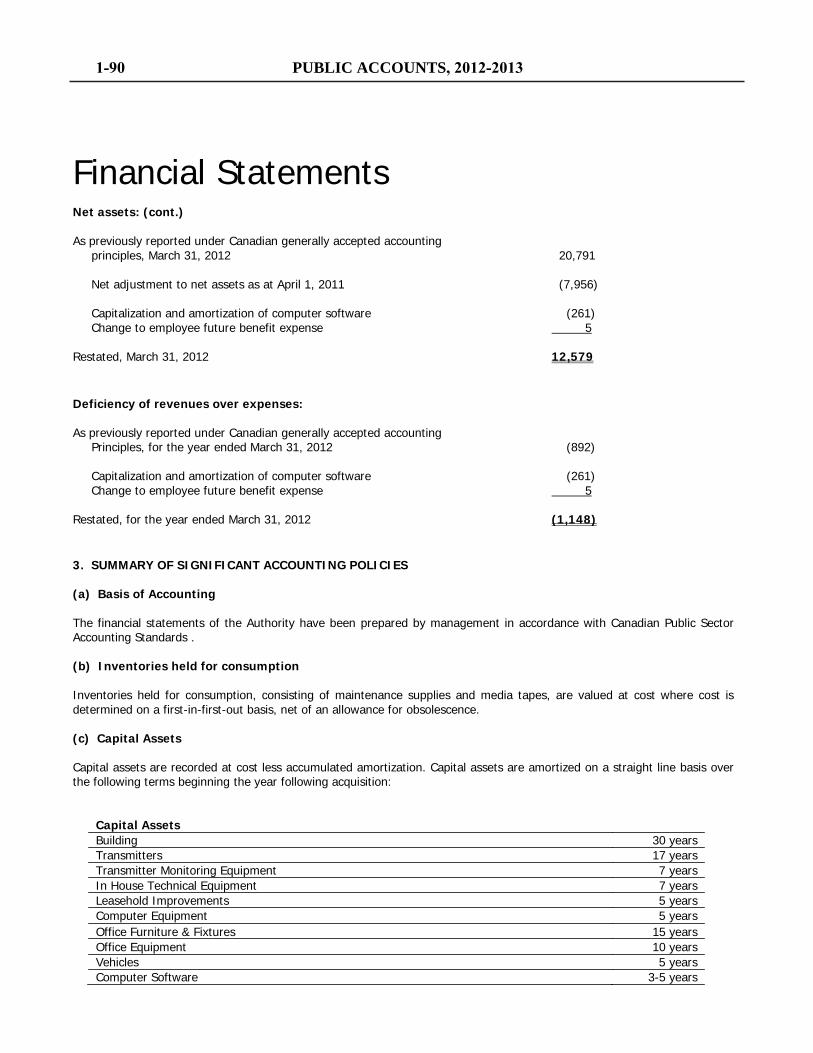
Financial Statements
Net assets: (cont.) As previously reported under Canadian generally accepted accounting principles, March 31, 2012 20,791 Net adjustment to net assets as at April 1, 2011 (7,956) Capitalization and amortization of computer software (261) Change to employee future benefit expense 5 Restated, March 31, 2012 12,579 Deficiency of revenues over expenses: As previously reported under Canadian generally accepted accounting Principles, for the year ended March 31, 2012 (892) Capitalization and amortization of computer software (261) Change to employee future benefit expense 5 Restated, for the year ended March 31, 2012 (1,148)
3. SUMMARY OF SIGNIFICANT ACCOUNTING POLICIES
(a) Basis of Accounting
The financial statements of the Authority have been prepared by management in accordance with Canadian Public Sector Accounting Standards .
(b) Inventories held for consumption
Inventories held for consumption, consisting of maintenance supplies and media tapes, are valued at cost where cost is determined on a first-in-first-out basis, net of an allowance for obsolescence.
(c) Capital Assets
Capital assets are recorded at cost less accumulated amortization. Capital assets are amortized on a straight line basis over the following terms beginning the year following acquisition: Capital Assets Building 30 years Transmitters 17 years Transmitter Monitoring Equipment 7 years In House Technical Equipment 7 years Leasehold Improvements 5 years Computer Equipment 5 years Office Furniture & Fixtures 15 years Office Equipment 10 years Vehicles 5 years Computer Software 3-5 years
1-90 PUBLIC ACCOUNTS, 2012-2013
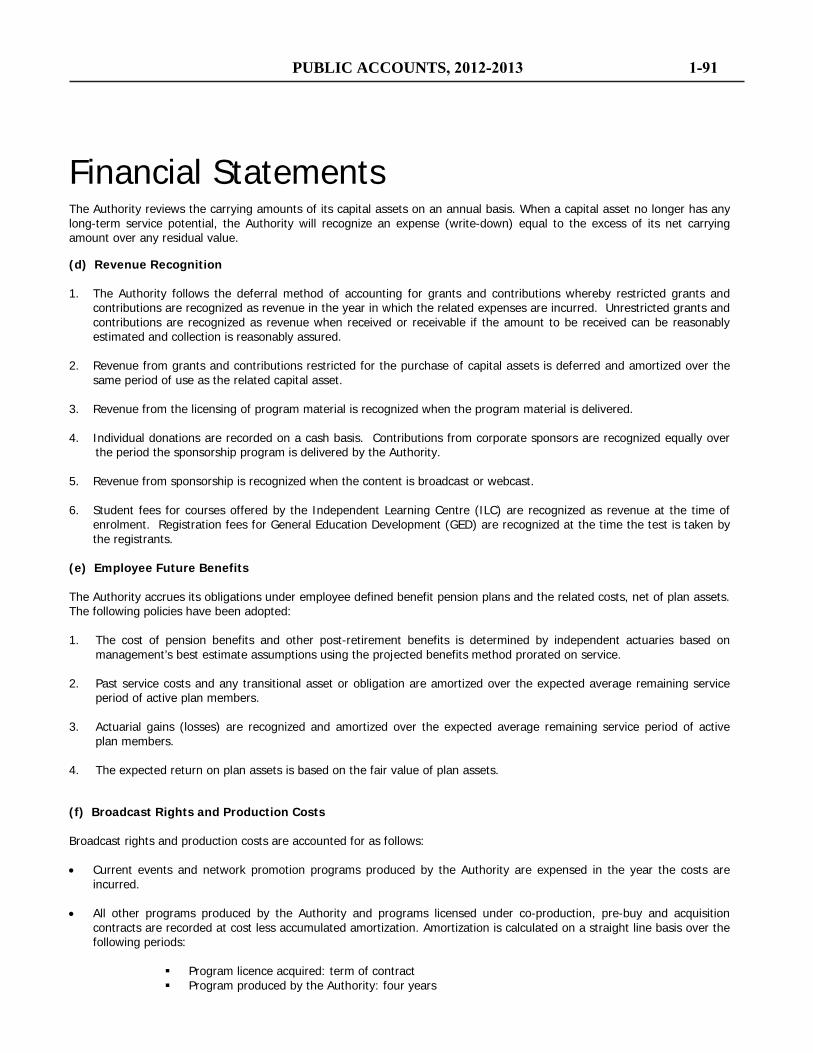
Financial Statements
The Authority reviews the carrying amounts of its capital assets on an annual basis. When a capital asset no longer has any long-term service potential, the Authority will recognize an expense (write-down) equal to the excess of its net carrying amount over any residual value. (d) Revenue Recognition
1. The Authority follows the deferral method of accounting for grants and contributions whereby restricted grants and
contributions are recognized as revenue in the year in which the related expenses are incurred. Unrestricted grants and contributions are recognized as revenue when received or receivable if the amount to be received can be reasonably estimated and collection is reasonably assured.
2. Revenue from grants and contributions restricted for the purchase of capital assets is deferred and amortized over the
same period of use as the related capital asset. 3. Revenue from the licensing of program material is recognized when the program material is delivered. 4. Individual donations are recorded on a cash basis. Contributions from corporate sponsors are recognized equally over
the period the sponsorship program is delivered by the Authority. 5. Revenue from sponsorship is recognized when the content is broadcast or webcast. 6. Student fees for courses offered by the Independent Learning Centre (ILC) are recognized as revenue at the time of
enrolment. Registration fees for General Education Development (GED) are recognized at the time the test is taken by the registrants.
(e) Employee Future Benefits The Authority accrues its obligations under employee defined benefit pension plans and the related costs, net of plan assets. The following policies have been adopted: 1. The cost of pension benefits and other post-retirement benefits is determined by independent actuaries based on
management’s best estimate assumptions using the projected benefits method prorated on service.
2. Past service costs and any transitional asset or obligation are amortized over the expected average remaining service period of active plan members.
3. Actuarial gains (losses) are recognized and amortized over the expected average remaining service period of active plan members.
4. The expected return on plan assets is based on the fair value of plan assets.
(f) Broadcast Rights and Production Costs Broadcast rights and production costs are accounted for as follows: • Current events and network promotion programs produced by the Authority are expensed in the year the costs are
incurred.
• All other programs produced by the Authority and programs licensed under co-production, pre-buy and acquisition contracts are recorded at cost less accumulated amortization. Amortization is calculated on a straight line basis over the following periods:
Program licence acquired: term of contract Program produced by the Authority: four years
PUBLIC ACCOUNTS, 2012-2013 1-91
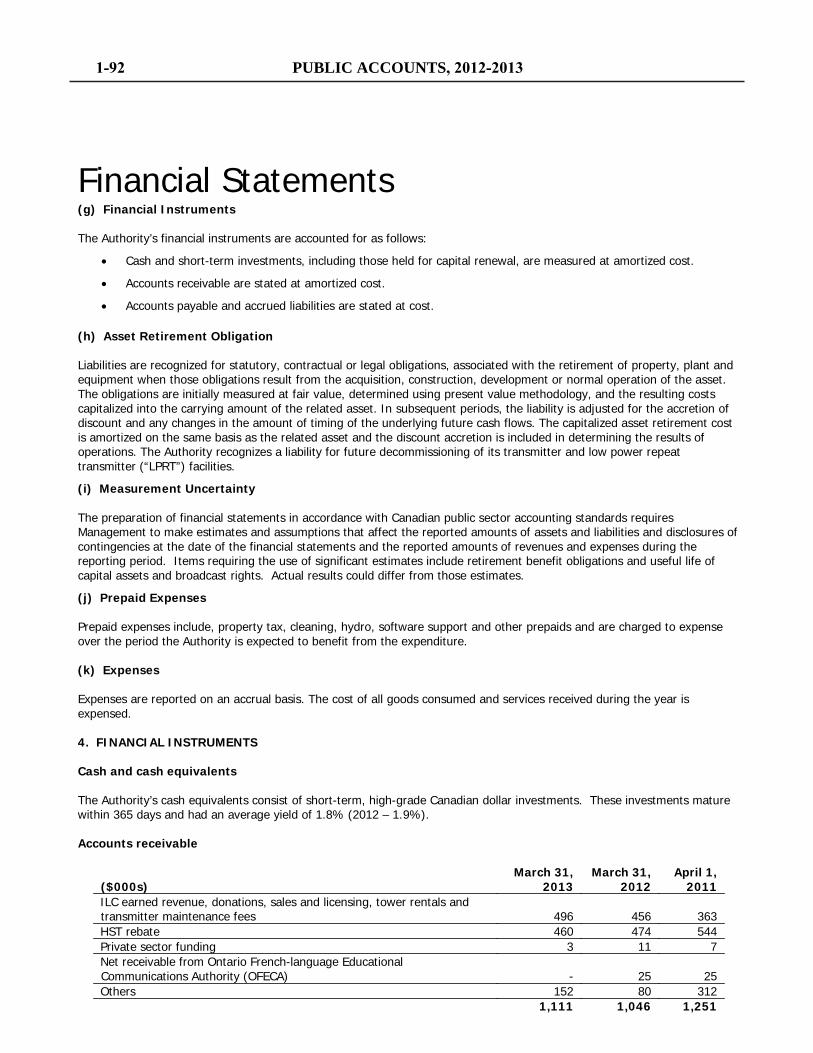
Financial Statements (g) Financial Instruments
The Authority’s financial instruments are accounted for as follows:
• Cash and short-term investments, including those held for capital renewal, are measured at amortized cost.
• Accounts receivable are stated at amortized cost.
• Accounts payable and accrued liabilities are stated at cost.
(h) Asset Retirement Obligation Liabilities are recognized for statutory, contractual or legal obligations, associated with the retirement of property, plant and equipment when those obligations result from the acquisition, construction, development or normal operation of the asset. The obligations are initially measured at fair value, determined using present value methodology, and the resulting costs capitalized into the carrying amount of the related asset. In subsequent periods, the liability is adjusted for the accretion of discount and any changes in the amount of timing of the underlying future cash flows. The capitalized asset retirement cost is amortized on the same basis as the related asset and the discount accretion is included in determining the results of operations. The Authority recognizes a liability for future decommissioning of its transmitter and low power repeat transmitter (“LPRT”) facilities.
(i) Measurement Uncertainty The preparation of financial statements in accordance with Canadian public sector accounting standards requires Management to make estimates and assumptions that affect the reported amounts of assets and liabilities and disclosures of contingencies at the date of the financial statements and the reported amounts of revenues and expenses during the reporting period. Items requiring the use of significant estimates include retirement benefit obligations and useful life of capital assets and broadcast rights. Actual results could differ from those estimates.
(j) Prepaid Expenses Prepaid expenses include, property tax, cleaning, hydro, software support and other prepaids and are charged to expense over the period the Authority is expected to benefit from the expenditure. (k) Expenses Expenses are reported on an accrual basis. The cost of all goods consumed and services received during the year is expensed. 4. FINANCIAL INSTRUMENTS Cash and cash equivalents
The Authority’s cash equivalents consist of short-term, high-grade Canadian dollar investments. These investments mature
within 365 days and had an average yield of 1.8% (2012 – 1.9%). Accounts receivable
($000s) March 31,
2013 March 31,
2012 April 1,
2011 ILC earned revenue, donations, sales and licensing, tower rentals and
transmitter maintenance fees 496 456 363 HST rebate 460 474 544 Private sector funding 3 11 7 Net receivable from Ontario French-language Educational
Communications Authority (OFECA) - 25 25 Others 152 80 312 1,111 1,046 1,251
1-92 PUBLIC ACCOUNTS, 2012-2013
Financial Statements
Risk disclosures (a) Liquidity risk: Liquidity risk is the risk that the Authority will not be able to meet its cash flow obligations as they fall due. The Authority manages its liquidity risk by monitoring its operating requirements and prepares budget and cash forecasts to ensure it has sufficient funds to fulfill its obligations. It is management’s opinion that the Authority is not exposed to significant liquidity risk. (b) Credit risk: Credit risk is the risk that one party to a financial instrument will cause a financial loss for the other party by failing to discharge an obligation. The Authority is exposed to credit risk arising from its accounts receivable. Given the amount of the Authority’s accounts receivable and past experience regarding payments, management believes that the Authority is not exposed to significant credit risk. (c) Interest rate risk: Interest rate risk is the risk that the fair value or future cash flows of a financial instrument will fluctuate because of changes in market interest rates. Due to the short-term nature of the Authority’s financial instruments, their carrying value approximate fair value and as a result management believes that the Authority is not exposed to significant interest rate risk. (d) Foreign currency risk: Currency risk is the risk that the fair value or future cash flows of a financial instrument will fluctuate because of changes in foreign exchange rates. The Authority’s U.S. dollar cash totalled $121,000 (2012 - $127,000) and was not large enough at any time during the year to expose the Authority to significant currency risks. These amounts were converted to Canadian dollars using an exchange rate of 1.016 (2012 – 0.97). It is managements opinion that the Authority is not exposes to significant liquidity, credit, interest rate or currency risk. 5. EMPLOYEE FUTURE BENEFITS
The pension and other post-employment benefit plans have the following components: (a) Registered pension plans: • Main Pension Plan - Most employees of the Authority are members of this plan, which consists of three elements – a
non-contributory, defined benefit, best average earnings and years of service element; a contributory, defined contribution element; and a non-contributory, defined contribution element.
• Executive Pension Plan – Executives are members of this non-contributory, defined benefit, best average earnings and years of service plan.
(b) Supplementary retirement plan: • Certain employees are members of this unregistered and non-contributory plan which funds the portion of pension
entitlements in excess of the maximum allowed for registered pension plans under the federal Income Tax Act. The employee future benefits payable under the defined benefit plans are adjusted for inflation based on the consumer price index up to a maximum of 3% per year.
PUBLIC ACCOUNTS, 2012-2013 1-93
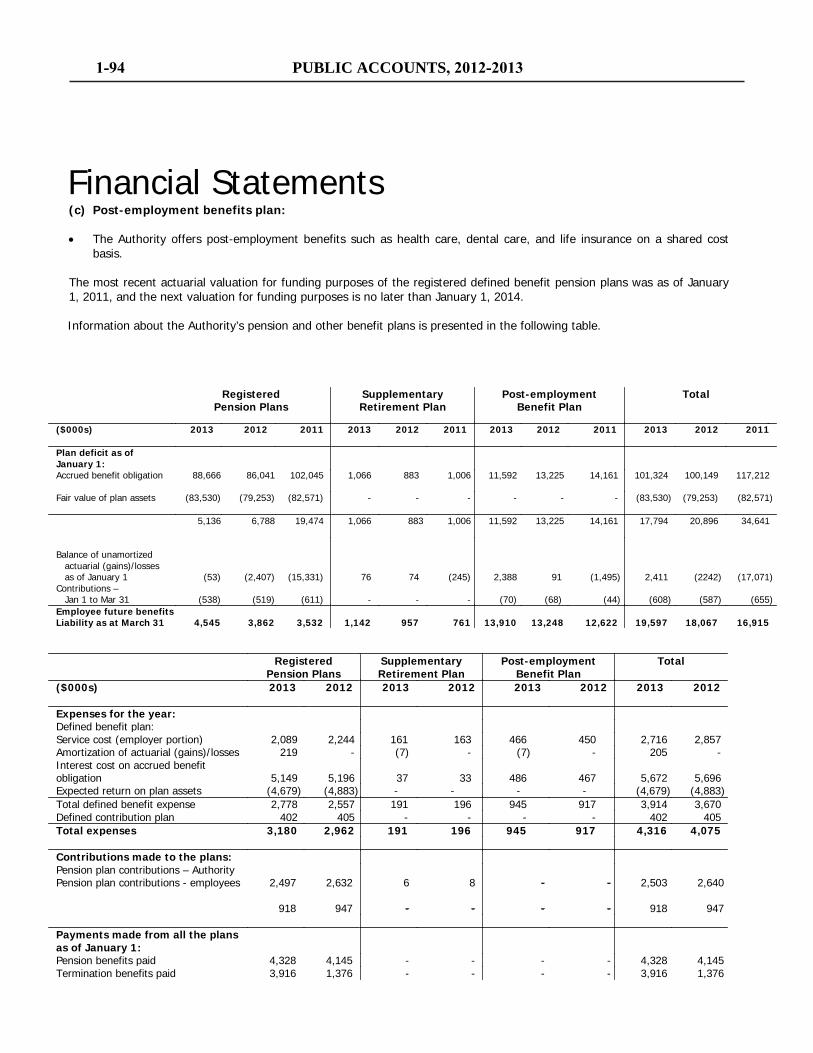
Financial Statements
(c) Post-employment benefits plan: • The Authority offers post-employment benefits such as health care, dental care, and life insurance on a shared cost
basis.
The most recent actuarial valuation for funding purposes of the registered defined benefit pension plans was as of January 1, 2011, and the next valuation for funding purposes is no later than January 1, 2014. Information about the Authority’s pension and other benefit plans is presented in the following table.
Registered Pension Plans
Supplementary Retirement Plan
Post-employment Benefit Plan
Total
($000s) 2013 2012
2011 2013 2012
2011 2013 2012
2011 2013 2012
2011
Plan deficit as of January 1:
Accrued benefit obligation 88,666 86,041
102,045
1,066
883
1,006 11,592
13,225
14,161 101,324
100,149
117,212
Fair value of plan assets (83,530)
(79,253)
(82,571) -
-
- -
-
- (83,530)
(79,253)
(82,571)
5,136 6,788
19,474 1,066
883 1,006 11,592
13,225
14,161 17,794
20,896
34,641
Balance of unamortized actuarial (gains)/losses as of January 1 Contributions – Jan 1 to Mar 31
(53)
(538)
(2,407)
(519)
(15,331)
(611)
76
-
74
-
(245)
-
2,388
(70)
91
(68)
(1,495)
(44)
2,411
(608)
(2242)
(587)
(17,071)
(655) Employee future benefits
Liability as at March 31 4,545 3,862 3,532 1,142 957 761 13,910 13,248 12,622 19,597 18,067 16,915
Registered Pension Plans
Supplementary Retirement Plan
Post-employment Benefit Plan
Total
($000s) 2013 2012
2013 2012
2013 2012
2013 2012
Expenses for the year: Defined benefit plan: Service cost (employer portion) 2,089 2,244 161 163 466 450 2,716 2,857 Amortization of actuarial (gains)/losses 219 - (7) - (7) - 205 - Interest cost on accrued benefit obligation 5,149 5,196 37 33 486 467 5,672 5,696 Expected return on plan assets (4,679) (4,883) -
- - - (4,679) (4,883)
Total defined benefit expense 2,778 2,557 191 196 945 917 3,914 3,670 Defined contribution plan 402 405 - - - - 402 405 Total expenses 3,180 2,962 191 196 945 917 4,316 4,075
Contributions made to the plans: Pension plan contributions – Authority Pension plan contributions - employees
2,497
918
2,632
947
6
-
8
-
-
-
-
-
2,503
918
2,640
947
Payments made from all the plans as of January 1:
Pension benefits paid 4,328 4,145 - - - - 4,328 4,145 Termination benefits paid 3,916 1,376 - - - - 3,916 1,376
1-94 PUBLIC ACCOUNTS, 2012-2013
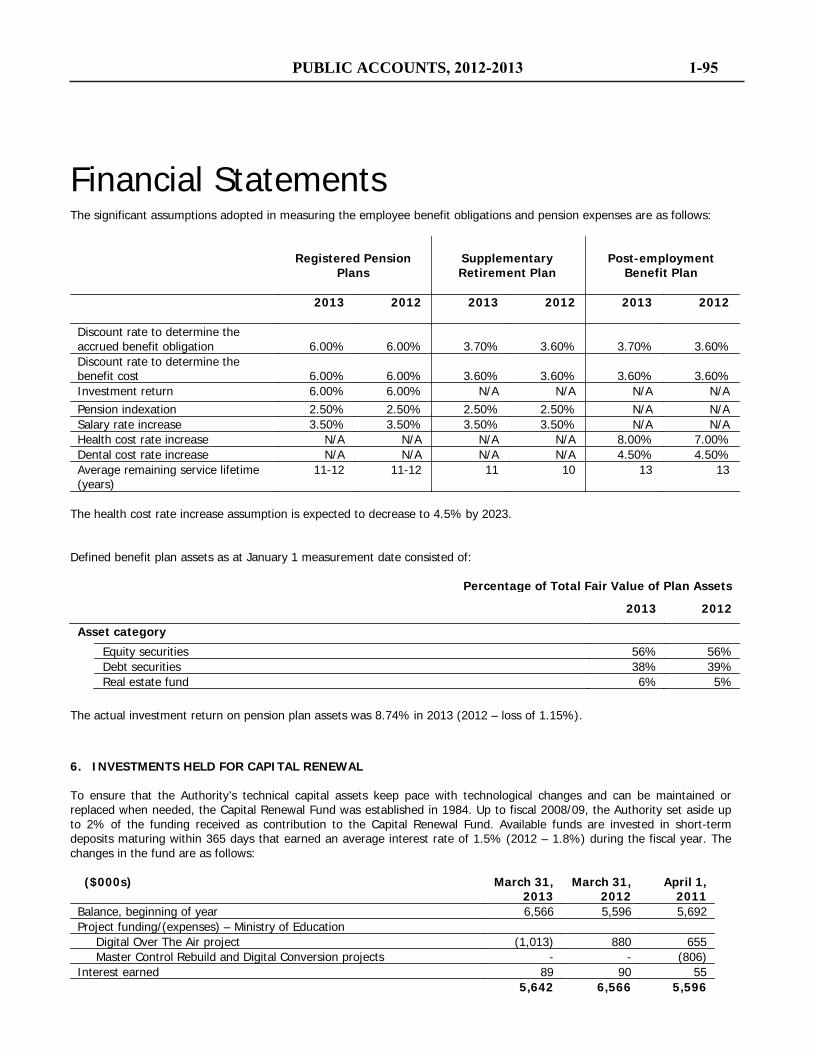
Financial Statements
The significant assumptions adopted in measuring the employee benefit obligations and pension expenses are as follows:
Registered Pension
Plans
Supplementary Retirement Plan
Post-employment Benefit Plan
2013 2012
2013 2012
2013 2012
Discount rate to determine the accrued benefit obligation 6.00% 6.00% 3.70% 3.60% 3.70% 3.60% Discount rate to determine the benefit cost 6.00% 6.00% 3.60% 3.60% 3.60% 3.60% Investment return 6.00% 6.00% N/A N/A N/A N/A Pension indexation 2.50% 2.50% 2.50% 2.50% N/A N/A Salary rate increase 3.50% 3.50% 3.50% 3.50% N/A N/A Health cost rate increase N/A N/A N/A N/A 8.00% 7.00% Dental cost rate increase N/A N/A N/A N/A 4.50% 4.50% Average remaining service lifetime (years)
11-12 11-12 11 10 13 13
The health cost rate increase assumption is expected to decrease to 4.5% by 2023.
Defined benefit plan assets as at January 1 measurement date consisted of: Percentage of Total Fair Value of Plan Assets
2013 2012
Asset category Equity securities 56% 56% Debt securities 38% 39% Real estate fund 6% 5%
The actual investment return on pension plan assets was 8.74% in 2013 (2012 – loss of 1.15%).
6. INVESTMENTS HELD FOR CAPITAL RENEWAL To ensure that the Authority’s technical capital assets keep pace with technological changes and can be maintained or replaced when needed, the Capital Renewal Fund was established in 1984. Up to fiscal 2008/09, the Authority set aside up to 2% of the funding received as contribution to the Capital Renewal Fund. Available funds are invested in short-term deposits maturing within 365 days that earned an average interest rate of 1.5% (2012 – 1.8%) during the fiscal year. The changes in the fund are as follows:
($000s) March 31,
2013 March 31,
2012 April 1,
2011 Balance, beginning of year 6,566 5,596 5,692 Project funding/(expenses) – Ministry of Education Digital Over The Air project (1,013) 880 655 Master Control Rebuild and Digital Conversion projects - - (806) Interest earned 89 90 55 5,642 6,566 5,596
PUBLIC ACCOUNTS, 2012-2013 1-95
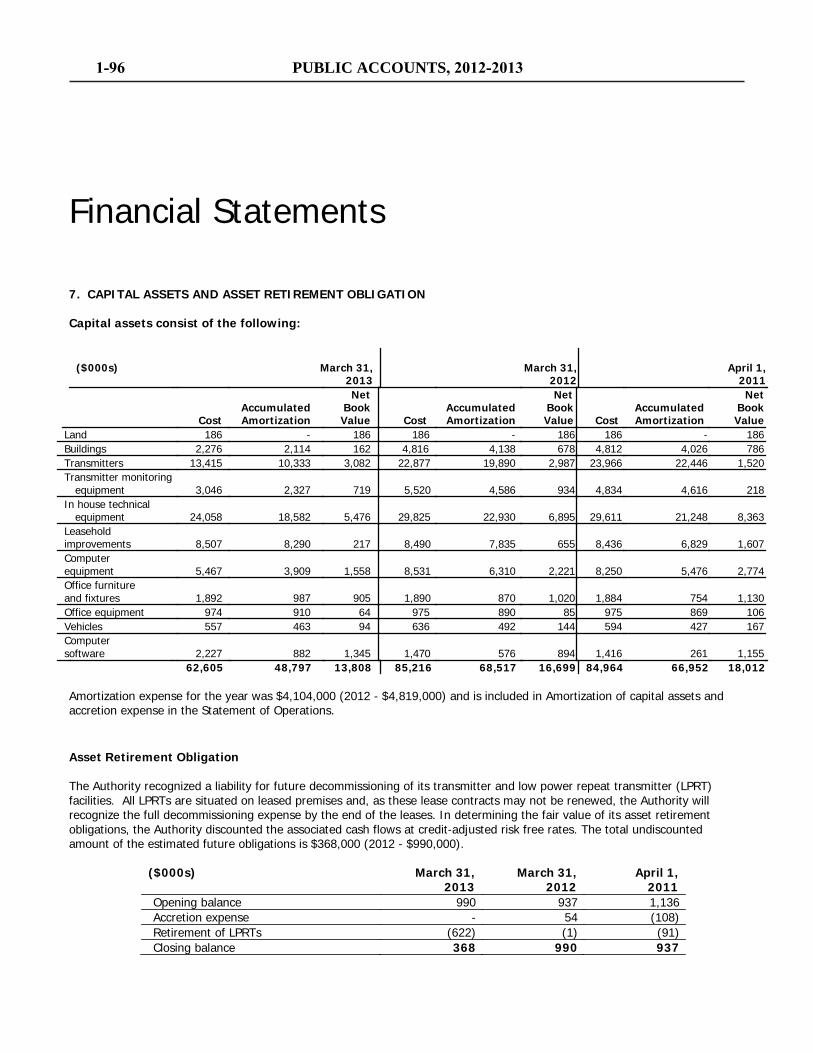
Financial Statements
7. CAPITAL ASSETS AND ASSET RETIREMENT OBLIGATION Capital assets consist of the following:
($000s) March 31, 2013
March 31, 2012
April 1,
2011
Cost
Accumulated Amortization
Net Book Value
Cost Accumulated Amortization
Net Book
Value
Cost Accumulated Amortization
Net
Book
Value Land 186 - 186 186 - 186 186 - 186 Buildings 2,276 2,114 162 4,816 4,138 678 4,812 4,026 786 Transmitters 13,415 10,333 3,082 22,877 19,890 2,987 23,966 22,446 1,520 Transmitter monitoring
equipment 3,046 2,327 719 5,520 4,586 934 4,834 4,616
218 In house technical
equipment 24,058 18,582 5,476 29,825 22,930 6,895 29,611 21,248
8,363 Leasehold improvements 8,507 8,290 217 8,490 7,835 655 8,436 6,829
1,607
Computer equipment 5,467 3,909 1,558 8,531 6,310 2,221 8,250 5,476
2,774
Office furniture and fixtures 1,892 987 905 1,890 870 1,020 1,884 754
1,130
Office equipment 974 910 64 975 890 85 975 869 106 Vehicles 557 463 94 636 492 144 594 427 167 Computer software 2,227 882 1,345 1,470 576 894 1,416 261
1,155
62,605 48,797 13,808 85,216 68,517 16,699 84,964 66,952 18,012 Amortization expense for the year was $4,104,000 (2012 - $4,819,000) and is included in Amortization of capital assets and accretion expense in the Statement of Operations. Asset Retirement Obligation The Authority recognized a liability for future decommissioning of its transmitter and low power repeat transmitter (LPRT) facilities. All LPRTs are situated on leased premises and, as these lease contracts may not be renewed, the Authority will recognize the full decommissioning expense by the end of the leases. In determining the fair value of its asset retirement obligations, the Authority discounted the associated cash flows at credit-adjusted risk free rates. The total undiscounted amount of the estimated future obligations is $368,000 (2012 - $990,000).
($000s) March 31, 2013
March 31, 2012
April 1, 2011
Opening balance 990 937 1,136 Accretion expense - 54 (108) Retirement of LPRTs (622) (1) (91) Closing balance 368 990 937
1-96 PUBLIC ACCOUNTS, 2012-2013
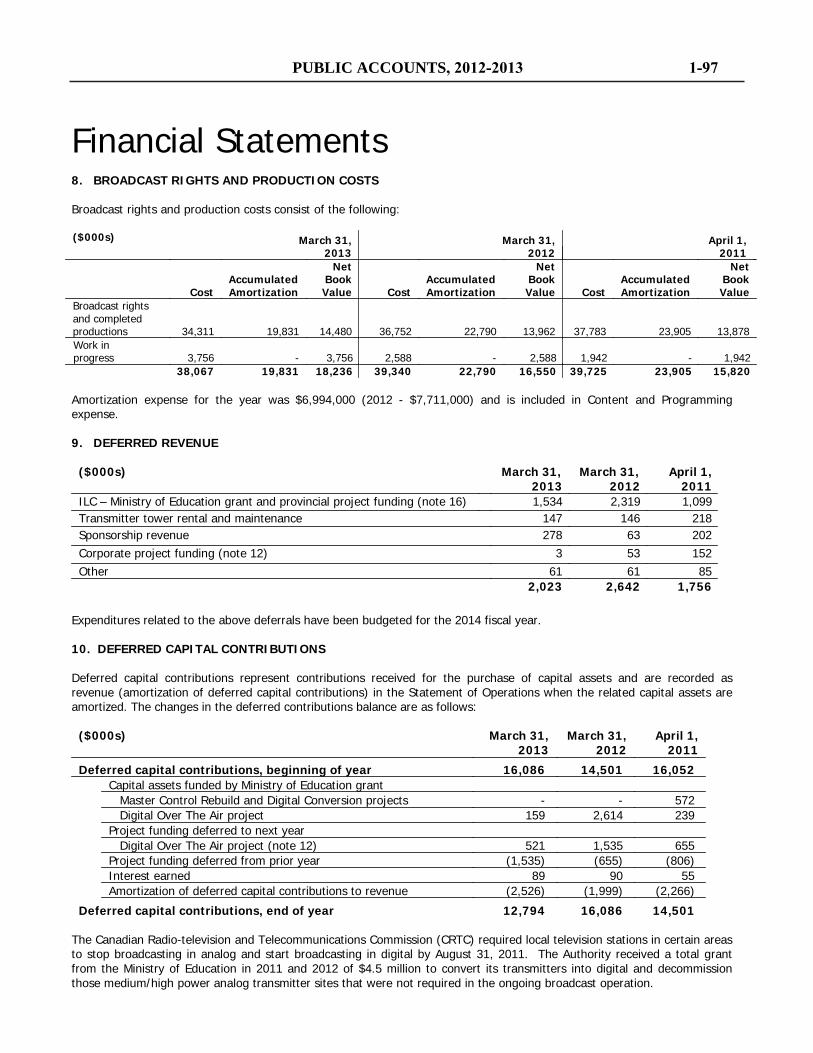
Financial Statements
8. BROADCAST RIGHTS AND PRODUCTION COSTS Broadcast rights and production costs consist of the following: ($000s) March 31,
2013 March 31,
2012 April 1,
2011
Cost Accumulated Amortization
Net Book Value Cost
Accumulated Amortization
Net Book Value Cost
Accumulated Amortization
Net Book Value
Broadcast rights and completed productions 34,311 19,831 14,480 36,752 22,790 13,962 37,783 23,905 13,878 Work in progress 3,756 - 3,756 2,588 - 2,588 1,942 - 1,942
38,067 19,831 18,236 39,340 22,790 16,550 39,725 23,905 15,820 Amortization expense for the year was $6,994,000 (2012 - $7,711,000) and is included in Content and Programming expense. 9. DEFERRED REVENUE
($000s)
March 31,
2013
March 31,
2012
April 1,
2011 ILC – Ministry of Education grant and provincial project funding (note 16) 1,534 2,319 1,099 Transmitter tower rental and maintenance 147 146 218 Sponsorship revenue 278 63 202 Corporate project funding (note 12) 3 53 152 Other 61 61 85
2,023 2,642 1,756 Expenditures related to the above deferrals have been budgeted for the 2014 fiscal year. 10. DEFERRED CAPITAL CONTRIBUTIONS Deferred capital contributions represent contributions received for the purchase of capital assets and are recorded as revenue (amortization of deferred capital contributions) in the Statement of Operations when the related capital assets are amortized. The changes in the deferred contributions balance are as follows:
($000s) March 31, 2013
March 31, 2012
April 1, 2011
Deferred capital contributions, beginning of year 16,086 14,501 16,052 Capital assets funded by Ministry of Education grant Master Control Rebuild and Digital Conversion projects - - 572 Digital Over The Air project 159 2,614 239 Project funding deferred to next year Digital Over The Air project (note 12) 521 1,535 655 Project funding deferred from prior year (1,535) (655) (806) Interest earned 89 90 55 Amortization of deferred capital contributions to revenue (2,526) (1,999) (2,266)
Deferred capital contributions, end of year 12,794 16,086 14,501 The Canadian Radio-television and Telecommunications Commission (CRTC) required local television stations in certain areas to stop broadcasting in analog and start broadcasting in digital by August 31, 2011. The Authority received a total grant from the Ministry of Education in 2011 and 2012 of $4.5 million to convert its transmitters into digital and decommission those medium/high power analog transmitter sites that were not required in the ongoing broadcast operation.
PUBLIC ACCOUNTS, 2012-2013 1-97
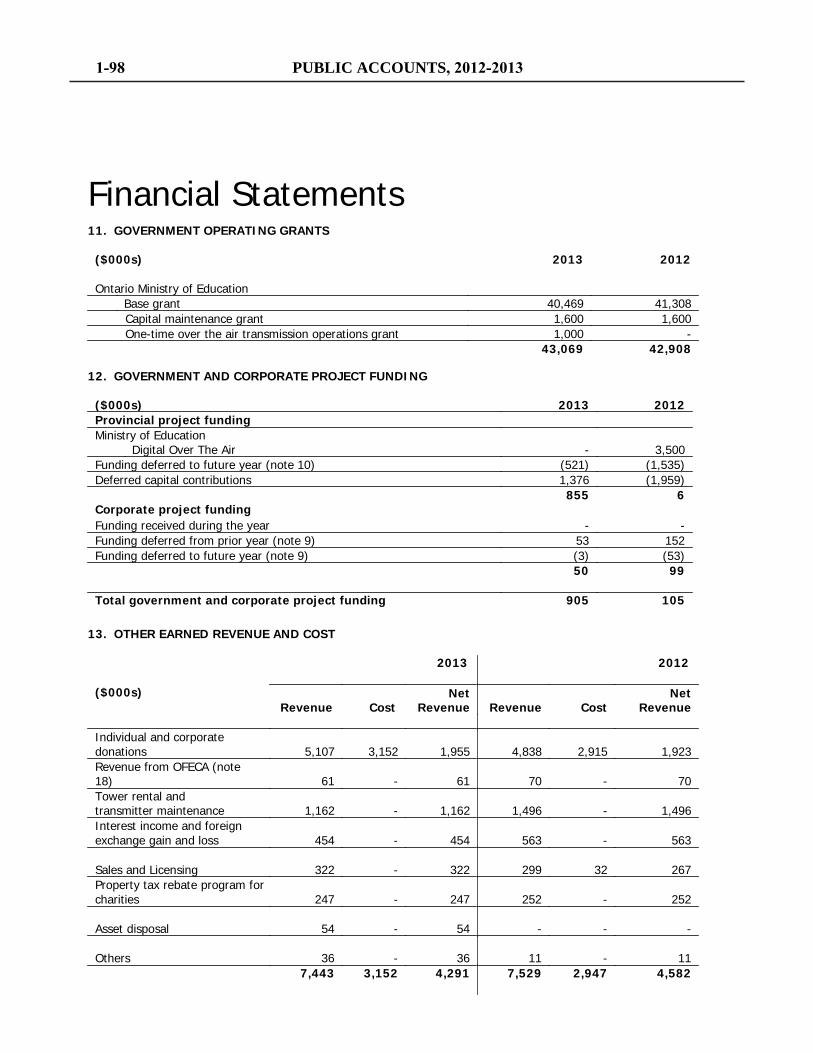
Financial Statements
11. GOVERNMENT OPERATING GRANTS
($000s) 2013 2012 Ontario Ministry of Education Base grant 40,469 41,308
Capital maintenance grant 1,600 1,600 One-time over the air transmission operations grant 1,000 -
43,069 42,908
12. GOVERNMENT AND CORPORATE PROJECT FUNDING
($000s) 2013 2012 Provincial project funding Ministry of Education Digital Over The Air - 3,500 Funding deferred to future year (note 10) (521) (1,535) Deferred capital contributions 1,376 (1,959)
855 6 Corporate project funding Funding received during the year - - Funding deferred from prior year (note 9) 53 152 Funding deferred to future year (note 9) (3) (53) 50 99 Total government and corporate project funding 905 105
13. OTHER EARNED REVENUE AND COST
2013
2012
($000s)
Revenue Cost Net
Revenue Revenue Cost Net
Revenue Individual and corporate donations 5,107 3,152 1,955 4,838 2,915 1,923 Revenue from OFECA (note 18) 61 - 61 70 - 70 Tower rental and transmitter maintenance 1,162 - 1,162 1,496 - 1,496 Interest income and foreign exchange gain and loss 454 - 454 563 - 563
Sales and Licensing 322 - 322 299
32
267 Property tax rebate program for charities 247 - 247 252 - 252
Asset disposal 54 - 54 - - -
Others 36 - 36 11 - 11 7,443 3,152 4,291 7,529 2,947 4,582
1-98 PUBLIC ACCOUNTS, 2012-2013
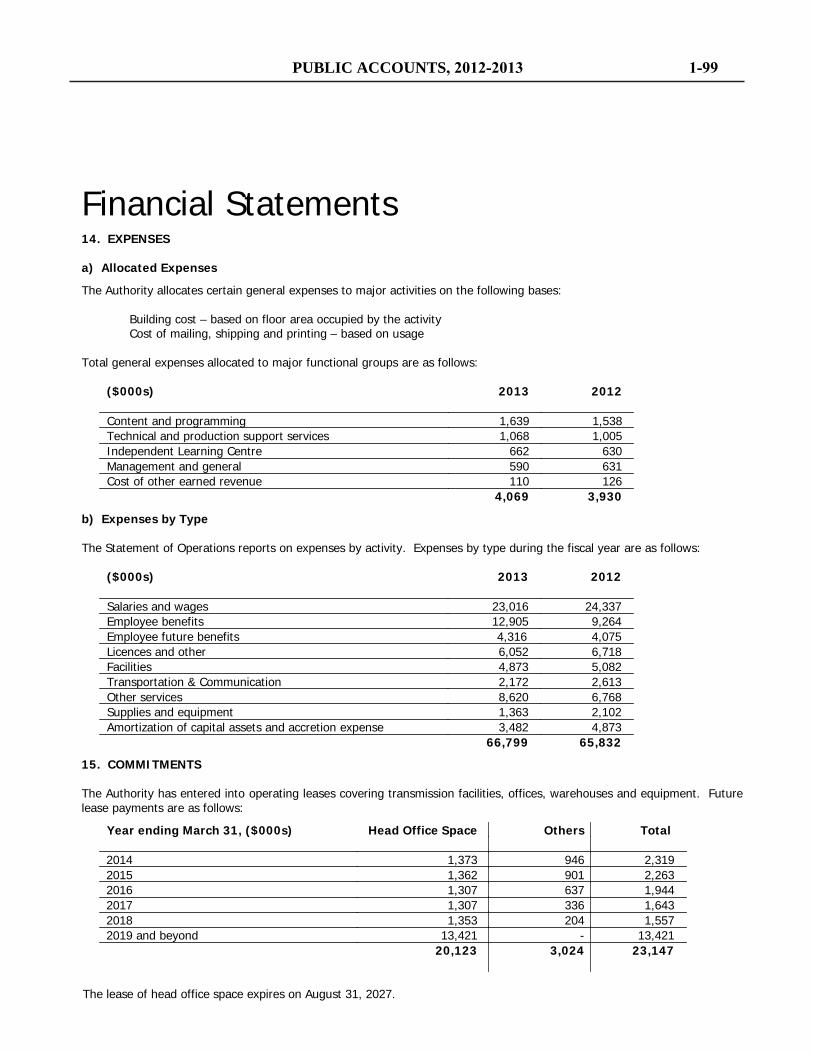
Financial Statements
14. EXPENSES
a) Allocated Expenses
The Authority allocates certain general expenses to major activities on the following bases: Building cost – based on floor area occupied by the activity Cost of mailing, shipping and printing – based on usage Total general expenses allocated to major functional groups are as follows:
($000s) 2013 2012 Content and programming 1,639 1,538 Technical and production support services 1,068 1,005 Independent Learning Centre 662 630 Management and general 590 631 Cost of other earned revenue 110 126 4,069 3,930
b) Expenses by Type The Statement of Operations reports on expenses by activity. Expenses by type during the fiscal year are as follows:
15. COMMITMENTS
The Authority has entered into operating leases covering transmission facilities, offices, warehouses and equipment. Future lease payments are as follows:
Year ending March 31, ($000s) Head Office Space Others Total 2014 1,373 946 2,319 2015 1,362 901 2,263 2016 1,307 637 1,944 2017 1,307 336 1,643 2018 1,353 204 1,557 2019 and beyond 13,421 - 13,421 20,123 3,024
23,147
The lease of head office space expires on August 31, 2027.
($000s) 2013 2012 Salaries and wages 23,016 24,337 Employee benefits 12,905 9,264 Employee future benefits 4,316 4,075 Licences and other 6,052 6,718 Facilities 4,873 5,082 Transportation & Communication 2,172 2,613 Other services 8,620 6,768 Supplies and equipment 1,363 2,102 Amortization of capital assets and accretion expense 3,482 4,873 66,799 65,832
PUBLIC ACCOUNTS, 2012-2013 1-99
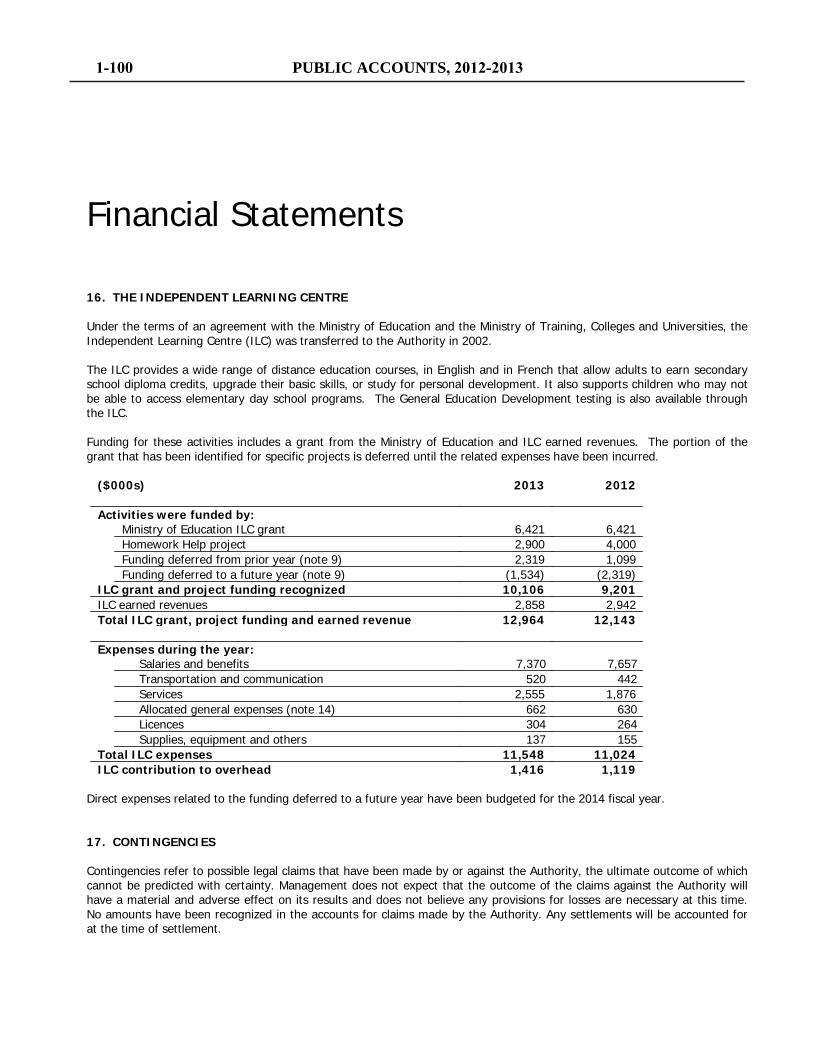
Financial Statements
16. THE INDEPENDENT LEARNING CENTRE
Under the terms of an agreement with the Ministry of Education and the Ministry of Training, Colleges and Universities, the Independent Learning Centre (ILC) was transferred to the Authority in 2002.
The ILC provides a wide range of distance education courses, in English and in French that allow adults to earn secondary school diploma credits, upgrade their basic skills, or study for personal development. It also supports children who may not be able to access elementary day school programs. The General Education Development testing is also available through the ILC.
Funding for these activities includes a grant from the Ministry of Education and ILC earned revenues. The portion of the grant that has been identified for specific projects is deferred until the related expenses have been incurred.
($000s)
2013 2012
Activities were funded by: Ministry of Education ILC grant 6,421 6,421 Homework Help project 2,900 4,000 Funding deferred from prior year (note 9) 2,319 1,099 Funding deferred to a future year (note 9) (1,534) (2,319) ILC grant and project funding recognized 10,106 9,201 ILC earned revenues 2,858 2,942 Total ILC grant, project funding and earned revenue 12,964 12,143 Expenses during the year: Salaries and benefits 7,370 7,657 Transportation and communication 520 442 Services 2,555 1,876 Allocated general expenses (note 14) 662 630 Licences 304 264 Supplies, equipment and others 137 155 Total ILC expenses 11,548 11,024 ILC contribution to overhead 1,416 1,119
Direct expenses related to the funding deferred to a future year have been budgeted for the 2014 fiscal year. 17. CONTINGENCIES Contingencies refer to possible legal claims that have been made by or against the Authority, the ultimate outcome of which cannot be predicted with certainty. Management does not expect that the outcome of the claims against the Authority will have a material and adverse effect on its results and does not believe any provisions for losses are necessary at this time. No amounts have been recognized in the accounts for claims made by the Authority. Any settlements will be accounted for at the time of settlement.
1-100 PUBLIC ACCOUNTS, 2012-2013
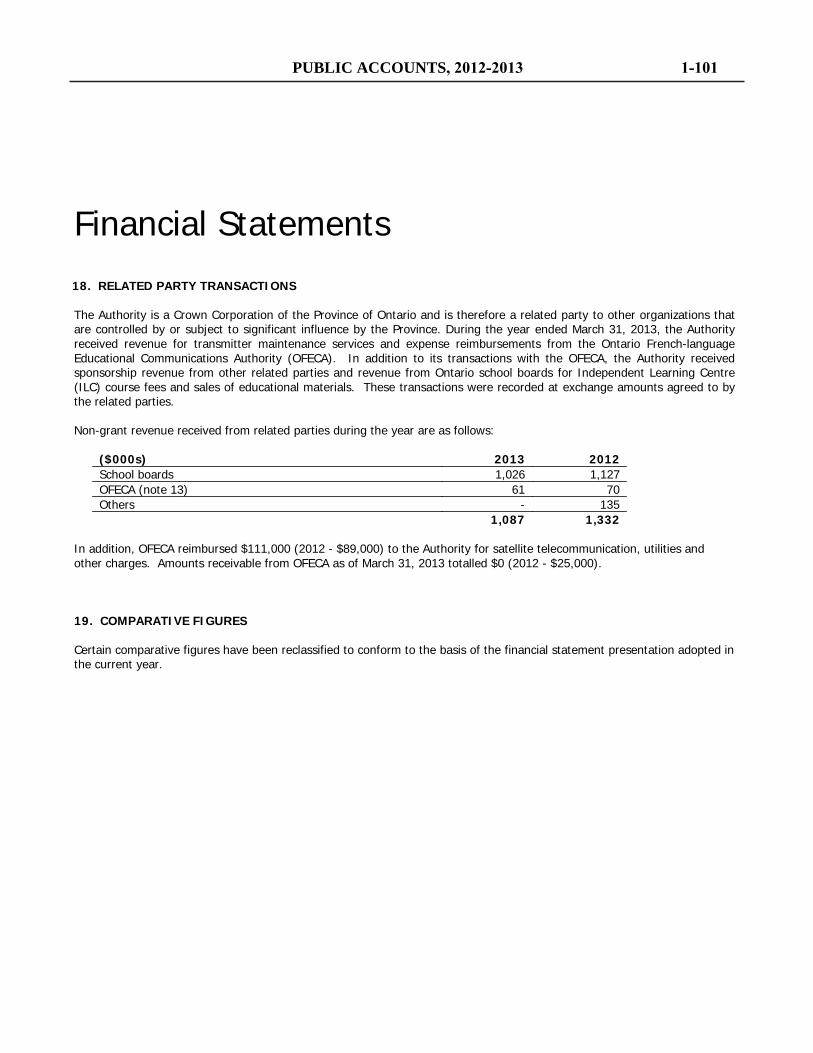
Financial Statements
18. RELATED PARTY TRANSACTIONS
The Authority is a Crown Corporation of the Province of Ontario and is therefore a related party to other organizations that are controlled by or subject to significant influence by the Province. During the year ended March 31, 2013, the Authority received revenue for transmitter maintenance services and expense reimbursements from the Ontario French-language Educational Communications Authority (OFECA). In addition to its transactions with the OFECA, the Authority received sponsorship revenue from other related parties and revenue from Ontario school boards for Independent Learning Centre (ILC) course fees and sales of educational materials. These transactions were recorded at exchange amounts agreed to by the related parties.
Non-grant revenue received from related parties during the year are as follows:
($000s) 2013 2012 School boards 1,026 1,127 OFECA (note 13) 61 70 Others - 135 1,087 1,332
In addition, OFECA reimbursed $111,000 (2012 - $89,000) to the Authority for satellite telecommunication, utilities and other charges. Amounts receivable from OFECA as of March 31, 2013 totalled $0 (2012 - $25,000). 19. COMPARATIVE FIGURES Certain comparative figures have been reclassified to conform to the basis of the financial statement presentation adopted in the current year.
PUBLIC ACCOUNTS, 2012-2013 1-101

Ontario Electricity Financial Corporation
Financial Statements
Responsibility for Financial Reporting
The accompanying financial statements of OEFC have been prepared in accordance with Canadian public sector accounting standards and are management’s responsibility. The preparation of financial statements necessarily involves the use of estimates based on management’s judgment, particularly when transactions affecting the current accounting period cannot be finalized with certainty until future periods. The financial statements have been properly prepared within reasonable limits of materiality and in light of information available up to June 21, 2013. Management maintains a system of internal controls designed to provide reasonable assurance that the assets are safeguarded and that reliable financial information is available on a timely basis. The system includes formal policies and procedures and an organizational structure that provides for appropriate delegation of authority and segregation of responsibilities. The Ontario Internal Audit Division of the Ministry of Finance independently evaluates the effectiveness of these internal controls on an ongoing basis and reports its findings to management and the Audit Committee of the Board. The Board is responsible for ensuring management fulfills its responsibilities for financial reporting and internal controls. The Audit Committee assists the Board in carrying out these responsibilities. The Audit Committee periodically meets with management, the internal auditors and the external auditors to deal with issues raised by them, and to review the financial statements before recommending Board approval. The financial statements have been audited by the Auditor General of Ontario (the Auditor). The Auditor’s responsibility is to express an opinion on whether OEFC’s financial statements fairly present OEFC’s financial position in accordance with Canadian public sector accounting standards. The Auditor’s Report, which appears on the following page, outlines the scope of the Auditor’s examination and his opinion. On behalf of management:
Gadi Mayman Ken Kandeepan Vice-Chair and Chief Executive Officer Chief Financial Officer
PUBLIC ACCOUNTS, 2012-2013 1-103
Auditor’s Report
Office of the Auditor General of Ontario Bureau du vérificateur général de l’Ontario Independent Auditor’s Report To the Ontario Electricity Financial Corporation and to the Minister of Finance I have audited the accompanying financial statements of the Ontario Electricity Financial Corporation, which comprise the statement of financial position as at March 31, 2013, and the statements of operations and cash flow for the year then ended, and a summary of significant accounting policies and other explanatory information. Management’s Responsibility for the Financial Statements Management is responsible for the preparation and fair presentation of these financial statements in accordance with Canadian public sector accounting standards, and for such internal control as management determines is necessary to enable the preparation of financial statements that are free from material misstatement, whether due to fraud or error. Auditor’s Responsibility My responsibility is to express an opinion on these financial statements based on my audit. I conducted my audit in accordance with Canadian generally accepted auditing standards. Those standards require that I comply with ethical requirements and plan and perform the audit to obtain reasonable assurance about whether the financial statements are free from material misstatement. An audit involves performing procedures to obtain audit evidence about the amounts and disclosures in the financial statements. The procedures selected depend on the auditor’s judgment, including the assessment of the risks of material misstatement of the financial statements, whether due to fraud or error. In making those risk assessments, the auditor considers internal control relevant to the entity’s preparation of the financial statements in order to design audit procedures that are appropriate in the circumstances, but not for the purpose of expressing an opinion on the effectiveness of the entity’s internal control. An audit also includes evaluating the appropriateness of accounting policies used and the reasonableness of accounting estimates made by management, as well as evaluating the overall presentation of the financial statements. I believe that the audit evidence I have obtained is sufficient and appropriate to provide a basis for my opinion. Opinion In my opinion, these financial statements present fairly, in all material respects, the financial position of the Ontario Electricity Financial Corporation as at March 31, 2013 and the results of its operations, and its cash flow for the year then ended in accordance with Canadian public sector accounting standards.
Toronto, Ontario Gary Peall, CPA, CA, LPA June 21, 2013 Acting Auditor General
1-104 PUBLIC ACCOUNTS, 2012-2013
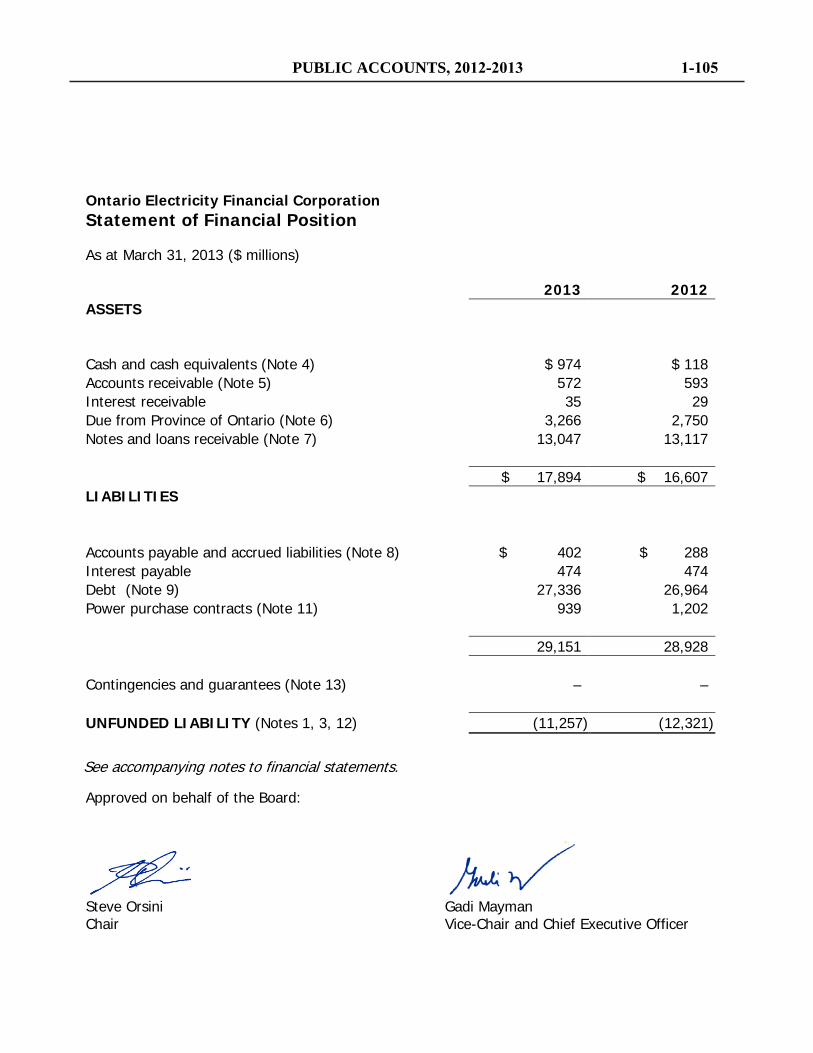
Ontario Electricity Financial Corporation Statement of Financial Position
As at March 31, 2013 ($ millions)
Approved on behalf of the Board:
Steve Orsini Gadi Mayman Chair Vice-Chair and Chief Executive Officer
See accompanying notes to financial statements.
2013 2012 ASSETS Cash and cash equivalents (Note 4) $ 974 $ 118 Accounts receivable (Note 5) 572 593 Interest receivable 35 29 Due from Province of Ontario (Note 6) 3,266 2,750 Notes and loans receivable (Note 7) 13,047 13,117 $ 17,894 $ 16,607 LIABILITIES Accounts payable and accrued liabilities (Note 8) $ 402 $ 288 Interest payable 474 474 Debt (Note 9) 27,336 26,964 Power purchase contracts (Note 11) 939 1,202 29,151 28,928 Contingencies and guarantees (Note 13) – – UNFUNDED LIABILITY (Notes 1, 3, 12) (11,257) (12,321)
PUBLIC ACCOUNTS, 2012-2013 1-105
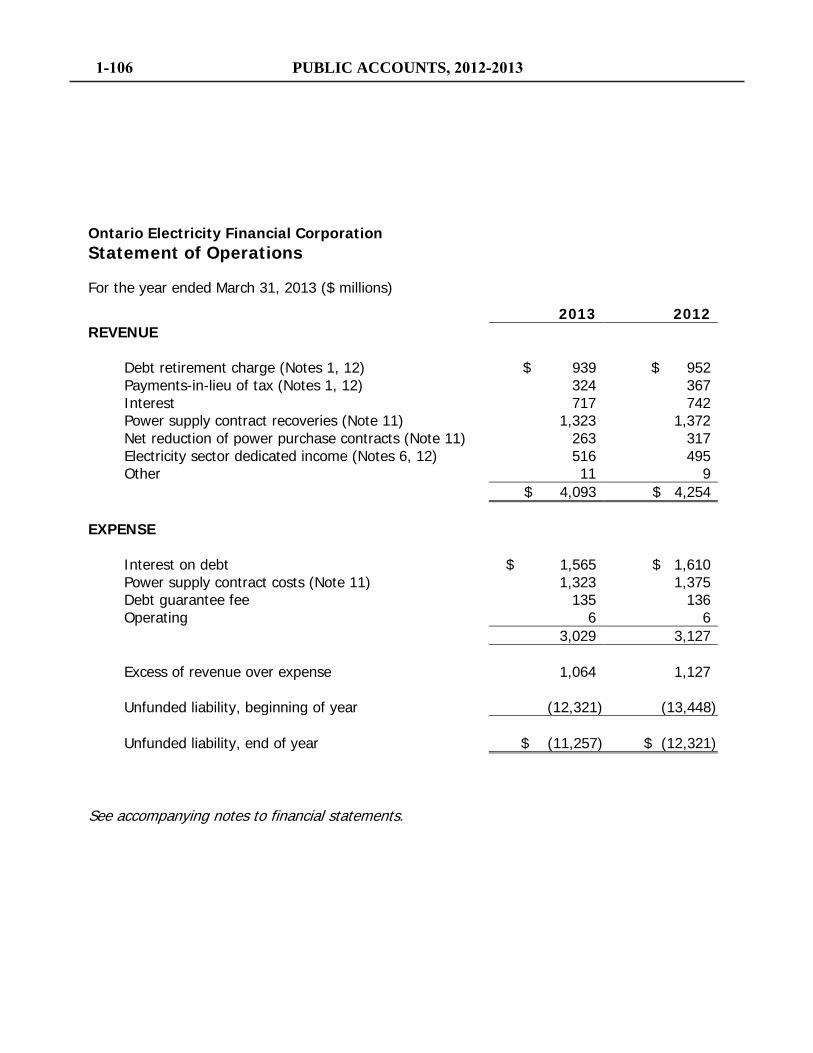
Ontario Electricity Financial Corporation Statement of Operations
For the year ended March 31, 2013 ($ millions)
See accompanying notes to financial statements.
2013 2012 REVENUE Debt retirement charge (Notes 1, 12) $ 939 $ 952 Payments-in-lieu of tax (Notes 1, 12) 324 367 Interest 717 742 Power supply contract recoveries (Note 11) 1,323 1,372 Net reduction of power purchase contracts (Note 11) 263 317 Electricity sector dedicated income (Notes 6, 12) 516 495 Other 11 9 $ 4,093 $ 4,254 EXPENSE Interest on debt $ 1,565 $ 1,610
Power supply contract costs (Note 11) 1,323 1,375 Debt guarantee fee 135 136 Operating 6 6 3,029 3,127 Excess of revenue over expense 1,064 1,127 Unfunded liability, beginning of year (12,321) (13,448) Unfunded liability, end of year $ (11,257) $ (12,321)
1-106 PUBLIC ACCOUNTS, 2012-2013
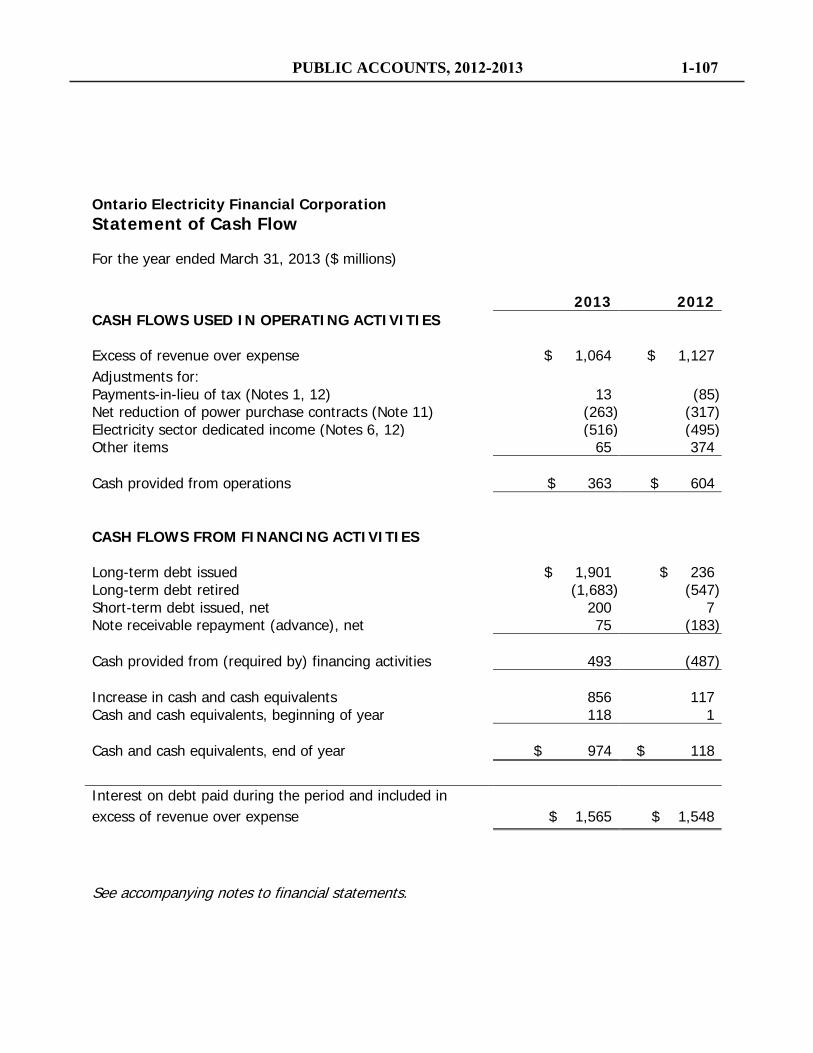
Ontario Electricity Financial Corporation Statement of Cash Flow
For the year ended March 31, 2013 ($ millions)
See accompanying notes to financial statements.
2013 2012 CASH FLOWS USED IN OPERATING ACTIVITIES
Excess of revenue over expense $ 1,064 $ 1,127 Adjustments for: Payments-in-lieu of tax (Notes 1, 12) 13 (85) Net reduction of power purchase contracts (Note 11) (263) (317) Electricity sector dedicated income (Notes 6, 12) (516) (495) Other items 65 374 Cash provided from operations $ 363 $ 604 CASH FLOWS FROM FINANCING ACTIVITIES Long-term debt issued $ 1,901 $ 236 Long-term debt retired (1,683) (547) Short-term debt issued, net 200 7 Note receivable repayment (advance), net 75 (183) Cash provided from (required by) financing activities 493 (487) Increase in cash and cash equivalents 856 117 Cash and cash equivalents, beginning of year 118 1 Cash and cash equivalents, end of year $ 974 $ 118
Interest on debt paid during the period and included in excess of revenue over expense $ 1,565 $ 1,548
PUBLIC ACCOUNTS, 2012-2013 1-107
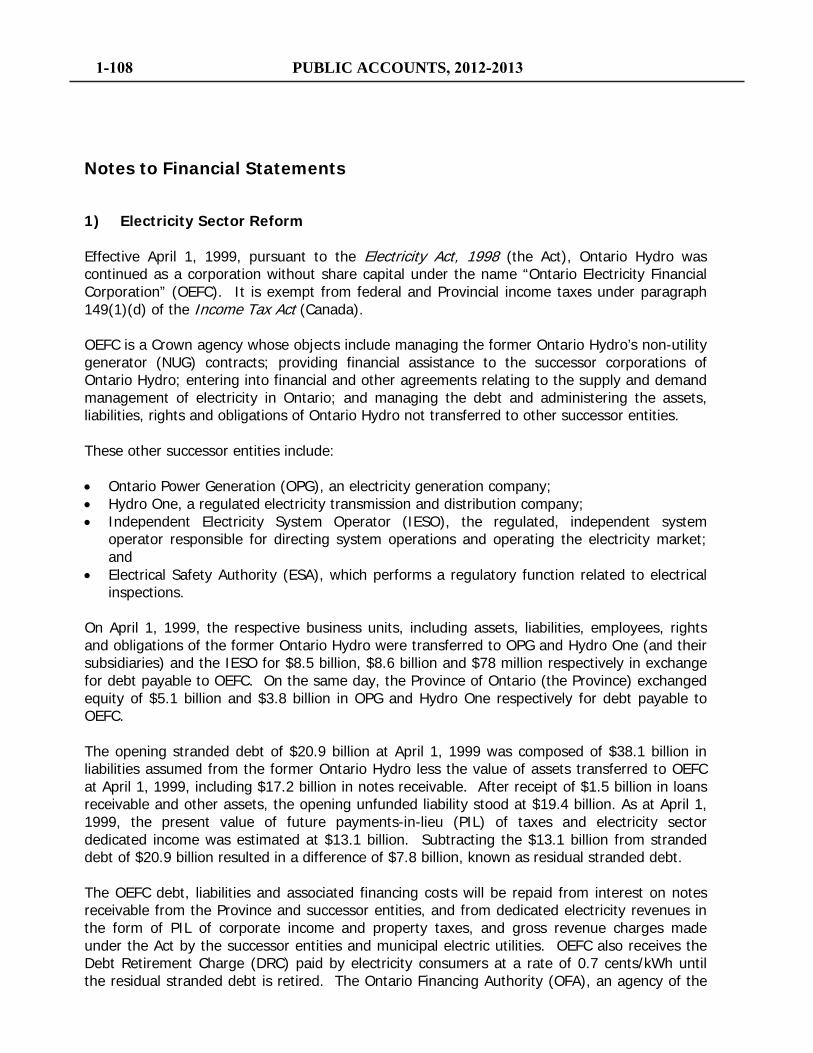
Notes to Financial Statements
1) Electricity Sector Reform Effective April 1, 1999, pursuant to the Electricity Act, 1998 (the Act), Ontario Hydro was continued as a corporation without share capital under the name “Ontario Electricity Financial Corporation” (OEFC). It is exempt from federal and Provincial income taxes under paragraph 149(1)(d) of the Income Tax Act (Canada). OEFC is a Crown agency whose objects include managing the former Ontario Hydro’s non-utility generator (NUG) contracts; providing financial assistance to the successor corporations of Ontario Hydro; entering into financial and other agreements relating to the supply and demand management of electricity in Ontario; and managing the debt and administering the assets, liabilities, rights and obligations of Ontario Hydro not transferred to other successor entities. These other successor entities include: • Ontario Power Generation (OPG), an electricity generation company; • Hydro One, a regulated electricity transmission and distribution company; • Independent Electricity System Operator (IESO), the regulated, independent system
operator responsible for directing system operations and operating the electricity market; and
• Electrical Safety Authority (ESA), which performs a regulatory function related to electrical inspections.
On April 1, 1999, the respective business units, including assets, liabilities, employees, rights and obligations of the former Ontario Hydro were transferred to OPG and Hydro One (and their subsidiaries) and the IESO for $8.5 billion, $8.6 billion and $78 million respectively in exchange for debt payable to OEFC. On the same day, the Province of Ontario (the Province) exchanged equity of $5.1 billion and $3.8 billion in OPG and Hydro One respectively for debt payable to OEFC. The opening stranded debt of $20.9 billion at April 1, 1999 was composed of $38.1 billion in liabilities assumed from the former Ontario Hydro less the value of assets transferred to OEFC at April 1, 1999, including $17.2 billion in notes receivable. After receipt of $1.5 billion in loans receivable and other assets, the opening unfunded liability stood at $19.4 billion. As at April 1, 1999, the present value of future payments-in-lieu (PIL) of taxes and electricity sector dedicated income was estimated at $13.1 billion. Subtracting the $13.1 billion from stranded debt of $20.9 billion resulted in a difference of $7.8 billion, known as residual stranded debt. The OEFC debt, liabilities and associated financing costs will be repaid from interest on notes receivable from the Province and successor entities, and from dedicated electricity revenues in the form of PIL of corporate income and property taxes, and gross revenue charges made under the Act by the successor entities and municipal electric utilities. OEFC also receives the Debt Retirement Charge (DRC) paid by electricity consumers at a rate of 0.7 cents/kWh until the residual stranded debt is retired. The Ontario Financing Authority (OFA), an agency of the
1-108 PUBLIC ACCOUNTS, 2012-2013
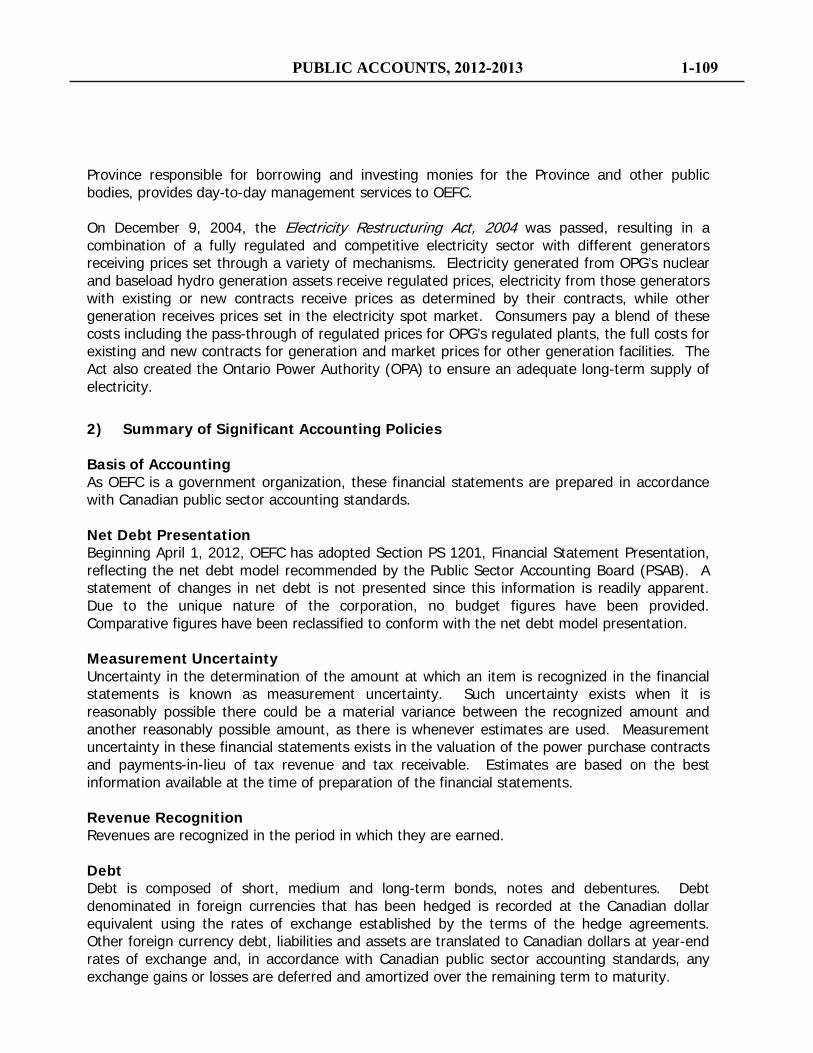
Province responsible for borrowing and investing monies for the Province and other public bodies, provides day-to-day management services to OEFC. On December 9, 2004, the Electricity Restructuring Act, 2004 was passed, resulting in a combination of a fully regulated and competitive electricity sector with different generators receiving prices set through a variety of mechanisms. Electricity generated from OPG’s nuclear and baseload hydro generation assets receive regulated prices, electricity from those generators with existing or new contracts receive prices as determined by their contracts, while other generation receives prices set in the electricity spot market. Consumers pay a blend of these costs including the pass-through of regulated prices for OPG’s regulated plants, the full costs for existing and new contracts for generation and market prices for other generation facilities. The Act also created the Ontario Power Authority (OPA) to ensure an adequate long-term supply of electricity. 2) Summary of Significant Accounting Policies Basis of Accounting As OEFC is a government organization, these financial statements are prepared in accordance with Canadian public sector accounting standards. Net Debt Presentation Beginning April 1, 2012, OEFC has adopted Section PS 1201, Financial Statement Presentation, reflecting the net debt model recommended by the Public Sector Accounting Board (PSAB). A statement of changes in net debt is not presented since this information is readily apparent. Due to the unique nature of the corporation, no budget figures have been provided. Comparative figures have been reclassified to conform with the net debt model presentation. Measurement Uncertainty Uncertainty in the determination of the amount at which an item is recognized in the financial statements is known as measurement uncertainty. Such uncertainty exists when it is reasonably possible there could be a material variance between the recognized amount and another reasonably possible amount, as there is whenever estimates are used. Measurement uncertainty in these financial statements exists in the valuation of the power purchase contracts and payments-in-lieu of tax revenue and tax receivable. Estimates are based on the best information available at the time of preparation of the financial statements. Revenue Recognition Revenues are recognized in the period in which they are earned. Debt Debt is composed of short, medium and long-term bonds, notes and debentures. Debt denominated in foreign currencies that has been hedged is recorded at the Canadian dollar equivalent using the rates of exchange established by the terms of the hedge agreements. Other foreign currency debt, liabilities and assets are translated to Canadian dollars at year-end rates of exchange and, in accordance with Canadian public sector accounting standards, any exchange gains or losses are deferred and amortized over the remaining term to maturity.
PUBLIC ACCOUNTS, 2012-2013 1-109
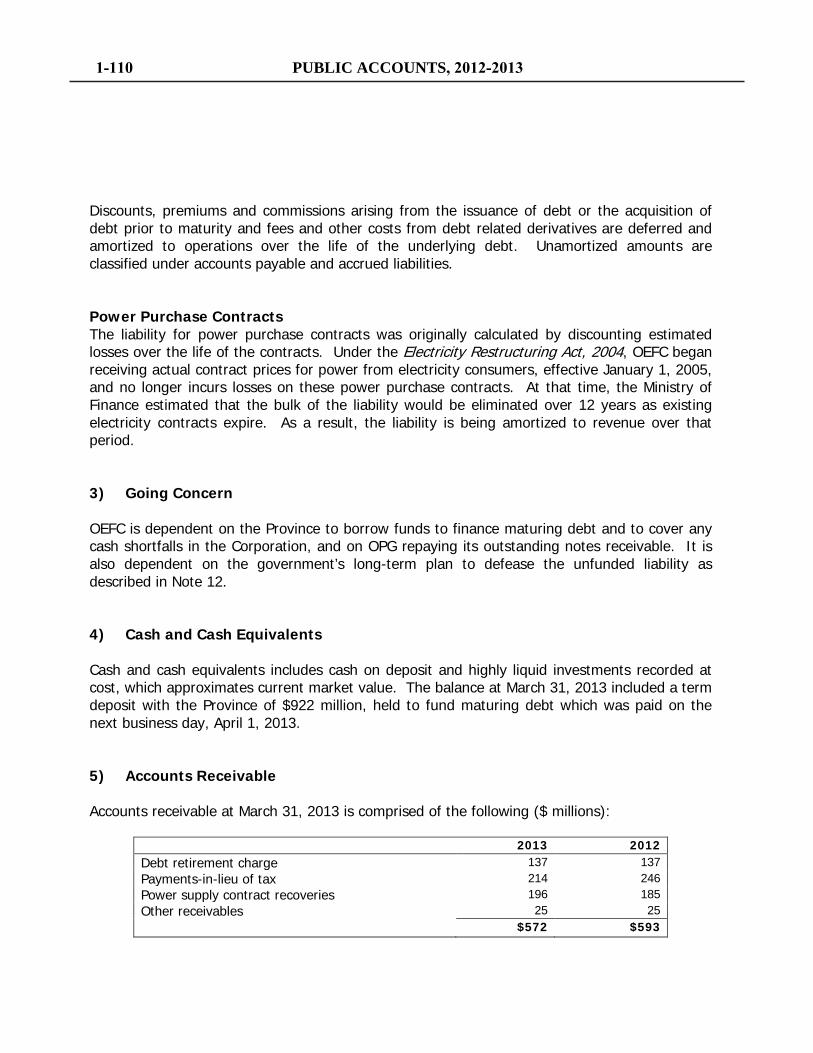
Discounts, premiums and commissions arising from the issuance of debt or the acquisition of debt prior to maturity and fees and other costs from debt related derivatives are deferred and amortized to operations over the life of the underlying debt. Unamortized amounts are classified under accounts payable and accrued liabilities. Power Purchase Contracts The liability for power purchase contracts was originally calculated by discounting estimated losses over the life of the contracts. Under the Electricity Restructuring Act, 2004, OEFC began receiving actual contract prices for power from electricity consumers, effective January 1, 2005, and no longer incurs losses on these power purchase contracts. At that time, the Ministry of Finance estimated that the bulk of the liability would be eliminated over 12 years as existing electricity contracts expire. As a result, the liability is being amortized to revenue over that period. 3) Going Concern OEFC is dependent on the Province to borrow funds to finance maturing debt and to cover any cash shortfalls in the Corporation, and on OPG repaying its outstanding notes receivable. It is also dependent on the government’s long-term plan to defease the unfunded liability as described in Note 12. 4) Cash and Cash Equivalents Cash and cash equivalents includes cash on deposit and highly liquid investments recorded at cost, which approximates current market value. The balance at March 31, 2013 included a term deposit with the Province of $922 million, held to fund maturing debt which was paid on the next business day, April 1, 2013. 5) Accounts Receivable
Accounts receivable at March 31, 2013 is comprised of the following ($ millions):
2013 2012 Debt retirement charge 137 137 Payments-in-lieu of tax 214 246 Power supply contract recoveries 196 185 Other receivables 25 25
$572 $593
1-110 PUBLIC ACCOUNTS, 2012-2013
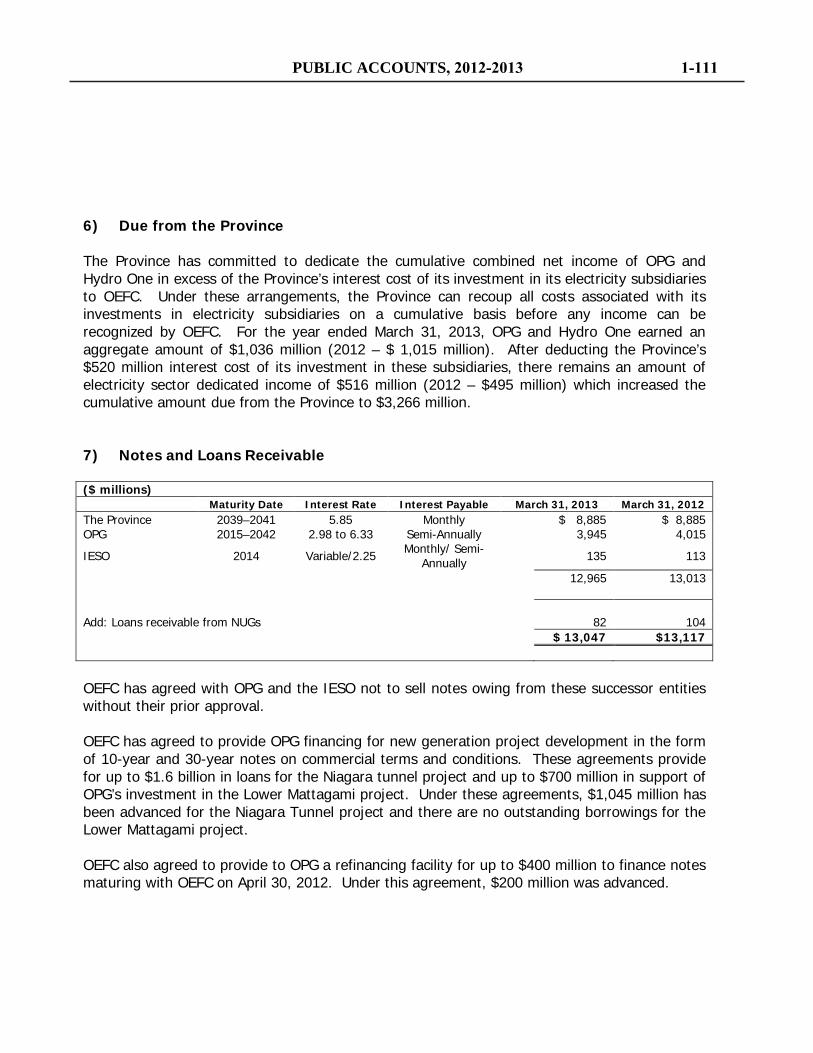
6) Due from the Province The Province has committed to dedicate the cumulative combined net income of OPG and Hydro One in excess of the Province’s interest cost of its investment in its electricity subsidiaries to OEFC. Under these arrangements, the Province can recoup all costs associated with its investments in electricity subsidiaries on a cumulative basis before any income can be recognized by OEFC. For the year ended March 31, 2013, OPG and Hydro One earned an aggregate amount of $1,036 million (2012 – $ 1,015 million). After deducting the Province’s $520 million interest cost of its investment in these subsidiaries, there remains an amount of electricity sector dedicated income of $516 million (2012 – $495 million) which increased the cumulative amount due from the Province to $3,266 million. 7) Notes and Loans Receivable ($ millions) Maturity Date Interest Rate Interest Payable March 31, 2013 March 31, 2012 The Province 2039–2041 5.85 Monthly $ 8,885 $ 8,885 OPG 2015–2042 2.98 to 6.33 Semi-Annually 3,945 4,015
IESO 2014 Variable/2.25 Monthly/ Semi-Annually 135 113
12,965 13,013 Add: Loans receivable from NUGs 82 104 $ 13,047 $13,117 OEFC has agreed with OPG and the IESO not to sell notes owing from these successor entities without their prior approval. OEFC has agreed to provide OPG financing for new generation project development in the form of 10-year and 30-year notes on commercial terms and conditions. These agreements provide for up to $1.6 billion in loans for the Niagara tunnel project and up to $700 million in support of OPG’s investment in the Lower Mattagami project. Under these agreements, $1,045 million has been advanced for the Niagara Tunnel project and there are no outstanding borrowings for the Lower Mattagami project. OEFC also agreed to provide to OPG a refinancing facility for up to $400 million to finance notes maturing with OEFC on April 30, 2012. Under this agreement, $200 million was advanced.
PUBLIC ACCOUNTS, 2012-2013 1-111

Set out below is a summary by year of maturity of OPG’s debt to OEFC:
Fiscal Year
Amount ($ millions)
2014–15 300
2015–16 200
2016–17 320
2017–18 1,125
2018–19 260
2019–20 505
2020–21 420
2021–22 185
2022–23 130
2040–41 150
2041–42 350
Total $ 3,945
OEFC refinanced a note receivable with the IESO for $78.2 million for a term of one year originally maturing on April 30, 2013. In October 2011, OEFC increased its revolving credit facility to the IESO from $60 million to $110 million. In April 2013, OEFC extended the expiry date of the credit facility to April 30, 2014. The credit facility bears interest at a floating rate equal to the Province’s cost of borrowing for a 30 day term plus 50 basis points. The facility will be used for liquidity purposes and to temporarily fund corporate requirements. At March 31, 2013, IESO had drawn $57 million on the credit facility. Loans receivable from NUGs decreased during the year by $22 million to $82 million (2012 – $104 million), primarily due to repayment of loan principal. 8) Accounts Payable and Accrued Liabilities Accounts Payable and accrued liabilities at March 31, 2013 is comprised of the following ($ millions):
2013 2012 Power supply contract costs 289 188 Payments-in-lieu of tax refundable 60 79 Other liabilities 53 21 $402 $288
1-112 PUBLIC ACCOUNTS, 2012-2013
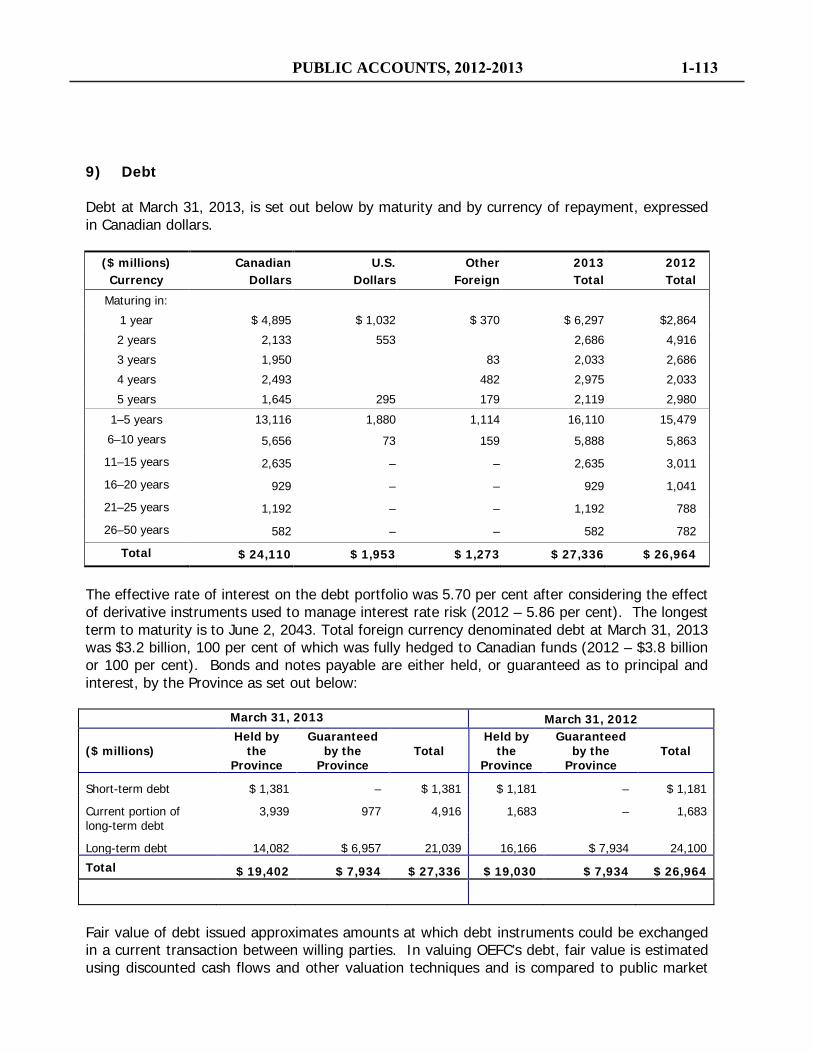
9) Debt Debt at March 31, 2013, is set out below by maturity and by currency of repayment, expressed in Canadian dollars.
($ millions) Currency
Canadian Dollars
U.S. Dollars
Other Foreign
2013 Total
2012 Total
Maturing in:
1 year $ 4,895 $ 1,032 $ 370 $ 6,297 $2,864
2 years 2,133 553 2,686 4,916
3 years 1,950 83 2,033 2,686
4 years 2,493 482 2,975 2,033
5 years 1,645 295 179 2,119 2,980
1–5 years 13,116 1,880 1,114 16,110 15,479
6–10 years 5,656 73 159 5,888 5,863
11–15 years 2,635 – – 2,635 3,011
16–20 years 929 – – 929 1,041
21–25 years 1,192 – – 1,192 788
26–50 years 582 – – 582 782
Total $ 24,110 $ 1,953 $ 1,273 $ 27,336 $ 26,964
The effective rate of interest on the debt portfolio was 5.70 per cent after considering the effect of derivative instruments used to manage interest rate risk (2012 – 5.86 per cent). The longest term to maturity is to June 2, 2043. Total foreign currency denominated debt at March 31, 2013 was $3.2 billion, 100 per cent of which was fully hedged to Canadian funds (2012 – $3.8 billion or 100 per cent). Bonds and notes payable are either held, or guaranteed as to principal and interest, by the Province as set out below:
March 31, 2013 March 31, 2012
($ millions) Held by
the Province
Guaranteed by the
Province Total
Held by the
Province
Guaranteed by the
Province Total
Short-term debt $ 1,381 – $ 1,381 $ 1,181 – $ 1,181
Current portion of long-term debt
3,939 977 4,916 1,683 – 1,683
Long-term debt 14,082 $ 6,957 21,039 16,166 $ 7,934 24,100
Total $ 19,402 $ 7,934 $ 27,336 $ 19,030 $ 7,934 $ 26,964
Fair value of debt issued approximates amounts at which debt instruments could be exchanged in a current transaction between willing parties. In valuing OEFC’s debt, fair value is estimated using discounted cash flows and other valuation techniques and is compared to public market
PUBLIC ACCOUNTS, 2012-2013 1-113
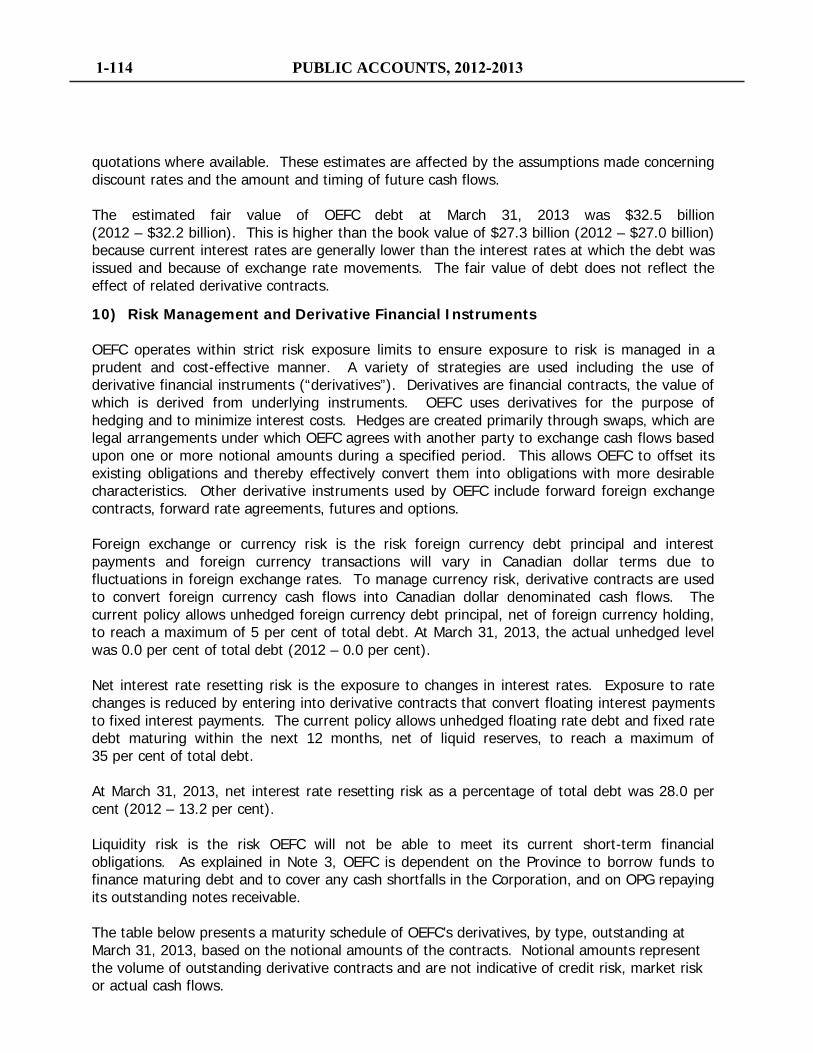
quotations where available. These estimates are affected by the assumptions made concerning discount rates and the amount and timing of future cash flows. The estimated fair value of OEFC debt at March 31, 2013 was $32.5 billion (2012 – $32.2 billion). This is higher than the book value of $27.3 billion (2012 – $27.0 billion) because current interest rates are generally lower than the interest rates at which the debt was issued and because of exchange rate movements. The fair value of debt does not reflect the effect of related derivative contracts. 10) Risk Management and Derivative Financial Instruments OEFC operates within strict risk exposure limits to ensure exposure to risk is managed in a prudent and cost-effective manner. A variety of strategies are used including the use of derivative financial instruments (“derivatives”). Derivatives are financial contracts, the value of which is derived from underlying instruments. OEFC uses derivatives for the purpose of hedging and to minimize interest costs. Hedges are created primarily through swaps, which are legal arrangements under which OEFC agrees with another party to exchange cash flows based upon one or more notional amounts during a specified period. This allows OEFC to offset its existing obligations and thereby effectively convert them into obligations with more desirable characteristics. Other derivative instruments used by OEFC include forward foreign exchange contracts, forward rate agreements, futures and options. Foreign exchange or currency risk is the risk foreign currency debt principal and interest payments and foreign currency transactions will vary in Canadian dollar terms due to fluctuations in foreign exchange rates. To manage currency risk, derivative contracts are used to convert foreign currency cash flows into Canadian dollar denominated cash flows. The current policy allows unhedged foreign currency debt principal, net of foreign currency holding, to reach a maximum of 5 per cent of total debt. At March 31, 2013, the actual unhedged level was 0.0 per cent of total debt (2012 – 0.0 per cent). Net interest rate resetting risk is the exposure to changes in interest rates. Exposure to rate changes is reduced by entering into derivative contracts that convert floating interest payments to fixed interest payments. The current policy allows unhedged floating rate debt and fixed rate debt maturing within the next 12 months, net of liquid reserves, to reach a maximum of 35 per cent of total debt. At March 31, 2013, net interest rate resetting risk as a percentage of total debt was 28.0 per cent (2012 – 13.2 per cent). Liquidity risk is the risk OEFC will not be able to meet its current short-term financial obligations. As explained in Note 3, OEFC is dependent on the Province to borrow funds to finance maturing debt and to cover any cash shortfalls in the Corporation, and on OPG repaying its outstanding notes receivable. The table below presents a maturity schedule of OEFC’s derivatives, by type, outstanding at March 31, 2013, based on the notional amounts of the contracts. Notional amounts represent the volume of outstanding derivative contracts and are not indicative of credit risk, market risk or actual cash flows.
1-114 PUBLIC ACCOUNTS, 2012-2013
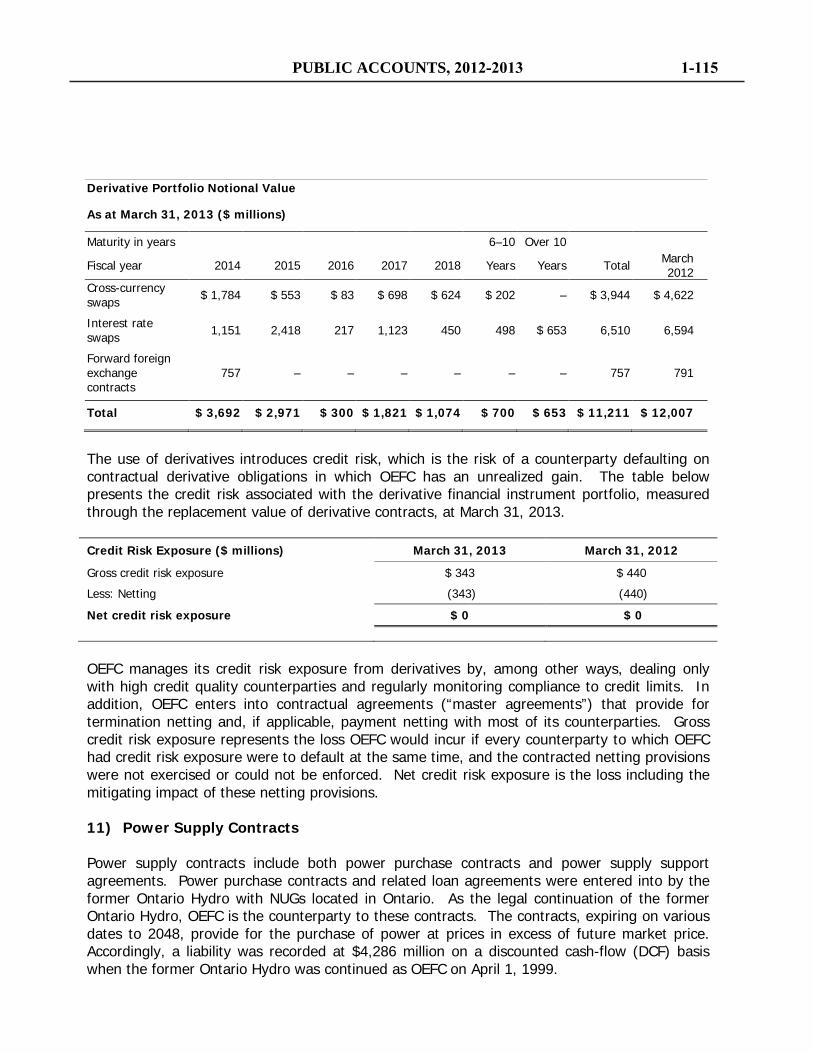
Derivative Portfolio Notional Value
As at March 31, 2013 ($ millions)
Maturity in years 6–10 Over 10
Fiscal year 2014 2015 2016 2017 2018 Years Years Total March 2012
Cross-currency swaps $ 1,784 $ 553 $ 83 $ 698 $ 624 $ 202 – $ 3,944 $ 4,622
Interest rate swaps 1,151 2,418 217 1,123 450 498 $ 653 6,510 6,594
Forward foreign exchange contracts
757 – – – – – – 757 791
Total $ 3,692 $ 2,971 $ 300 $ 1,821 $ 1,074 $ 700 $ 653 $ 11,211 $ 12,007
The use of derivatives introduces credit risk, which is the risk of a counterparty defaulting on contractual derivative obligations in which OEFC has an unrealized gain. The table below presents the credit risk associated with the derivative financial instrument portfolio, measured through the replacement value of derivative contracts, at March 31, 2013. Credit Risk Exposure ($ millions) March 31, 2013 March 31, 2012
Gross credit risk exposure $ 343 $ 440
Less: Netting (343) (440)
Net credit risk exposure $ 0 $ 0
OEFC manages its credit risk exposure from derivatives by, among other ways, dealing only with high credit quality counterparties and regularly monitoring compliance to credit limits. In addition, OEFC enters into contractual agreements (“master agreements”) that provide for termination netting and, if applicable, payment netting with most of its counterparties. Gross credit risk exposure represents the loss OEFC would incur if every counterparty to which OEFC had credit risk exposure were to default at the same time, and the contracted netting provisions were not exercised or could not be enforced. Net credit risk exposure is the loss including the mitigating impact of these netting provisions. 11) Power Supply Contracts Power supply contracts include both power purchase contracts and power supply support agreements. Power purchase contracts and related loan agreements were entered into by the former Ontario Hydro with NUGs located in Ontario. As the legal continuation of the former Ontario Hydro, OEFC is the counterparty to these contracts. The contracts, expiring on various dates to 2048, provide for the purchase of power at prices in excess of future market price. Accordingly, a liability was recorded at $4,286 million on a discounted cash-flow (DCF) basis when the former Ontario Hydro was continued as OEFC on April 1, 1999.
PUBLIC ACCOUNTS, 2012-2013 1-115
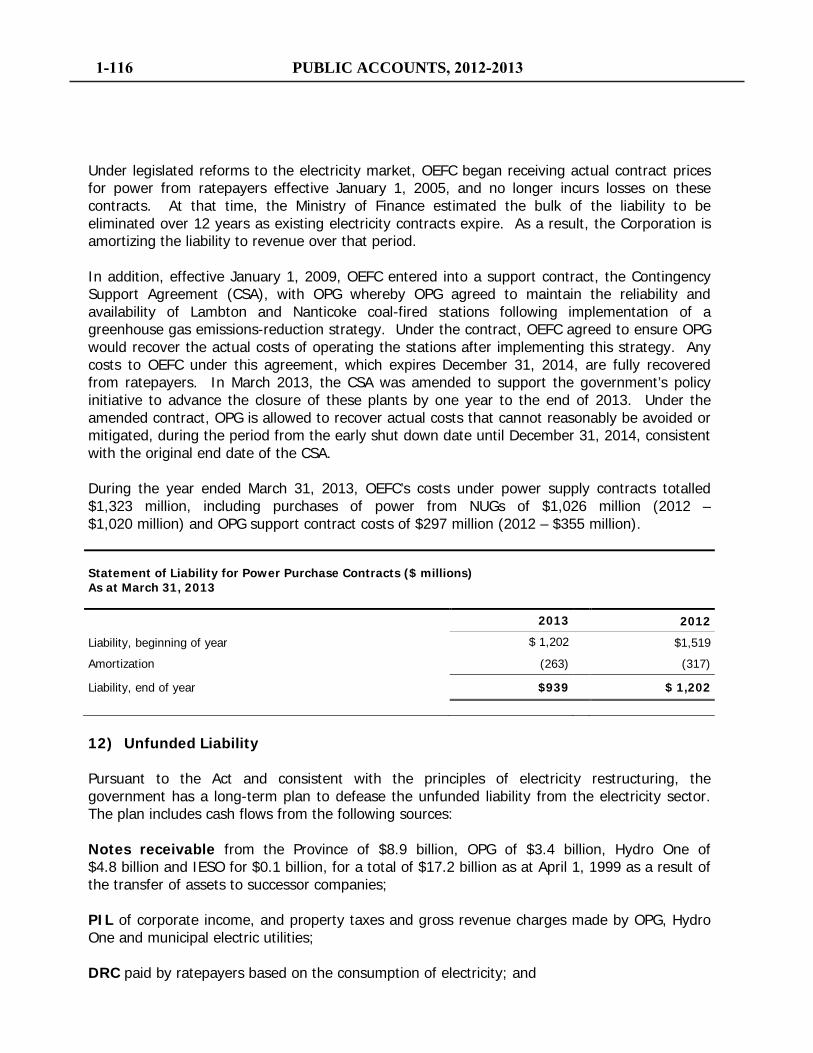
Under legislated reforms to the electricity market, OEFC began receiving actual contract prices for power from ratepayers effective January 1, 2005, and no longer incurs losses on these contracts. At that time, the Ministry of Finance estimated the bulk of the liability to be eliminated over 12 years as existing electricity contracts expire. As a result, the Corporation is amortizing the liability to revenue over that period. In addition, effective January 1, 2009, OEFC entered into a support contract, the Contingency Support Agreement (CSA), with OPG whereby OPG agreed to maintain the reliability and availability of Lambton and Nanticoke coal-fired stations following implementation of a greenhouse gas emissions-reduction strategy. Under the contract, OEFC agreed to ensure OPG would recover the actual costs of operating the stations after implementing this strategy. Any costs to OEFC under this agreement, which expires December 31, 2014, are fully recovered from ratepayers. In March 2013, the CSA was amended to support the government’s policy initiative to advance the closure of these plants by one year to the end of 2013. Under the amended contract, OPG is allowed to recover actual costs that cannot reasonably be avoided or mitigated, during the period from the early shut down date until December 31, 2014, consistent with the original end date of the CSA. During the year ended March 31, 2013, OEFC’s costs under power supply contracts totalled $1,323 million, including purchases of power from NUGs of $1,026 million (2012 – $1,020 million) and OPG support contract costs of $297 million (2012 – $355 million).
Statement of Liability for Power Purchase Contracts ($ millions) As at March 31, 2013
2013 2012
Liability, beginning of year $ 1,202 $1,519
Amortization (263) (317)
Liability, end of year $939 $ 1,202
12) Unfunded Liability Pursuant to the Act and consistent with the principles of electricity restructuring, the government has a long-term plan to defease the unfunded liability from the electricity sector. The plan includes cash flows from the following sources: Notes receivable from the Province of $8.9 billion, OPG of $3.4 billion, Hydro One of $4.8 billion and IESO for $0.1 billion, for a total of $17.2 billion as at April 1, 1999 as a result of the transfer of assets to successor companies; PIL of corporate income, and property taxes and gross revenue charges made by OPG, Hydro One and municipal electric utilities; DRC paid by ratepayers based on the consumption of electricity; and
1-116 PUBLIC ACCOUNTS, 2012-2013
Electricity Sector Dedicated Income Consistent with the government’s commitment to keep electricity income in the electricity sector, the cumulative combined net income of OPG and Hydro One in excess of the Province’s interest cost of its investment in its electricity subsidiaries will be allocated to help retire OEFC’s debt. 13) Contingencies and Guarantees OEFC is involved in various legal actions arising out of the ordinary course and conduct of business, some of which relate to the former Ontario Hydro prior to the establishment of OEFC on April 1, 1999. For some of these claims, OPG or Hydro One is required to indemnify OEFC for any liability arising from the claim. For claims on which OEFC is provided no indemnification and where the outcome and ultimate disposition of these legal actions is not determinable at this time, the settlements, if any, will be reflected in the period in which settlement occurs. Subject to a $10 million deductible, OEFC has agreed to indemnify Hydro One in respect of any adverse claim to title to any asset, right or thing transferred or intended to be transferred to the company at April 1, 1999, and any failure of the transfer order to transfer such assets, rights or things and with respect to payment to or from or other dealing with any equity account of Ontario Hydro, including certain related litigation. The Province has guaranteed any liability arising from these indemnifications. A similar indemnity provided to OPG was terminated as of May 31, 2006. OEFC is contingently liable under guarantees given to third parties that have provided long-term financing to certain independent power producers in connection with the power purchase agreements described in Note 9. These guarantees total approximately $14 million at March 31, 2013 (2012 – $20 million). 14) Related Party Transactions In the normal course of operations, OEFC has transactions with the following related parties. All material transactions have been disclosed in the notes to the financial statements. Each of the following entities is included in the Province’s financial statements: a) Province of Ontario b) Ontario Power Generation Inc. c) Hydro One Inc. d) Independent Electricity System Operator e) Ontario Financing Authority
PUBLIC ACCOUNTS, 2012-2013 1-117

Ontario Energy Board MANAGEMENT’S RESPONSIBILITY The Ontario Energy Board’s management is responsible for the integrity and fair presentation of the financial statements and other information presented in the annual report. The financial statements have been prepared by management in accordance with Canadian Public Sector Accounting Standards. The preparation of financial statements necessarily involves the use of management’s judgment and best estimates, particularly when transactions affecting the current accounting period cannot be determined with certainty until future periods. The Board maintains systems of internal accounting controls designed to provide reasonable assurance that reliable financial information is available on a timely basis and that the Board assets and liabilities are adequately accounted for and assets safeguarded. The financial statements have been reviewed and approved by the Board’s Management Committee. In addition the financial statements have been audited by the Auditor General of Ontario, whose report follows.
Allan Fogwill Managing Director, Planning & Business Services July 17, 2013
PUBLIC ACCOUNTS, 2012-2013 1-119
Independent Auditor’s Report To the Ontario Energy Board I have audited the accompanying financial statements of the Ontario Energy Board, which comprise the statement of financial position as at March 31, 2013 and the statements of operations and net assets and cash flows for the year then ended, and a summary of significant accounting policies and other explanatory information. Management’s Responsibility for the Financial Statements Management is responsible for the preparation and fair presentation of these financial statements in accordance with Canadian public sector accounting standards, and for such internal control as management determines is necessary to enable the preparation of financial statements that are free from material misstatement, whether due to fraud or error. Auditor’s Responsibility My responsibility is to express an opinion on these financial statements based on my audit. I conducted my audit in accordance with Canadian generally accepted auditing standards. Those standards require that I comply with ethical requirements and plan and perform the audit to obtain reasonable assurance about whether the financial statements are free from material misstatement. An audit involves performing procedures to obtain audit evidence about the amounts and disclosures in the financial statements. The procedures selected depend on the auditor’s judgment, including the assessment of the risks of material misstatement of the financial statements, whether due to fraud or error. In making those risk assessments, the auditor considers internal control relevant to the entity’s preparation and fair presentation of the financial statements in order to design audit procedures that are appropriate in the circumstances, but not for the purpose of expressing an opinion on the effectiveness of the entity’s internal control. An audit also includes evaluating the appropriateness of accounting policies used and the reasonableness of accounting estimates made by management, as well as evaluating the overall presentation of the financial statements. I believe that the audit evidence I have obtained is sufficient and appropriate to provide a basis for my audit opinion. Opinion In my opinion, the financial statements present fairly, in all material respects, the financial position of the Ontario Energy Board as at March 31, 2013 and the results of its operations, its net assets, and its cash flows for the year then ended in accordance with Canadian public sector accounting standards. Toronto, Ontario Gary Peall, CPA, CA, LPA July 17, 2013 Acting Auditor General
1-120 PUBLIC ACCOUNTS, 2012-2013
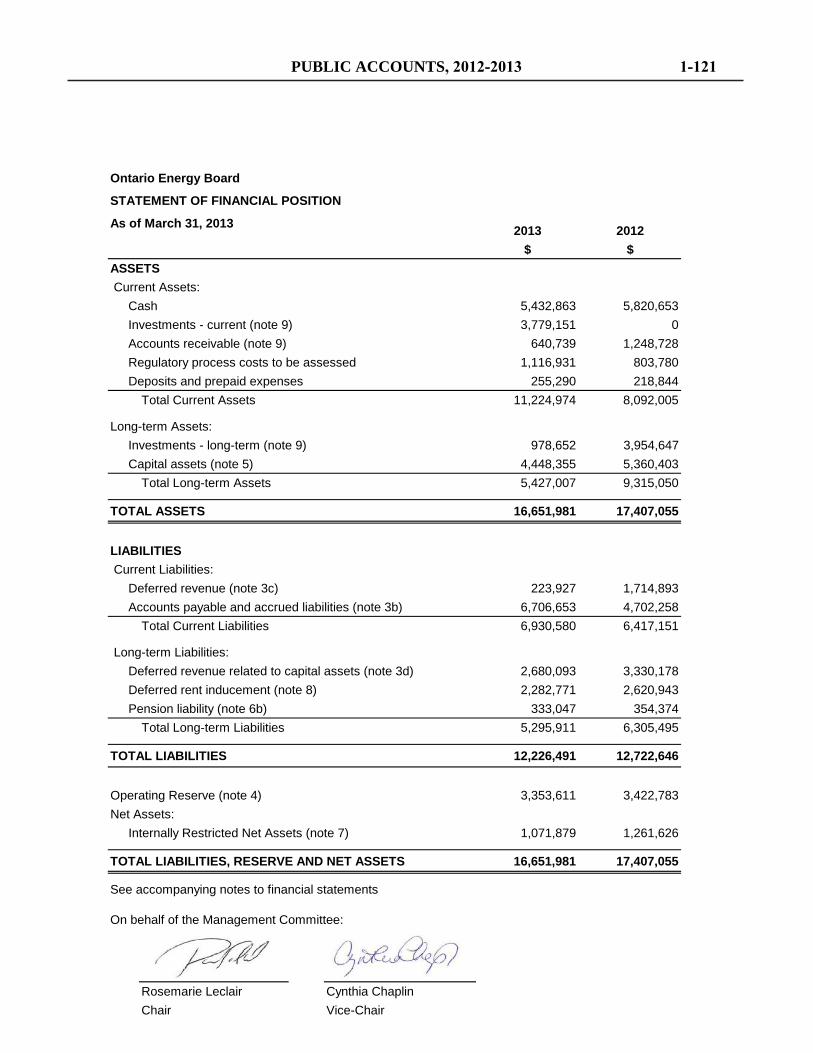
Ontario Energy Board
STATEMENT OF FINANCIAL POSITION
As of March 31, 2013 2013 2012$ $
ASSETS Current Assets:
Cash 5,432,863 5,820,653Investments - current (note 9) 3,779,151 0Accounts receivable (note 9) 640,739 1,248,728Regulatory process costs to be assessed 1,116,931 803,780Deposits and prepaid expenses 255,290 218,844
Total Current Assets 11,224,974 8,092,005
Long-term Assets:Investments - long-term (note 9) 978,652 3,954,647Capital assets (note 5) 4,448,355 5,360,403
Total Long-term Assets 5,427,007 9,315,050
TOTAL ASSETS 16,651,981 17,407,055
LIABILITIES Current Liabilities:
Deferred revenue (note 3c) 223,927 1,714,893Accounts payable and accrued liabilities (note 3b) 6,706,653 4,702,258
Total Current Liabilities 6,930,580 6,417,151
Long-term Liabilities:Deferred revenue related to capital assets (note 3d) 2,680,093 3,330,178Deferred rent inducement (note 8) 2,282,771 2,620,943Pension liability (note 6b) 333,047 354,374
Total Long-term Liabilities 5,295,911 6,305,495
TOTAL LIABILITIES 12,226,491 12,722,646
Operating Reserve (note 4) 3,353,611 3,422,783Net Assets:
Internally Restricted Net Assets (note 7) 1,071,879 1,261,626
TOTAL LIABILITIES, RESERVE AND NET ASSETS 16,651,981 17,407,055
See accompanying notes to financial statements
On behalf of the Management Committee:
Rosemarie Leclair Cynthia ChaplinChair Vice-Chair
PUBLIC ACCOUNTS, 2012-2013 1-121
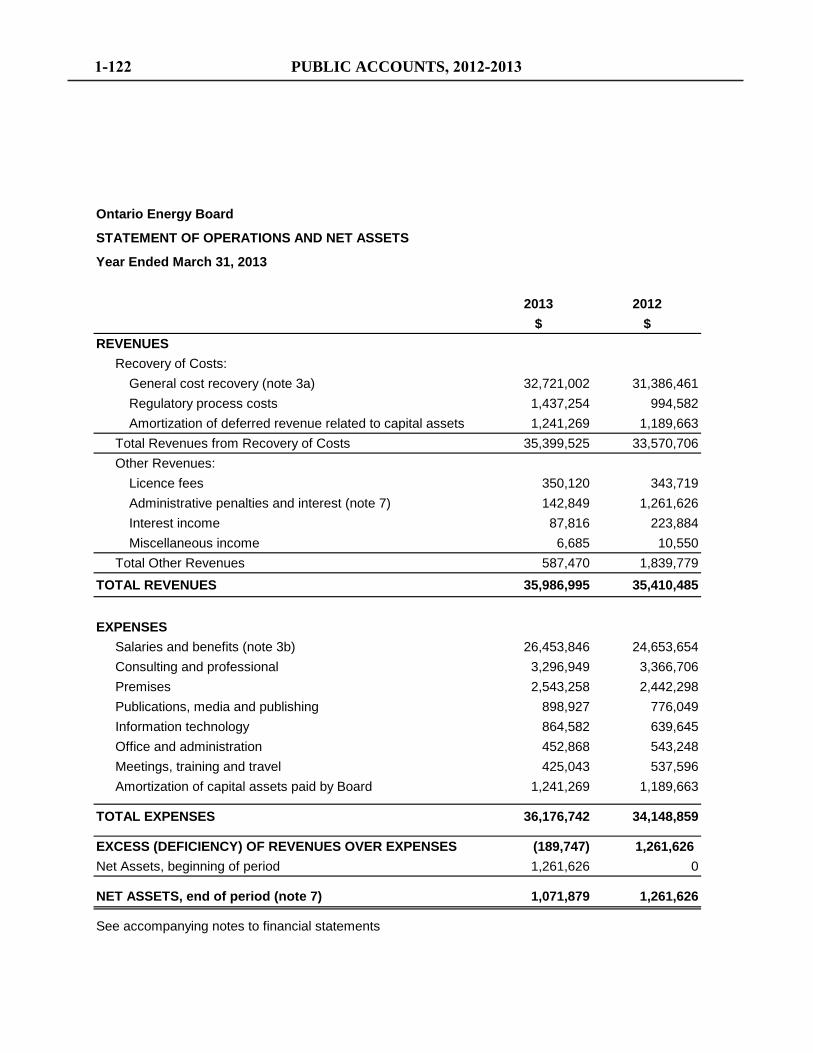
Ontario Energy Board
STATEMENT OF OPERATIONS AND NET ASSETS
Year Ended March 31, 2013
2013 2012$ $
REVENUESRecovery of Costs:
General cost recovery (note 3a) 32,721,002 31,386,461Regulatory process costs 1,437,254 994,582Amortization of deferred revenue related to capital assets 1,241,269 1,189,663
Total Revenues from Recovery of Costs 35,399,525 33,570,706Other Revenues:
Licence fees 350,120 343,719Administrative penalties and interest (note 7) 142,849 1,261,626Interest income 87,816 223,884Miscellaneous income 6,685 10,550
Total Other Revenues 587,470 1,839,779TOTAL REVENUES 35,986,995 35,410,485
EXPENSESSalaries and benefits (note 3b) 26,453,846 24,653,654Consulting and professional 3,296,949 3,366,706Premises 2,543,258 2,442,298Publications, media and publishing 898,927 776,049Information technology 864,582 639,645Office and administration 452,868 543,248Meetings, training and travel 425,043 537,596Amortization of capital assets paid by Board 1,241,269 1,189,663
TOTAL EXPENSES 36,176,742 34,148,859
EXCESS (DEFICIENCY) OF REVENUES OVER EXPENSES (189,747) 1,261,626 Net Assets, beginning of period 1,261,626 0
NET ASSETS, end of period (note 7) 1,071,879 1,261,626
See accompanying notes to financial statements
1-122 PUBLIC ACCOUNTS, 2012-2013
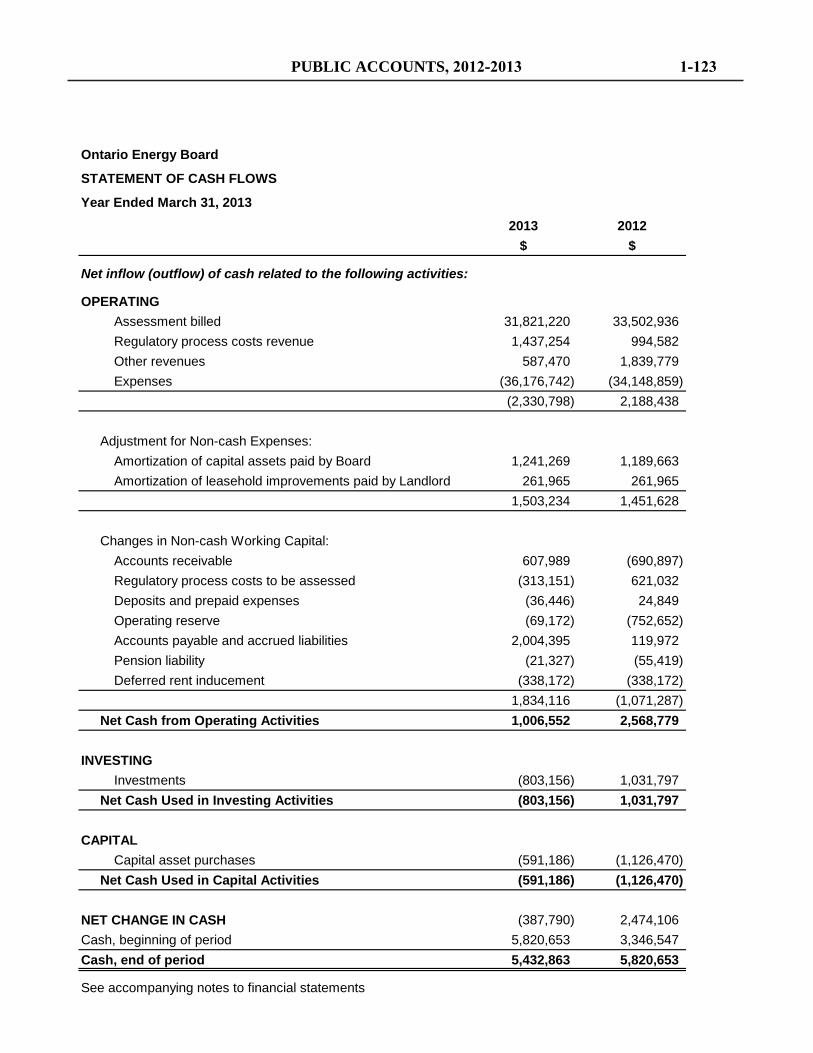
Ontario Energy Board
STATEMENT OF CASH FLOWS
Year Ended March 31, 2013
2013 2012$ $
Net inflow (outflow) of cash related to the following activities:
OPERATINGAssessment billed 31,821,220 33,502,936 Regulatory process costs revenue 1,437,254 994,582 Other revenues 587,470 1,839,779 Expenses (36,176,742) (34,148,859)
(2,330,798) 2,188,438
Adjustment for Non-cash Expenses:Amortization of capital assets paid by Board 1,241,269 1,189,663 Amortization of leasehold improvements paid by Landlord 261,965 261,965
1,503,234 1,451,628
Changes in Non-cash Working Capital:Accounts receivable 607,989 (690,897) Regulatory process costs to be assessed (313,151) 621,032 Deposits and prepaid expenses (36,446) 24,849 Operating reserve (69,172) (752,652) Accounts payable and accrued liabilities 2,004,395 119,972 Pension liability (21,327) (55,419) Deferred rent inducement (338,172) (338,172)
1,834,116 (1,071,287) Net Cash from Operating Activities 1,006,552 2,568,779
INVESTINGInvestments (803,156) 1,031,797
Net Cash Used in Investing Activities (803,156) 1,031,797
CAPITALCapital asset purchases (591,186) (1,126,470)
Net Cash Used in Capital Activities (591,186) (1,126,470)
NET CHANGE IN CASH (387,790) 2,474,106 Cash, beginning of period 5,820,653 3,346,547 Cash, end of period 5,432,863 5,820,653
See accompanying notes to financial statements
PUBLIC ACCOUNTS, 2012-2013 1-123

Ontario Energy Board Notes To The Financial Statements March 31, 2013
1. Nature of the Corporation The Ontario Energy Board (the "Board”) is the regulator of Ontario’s natural gas and electricity industries. The Board also provides advice on energy matters referred to it by the Minister of Energy and the Minister of Natural Resources. Effective August 1, 2003, and pursuant to the Ontario Energy Board Act, 1998, (the “OEB Act”) the Board was continued as a corporation without share capital empowered to fully recover its costs from natural gas and electricity industry participants. As an agent of Her Majesty in right of Ontario, the Board is exempted from federal and provincial income taxes under the Income Tax Act. The Board is classified as a government not for profit organization for accounting purposes. 2. Significant Accounting Policies These financial statements are the first financial statements which the Board has prepared in accordance with Public Sector Accounting Standards (PS), which constitutes generally accepted accounting principles for government not-for-profit- organizations in Canada. The Board has chosen to use the standards for government not-for-profit organizations that include sections PS 4200 to PS 4270. The adoption of the new standards did not result in any retroactive adjustments to previously reported financial statements, nor were any significant reclassifications to the comparative figures required. Significant accounting policies followed in the preparation of these financial statements include: a) Revenue Recognition Revenues received in the 2012-13 fiscal year that relate to subsequent years are not recognized as revenue and are deferred. Recognition of revenue is matched to the expenses of the Board as follows:
• General cost recovery under S.26 of the OEB Act related to the expenses of the Board is recognized as revenue to the extent that they are in excess of regulatory process costs (S.30), amortization of deferred revenue related to
1-124 PUBLIC ACCOUNTS, 2012-2013
Ontario Energy Board Notes To The Financial Statements March 31, 2013
capital assets, and other revenues. Revenue assessed in excess of actual cost in 2012-13 is deferred and recognized in fiscal year 2013-14 and referred to as a true-up (note 3c).
• Revenue from administrative penalties assessed against market participants under s. 112.5 of the OEB Act is recognized in the year the Board issues the enforcement order, for the amount identified in the order, provided that the order is not under appeal and a reasonable estimate can be made and collection is reasonably assured. If the order is appealed, revenue will be recognized in the year in which all rights of appeal are exhausted and the order becomes final. Revenue from administrative penalties is not used to reduce the costs assessed under the Board’s Cost Assessment Model, but used to support activities relating to consumer education, outreach and other activities in the public interest. Both administrative penalties and their related expenses are reflected in the Statement of Operations and Net Assets and are reflected as internally restricted net assets summarized in note 7 of the financial statements.
• Deferred revenue related to capital assets is recognized as revenue on the
same basis that the underlying capital assets are amortized. Revenue related to capital asset expenditures is deferred because they have been billed in advance (note 3d).
• Regulatory process costs are recognized as revenue when related expenses are
incurred.
• Other revenues are recognized when received and receivable. b) Capital Assets Capital assets are recorded at cost less accumulated amortization. Amortization is calculated on a straight-line basis over the estimated useful lives of the assets, beginning in the fiscal year following the acquisition, as follows:
Office furniture and equipment 5 years Computer equipment and related software 3 years Audio visual equipment 3 years Leasehold improvements over remainder of lease
PUBLIC ACCOUNTS, 2012-2013 1-125
Ontario Energy Board Notes To The Financial Statements March 31, 2013
c) Financial Instruments Effective April 1, 2012, the Board adopted new Public Sector Handbook Standard 3450-Financial Instruments. The Board’s financial instruments are initially measured at their fair value and subsequently measured in one of the following categories (i) fair value or (ii) cost or amortized cost. The Board uses fair value for the subsequent measurement of cash, accounts receivable, regulatory process costs to be assessed, accounts payable and accrued liabilities. The Board’s short and long term investments are subsequently measured at amortized cost. d) Use of Estimates The preparation of financial statements in accordance with public sector accounting standards requires that management make estimates and assumptions that affect the reported amounts of assets and liabilities at the date of the financial statements and the reported amounts of revenues, expenses and recoveries for the year. Actual amounts could differ from these estimates. e) Employee Pension Plans The Board’s full-time employees participate in the Public Service Pension Fund (PSPF) which is a defined benefit pension plan for employees of the Province and many provincial agencies. The Province of Ontario, which is the sole sponsor of the PSPF, determines the Board’s annual payments to the fund. Since the Board is not a sponsor of these funds, gains and losses arising from statutory actuarial funding valuations are not assets or obligations of the Board, as the sponsor is responsible for ensuring that the pension funds are financially viable. The Board’s expense is limited to the required contributions to the Fund as described in note 6(a). The Board also manages a supplementary unfunded pension plan for a former Chair as described in note 6(b). The Board accrues its obligations and the related cost under this supplemental unfunded pension plan. The actuarial liability and the current service cost are determined by independent actuaries using the projected benefit method, prorated on management’s best estimate assumptions.
1-126 PUBLIC ACCOUNTS, 2012-2013
Ontario Energy Board Notes To The Financial Statements March 31, 2013
3. Industry Assessments for 2012-13 During the 2012-13 fiscal year, the natural gas and electricity industry participants were assessed estimated costs for the 2012-13 fiscal year based on budgeted amounts. Amounts assessed in excess of actual costs are a true-up and are reported as current deferred revenue. The 2012-13 true-up will be used to reduce the 2013-14 fiscal year assessment. The calculation of the general cost recovery, true-up and deferred revenue are outlined in the following tables. a) 2012-13 General cost recovery Salaries and benefits (note 3b) $26,453,846 Consulting and professional $3,296,949 Premises $2,543,258 Publications, media and publishing $898,927 Information technology $864,582 Office and administration $452,868 Meetings, training and travel $425,043 Amortization of capital assets paid by the Board $1,241,269
Total expenses $36,176,742 Regulatory process costs, amortization of deferred revenue related to capital assets, other revenues and both administrative penalties revenues and their related expenses ($3,455,740)
General cost recovery at March 31, 2013 $32,721,002
b) Accounts Payable and Accrued Liabilities Estimate The accounts payable and accrued liabilities amount includes one-time accruals in respects of pay equity, job evaluation, and restructuring costs. These liabilities are recorded in salaries and benefits as shown in note 3a.
PUBLIC ACCOUNTS, 2012-2013 1-127
Ontario Energy Board Notes To The Financial Statements March 31, 2013
c) 2012-13 Current Deferred Revenue (2012-13 True-up) General cost recovery (note 3a) $32,721,002 2012-13 Capital expenditures paid by the OEB $591,186
Total assessment (actual) $33,312,188 Total assessment (budget) $33,536,115
2012-13 Current Deferred Revenue (2012-13 True-up) $223,927
d) 2012-13 Deferred Revenue Related to Capital Assets Revenues related to capital asset expenditures are deferred because they have been billed in advance with the exclusion of leasehold improvements paid by the landlord, which were not included in the assessments. As part of the leasehold inducements included in the lease agreement, the landlord paid for $3,540,400 of leasehold improvements on behalf of the Board since the start of the lease on January 1, 2005. Net book value of capital assets 2012-13 (note 5) $ 4,448,355 Net book value of leasehold improvements paid by landlord (note 5)
$(1,768,262)
2012-13 Deferred revenue related to capital assets
$2,680,093
1-128 PUBLIC ACCOUNTS, 2012-2013

Ontario Energy Board Notes To The Financial Statements March 31, 2013
4. Operating Reserve As part of its self-financing status, the Board established an operating reserve, which is adjusted on an annual basis. The primary objective of maintaining this reserve is to fund the Board’s operations in the event of revenue shortfalls or unanticipated expenditures. It is to be used for cash flow management and to support working capital requirements. The operating reserve was initially set at a maximum of 15% of the annual assessment. Based on the review of cash flow history, the Board has set the operating reserve to 10% of the current annual funding requirement. This operating reserve level is expected to be maintained in fiscal year 2013-14. 2012-13 Operating reserve
Operating reserve as at March 31, 2012 $3,422,783 Adjustment to the operating reserve $(69,172) Operating reserve as at March 31, 2013 $3,353,611
The Board is not subject to any externally imposed reserve requirements. 5. Capital Assets
Cost Accumulated amortization
Net book value 2013
Net book value 2012
Office furniture and equipment $2,804,730 $2,567,776 $235,954 $330,518 Computer equipment and related software $10,727,272 $9,118,378 $1,608,894 $2,070,013 Audio visual equipment $881,447
$870,086 $11,361 $12,074
Leasehold improvements paid by OEB $1,297,748 $473,864 $823,884 $917,573 Leasehold improvements paid by Landlord $3,540,400 $1,772,138 $1,768,262 $2,030,225 Total $19,251,597 $14,803,242 $4,448,355 $5,360,403
PUBLIC ACCOUNTS, 2012-2013 1-129
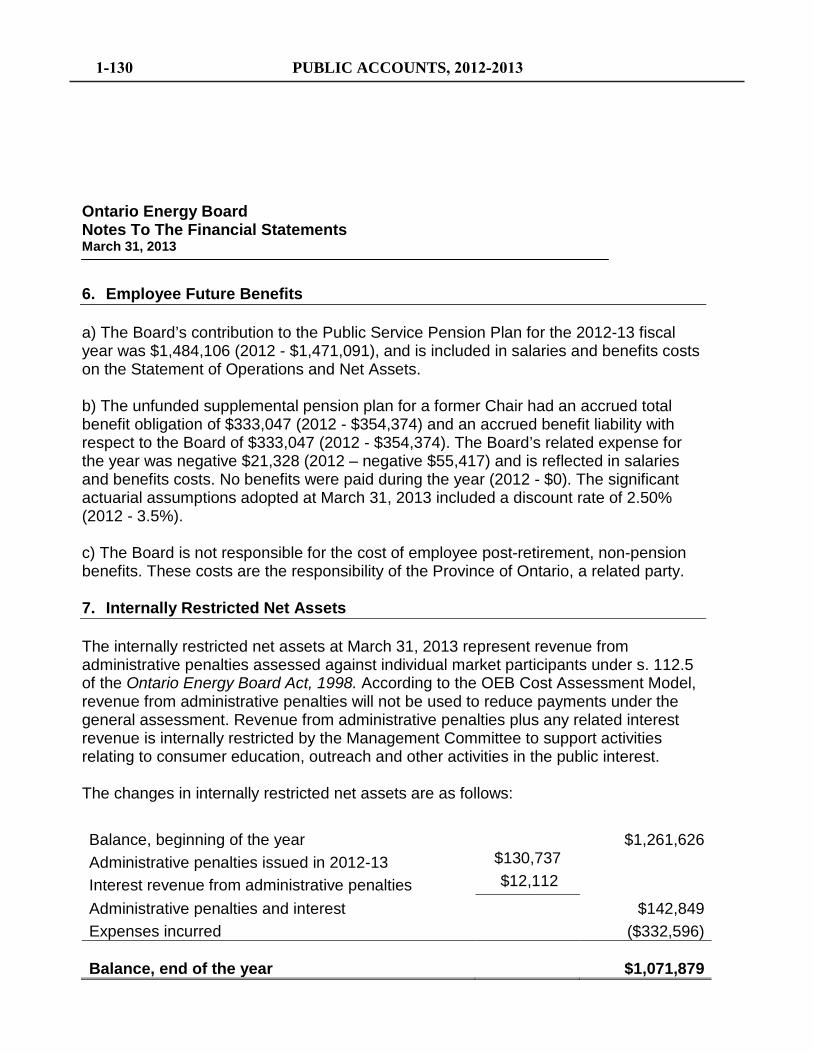
Ontario Energy Board Notes To The Financial Statements March 31, 2013
6. Employee Future Benefits a) The Board’s contribution to the Public Service Pension Plan for the 2012-13 fiscal year was $1,484,106 (2012 - $1,471,091), and is included in salaries and benefits costs on the Statement of Operations and Net Assets. b) The unfunded supplemental pension plan for a former Chair had an accrued total benefit obligation of $333,047 (2012 - $354,374) and an accrued benefit liability with respect to the Board of $333,047 (2012 - $354,374). The Board’s related expense for the year was negative $21,328 (2012 – negative $55,417) and is reflected in salaries and benefits costs. No benefits were paid during the year (2012 - $0). The significant actuarial assumptions adopted at March 31, 2013 included a discount rate of 2.50% (2012 - 3.5%). c) The Board is not responsible for the cost of employee post-retirement, non-pension benefits. These costs are the responsibility of the Province of Ontario, a related party. 7. Internally Restricted Net Assets The internally restricted net assets at March 31, 2013 represent revenue from administrative penalties assessed against individual market participants under s. 112.5 of the Ontario Energy Board Act, 1998. According to the OEB Cost Assessment Model, revenue from administrative penalties will not be used to reduce payments under the general assessment. Revenue from administrative penalties plus any related interest revenue is internally restricted by the Management Committee to support activities relating to consumer education, outreach and other activities in the public interest. The changes in internally restricted net assets are as follows:
Balance, beginning of the year $1,261,626 Administrative penalties issued in 2012-13 $130,737 Interest revenue from administrative penalties $12,112 Administrative penalties and interest $142,849 Expenses incurred ($332,596) Balance, end of the year
$1,071,879
1-130 PUBLIC ACCOUNTS, 2012-2013
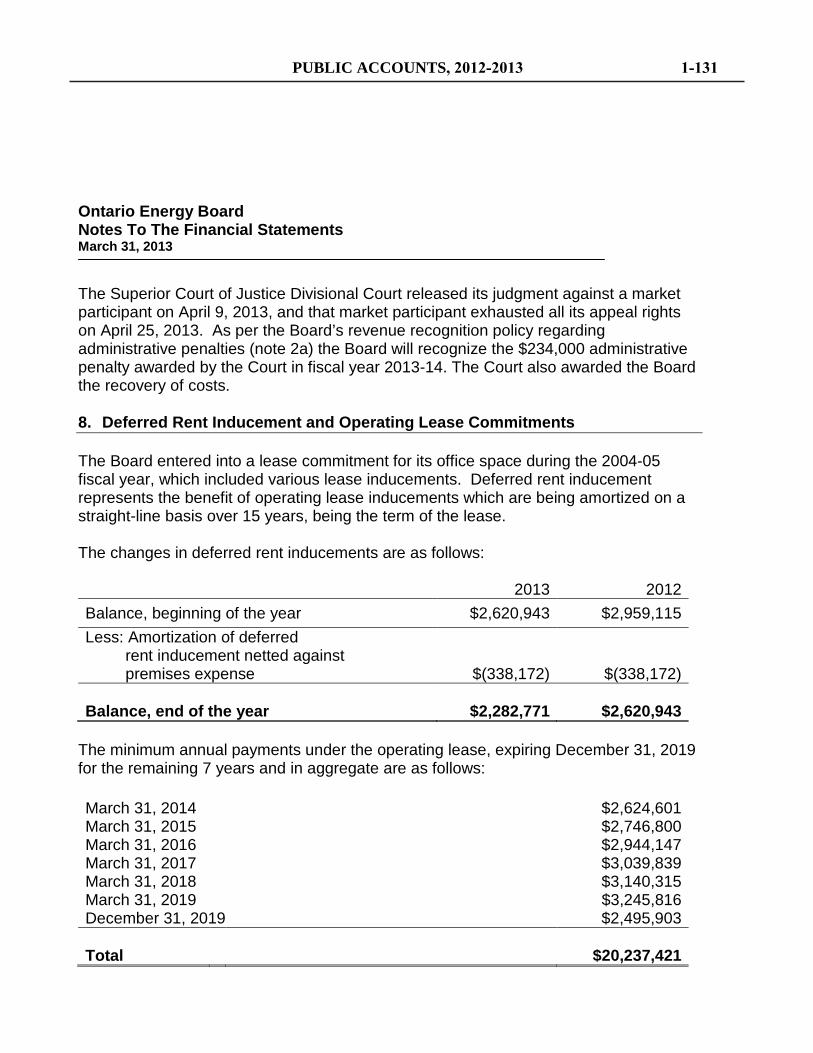
Ontario Energy Board Notes To The Financial Statements March 31, 2013
The Superior Court of Justice Divisional Court released its judgment against a market participant on April 9, 2013, and that market participant exhausted all its appeal rights on April 25, 2013. As per the Board’s revenue recognition policy regarding administrative penalties (note 2a) the Board will recognize the $234,000 administrative penalty awarded by the Court in fiscal year 2013-14. The Court also awarded the Board the recovery of costs. 8. Deferred Rent Inducement and Operating Lease Commitments The Board entered into a lease commitment for its office space during the 2004-05 fiscal year, which included various lease inducements. Deferred rent inducement represents the benefit of operating lease inducements which are being amortized on a straight-line basis over 15 years, being the term of the lease. The changes in deferred rent inducements are as follows: 2013 2012 Balance, beginning of the year $2,620,943 $2,959,115 Less: Amortization of deferred rent inducement netted against premises expense $(338,172) $(338,172) Balance, end of the year $2,282,771 $2,620,943
The minimum annual payments under the operating lease, expiring December 31, 2019 for the remaining 7 years and in aggregate are as follows: March 31, 2014 $2,624,601
March 31, 2015 $2,746,800
March 31, 2016 $2,944,147
March 31, 2017 $3,039,839 March 31, 2018 $3,140,315 March 31, 2019 $3,245,816 December 31, 2019 $2,495,903 Total $20,237,421
PUBLIC ACCOUNTS, 2012-2013 1-131
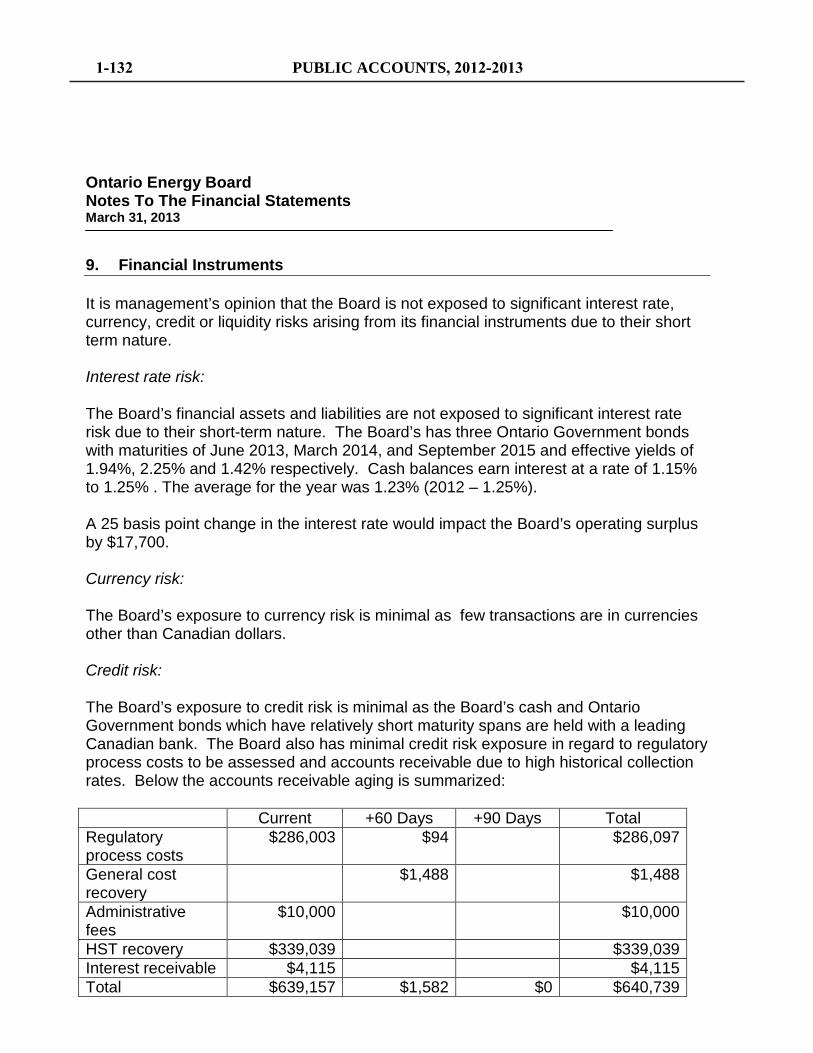
Ontario Energy Board Notes To The Financial Statements March 31, 2013
9. Financial Instruments It is management’s opinion that the Board is not exposed to significant interest rate, currency, credit or liquidity risks arising from its financial instruments due to their short term nature. Interest rate risk: The Board’s financial assets and liabilities are not exposed to significant interest rate risk due to their short-term nature. The Board’s has three Ontario Government bonds with maturities of June 2013, March 2014, and September 2015 and effective yields of 1.94%, 2.25% and 1.42% respectively. Cash balances earn interest at a rate of 1.15% to 1.25% . The average for the year was 1.23% (2012 – 1.25%). A 25 basis point change in the interest rate would impact the Board’s operating surplus by $17,700. Currency risk: The Board’s exposure to currency risk is minimal as few transactions are in currencies other than Canadian dollars. Credit risk: The Board’s exposure to credit risk is minimal as the Board’s cash and Ontario Government bonds which have relatively short maturity spans are held with a leading Canadian bank. The Board also has minimal credit risk exposure in regard to regulatory process costs to be assessed and accounts receivable due to high historical collection rates. Below the accounts receivable aging is summarized: Current +60 Days +90 Days Total Regulatory process costs
$286,003
$94 $286,097
General cost recovery
$1,488 $1,488
Administrative fees
$10,000 $10,000
HST recovery $339,039 $339,039 Interest receivable $4,115 $4,115 Total $639,157 $1,582 $0 $640,739
1-132 PUBLIC ACCOUNTS, 2012-2013
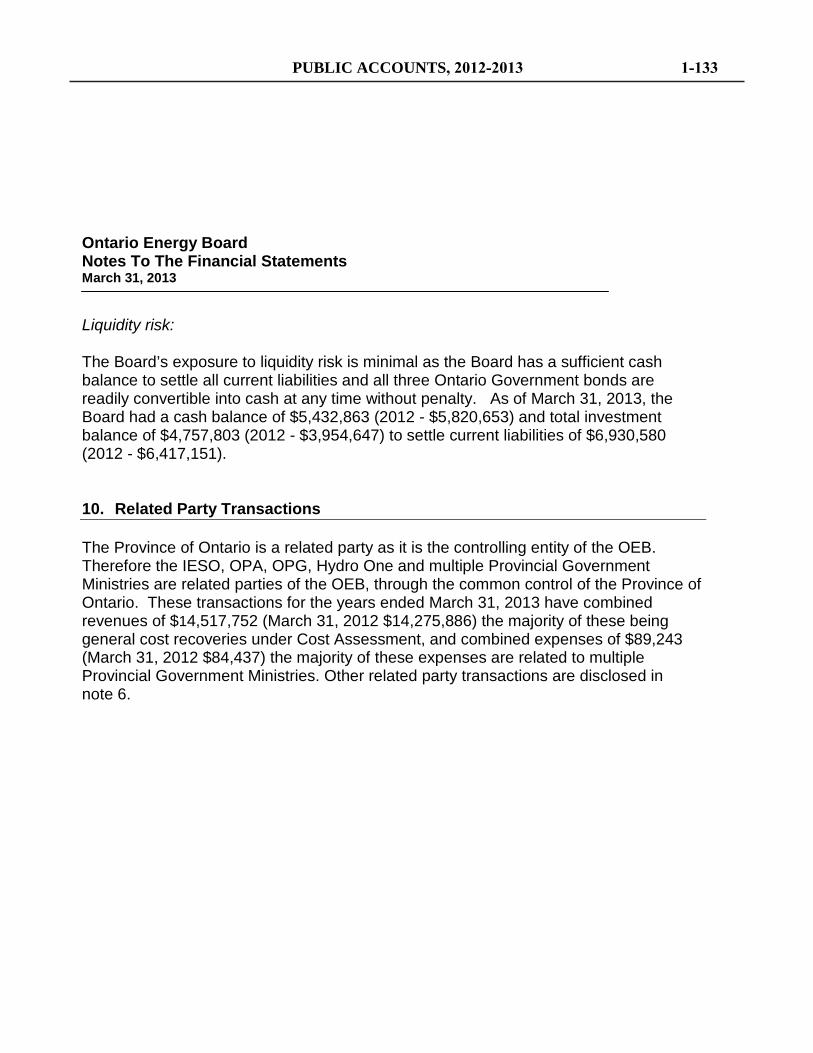
Ontario Energy Board Notes To The Financial Statements March 31, 2013
Liquidity risk: The Board’s exposure to liquidity risk is minimal as the Board has a sufficient cash balance to settle all current liabilities and all three Ontario Government bonds are readily convertible into cash at any time without penalty. As of March 31, 2013, the Board had a cash balance of $5,432,863 (2012 - $5,820,653) and total investment balance of $4,757,803 (2012 - $3,954,647) to settle current liabilities of $6,930,580 (2012 - $6,417,151). 10. Related Party Transactions The Province of Ontario is a related party as it is the controlling entity of the OEB. Therefore the IESO, OPA, OPG, Hydro One and multiple Provincial Government Ministries are related parties of the OEB, through the common control of the Province of Ontario. These transactions for the years ended March 31, 2013 have combined revenues of $14,517,752 (March 31, 2012 $14,275,886) the majority of these being general cost recoveries under Cost Assessment, and combined expenses of $89,243 (March 31, 2012 $84,437) the majority of these expenses are related to multiple Provincial Government Ministries. Other related party transactions are disclosed in note 6.
PUBLIC ACCOUNTS, 2012-2013 1-133

ONTARIO FINANCING AUTHORITY Financial Statements Responsibility for Financial Reporting The accompanying Financial Statements of the OFA have been prepared in accordance with Canadian public sector accounting standards. The preparation of the Financial Statements necessarily involves the use of estimates based on management’s judgment, particularly when transactions affecting the current accounting period cannot be finalized with certainty until future periods. The Financial Statements have been properly prepared within reasonable limits of materiality and in light of information available up to June 14, 2013. Management maintains a system of internal controls designed to provide reasonable assurance that assets are safeguarded and that reliable financial information is available on a timely basis. The system includes formal policies and procedures and an organizational structure that provides for appropriate delegation of authority and segregation of responsibilities. An internal audit function independently evaluates the effectiveness of these internal controls on an ongoing basis and reports its findings to management and the Audit & Risk Management Committee of the Board. The Board, through the Audit & Risk Management Committee, is responsible for ensuring management fulfils its responsibilities for financial reporting and internal controls. The Audit & Risk Management Committee meets periodically with management, the internal auditors and the external auditor to deal with issues raised by them and to review the financial statements before recommending approval by the Board. The Financial Statements have been audited by the Auditor General of Ontario. The Auditor General’s responsibility is to express an opinion on whether the Financial Statements are fairly presented in accordance with Canadian public sector accounting standards. The Auditor’s Report, which appears on the following page, outlines the scope of the Auditor’s examination and opinion. On behalf of management:
Gadi Mayman Ken Kandeepan Chief Executive Officer Chief Financial Officer
PUBLIC ACCOUNTS, 2012-2013 1-135
Auditor’s Report
Office of the Auditor General of Ontario Bureau du vérificateur général de l’Ontario Independent Auditor’s Report To the Ontario Financing Authority and to the Minister of Finance I have audited the accompanying financial statements of the Ontario Financing Authority, which comprise the statement of financial position as at March 31, 2013, and the statements of operations, change in net assets and cash flow for the year then ended, and a summary of significant accounting policies and other explanatory information. Management’s Responsibility for the Financial Statements Management is responsible for the preparation and fair presentation of these financial statements in accordance with Canadian public sector accounting standards, and for such internal control as management determines is necessary to enable the preparation of financial statements that are free from material misstatement, whether due to fraud or error. Auditor’s Responsibility My responsibility is to express an opinion on these financial statements based on my audit. I conducted my audit in accordance with Canadian generally accepted auditing standards. Those standards require that I comply with ethical requirements and plan and perform the audit to obtain reasonable assurance about whether the financial statements are free from material misstatement. An audit involves performing procedures to obtain audit evidence about the amounts and disclosures in the financial statements. The procedures selected depend on the auditor’s judgment, including the assessment of the risks of material misstatement of the financial statements, whether due to fraud or error. In making those risk assessments, the auditor considers internal control relevant to the entity’s preparation and fair presentation of the financial statements in order to design audit procedures that are appropriate in the circumstances, but not for the purpose of expressing an opinion on the effectiveness of the entity’s internal control. An audit also includes evaluating the appropriateness of accounting policies used and the reasonableness of accounting estimates made by management, as well as evaluating the overall presentation of the financial statements. I believe that the audit evidence I have obtained is sufficient and appropriate to provide a basis for my audit opinion. Opinion In my opinion, the financial statements present fairly, in all material respects, the financial position of the Ontario Financing Authority as at March 31, 2013 and the results of its operations, changes in its net assets, and its cash flows for the year then ended in accordance with Canadian public sector accounting standards.
Toronto, Ontario Susan Klein, CPA, CA, LPA June 14, 2013 Acting Deputy Auditor General
1-136 PUBLIC ACCOUNTS, 2012-2013
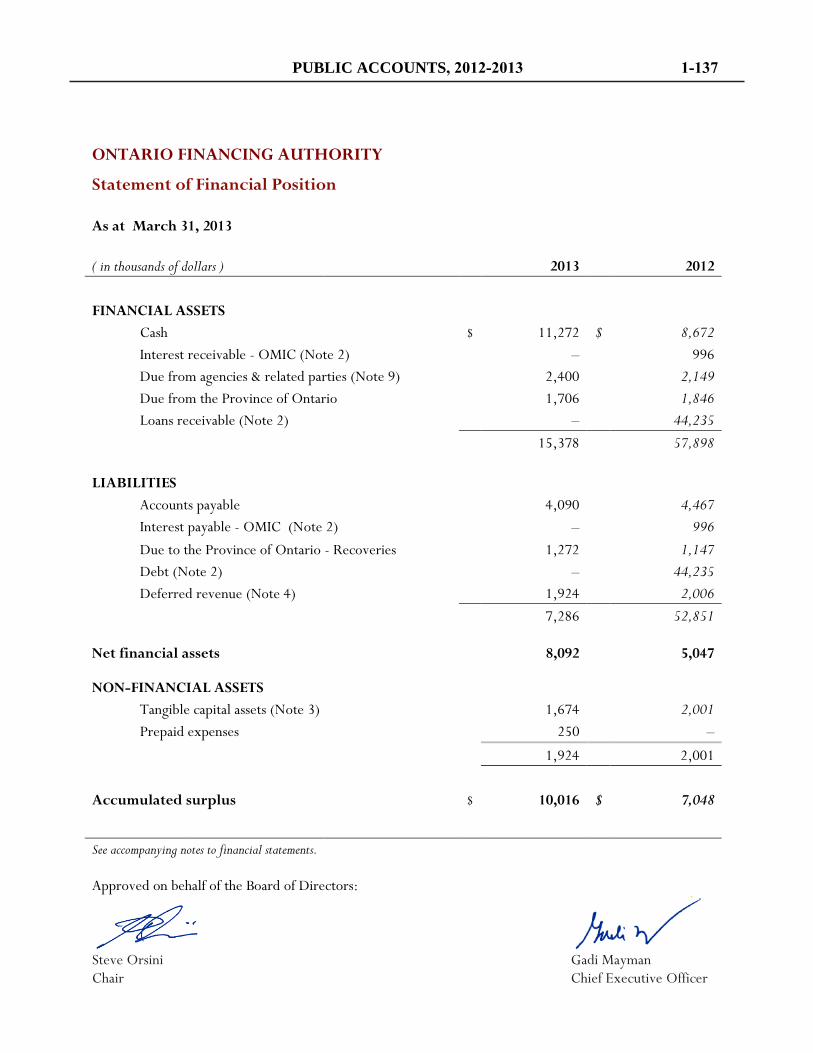
ONTARIO FINANCING AUTHORITY Statement of Financial Position
As at March 31, 2013
( in thousands of dollars ) 2013 2012
FINANCIAL ASSETS Cash $ 11,272 $ 8,672
Interest receivable - OMIC (Note 2)
–
996 Due from agencies & related parties (Note 9)
2,400
2,149
Due from the Province of Ontario
1,706
1,846 Loans receivable (Note 2)
–
44,235
15,378 57,898
LIABILITIES Accounts payable
4,090
4,467 Interest payable - OMIC (Note 2)
–
996
Due to the Province of Ontario - Recoveries
1,272
1,147 Debt (Note 2)
–
44,235
Deferred revenue (Note 4)
1,924
2,006
7,286 52,851
Net financial assets
8,092
5,047
NON-FINANCIAL ASSETS Tangible capital assets (Note 3)
1,674 2,001
Prepaid expenses 250 –
1,924 2,001
Accumulated surplus $ 10,016 $ 7,048
See accompanying notes to financial statements.
Approved on behalf of the Board of Directors:
Steve Orsini Gadi Mayman Chair Chief Executive Officer
PUBLIC ACCOUNTS, 2012-2013 1-137
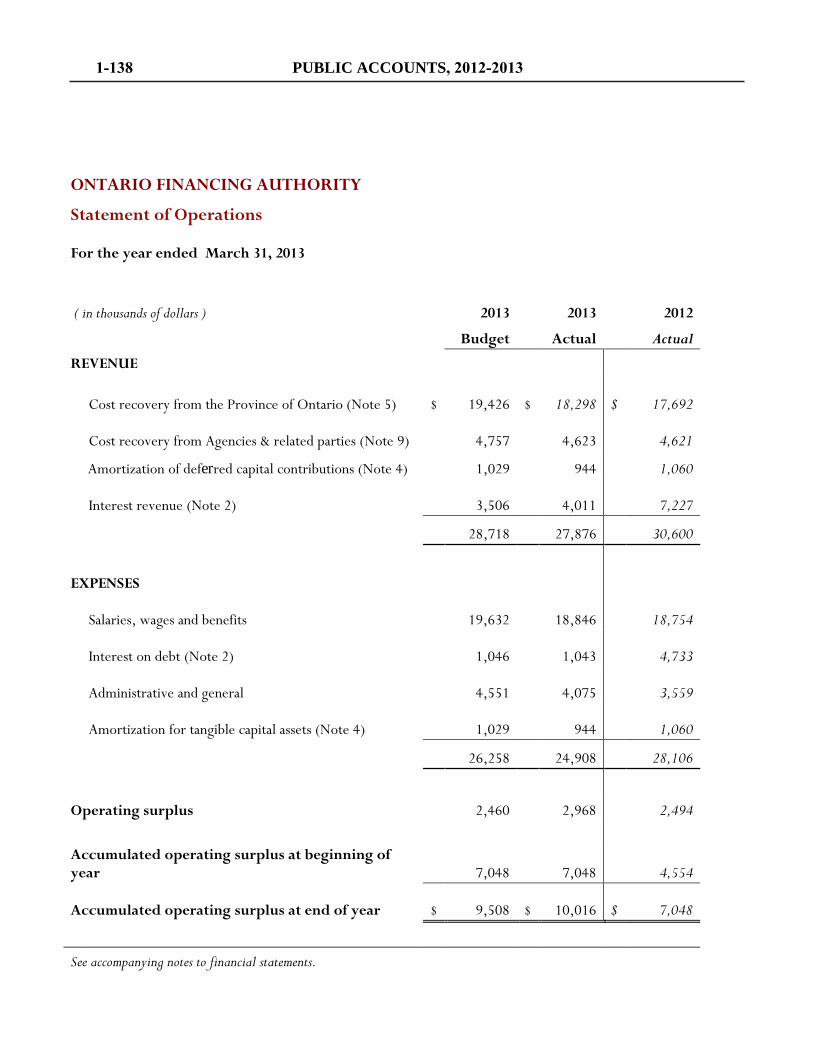
ONTARIO FINANCING AUTHORITY Statement of Operations
For the year ended March 31, 2013
( in thousands of dollars )
2013
2013
2012
Budget Actual Actual
REVENUE
Cost recovery from the Province of Ontario (Note 5) $
19,426 $
18,298 $ 17,692
Cost recovery from Agencies & related parties (Note 9)
4,757
4,623
4,621
1,029 944 1,060
Interest revenue (Note 2)
3,506
4,011
7,227
28,718 27,876 30,600
EXPENSES
Salaries, wages and benefits
19,632
18,846
18,754
Interest on debt (Note 2)
1,046
1,043
4,733
Administrative and general
4,551
4,075
3,559
Amortization for tangible capital assets (Note 4)
1,029 944 1,060
26,258 24,908 28,106
Operating surplus
2,460
2,968
2,494
Accumulated operating surplus at beginning of year
7,048
7,048
4,554
Accumulated operating surplus at end of year $
9,508 $
10,016 $
7,048
See accompanying notes to financial statements.
Amortization of deferred capital contributions (Note 4)
1-138 PUBLIC ACCOUNTS, 2012-2013
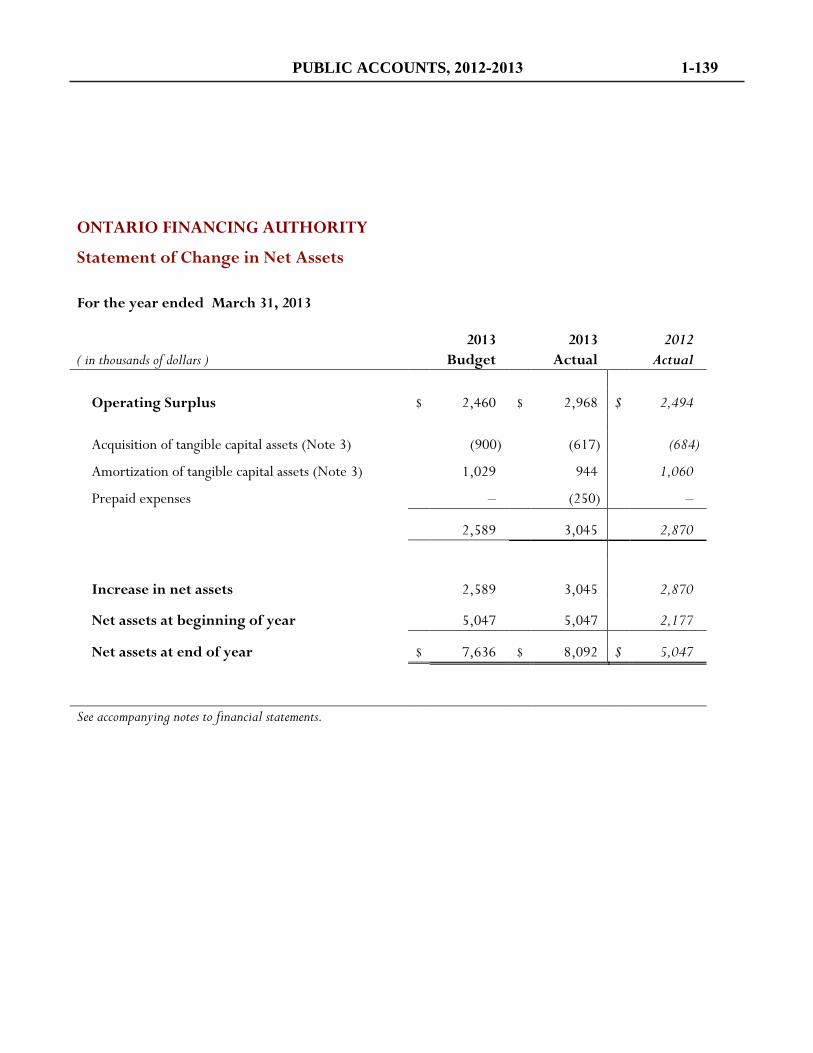
ONTARIO FINANCING AUTHORITY Statement of Change in Net Assets
For the year ended March 31, 2013
2013
2013
2012 ( in thousands of dollars ) Budget Actual Actual
Operating Surplus $ 2,460 $ 2,968 $ 2,494
Acquisition of tangible capital assets (Note 3)
(900)
(617)
(684)
Amortization of tangible capital assets (Note 3)
1,029
944
1,060
Prepaid expenses – (250) –
2,589 3,045 2,870
Increase in net assets
2,589
3,045
2,870
Net assets at beginning of year
5,047
5,047
2,177
Net assets at end of year $ 7,636 $ 8,092 $ 5,047
See accompanying notes to financial statements.
PUBLIC ACCOUNTS, 2012-2013 1-139
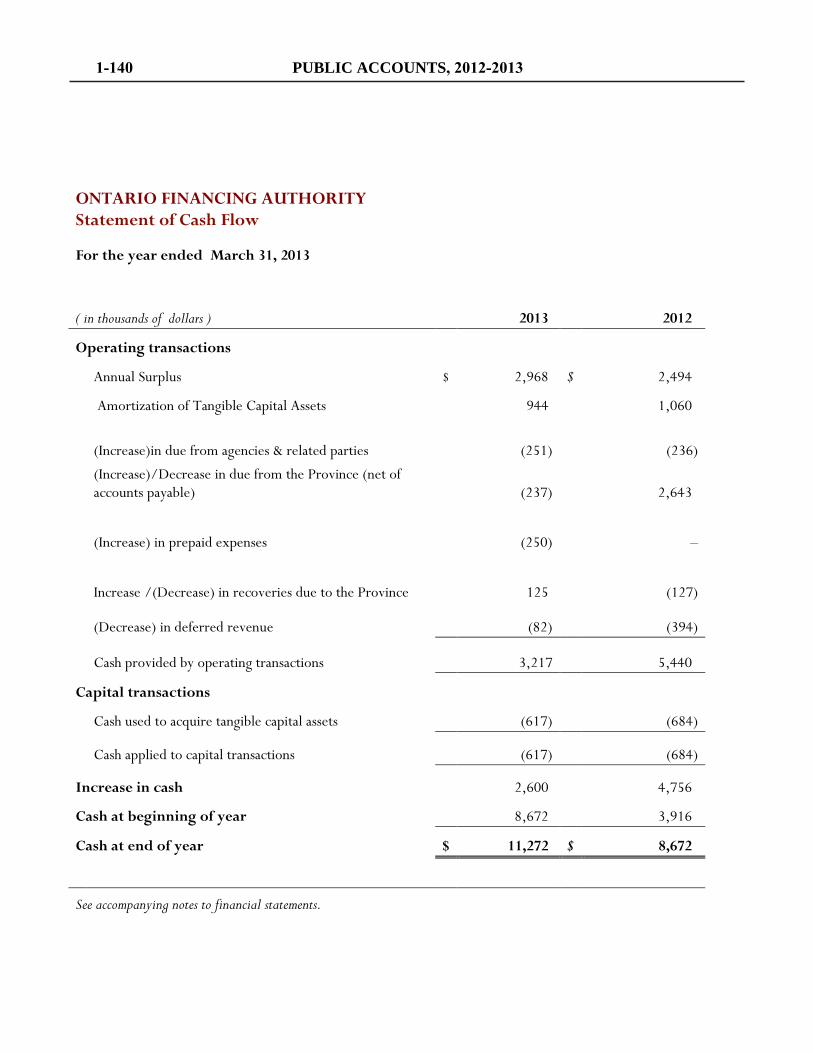
ONTARIO FINANCING AUTHORITY Statement of Cash Flow
For the year ended March 31, 2013
( in thousands of dollars ) 2013 2012
Operating transactions
Annual Surplus $ 2,968 $ 2,494
Amortization of Tangible Capital Assets
944
1,060
(Increase)in due from agencies & related parties
(251)
(236)
(Increase)/Decrease in due from the Province (net of accounts payable)
(237)
2,643
(Increase) in prepaid expenses (250) –
Increase /(Decrease) in recoveries due to the Province
125
(127)
(Decrease) in deferred revenue
(82)
(394)
Cash provided by operating transactions 3,217 5,440
Capital transactions
Cash used to acquire tangible capital assets
(617)
(684)
Cash applied to capital transactions (617) (684)
Increase in cash
2,600
4,756
Cash at beginning of year
8,672
3,916
Cash at end of year $ 11,272 $ 8,672
See accompanying notes to financial statements.
1-140 PUBLIC ACCOUNTS, 2012-2013
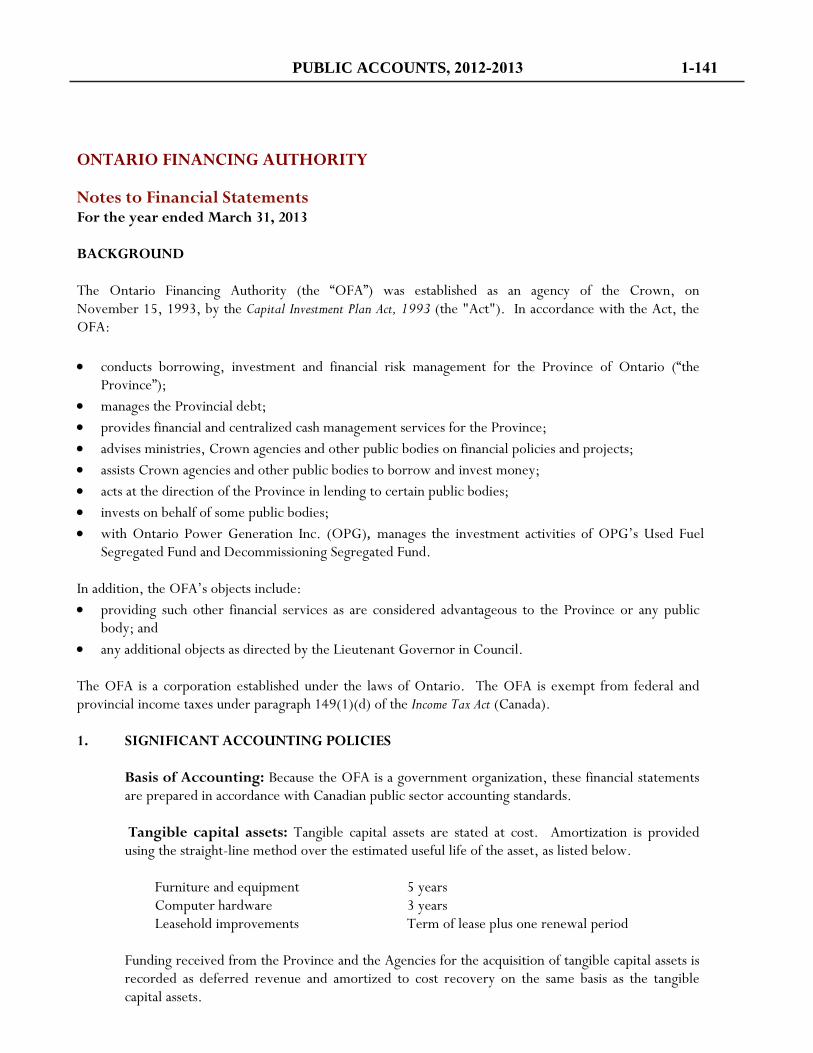
ONTARIO FINANCING AUTHORITY
Notes to Financial Statements For the year ended March 31, 2013 BACKGROUND The Ontario Financing Authority (the “OFA”) was established as an agency of the Crown, on November 15, 1993, by the Capital Investment Plan Act, 1993 (the "Act"). In accordance with the Act, the OFA: • conducts borrowing, investment and financial risk management for the Province of Ontario (“the
Province”); • manages the Provincial debt; • provides financial and centralized cash management services for the Province; • advises ministries, Crown agencies and other public bodies on financial policies and projects; • assists Crown agencies and other public bodies to borrow and invest money; • acts at the direction of the Province in lending to certain public bodies; • invests on behalf of some public bodies; • with Ontario Power Generation Inc. (OPG), manages the investment activities of OPG’s Used Fuel
Segregated Fund and Decommissioning Segregated Fund. In addition, the OFA’s objects include: • providing such other financial services as are considered advantageous to the Province or any public
body; and • any additional objects as directed by the Lieutenant Governor in Council. The OFA is a corporation established under the laws of Ontario. The OFA is exempt from federal and provincial income taxes under paragraph 149(1)(d) of the Income Tax Act (Canada). 1. SIGNIFICANT ACCOUNTING POLICIES
Basis of Accounting: Because the OFA is a government organization, these financial statements
are prepared in accordance with Canadian public sector accounting standards. Tangible capital assets: Tangible capital assets are stated at cost. Amortization is provided
using the straight-line method over the estimated useful life of the asset, as listed below.
Furniture and equipment 5 years Computer hardware 3 years Leasehold improvements Term of lease plus one renewal period
Funding received from the Province and the Agencies for the acquisition of tangible capital assets is
recorded as deferred revenue and amortized to cost recovery on the same basis as the tangible capital assets.
PUBLIC ACCOUNTS, 2012-2013 1-141
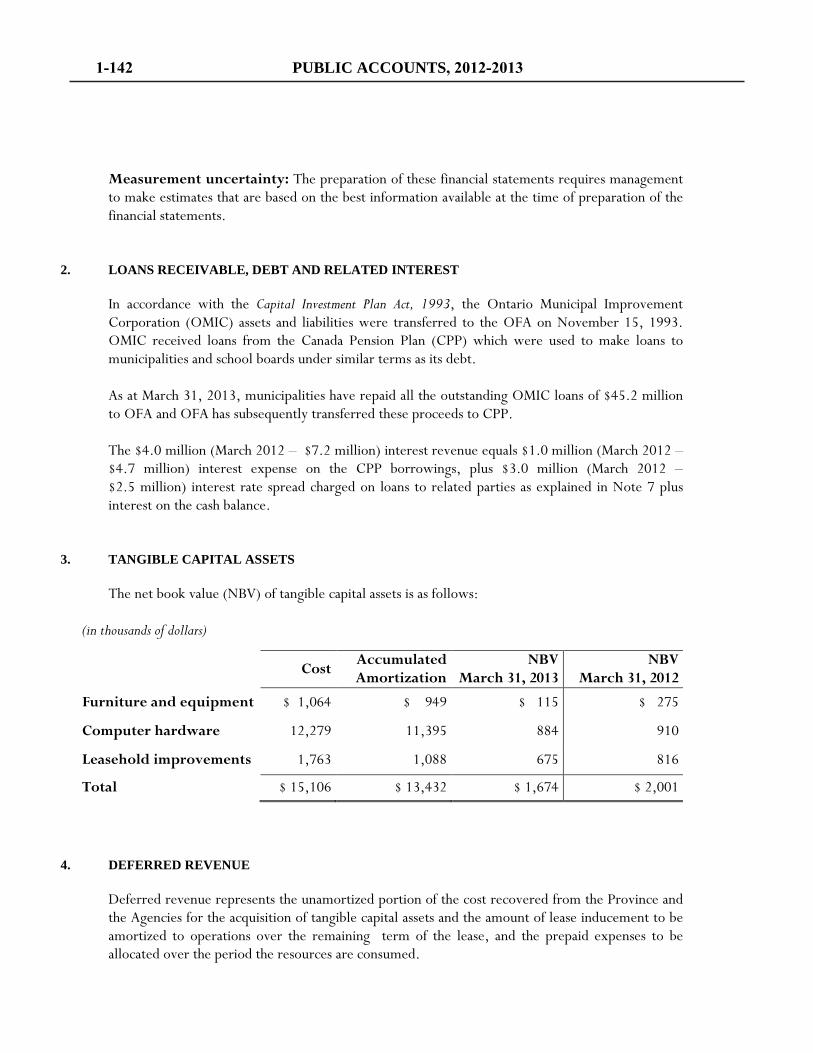
Measurement uncertainty: The preparation of these financial statements requires management
to make estimates that are based on the best information available at the time of preparation of the financial statements.
2. LOANS RECEIVABLE, DEBT AND RELATED INTEREST
In accordance with the Capital Investment Plan Act, 1993, the Ontario Municipal Improvement Corporation (OMIC) assets and liabilities were transferred to the OFA on November 15, 1993. OMIC received loans from the Canada Pension Plan (CPP) which were used to make loans to municipalities and school boards under similar terms as its debt. As at March 31, 2013, municipalities have repaid all the outstanding OMIC loans of $45.2 million to OFA and OFA has subsequently transferred these proceeds to CPP. The $4.0 million (March 2012 – $7.2 million) interest revenue equals $1.0 million (March 2012 – $4.7 million) interest expense on the CPP borrowings, plus $3.0 million (March 2012 – $2.5 million) interest rate spread charged on loans to related parties as explained in Note 7 plus interest on the cash balance.
3. TANGIBLE CAPITAL ASSETS
The net book value (NBV) of tangible capital assets is as follows:
(in thousands of dollars)
Cost Accumulated Amortization
NBV March 31, 2013
NBV March 31, 2012
Furniture and equipment $ 1,064 $ 949 $ 115 $ 275
Computer hardware 12,279 11,395 884 910
Leasehold improvements 1,763 1,088 675 816
Total $ 15,106 $ 13,432 $ 1,674 $ 2,001
4. DEFERRED REVENUE
Deferred revenue represents the unamortized portion of the cost recovered from the Province and the Agencies for the acquisition of tangible capital assets and the amount of lease inducement to be amortized to operations over the remaining term of the lease, and the prepaid expenses to be allocated over the period the resources are consumed.
1-142 PUBLIC ACCOUNTS, 2012-2013
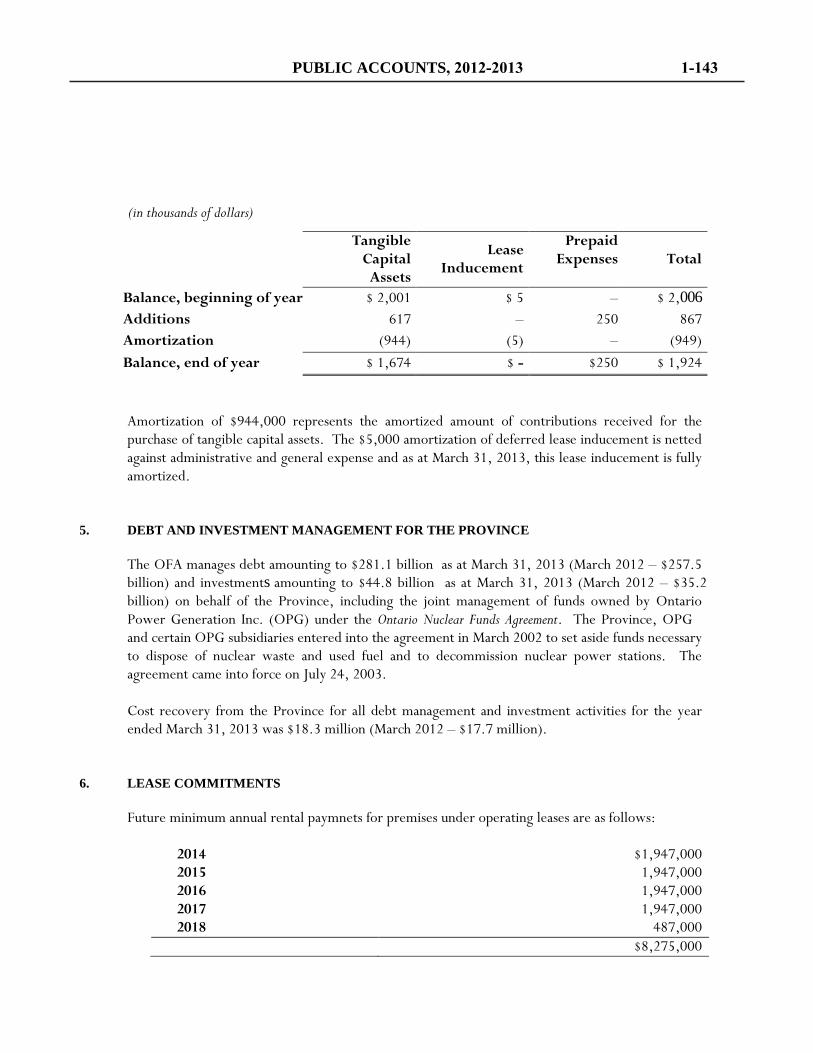
(in thousands of dollars)
Tangible
Capital Assets
Lease Inducement
Prepaid
Expenses
Total
Balance, beginning of year $ 2,001 $ 5 – Additions 617 – 250 867 Amortization (944) (5) – (949) Balance, end of year $ 1,674 $ - $250 $ 1,924 Amortization of $944,000 represents the amortized amount of contributions received for the purchase of tangible capital assets. The $5,000 amortization of deferred lease inducement is netted against administrative and general expense and as at March 31, 2013, this lease inducement is fully amortized.
5. DEBT AND INVESTMENT MANAGEMENT FOR THE PROVINCE
The OFA manages debt amounting to $281.1 billion as at March 31, 2013 (March 2012 – $257.5
billion) and investments amounting to $44.8 billion as at March 31, 2013 (March 2012 – $35.2 billion) on behalf of the Province, including the joint management of funds owned by Ontario Power Generation Inc. (OPG) under the Ontario Nuclear Funds Agreement. The Province, OPG and certain OPG subsidiaries entered into the agreement in March 2002 to set aside funds necessary to dispose of nuclear waste and used fuel and to decommission nuclear power stations. The agreement came into force on July 24, 2003.
Cost recovery from the Province for all debt management and investment activities for the year ended March 31, 2013 was $18.3 million (March 2012 – $17.7 million).
6. LEASE COMMITMENTS Future minimum annual rental paymnets for premises under operating leases are as follows:
2014 $1,947,000 2015 1,947,000 2016 1,947,000 2017 1,947,000 2018 487,000
$8,275,000
$ 2,006
PUBLIC ACCOUNTS, 2012-2013 1-143
7. TRANSACTIONS WITH PUBLIC BODIES The OFA provides financing to various public bodies on direction from the Province. As the OFA is directed by the Province to make these loans in furtherance of stated Provincial initiatives, and these loans are included in the Province’s consolidated financial statements, these transactions are not reflected in these financial statements. Funds for these loans are advanced to the OFA by the Province under credit facilities aggregating $14.5 billion expiring from 2027 to 2040. Principal repayments received from public bodies by the OFA are forwarded to the Province. The interest rates charged to public bodies will generally be slightly higher than the rate charged on the advances from the Province to fund the loans (“the spread”). The OFA will generally retain the spread in order to recover the administrative costs of managing these loans. In some cases the rate charged to the borrower will be similar to the rate that would be charged on the loan by a commercial lender which would reflect the relative risk associated with the loan. As at March 31, 2013, the principal amounts receivable by the OFA on behalf of the Province represent debentures and short term loans. In addition to the outstanding loans below, interest accrued on these loans amounted to $89.5 million (March 2012 – $84.1 million). These are related party transactions, with the exception of those with the Corporation of the City of Windsor and the University of Ontario Institute of Technology.
1-144 PUBLIC ACCOUNTS, 2012-2013
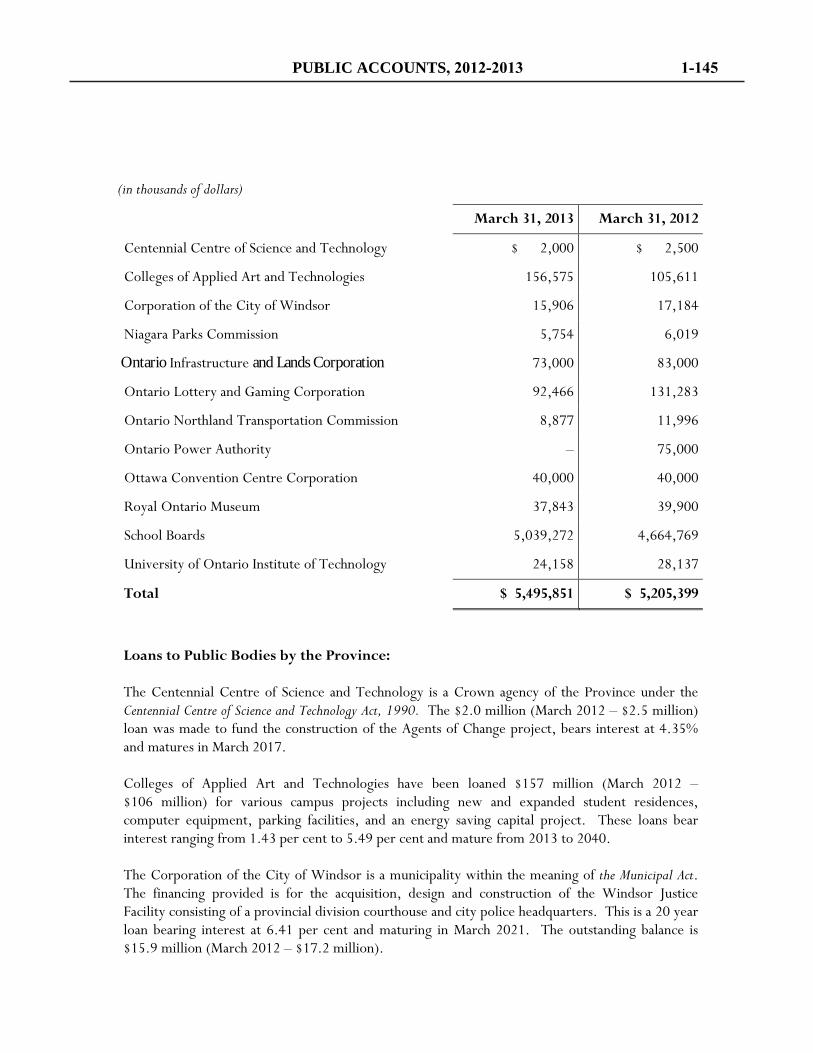
(in thousands of dollars)
March 31, 2013 March 31, 2012
Centennial Centre of Science and Technology $ 2,000 $ 2,500
Colleges of Applied Art and Technologies 156,575 105,611
Corporation of the City of Windsor 15,906 17,184
Niagara Parks Commission 5,754 6,019
73,000 83,000
Ontario Lottery and Gaming Corporation 92,466 131,283
Ontario Northland Transportation Commission 8,877 11,996
Ontario Power Authority – 75,000
Ottawa Convention Centre Corporation 40,000 40,000
Royal Ontario Museum 37,843 39,900
School Boards 5,039,272 4,664,769
University of Ontario Institute of Technology 24,158 28,137
Total $ 5,495,851 $ 5,205,399
Loans to Public Bodies by the Province: The Centennial Centre of Science and Technology is a Crown agency of the Province under the Centennial Centre of Science and Technology Act, 1990. The $2.0 million (March 2012 – $2.5 million) loan was made to fund the construction of the Agents of Change project, bears interest at 4.35% and matures in March 2017. Colleges of Applied Art and Technologies have been loaned $157 million (March 2012 – $106 million) for various campus projects including new and expanded student residences, computer equipment, parking facilities, and an energy saving capital project. These loans bear interest ranging from 1.43 per cent to 5.49 per cent and mature from 2013 to 2040. The Corporation of the City of Windsor is a municipality within the meaning of the Municipal Act. The financing provided is for the acquisition, design and construction of the Windsor Justice Facility consisting of a provincial division courthouse and city police headquarters. This is a 20 year loan bearing interest at 6.41 per cent and maturing in March 2021. The outstanding balance is $15.9 million (March 2012 – $17.2 million).
Ontario Infrastructure and Lands Corporation
PUBLIC ACCOUNTS, 2012-2013 1-145
The Niagara Parks Commission, a Crown agency of the Province, operating under Niagara Parks Act, 1990, has been provided a loan of $5.8 million (March 2012 – $6.0 million) to finance additional capital costs incurred for the redevelopment of phase I of Table Rock House in Queen Victoria Park, Niagara Falls. This bears interest at 5.07 per cent and matures in April 2027. The Ontario Infrastructure and Lands Corporation (OILC) is a Crown agency of the Province under the Ontario Infrastructure and Lands Corporation Act, 2011 and has been provided a Revolving Credit Facility to a maximum amount of $200 million maturing in June 2019. OILC has drawn $73 million (March 2012 – $83 million) bearing interest at rates ranging from 1.59 to 2.64 per cent. The Ontario Lottery and Gaming Corporation (OLG) is a Crown agency of the Province under the Ontario Lottery and Gaming Corporation Act, 1999, and has been provided loans totaling $92 million (March 2012 – $131 million) to fund several projects, bearing interest at rates ranging from 2.32 to 3.22 per cent and maturing from November 2013 to January 2018. The Ontario Northland Transportation Commission (ONTC) is a Crown agency of the Province under the Ontario Northland Transportation Commission Act, 1990. ONTC’s total borrowing of $8.9 million (March 2012 – $12 million) matures from 2014 to 2031 and bears interest ranging from 4.90 to 6.29 per cent. The Ontario Power Authority (OPA) is an independent non-profit corporation under the Electricity Restructuring Act, 2004 and was provided a maximum $975 million credit facility to fund the Regulated Price Plan variance account. The credit facility expires on December 31, 2013. The Authority had a zero draw under this facility as at March 31, 2013 (March 2012 – $75 million). The Ottawa Convention Centre Corporation (OCC) is a Crown agency of the Province under the Capital Investment Plan Act, 1993, and has been provided a loan of $40 million (March 2012 – $40 million) for the purpose of providing term debt to finance part of the construction of the Ottawa Convention Centre. This is a 25 year loan, bears interest at 4.67 per cent and matures in September 2036.Pursuant to a directive signed by the Minister of Finance on November 2, 2012, the Province provided OCC with a repayment deferral of principal and interest up to five years. Interest continues to accrue over the five year deferral period. The Royal Ontario Museum (ROM) is a Crown agency of the Province under a Special Act of the Ontario Legislature and has borrowed $37.8 million (March 2012 – $39.9 million) comprised of $13.2 million at fixed rate 5.04 per cent and $24.6 million at a floating rate currently at 2.68 per cent. All outstanding loans are scheduled to be repaid by March 2027. School boards have been provided loans under various programs beginning in 2006. During the year ended March 31, 2013, school boards were provided with additional loans and made semi-annual blended payments of principal and interest, leaving the total outstanding amount at $5,039 million (March 2012 – $4,665 million). These loans bear interest ranging from 2.42 to 5.38 per cent and mature from 2019 to 2038.
1-146 PUBLIC ACCOUNTS, 2012-2013
The University of Ontario Institute of Technology (UOIT) is a corporation established under the University of Ontario Institute of Technology Act, 2002. The Province has provided a 5 year term loan of $28.1 million bears interest rate at 2.77 per cent and matures in October 2017.
Committed Credit Facilities: At the direction of the Province, the OFA has committed to finance a number of public bodies for which funds have not yet been advanced. The details are as follows: The Deposit Insurance Corporation of Ontario (DICO) was provided a maximum $250 million revolving credit facility expiring on October 31, 2013 to ensure DICO’s capacity to address systemic difficulties in the credit union system or the failure of large institutions that require resources above those in the Deposit Insurance Reserve Fund which is currently valued at approximately $134 million. All principal and interest is required to be repaid by December 31, 2024. DICO has not utilized this credit facility.
8. INVESTMENT MANAGEMENT FOR AGENCIES AND RELATED PARTIES
Deposit Insurance Corporation of Ontario Ontario Immigrant Investor Corporation Northern Ontario Heritage Fund Ontario Infrastructure and Lands Corporation Ontario Capital Growth Corporation Ontario Trillium Foundation Pension Benefits Guarantee Fund
9. DEBT MANAGEMENT FOR AGENCIES AND RELATED PARTIES The OFA provides debt management services on a cost recovery basis to agencies and related
parties as set out below:
Agencies: Ontario Electricity Financial Corporation (OEFC)
The OFA provides financial services and advice on a cost recovery basis to OEFC and manages its debt portfolio of approximately $27.3 billion (March 2012 – $26.9 billion).
Ontario Infrastructure and Lands Corporation (OILC)
The OFA provides financial services and advice on a cost recovery basis to OILC and manages its debt of approximately $5.1 billion (March 2012 -$4.5 billion) including loans from the Province, a provincial agency and third parties.
The OFA provides services, including investment management services, to agencies, related parties and other public bodies as listed below in return for fees amounting to $216,000 for the year ended March 31, 2013 (March 2012 – $206,000). Funds managed on behalf of these entities totaled $ 2,900 million at March 31, 2013 (March 2012 – $2,800 million).
PUBLIC ACCOUNTS, 2012-2013 1-147
Total costs recovered and receivables outstanding at March 31, 2013 are set out below:
(in thousands of dollars)
March 31, 2013 March 31, 2012
Costs Recovered:
OEFC $ 3,471 $ 3,471 OILC 936 944 Other (Note 8) 216 206 Total $ 4,623 $ 4,621
Receivables:
OEFC $ 980 $ 868
OILC 234 234
Other (Note 8) 59 45
Related parties (Note 7) 1,127 1,002
Total $ 2,400 $ 2,149
10. RISK MANAGEMENT AND FINANCIAL INSTRUMENTS
The main risks that the Authority’s financial instruments are exposed to are credit risk, liquidity risk and market risk. Credit risk Credit risk is the risk that the counterparty to a financial instrument may fail to discharge an obligation or commitment that it has entered into. The Authority is exposed to credit risk relating to the collection of receivables from the Province of Ontario. The risk is minimal as most of the receivables are from the Province of Ontario. The risk of not collecting the receivables related to OEFC, OILC and others is also considered to be minimal.
1-148 PUBLIC ACCOUNTS, 2012-2013
Liquidity risk The Authority’s exposure to liquidity risk is minimal as all operating and capital expenses are cost recovered from the Province of Ontario and therefore liquidity risk is low. Market risk The market risk arises from the possibility that changes in market prices will affect the value of the financial instruments of the Authority. The Authority is not exposed to market risk.
11. FUTURE EMPLOYEE BENEFITS
The OFA provides pension benefits to its full-time employees through participation in the Public Service Pension Plan, which is a multi-employer defined benefit pension plan established by the Province of Ontario. The Ministry of Government Services (MGS) is responsible for funding the employer’s contribution to the Pension Fund and accordingly, the OFA has no additional liability for these future costs. In addition, the cost of post-retirement, non-pension benefits is paid by MGS and is not reported in these financial statements.
12. CONTINGENCIES AND COMMITMENTS
At March 31, 2013, there were no claims under which the OFA would be financially liable. The Province continues to guarantee the term deposits issued by the Province of Ontario Savings Office prior to 2003.
13. COMPARATIVE FIGURES Certain of the prior year’s comparative figures have been reclassified to conform to the financial statement presentation adopted for the 2012–13 fiscal year.
PUBLIC ACCOUNTS, 2012-2013 1-149

ONTARIO FRENCH-LANGUAGE EDUCATIONAL COMMUNICATIONS AUTHORITY (OFLECA)
MANAGEMENT’S REPORT
June 21, 2013 Management of the Ontario French-language Educational Communications Authority (OFLECA) is responsible for the financial statements, the notes to the financial statements and all other financial information contained in this financial report. Management has prepared the financial statements in accordance with Canadian public sector accounting standards for government not-for-profit organizations. In order to achieve the objective of fair presentation in all material respects, reasonable estimates and professional judgements were used. Management believes the financial statements present fairly the OFLECA’s financial position as at March 31, 2013, March 31, 2012 and April 1, 2011 as well as the results of its operations and its cash flows for the years ended March 31, 2013 and March 31, 2012. In fulfilling its responsibilities and recognizing the limits inherent in all systems, Management has developed and maintains a system of internal controls designed to provide reasonable assurance that the OFLECA’s assets are safeguarded from loss and that the accounting records are a reliable basis for the preparation of financial statements. The Board of Directors is responsible for ensuring that the OFLECA’s Management fulfills its responsibilities for financial reporting and is ultimately responsible for reviewing and approving the financial statements. The Board of Directors carries out its responsibility for review of the financial statements principally through the Audit Committee. The Audit Committee meets with Management and the external auditors to discuss the results of audit examinations and financial reporting matters and to satisfy itself that each party is properly discharging its responsibilities. The external auditors have full access to the Audit Committee with or without the presence of Management. The financial statements for the years ended March 31, 2013 and March 31, 2012 have been audited by Marcil Lavallée, Chartered Accountants, Licensed Public Accountants, the independent external auditors appointed by the members of the OFLECA. The accompanying Independent Auditor’s Report outlines their responsibilities, the scope of their examination and their professional opinion on the financial statements.
_______________________________________________
Glenn O’Farrell Chief Executive Officer
________________________________________________ Lisa Larsen, CPA, CA
Chief Financial Officer, Interim Toronto, Ontario June 21, 2013
PUBLIC ACCOUNTS, 2012-2013 1-151
INDEPENDENT AUDITOR'S REPORT To the Directors of Ontario French-language Educational Communications Authority We have audited the accompanying financial statements of the Ontario French-language Educational Communications Authority (OFLECA), which comprise the statements of financial position as at March 31, 2013, March 31, 2012 and April 1, 2011 as well as the statements of operations, changes in net assets and cash flows for the years ended March 31, 2013 and March 31, 2012, and a summary of significant accounting policies and other explanatory information. Management's Responsibility for the Financial Statements
Management is responsible for the preparation and fair presentation of these financial statements in accordance with Canadian public sector accounting standards for government not-for-profit organizations and for such internal control as management determines is necessary to enable the preparation of financial statements that are free from material misstatement, whether due to fraud or error. Auditor's Responsibility
Our responsibility is to express an opinion on these financial statements based on our audits. We conducted our audits in accordance with Canadian generally accepted auditing standards. Those standards require that we comply with ethical requirements and plan and perform the audit to obtain reasonable assurance about whether the financial statements are free from material misstatement. An audit involves performing procedures to obtain audit evidence about the amounts and disclosures in the financial statements. The procedures selected depend on the auditor's judgment, including the assessment of the risks of material misstatement of the financial statements, whether due to fraud or error. In making those risk assessments, the auditor considers internal control relevant to the entity's preparation and fair presentation of the financial statements in order to design audit procedures that are appropriate in the circumstances, but not for the purpose of expressing an opinion on the effectiveness of the entity's internal control. An audit also includes evaluating the appropriateness of accounting policies used and the reasonableness of accounting estimates made by management, as well as evaluating the overall presentation of the financial statements. We believe that the audit evidence we have obtained during our audits is sufficient and appropriate to provide a basis for our audit opinion.
1-152 PUBLIC ACCOUNTS, 2012-2013
Opinion
In our opinion, the financial statements present fairly, in all material respects, the financial position of the Ontario French-language Educational Communications Authority as at March 31, 2013, March 31, 2012 and April 1, 2011 as well as the results of its operations and its cash flows for the years ended March 31, 2013 and March 31, 2012 in accordance with Canadian public sector accounting standards for government not-for-profit organizations.
Chartered Accountants, Licensed Public Accountant
Ottawa, Ontario June 21, 2013
PUBLIC ACCOUNTS, 2012-2013 1-153
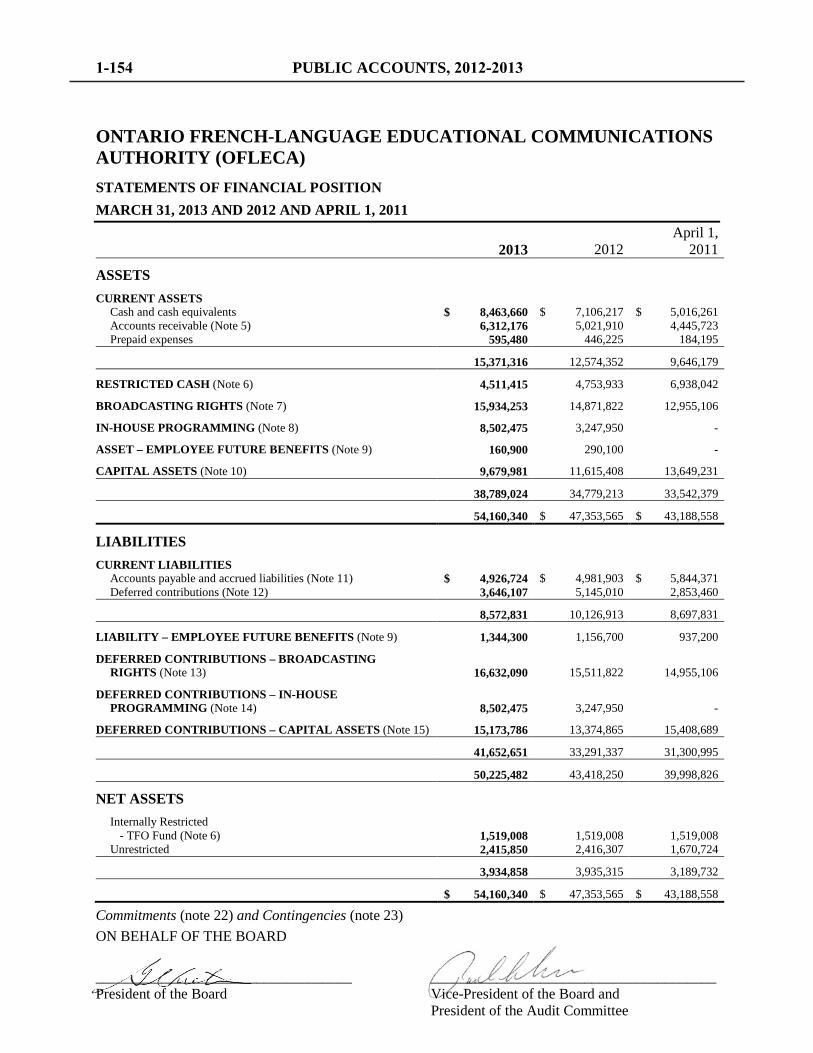
ONTARIO FRENCH-LANGUAGE EDUCATIONAL COMMUNICATIONS AUTHORITY (OFLECA) STATEMENTS OF FINANCIAL POSITION MARCH 31, 2013 AND 2012 AND APRIL 1, 2011
2013 2012 April 1,
2011
ASSETS
CURRENT ASSETS Cash and cash equivalents $ 8,463,660 $ 7,106,217 $ 5,016,261 Accounts receivable (Note 5) 6,312,176 5,021,910 4,445,723 Prepaid expenses 595,480 446,225 184,195
15,371,316 12,574,352 9,646,179
RESTRICTED CASH (Note 6) 4,511,415 4,753,933 6,938,042
BROADCASTING RIGHTS (Note 7) 15,934,253 14,871,822 12,955,106
IN-HOUSE PROGRAMMING (Note 8) 8,502,475 3,247,950 -
ASSET – EMPLOYEE FUTURE BENEFITS (Note 9) 160,900 290,100 -
CAPITAL ASSETS (Note 10) 9,679,981 11,615,408 13,649,231
38,789,024 34,779,213 33,542,379
54,160,340 $ 47,353,565 $ 43,188,558
LIABILITIES
CURRENT LIABILITIES Accounts payable and accrued liabilities (Note 11) $ 4,926,724 $ 4,981,903 $ 5,844,371 Deferred contributions (Note 12) 3,646,107 5,145,010 2,853,460
8,572,831 10,126,913 8,697,831
LIABILITY – EMPLOYEE FUTURE BENEFITS (Note 9) 1,344,300 1,156,700 937,200
DEFERRED CONTRIBUTIONS – BROADCASTING RIGHTS (Note 13) 16,632,090 15,511,822 14,955,106
DEFERRED CONTRIBUTIONS – IN-HOUSE PROGRAMMING (Note 14) 8,502,475 3,247,950 -
DEFERRED CONTRIBUTIONS – CAPITAL ASSETS (Note 15) 15,173,786 13,374,865 15,408,689
41,652,651 33,291,337 31,300,995
50,225,482 43,418,250 39,998,826
NET ASSETS
Internally Restricted - TFO Fund (Note 6) 1,519,008 1,519,008 1,519,008
Unrestricted 2,415,850 2,416,307 1,670,724
3,934,858 3,935,315 3,189,732
$ 54,160,340 $ 47,353,565 $ 43,188,558
Commitments (note 22) and Contingencies (note 23) ON BEHALF OF THE BOARD
___________________________________ _______________________________________ President of the Board Vice-President of the Board and President of the Audit Committee
1-154 PUBLIC ACCOUNTS, 2012-2013
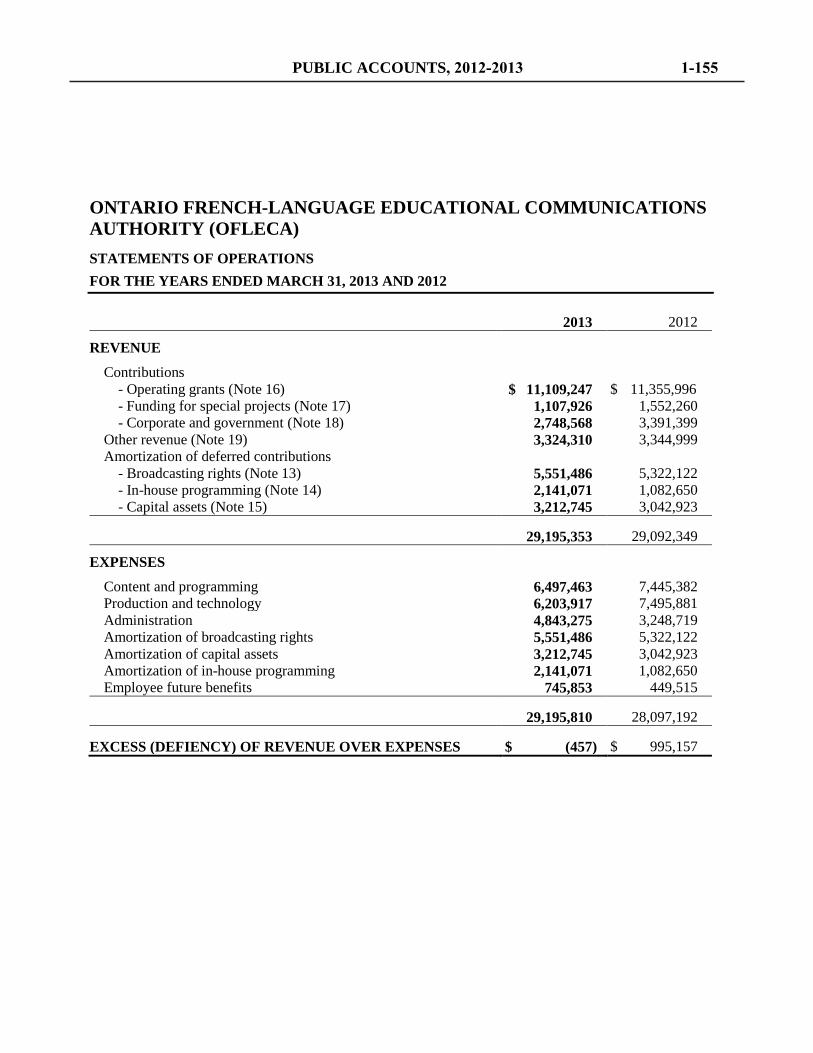
ONTARIO FRENCH-LANGUAGE EDUCATIONAL COMMUNICATIONS AUTHORITY (OFLECA) STATEMENTS OF OPERATIONS FOR THE YEARS ENDED MARCH 31, 2013 AND 2012
2013 2012
REVENUE
Contributions - Operating grants (Note 16) $ 11,109,247 $ 11,355,996 - Funding for special projects (Note 17) 1,107,926 1,552,260 - Corporate and government (Note 18) 2,748,568 3,391,399
Other revenue (Note 19) 3,324,310 3,344,999 Amortization of deferred contributions
- Broadcasting rights (Note 13) 5,551,486 5,322,122 - In-house programming (Note 14) 2,141,071 1,082,650 - Capital assets (Note 15) 3,212,745 3,042,923
29,195,353 29,092,349
EXPENSES
Content and programming 6,497,463 7,445,382 Production and technology 6,203,917 7,495,881 Administration 4,843,275 3,248,719 Amortization of broadcasting rights 5,551,486 5,322,122 Amortization of capital assets 3,212,745 3,042,923 Amortization of in-house programming 2,141,071 1,082,650 Employee future benefits 745,853 449,515
29,195,810 28,097,192
EXCESS (DEFIENCY) OF REVENUE OVER EXPENSES $ (457) $ 995,157
PUBLIC ACCOUNTS, 2012-2013 1-155
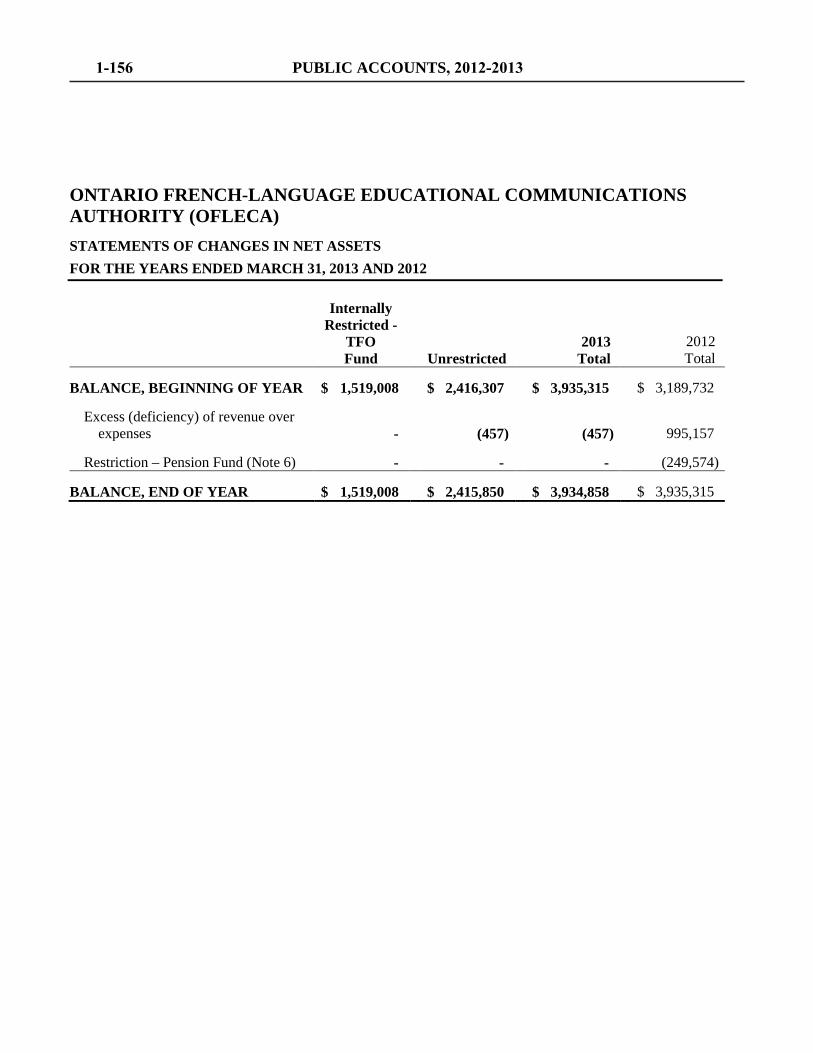
ONTARIO FRENCH-LANGUAGE EDUCATIONAL COMMUNICATIONS AUTHORITY (OFLECA) STATEMENTS OF CHANGES IN NET ASSETS FOR THE YEARS ENDED MARCH 31, 2013 AND 2012
Internally Restricted -
TFO Fund
Unrestricted
2013 Total
2012 Total
BALANCE, BEGINNING OF YEAR $ 1,519,008
$ 2,416,307 $ 3,935,315 $ 3,189,732
Excess (deficiency) of revenue over expenses - (457) (457) 995,157
Restriction – Pension Fund (Note 6) - - - (249,574)
BALANCE, END OF YEAR $ 1,519,008
$ 2,415,850 $ 3,934,858 $ 3,935,315
1-156 PUBLIC ACCOUNTS, 2012-2013
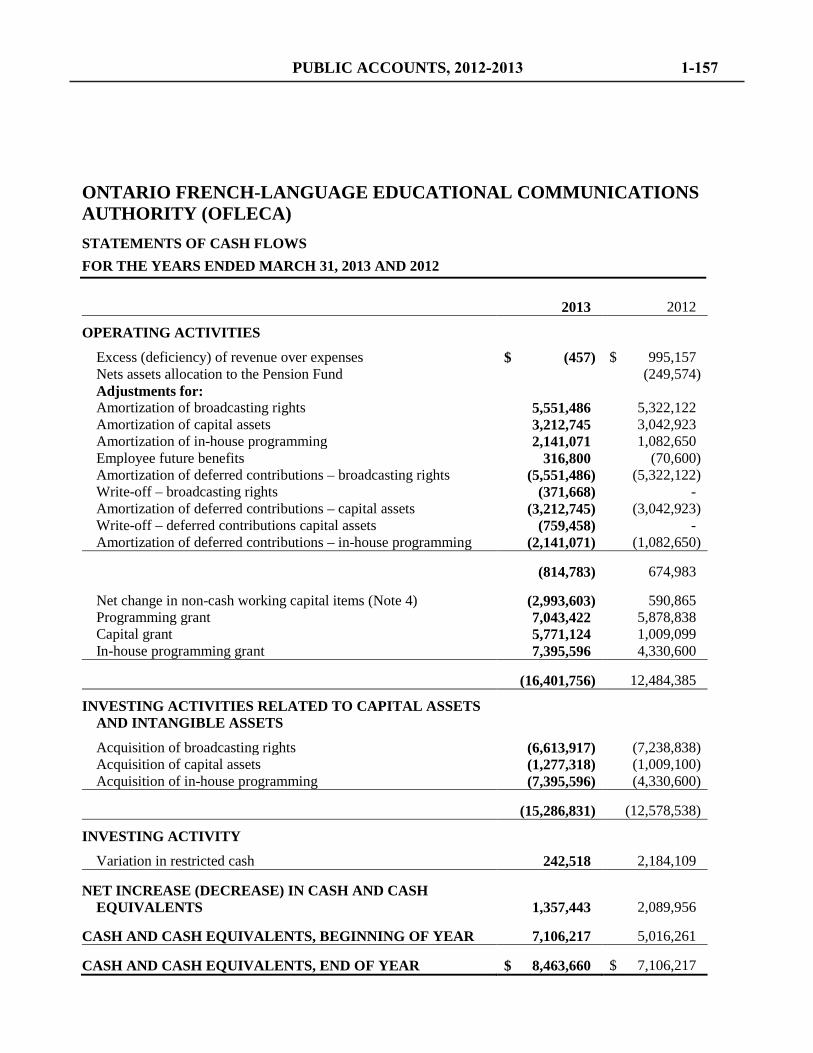
ONTARIO FRENCH-LANGUAGE EDUCATIONAL COMMUNICATIONS AUTHORITY (OFLECA) STATEMENTS OF CASH FLOWS FOR THE YEARS ENDED MARCH 31, 2013 AND 2012
2013 2012
OPERATING ACTIVITIES
Excess (deficiency) of revenue over expenses $ (457) $ 995,157 Nets assets allocation to the Pension Fund (249,574) Adjustments for: Amortization of broadcasting rights 5,551,486 5,322,122 Amortization of capital assets 3,212,745 3,042,923 Amortization of in-house programming 2,141,071 1,082,650 Employee future benefits 316,800 (70,600) Amortization of deferred contributions – broadcasting rights (5,551,486) (5,322,122) Write-off – broadcasting rights (371,668) - Amortization of deferred contributions – capital assets (3,212,745) (3,042,923) Write-off – deferred contributions capital assets (759,458) - Amortization of deferred contributions – in-house programming (2,141,071) (1,082,650)
(814,783) 674,983
Net change in non-cash working capital items (Note 4) (2,993,603) 590,865 Programming grant 7,043,422 5,878,838 Capital grant 5,771,124 1,009,099 In-house programming grant 7,395,596 4,330,600
(16,401,756) 12,484,385
INVESTING ACTIVITIES RELATED TO CAPITAL ASSETS AND INTANGIBLE ASSETS
Acquisition of broadcasting rights (6,613,917) (7,238,838) Acquisition of capital assets (1,277,318) (1,009,100) Acquisition of in-house programming (7,395,596) (4,330,600)
(15,286,831) (12,578,538)
INVESTING ACTIVITY
Variation in restricted cash 242,518 2,184,109
NET INCREASE (DECREASE) IN CASH AND CASH EQUIVALENTS 1,357,443 2,089,956
CASH AND CASH EQUIVALENTS, BEGINNING OF YEAR 7,106,217 5,016,261
CASH AND CASH EQUIVALENTS, END OF YEAR $ 8,463,660 $ 7,106,217
PUBLIC ACCOUNTS, 2012-2013 1-157
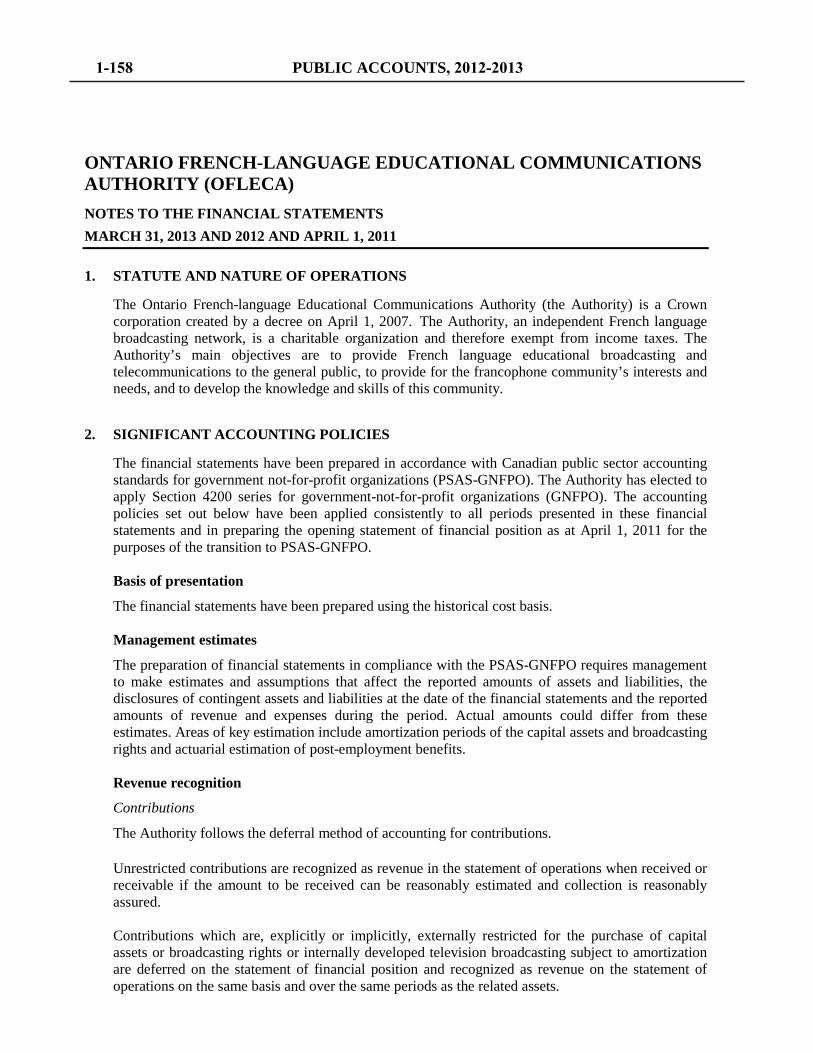
ONTARIO FRENCH-LANGUAGE EDUCATIONAL COMMUNICATIONS AUTHORITY (OFLECA) NOTES TO THE FINANCIAL STATEMENTS MARCH 31, 2013 AND 2012 AND APRIL 1, 2011 1. STATUTE AND NATURE OF OPERATIONS
The Ontario French-language Educational Communications Authority (the Authority) is a Crown corporation created by a decree on April 1, 2007. The Authority, an independent French language broadcasting network, is a charitable organization and therefore exempt from income taxes. The Authority’s main objectives are to provide French language educational broadcasting and telecommunications to the general public, to provide for the francophone community’s interests and needs, and to develop the knowledge and skills of this community.
2. SIGNIFICANT ACCOUNTING POLICIES
The financial statements have been prepared in accordance with Canadian public sector accounting standards for government not-for-profit organizations (PSAS-GNFPO). The Authority has elected to apply Section 4200 series for government-not-for-profit organizations (GNFPO). The accounting policies set out below have been applied consistently to all periods presented in these financial statements and in preparing the opening statement of financial position as at April 1, 2011 for the purposes of the transition to PSAS-GNFPO. Basis of presentation
The financial statements have been prepared using the historical cost basis. Management estimates
The preparation of financial statements in compliance with the PSAS-GNFPO requires management to make estimates and assumptions that affect the reported amounts of assets and liabilities, the disclosures of contingent assets and liabilities at the date of the financial statements and the reported amounts of revenue and expenses during the period. Actual amounts could differ from these estimates. Areas of key estimation include amortization periods of the capital assets and broadcasting rights and actuarial estimation of post-employment benefits. Revenue recognition
Contributions
The Authority follows the deferral method of accounting for contributions. Unrestricted contributions are recognized as revenue in the statement of operations when received or receivable if the amount to be received can be reasonably estimated and collection is reasonably assured. Contributions which are, explicitly or implicitly, externally restricted for the purchase of capital assets or broadcasting rights or internally developed television broadcasting subject to amortization are deferred on the statement of financial position and recognized as revenue on the statement of operations on the same basis and over the same periods as the related assets.
1-158 PUBLIC ACCOUNTS, 2012-2013
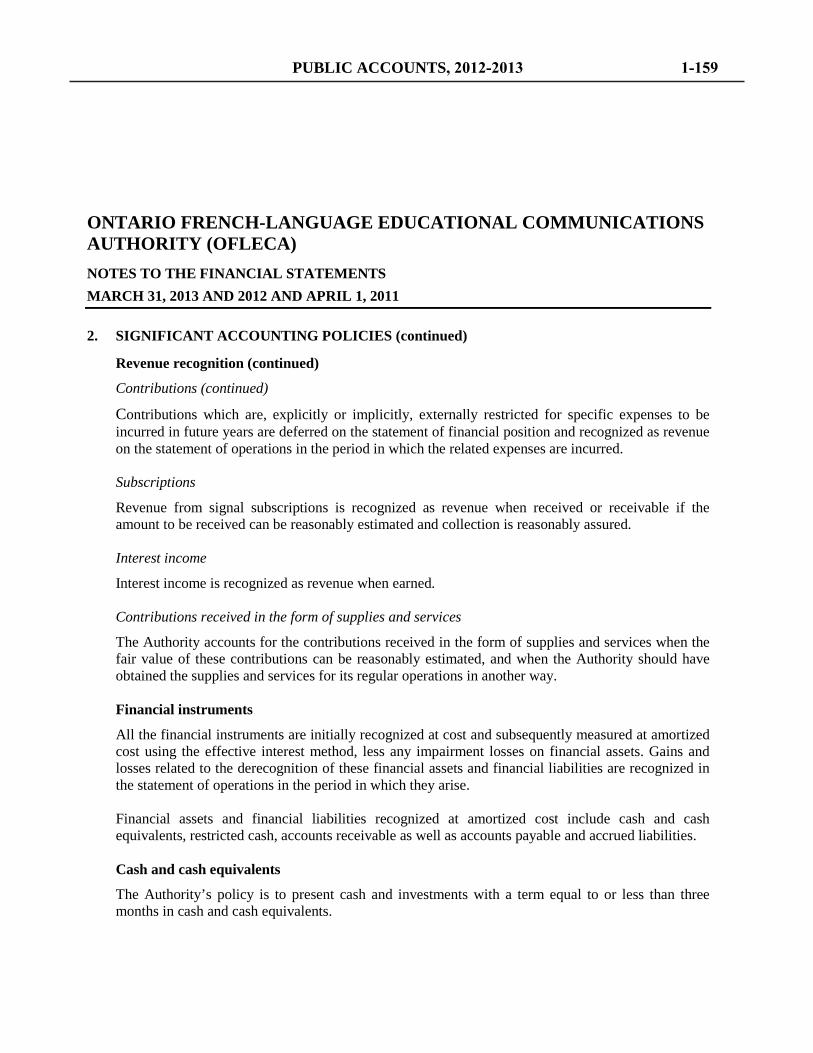
ONTARIO FRENCH-LANGUAGE EDUCATIONAL COMMUNICATIONS AUTHORITY (OFLECA) NOTES TO THE FINANCIAL STATEMENTS MARCH 31, 2013 AND 2012 AND APRIL 1, 2011 2. SIGNIFICANT ACCOUNTING POLICIES (continued)
Revenue recognition (continued)
Contributions (continued)
Contributions which are, explicitly or implicitly, externally restricted for specific expenses to be incurred in future years are deferred on the statement of financial position and recognized as revenue on the statement of operations in the period in which the related expenses are incurred.
Subscriptions
Revenue from signal subscriptions is recognized as revenue when received or receivable if the amount to be received can be reasonably estimated and collection is reasonably assured. Interest income
Interest income is recognized as revenue when earned. Contributions received in the form of supplies and services
The Authority accounts for the contributions received in the form of supplies and services when the fair value of these contributions can be reasonably estimated, and when the Authority should have obtained the supplies and services for its regular operations in another way. Financial instruments
All the financial instruments are initially recognized at cost and subsequently measured at amortized cost using the effective interest method, less any impairment losses on financial assets. Gains and losses related to the derecognition of these financial assets and financial liabilities are recognized in the statement of operations in the period in which they arise. Financial assets and financial liabilities recognized at amortized cost include cash and cash equivalents, restricted cash, accounts receivable as well as accounts payable and accrued liabilities. Cash and cash equivalents
The Authority’s policy is to present cash and investments with a term equal to or less than three months in cash and cash equivalents.
PUBLIC ACCOUNTS, 2012-2013 1-159
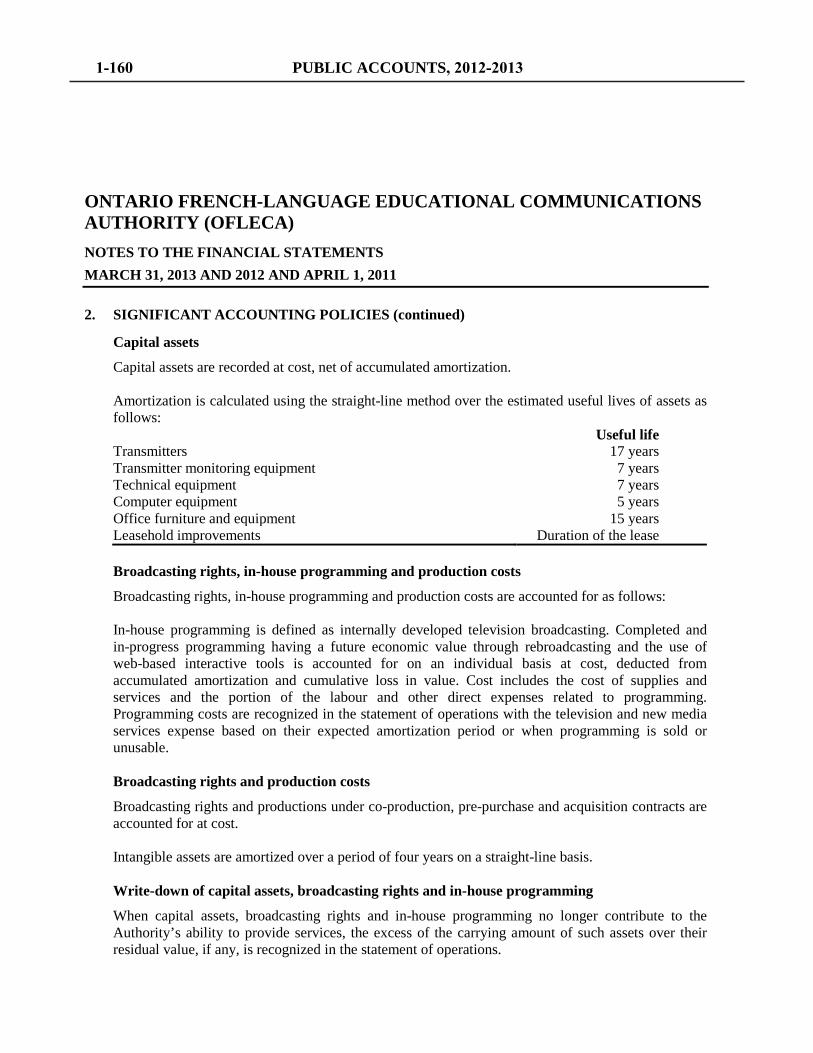
ONTARIO FRENCH-LANGUAGE EDUCATIONAL COMMUNICATIONS AUTHORITY (OFLECA) NOTES TO THE FINANCIAL STATEMENTS MARCH 31, 2013 AND 2012 AND APRIL 1, 2011 2. SIGNIFICANT ACCOUNTING POLICIES (continued)
Capital assets
Capital assets are recorded at cost, net of accumulated amortization. Amortization is calculated using the straight-line method over the estimated useful lives of assets as follows: Useful life Transmitters 17 years Transmitter monitoring equipment 7 years Technical equipment 7 years Computer equipment 5 years Office furniture and equipment 15 years Leasehold improvements Duration of the lease Broadcasting rights, in-house programming and production costs
Broadcasting rights, in-house programming and production costs are accounted for as follows: In-house programming is defined as internally developed television broadcasting. Completed and in-progress programming having a future economic value through rebroadcasting and the use of web-based interactive tools is accounted for on an individual basis at cost, deducted from accumulated amortization and cumulative loss in value. Cost includes the cost of supplies and services and the portion of the labour and other direct expenses related to programming. Programming costs are recognized in the statement of operations with the television and new media services expense based on their expected amortization period or when programming is sold or unusable. Broadcasting rights and production costs
Broadcasting rights and productions under co-production, pre-purchase and acquisition contracts are accounted for at cost. Intangible assets are amortized over a period of four years on a straight-line basis. Write-down of capital assets, broadcasting rights and in-house programming
When capital assets, broadcasting rights and in-house programming no longer contribute to the Authority’s ability to provide services, the excess of the carrying amount of such assets over their residual value, if any, is recognized in the statement of operations.
1-160 PUBLIC ACCOUNTS, 2012-2013
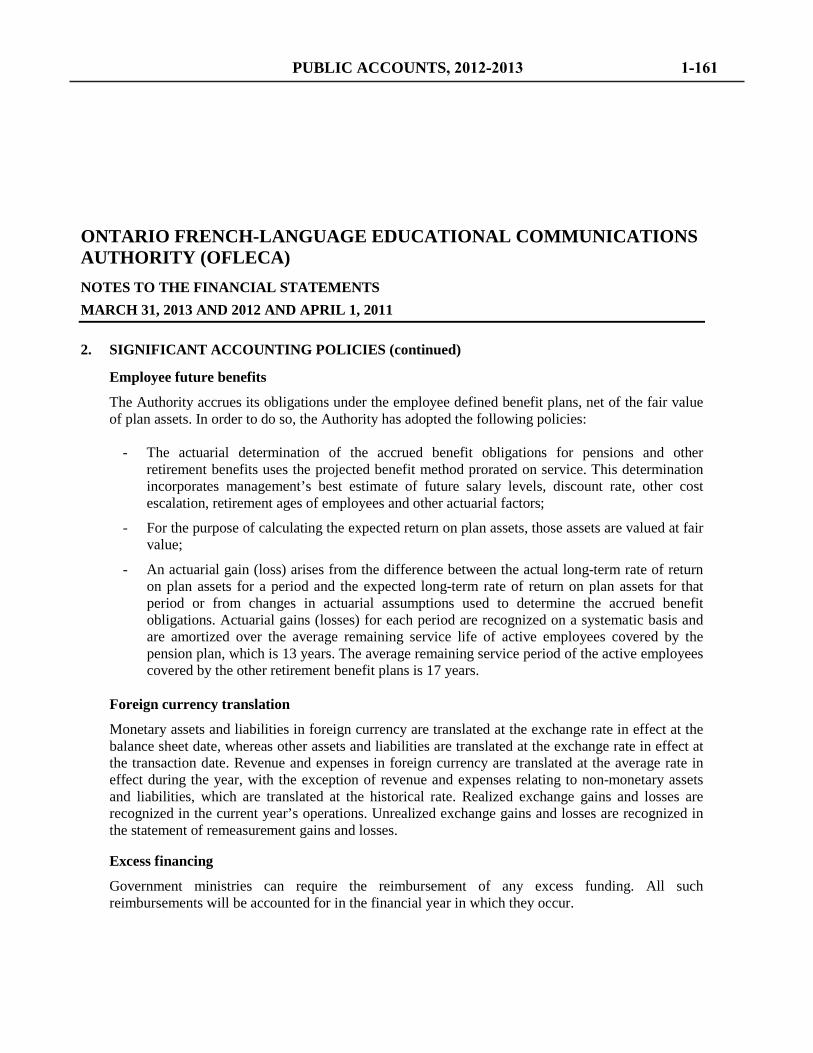
ONTARIO FRENCH-LANGUAGE EDUCATIONAL COMMUNICATIONS AUTHORITY (OFLECA) NOTES TO THE FINANCIAL STATEMENTS MARCH 31, 2013 AND 2012 AND APRIL 1, 2011 2. SIGNIFICANT ACCOUNTING POLICIES (continued)
Employee future benefits
The Authority accrues its obligations under the employee defined benefit plans, net of the fair value of plan assets. In order to do so, the Authority has adopted the following policies:
- The actuarial determination of the accrued benefit obligations for pensions and other retirement benefits uses the projected benefit method prorated on service. This determination incorporates management’s best estimate of future salary levels, discount rate, other cost escalation, retirement ages of employees and other actuarial factors;
- For the purpose of calculating the expected return on plan assets, those assets are valued at fair value;
- An actuarial gain (loss) arises from the difference between the actual long-term rate of return on plan assets for a period and the expected long-term rate of return on plan assets for that period or from changes in actuarial assumptions used to determine the accrued benefit obligations. Actuarial gains (losses) for each period are recognized on a systematic basis and are amortized over the average remaining service life of active employees covered by the pension plan, which is 13 years. The average remaining service period of the active employees covered by the other retirement benefit plans is 17 years.
Foreign currency translation
Monetary assets and liabilities in foreign currency are translated at the exchange rate in effect at the balance sheet date, whereas other assets and liabilities are translated at the exchange rate in effect at the transaction date. Revenue and expenses in foreign currency are translated at the average rate in effect during the year, with the exception of revenue and expenses relating to non-monetary assets and liabilities, which are translated at the historical rate. Realized exchange gains and losses are recognized in the current year’s operations. Unrealized exchange gains and losses are recognized in the statement of remeasurement gains and losses.
Excess financing
Government ministries can require the reimbursement of any excess funding. All such reimbursements will be accounted for in the financial year in which they occur.
PUBLIC ACCOUNTS, 2012-2013 1-161

ONTARIO FRENCH-LANGUAGE EDUCATIONAL COMMUNICATIONS AUTHORITY (OFLECA) NOTES TO THE FINANCIAL STATEMENTS MARCH 31, 2013 AND 2012 AND APRIL 1, 2011 3. ADOPTION OF NEW ACCOUNTING STANDARDS
The Authority adopted the PSAS-GNFPO effective April 1, 2011. These standards were retrospectively adopted and therefore, the 2012 comparative figures have been restated. Key adjustments resulting from the adoption of these accounting standards are as follows: (a) The financial statements for the year ended March 31, 2012 have been adjusted to record as
deferred contributions certain contributions previously recognized in the statement of operations. Previously, the contributions received for the purchase of amortizable broadcasting rights and capital assets were not deferred and recognized as revenue on the same basis and over the same periods as the related assets acquired. These contributions are considered to be subject to implicit external restrictions.
(b) The Authority made an adjustment to the financial statements for the year ended March 31, 2012 with respect to the accounting for employee future benefits. Specifically, this adjustment related to accounting policy difference under public sector accounting standards with respect to the timing of recognition of the past service costs. In addition, at the date of transition, all previously unrecognized cumulative actuarial gains and losses were recognized in the net assets as of April 1, 2011.
The impact of these restatements on the comparative figures is as follows:
Summary of adjustments Statement of financial position as at April 1, 2011 Net assets as at April 1, 2011:
Net assets, as previously reported $ 12,746,138 Adjustment to deferred contributions – broadcasting rights (9,287,612) Adjustment to deferred contributions – capital assets (220,794) Adjustment to accrued benefit liability – other plans 164,500 Adjustment to accrued benefit asset – pension plan (212,500)
Net assets reported under the new accounting standards $ 3,189,732 Statement of financial position as at March 31, 2012 Net assets as at March 31, 2012:
Net assets, as previously reported $ 12,508,742 Adjustment to deferred contributions – broadcasting rights (8,339,681) Adjustment to deferred contributions – capital assets (64,646) Adjustment to accrued benefit liability – other plans 106,600 Adjustment to accrued benefit asset – pension plan (275,700)
Net assets reported under the new accounting standards $ 3,935,315
1-162 PUBLIC ACCOUNTS, 2012-2013
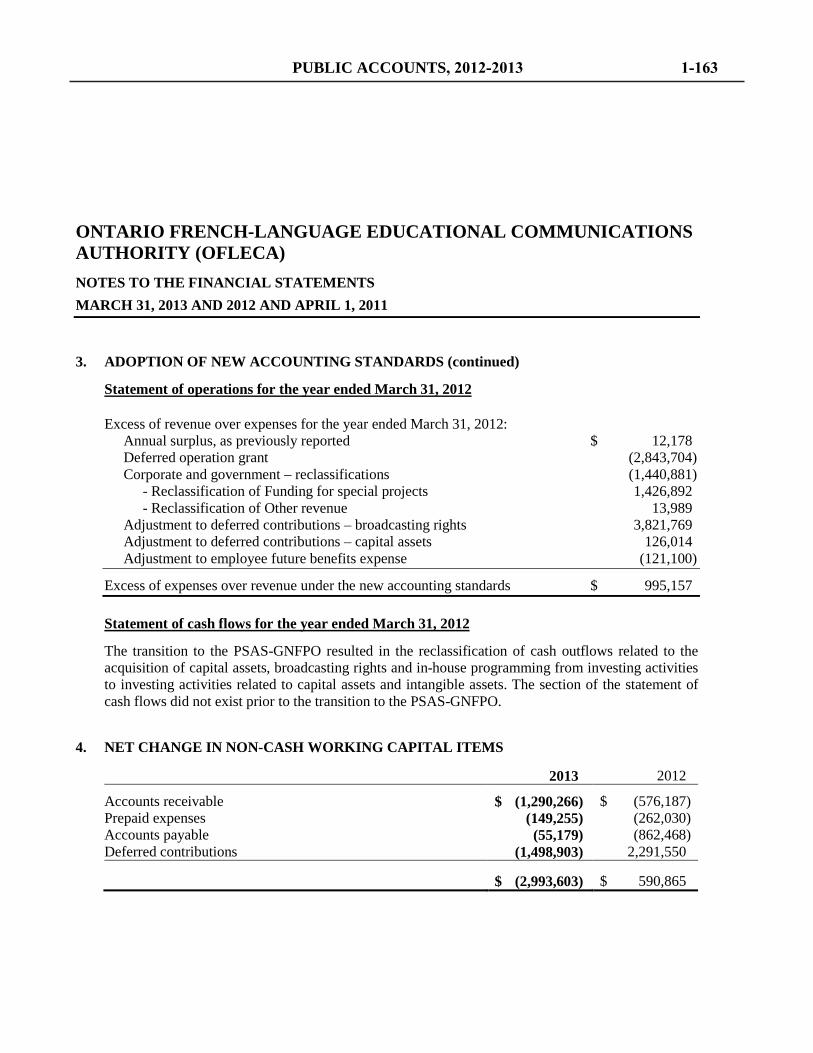
ONTARIO FRENCH-LANGUAGE EDUCATIONAL COMMUNICATIONS AUTHORITY (OFLECA) NOTES TO THE FINANCIAL STATEMENTS MARCH 31, 2013 AND 2012 AND APRIL 1, 2011 3. ADOPTION OF NEW ACCOUNTING STANDARDS (continued)
Statement of operations for the year ended March 31, 2012 Excess of revenue over expenses for the year ended March 31, 2012:
Annual surplus, as previously reported $ 12,178 Deferred operation grant (2,843,704) Corporate and government – reclassifications (1,440,881)
- Reclassification of Funding for special projects 1,426,892 - Reclassification of Other revenue 13,989
Adjustment to deferred contributions – broadcasting rights 3,821,769 Adjustment to deferred contributions – capital assets 126,014 Adjustment to employee future benefits expense (121,100)
Excess of expenses over revenue under the new accounting standards $ 995,157 Statement of cash flows for the year ended March 31, 2012
The transition to the PSAS-GNFPO resulted in the reclassification of cash outflows related to the acquisition of capital assets, broadcasting rights and in-house programming from investing activities to investing activities related to capital assets and intangible assets. The section of the statement of cash flows did not exist prior to the transition to the PSAS-GNFPO.
4. NET CHANGE IN NON-CASH WORKING CAPITAL ITEMS
2013 2012
Accounts receivable $ (1,290,266) $ (576,187) Prepaid expenses (149,255) (262,030) Accounts payable (55,179) (862,468) Deferred contributions (1,498,903) 2,291,550
$ (2,993,603) $ 590,865
PUBLIC ACCOUNTS, 2012-2013 1-163
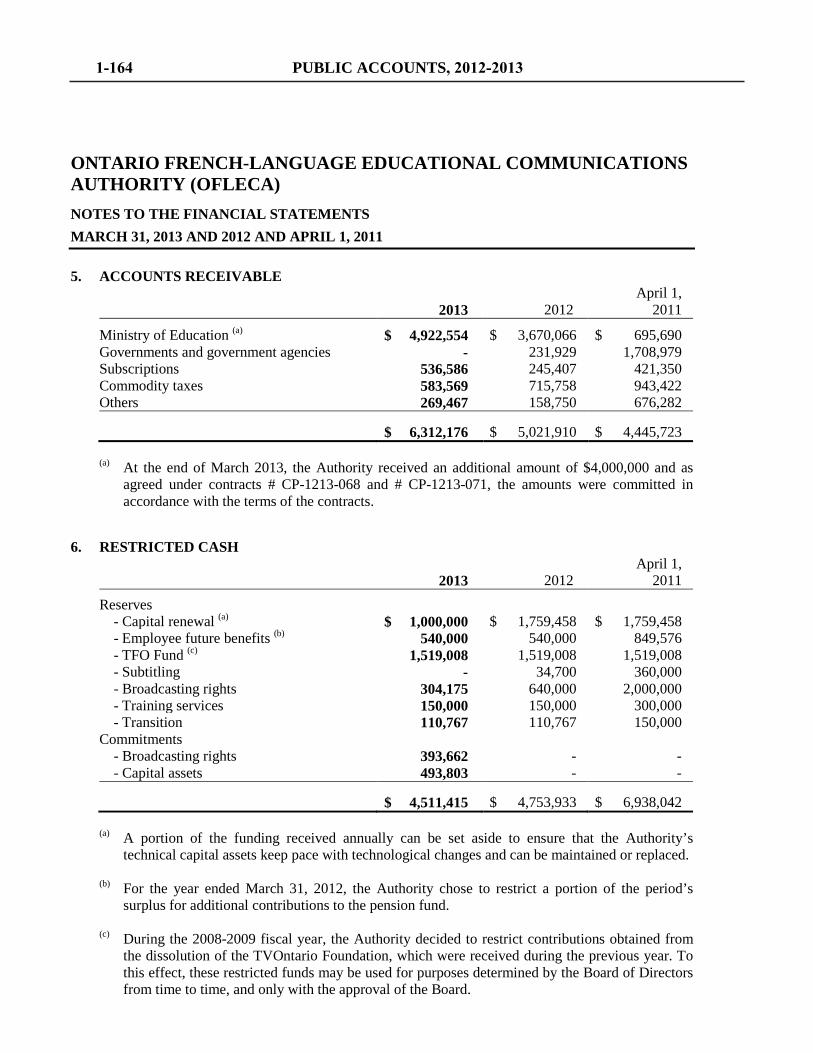
ONTARIO FRENCH-LANGUAGE EDUCATIONAL COMMUNICATIONS AUTHORITY (OFLECA) NOTES TO THE FINANCIAL STATEMENTS MARCH 31, 2013 AND 2012 AND APRIL 1, 2011 5. ACCOUNTS RECEIVABLE
2013 2012 April 1, 2011
Ministry of Education (a) $ 4,922,554 $ 3,670,066 $ 695,690 Governments and government agencies - 231,929 1,708,979 Subscriptions 536,586 245,407 421,350 Commodity taxes 583,569 715,758 943,422 Others 269,467 158,750 676,282
$ 6,312,176 $ 5,021,910 $ 4,445,723
(a) At the end of March 2013, the Authority received an additional amount of $4,000,000 and as agreed under contracts # CP-1213-068 and # CP-1213-071, the amounts were committed in accordance with the terms of the contracts.
6. RESTRICTED CASH
2013 2012 April 1, 2011
Reserves - Capital renewal (a) $ 1,000,000 $ 1,759,458 $ 1,759,458 - Employee future benefits (b) 540,000 540,000 849,576 - TFO Fund (c) 1,519,008 1,519,008 1,519,008 - Subtitling - 34,700 360,000 - Broadcasting rights 304,175 640,000 2,000,000 - Training services 150,000 150,000 300,000 - Transition 110,767 110,767 150,000 Commitments - Broadcasting rights 393,662 - - - Capital assets 493,803 - -
$ 4,511,415 $ 4,753,933 $ 6,938,042
(a) A portion of the funding received annually can be set aside to ensure that the Authority’s technical capital assets keep pace with technological changes and can be maintained or replaced.
(b) For the year ended March 31, 2012, the Authority chose to restrict a portion of the period’s
surplus for additional contributions to the pension fund. (c) During the 2008-2009 fiscal year, the Authority decided to restrict contributions obtained from
the dissolution of the TVOntario Foundation, which were received during the previous year. To this effect, these restricted funds may be used for purposes determined by the Board of Directors from time to time, and only with the approval of the Board.
1-164 PUBLIC ACCOUNTS, 2012-2013

ONTARIO FRENCH-LANGUAGE EDUCATIONAL COMMUNICATIONS AUTHORITY (OFLECA) NOTES TO THE FINANCIAL STATEMENTS MARCH 31, 2013 AND 2012 AND APRIL 1, 2011 7. BROADCASTING RIGHTS
2013
Cost
Accumulated amortization Net value
Broadcasting rights and completed productions $ 43,799,993 $ 30,983,552 $ 12,816,441
Work in progress 3,117,812 - 3,117,812
$ 46,917,805 $ 30,983,552 $ 15,934,253
2012
Cost
Accumulated amortization Net value
Broadcasting rights and completed productions $ 36,342,772 $ 25,432,065 $ 10,910,707
Work in progress 3,961,115 - 3,961,115
$ 40,303,887 $ 25,432,065 $ 14,871,822
April 1, 2011
Cost
Accumulated amortization Net value
Broadcasting rights and completed productions $ 30,251,062 $ 20,109,943 $ 10,141,119
Work in progress 2,813,987 - 2,813,987
$ 33,065,049 $ 20,109,943 $ 12,955,106
8. IN-HOUSE PROGRAMMING
2013
Cost
Accumulated amortization Net value
In-house programming $ 11,726,196 $ 3,223,721 $ 8,502,475
2012
Cost
Accumulated amortization Net value
In-house programming $ 4,330,600 $ 1,082,650 $ 3,247,950
PUBLIC ACCOUNTS, 2012-2013 1-165
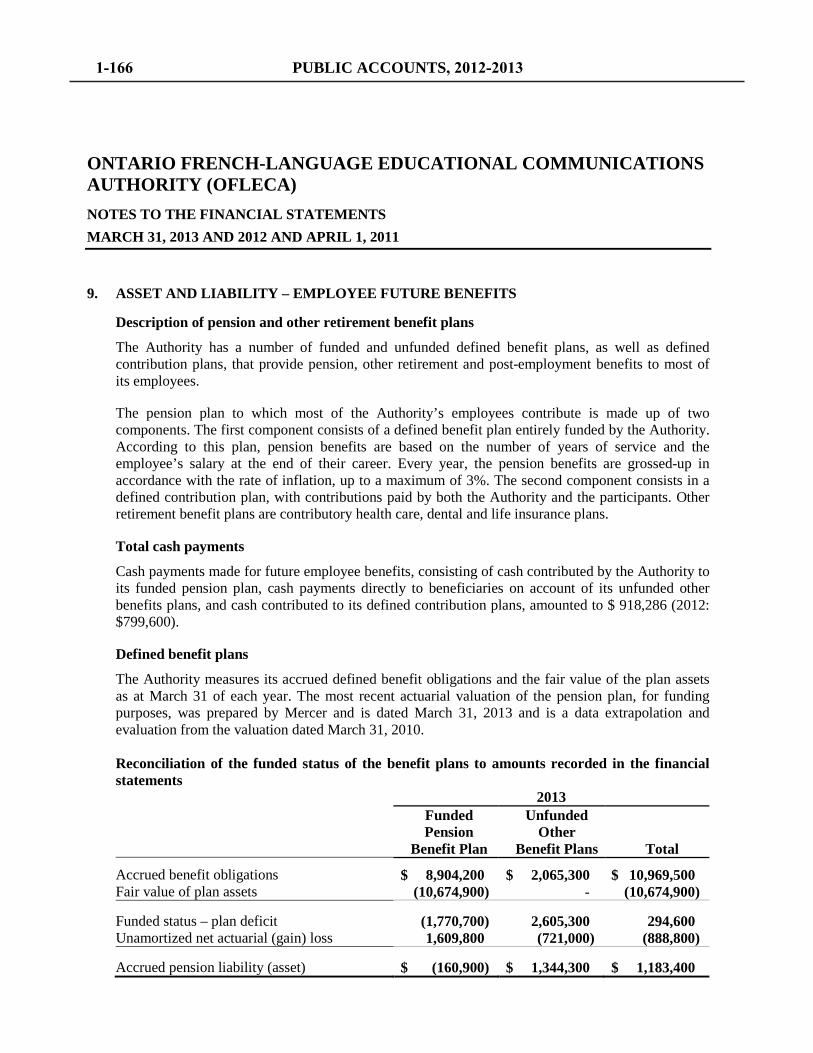
ONTARIO FRENCH-LANGUAGE EDUCATIONAL COMMUNICATIONS AUTHORITY (OFLECA) NOTES TO THE FINANCIAL STATEMENTS MARCH 31, 2013 AND 2012 AND APRIL 1, 2011 9. ASSET AND LIABILITY – EMPLOYEE FUTURE BENEFITS
Description of pension and other retirement benefit plans
The Authority has a number of funded and unfunded defined benefit plans, as well as defined contribution plans, that provide pension, other retirement and post-employment benefits to most of its employees. The pension plan to which most of the Authority’s employees contribute is made up of two components. The first component consists of a defined benefit plan entirely funded by the Authority. According to this plan, pension benefits are based on the number of years of service and the employee’s salary at the end of their career. Every year, the pension benefits are grossed-up in accordance with the rate of inflation, up to a maximum of 3%. The second component consists in a defined contribution plan, with contributions paid by both the Authority and the participants. Other retirement benefit plans are contributory health care, dental and life insurance plans. Total cash payments
Cash payments made for future employee benefits, consisting of cash contributed by the Authority to its funded pension plan, cash payments directly to beneficiaries on account of its unfunded other benefits plans, and cash contributed to its defined contribution plans, amounted to $ 918,286 (2012: $799,600). Defined benefit plans
The Authority measures its accrued defined benefit obligations and the fair value of the plan assets as at March 31 of each year. The most recent actuarial valuation of the pension plan, for funding purposes, was prepared by Mercer and is dated March 31, 2013 and is a data extrapolation and evaluation from the valuation dated March 31, 2010.
Reconciliation of the funded status of the benefit plans to amounts recorded in the financial statements 2013
Funded Pension
Benefit Plan
Unfunded Other
Benefit Plans Total
Accrued benefit obligations $ 8,904,200 $ 2,065,300 $ 10,969,500 Fair value of plan assets (10,674,900) - (10,674,900)
Funded status – plan deficit (1,770,700) 2,605,300 294,600 Unamortized net actuarial (gain) loss 1,609,800 (721,000) (888,800)
Accrued pension liability (asset) $ (160,900) $ 1,344,300 $ 1,183,400
1-166 PUBLIC ACCOUNTS, 2012-2013
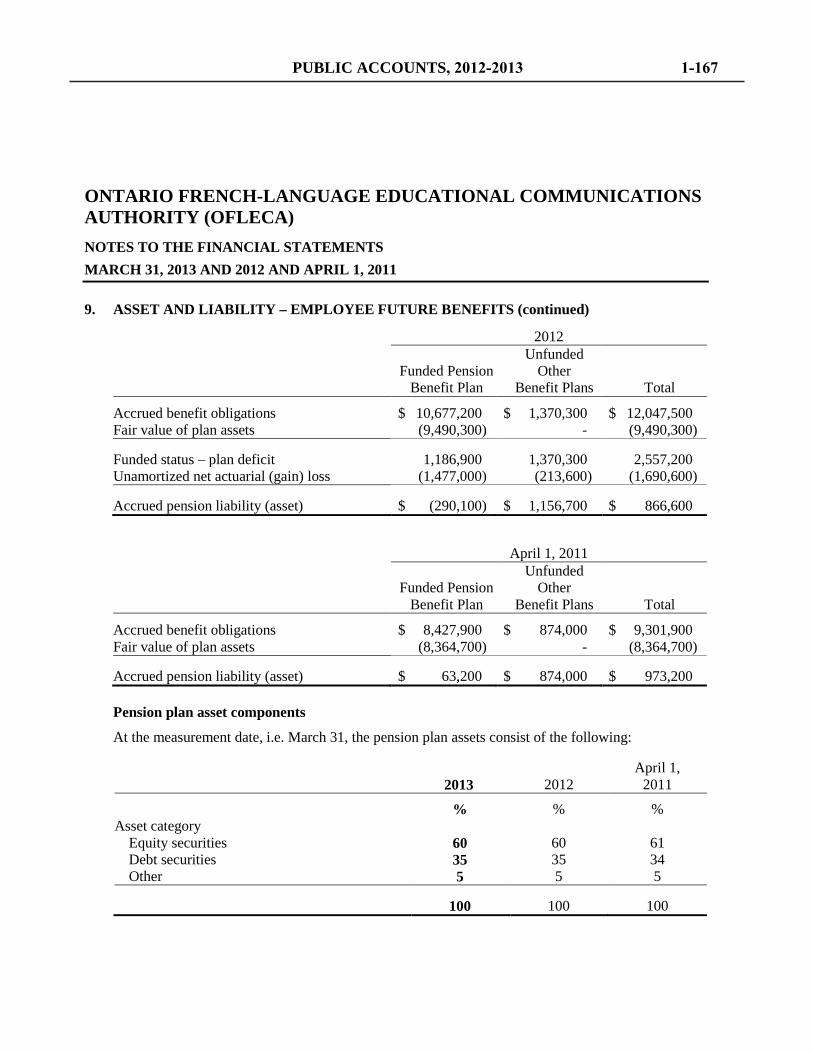
ONTARIO FRENCH-LANGUAGE EDUCATIONAL COMMUNICATIONS AUTHORITY (OFLECA) NOTES TO THE FINANCIAL STATEMENTS MARCH 31, 2013 AND 2012 AND APRIL 1, 2011 9. ASSET AND LIABILITY – EMPLOYEE FUTURE BENEFITS (continued)
2012
Funded Pension
Benefit Plan
Unfunded Other
Benefit Plans Total
Accrued benefit obligations $ 10,677,200 $ 1,370,300 $ 12,047,500 Fair value of plan assets (9,490,300) - (9,490,300)
Funded status – plan deficit 1,186,900 1,370,300 2,557,200 Unamortized net actuarial (gain) loss (1,477,000) (213,600) (1,690,600)
Accrued pension liability (asset) $ (290,100) $ 1,156,700 $ 866,600
April 1, 2011
Funded Pension
Benefit Plan
Unfunded Other
Benefit Plans Total
Accrued benefit obligations $ 8,427,900 $ 874,000 $ 9,301,900 Fair value of plan assets (8,364,700) - (8,364,700)
Accrued pension liability (asset) $ 63,200 $ 874,000 $ 973,200 Pension plan asset components
At the measurement date, i.e. March 31, the pension plan assets consist of the following:
2013 2012 April 1,
2011
% % % Asset category
Equity securities 60 60 61 Debt securities 35 35 34 Other 5 5 5
100 100 100
PUBLIC ACCOUNTS, 2012-2013 1-167
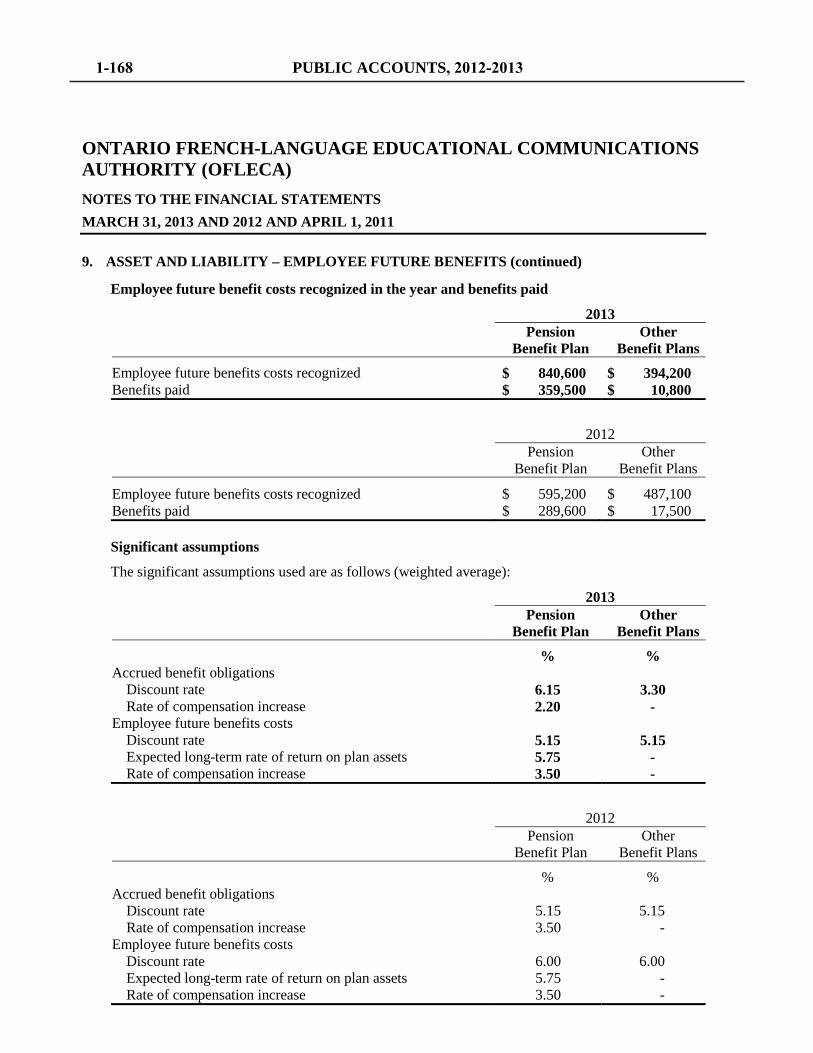
ONTARIO FRENCH-LANGUAGE EDUCATIONAL COMMUNICATIONS AUTHORITY (OFLECA) NOTES TO THE FINANCIAL STATEMENTS MARCH 31, 2013 AND 2012 AND APRIL 1, 2011 9. ASSET AND LIABILITY – EMPLOYEE FUTURE BENEFITS (continued)
Employee future benefit costs recognized in the year and benefits paid
2013
Pension Benefit Plan
Other Benefit Plans
Employee future benefits costs recognized $ 840,600 $ 394,200 Benefits paid $ 359,500 $ 10,800
2012
Pension Benefit Plan
Other Benefit Plans
Employee future benefits costs recognized $ 595,200 $ 487,100 Benefits paid $ 289,600 $ 17,500
Significant assumptions
The significant assumptions used are as follows (weighted average):
2013
Pension Benefit Plan
Other Benefit Plans
% % Accrued benefit obligations
Discount rate 6.15 3.30 Rate of compensation increase 2.20 -
Employee future benefits costs Discount rate 5.15 5.15 Expected long-term rate of return on plan assets 5.75 - Rate of compensation increase 3.50 -
2012
Pension Benefit Plan
Other Benefit Plans
% % Accrued benefit obligations
Discount rate 5.15 5.15 Rate of compensation increase 3.50 -
Employee future benefits costs Discount rate 6.00 6.00 Expected long-term rate of return on plan assets 5.75 - Rate of compensation increase 3.50 -
1-168 PUBLIC ACCOUNTS, 2012-2013
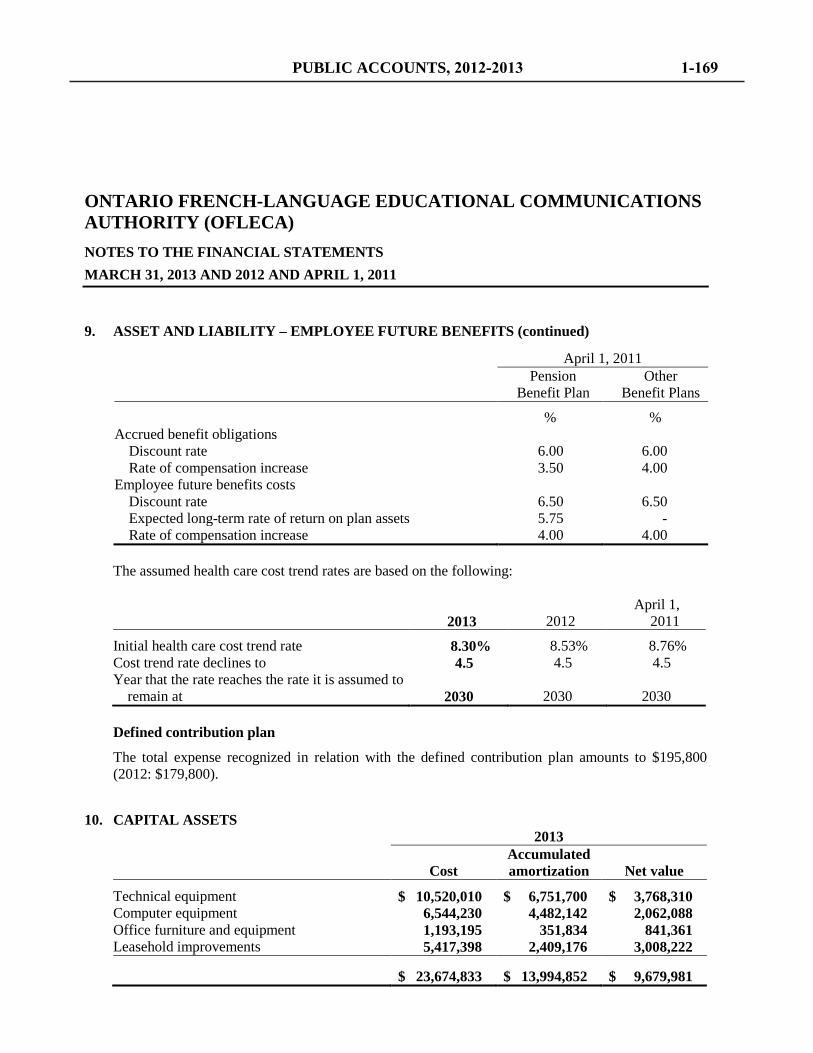
ONTARIO FRENCH-LANGUAGE EDUCATIONAL COMMUNICATIONS AUTHORITY (OFLECA) NOTES TO THE FINANCIAL STATEMENTS MARCH 31, 2013 AND 2012 AND APRIL 1, 2011 9. ASSET AND LIABILITY – EMPLOYEE FUTURE BENEFITS (continued)
April 1, 2011
Pension Benefit Plan
Other Benefit Plans
% % Accrued benefit obligations
Discount rate 6.00 6.00 Rate of compensation increase 3.50 4.00
Employee future benefits costs Discount rate 6.50 6.50 Expected long-term rate of return on plan assets 5.75 - Rate of compensation increase 4.00 4.00
The assumed health care cost trend rates are based on the following:
2013
2012 April 1, 2011
Initial health care cost trend rate 8.30% 8.53% 8.76% Cost trend rate declines to 4.5 4.5 4.5 Year that the rate reaches the rate it is assumed to
remain at 2030 2030 2030 Defined contribution plan
The total expense recognized in relation with the defined contribution plan amounts to $195,800 (2012: $179,800).
10. CAPITAL ASSETS 2013
Cost
Accumulated amortization Net value
Technical equipment $ 10,520,010 $ 6,751,700 $ 3,768,310 Computer equipment 6,544,230 4,482,142 2,062,088 Office furniture and equipment 1,193,195 351,834 841,361 Leasehold improvements 5,417,398 2,409,176 3,008,222
$ 23,674,833 $ 13,994,852 $ 9,679,981
PUBLIC ACCOUNTS, 2012-2013 1-169
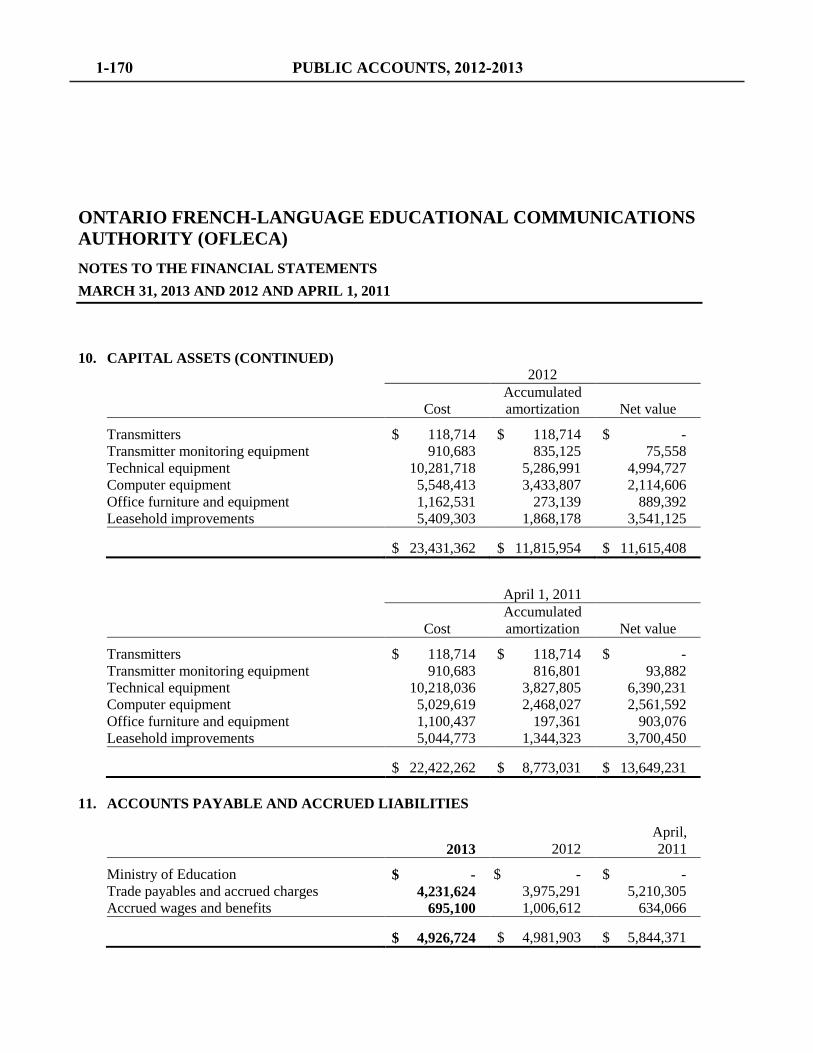
ONTARIO FRENCH-LANGUAGE EDUCATIONAL COMMUNICATIONS AUTHORITY (OFLECA) NOTES TO THE FINANCIAL STATEMENTS MARCH 31, 2013 AND 2012 AND APRIL 1, 2011
10. CAPITAL ASSETS (CONTINUED) 2012
Cost
Accumulated amortization Net value
Transmitters $ 118,714 $ 118,714 $ - Transmitter monitoring equipment 910,683 835,125 75,558 Technical equipment 10,281,718 5,286,991 4,994,727 Computer equipment 5,548,413 3,433,807 2,114,606 Office furniture and equipment 1,162,531 273,139 889,392 Leasehold improvements 5,409,303 1,868,178 3,541,125
$ 23,431,362 $ 11,815,954 $ 11,615,408
April 1, 2011
Cost
Accumulated amortization Net value
Transmitters $ 118,714 $ 118,714 $ - Transmitter monitoring equipment 910,683 816,801 93,882 Technical equipment 10,218,036 3,827,805 6,390,231 Computer equipment 5,029,619 2,468,027 2,561,592 Office furniture and equipment 1,100,437 197,361 903,076 Leasehold improvements 5,044,773 1,344,323 3,700,450
$ 22,422,262 $ 8,773,031 $ 13,649,231 11. ACCOUNTS PAYABLE AND ACCRUED LIABILITIES
2013 2012 April, 2011
Ministry of Education $ - $ - $ - Trade payables and accrued charges 4,231,624 3,975,291 5,210,305 Accrued wages and benefits 695,100 1,006,612 634,066
$ 4,926,724 $ 4,981,903 $ 5,844,371
1-170 PUBLIC ACCOUNTS, 2012-2013
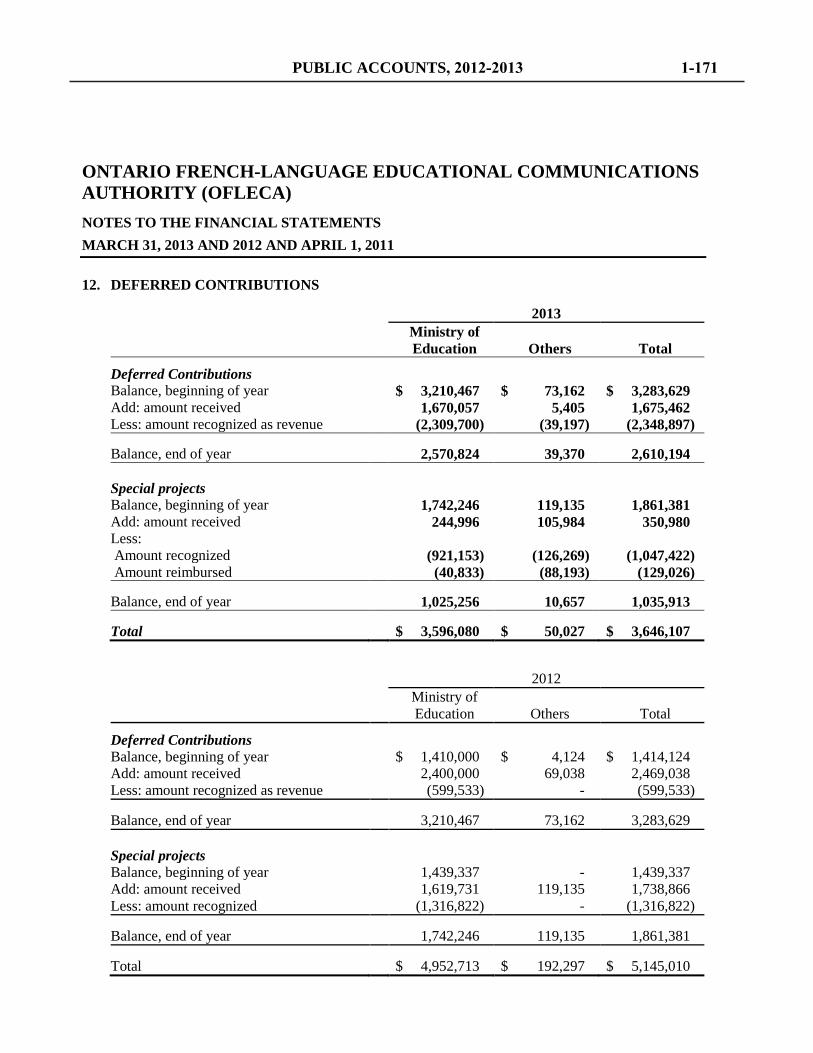
ONTARIO FRENCH-LANGUAGE EDUCATIONAL COMMUNICATIONS AUTHORITY (OFLECA) NOTES TO THE FINANCIAL STATEMENTS MARCH 31, 2013 AND 2012 AND APRIL 1, 2011 12. DEFERRED CONTRIBUTIONS
2013
Ministry of Education Others Total
Deferred Contributions Balance, beginning of year $ 3,210,467 $ 73,162 $ 3,283,629 Add: amount received 1,670,057 5,405 1,675,462 Less: amount recognized as revenue (2,309,700) (39,197) (2,348,897)
Balance, end of year 2,570,824 39,370 2,610,194 Special projects Balance, beginning of year 1,742,246 119,135 1,861,381 Add: amount received 244,996 105,984 350,980 Less: Amount recognized (921,153) (126,269) (1,047,422) Amount reimbursed (40,833) (88,193) (129,026)
Balance, end of year 1,025,256 10,657 1,035,913
Total $ 3,596,080 $ 50,027 $ 3,646,107
2012
Ministry of Education Others Total
Deferred Contributions Balance, beginning of year $ 1,410,000 $ 4,124 $ 1,414,124 Add: amount received 2,400,000 69,038 2,469,038 Less: amount recognized as revenue (599,533) - (599,533)
Balance, end of year 3,210,467 73,162 3,283,629 Special projects Balance, beginning of year 1,439,337 - 1,439,337 Add: amount received 1,619,731 119,135 1,738,866 Less: amount recognized (1,316,822) - (1,316,822)
Balance, end of year 1,742,246 119,135 1,861,381
Total $ 4,952,713 $ 192,297 $ 5,145,010
PUBLIC ACCOUNTS, 2012-2013 1-171
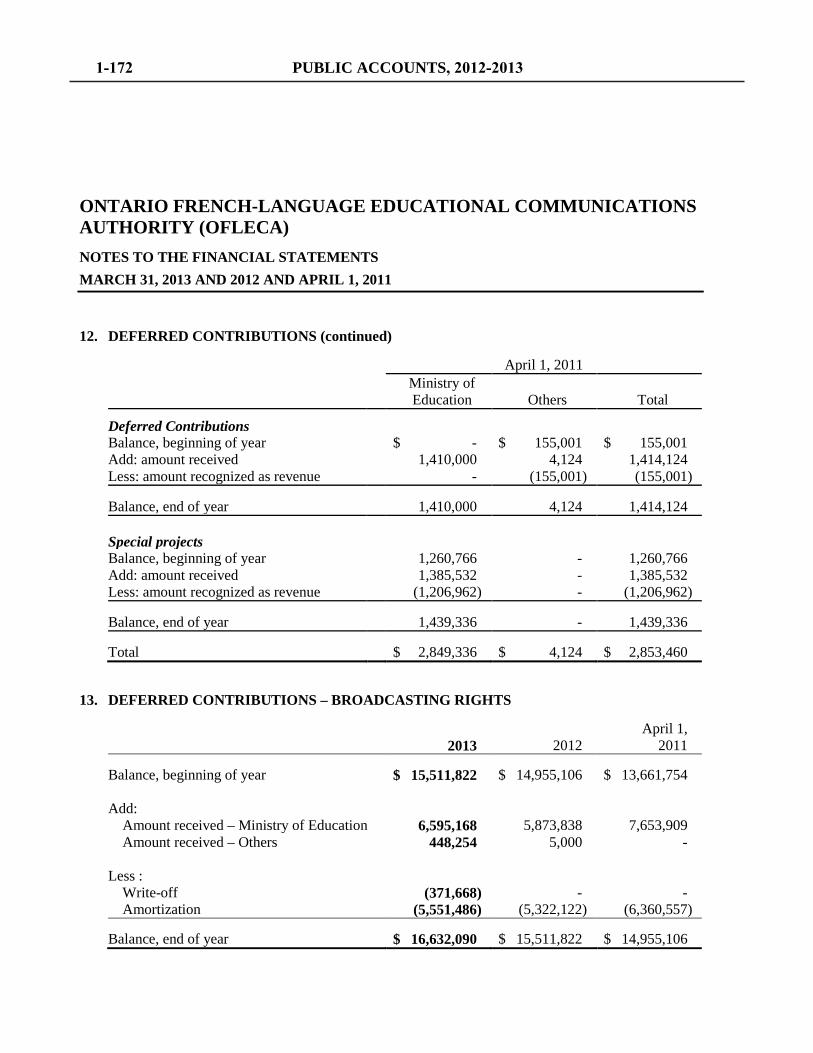
ONTARIO FRENCH-LANGUAGE EDUCATIONAL COMMUNICATIONS AUTHORITY (OFLECA) NOTES TO THE FINANCIAL STATEMENTS MARCH 31, 2013 AND 2012 AND APRIL 1, 2011
12. DEFERRED CONTRIBUTIONS (continued)
April 1, 2011 Ministry of
Education Others Total
Deferred Contributions Balance, beginning of year $ - $ 155,001 $ 155,001 Add: amount received 1,410,000 4,124 1,414,124 Less: amount recognized as revenue - (155,001) (155,001)
Balance, end of year 1,410,000 4,124 1,414,124 Special projects Balance, beginning of year 1,260,766 - 1,260,766 Add: amount received 1,385,532 - 1,385,532 Less: amount recognized as revenue (1,206,962) - (1,206,962)
Balance, end of year 1,439,336 - 1,439,336
Total $ 2,849,336 $ 4,124 $ 2,853,460
13. DEFERRED CONTRIBUTIONS – BROADCASTING RIGHTS
2013 2012 April 1, 2011
Balance, beginning of year $ 15,511,822 $ 14,955,106 $ 13,661,754 Add:
Amount received – Ministry of Education 6,595,168 5,873,838 7,653,909 Amount received – Others 448,254 5,000 -
Less :
Write-off (371,668) - - Amortization (5,551,486) (5,322,122) (6,360,557)
Balance, end of year $ 16,632,090 $ 15,511,822 $ 14,955,106
1-172 PUBLIC ACCOUNTS, 2012-2013
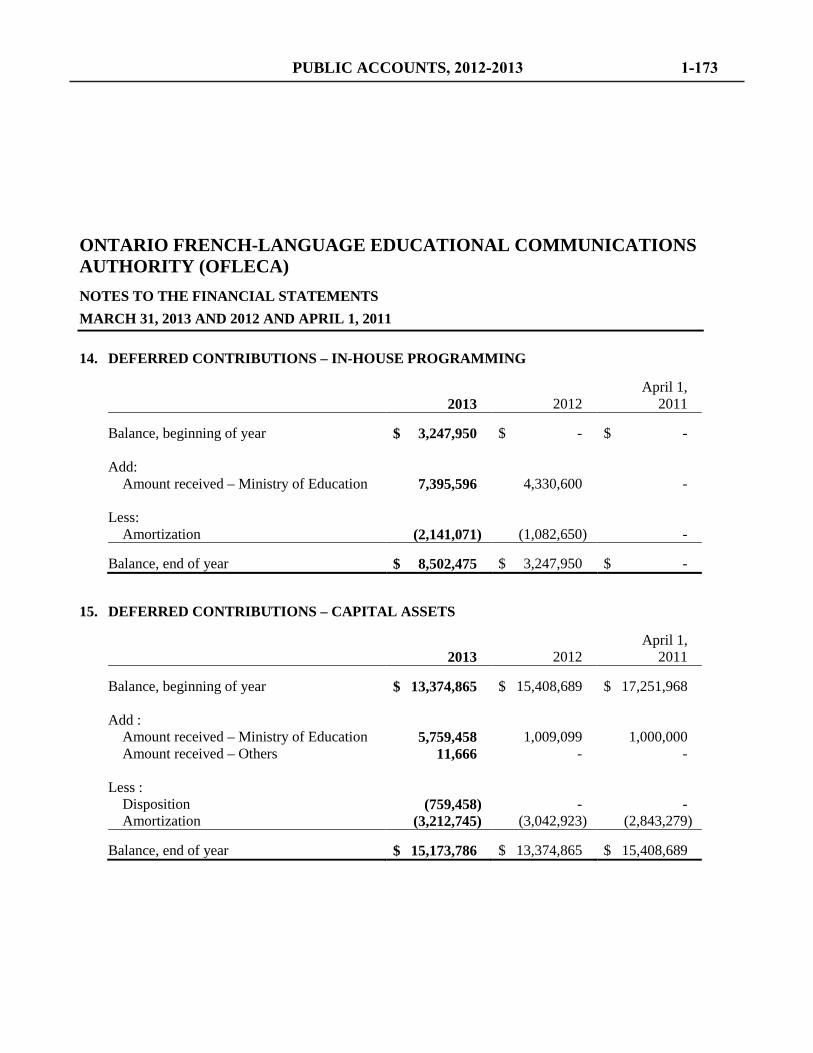
ONTARIO FRENCH-LANGUAGE EDUCATIONAL COMMUNICATIONS AUTHORITY (OFLECA) NOTES TO THE FINANCIAL STATEMENTS MARCH 31, 2013 AND 2012 AND APRIL 1, 2011 14. DEFERRED CONTRIBUTIONS – IN-HOUSE PROGRAMMING
2013 2012 April 1, 2011
Balance, beginning of year $ 3,247,950 $ - $ - Add:
Amount received – Ministry of Education 7,395,596 4,330,600 -
Less: Amortization (2,141,071) (1,082,650) -
Balance, end of year $ 8,502,475 $ 3,247,950 $ -
15. DEFERRED CONTRIBUTIONS – CAPITAL ASSETS
2013 2012 April 1, 2011
Balance, beginning of year $ 13,374,865 $ 15,408,689 $ 17,251,968 Add :
Amount received – Ministry of Education 5,759,458 1,009,099 1,000,000 Amount received – Others 11,666 - -
Less :
Disposition (759,458) - - Amortization (3,212,745) (3,042,923) (2,843,279)
Balance, end of year $ 15,173,786 $ 13,374,865 $ 15,408,689
PUBLIC ACCOUNTS, 2012-2013 1-173
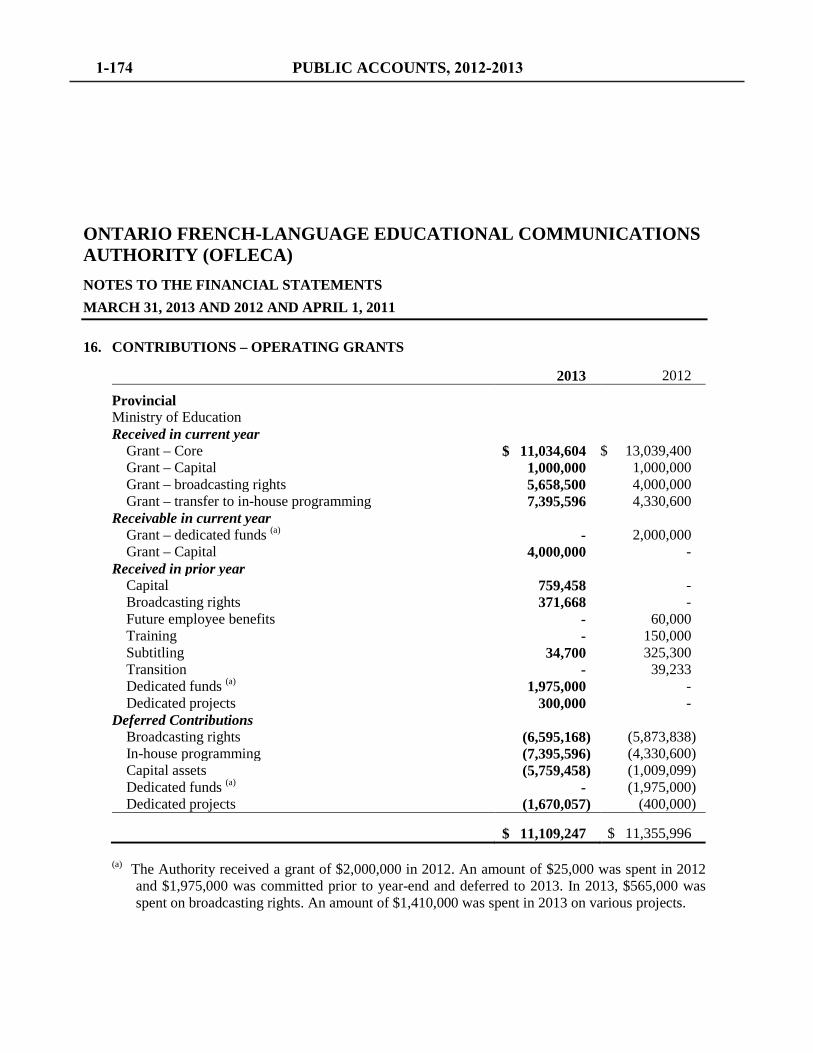
ONTARIO FRENCH-LANGUAGE EDUCATIONAL COMMUNICATIONS AUTHORITY (OFLECA) NOTES TO THE FINANCIAL STATEMENTS MARCH 31, 2013 AND 2012 AND APRIL 1, 2011 16. CONTRIBUTIONS – OPERATING GRANTS
2013 2012
Provincial Ministry of Education Received in current year
Grant – Core $ 11,034,604 $ 13,039,400 Grant – Capital 1,000,000 1,000,000 Grant – broadcasting rights 5,658,500 4,000,000 Grant – transfer to in-house programming 7,395,596 4,330,600
Receivable in current year Grant – dedicated funds (a) - 2,000,000 Grant – Capital 4,000,000 -
Received in prior year Capital 759,458 - Broadcasting rights 371,668 - Future employee benefits - 60,000 Training - 150,000 Subtitling 34,700 325,300 Transition - 39,233 Dedicated funds (a) 1,975,000 - Dedicated projects 300,000 -
Deferred Contributions Broadcasting rights (6,595,168) (5,873,838) In-house programming (7,395,596) (4,330,600) Capital assets (5,759,458) (1,009,099) Dedicated funds (a) - (1,975,000) Dedicated projects (1,670,057) (400,000)
$ 11,109,247 $ 11,355,996 (a) The Authority received a grant of $2,000,000 in 2012. An amount of $25,000 was spent in 2012
and $1,975,000 was committed prior to year-end and deferred to 2013. In 2013, $565,000 was spent on broadcasting rights. An amount of $1,410,000 was spent in 2013 on various projects.
1-174 PUBLIC ACCOUNTS, 2012-2013
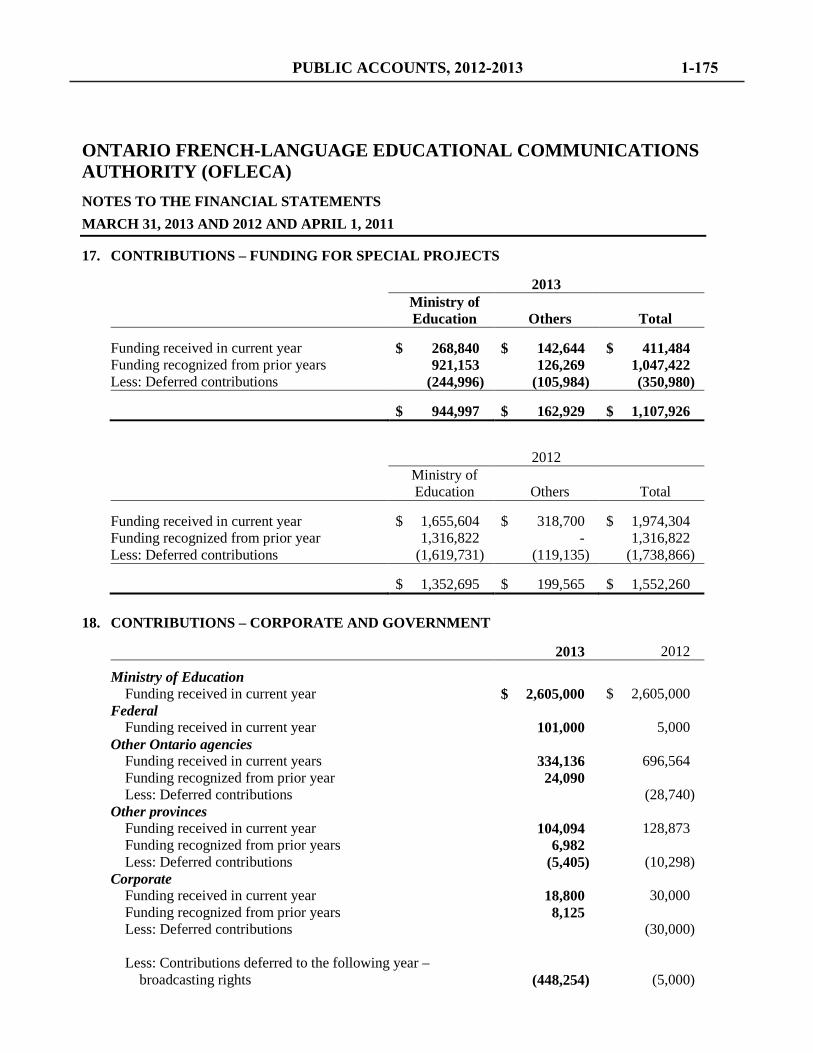
ONTARIO FRENCH-LANGUAGE EDUCATIONAL COMMUNICATIONS AUTHORITY (OFLECA) NOTES TO THE FINANCIAL STATEMENTS MARCH 31, 2013 AND 2012 AND APRIL 1, 2011 17. CONTRIBUTIONS – FUNDING FOR SPECIAL PROJECTS
2013 Ministry of
Education Others Total
Funding received in current year $ 268,840 $ 142,644 $ 411,484 Funding recognized from prior years 921,153 126,269 1,047,422 Less: Deferred contributions (244,996) (105,984) (350,980)
$ 944,997 $ 162,929 $ 1,107,926
2012 Ministry of
Education Others Total
Funding received in current year $ 1,655,604 $ 318,700 $ 1,974,304 Funding recognized from prior year 1,316,822 - 1,316,822 Less: Deferred contributions (1,619,731) (119,135) (1,738,866)
$ 1,352,695 $ 199,565 $ 1,552,260
18. CONTRIBUTIONS – CORPORATE AND GOVERNMENT
2013 2012
Ministry of Education Funding received in current year $ 2,605,000 $ 2,605,000
Federal Funding received in current year 101,000 5,000
Other Ontario agencies Funding received in current years 334,136 696,564 Funding recognized from prior year 24,090 Less: Deferred contributions (28,740)
Other provinces Funding received in current year 104,094 128,873 Funding recognized from prior years 6,982 Less: Deferred contributions (5,405) (10,298)
Corporate Funding received in current year 18,800 30,000 Funding recognized from prior years 8,125 Less: Deferred contributions (30,000) Less: Contributions deferred to the following year –
broadcasting rights (448,254) (5,000)
PUBLIC ACCOUNTS, 2012-2013 1-175
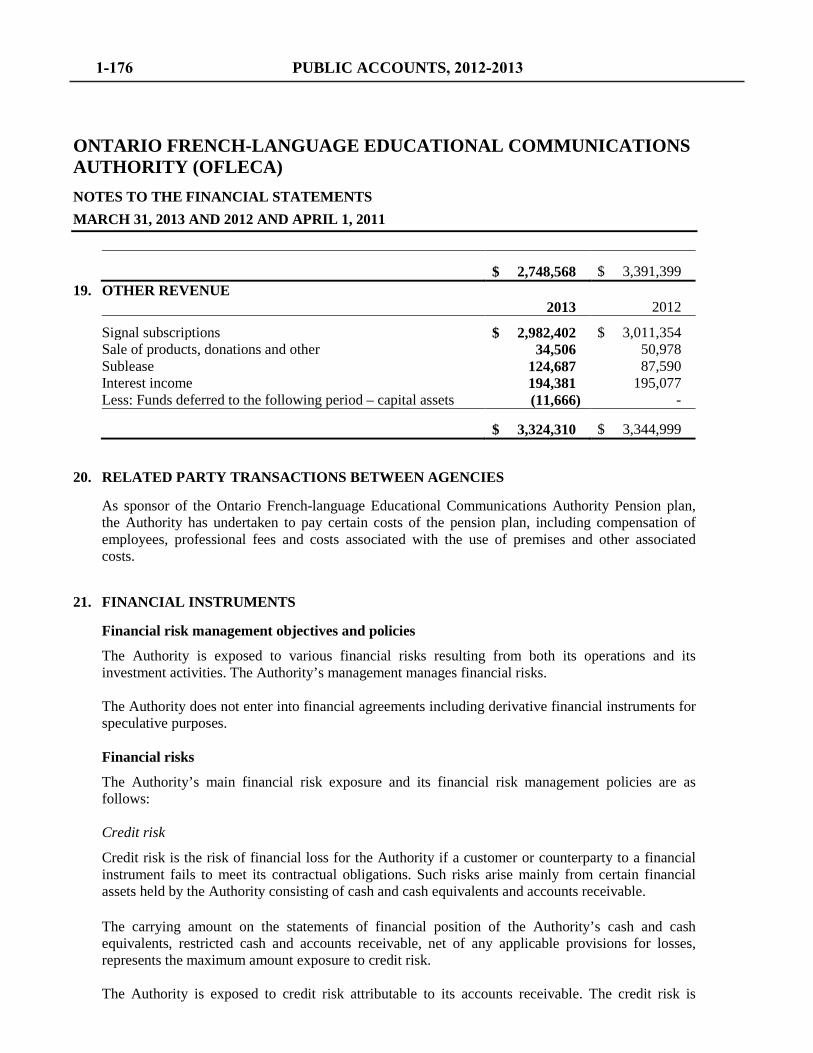
ONTARIO FRENCH-LANGUAGE EDUCATIONAL COMMUNICATIONS AUTHORITY (OFLECA) NOTES TO THE FINANCIAL STATEMENTS MARCH 31, 2013 AND 2012 AND APRIL 1, 2011
$ 2,748,568 $ 3,391,399 19. OTHER REVENUE
2013 2012
Signal subscriptions $ 2,982,402 $ 3,011,354 Sale of products, donations and other 34,506 50,978 Sublease 124,687 87,590 Interest income 194,381 195,077 Less: Funds deferred to the following period – capital assets (11,666) -
$ 3,324,310 $ 3,344,999
20. RELATED PARTY TRANSACTIONS BETWEEN AGENCIES
As sponsor of the Ontario French-language Educational Communications Authority Pension plan, the Authority has undertaken to pay certain costs of the pension plan, including compensation of employees, professional fees and costs associated with the use of premises and other associated costs.
21. FINANCIAL INSTRUMENTS
Financial risk management objectives and policies
The Authority is exposed to various financial risks resulting from both its operations and its investment activities. The Authority’s management manages financial risks. The Authority does not enter into financial agreements including derivative financial instruments for speculative purposes. Financial risks
The Authority’s main financial risk exposure and its financial risk management policies are as follows: Credit risk
Credit risk is the risk of financial loss for the Authority if a customer or counterparty to a financial instrument fails to meet its contractual obligations. Such risks arise mainly from certain financial assets held by the Authority consisting of cash and cash equivalents and accounts receivable. The carrying amount on the statements of financial position of the Authority’s cash and cash equivalents, restricted cash and accounts receivable, net of any applicable provisions for losses, represents the maximum amount exposure to credit risk. The Authority is exposed to credit risk attributable to its accounts receivable. The credit risk is
1-176 PUBLIC ACCOUNTS, 2012-2013
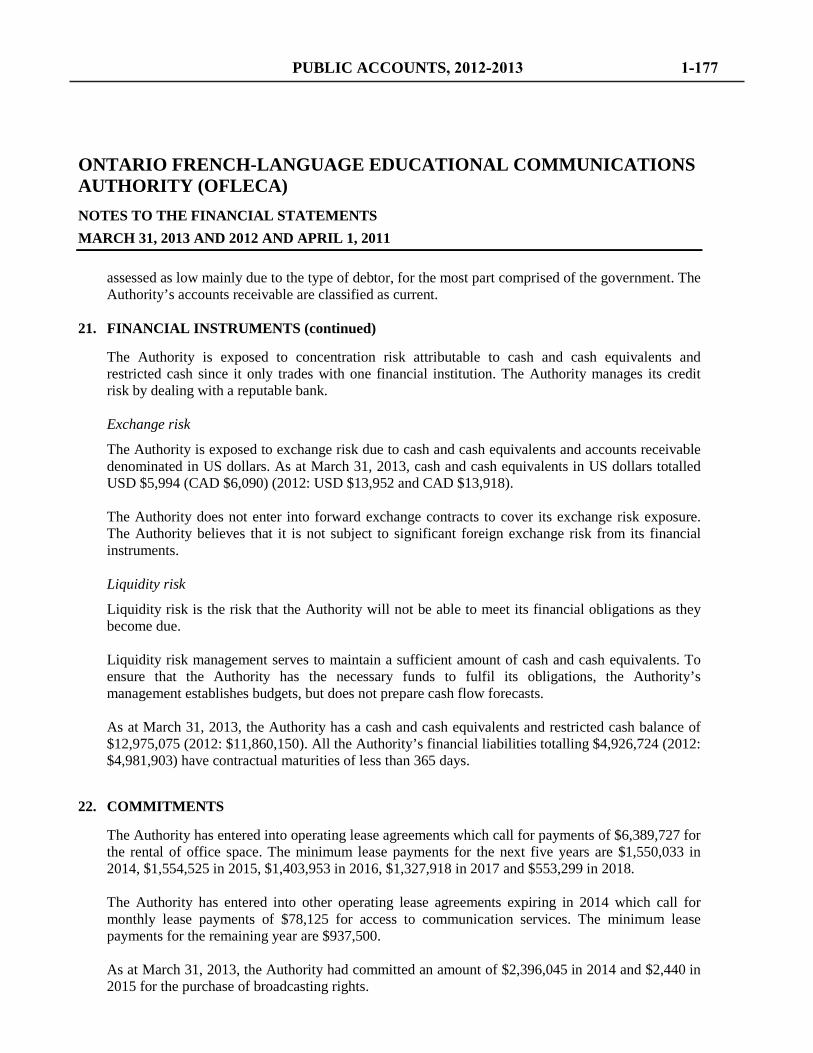
ONTARIO FRENCH-LANGUAGE EDUCATIONAL COMMUNICATIONS AUTHORITY (OFLECA) NOTES TO THE FINANCIAL STATEMENTS MARCH 31, 2013 AND 2012 AND APRIL 1, 2011
assessed as low mainly due to the type of debtor, for the most part comprised of the government. The Authority’s accounts receivable are classified as current.
21. FINANCIAL INSTRUMENTS (continued)
The Authority is exposed to concentration risk attributable to cash and cash equivalents and restricted cash since it only trades with one financial institution. The Authority manages its credit risk by dealing with a reputable bank. Exchange risk
The Authority is exposed to exchange risk due to cash and cash equivalents and accounts receivable denominated in US dollars. As at March 31, 2013, cash and cash equivalents in US dollars totalled USD $5,994 (CAD $6,090) (2012: USD $13,952 and CAD $13,918). The Authority does not enter into forward exchange contracts to cover its exchange risk exposure. The Authority believes that it is not subject to significant foreign exchange risk from its financial instruments. Liquidity risk
Liquidity risk is the risk that the Authority will not be able to meet its financial obligations as they become due. Liquidity risk management serves to maintain a sufficient amount of cash and cash equivalents. To ensure that the Authority has the necessary funds to fulfil its obligations, the Authority’s management establishes budgets, but does not prepare cash flow forecasts. As at March 31, 2013, the Authority has a cash and cash equivalents and restricted cash balance of $12,975,075 (2012: $11,860,150). All the Authority’s financial liabilities totalling $4,926,724 (2012: $4,981,903) have contractual maturities of less than 365 days.
22. COMMITMENTS
The Authority has entered into operating lease agreements which call for payments of $6,389,727 for the rental of office space. The minimum lease payments for the next five years are $1,550,033 in 2014, $1,554,525 in 2015, $1,403,953 in 2016, $1,327,918 in 2017 and $553,299 in 2018. The Authority has entered into other operating lease agreements expiring in 2014 which call for monthly lease payments of $78,125 for access to communication services. The minimum lease payments for the remaining year are $937,500. As at March 31, 2013, the Authority had committed an amount of $2,396,045 in 2014 and $2,440 in 2015 for the purchase of broadcasting rights.
PUBLIC ACCOUNTS, 2012-2013 1-177
ONTARIO FRENCH-LANGUAGE EDUCATIONAL COMMUNICATIONS AUTHORITY (OFLECA) NOTES TO THE FINANCIAL STATEMENTS MARCH 31, 2013 AND 2012 AND APRIL 1, 2011 23. CONTINGENCIES
The nature of the Authority’s activities is such that there may be litigation pending or in the prospect at any time. With respect to claims existing as at March 31, 2013, management believes that the Authority has valid defenses and appropriate insurance coverage in place. Even in the event these claims would be found valid, management believes that such claims are not expected to have a material effect on the Authority’s financial position. No amount has been recorded in the financial statements. The funding received from government departments may be refunded following an audit if the funding received is identified as a surplus based on the funding arrangements agreed between the parties. As at March 31, 2013, management has not been informed of any potential refund.
1-178 PUBLIC ACCOUNTS, 2012-2013
ONTARIO IMMIGRANT INVESTOR CORPORATION (OIIC)
Responsibility for Financial Reporting
Management and the Board of Directors are responsible for the financial statements presented. The financial statements have been prepared by management in accordance with Canadian public sector accounting standards. The preparation of financial statements necessarily involves the use of estimates based on management’s judgement. The financial statements have been properly prepared with reasonable limits of materiality and in light of information available up to June 28, 2013. Management maintains a system of internal controls designed to provide reasonable assurance that the assets are safeguarded and that reliable financial information is available on a timely basis. The system includes formal policies and procedures and an organizational structure that provides for appropriate delegation of authority and segregation of responsibilities. These financial statements have been audited by the Auditor General of Ontario. The Auditor General’s responsibility is to express an opinion on whether the financial statements are fairly presented in accordance with Canadian public sector accounting standards. The Auditor’s Report, which appears on the following page, outlines the scope of the Auditor General’s examination and his opinion. On behalf of management David Clifford Chairman
PUBLIC ACCOUNTS, 2012-2013 1-179
Independent Auditor’s Report
To the Ontario Immigrant Investor Corporation and to the Minister of Economic Development, Trade and Employment
I have audited the accompanying financial statements of the Ontario Immigrant Investor Corporation, which comprise the statement of financial position as at March 31, 2013, and the statements of operations, changes in net financial assets and cash flows for the year then ended, and a summary of significant accounting policies and other explanatory information. Management’s Responsibility for the Financial Statements
Management is responsible for the preparation and fair presentation of these financial statements in accordance with Canadian public sector accounting standards, and for such internal control as management determines is necessary to enable the preparation of financial statements that are free from material misstatement, whether due to fraud or error. Auditor’s Responsibility
My responsibility is to express an opinion on these financial statements based on my audit. I conducted my audit in accordance with Canadian generally accepted auditing standards. Those standards require that I comply with ethical requirements and plan and perform the audit to obtain reasonable assurance about whether the financial statements are free from material misstatement. An audit involves performing procedures to obtain audit evidence about the amounts and disclosures in the financial statements. The procedures selected depend on the auditor’s judgment, including the assessment of the risks of material misstatement of the financial statements, whether due to fraud or error. In making those risk assessments, the auditor considers internal control relevant to the entity’s preparation and fair presentation of the financial statements in order to design audit procedures that are appropriate in the circumstances, but not for the purpose of expressing an opinion on the effectiveness of the entity’s internal control. An audit also includes evaluating the appropriateness of accounting policies used and the reasonableness of accounting estimates made by management, as well as evaluating the overall presentation of the financial statements. I believe that the audit evidence I have obtained is sufficient and appropriate to provide a basis for my opinion. Opinion
In my opinion, these financial statements present fairly, in all material respects, the financial position of the Ontario Immigrant Investor Corporation as at March 31, 2013 and the results of its operations, changes in its net financial assets and its cash flows for the year then ended in accordance with Canadian public sector accounting standards. Toronto, Ontario Susan Klein, CPA, CA, LPA June 28, 2013 Acting Deputy Auditor General
1-180 PUBLIC ACCOUNTS, 2012-2013
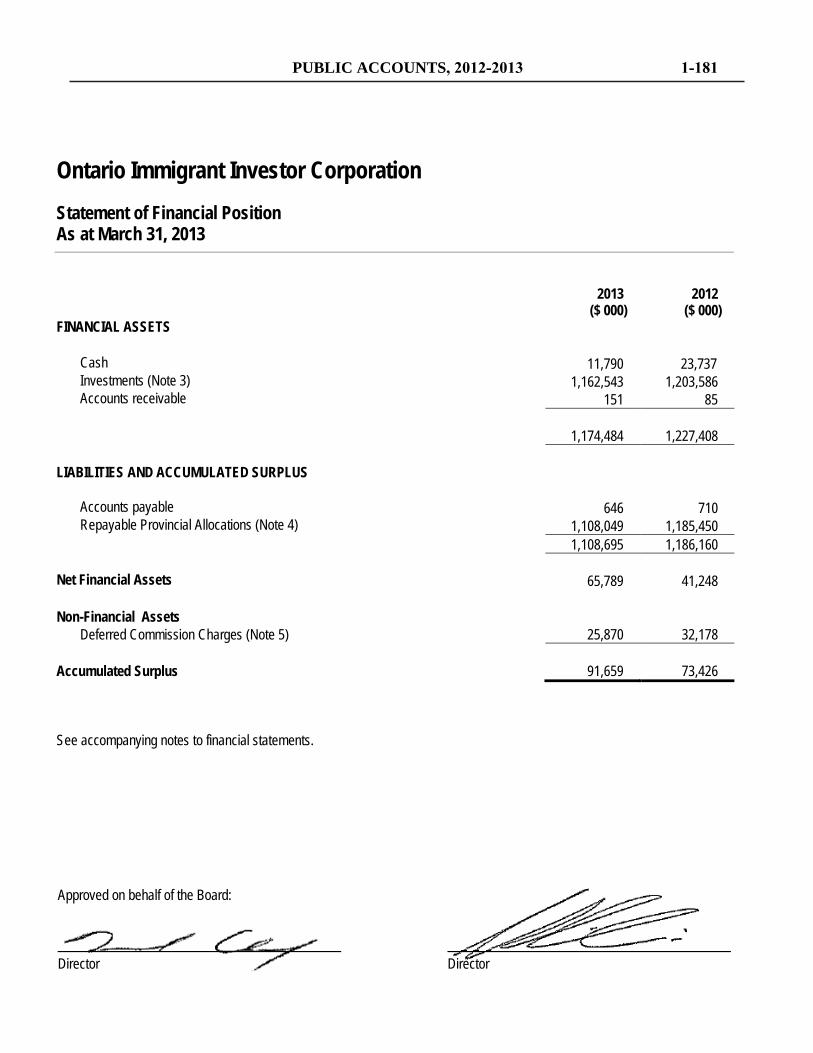
Ontario Immigrant Investor Corporation Statement of Financial Position As at March 31, 2013
2013 2012 ($ 000) ($ 000)
FINANCIAL ASSETS
Cash 11,790 23,737 Investments (Note 3) 1,162,543 1,203,586 Accounts receivable 151 85
1,174,484 1,227,408
LIABILITIES AND ACCUMULATED SURPLUS
Accounts payable 646 710 Repayable Provincial Allocations (Note 4) 1,108,049 1,185,450 1,108,695 1,186,160
Net Financial Assets 65,789 41,248 Non-Financial Assets
Deferred Commission Charges (Note 5) 25,870 32,178 Accumulated Surplus 91,659 73,426
See accompanying notes to financial statements.
Approved on behalf of the Board: Director Director
PUBLIC ACCOUNTS, 2012-2013 1-181
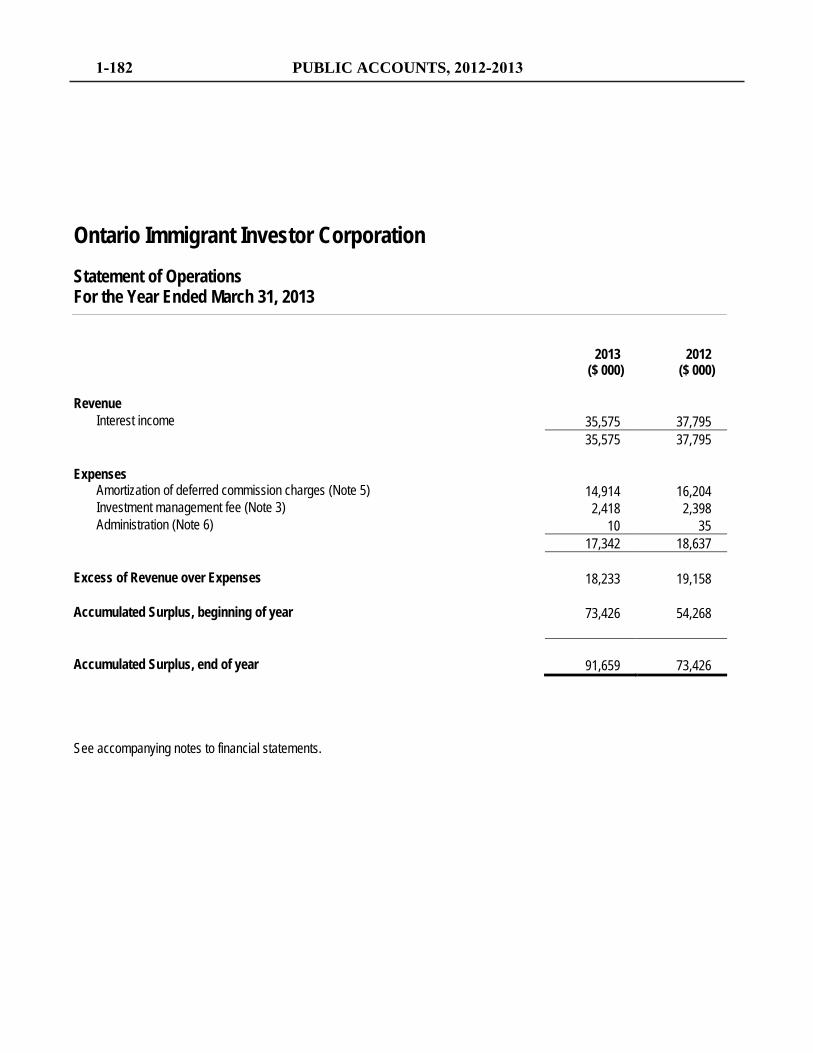
Ontario Immigrant Investor Corporation Statement of Operations For the Year Ended March 31, 2013
2013 2012 ($ 000) ($ 000)
Revenue
Interest income 35,575 37,795 35,575 37,795
Expenses
Amortization of deferred commission charges (Note 5) 14,914 16,204 Investment management fee (Note 3) 2,418 2,398 Administration (Note 6) 10 35
17,342 18,637
Excess of Revenue over Expenses 18,233 19,158 Accumulated Surplus, beginning of year 73,426 54,268
Accumulated Surplus, end of year 91,659 73,426
See accompanying notes to financial statements.
1-182 PUBLIC ACCOUNTS, 2012-2013
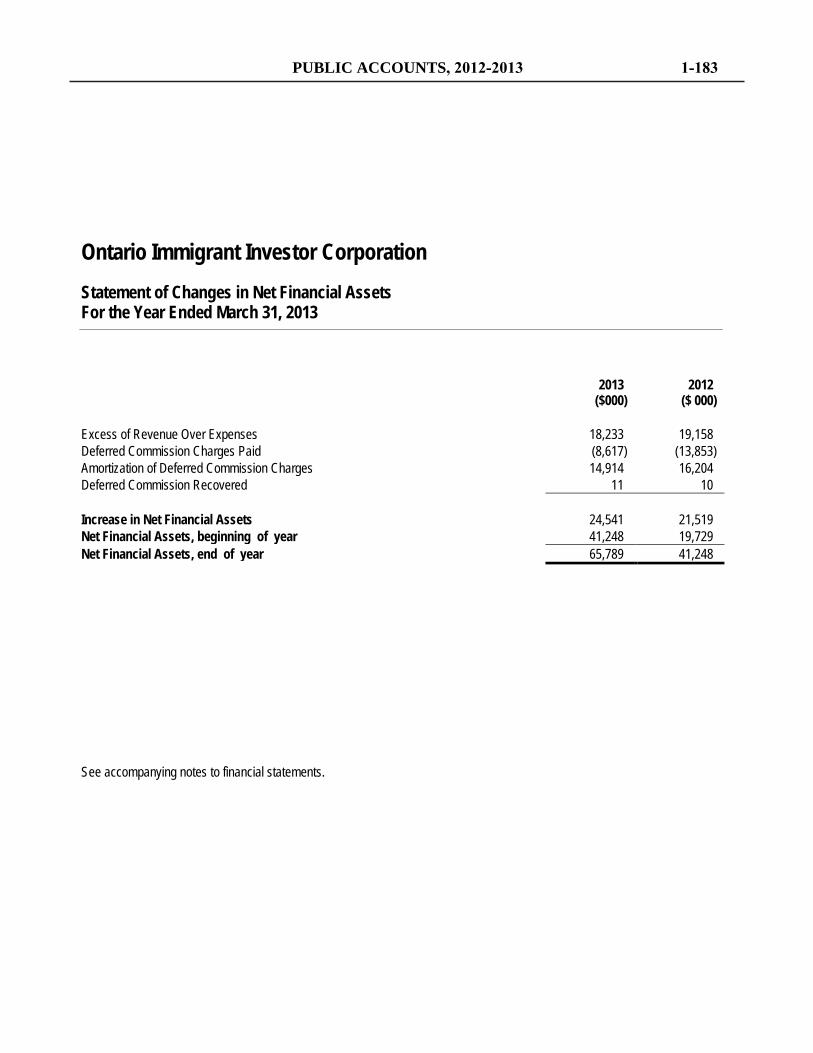
Ontario Immigrant Investor Corporation Statement of Changes in Net Financial Assets For the Year Ended March 31, 2013
2013 2012 ($000) ($ 000)
Excess of Revenue Over Expenses 18,233 19,158 Deferred Commission Charges Paid (8,617) (13,853) Amortization of Deferred Commission Charges 14,914 16,204 Deferred Commission Recovered 11 10 Increase in Net Financial Assets 24,541 21,519 Net Financial Assets, beginning of year 41,248 19,729 Net Financial Assets, end of year 65,789 41,248
See accompanying notes to financial statements.
PUBLIC ACCOUNTS, 2012-2013 1-183
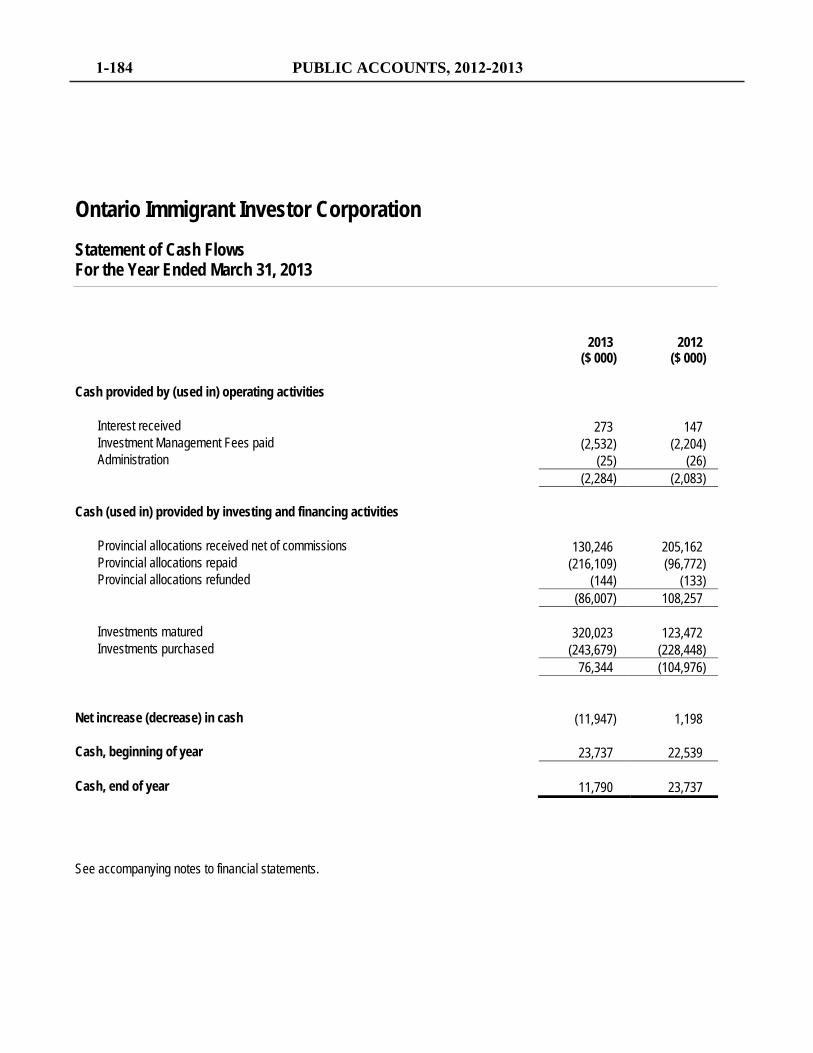
Ontario Immigrant Investor Corporation Statement of Cash Flows For the Year Ended March 31, 2013
2013 2012 ($ 000) ($ 000)
Cash provided by (used in) operating activities
Interest received 273 147 Investment Management Fees paid (2,532) (2,204) Administration (25) (26)
(2,284) (2,083)
Cash (used in) provided by investing and financing activities
Provincial allocations received net of commissions 130,246 205,162 Provincial allocations repaid (216,109) (96,772) Provincial allocations refunded (144) (133)
(86,007) 108,257
Investments matured 320,023 123,472 Investments purchased (243,679) (228,448)
76,344 (104,976)
Net increase (decrease) in cash (11,947) 1,198 Cash, beginning of year 23,737 22,539 Cash, end of year 11,790 23,737
See accompanying notes to financial statements.
1-184 PUBLIC ACCOUNTS, 2012-2013
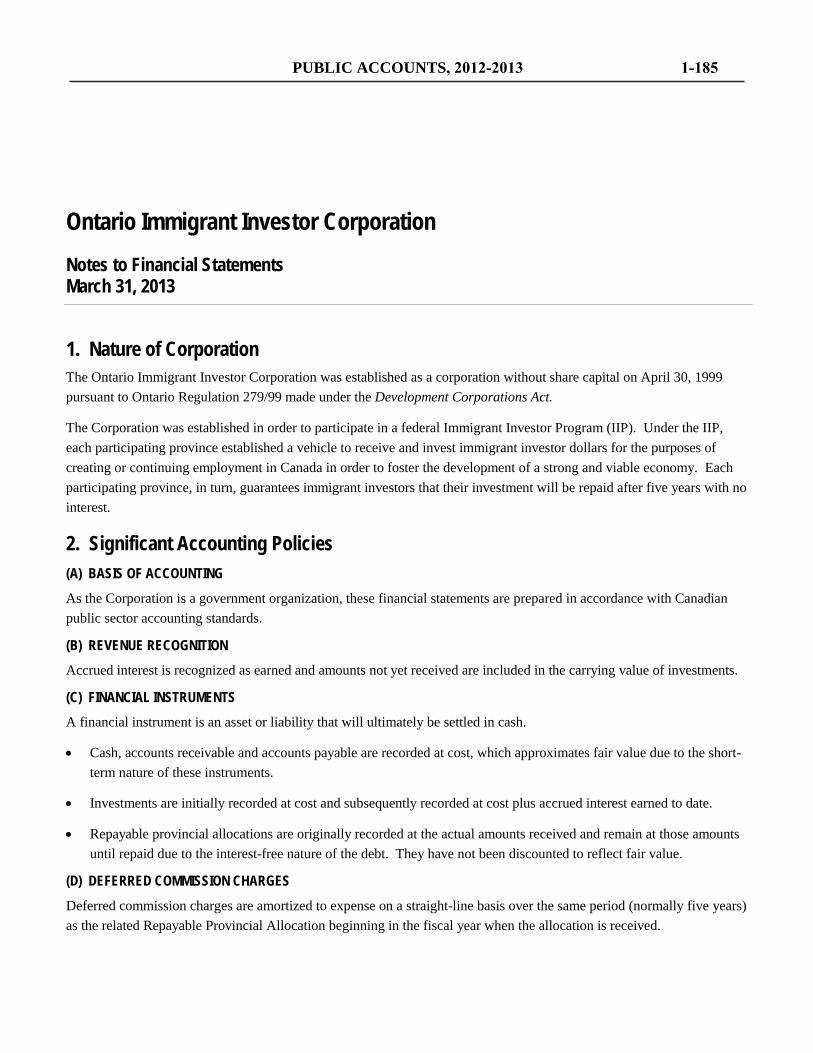
Ontario Immigrant Investor Corporation Notes to Financial Statements March 31, 2013
1. Nature of Corporation The Ontario Immigrant Investor Corporation was established as a corporation without share capital on April 30, 1999 pursuant to Ontario Regulation 279/99 made under the Development Corporations Act.
The Corporation was established in order to participate in a federal Immigrant Investor Program (IIP). Under the IIP, each participating province established a vehicle to receive and invest immigrant investor dollars for the purposes of creating or continuing employment in Canada in order to foster the development of a strong and viable economy. Each participating province, in turn, guarantees immigrant investors that their investment will be repaid after five years with no interest.
2. Significant Accounting Policies (A) BASIS OF ACCOUNTING As the Corporation is a government organization, these financial statements are prepared in accordance with Canadian public sector accounting standards.
(B) REVENUE RECOGNITION Accrued interest is recognized as earned and amounts not yet received are included in the carrying value of investments.
(C) FINANCIAL INSTRUMENTS A financial instrument is an asset or liability that will ultimately be settled in cash.
• Cash, accounts receivable and accounts payable are recorded at cost, which approximates fair value due to the short-term nature of these instruments.
• Investments are initially recorded at cost and subsequently recorded at cost plus accrued interest earned to date.
• Repayable provincial allocations are originally recorded at the actual amounts received and remain at those amounts until repaid due to the interest-free nature of the debt. They have not been discounted to reflect fair value.
(D) DEFERRED COMMISSION CHARGES Deferred commission charges are amortized to expense on a straight-line basis over the same period (normally five years) as the related Repayable Provincial Allocation beginning in the fiscal year when the allocation is received.
PUBLIC ACCOUNTS, 2012-2013 1-185
Ontario Immigrant Investor Corporation Notes to Financial Statements March 31, 2013
2. Significant Accounting Policies (Continued) (E) USE OF ESTIMATES The preparation of financial statements requires management to make estimates and assumptions that affect the reported amount of assets and liabilities at the date of the financial statements, and the reported amounts of revenues and expenses during the reporting period. Actual results could differ from those estimates.
3. Investments In September 2010, in order to satisfy the requirements of the Federal Immigration Investor Program the Corporation approved a new investment strategy to direct a significant portion of allocations received to the Loan Program managed by Ontario Infrastructure and Lands Corporation (OILC) a related party. Through its Loan Program, OILC helps finance hundreds of infrastructure projects such as the construction of roads, bridges and facilities thereby fostering economic development and job creation.
In December 2010, the Corporation entered into an agreement with OILC to direct a minimum of $12.5 million of the allocations to OILC monthly, in exchange for promissory notes due five years from the date of the transfer at interest rates equal to the Province’s cost of borrowing for similar terms. In February 2011, the Corporation started to advance funds to OILC, and as at March 31, 2013 the promissory notes had a weighted-average interest rate of 2.07% (2012 – 2.30%).
Prior to February 2011, the Corporation invested all of its allocations in fixed income securities issued by the Province of Ontario, maturing within five years. In general, zero-coupon bonds were purchased to align maturity dates to the Provincial Allocations repayment schedule provided in Note 4. As at March 31, 2013, these fixed income securities had a weighted-average yield of 3.18% (2012– 3.45%).
The entire portfolio of investments is managed by the Ontario Financing Authority (OFA), a related party, in accordance with the terms and conditions set out in an agreement signed between the OFA, the Corporation and the Province. The Corporation pays OFA an investment management fee of 0.2% of the average par value or face value of the investments outstanding during the year for performing these services.
1-186 PUBLIC ACCOUNTS, 2012-2013
Ontario Immigrant Investor Corporation Notes to Financial Statements March 31, 2013
3. Investments (Continued) The investments balance which includes accrued interest is broken down as follows:
March 31, 2013 March 31, 2013 March 31, 2012 March 31, 2012 Cost Market Cost Market ($ 000) ($ 000) ($ 000) ($ 000) Zero Coupon Bonds 743,706 760,821 963,734 991,496 OILC Promissory Notes 344,151 343,166 216,414 219,159 Fixed Income Bonds 34,880 34,806 13,368 13,304 Treasury Bills 39,806 39,803 10,070 10,073 1,162,543 1,178,596 1,203,586 1,234,032
The Corporation is exposed to interest rate risk whenever any funds received from immigrants are invested in fixed income securities because the future return and market value of the investments is dependent on the prevailing interest rates. However, there is very little exposure to fluctuating interest rates during the 5-year period of the repayable provincial allocations because the maturity of the fixed income investments matches the maturity of the repayable provincial allocations. It is management’s opinion that the Corporation is not exposed to significant currency or credit risks arising from its financial instruments.
4. Repayable Provincial Allocations The Corporation incurs long-term obligations from funds received under the federal Immigrant Investor Program in accordance with the terms and conditions set out in agreements signed in June 1999 and June 2011 between the federal Minister of Citizenship and Immigration Canada and the Corporation. The agreement states that the federal Minister, as agent of the Corporation, receives funds from immigrant investors and transfers Ontario’s share of the funds (Provincial Allocation) to the Corporation. The Corporation will repay any Provincial Allocations received without interest at expiry of the Allocation Period, being five years from the date the Provincial Allocation was originally received. An investor’s application for permanent residence may be withdrawn by the Investor or denied by the federal government. If this happens, the Provincial Allocation pertaining to the Investor is due and refunded by the Corporation within 90 days of written notification from the investor for repayment. Funds received pertaining to applications still being processed by the federal government are also considered repayable within 90 days.
PUBLIC ACCOUNTS, 2012-2013 1-187
Ontario Immigrant Investor Corporation Notes to Financial Statements March 31, 2013
4. Repayable Provincial Allocations (Continued) The Province guarantees the repayment of the Provincial Allocations when due. The repayment schedule on Provincial Allocations is as follows:
($ 000) Due 90 days on request 1,874 Due fiscal year 2014 240,387 Due fiscal year 2015 251,635 Due fiscal year 2016 258,147 Due fiscal year 2017 219,017 Due fiscal year 2018 136,989 1,108,049
5. Deferred Commission Charges The Corporation pays a commission to intermediaries for introducing new immigrant investors who successfully apply for permanent residence in Ontario under the federal Immigrant Investor program. If the application for permanent residence is withdrawn by the immigrant investor or denied by the federal government, the Corporation recovers the commission in the year when this occurs. The deferred charges represent the unamortized balance of the commissions.
2013 2012 ($ 000) ($ 000) Balance, beginning of year 32,178 34,539 Commissions paid 8,617 13,853 Commissions recovered (11) (10) Amortization (14,914) (16,204) Balance, end of year 25,870 32,178
6. Administration Support Services The Ministry of Economic Development, Trade and Employment provides expert business support, strategic management services and other administrative support, including accommodation, financial, legal and human resource services without charge.
1-188 PUBLIC ACCOUNTS, 2012-2013
INFRASTRUCTURE ONTARIO RESPONSIBILITY FOR FINANCIAL REPORTING
The accompanying financial statements of Ontario Infrastructure and Lands Corporation have been prepared in accordance with accounting principles for governments recommended by the Public Sector Accounting Board of the Canadian Institute of Chartered Accountants and, where applicable, the recommendations of the Accounting Standards Board of the Canadian Institute of Chartered Accountants and are the responsibility of management. Management maintains a system of internal controls designed to provide reasonable assurance that the assets are safeguarded and that reliable financial information is available on a timely basis. The system includes formal policies and procedures and an organizational structure that provides for appropriate delegation of authority and segregation of responsibilities. The Board of Directors oversees management’s responsibilities for financial reporting through the Audit Committee. The Audit Committee reviews the financial statements and recommends them to the Board for approval. The financial statements have been audited by PricewaterHouseCoopers. The Auditor’s responsibility is to express an opinion on whether the financial statements are fairly presented in accordance with generally accepted accounting principles. The Auditor’s report outlines the scope of the Auditor’s examination and opinion.
On behalf of management,
Bert Clark President and Chief Executive Officer
Komathie Wulf Chief Financial Officer
PUBLIC ACCOUNTS, 2012-2013 1-189
PricewaterhouseCoopers LLP1 Robert Speck Parkway,Suite 1100, Mississauga ON L4Z 3M3T: 905 949 7400, F:905 949 7415, www.pwc.com/ca
“PwC” refers to PricewaterhouseCoopers LLP, an Ontario limited liability partnership.
June 26, 2013
Independent Auditor’s Report
To the Directors of Ontario Infrastructure and Lands Corporation
We have audited the accompanying financial statements of Ontario Infrastructure and Lands Corporation,which comprise the statement of financial position as at March 31, 2013 and the statement of operations andaccumulated surplus, re-measurement gains and losses, changes in net financial assets, and cash flows for theyear then ended, and the related notes, which comprise a summary of significant accounting policies and otherexplanatory information.
Management’s responsibility for the financial statementsManagement is responsible for the preparation and fair presentation of these financial statements in accordancewith Canadian public sector accounting standards, and for such internal control as management determines isnecessary to enable the preparation of financial statements that are free from material misstatement, whetherdue to fraud or error.
Auditor’s responsibilityOur responsibility is to express an opinion on these financial statements based on our audit. We conducted ouraudit in accordance with Canadian generally accepted auditing standards. Those standards require that wecomply with ethical requirements and plan and perform the audit to obtain reasonable assurance about whetherthe financial statements are free from material misstatement.
An audit involves performing procedures to obtain audit evidence about the amounts and disclosures in thefinancial statements. The procedures selected depend on the auditor’s judgment, including the assessment ofthe risks of material misstatement of the financial statements, whether due to fraud or error. In making thoserisk assessments, the auditor considers internal control relevant to the entity’s preparation and fair presentationof the financial statements in order to design audit procedures that are appropriate in the circumstances, butnot for the purpose of expressing an opinion on the effectiveness of the entity’s internal control. An audit alsoincludes evaluating the appropriateness of accounting policies used and the reasonableness of accountingestimates made by management, as well as evaluating the overall presentation of the financial statements.
We believe that the audit evidence we have obtained is sufficient and appropriate to provide a basis for our auditopinion.
OpinionIn our opinion, the financial statements present fairly, in all material respects, the financial position of OntarioInfrastructure and Lands Corporation as at March 31, 2013 and the results of its operations, its re-measurementgains and losses, changes in its net financial assets and its cash flows for the year then ended in accordance withCanadian public sector accounting standards.
Other matterWithout modifying our opinion, we draw attention to Note 2 to the financial statements which explain thatcertain comparative information for the year ended and as at March 31, 2012 has been restated. The financialstatements as at March 31, 2012 and for the year then ended, prior to restatement of the comparativeinformation, were audited by another auditor who expressed an unmodified opinion on those financialstatements on June 21, 2012.
(Signed) “PricewaterhouseCoopers LLP”
Chartered Accountants, Licensed Public Accountants
1-190 PUBLIC ACCOUNTS, 2012-2013
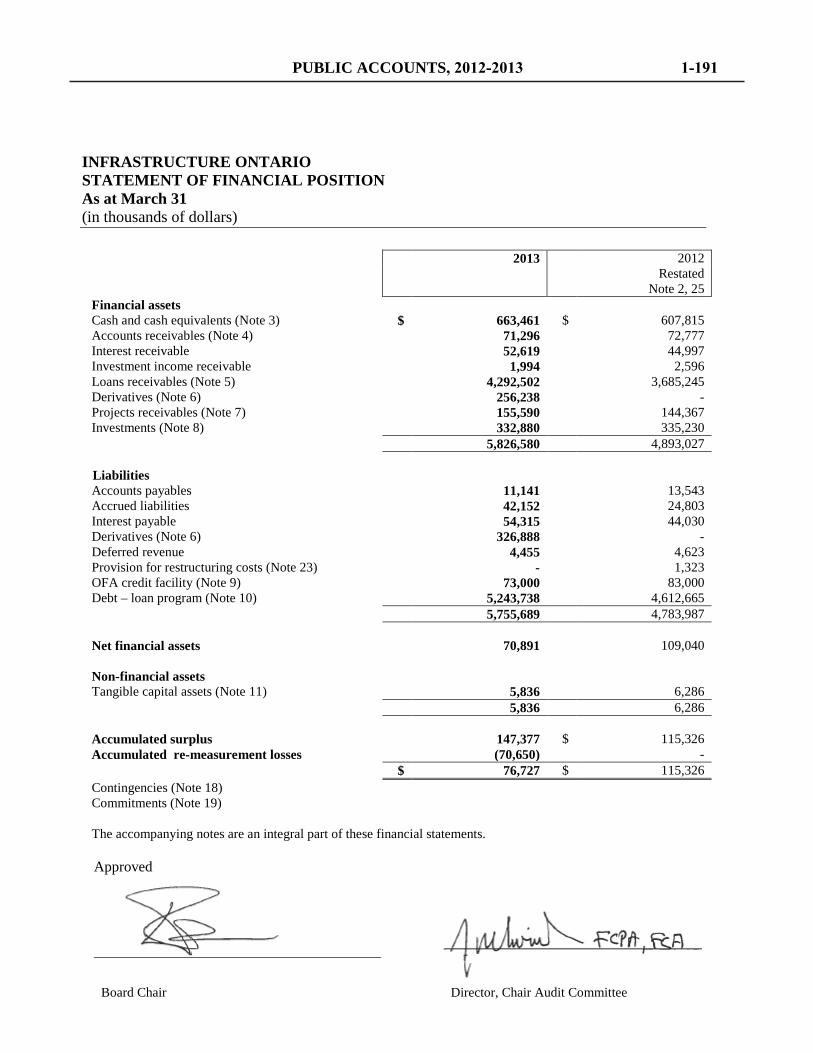
INFRASTRUCTURE ONTARIO STATEMENT OF FINANCIAL POSITION As at March 31 (in thousands of dollars)
Approved
Board Chair Director, Chair Audit Committee
2013 2012
Restated
Note 2, 25 Financial assets Cash and cash equivalents (Note 3) $ 663,461 $ 607,815 Accounts receivables (Note 4) 71,296 72,777 Interest receivable 52,619 44,997 Investment income receivable 1,994 2,596 Loans receivables (Note 5) 4,292,502 3,685,245 Derivatives (Note 6) 256,238 - Projects receivables (Note 7) 155,590 144,367 Investments (Note 8) 332,880 335,230 5,826,580 4,893,027 Liabilities Accounts payables 11,141 13,543 Accrued liabilities 42,152 24,803 Interest payable 54,315 44,030 Derivatives (Note 6) 326,888 - Deferred revenue 4,455 4,623 Provision for restructuring costs (Note 23) - 1,323 OFA credit facility (Note 9) 73,000 83,000 Debt – loan program (Note 10) 5,243,738 4,612,665 5,755,689 4,783,987 Net financial assets 70,891 109,040 Non-financial assets Tangible capital assets (Note 11) 5,836 6,286 5,836 6,286 Accumulated surplus 147,377 $ 115,326 Accumulated re-measurement losses (70,650) - $ 76,727 $ 115,326 Contingencies (Note 18) Commitments (Note 19) The accompanying notes are an integral part of these financial statements.
PUBLIC ACCOUNTS, 2012-2013 1-191
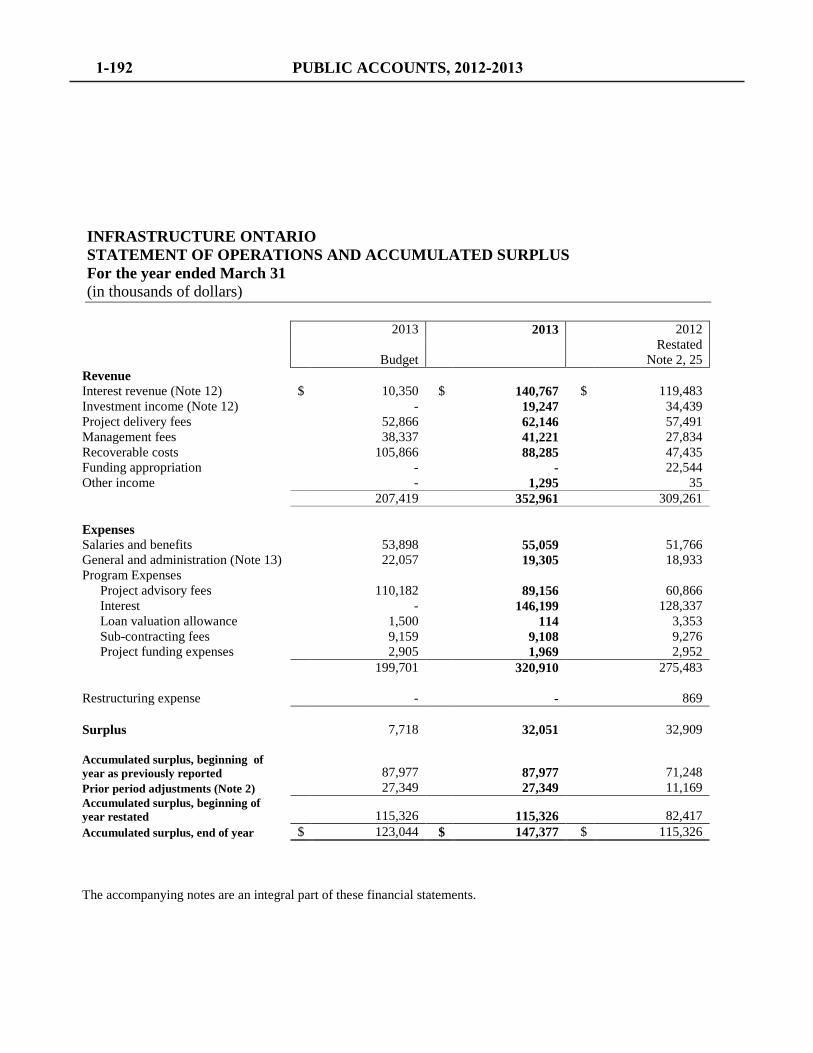
INFRASTRUCTURE ONTARIO STATEMENT OF OPERATIONS AND ACCUMULATED SURPLUS For the year ended March 31 (in thousands of dollars)
2013 2013 2012
Budget Restated
Note 2, 25 Revenue Interest revenue (Note 12) $ 10,350 $ 140,767 $ 119,483 Investment income (Note 12) - 19,247 34,439 Project delivery fees 52,866 62,146 57,491 Management fees 38,337 41,221 27,834 Recoverable costs 105,866 88,285 47,435 Funding appropriation - - 22,544 Other income - 1,295 35 207,419 352,961 309,261 Expenses Salaries and benefits 53,898 55,059 51,766 General and administration (Note 13) 22,057 19,305 18,933 Program Expenses
Project advisory fees 110,182 89,156 60,866 Interest - 146,199 128,337 Loan valuation allowance 1,500 114 3,353 Sub-contracting fees 9,159 9,108 9,276 Project funding expenses 2,905 1,969 2,952
199,701 320,910 275,483 Restructuring expense - - 869 Surplus 7,718 32,051 32,909 Accumulated surplus, beginning of year as previously reported
87,977 87,977 71,248
Prior period adjustments (Note 2) 27,349 27,349 11,169 Accumulated surplus, beginning of year restated
115,326
115,326 82,417
Accumulated surplus, end of year $ 123,044 $ 147,377 $ 115,326
The accompanying notes are an integral part of these financial statements.
1-192 PUBLIC ACCOUNTS, 2012-2013
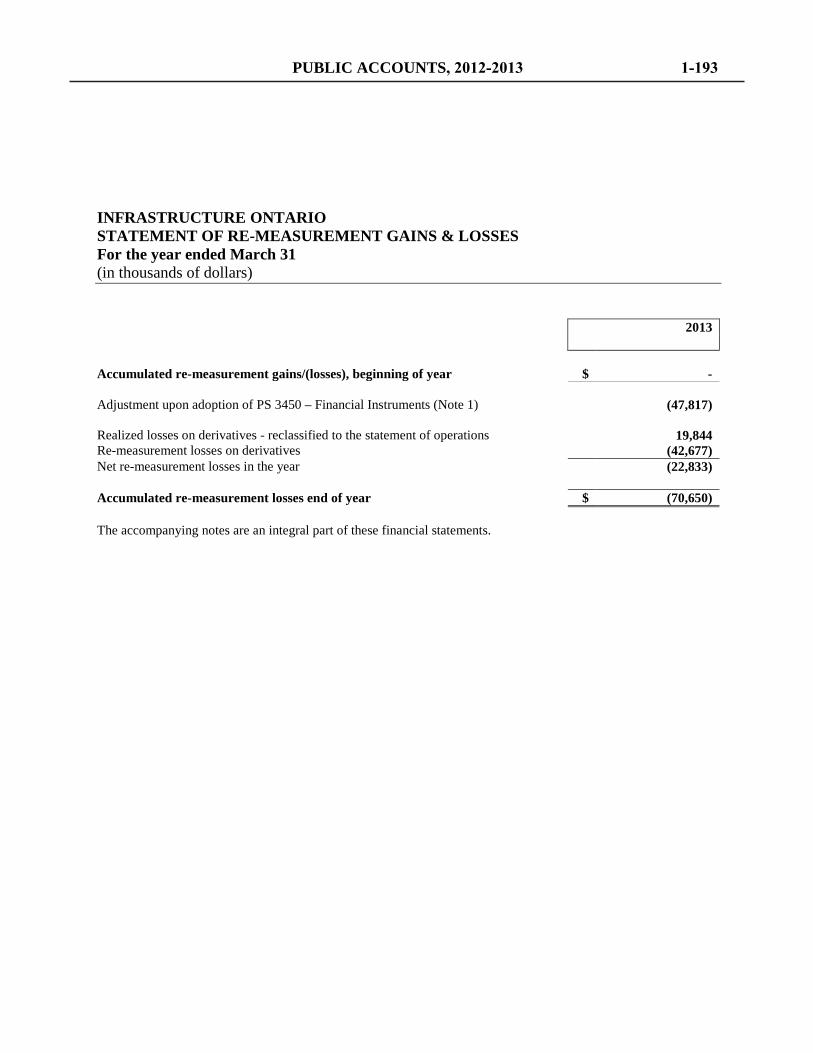
INFRASTRUCTURE ONTARIO STATEMENT OF RE-MEASUREMENT GAINS & LOSSES For the year ended March 31 (in thousands of dollars) 2013 Accumulated re-measurement gains/(losses), beginning of year $ - Adjustment upon adoption of PS 3450 – Financial Instruments (Note 1) (47,817) Realized losses on derivatives - reclassified to the statement of operations 19,844 Re-measurement losses on derivatives (42,677) Net re-measurement losses in the year (22,833) Accumulated re-measurement losses end of year $ (70,650) The accompanying notes are an integral part of these financial statements.
PUBLIC ACCOUNTS, 2012-2013 1-193
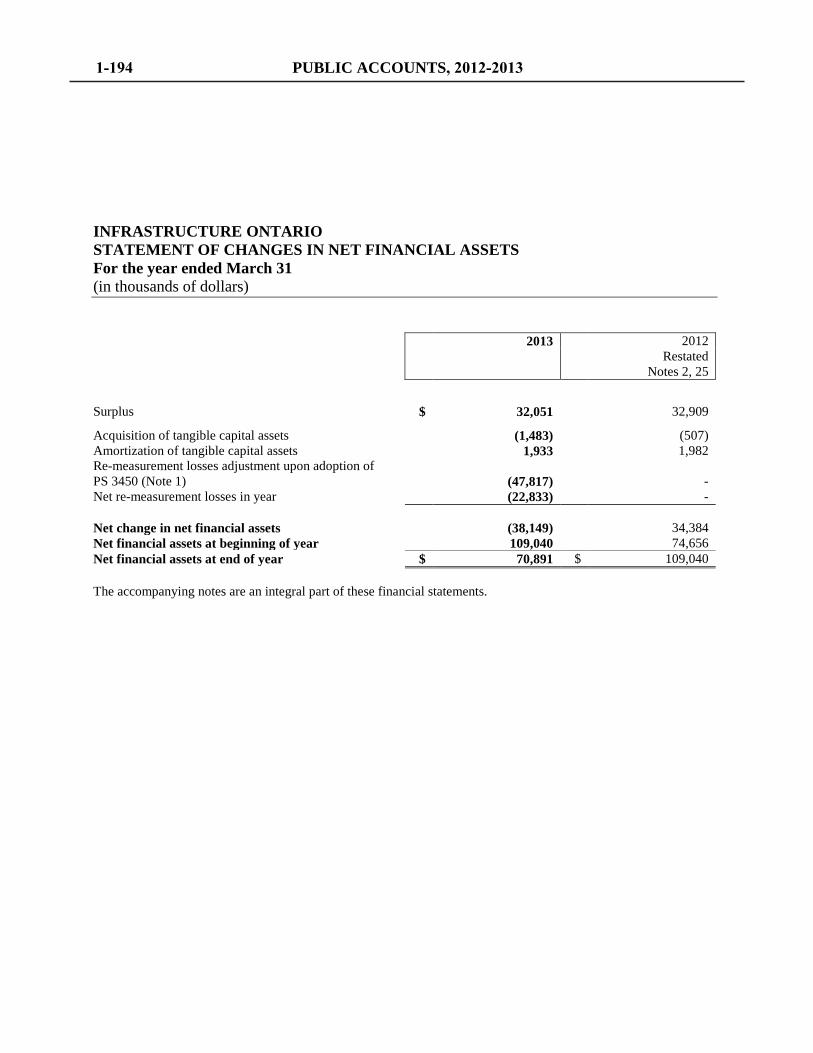
INFRASTRUCTURE ONTARIO STATEMENT OF CHANGES IN NET FINANCIAL ASSETS For the year ended March 31 (in thousands of dollars) 2013 2012
Restated
Notes 2, 25
Surplus $ 32,051 32,909
Acquisition of tangible capital assets (1,483) (507) Amortization of tangible capital assets 1,933 1,982 Re-measurement losses adjustment upon adoption of PS 3450 (Note 1) (47,817) - Net re-measurement losses in year (22,833) - Net change in net financial assets (38,149) 34,384 Net financial assets at beginning of year 109,040 74,656 Net financial assets at end of year $ 70,891 $ 109,040 The accompanying notes are an integral part of these financial statements.
1-194 PUBLIC ACCOUNTS, 2012-2013
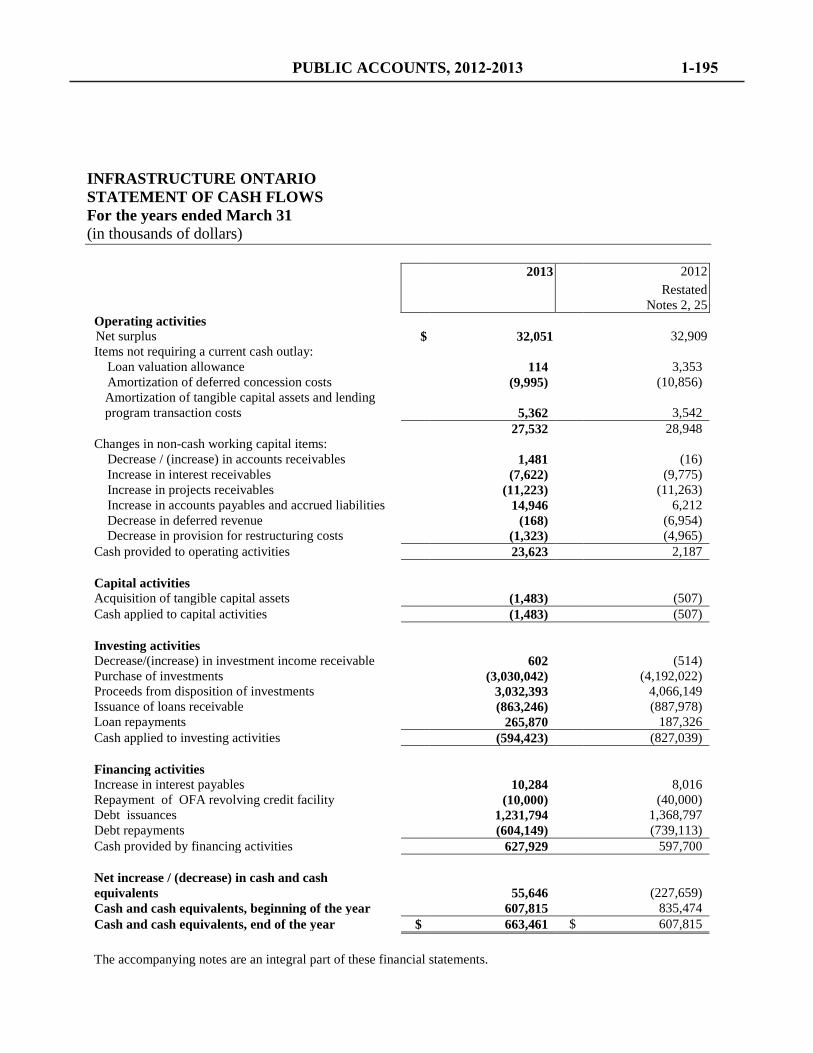
INFRASTRUCTURE ONTARIO STATEMENT OF CASH FLOWS For the years ended March 31 (in thousands of dollars) 2013 2012
Restated
Notes 2, 25 Operating activities
Net surplus $ 32,051
32,909 Items not requiring a current cash outlay:
Loan valuation allowance
114
3,353 Amortization of deferred concession costs
(9,995)
(10,856)
Amortization of tangible capital assets and lending program transaction costs 5,362 3,542
27,532
28,948
Changes in non-cash working capital items: Decrease / (increase) in accounts receivables
1,481
(16) Increase in interest receivables
(7,622)
(9,775)
Increase in projects receivables
(11,223)
(11,263) Increase in accounts payables and accrued liabilities
14,946
6,212
Decrease in deferred revenue
(168)
(6,954) Decrease in provision for restructuring costs
(1,323)
(4,965)
Cash provided to operating activities 23,623 2,187
Capital activities Acquisition of tangible capital assets (1,483) (507)
Cash applied to capital activities (1,483) (507)
Investing activities Decrease/(increase) in investment income receivable
602
(514) Purchase of investments
(3,030,042)
(4,192,022)
Proceeds from disposition of investments
3,032,393
4,066,149 Issuance of loans receivable
(863,246)
(887,978)
Loan repayments 265,870 187,326 Cash applied to investing activities (594,423) (827,039)
Financing activities Increase in interest payables
10,284
8,016 Repayment of OFA revolving credit facility
(10,000)
(40,000)
Debt issuances
1,231,794
1,368,797 Debt repayments
(604,149)
(739,113)
Cash provided by financing activities 627,929 597,700
Net increase / (decrease) in cash and cash equivalents
55,646
(227,659)
Cash and cash equivalents, beginning of the year 607,815 835,474 Cash and cash equivalents, end of the year $ 663,461 $ 607,815
The accompanying notes are an integral part of these financial statements.
PUBLIC ACCOUNTS, 2012-2013 1-195
INFRASTRUCTURE ONTARIO NOTES TO FINANCIAL STATEMENTS March 31, 2013 and 2012 NATURE OF THE CORPORATION On June 6, 2011 pursuant to the Ontario Infrastructure and Lands Corporation Act, 2011, Ontario Infrastructure Projects Corporation (OIPC), Ontario Realty Corporation (ORC) and Stadium Corporation of Ontario Limited (STADCO) were amalgamated and continued as a corporation without share capital under the name of Ontario Infrastructure and Lands Corporation (Infrastructure Ontario/Agency). Infrastructure Ontario is a Crown Corporation reporting to the Minister of Infrastructure (Minister) and is classified by the Province of Ontario (Province) as an operational enterprise. The mandate of Infrastructure Ontario includes the following:
• To provide financing for infrastructure purposes to municipalities and to eligible public organizations; • To provide the Government with advice and services, including project management, contract management
and development, related to public works; • To provide financial management for public works managed by the Ministry or by a Crown agency for
which the Minister is responsible; • To carry out the powers, duties and functions delegated by the Minister to the Corporation under the
Ministry of Infrastructure Act, 2011; • To provide advice and services related to real property to public sector organizations when directed to do so
in writing by the Minister; • To advise the Minister on infrastructure projects in Ontario, when directed to do so in writing by the
Minister; • To advise the Minister on financial, strategic or other matters involving the Government, when directed to
do so in writing by the Minister; • To implement or assist in the implementation of transactions involving the Government, when directed to
do so in writing by the Minister; • To provide project management and contract management services related to infrastructure projects in
Ontario that are not public works, when directed to do so in writing by the Minister; and • To undertake any additional objects as directed by the Minister of Infrastructure.
As at March 31, 2013, Infrastructure Ontario managed 45.6 million rentable square feet: 35.2 million owned by the province and 10.4 million leased from the private sector; as well as 82,176 acres of land managed by the Province as represented by the Ministry of Infrastructure. As a Crown corporation, Infrastructure Ontario is exempt from federal and provincial income taxes under paragraph 149(1) (d) of the Income Tax Act of Canada. Infrastructure Ontario has been added to Schedule A of the Canada Ontario Reciprocal Taxation Agreement and is exempt from the Goods and Services Tax. Infrastructure Ontario is subject to Harmonized Sales Tax (HST). 1. SIGNIFICANT ACCOUNTING POLICIES
Basis of accounting These financial statements are prepared in accordance with accounting policies and standards established by the Public Sector Accounting Board (PSAB) of the Canadian Institute of Chartered Accountants. The financial statements have been prepared based on the continuity of interests’ principle with respect to the OIPC and ORC amalgamation which requires the continuing entity, Infrastructure Ontario, to report the comparative financial statements as if the two entities had been combined since inception. OIPC and ORC
1-196 PUBLIC ACCOUNTS, 2012-2013
INFRASTRUCTURE ONTARIO NOTES TO FINANCIAL STATEMENTS March 31, 2013 and 2012
had complementary operating mandates prior to the amalgamation, which are being continued by Infrastructure Ontario. All assets and liabilities were transferred to Infrastructure Ontario. Since STADCO divested itself of its assets, liabilities and operations to Ministry of Infrastructure (MOI) prior to amalgamation and brought no assets, liabilities or operations into the amalgamated agency, STADCO is accounted for using the purchase method of accounting, with no purchase price paid, no assets acquired and no liabilities assumed. Accordingly, the comparative year financial statements include the entire year of operations for Infrastructure Ontario, OIPC and ORC, but not STADCO, after adjusting for any amounts owing among the entities. New Accounting Standards Effective April 1, 2012, Infrastructure Ontario adopted Public Accounting Standards PS 3450 – Financial Instruments (PS 3450), PS 1201 – Financial Statement Presentation (PS 1201) and PS 2601 – Foreign Currency Translation (PS 2601). In accordance with the transitional provisions, the standards were adopted prospectively from the date of adoption and comparative periods were not restated. The new standards provide comprehensive requirements for the recognition, measurement, presentation and disclosure of financial instruments and foreign currency transactions. The adoption of PS 2601 did not have an impact on the financial statements of Infrastructure Ontario. As a result of adopting PS 1201 a new statement of re-measurement gains and losses was presented for the year ending March 31, 2013, which measures the changes in the fair market value of specific financial assets and financial liabilities measured at fair value. The impact of the adoption of PS 3450 was a change in the method of measuring and reporting interest on financial assets from the simple method, or straight line, to the effective interest method. The change in methodology did not have a material impact to the financial statements. In addition, under PS 1201 and PS 3450, all financial instruments, including derivatives, are included in the statement of financial position. They are measured either at fair value, cost or amortized cost depending upon the characteristics of the instruments and Infrastructure Ontario's accounting policy choices. As permitted by PS 3450, Infrastructure Ontario has elected to identify and account for embedded derivatives on a prospective basis. In accordance with the transitional provisions of PS 3450, Infrastructure Ontario recognized a derivative asset of $236.9 million and a derivative liability of $284.7 million related to the fair value of Infrastructure Ontario's interest rate swap derivatives at April 1, 2012, with a corresponding adjustment to accumulated re-measurement gains (losses). Management estimates The preparation of financial statements in accordance with Canadian General Accepted Accounting Principles (GAAP) requires management to make estimates and assumptions that affect the reported amounts of assets and liabilities and disclosures of contingent liabilities at the date of the financial statements and the reported amounts of revenue and expenses during the reporting period. Actual amounts could differ from these estimates. Key areas where management has made estimates are in the percentage of completion for the determination of revenue from project delivery fees, the loan portfolio valuation allowance and the fair value of derivatives.
PUBLIC ACCOUNTS, 2012-2013 1-197
INFRASTRUCTURE ONTARIO NOTES TO FINANCIAL STATEMENTS March 31, 2013 and 2012
Actual results could differ from these and other estimates, the impact of which would be recorded in future periods. Financial Instruments Infrastructure Ontario’s financial assets include cash and cash equivalents, accounts receivables, interest receivable, investment income receivable, loans receivables, derivatives, projects receivables, and investments. Infrastructure Ontario’s financial liabilities include accounts payables, accrued liabilities, interest payable, derivatives, Ontario Financing Authority (OFA) credit facility, and debt-loan program.
Initial recognition and measurement All financial assets and liabilities are initially recognized at fair value. Fair value is the amount of the consideration that would be agreed upon in an arm’s length transaction between knowledgeable willing parties, who are under no compulsion to act. Financial instruments are classified at initial recognition as either (i) fair value or (ii) cost or amortized cost. Derivatives, portfolio investments in equity instruments quoted in an active market and financial instruments managed on a fair value basis are classified in the fair value category. All other financial instruments are classified in the cost or amortized cost category. Infrastructure Ontario’s only financial asset or liability measured at fair value are derivatives. All other financial assets and liabilities are measured at cost or amortized cost. The agency does not have any portfolio equity investments quoted in an active market or financial instruments managed on a fair value basis. The amortized cost of the 2003-04 program loans (see Note 5) issued by Infrastructure Ontario, which were considered to have concessionary terms, was determined as the present value of the future cash flows of the loan, and discounted using Infrastructure Ontario’s cost of borrowing. The difference between the face value of the loan and its present value is, in substance, a grant. The grant portion is recognized as a concession cost at the date of issuance of the loan and amortized to match the underlying interest subsidy, over the term of the loan. Transaction costs for financial instruments measured at cost or amortized cost are added to or netted against the carrying value of the financial asset or financial liability, respectively. Transaction costs for financial instruments measured at fair value are expensed in the statement of operations. Purchases or sales of financial assets that require delivery of assets within a time frame established by regulation or convention in the market place (regular way trades) are recognized on the trade date. Subsequent measurement The subsequent measurement of financial assets depends on their classification as described below:
i. Financial instruments at fair value Financial instruments at fair value are re-measured at their fair value at the end of each reporting period. Any unrealized gains and losses are recognized in the statement of re-measurement gains and losses and are subsequently reclassified to the statement of operations upon disposal or settlement. Infrastructure Ontario uses the following hierarchy for determining and disclosing the fair value of financial instruments:
• Level 1: quoted (unadjusted) prices in active markets for identical assets or liabilities • Level 2: other techniques for which all inputs that have a significant effect on the recorded
fair value are observable, either directly or indirectly • Level 3: techniques that use inputs that have a significant effect on the recorded fair value
that are not based on observable market data
1-198 PUBLIC ACCOUNTS, 2012-2013
INFRASTRUCTURE ONTARIO NOTES TO FINANCIAL STATEMENTS March 31, 2013 and 2012
The fair value of financial instruments not traded in an active market is determined by appropriate valuation techniques, including forward pricing and swap models, using present value calculations. The models incorporate various inputs including interest rate curves.
ii. Financial instruments at cost or amortized cost Financial instruments not measured at fair value are measured at cost or amortized cost. For financial assets and financial liabilities measured at amortized cost, interest is recorded using the effective interest rate (EIR) method. The EIR is the rate that discounts the estimated future cash payments or receipts over the expected life of the financial instrument or, where appropriate, a shorter period.
Impairment
i. Loss in value of an investment (not quoted in an active market) A write down is recognized in the Statement of Operations and Accumulated Surplus when there has been a loss in the value of the investment considered as an ‘other than temporary’ loss. A loss is considered ‘other than temporary’ when the carrying value of the investment exceeds its actual value for a prolonged period of time. If the actual value of the portfolio investment subsequently increases, the write down to the statement of operations is not reversed.
ii. Loans receivables impairment
A loan portfolio valuation allowance is maintained at a level that Infrastructure Ontario considers adequate to absorb valuation adjustments and losses on loans. The valuation allowance consists of a general allowance which is reviewed on a regular basis. A loan valuation allowance is established against the loan portfolio after management’s review of existing economic, industry and portfolio conditions. The valuation allowance is underpinned by a risk rating process in which risk ratings are assigned at the time of loan origination, monitored on an ongoing basis, and adjusted to reflect changes in underlying credit risk. A number of factors are considered when determining the appropriate level of the valuation allowance, including sensitivity to risk ratings, industry sectors, portfolio quality, business mix, and economic and credit market conditions.
Cash and cash equivalents Cash and cash equivalents include cash on deposit and highly liquid investments with a term to maturity of three months or less. Derivative financial instruments Infrastructure Ontario uses derivative financial instruments, specifically interest rate swaps, to manage its interest rate risks. Such derivative financial instruments are initially recognized at fair value on the date on which a derivative contract is entered into and are subsequently re-measured at fair value at each reporting date. Derivatives are carried as financial assets when the fair value is in a receivable position and as financial liabilities when the fair value is in a payable position.
PUBLIC ACCOUNTS, 2012-2013 1-199
INFRASTRUCTURE ONTARIO NOTES TO FINANCIAL STATEMENTS March 31, 2013 and 2012
Any unrealized gains or losses arising from changes in the fair value of derivatives are recorded in the statement of re-measurement gains and losses and subsequently re-classified to the statement of operations upon settlement. Embedded derivatives An embedded derivative is separated from the host contract and accounted for as a derivative if all of the following conditions are met:
a) The economic characteristics and risks of the embedded derivative are not closely related to the economic characteristics and risks of the host contract;
b) A separate instrument with the same terms as the embedded derivative would meet the definition of a derivative; and
c) The hybrid instrument is not measured at fair value Upon entering new contracts, Infrastructure Ontario applies a documented process to identify the existence of embedded derivatives. A questionnaire listing indicators of the existence of an embedded derivative is completed at the outset in order to identify whether the agreement may give rise to such embedded derivative. Where embedded derivatives are identified, management reviews the specifics of the agreement, determining if the derivative should be measured separately or in combination of the host contract. There were no embedded derivatives in the fiscal period ending March 31, 2013. Tangible capital assets Tangible capital assets are stated at cost less accumulated amortization. Amortization is provided using the straight-line method over the estimated useful life of the assets beginning in the fiscal year of acquisition, with a half-year provision in the year of acquisition and half-year in the year of disposal. The estimated useful lives of the assets are as follows:
Computer hardware and equipment Software Furniture, fixtures and office equipment Leasehold improvements
3 years 5 years 3 – 10 years 5 – 10 years
Impairment of tangible capital assets The Agency reviews the carrying value of tangible capital assets for potential impairment when there is evidence that events or changes in circumstances exist, that indicate that a tangible capital asset no longer contributes to a government's ability to provide goods and services, or that the value of future economic benefits associated with the tangible capital asset is less than its net book value. In these circumstances, the cost of the tangible capital asset is reduced to reflect the decline in the asset's value. No such impairment losses have been incurred to date. Revenue recognition Loan interest Interest on investments and loans receivables are recognized using the effective interest rate method. Project delivery fees Infrastructure Ontario provides professional services under either cost based or fixed price contracts. For cost based contracts, revenue is recorded as costs are incurred. Revenue from fixed price contracts is recorded using the percentage-of-completion method. Percentage of completion is calculated based on a ratio of cost incurred to total estimated costs. Losses, if any, on fixed price contracts are recognized during the period they are identified.
1-200 PUBLIC ACCOUNTS, 2012-2013
INFRASTRUCTURE ONTARIO NOTES TO FINANCIAL STATEMENTS March 31, 2013 and 2012
Management fees Management fees are recognized as revenue when services are provided. Recoverable costs Recoverable costs are recognized as revenue when the related expenses are incurred. Funding appropriation In prior years, Infrastructure Ontario received funding from the Ministry of Infrastructure in relation to in-year corporate expenses. The funding was recorded as unearned revenue until the corporate expenses had been incurred. Once the corporate expenses were incurred, the funding was recognized as revenue.
2. RESTATEMENT OF PRIOR PERIOD FINANCIAL STATEMENTS
Adjustments were required to be recorded in the comparative financial information for the year ended March 31, 2012 related to the accounting for Major Projects fixed-priced contracts, amortization of concession costs and gains/(losses) from the sale of investments. During the year, management determined that revenues and costs for Major Projects’ fixed-priced contracts, should begin to be recognized on project approval as the fixed contract price is determinable and project cost estimates can be reliable measured. Certain revenues and costs in the Major Projects division were previously deferred and recognized over the construction period. The adjustment resulted in an increase to accumulated surplus of $9.4 million and $11.2 million as at March 31, 2011 and March 31, 2012 respectively, as well as a corresponding increase to surplus of $1.9 million for the year ended March 31, 2012. In 2008, Infrastructure Ontario adopted the effective interest method to amortize deferred concession costs into income. The amortization was not calculated correctly on adoption which resulted in an understatement of loans receivable and accumulated surplus of $10.3 million as at April 1, 2011. The correction has been accounted for retroactively. Gains/losses from the sale of investments previously deferred and amortized over the life of the associated loan, should have been completely recognized in the period of disposition.
The above adjustments have been accounted for on a retroactive basis with prior period adjustment and have the following effects on the comparative financial statements:
Adjustments to Statement of Financial Position
($,000)
March 31 2012 Previously Issued
Prior period Adjustment
March 31 2012 Restated
Project receivable $ 125,427 18,940 144,367 Deferred project costs
16,582 (16,582) -
Deferred revenue
19,098 (14,475) 4,623 Accrued liabilities
19,233 5,570 24,803
Loans receivable
3,674,971 10,274 3,685,245 Deferred (revenue) cost on hedging
(5,812) 5,812 -
Accumulated surplus Cumulative pre 2012 adjustment
- 11,169 - Adjustment from 2012
- 16,180 -
Accumulated Surplus, beginning of year
87,977 27,349 115,326
PUBLIC ACCOUNTS, 2012-2013 1-201

INFRASTRUCTURE ONTARIO NOTES TO FINANCIAL STATEMENTS March 31, 2013 and 2012
Adjustments to Statement of Operations
($,000)
March 31 2012 Previously Issued
Prior period Adjustment
March 31 2012 Restated
Investment income
20,143 14,296 34,439 Project Delivery Fees $ 64,700 (7,209) 57,491 Major Projects – Program expenses
70,777 (10,740) 60,037
Commercial Projects – Program expenses
(818) 1,647 829
Surplus
16,729 16,180 32,909 3. CASH AND CASH EQUIVALENTS
($,000) 2013
2012
Restated
Notes 2, 25 Cash $ 29,043 $ 11,577 Cash equivalents 634,418 596,238 $ 663,461 $ 607,815 Cash equivalents include money market investments recorded at cost, which approximate fair value. At March 31, 2013 the interest rates on these investments ranged from 0.98% to 1.56% (2012 - 0.99% to 1.24%).
4. ACCOUNTS RECEIVABLES
($,000) 2013
2012
Restated
Notes 2, 25 Trade accounts receivable $ 67,765 $ 68,338 HST/GST 3,504 4,153 Other receivables 27 286 $ 71,296 $ 72,777
1-202 PUBLIC ACCOUNTS, 2012-2013
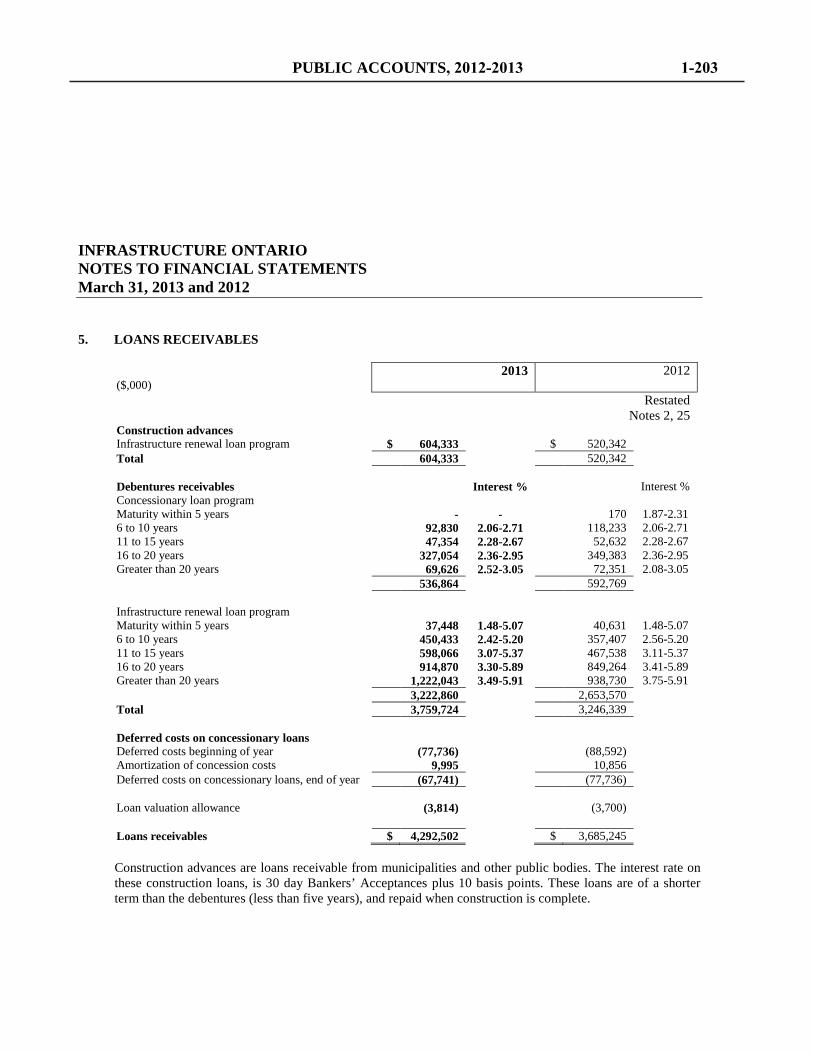
INFRASTRUCTURE ONTARIO NOTES TO FINANCIAL STATEMENTS March 31, 2013 and 2012 5. LOANS RECEIVABLES
($,000) 2013
2012
Restated
Notes 2, 25 Construction advances Infrastructure renewal loan program $ 604,333 $ 520,342 Total 604,333 520,342 Debentures receivables Interest % Interest % Concessionary loan program Maturity within 5 years - - 170 1.87-2.31 6 to 10 years 92,830 2.06-2.71 118,233 2.06-2.71 11 to 15 years 47,354 2.28-2.67 52,632 2.28-2.67 16 to 20 years 327,054 2.36-2.95 349,383 2.36-2.95 Greater than 20 years 69,626 2.52-3.05 72,351 2.08-3.05 536,864 592,769 Infrastructure renewal loan program Maturity within 5 years 37,448 1.48-5.07 40,631 1.48-5.07 6 to 10 years 450,433 2.42-5.20 357,407 2.56-5.20 11 to 15 years 598,066 3.07-5.37 467,538 3.11-5.37 16 to 20 years 914,870 3.30-5.89 849,264 3.41-5.89 Greater than 20 years 1,222,043 3.49-5.91 938,730 3.75-5.91 3,222,860 2,653,570 Total 3,759,724 3,246,339 Deferred costs on concessionary loans Deferred costs beginning of year (77,736) (88,592) Amortization of concession costs 9,995 10,856 Deferred costs on concessionary loans, end of year (67,741) (77,736) Loan valuation allowance (3,814) (3,700) Loans receivables $ 4,292,502 $ 3,685,245 Construction advances are loans receivable from municipalities and other public bodies. The interest rate on these construction loans, is 30 day Bankers’ Acceptances plus 10 basis points. These loans are of a shorter term than the debentures (less than five years), and repaid when construction is complete.
PUBLIC ACCOUNTS, 2012-2013 1-203
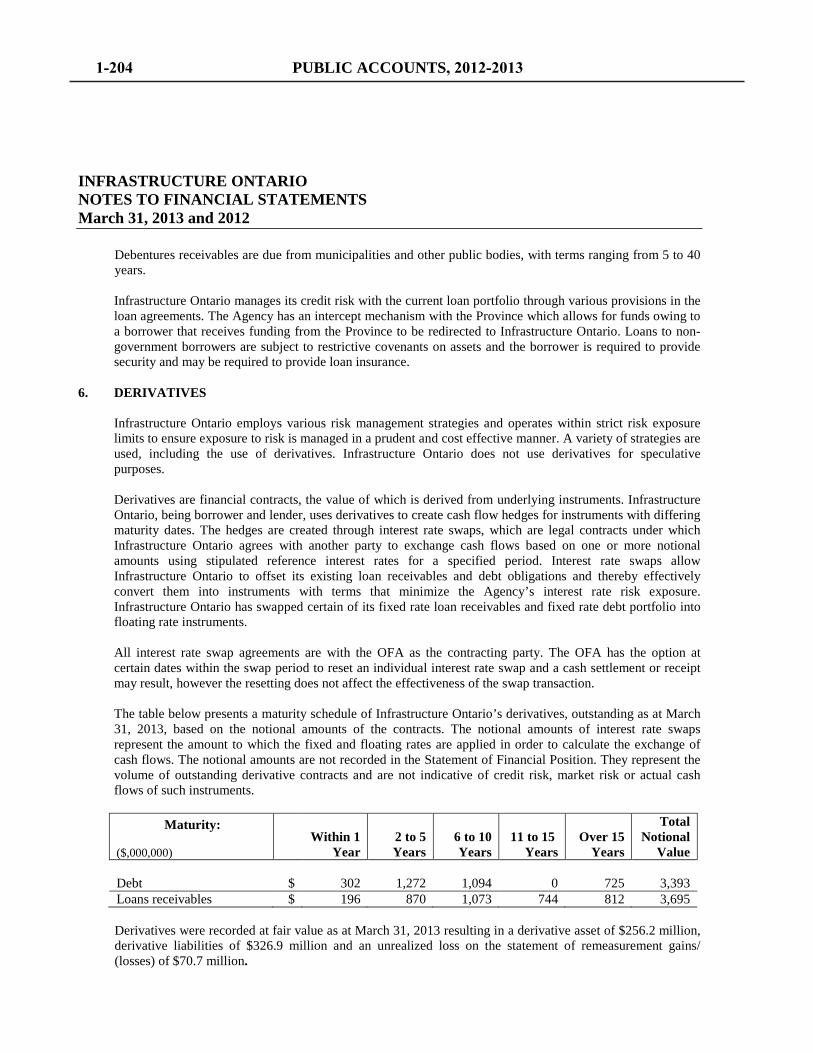
INFRASTRUCTURE ONTARIO NOTES TO FINANCIAL STATEMENTS March 31, 2013 and 2012
Debentures receivables are due from municipalities and other public bodies, with terms ranging from 5 to 40 years. Infrastructure Ontario manages its credit risk with the current loan portfolio through various provisions in the loan agreements. The Agency has an intercept mechanism with the Province which allows for funds owing to a borrower that receives funding from the Province to be redirected to Infrastructure Ontario. Loans to non-government borrowers are subject to restrictive covenants on assets and the borrower is required to provide security and may be required to provide loan insurance.
6. DERIVATIVES Infrastructure Ontario employs various risk management strategies and operates within strict risk exposure limits to ensure exposure to risk is managed in a prudent and cost effective manner. A variety of strategies are used, including the use of derivatives. Infrastructure Ontario does not use derivatives for speculative purposes. Derivatives are financial contracts, the value of which is derived from underlying instruments. Infrastructure Ontario, being borrower and lender, uses derivatives to create cash flow hedges for instruments with differing maturity dates. The hedges are created through interest rate swaps, which are legal contracts under which Infrastructure Ontario agrees with another party to exchange cash flows based on one or more notional amounts using stipulated reference interest rates for a specified period. Interest rate swaps allow Infrastructure Ontario to offset its existing loan receivables and debt obligations and thereby effectively convert them into instruments with terms that minimize the Agency’s interest rate risk exposure. Infrastructure Ontario has swapped certain of its fixed rate loan receivables and fixed rate debt portfolio into floating rate instruments. All interest rate swap agreements are with the OFA as the contracting party. The OFA has the option at certain dates within the swap period to reset an individual interest rate swap and a cash settlement or receipt may result, however the resetting does not affect the effectiveness of the swap transaction. The table below presents a maturity schedule of Infrastructure Ontario’s derivatives, outstanding as at March 31, 2013, based on the notional amounts of the contracts. The notional amounts of interest rate swaps represent the amount to which the fixed and floating rates are applied in order to calculate the exchange of cash flows. The notional amounts are not recorded in the Statement of Financial Position. They represent the volume of outstanding derivative contracts and are not indicative of credit risk, market risk or actual cash flows of such instruments. Maturity: ($,000,000)
Within 1
Year 2 to 5 Years
6 to 10 Years
11 to 15 Years
Over 15 Years
Total Notional
Value Debt $ 302 1,272 1,094 0 725 3,393 Loans receivables $ 196 870 1,073 744 812 3,695
Derivatives were recorded at fair value as at March 31, 2013 resulting in a derivative asset of $256.2 million, derivative liabilities of $326.9 million and an unrealized loss on the statement of remeasurement gains/ (losses) of $70.7 million.
1-204 PUBLIC ACCOUNTS, 2012-2013
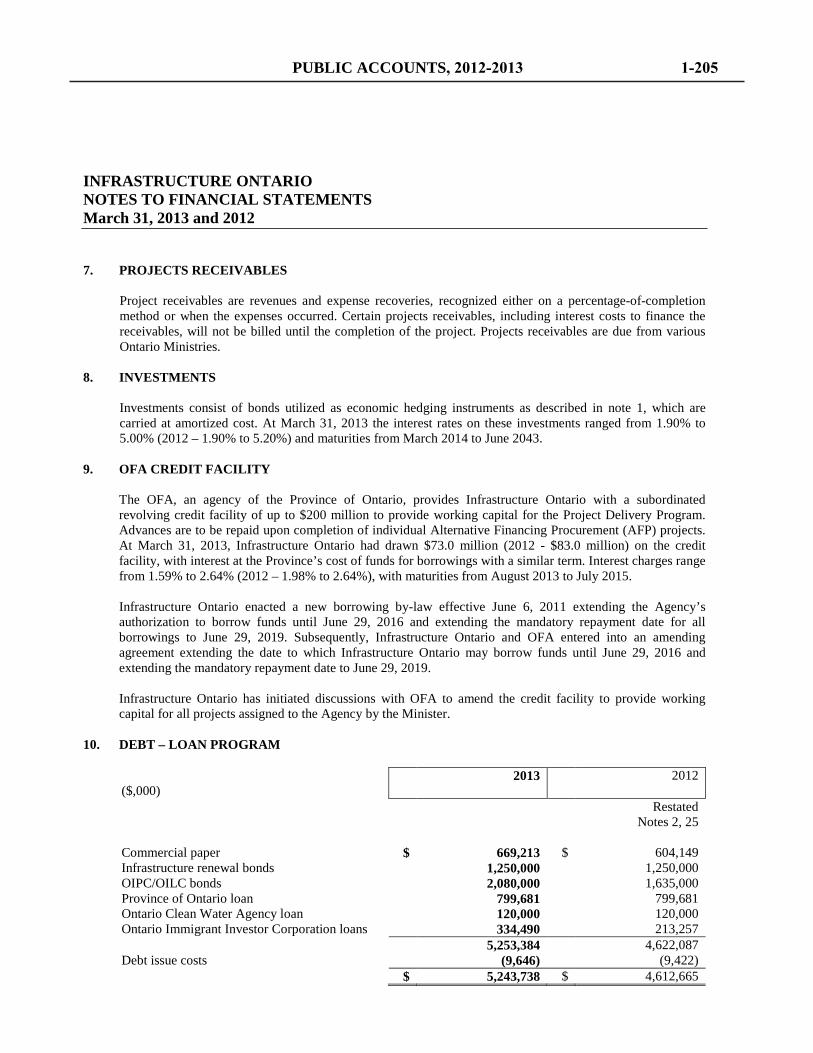
INFRASTRUCTURE ONTARIO NOTES TO FINANCIAL STATEMENTS March 31, 2013 and 2012
7. PROJECTS RECEIVABLES
Project receivables are revenues and expense recoveries, recognized either on a percentage-of-completion method or when the expenses occurred. Certain projects receivables, including interest costs to finance the receivables, will not be billed until the completion of the project. Projects receivables are due from various Ontario Ministries.
8. INVESTMENTS
Investments consist of bonds utilized as economic hedging instruments as described in note 1, which are carried at amortized cost. At March 31, 2013 the interest rates on these investments ranged from 1.90% to 5.00% (2012 – 1.90% to 5.20%) and maturities from March 2014 to June 2043.
9. OFA CREDIT FACILITY The OFA, an agency of the Province of Ontario, provides Infrastructure Ontario with a subordinated revolving credit facility of up to $200 million to provide working capital for the Project Delivery Program. Advances are to be repaid upon completion of individual Alternative Financing Procurement (AFP) projects. At March 31, 2013, Infrastructure Ontario had drawn $73.0 million (2012 - $83.0 million) on the credit facility, with interest at the Province’s cost of funds for borrowings with a similar term. Interest charges range from 1.59% to 2.64% (2012 – 1.98% to 2.64%), with maturities from August 2013 to July 2015. Infrastructure Ontario enacted a new borrowing by-law effective June 6, 2011 extending the Agency’s authorization to borrow funds until June 29, 2016 and extending the mandatory repayment date for all borrowings to June 29, 2019. Subsequently, Infrastructure Ontario and OFA entered into an amending agreement extending the date to which Infrastructure Ontario may borrow funds until June 29, 2016 and extending the mandatory repayment date to June 29, 2019. Infrastructure Ontario has initiated discussions with OFA to amend the credit facility to provide working capital for all projects assigned to the Agency by the Minister.
10. DEBT – LOAN PROGRAM
($,000) 2013
2012
Restated
Notes 2, 25 Commercial paper $ 669,213 $ 604,149 Infrastructure renewal bonds 1,250,000 1,250,000 OIPC/OILC bonds 2,080,000 1,635,000 Province of Ontario loan 799,681 799,681 Ontario Clean Water Agency loan 120,000 120,000 Ontario Immigrant Investor Corporation loans 334,490 213,257 5,253,384 4,622,087 Debt issue costs (9,646) (9,422) $ 5,243,738 $ 4,612,665
PUBLIC ACCOUNTS, 2012-2013 1-205
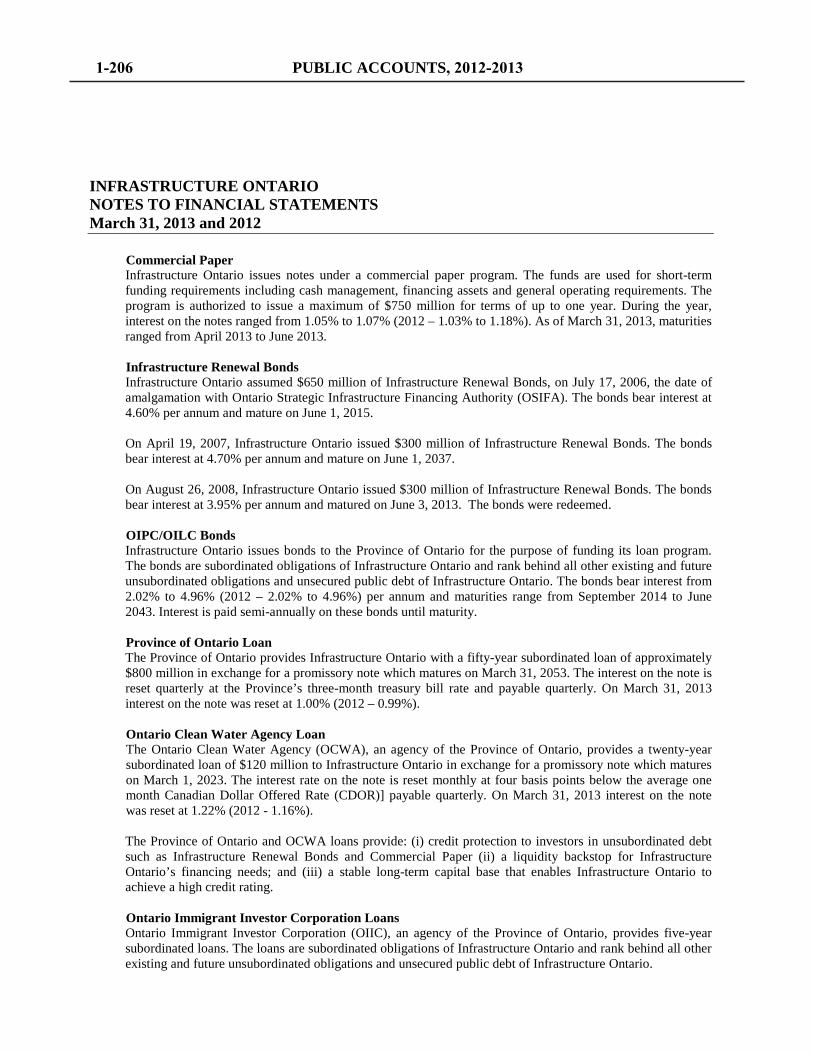
INFRASTRUCTURE ONTARIO NOTES TO FINANCIAL STATEMENTS March 31, 2013 and 2012
Commercial Paper Infrastructure Ontario issues notes under a commercial paper program. The funds are used for short-term funding requirements including cash management, financing assets and general operating requirements. The program is authorized to issue a maximum of $750 million for terms of up to one year. During the year, interest on the notes ranged from 1.05% to 1.07% (2012 – 1.03% to 1.18%). As of March 31, 2013, maturities ranged from April 2013 to June 2013. Infrastructure Renewal Bonds Infrastructure Ontario assumed $650 million of Infrastructure Renewal Bonds, on July 17, 2006, the date of amalgamation with Ontario Strategic Infrastructure Financing Authority (OSIFA). The bonds bear interest at 4.60% per annum and mature on June 1, 2015. On April 19, 2007, Infrastructure Ontario issued $300 million of Infrastructure Renewal Bonds. The bonds bear interest at 4.70% per annum and mature on June 1, 2037. On August 26, 2008, Infrastructure Ontario issued $300 million of Infrastructure Renewal Bonds. The bonds bear interest at 3.95% per annum and matured on June 3, 2013. The bonds were redeemed.
OIPC/OILC Bonds Infrastructure Ontario issues bonds to the Province of Ontario for the purpose of funding its loan program. The bonds are subordinated obligations of Infrastructure Ontario and rank behind all other existing and future unsubordinated obligations and unsecured public debt of Infrastructure Ontario. The bonds bear interest from 2.02% to 4.96% (2012 – 2.02% to 4.96%) per annum and maturities range from September 2014 to June 2043. Interest is paid semi-annually on these bonds until maturity. Province of Ontario Loan The Province of Ontario provides Infrastructure Ontario with a fifty-year subordinated loan of approximately $800 million in exchange for a promissory note which matures on March 31, 2053. The interest on the note is reset quarterly at the Province’s three-month treasury bill rate and payable quarterly. On March 31, 2013 interest on the note was reset at 1.00% (2012 – 0.99%). Ontario Clean Water Agency Loan The Ontario Clean Water Agency (OCWA), an agency of the Province of Ontario, provides a twenty-year subordinated loan of $120 million to Infrastructure Ontario in exchange for a promissory note which matures on March 1, 2023. The interest rate on the note is reset monthly at four basis points below the average one month Canadian Dollar Offered Rate (CDOR)] payable quarterly. On March 31, 2013 interest on the note was reset at 1.22% (2012 - 1.16%). The Province of Ontario and OCWA loans provide: (i) credit protection to investors in unsubordinated debt such as Infrastructure Renewal Bonds and Commercial Paper (ii) a liquidity backstop for Infrastructure Ontario’s financing needs; and (iii) a stable long-term capital base that enables Infrastructure Ontario to achieve a high credit rating. Ontario Immigrant Investor Corporation Loans Ontario Immigrant Investor Corporation (OIIC), an agency of the Province of Ontario, provides five-year subordinated loans. The loans are subordinated obligations of Infrastructure Ontario and rank behind all other existing and future unsubordinated obligations and unsecured public debt of Infrastructure Ontario.
1-206 PUBLIC ACCOUNTS, 2012-2013
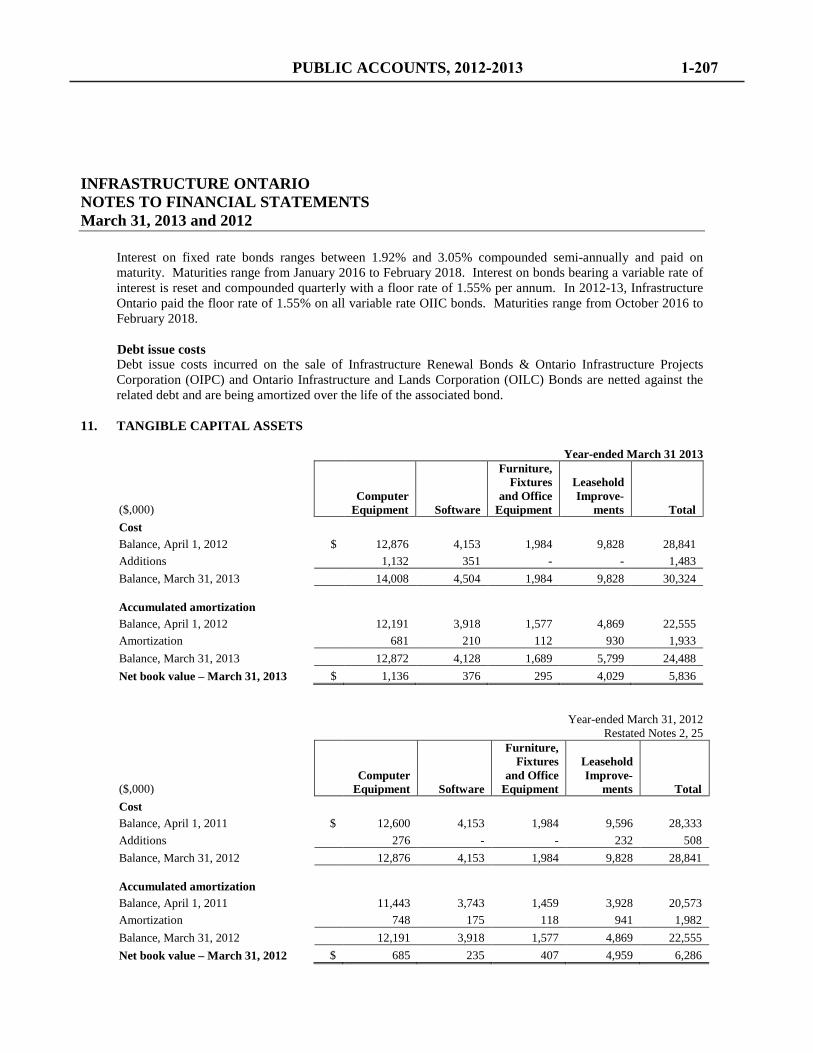
INFRASTRUCTURE ONTARIO NOTES TO FINANCIAL STATEMENTS March 31, 2013 and 2012
Interest on fixed rate bonds ranges between 1.92% and 3.05% compounded semi-annually and paid on maturity. Maturities range from January 2016 to February 2018. Interest on bonds bearing a variable rate of interest is reset and compounded quarterly with a floor rate of 1.55% per annum. In 2012-13, Infrastructure Ontario paid the floor rate of 1.55% on all variable rate OIIC bonds. Maturities range from October 2016 to February 2018. Debt issue costs Debt issue costs incurred on the sale of Infrastructure Renewal Bonds & Ontario Infrastructure Projects Corporation (OIPC) and Ontario Infrastructure and Lands Corporation (OILC) Bonds are netted against the related debt and are being amortized over the life of the associated bond.
11. TANGIBLE CAPITAL ASSETS
Year-ended March 31 2013
($,000)
Computer Equipment Software
Furniture, Fixtures
and Office Equipment
Leasehold Improve-
ments Total Cost Balance, April 1, 2012 $ 12,876 4,153 1,984 9,828 28,841 Additions 1,132 351 - - 1,483 Balance, March 31, 2013 14,008 4,504 1,984 9,828 30,324 Accumulated amortization Balance, April 1, 2012 12,191 3,918 1,577 4,869 22,555 Amortization 681 210 112 930 1,933 Balance, March 31, 2013 12,872 4,128 1,689 5,799 24,488 Net book value – March 31, 2013 $ 1,136 376 295 4,029 5,836
Year-ended March 31, 2012 Restated Notes 2, 25
($,000)
Computer Equipment Software
Furniture, Fixtures
and Office Equipment
Leasehold Improve-
ments Total Cost
Balance, April 1, 2011 $ 12,600 4,153 1,984 9,596 28,333 Additions 276 - - 232 508 Balance, March 31, 2012 12,876 4,153 1,984 9,828 28,841 Accumulated amortization Balance, April 1, 2011 11,443 3,743 1,459 3,928 20,573 Amortization 748 175 118 941 1,982 Balance, March 31, 2012 12,191 3,918 1,577 4,869 22,555 Net book value – March 31, 2012 $ 685 235 407 4,959 6,286
PUBLIC ACCOUNTS, 2012-2013 1-207
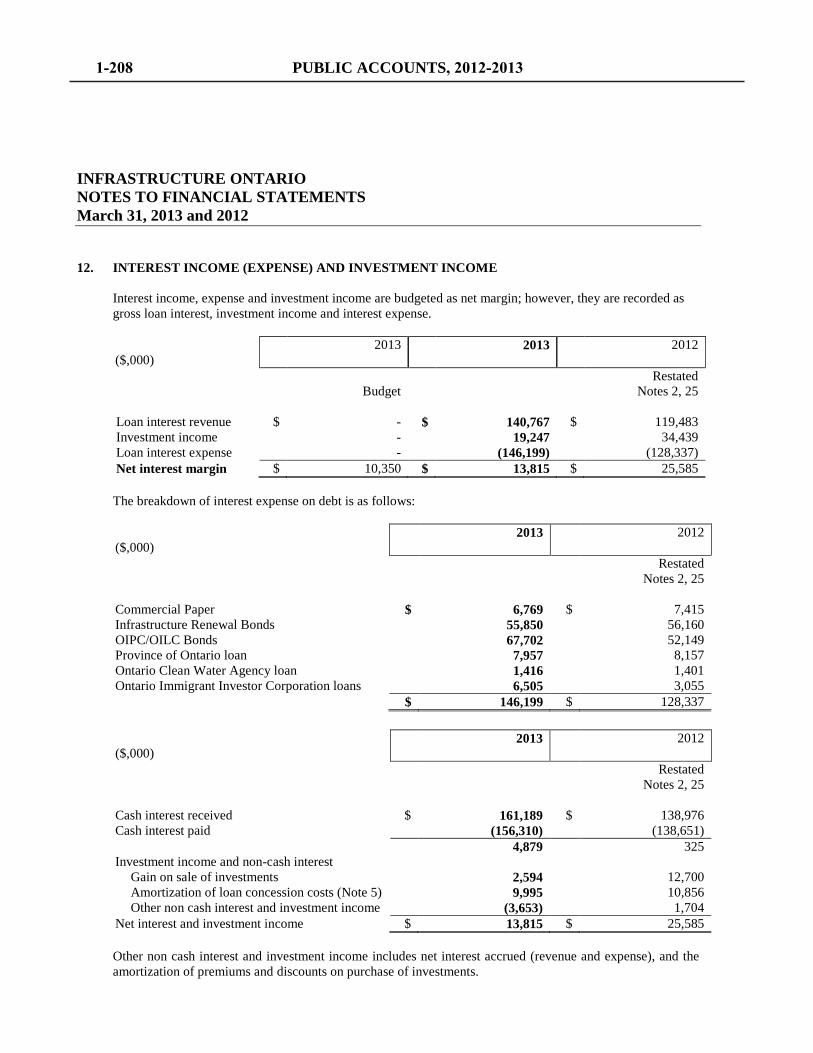
INFRASTRUCTURE ONTARIO NOTES TO FINANCIAL STATEMENTS March 31, 2013 and 2012 12. INTEREST INCOME (EXPENSE) AND INVESTMENT INCOME
Interest income, expense and investment income are budgeted as net margin; however, they are recorded as gross loan interest, investment income and interest expense.
($,000)
2013 2013 2012
Budget Restated
Notes 2, 25 Loan interest revenue $ - $ 140,767 $ 119,483 Investment income - 19,247 34,439 Loan interest expense - (146,199) (128,337) Net interest margin $ 10,350 $ 13,815 $ 25,585
The breakdown of interest expense on debt is as follows:
($,000)
2013 2012
Restated
Notes 2, 25 Commercial Paper $ 6,769 $ 7,415 Infrastructure Renewal Bonds 55,850 56,160 OIPC/OILC Bonds 67,702 52,149 Province of Ontario loan 7,957 8,157 Ontario Clean Water Agency loan 1,416 1,401 Ontario Immigrant Investor Corporation loans 6,505 3,055 $ 146,199 $ 128,337
($,000)
2013 2012
Restated
Notes 2, 25 Cash interest received $ 161,189 $ 138,976 Cash interest paid (156,310) (138,651) 4,879 325 Investment income and non-cash interest
Gain on sale of investments 2,594 12,700 Amortization of loan concession costs (Note 5) 9,995 10,856 Other non cash interest and investment income (3,653) 1,704
Net interest and investment income $ 13,815 $ 25,585
Other non cash interest and investment income includes net interest accrued (revenue and expense), and the amortization of premiums and discounts on purchase of investments.
1-208 PUBLIC ACCOUNTS, 2012-2013
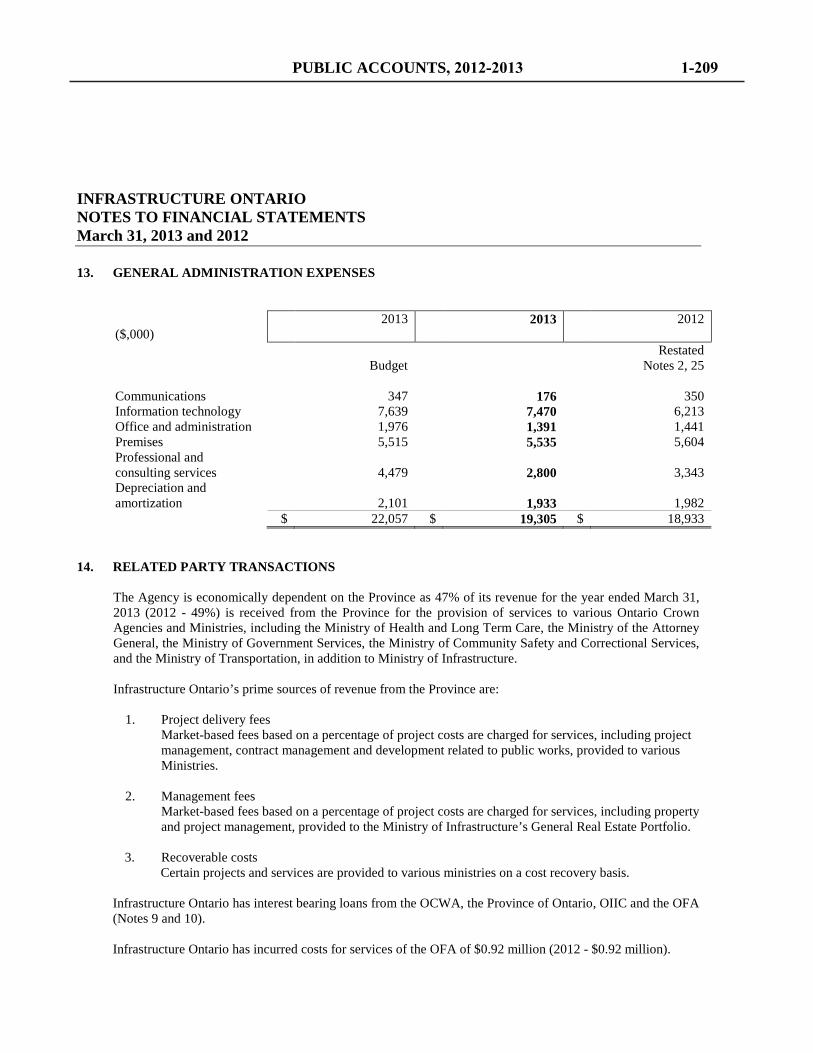
INFRASTRUCTURE ONTARIO NOTES TO FINANCIAL STATEMENTS March 31, 2013 and 2012 13. GENERAL ADMINISTRATION EXPENSES
($,000)
2013 2013 2012
Budget
Restated
Notes 2, 25 Communications 347 176 350 Information technology 7,639 7,470 6,213 Office and administration 1,976 1,391 1,441 Premises 5,515 5,535 5,604 Professional and consulting services
4,479 2,800 3,343
Depreciation and amortization
2,101 1,933 1,982
$ 22,057 $ 19,305 $ 18,933 14. RELATED PARTY TRANSACTIONS
The Agency is economically dependent on the Province as 47% of its revenue for the year ended March 31, 2013 (2012 - 49%) is received from the Province for the provision of services to various Ontario Crown Agencies and Ministries, including the Ministry of Health and Long Term Care, the Ministry of the Attorney General, the Ministry of Government Services, the Ministry of Community Safety and Correctional Services, and the Ministry of Transportation, in addition to Ministry of Infrastructure.
Infrastructure Ontario’s prime sources of revenue from the Province are:
1. Project delivery fees Market-based fees based on a percentage of project costs are charged for services, including project management, contract management and development related to public works, provided to various Ministries.
2. Management fees Market-based fees based on a percentage of project costs are charged for services, including property and project management, provided to the Ministry of Infrastructure’s General Real Estate Portfolio.
3. Recoverable costs
Certain projects and services are provided to various ministries on a cost recovery basis. Infrastructure Ontario has interest bearing loans from the OCWA, the Province of Ontario, OIIC and the OFA (Notes 9 and 10). Infrastructure Ontario has incurred costs for services of the OFA of $0.92 million (2012 - $0.92 million).
PUBLIC ACCOUNTS, 2012-2013 1-209
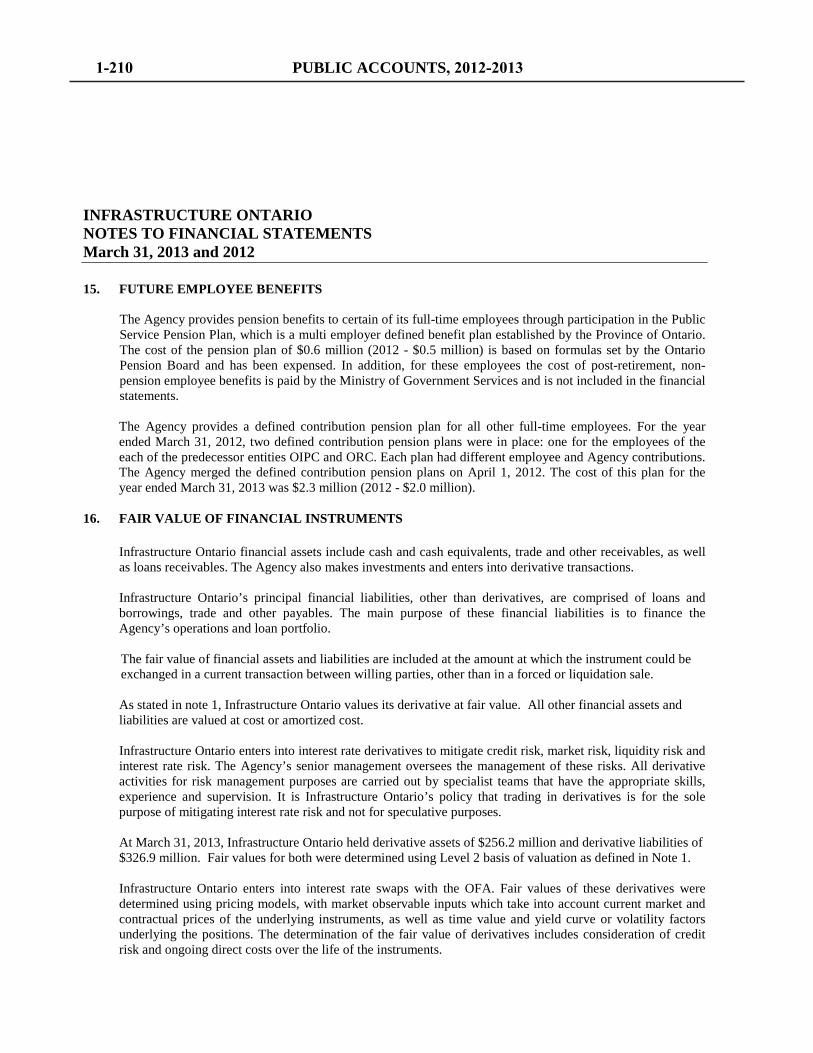
INFRASTRUCTURE ONTARIO NOTES TO FINANCIAL STATEMENTS March 31, 2013 and 2012 15. FUTURE EMPLOYEE BENEFITS
The Agency provides pension benefits to certain of its full-time employees through participation in the Public Service Pension Plan, which is a multi employer defined benefit plan established by the Province of Ontario. The cost of the pension plan of $0.6 million (2012 - $0.5 million) is based on formulas set by the Ontario Pension Board and has been expensed. In addition, for these employees the cost of post-retirement, non-pension employee benefits is paid by the Ministry of Government Services and is not included in the financial statements. The Agency provides a defined contribution pension plan for all other full-time employees. For the year ended March 31, 2012, two defined contribution pension plans were in place: one for the employees of the each of the predecessor entities OIPC and ORC. Each plan had different employee and Agency contributions. The Agency merged the defined contribution pension plans on April 1, 2012. The cost of this plan for the year ended March 31, 2013 was $2.3 million (2012 - $2.0 million).
16. FAIR VALUE OF FINANCIAL INSTRUMENTS
Infrastructure Ontario financial assets include cash and cash equivalents, trade and other receivables, as well as loans receivables. The Agency also makes investments and enters into derivative transactions. Infrastructure Ontario’s principal financial liabilities, other than derivatives, are comprised of loans and borrowings, trade and other payables. The main purpose of these financial liabilities is to finance the Agency’s operations and loan portfolio. The fair value of financial assets and liabilities are included at the amount at which the instrument could be exchanged in a current transaction between willing parties, other than in a forced or liquidation sale. As stated in note 1, Infrastructure Ontario values its derivative at fair value. All other financial assets and liabilities are valued at cost or amortized cost. Infrastructure Ontario enters into interest rate derivatives to mitigate credit risk, market risk, liquidity risk and interest rate risk. The Agency’s senior management oversees the management of these risks. All derivative activities for risk management purposes are carried out by specialist teams that have the appropriate skills, experience and supervision. It is Infrastructure Ontario’s policy that trading in derivatives is for the sole purpose of mitigating interest rate risk and not for speculative purposes. At March 31, 2013, Infrastructure Ontario held derivative assets of $256.2 million and derivative liabilities of $326.9 million. Fair values for both were determined using Level 2 basis of valuation as defined in Note 1. Infrastructure Ontario enters into interest rate swaps with the OFA. Fair values of these derivatives were determined using pricing models, with market observable inputs which take into account current market and contractual prices of the underlying instruments, as well as time value and yield curve or volatility factors underlying the positions. The determination of the fair value of derivatives includes consideration of credit risk and ongoing direct costs over the life of the instruments.
1-210 PUBLIC ACCOUNTS, 2012-2013
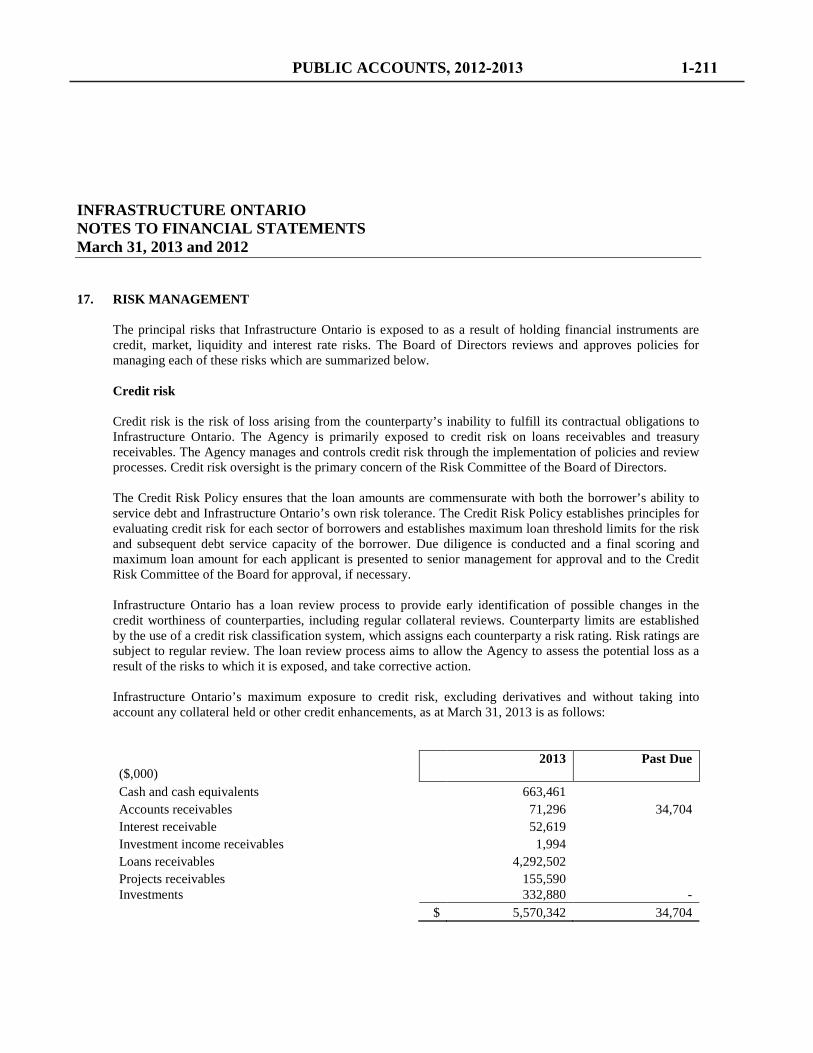
INFRASTRUCTURE ONTARIO NOTES TO FINANCIAL STATEMENTS March 31, 2013 and 2012
17. RISK MANAGEMENT
The principal risks that Infrastructure Ontario is exposed to as a result of holding financial instruments are credit, market, liquidity and interest rate risks. The Board of Directors reviews and approves policies for managing each of these risks which are summarized below.
Credit risk Credit risk is the risk of loss arising from the counterparty’s inability to fulfill its contractual obligations to Infrastructure Ontario. The Agency is primarily exposed to credit risk on loans receivables and treasury receivables. The Agency manages and controls credit risk through the implementation of policies and review processes. Credit risk oversight is the primary concern of the Risk Committee of the Board of Directors.
The Credit Risk Policy ensures that the loan amounts are commensurate with both the borrower’s ability to service debt and Infrastructure Ontario’s own risk tolerance. The Credit Risk Policy establishes principles for evaluating credit risk for each sector of borrowers and establishes maximum loan threshold limits for the risk and subsequent debt service capacity of the borrower. Due diligence is conducted and a final scoring and maximum loan amount for each applicant is presented to senior management for approval and to the Credit Risk Committee of the Board for approval, if necessary. Infrastructure Ontario has a loan review process to provide early identification of possible changes in the credit worthiness of counterparties, including regular collateral reviews. Counterparty limits are established by the use of a credit risk classification system, which assigns each counterparty a risk rating. Risk ratings are subject to regular review. The loan review process aims to allow the Agency to assess the potential loss as a result of the risks to which it is exposed, and take corrective action. Infrastructure Ontario’s maximum exposure to credit risk, excluding derivatives and without taking into account any collateral held or other credit enhancements, as at March 31, 2013 is as follows:
($,000)
2013 Past Due
Cash and cash equivalents 663,461 Accounts receivables 71,296 34,704 Interest receivable 52,619 Investment income receivables 1,994 Loans receivables 4,292,502 Projects receivables 155,590 Investments 332,880 -
$ 5,570,342 34,704
PUBLIC ACCOUNTS, 2012-2013 1-211
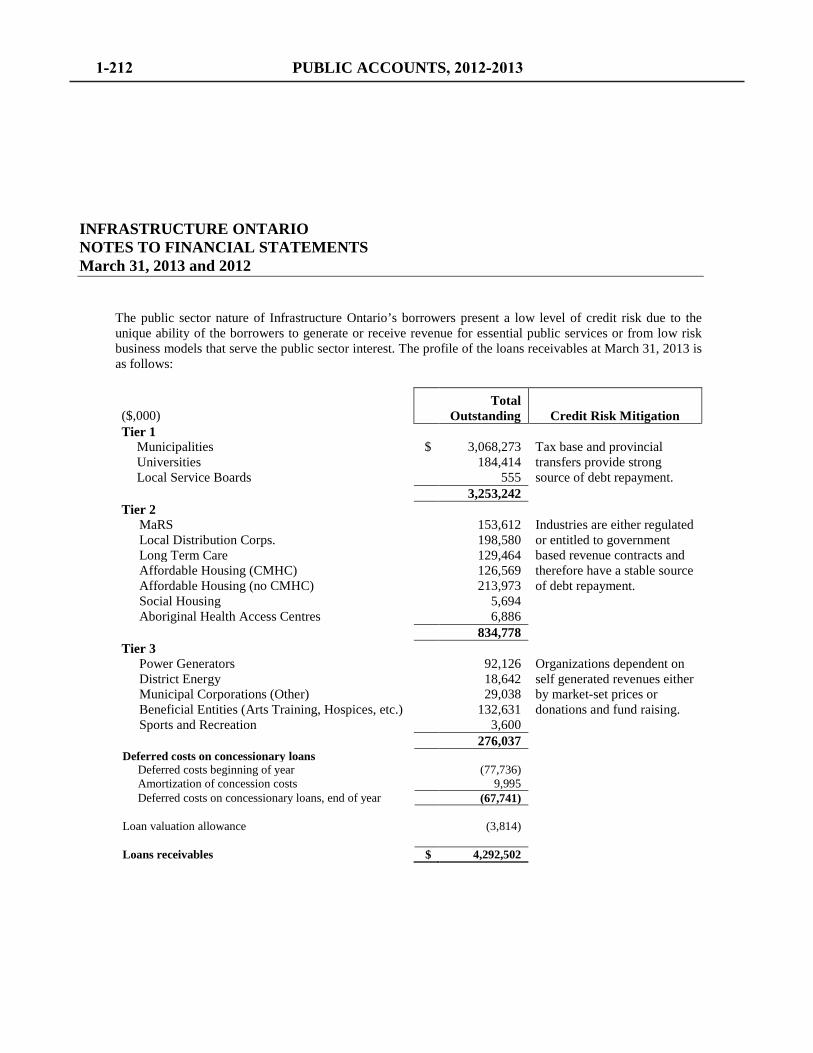
INFRASTRUCTURE ONTARIO NOTES TO FINANCIAL STATEMENTS March 31, 2013 and 2012
The public sector nature of Infrastructure Ontario’s borrowers present a low level of credit risk due to the unique ability of the borrowers to generate or receive revenue for essential public services or from low risk business models that serve the public sector interest. The profile of the loans receivables at March 31, 2013 is as follows:
($,000) Total
Outstanding Credit Risk Mitigation Tier 1
Municipalities $ 3,068,273 Tax base and provincial transfers provide strong source of debt repayment.
Universities 184,414 Local Service Boards 555
3,253,242
Tier 2
Industries are either regulated or entitled to government based revenue contracts and therefore have a stable source of debt repayment.
MaRS 153,612 Local Distribution Corps. 198,580 Long Term Care 129,464 Affordable Housing (CMHC) 126,569 Affordable Housing (no CMHC) 213,973 Social Housing 5,694 Aboriginal Health Access Centres 6,886
834,778
Tier 3 Organizations dependent on
self generated revenues either by market-set prices or donations and fund raising.
Power Generators 92,126 District Energy 18,642 Municipal Corporations (Other) 29,038 Beneficial Entities (Arts Training, Hospices, etc.) 132,631 Sports and Recreation 3,600
276,037
Deferred costs on concessionary loans Deferred costs beginning of year (77,736) Amortization of concession costs 9,995 Deferred costs on concessionary loans, end of year (67,741)
Loan valuation allowance (3,814) Loans receivables $ 4,292,502
1-212 PUBLIC ACCOUNTS, 2012-2013
INFRASTRUCTURE ONTARIO NOTES TO FINANCIAL STATEMENTS March 31, 2013 and 2012
Collateral Infrastructure Ontario lends on the strength of applicants’ ability to service loan payments over time. The Agency does not lend on a residual asset value basis and does not factor in possession or control of an asset in the evaluation of debt service coverage. It lends on the basis of a strong assurance of permanent sources of cash flow, namely the unique position of many borrowers to generate tax revenue or receive funding from the Province. Infrastructure Ontario mitigates its credit risk with the loan portfolio through various loan provisions. The Agency has an intercept mechanism with the Province which allows for funds owing to a borrower that receives funding from the Province to be redirected to Infrastructure Ontario. Clients that do not receive provincial funding are required to provide adequate guarantees, first ranking mortgage/charge, general security agreement, assignment of rents and leases and assignment of accounts and agreements and collateral. Impairment The loan portfolio valuation allowance is maintained at a level that Infrastructure Ontario considers adequate to absorb valuation adjustments and losses on loans. The valuation allowance is established against the loan portfolio where prudent assessment by Infrastructure Ontario of existing economic, industry and portfolio conditions indicate that valuation may be impaired or losses incurred. The valuation allowance is underpinned by a risk rating process in which risk ratings are assigned at the time of loan origination, monitored on an ongoing basis, and adjusted to reflect changes in underlying credit risk. A number of factors are considered when determining the appropriate level of the valuation allowance, including sensitivity to risk ratings, industry sectors, portfolio quality, business mix, and economic and credit market conditions. There are no assets impaired at March 31, 2013. Market risk Market risk is the risk that the fair value of a financial instrument will fluctuate due to changes in market prices. Market risk includes interest rate risk. The Agency has market risk on investments purchased as an economic hedge against borrowed funds that are surplus to immediate lending requirements. These investments are sold as required in order to fund loans. The short term nature of these investments mitigates this risk. Interest rate risk Interest rate risk is the risk that the fair value of future cash flows of a financial instrument will fluctuate because of changes in market interest rates. Interest rate risk arises when the re-pricing of assets is not aligned with the re-pricing of liabilities. For example, in its lending portfolio, if the Agency lends for a 20-year term (assets) and the debt that it issues to obtain the funds (liabilities) has a shorter term, it may have to issue the debt several times over the life of the asset. Each time the debt is rolled over or re-financed, there is a risk that interest rates will have risen, resulting in either lower net interest income or, if the Agency is lending at a rate below its borrowing cost, a greater net loss. Management controls interest rate risk through the natural alignment of asset and liability maturities and by employing interest rate swap derivatives. For instance, management has mitigated interest rate risk in its reserve fund by investing in investments with terms that match the loans from the Province and the OCWA. Infrastructure Ontario is exposed to interest rate fluctuations during the period between the issuance of long term debt and providing financing to public bodies. To manage this interest rate risk, Infrastructure Ontario invests in bonds with similar maturities to offset the interest rate risk until funds are loaned out.
PUBLIC ACCOUNTS, 2012-2013 1-213
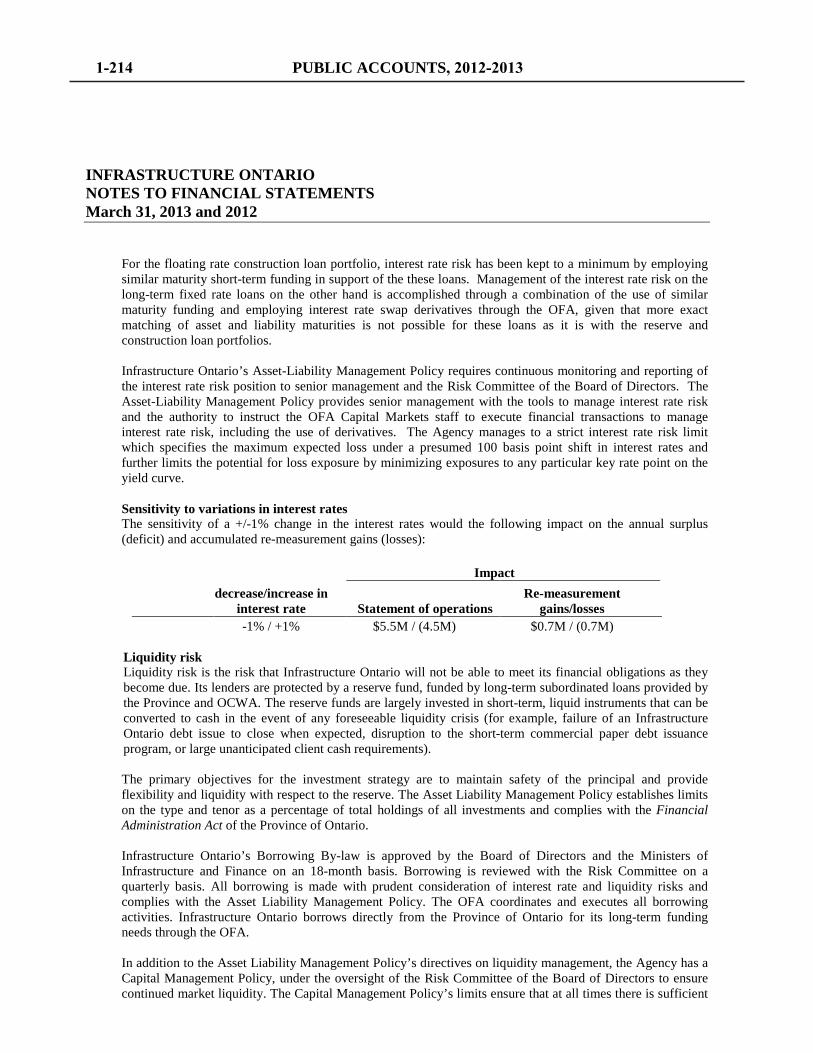
INFRASTRUCTURE ONTARIO NOTES TO FINANCIAL STATEMENTS March 31, 2013 and 2012
For the floating rate construction loan portfolio, interest rate risk has been kept to a minimum by employing similar maturity short-term funding in support of the these loans. Management of the interest rate risk on the long-term fixed rate loans on the other hand is accomplished through a combination of the use of similar maturity funding and employing interest rate swap derivatives through the OFA, given that more exact matching of asset and liability maturities is not possible for these loans as it is with the reserve and construction loan portfolios. Infrastructure Ontario’s Asset-Liability Management Policy requires continuous monitoring and reporting of the interest rate risk position to senior management and the Risk Committee of the Board of Directors. The Asset-Liability Management Policy provides senior management with the tools to manage interest rate risk and the authority to instruct the OFA Capital Markets staff to execute financial transactions to manage interest rate risk, including the use of derivatives. The Agency manages to a strict interest rate risk limit which specifies the maximum expected loss under a presumed 100 basis point shift in interest rates and further limits the potential for loss exposure by minimizing exposures to any particular key rate point on the yield curve. Sensitivity to variations in interest rates The sensitivity of a +/-1% change in the interest rates would the following impact on the annual surplus (deficit) and accumulated re-measurement gains (losses): Impact
decrease/increase in interest rate Statement of operations
Re-measurement gains/losses
-1% / +1% $5.5M / (4.5M) $0.7M / (0.7M)
Liquidity risk Liquidity risk is the risk that Infrastructure Ontario will not be able to meet its financial obligations as they become due. Its lenders are protected by a reserve fund, funded by long-term subordinated loans provided by the Province and OCWA. The reserve funds are largely invested in short-term, liquid instruments that can be converted to cash in the event of any foreseeable liquidity crisis (for example, failure of an Infrastructure Ontario debt issue to close when expected, disruption to the short-term commercial paper debt issuance program, or large unanticipated client cash requirements). The primary objectives for the investment strategy are to maintain safety of the principal and provide flexibility and liquidity with respect to the reserve. The Asset Liability Management Policy establishes limits on the type and tenor as a percentage of total holdings of all investments and complies with the Financial Administration Act of the Province of Ontario. Infrastructure Ontario’s Borrowing By-law is approved by the Board of Directors and the Ministers of Infrastructure and Finance on an 18-month basis. Borrowing is reviewed with the Risk Committee on a quarterly basis. All borrowing is made with prudent consideration of interest rate and liquidity risks and complies with the Asset Liability Management Policy. The OFA coordinates and executes all borrowing activities. Infrastructure Ontario borrows directly from the Province of Ontario for its long-term funding needs through the OFA. In addition to the Asset Liability Management Policy’s directives on liquidity management, the Agency has a Capital Management Policy, under the oversight of the Risk Committee of the Board of Directors to ensure continued market liquidity. The Capital Management Policy’s limits ensure that at all times there is sufficient
1-214 PUBLIC ACCOUNTS, 2012-2013
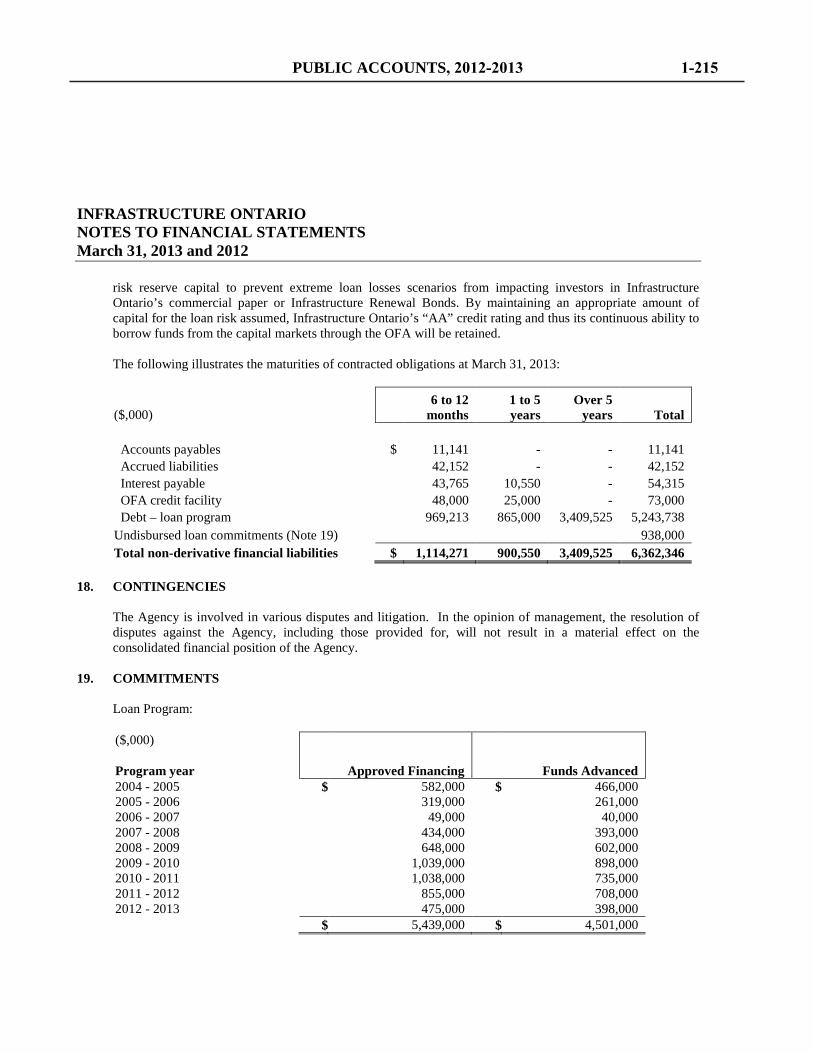
INFRASTRUCTURE ONTARIO NOTES TO FINANCIAL STATEMENTS March 31, 2013 and 2012
risk reserve capital to prevent extreme loan losses scenarios from impacting investors in Infrastructure Ontario’s commercial paper or Infrastructure Renewal Bonds. By maintaining an appropriate amount of capital for the loan risk assumed, Infrastructure Ontario’s “AA” credit rating and thus its continuous ability to borrow funds from the capital markets through the OFA will be retained.
The following illustrates the maturities of contracted obligations at March 31, 2013:
($,000) 6 to 12
months 1 to 5 years
Over 5 years Total
Accounts payables $ 11,141 - - 11,141 Accrued liabilities 42,152 - - 42,152 Interest payable 43,765 10,550 - 54,315 OFA credit facility 48,000 25,000 - 73,000 Debt – loan program 969,213 865,000 3,409,525 5,243,738 Undisbursed loan commitments (Note 19)
938,000
Total non-derivative financial liabilities $ 1,114,271 900,550 3,409,525 6,362,346 18. CONTINGENCIES
The Agency is involved in various disputes and litigation. In the opinion of management, the resolution of disputes against the Agency, including those provided for, will not result in a material effect on the consolidated financial position of the Agency.
19. COMMITMENTS
Loan Program: ($,000) Program year Approved Financing Funds Advanced 2004 - 2005 $ 582,000 $ 466,000 2005 - 2006 319,000 261,000 2006 - 2007 49,000 40,000 2007 - 2008 434,000 393,000 2008 - 2009 648,000 602,000 2009 - 2010 1,039,000 898,000 2010 - 2011 1,038,000 735,000 2011 - 2012 855,000 708,000 2012 - 2013 475,000 398,000 $ 5,439,000 $ 4,501,000
PUBLIC ACCOUNTS, 2012-2013 1-215
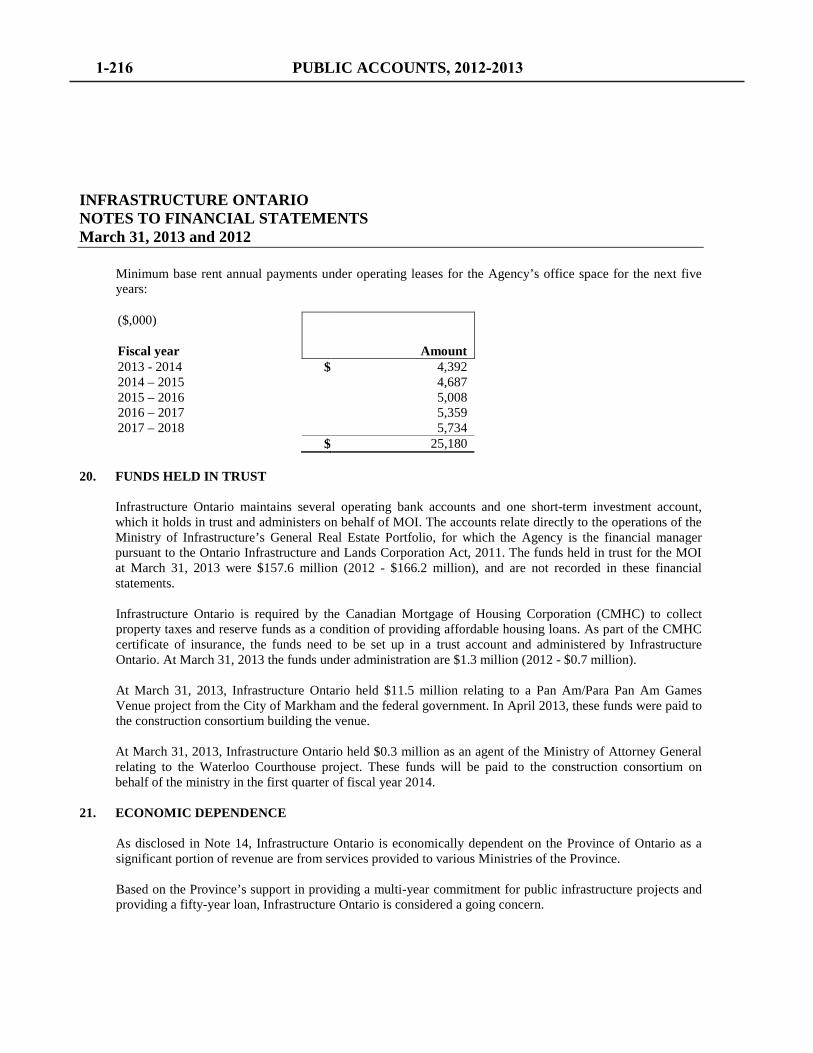
INFRASTRUCTURE ONTARIO NOTES TO FINANCIAL STATEMENTS March 31, 2013 and 2012
Minimum base rent annual payments under operating leases for the Agency’s office space for the next five years: ($,000) Fiscal year Amount 2013 - 2014 $ 4,392 2014 – 2015 4,687 2015 – 2016 5,008 2016 – 2017 5,359 2017 – 2018 5,734 $ 25,180
20. FUNDS HELD IN TRUST Infrastructure Ontario maintains several operating bank accounts and one short-term investment account, which it holds in trust and administers on behalf of MOI. The accounts relate directly to the operations of the Ministry of Infrastructure’s General Real Estate Portfolio, for which the Agency is the financial manager pursuant to the Ontario Infrastructure and Lands Corporation Act, 2011. The funds held in trust for the MOI at March 31, 2013 were $157.6 million (2012 - $166.2 million), and are not recorded in these financial statements. Infrastructure Ontario is required by the Canadian Mortgage of Housing Corporation (CMHC) to collect property taxes and reserve funds as a condition of providing affordable housing loans. As part of the CMHC certificate of insurance, the funds need to be set up in a trust account and administered by Infrastructure Ontario. At March 31, 2013 the funds under administration are $1.3 million (2012 - $0.7 million). At March 31, 2013, Infrastructure Ontario held $11.5 million relating to a Pan Am/Para Pan Am Games Venue project from the City of Markham and the federal government. In April 2013, these funds were paid to the construction consortium building the venue. At March 31, 2013, Infrastructure Ontario held $0.3 million as an agent of the Ministry of Attorney General relating to the Waterloo Courthouse project. These funds will be paid to the construction consortium on behalf of the ministry in the first quarter of fiscal year 2014.
21. ECONOMIC DEPENDENCE
As disclosed in Note 14, Infrastructure Ontario is economically dependent on the Province of Ontario as a significant portion of revenue are from services provided to various Ministries of the Province. Based on the Province’s support in providing a multi-year commitment for public infrastructure projects and providing a fifty-year loan, Infrastructure Ontario is considered a going concern.
1-216 PUBLIC ACCOUNTS, 2012-2013
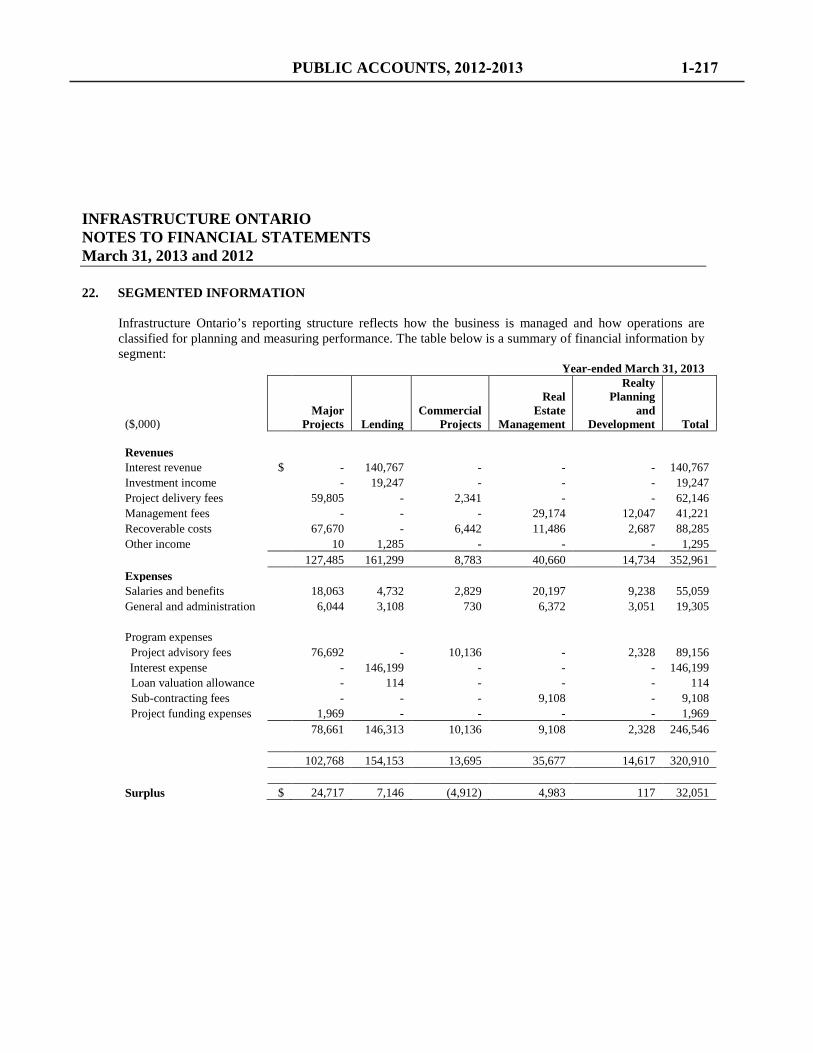
INFRASTRUCTURE ONTARIO NOTES TO FINANCIAL STATEMENTS March 31, 2013 and 2012 22. SEGMENTED INFORMATION
Infrastructure Ontario’s reporting structure reflects how the business is managed and how operations are classified for planning and measuring performance. The table below is a summary of financial information by segment: Year-ended March 31, 2013
($,000)
Major Projects Lending
Commercial Projects
Real Estate
Management
Realty Planning
and Development Total
Revenues Interest revenue $ - 140,767 - - - 140,767 Investment income - 19,247 - - - 19,247 Project delivery fees 59,805 - 2,341 - - 62,146 Management fees - - - 29,174 12,047 41,221 Recoverable costs 67,670 - 6,442 11,486 2,687 88,285 Other income 10 1,285 - - - 1,295 127,485 161,299 8,783 40,660 14,734 352,961 Expenses Salaries and benefits 18,063 4,732 2,829 20,197 9,238 55,059 General and administration 6,044 3,108 730 6,372 3,051 19,305 Program expenses Project advisory fees 76,692 - 10,136 - 2,328 89,156 Interest expense - 146,199 - - - 146,199
Loan valuation allowance - 114 - - - 114 Sub-contracting fees - - - 9,108 - 9,108 Project funding expenses 1,969 - - - - 1,969 78,661 146,313 10,136 9,108 2,328 246,546 102,768 154,153 13,695 35,677 14,617 320,910 Surplus $ 24,717 7,146 (4,912) 4,983 117 32,051
PUBLIC ACCOUNTS, 2012-2013 1-217
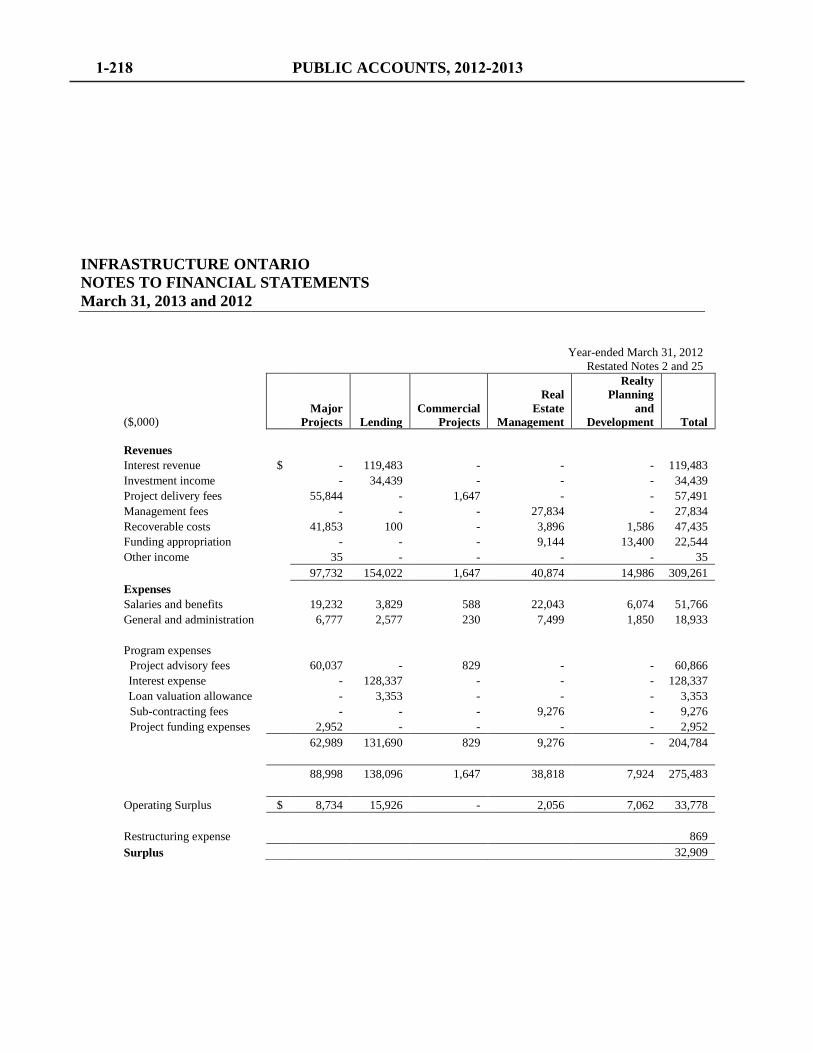
INFRASTRUCTURE ONTARIO NOTES TO FINANCIAL STATEMENTS March 31, 2013 and 2012
Year-ended March 31, 2012
Restated Notes 2 and 25
($,000)
Major Projects Lending
Commercial Projects
Real Estate
Management
Realty Planning
and Development Total
Revenues Interest revenue $ - 119,483 - - - 119,483 Investment income - 34,439 - - - 34,439 Project delivery fees 55,844 - 1,647 - - 57,491 Management fees - - - 27,834 - 27,834 Recoverable costs 41,853 100 - 3,896 1,586 47,435 Funding appropriation - - - 9,144 13,400 22,544 Other income 35 - - - - 35 97,732 154,022 1,647 40,874 14,986 309,261 Expenses Salaries and benefits 19,232 3,829 588 22,043 6,074 51,766 General and administration 6,777 2,577 230 7,499 1,850 18,933 Program expenses Project advisory fees 60,037 - 829 - - 60,866 Interest expense - 128,337 - - - 128,337 Loan valuation allowance - 3,353 - - - 3,353
Sub-contracting fees - - - 9,276 - 9,276 Project funding expenses 2,952 - - - - 2,952 62,989 131,690 829 9,276 - 204,784 88,998 138,096 1,647 38,818 7,924 275,483 Operating Surplus $ 8,734 15,926 - 2,056 7,062 33,778 Restructuring expense 869 Surplus 32,909
1-218 PUBLIC ACCOUNTS, 2012-2013
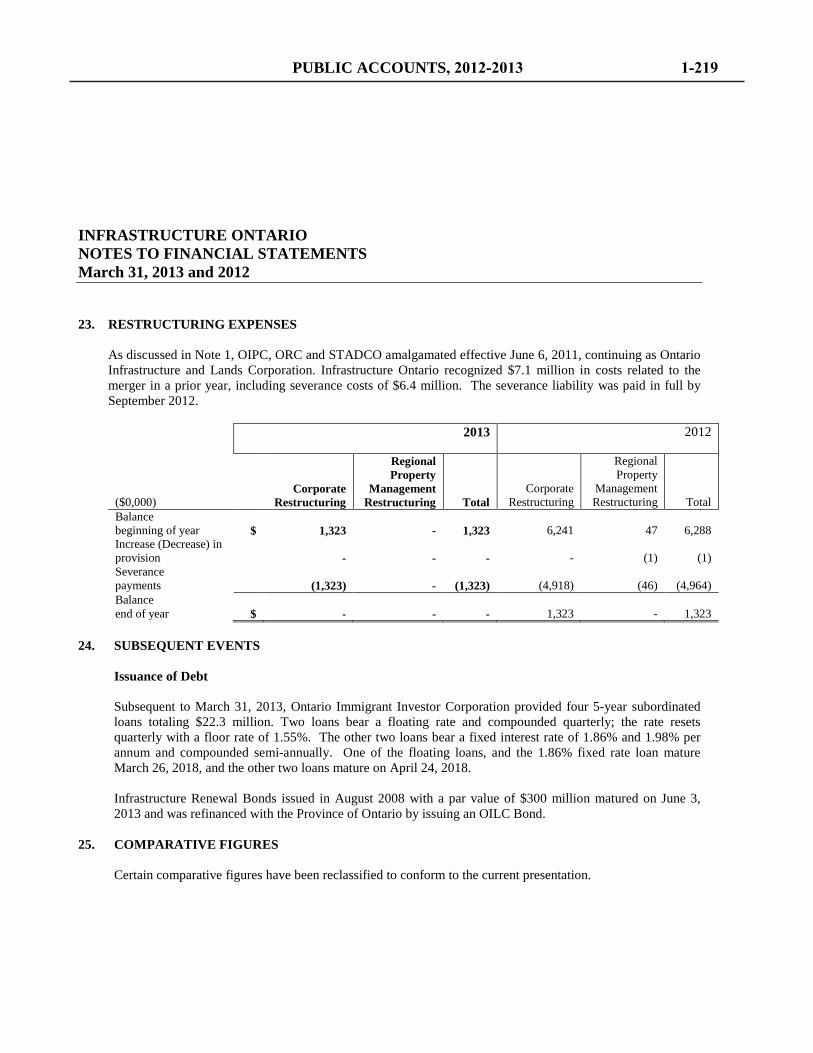
INFRASTRUCTURE ONTARIO NOTES TO FINANCIAL STATEMENTS March 31, 2013 and 2012 23. RESTRUCTURING EXPENSES
As discussed in Note 1, OIPC, ORC and STADCO amalgamated effective June 6, 2011, continuing as Ontario Infrastructure and Lands Corporation. Infrastructure Ontario recognized $7.1 million in costs related to the merger in a prior year, including severance costs of $6.4 million. The severance liability was paid in full by September 2012.
2013
2012
($0,000)
Corporate Restructuring
Regional Property
Management Restructuring Total
Corporate Restructuring
Regional Property
Management Restructuring Total
Balance beginning of year $ 1,323 -
1,323 6,241 47
6,288 Increase (Decrease) in provision - - - - (1) (1) Severance payments (1,323) -
(1,323) (4,918) (46) (4,964)
Balance end of year $ - -
- 1,323 -
1,323
24. SUBSEQUENT EVENTS
Issuance of Debt Subsequent to March 31, 2013, Ontario Immigrant Investor Corporation provided four 5-year subordinated loans totaling $22.3 million. Two loans bear a floating rate and compounded quarterly; the rate resets quarterly with a floor rate of 1.55%. The other two loans bear a fixed interest rate of 1.86% and 1.98% per annum and compounded semi-annually. One of the floating loans, and the 1.86% fixed rate loan mature March 26, 2018, and the other two loans mature on April 24, 2018. Infrastructure Renewal Bonds issued in August 2008 with a par value of $300 million matured on June 3, 2013 and was refinanced with the Province of Ontario by issuing an OILC Bond.
25. COMPARATIVE FIGURES
Certain comparative figures have been reclassified to conform to the current presentation.
PUBLIC ACCOUNTS, 2012-2013 1-219

Ministry of Ministère des Municipal Affairs Affaires municipales and Housing et du Logement Ontario Mortgage and Societe ontarienne Housing Corporation d’hypotheques et de logement 777 Bay Street, 2nd Floor 777, rue Bay, 2e étage Toronto ON M5G 2E5 Toronto ON M5G 2E5 Tel: (416) 585-6731 Tél: (416) 585-6731 Fax: (416) 585-7330 Télécopieur: (416) 585-7330
Management’s Responsibility For Financial Statements The accompanying financial statements of the Ontario Mortgage and Housing Corporation have been prepared in accordance with Canadian public sector accounting standards and are the responsibility of management. The preparation of financial statements necessarily involves the use of estimates based on management’s judgement, particularly when transactions affecting the current accounting period cannot be finalized with certainty until future periods. The financial statements have been properly prepared within reasonable limits of materiality and in light of information available up to June 27, 2013. Management maintains a system of internal controls designed to provide reasonable assurance that the assets are safeguarded and that reliable financial information is available on a timely basis. The system includes formal policies and procedures and an organizational structure that provides for appropriate delegation of authority and segregation of responsibilities. An internal audit function independently evaluates the effectiveness of these internal controls on a periodic basis and reports its findings to management and to the Board of Directors. The Board of Directors is responsible for ensuring that management fulfils its responsibilities for financial reporting and internal controls. The Board of Directors reviews and approves the financial statements. The financial statements have been audited by the Office of the Auditor General of Ontario. The Auditor General’s responsibility is to express an opinion on whether the financial statements are fairly presented in accordance with Canadian public sector accounting standards. The Independent Auditor’s Report, which appears on the following page, outlines the scope of the Auditor General’s examination and opinion. On behalf of Management:
Alison Coke Chief Executive Officer
PUBLIC ACCOUNTS, 2012-2013 1-221
Independent Auditor’s Report
To the Ontario Mortgage and Housing Corporation and to the Minister of Municipal Affairs and Housing
I have audited the accompanying financial statements of the Ontario Mortgage and Housing Corporation, which comprise the statement of financial position as at March 31, 2013, and the statements of operations and accumulated deficit, and cash flows for the year then ended, and a summary of significant accounting policies and other explanatory information.
Management’s Responsibility for the Financial Statements
Management is responsible for the preparation and fair presentation of these financial statements in accordance with Canadian public sector accounting standards, and for such internal control as management determines is necessary to enable the preparation of financial statements that are free from material misstatement, whether due to fraud or error.
Auditor’s Responsibility
My responsibility is to express an opinion on these financial statements based on my audit. I conducted my audit in accordance with Canadian generally accepted auditing standards. Those standards require that I comply with ethical requirements and plan and perform the audit to obtain reasonable assurance about whether the financial statements are free from material misstatement.
An audit involves performing procedures to obtain audit evidence about the amounts and disclosures in the financial statements. The procedures selected depend on the auditor’s judgment, including the assessment of the risks of material misstatement of the financial statements, whether due to fraud or error. In making those risk assessments, the auditor considers internal control relevant to the entity’s preparation and fair presentation of the financial statements in order to design audit procedures that are appropriate in the circumstances, but not for the purpose of expressing an opinion on the effectiveness of the entity’s internal control. An audit also includes evaluating the appropriateness of accounting policies used and the reasonableness of accounting estimates made by management, as well as evaluating the overall presentation of the financial statements.
I believe that the audit evidence I have obtained is sufficient and appropriate to provide a basis for my audit opinion.
Opinion
In my opinion, the financial statements present fairly, in all material respects, the financial position of Ontario Mortgage and Housing Corporation as at March 31, 2013 and the results of its operations and accumulated deficit, and its cash flows for the year then ended in accordance with Canadian public sector accounting standards.
Future of the Corporation
While not impacting my opinion, I draw attention to Note 13, which describes the planned merger with the Ontario Mortgage Corporation.
Toronto, Ontario Susan Klein, CPA, CA, LPA June 27, 2013 Acting Deputy Auditor General
1-222 PUBLIC ACCOUNTS, 2012-2013
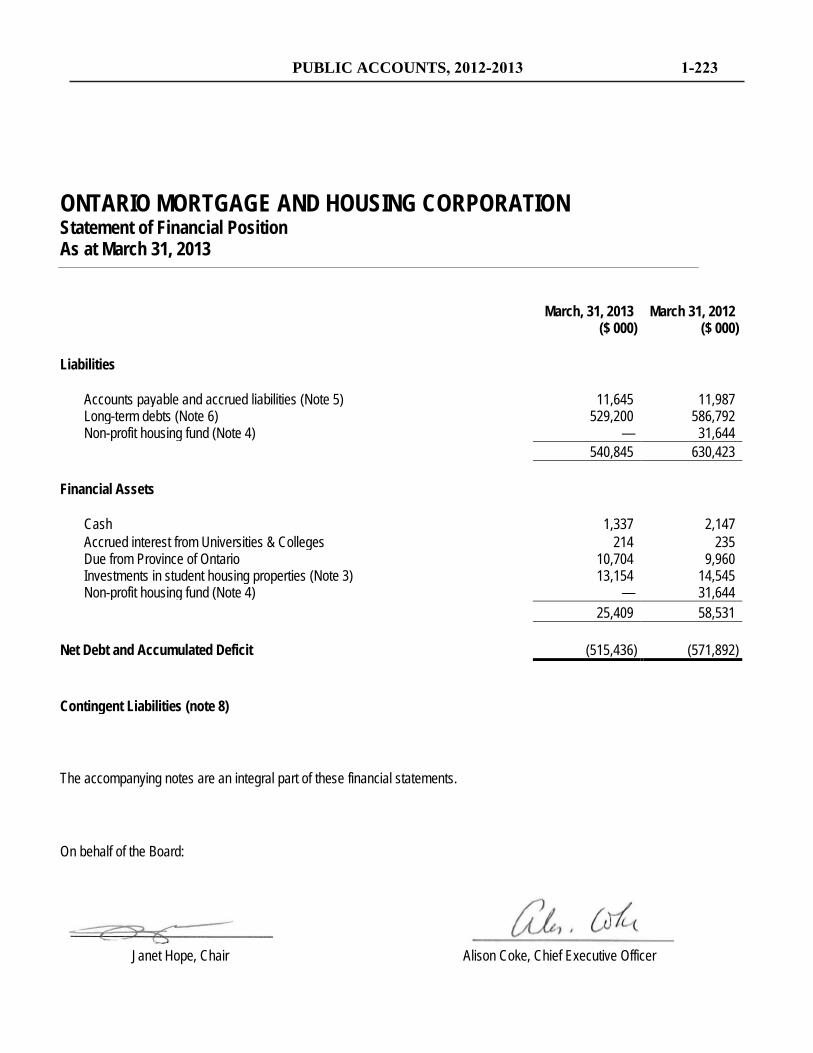
ONTARIO MORTGAGE AND HOUSING CORPORATION Statement of Financial Position As at March 31, 2013
March, 31, 2013
($ 000) March 31, 2012
($ 000) Liabilities
Accounts payable and accrued liabilities (Note 5) 11,645 11,987 Long-term debts (Note 6) 529,200 586,792 Non-profit housing fund (Note 4) — 31,644
540,845 630,423 Financial Assets
Cash 1,337 2,147 Accrued interest from Universities & Colleges 214 235 Due from Province of Ontario 10,704 9,960 Investments in student housing properties (Note 3) 13,154 14,545 Non-profit housing fund (Note 4) — 31,644 25,409 58,531
Net Debt and Accumulated Deficit (515,436) (571,892)
Contingent Liabilities (note 8) The accompanying notes are an integral part of these financial statements. On behalf of the Board:
Janet Hope, Chair Alison Coke, Chief Executive Officer
PUBLIC ACCOUNTS, 2012-2013 1-223
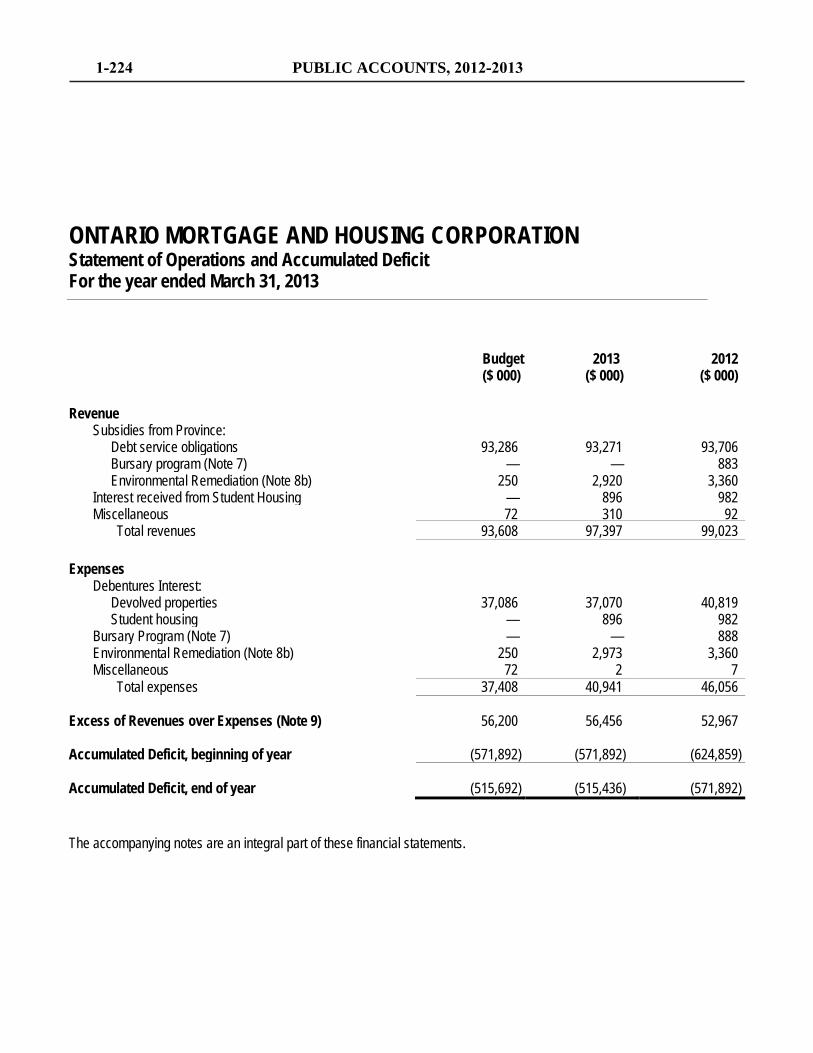
ONTARIO MORTGAGE AND HOUSING CORPORATION Statement of Operations and Accumulated Deficit For the year ended March 31, 2013
Budget ($ 000)
2013 ($ 000)
2012 ($ 000)
Revenue
Subsidies from Province: Debt service obligations 93,286 93,271 93,706 Bursary program (Note 7) — — 883 Environmental Remediation (Note 8b) 250 2,920 3,360 Interest received from Student Housing — 896 982 Miscellaneous 72 310 92
Total revenues 93,608 97,397 99,023 Expenses
Debentures Interest: Devolved properties 37,086 37,070 40,819 Student housing — 896 982 Bursary Program (Note 7) — — 888 Environmental Remediation (Note 8b) 250 2,973 3,360 Miscellaneous 72 2 7
Total expenses 37,408 40,941 46,056 Excess of Revenues over Expenses (Note 9) 56,200 56,456 52,967 Accumulated Deficit, beginning of year (571,892) (571,892) (624,859) Accumulated Deficit, end of year (515,692) (515,436) (571,892) The accompanying notes are an integral part of these financial statements.
1-224 PUBLIC ACCOUNTS, 2012-2013
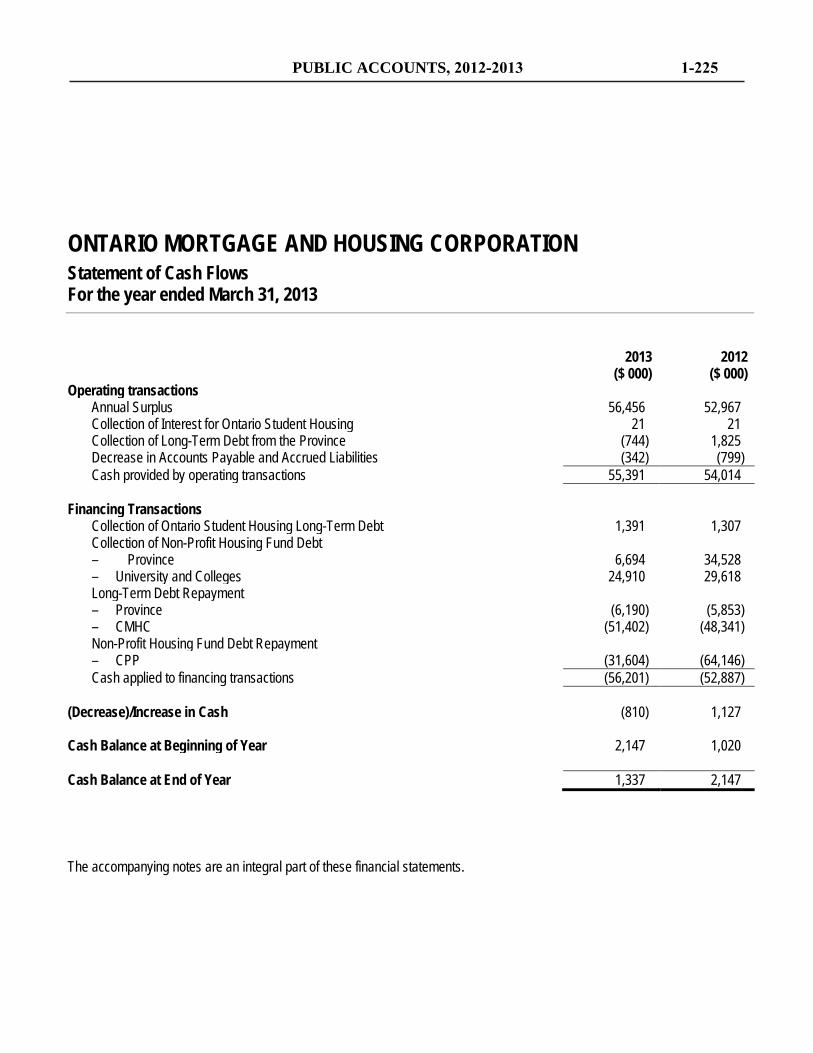
ONTARIO MORTGAGE AND HOUSING CORPORATION Statement of Cash Flows For the year ended March 31, 2013
2013 2012 ($ 000) ($ 000) Operating transactions
Annual Surplus 56,456 52,967 Collection of Interest for Ontario Student Housing 21 21 Collection of Long-Term Debt from the Province (744) 1,825 Decrease in Accounts Payable and Accrued Liabilities (342) (799) Cash provided by operating transactions 55,391 54,014
Financing Transactions Collection of Ontario Student Housing Long-Term Debt 1,391 1,307 Collection of Non-Profit Housing Fund Debt – Province 6,694 34,528 – University and Colleges 24,910 29,618 Long-Term Debt Repayment – Province (6,190) (5,853) – CMHC (51,402) (48,341) Non-Profit Housing Fund Debt Repayment – CPP (31,604) (64,146) Cash applied to financing transactions (56,201) (52,887)
(Decrease)/Increase in Cash (810) 1,127 Cash Balance at Beginning of Year 2,147 1,020
Cash Balance at End of Year 1,337 2,147 The accompanying notes are an integral part of these financial statements.
PUBLIC ACCOUNTS, 2012-2013 1-225
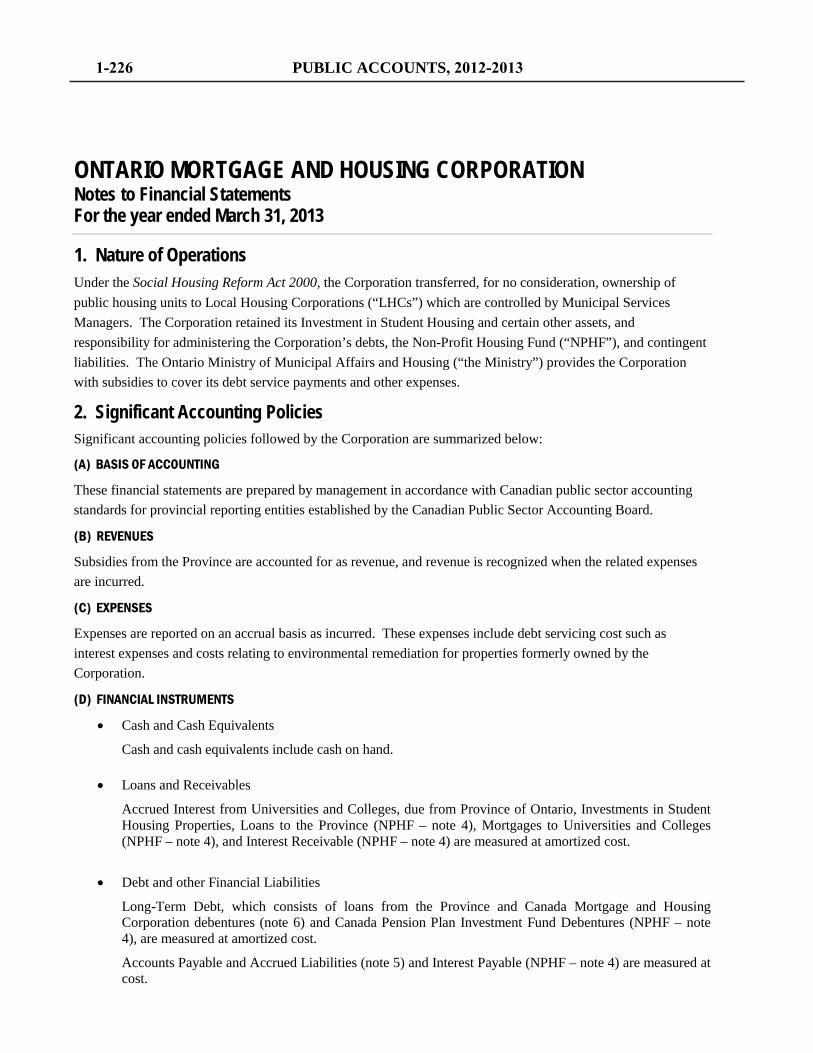
ONTARIO MORTGAGE AND HOUSING CORPORATION Notes to Financial Statements For the year ended March 31, 2013
1. Nature of Operations Under the Social Housing Reform Act 2000, the Corporation transferred, for no consideration, ownership of public housing units to Local Housing Corporations (“LHCs”) which are controlled by Municipal Services Managers. The Corporation retained its Investment in Student Housing and certain other assets, and responsibility for administering the Corporation’s debts, the Non-Profit Housing Fund (“NPHF”), and contingent liabilities. The Ontario Ministry of Municipal Affairs and Housing (“the Ministry”) provides the Corporation with subsidies to cover its debt service payments and other expenses.
2. Significant Accounting Policies Significant accounting policies followed by the Corporation are summarized below:
(A) BASIS OF ACCOUNTING
These financial statements are prepared by management in accordance with Canadian public sector accounting standards for provincial reporting entities established by the Canadian Public Sector Accounting Board.
(B) REVENUES
Subsidies from the Province are accounted for as revenue, and revenue is recognized when the related expenses are incurred.
(C) EXPENSES
Expenses are reported on an accrual basis as incurred. These expenses include debt servicing cost such as interest expenses and costs relating to environmental remediation for properties formerly owned by the Corporation.
(D) FINANCIAL INSTRUMENTS
• Cash and Cash Equivalents
Cash and cash equivalents include cash on hand.
• Loans and Receivables
Accrued Interest from Universities and Colleges, due from Province of Ontario, Investments in Student Housing Properties, Loans to the Province (NPHF – note 4), Mortgages to Universities and Colleges (NPHF – note 4), and Interest Receivable (NPHF – note 4) are measured at amortized cost.
• Debt and other Financial Liabilities
Long-Term Debt, which consists of loans from the Province and Canada Mortgage and Housing Corporation debentures (note 6) and Canada Pension Plan Investment Fund Debentures (NPHF – note 4), are measured at amortized cost.
Accounts Payable and Accrued Liabilities (note 5) and Interest Payable (NPHF – note 4) are measured at cost.
1-226 PUBLIC ACCOUNTS, 2012-2013
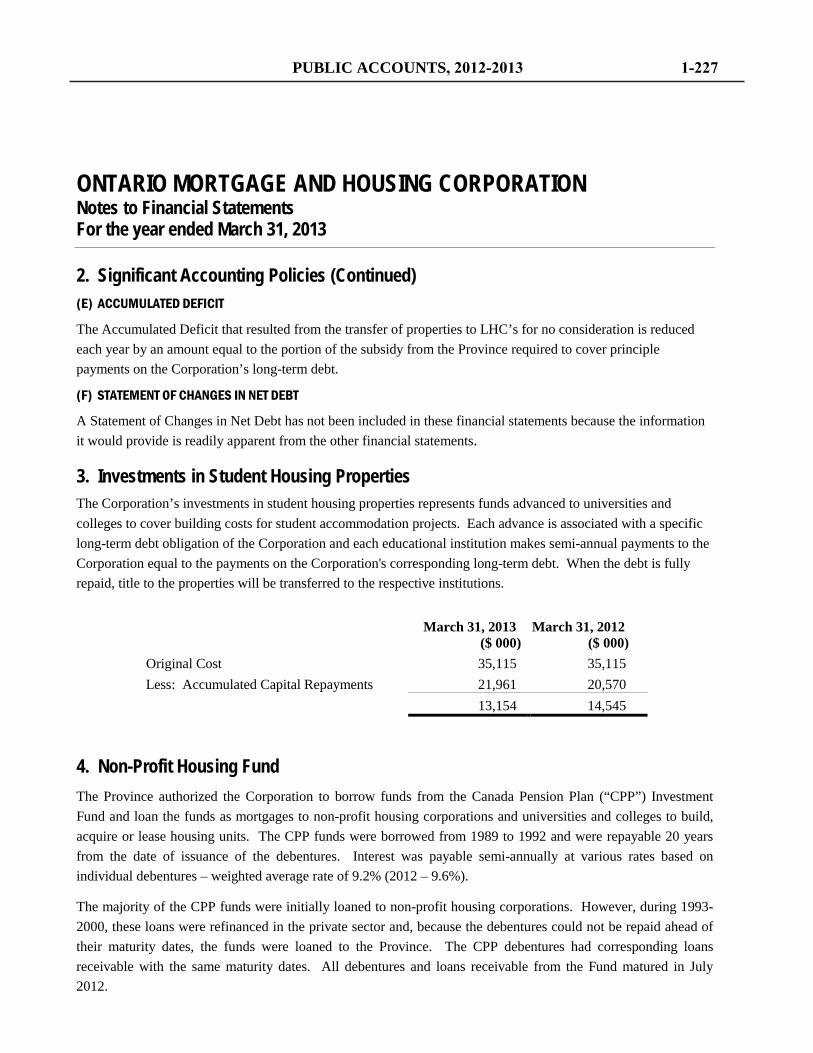
ONTARIO MORTGAGE AND HOUSING CORPORATION Notes to Financial Statements For the year ended March 31, 2013
2. Significant Accounting Policies (Continued) (E) ACCUMULATED DEFICIT
The Accumulated Deficit that resulted from the transfer of properties to LHC’s for no consideration is reduced each year by an amount equal to the portion of the subsidy from the Province required to cover principle payments on the Corporation’s long-term debt.
(F) STATEMENT OF CHANGES IN NET DEBT
A Statement of Changes in Net Debt has not been included in these financial statements because the information it would provide is readily apparent from the other financial statements.
3. Investments in Student Housing Properties The Corporation’s investments in student housing properties represents funds advanced to universities and colleges to cover building costs for student accommodation projects. Each advance is associated with a specific long-term debt obligation of the Corporation and each educational institution makes semi-annual payments to the Corporation equal to the payments on the Corporation's corresponding long-term debt. When the debt is fully repaid, title to the properties will be transferred to the respective institutions.
March 31, 2013 March 31, 2012 ($ 000) ($ 000) Original Cost 35,115 35,115 Less: Accumulated Capital Repayments 21,961 20,570 13,154 14,545
4. Non-Profit Housing Fund The Province authorized the Corporation to borrow funds from the Canada Pension Plan (“CPP”) Investment Fund and loan the funds as mortgages to non-profit housing corporations and universities and colleges to build, acquire or lease housing units. The CPP funds were borrowed from 1989 to 1992 and were repayable 20 years from the date of issuance of the debentures. Interest was payable semi-annually at various rates based on individual debentures – weighted average rate of 9.2% (2012 – 9.6%).
The majority of the CPP funds were initially loaned to non-profit housing corporations. However, during 1993-2000, these loans were refinanced in the private sector and, because the debentures could not be repaid ahead of their maturity dates, the funds were loaned to the Province. The CPP debentures had corresponding loans receivable with the same maturity dates. All debentures and loans receivable from the Fund matured in July 2012.
PUBLIC ACCOUNTS, 2012-2013 1-227
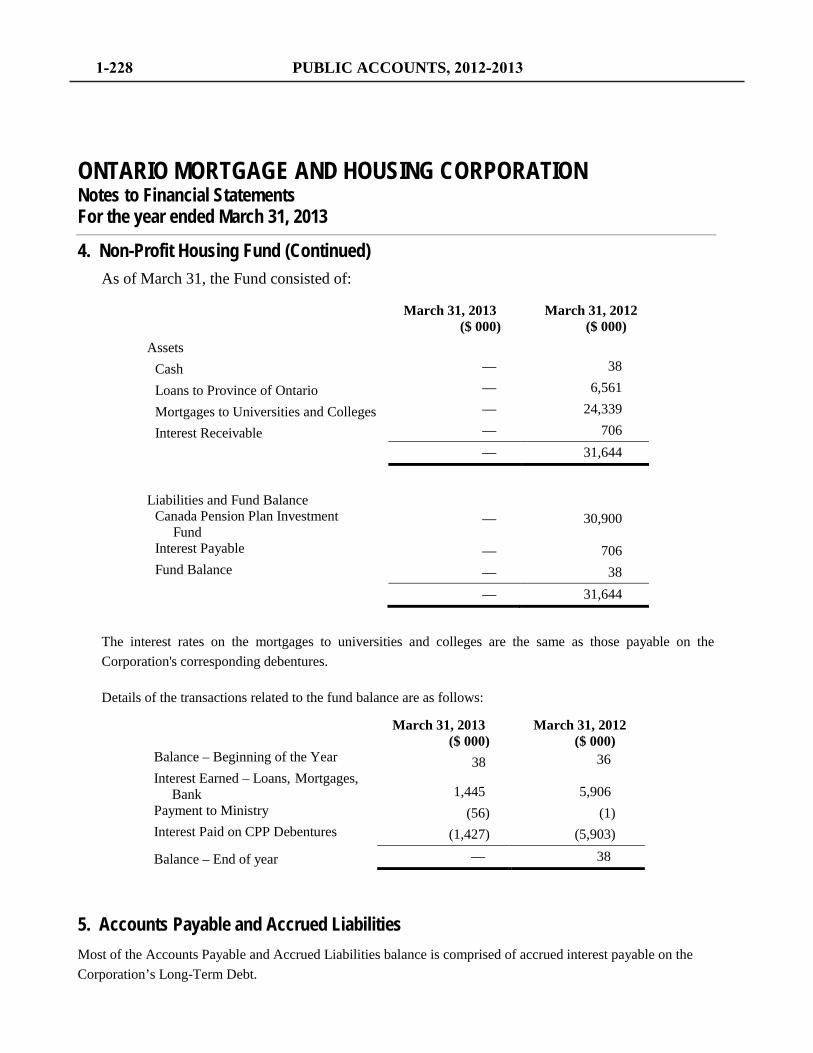
ONTARIO MORTGAGE AND HOUSING CORPORATION Notes to Financial Statements For the year ended March 31, 2013
4. Non-Profit Housing Fund (Continued) As of March 31, the Fund consisted of:
March 31, 2013 March 31, 2012 ($ 000) ($ 000) Assets
Cash — 38
Loans to Province of Ontario — 6,561
Mortgages to Universities and Colleges — 24,339
Interest Receivable — 706
— 31,644
Liabilities and Fund Balance
Canada Pension Plan Investment Fund
— 30,900
Interest Payable — 706 Fund Balance — 38
— 31,644
The interest rates on the mortgages to universities and colleges are the same as those payable on the Corporation's corresponding debentures.
Details of the transactions related to the fund balance are as follows:
March 31, 2013 March 31, 2012 ($ 000) ($ 000) Balance – Beginning of the Year 38 36 Interest Earned – Loans, Mortgages, Bank 1,445 5,906 Payment to Ministry (56) (1) Interest Paid on CPP Debentures (1,427) (5,903)
Balance – End of year — 38
5. Accounts Payable and Accrued Liabilities Most of the Accounts Payable and Accrued Liabilities balance is comprised of accrued interest payable on the Corporation’s Long-Term Debt.
1-228 PUBLIC ACCOUNTS, 2012-2013
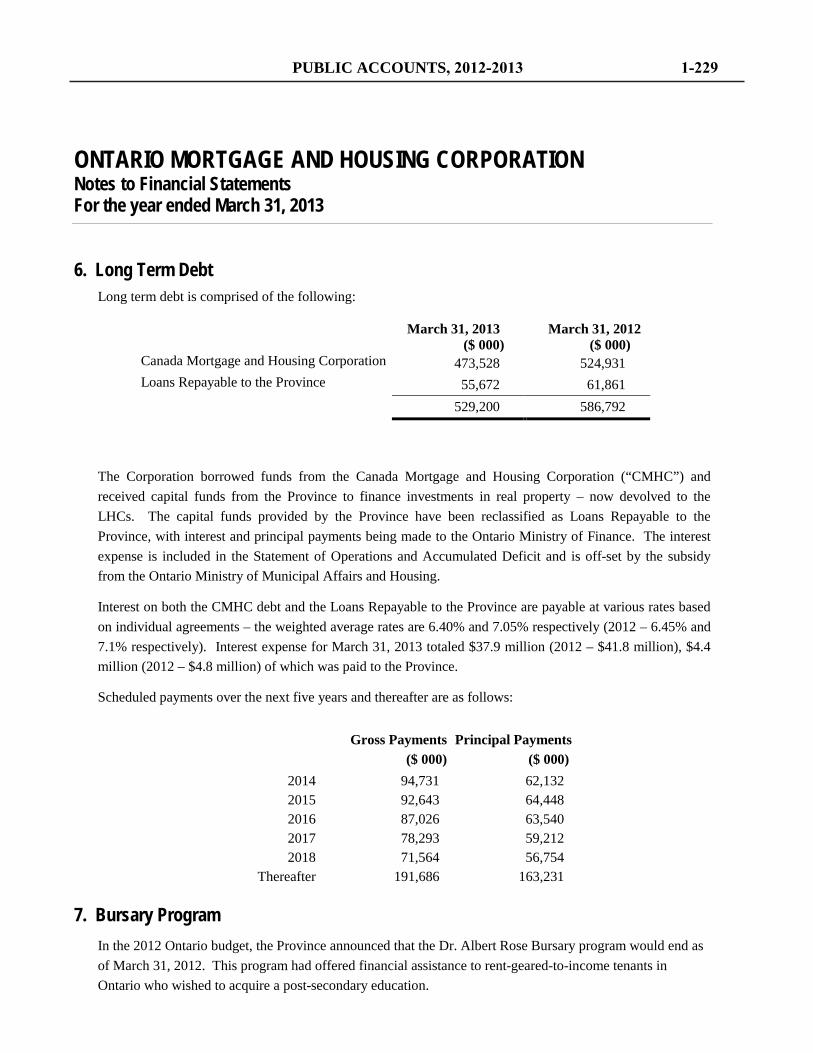
ONTARIO MORTGAGE AND HOUSING CORPORATION Notes to Financial Statements For the year ended March 31, 2013
6. Long Term Debt
Long term debt is comprised of the following:
March 31, 2013 March 31, 2012 ($ 000) ($ 000) Canada Mortgage and Housing Corporation 473,528 524,931 Loans Repayable to the Province 55,672 61,861
529,200 586,792
The Corporation borrowed funds from the Canada Mortgage and Housing Corporation (“CMHC”) and received capital funds from the Province to finance investments in real property – now devolved to the LHCs. The capital funds provided by the Province have been reclassified as Loans Repayable to the Province, with interest and principal payments being made to the Ontario Ministry of Finance. The interest expense is included in the Statement of Operations and Accumulated Deficit and is off-set by the subsidy from the Ontario Ministry of Municipal Affairs and Housing.
Interest on both the CMHC debt and the Loans Repayable to the Province are payable at various rates based on individual agreements – the weighted average rates are 6.40% and 7.05% respectively (2012 – 6.45% and 7.1% respectively). Interest expense for March 31, 2013 totaled $37.9 million (2012 – $41.8 million), $4.4 million (2012 – $4.8 million) of which was paid to the Province.
Scheduled payments over the next five years and thereafter are as follows:
Gross Payments Principal Payments ($ 000) ($ 000)
2014 94,731 62,132 2015 92,643 64,448 2016 87,026 63,540 2017 78,293 59,212 2018 71,564 56,754
Thereafter 191,686 163,231
7. Bursary Program In the 2012 Ontario budget, the Province announced that the Dr. Albert Rose Bursary program would end as of March 31, 2012. This program had offered financial assistance to rent-geared-to-income tenants in Ontario who wished to acquire a post-secondary education.
PUBLIC ACCOUNTS, 2012-2013 1-229

ONTARIO MORTGAGE AND HOUSING CORPORATION Notes to Financial Statements For the year ended March 31, 2013
8. Contingent Liabilities (A) GUARANTEED DEBT
The Corporation previously entered into loan insurance agreements with CMHC pertaining to mortgage loans on projects funded under various provincially-funded non-profit housing programs administered by the Ministry. Under these agreements, CMHC has insured mortgage loans made by lenders approved under the National Housing Act for the purpose of purchasing, improving, constructing or altering housing units. While the insurance is provided by CMHC, the Corporation is liable to CMHC for any net costs, including any environmental liabilities, incurred as a result of loan defaults on projects funded by the Province.
The Ministry will reimburse any costs incurred by the Corporation. As of March 31, 2013, there were $6.12 billion (2012 – $6.68 billion) of mortgage loans outstanding on provincially funded projects. To date, there have been no claims for defaults on the insured mortgage loans.
(B) CONTAMINATED SITES
The Corporation retains potential liability for cleaning up environmental contaminants of former public housing properties under the Environmental Protection Act, as noted in the Social Housing Reform Act and maintained in the Housing Services Act, 2011. Although the total cost of potential remediation is unknown, the Corporation will be reimbursed by the Ministry for costs incurred. Cumulative expenditures for site remediation to March 31, 2013 are $9.8 million (2012 – $6.9 million).
The Corporation had no outstanding claims as at March 31, 2013. Regent Park, formerly owned by the Corporation, is being re-developed by the Toronto Community Housing Corporation (TCHC). Based on the redevelopment plan prepared by TCHC, it is expected to take up to 15 years for the redevelopment of Regent Park and environmental remediation may be required at each stage of redevelopment. Given the nature of environmental remediation, a reasonable estimate of future costs cannot be made at this time.
9. Excess of Revenues over Expenses The subsidies from the Province include amounts intended to cover the interest and principal payments on the Corporation's long-term debt. The interest is included in the Corporation's expenses and the excess of revenues over expenses represents the principal payments.
10. Related Party Transactions The Corporation is controlled by the Province and is therefore a related party to other organizations that are controlled by or subject to significant influence by the Province. Transactions with related parties were:
1-230 PUBLIC ACCOUNTS, 2012-2013
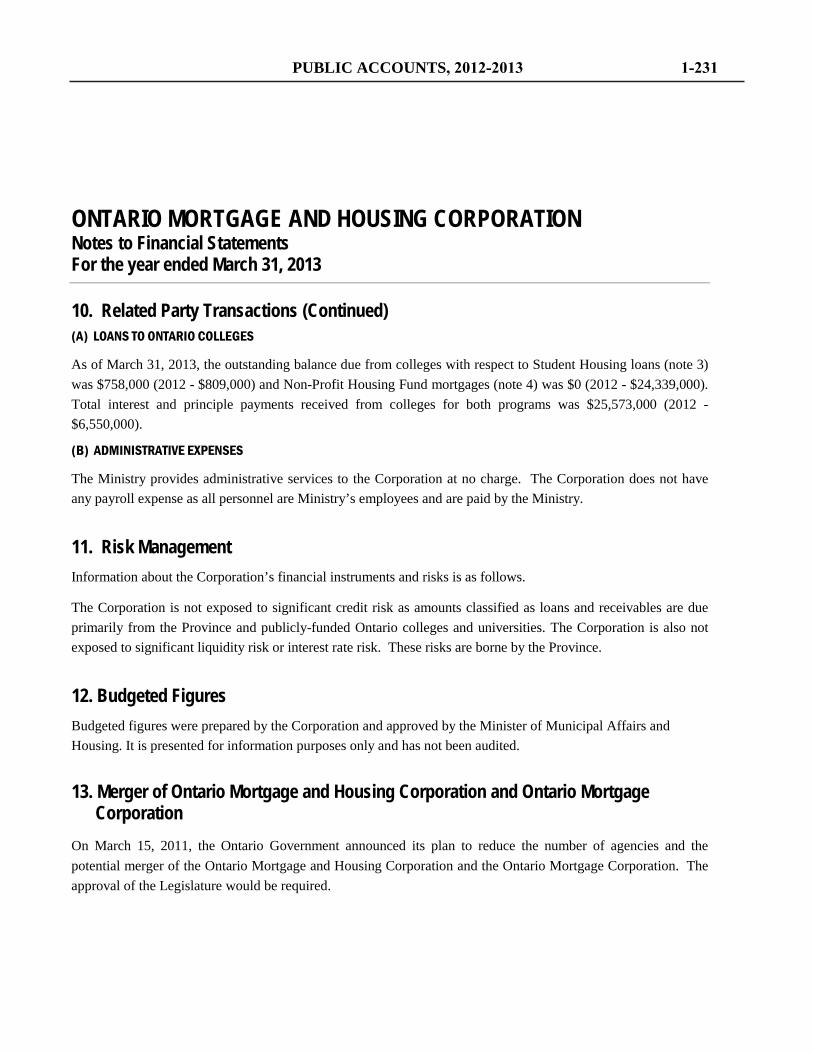
ONTARIO MORTGAGE AND HOUSING CORPORATION Notes to Financial Statements For the year ended March 31, 2013
10. Related Party Transactions (Continued) (A) LOANS TO ONTARIO COLLEGES
As of March 31, 2013, the outstanding balance due from colleges with respect to Student Housing loans (note 3) was $758,000 (2012 - $809,000) and Non-Profit Housing Fund mortgages (note 4) was $0 (2012 - $24,339,000). Total interest and principle payments received from colleges for both programs was $25,573,000 (2012 - $6,550,000).
(B) ADMINISTRATIVE EXPENSES
The Ministry provides administrative services to the Corporation at no charge. The Corporation does not have any payroll expense as all personnel are Ministry’s employees and are paid by the Ministry.
11. Risk Management Information about the Corporation’s financial instruments and risks is as follows.
The Corporation is not exposed to significant credit risk as amounts classified as loans and receivables are due primarily from the Province and publicly-funded Ontario colleges and universities. The Corporation is also not exposed to significant liquidity risk or interest rate risk. These risks are borne by the Province.
12. Budgeted Figures Budgeted figures were prepared by the Corporation and approved by the Minister of Municipal Affairs and Housing. It is presented for information purposes only and has not been audited.
13. Merger of Ontario Mortgage and Housing Corporation and Ontario Mortgage Corporation On March 15, 2011, the Ontario Government announced its plan to reduce the number of agencies and the potential merger of the Ontario Mortgage and Housing Corporation and the Ontario Mortgage Corporation. The approval of the Legislature would be required.
PUBLIC ACCOUNTS, 2012-2013 1-231

Management's Responsibility
The Ontario Northland Transportation Commission's management is responsible for the integrity and fair presentation of the consolidated financial statements and other information included in the annual report. The consolidated financial statements have been prepared in accordance with Canadian public sector accounting standards. The preparation of consolidated financial statements necessarily involves the use of management's judgment and best estimates, particularly when transactions affecting the current accounting period cannot be determined with certainty until future periods. All financial information in the annual report is consistent with the consolidated financial statements. The Commission maintains systems of internal accounting controls designed to provide reasonable assurance that the financial information is accurate and reliable and that the Commission’s assets and liabilities are adequately accounted for and assets safeguarded. The Commission is responsible for ensuring that management fulfils its responsibilities for internal control and financial reporting. The Commission meets with management and external auditors to satisfy itself that each group has met its responsibilities. These consolidated financial statements have been reviewed and approved by the Commission. These consolidated financial statements have been audited by the Auditor General of Ontario, whose responsibility is to express and opinion on whether they are fairly presented in accordance with Canadian public sector accounting standards. The Auditor’s Report which follows outlines the scope of the Auditor’s examination and opinion.
T. Hargreaves Chair
P. Goulet President and CEO
North Bay, Ontario July 18, 2013
Ontario Northland Transportation Commission
PUBLIC ACCOUNTS, 2012-2013 1-233
Independent Auditor’s Report
To the Ontario Northland Transportation Commission and to the Minister of Northern Development and Mines I have audited the accompanying consolidated financial statements of Ontario Northland Transportation Commission, which comprise the consolidated statement of financial position as at March 31, 2013, and the consolidated statements of changes in net assets, operations, and cash flows for the year then ended, and a summary of significant accounting policies and other explanatory information. Management’s responsibility for the consolidated financial statements Management is responsible for the preparation and fair presentation of these consolidated financial statements in accordance with Canadian public sector accounting standards, and for such internal control as management determines is necessary to enable the preparation of consolidated financial statements that are free from material misstatement, whether due to fraud or error. Auditors’ responsibility My responsibility is to express an opinion on these consolidated financial statements based on my audit. I conducted my audit in accordance with Canadian generally accepted auditing standards. Those standards require that I comply with ethical requirements and plan and perform the audit to obtain reasonable assurance about whether the consolidated financial statements are free from material misstatement. An audit involves performing procedures to obtain audit evidence about the amounts and disclosures in the consolidated financial statements. The procedures selected depend on the auditor’s judgment, including the assessment of the risks of material misstatement of the consolidated financial statements, whether due to fraud or error. In making those risk assessments, the auditor considers internal control relevant to the entity’s preparation and fair presentation of the consolidated financial statements in order to design audit procedures that are appropriate in the circumstances, but not for the purpose of expressing an opinion on the effectiveness of the entity’s internal control. An audit also includes evaluating the appropriateness of accounting policies used and the reasonableness of accounting estimates made by management, as well as evaluating the overall presentation of the consolidated financial statements. I believe that the audit evidence I have obtained is sufficient and appropriate to provide a basis for my audit opinion. Opinion In my opinion, the consolidated financial statements present fairly, in all material respects, the consolidated financial position of Ontario Northland Transportation Commission as at March 31, 2013, and the changes in its consolidated net assets, results of its consolidated operations, and its consolidated cash flows for the year then ended in accordance with Canadian public sector accounting standards. Emphasis of Matter Without qualifying my opinion, I draw attention to Note 1 to the consolidated financial statements which indicate that the Province of Ontario announced its intention to transform the operations of the Ontario Northland Transportation Commission and to operate it as a going concern while various options for transforming the Commission are examined. The Ontario Northland Transportation Commission’s ability to maintain operations is dependent on the continued support from the Government of Ontario while completing its transformation plans. These conditions indicate the existence of a material uncertainty that may cast doubt about the Ontario Northland Transportation Commission’s ability to continue as a going concern.
Toronto, Ontario Gary Peall, CPA, CA, LPA July 18, 2013 Acting Auditor General
1-234 PUBLIC ACCOUNTS, 2012-2013
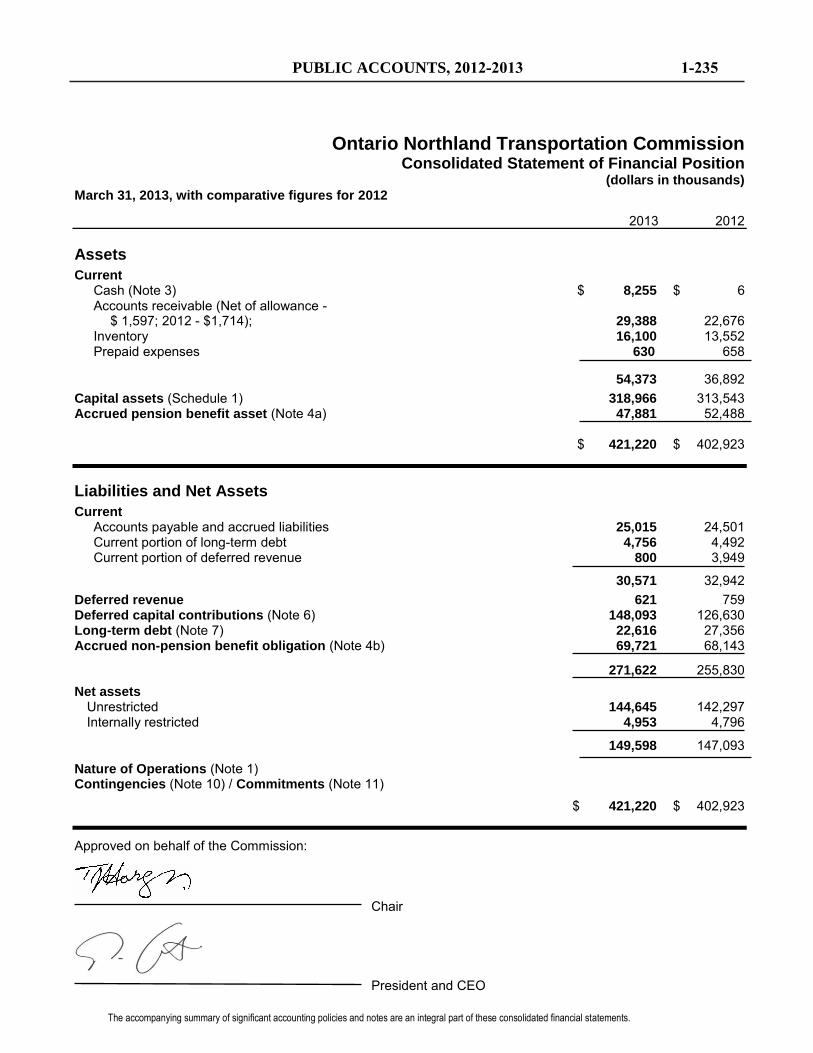
Ontario Northland Transportation Commission Consolidated Statement of Financial Position
(dollars in thousands) March 31, 2013, with comparative figures for 2012
2013 2012 Assets
Current Cash (Note 3) $ 8,255 $ 6 Accounts receivable (Net of allowance -
$ 1,597; 2012 - $1,714); 29,388 22,676 Inventory 16,100 13,552 Prepaid expenses 630 658
54,373 36,892
Capital assets (Schedule 1) 318,966 313,543 Accrued pension benefit asset (Note 4a) 47,881 52,488 $ 421,220 $ 402,923 Liabilities and Net Assets
Current Accounts payable and accrued liabilities 25,015 24,501 Current portion of long-term debt 4,756 4,492 Current portion of deferred revenue 800 3,949
30,571 32,942 Deferred revenue 621 759 Deferred capital contributions (Note 6) 148,093 126,630 Long-term debt (Note 7) 22,616 27,356 Accrued non-pension benefit obligation (Note 4b) 69,721 68,143
271,622 255,830
Net assets Unrestricted 144,645 142,297 Internally restricted 4,953 4,796
149,598 147,093
Nature of Operations (Note 1) Contingencies (Note 10) / Commitments (Note 11) $ 421,220 $ 402,923 Approved on behalf of the Commission:
Chair
President and CEO
The accompanying summary of significant accounting policies and notes are an integral part of these consolidated financial statements.
PUBLIC ACCOUNTS, 2012-2013 1-235
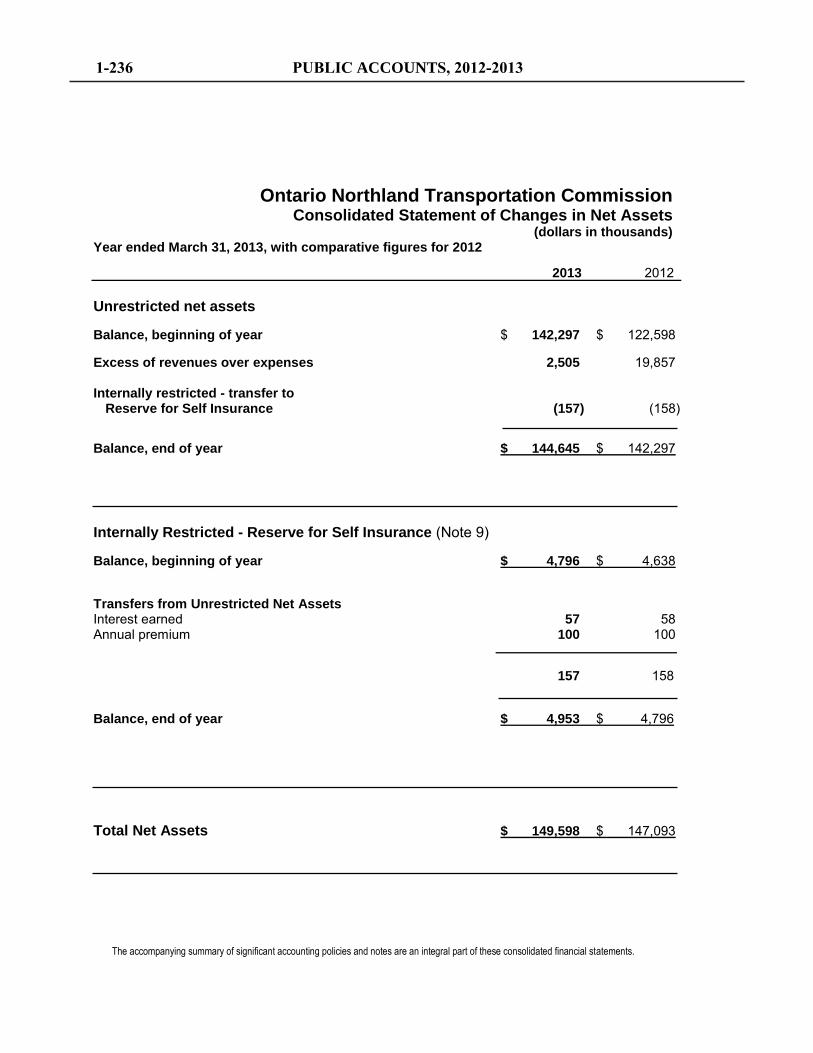
Ontario Northland Transportation Commission Consolidated Statement of Changes in Net Assets
(dollars in thousands) Year ended March 31, 2013, with comparative figures for 2012
2013 2012
Unrestricted net assets
Balance, beginning of year $ 142,297 $ 122,598
Excess of revenues over expenses 2,505 19,857 Internally restricted - transfer to
Reserve for Self Insurance (157) (158)
Balance, end of year $ 144,645 $ 142,297
Internally Restricted - Reserve for Self Insurance (Note 9)
Balance, beginning of year $ 4,796 $ 4,638
Transfers from Unrestricted Net Assets Interest earned 57 58 Annual premium 100 100 157 158
Balance, end of year $ 4,953 $ 4,796
Total Net Assets $ 149,598 $ 147,093
The accompanying summary of significant accounting policies and notes are an integral part of these consolidated financial statements.
1-236 PUBLIC ACCOUNTS, 2012-2013
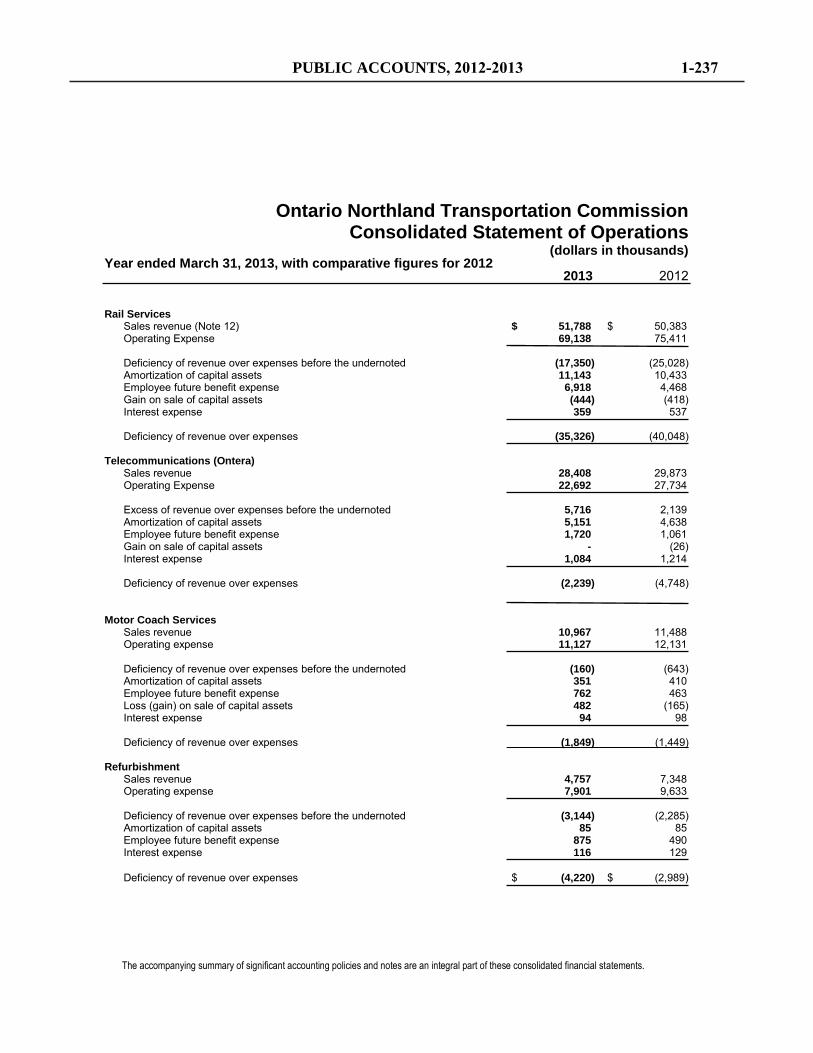
Ontario Northland Transportation Commission Consolidated Statement of Operations
(dollars in thousands) Year ended March 31, 2013, with comparative figures for 2012 2013 2012
Rail Services Sales revenue (Note 12) $ 51,788 $ 50,383 Operating Expense 69,138 75,411
Deficiency of revenue over expenses before the undernoted (17,350) (25,028) Amortization of capital assets 11,143 10,433 Employee future benefit expense 6,918 4,468 Gain on sale of capital assets (444) (418) Interest expense 359 537
Deficiency of revenue over expenses (35,326) (40,048)
Telecommunications (Ontera) Sales revenue 28,408 29,873
Operating Expense 22,692 27,734
Excess of revenue over expenses before the undernoted 5,716 2,139 Amortization of capital assets 5,151 4,638 Employee future benefit expense 1,720 1,061
Gain on sale of capital assets - (26) Interest expense 1,084 1,214
Deficiency of revenue over expenses (2,239) (4,748)
Motor Coach Services Sales revenue 10,967 11,488 Operating expense 11,127 12,131
Deficiency of revenue over expenses before the undernoted (160) (643) Amortization of capital assets 351 410 Employee future benefit expense 762 463 Loss (gain) on sale of capital assets 482 (165) Interest expense 94 98
Deficiency of revenue over expenses (1,849) (1,449) Refurbishment Sales revenue 4,757 7,348 Operating expense 7,901 9,633
Deficiency of revenue over expenses before the undernoted (3,144) (2,285) Amortization of capital assets 85 85 Employee future benefit expense 875 490 Interest expense 116 129
Deficiency of revenue over expenses $ (4,220) $ (2,989)
The accompanying summary of significant accounting policies and notes are an integral part of these consolidated financial statements.
PUBLIC ACCOUNTS, 2012-2013 1-237
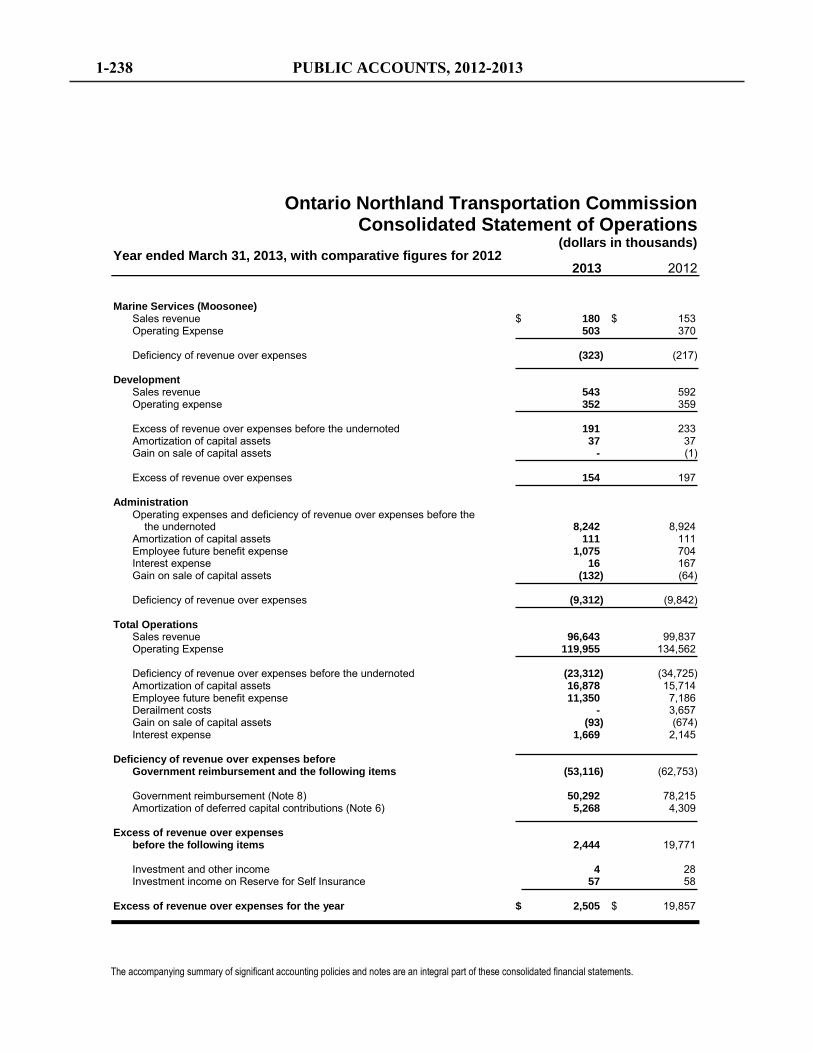
Ontario Northland Transportation Commission Consolidated Statement of Operations
(dollars in thousands) Year ended March 31, 2013, with comparative figures for 2012 2013 2012
Marine Services (Moosonee) Sales revenue $ 180 $ 153 Operating Expense 503 370
Deficiency of revenue over expenses (323) (217) Development Sales revenue 543 592 Operating expense 352 359 Excess of revenue over expenses before the undernoted 191 233 Amortization of capital assets 37 37 Gain on sale of capital assets - (1)
Excess of revenue over expenses 154 197
Administration Operating expenses and deficiency of revenue over expenses before the the undernoted 8,242 8,924 Amortization of capital assets 111 111 Employee future benefit expense 1,075 704 Interest expense 16 167 Gain on sale of capital assets (132) (64)
Deficiency of revenue over expenses (9,312) (9,842)
Total Operations Sales revenue 96,643 99,837 Operating Expense 119,955 134,562
Deficiency of revenue over expenses before the undernoted (23,312) (34,725) Amortization of capital assets 16,878 15,714 Employee future benefit expense 11,350 7,186 Derailment costs - 3,657 Gain on sale of capital assets (93) (674)
Interest expense 1,669 2,145 Deficiency of revenue over expenses before Government reimbursement and the following items (53,116) (62,753) Government reimbursement (Note 8) 50,292 78,215 Amortization of deferred capital contributions (Note 6) 5,268 4,309 Excess of revenue over expenses before the following items 2,444 19,771
Investment and other income 4 28 Investment income on Reserve for Self Insurance 57 58
Excess of revenue over expenses for the year $ 2,505 $ 19,857
The accompanying summary of significant accounting policies and notes are an integral part of these consolidated financial statements.
1-238 PUBLIC ACCOUNTS, 2012-2013
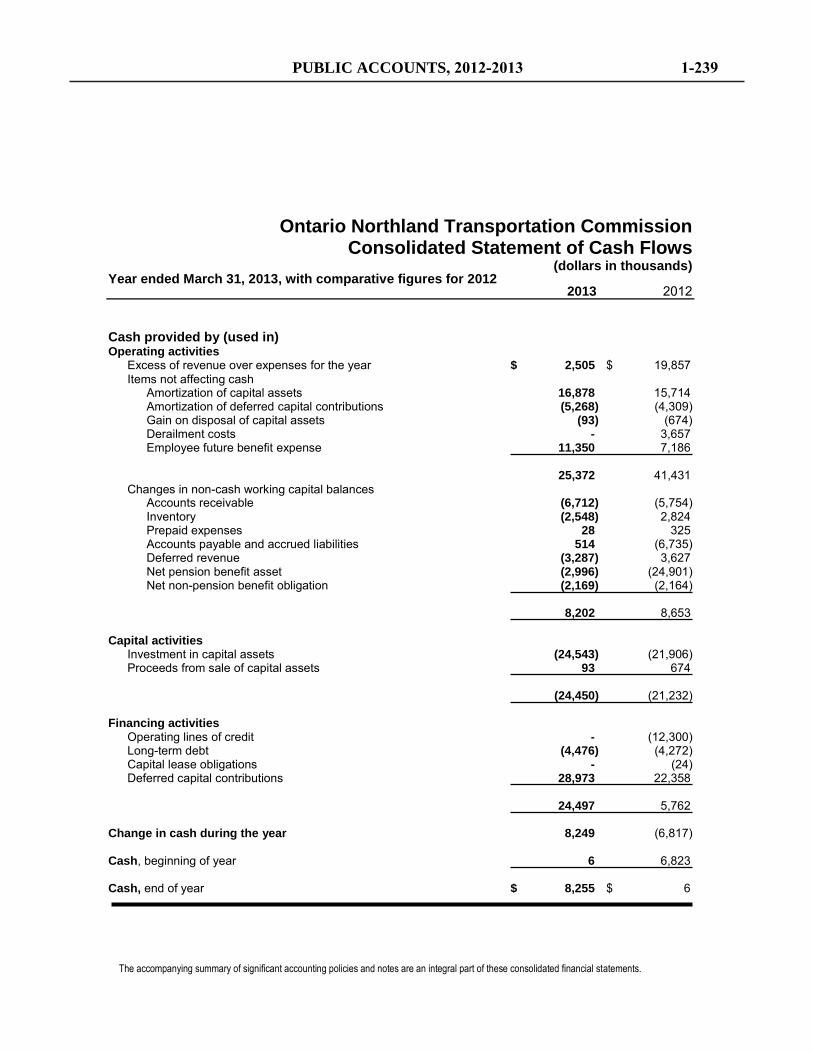
Ontario Northland Transportation Commission Consolidated Statement of Cash Flows
(dollars in thousands) Year ended March 31, 2013, with comparative figures for 2012 2013 2012
Cash provided by (used in) Operating activities
Excess of revenue over expenses for the year $ 2,505 $ 19,857 Items not affecting cash
Amortization of capital assets 16,878 15,714 Amortization of deferred capital contributions (5,268) (4,309) Gain on disposal of capital assets (93) (674) Derailment costs - 3,657 Employee future benefit expense 11,350 7,186
25,372 41,431
Changes in non-cash working capital balances Accounts receivable (6,712) (5,754) Inventory (2,548) 2,824 Prepaid expenses 28 325 Accounts payable and accrued liabilities 514 (6,735) Deferred revenue (3,287) 3,627 Net pension benefit asset (2,996) (24,901) Net non-pension benefit obligation (2,169) (2,164)
8,202 8,653
Capital activities
Investment in capital assets (24,543) (21,906) Proceeds from sale of capital assets 93 674
(24,450) (21,232)
Financing activities
Operating lines of credit - (12,300) Long-term debt (4,476) (4,272) Capital lease obligations - (24) Deferred capital contributions 28,973 22,358
24,497 5,762
Change in cash during the year 8,249 (6,817) Cash, beginning of year 6 6,823
Cash, end of year $ 8,255 $ 6
The accompanying summary of significant accounting policies and notes are an integral part of these consolidated financial statements.
PUBLIC ACCOUNTS, 2012-2013 1-239
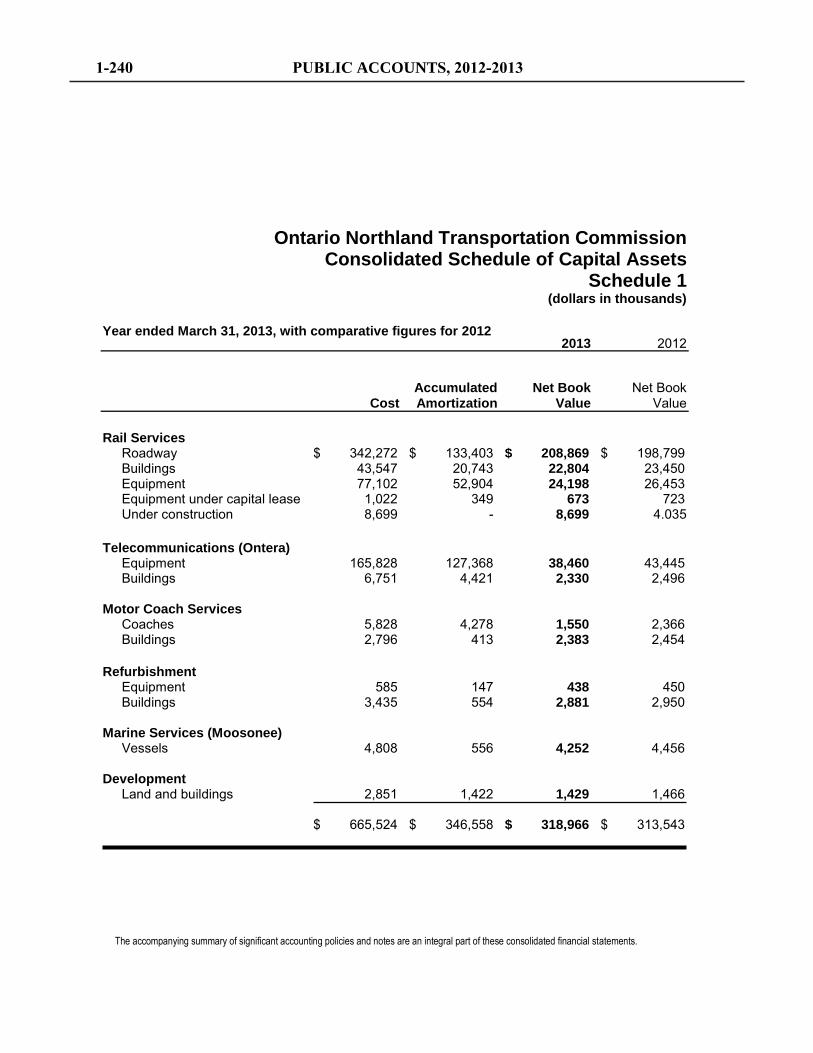
Ontario Northland Transportation Commission Consolidated Schedule of Capital Assets
Schedule 1 (dollars in thousands)
Year ended March 31, 2013, with comparative figures for 2012 2013 2012
Accumulated Net Book Net Book Cost Amortization Value Value
Rail Services Roadway $ 342,272 $ 133,403 $ 208,869 $ 198,799 Buildings 43,547 20,743 22,804 23,450 Equipment 77,102 52,904 24,198 26,453 Equipment under capital lease 1,022 349 673 723 Under construction 8,699 - 8,699 4.035
Telecommunications (Ontera) Equipment 165,828 127,368 38,460 43,445 Buildings 6,751 4,421 2,330 2,496 Motor Coach Services Coaches 5,828 4,278 1,550 2,366 Buildings 2,796 413 2,383 2,454 Refurbishment Equipment 585 147 438 450 Buildings 3,435 554 2,881 2,950 Marine Services (Moosonee) Vessels 4,808 556 4,252 4,456 Development Land and buildings 2,851 1,422 1,429 1,466 $ 665,524 $ 346,558 $ 318,966 $ 313,543
The accompanying summary of significant accounting policies and notes are an integral part of these consolidated financial statements.
1-240 PUBLIC ACCOUNTS, 2012-2013
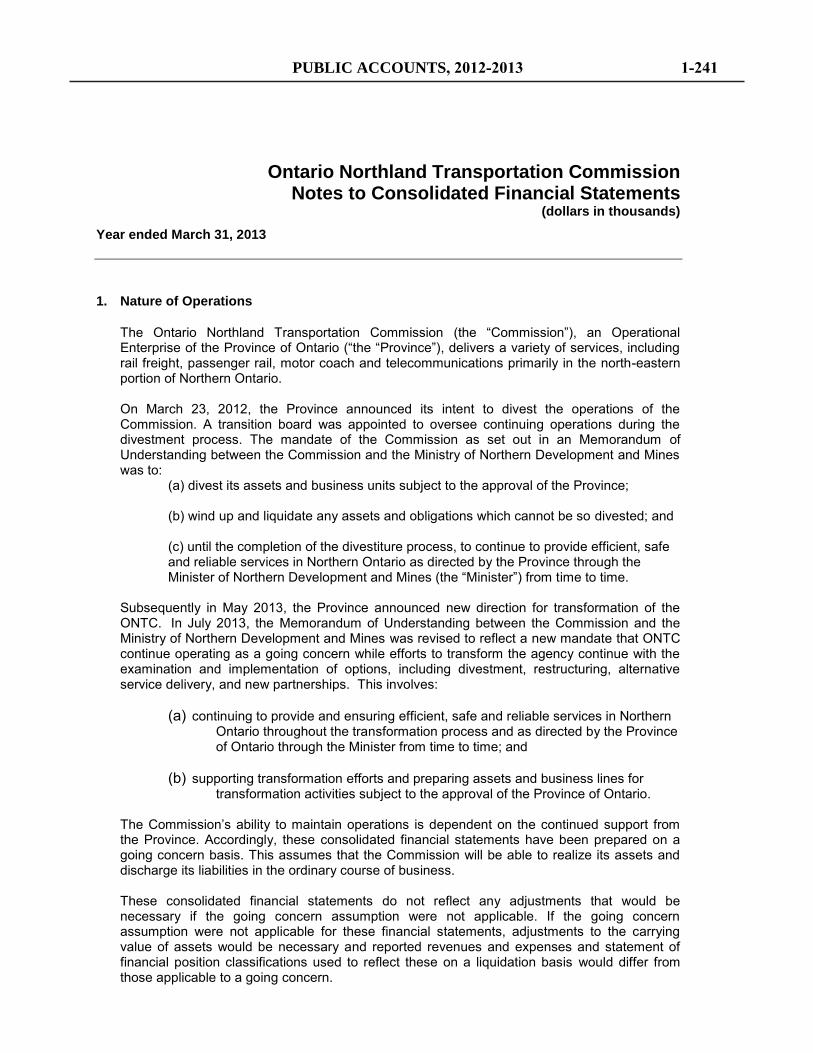
Ontario Northland Transportation Commission Notes to Consolidated Financial Statements
(dollars in thousands)
Year ended March 31, 2013
1. Nature of Operations
The Ontario Northland Transportation Commission (the “Commission”), an Operational Enterprise of the Province of Ontario (“the “Province”), delivers a variety of services, including rail freight, passenger rail, motor coach and telecommunications primarily in the north-eastern portion of Northern Ontario. On March 23, 2012, the Province announced its intent to divest the operations of the Commission. A transition board was appointed to oversee continuing operations during the divestment process. The mandate of the Commission as set out in an Memorandum of Understanding between the Commission and the Ministry of Northern Development and Mines was to:
(a) divest its assets and business units subject to the approval of the Province; (b) wind up and liquidate any assets and obligations which cannot be so divested; and (c) until the completion of the divestiture process, to continue to provide efficient, safe and reliable services in Northern Ontario as directed by the Province through the Minister of Northern Development and Mines (the “Minister”) from time to time.
Subsequently in May 2013, the Province announced new direction for transformation of the ONTC. In July 2013, the Memorandum of Understanding between the Commission and the Ministry of Northern Development and Mines was revised to reflect a new mandate that ONTC continue operating as a going concern while efforts to transform the agency continue with the examination and implementation of options, including divestment, restructuring, alternative service delivery, and new partnerships. This involves:
(a) continuing to provide and ensuring efficient, safe and reliable services in Northern Ontario throughout the transformation process and as directed by the Province of Ontario through the Minister from time to time; and
(b) supporting transformation efforts and preparing assets and business lines for transformation activities subject to the approval of the Province of Ontario.
The Commission’s ability to maintain operations is dependent on the continued support from the Province. Accordingly, these consolidated financial statements have been prepared on a going concern basis. This assumes that the Commission will be able to realize its assets and discharge its liabilities in the ordinary course of business. These consolidated financial statements do not reflect any adjustments that would be necessary if the going concern assumption were not applicable. If the going concern assumption were not applicable for these financial statements, adjustments to the carrying value of assets would be necessary and reported revenues and expenses and statement of financial position classifications used to reflect these on a liquidation basis would differ from those applicable to a going concern.
PUBLIC ACCOUNTS, 2012-2013 1-241
Ontario Northland Transportation Commission Notes to Consolidated Financial Statements
(dollars in thousands)
Year ended March 31, 2013
2. Significant Accounting Policies
These consolidated financial statements are prepared in accordance with the standards applicable for government not-for-profit organizations found in the Canadian Institute of Chartered Accountants (“CICA”) Public Sector Accounting Handbook. They include the accounts of the Commission and its wholly-owned subsidiaries, Ontario Northland International Consulting Services Inc., O.N. Tel Inc. (o/a Ontera) and Nipissing Central Railway Company.
Revenue Recognition
Revenue from all sources is recognized when all of the following conditions are met:
a) services are provided or products delivered to customers b) there is clear evidence that an arrangement exists, and c) collection is reasonably assured.
Rail services revenues are generally recognized on completion of movements, with interline movements being treated as complete when the shipment is turned over to the connecting carrier.
Contract revenues are generally recorded on a percentage of completion basis as work reaches predetermined project milestones.
Monthly subscriber fees in connection with wireless telecommunications services, internet services, network, local and long distance services are recorded as revenue as the service is provided. Any revenue or cost adjustments, whether positive or negative, in the interconnection and traffic settlement agreements are recognized in the year in which they become known and estimable.
The Commission accounts for provincial and federal reimbursements under the deferral method of accounting as follows:
Unrestricted reimbursements are recognized as revenue when received or receivable if the amounts can be reasonably estimated and collection is reasonably assured.
Externally restricted reimbursements related to operating expenditures are recognized as revenue when the related expenditures are incurred.
The Province reimburses the Commission for the cost of certain capital assets purchased for use in operations. The Commission records the contributions as deferred capital contributions. Deferred capital reimbursements are amortized to revenue on a straight-line basis at rates corresponding to those of the related capital assets.
1-242 PUBLIC ACCOUNTS, 2012-2013
Ontario Northland Transportation Commission Notes to Consolidated Financial Statements
(dollars in thousands)
Year ended March 31, 2013
2. Significant Accounting Policies (continued)
Capital Assets Capital assets are stated at acquisition cost less accumulated amortization. Amortization is provided using the straight-line method over the estimated useful lives of the assets.
The estimated useful lives for principal categories of capital assets are as follows:
Roadway - main line and branches 20 to 50 years Railway diesel locomotives 25 years Railway cars 33 years Buildings 50 years Telecommunications equipment 15 to 25 years Vehicles 3 years Computer equipment 5 years Coaches 12 years
No amortization is provided on assets under construction until they are placed in use.
Employee Future Benefits
Pension Plans - The Commission maintains a contributory defined benefit pension plan for its employees. It provides for pensions based on years of service and average pensionable earnings and is generally applicable from the first day of the month following employment. A Supplementary Employee Retirement Plan (SERP) also exists for employees who earn a lifetime pension amount in excess of the Canadian Income Tax Act’s maximum. The obligations under the plan are determined using the accrued benefit method reflecting projected benefits for services rendered to date. The plans are not indexed; however, there have been a variety of ad hoc increases made to pensioners.
Non-Pension Benefit Plans - The Commission offers non-pension post retirement benefits such as group life, health care and long-term disability to employees through defined benefit plans. The costs associated with these future benefits are actuarially determined using the projected benefits method prorated on service and best estimate assumptions. In addition, as a Schedule 2 employer under the Workplace Safety and Insurance Board (WSIB), the Commission recognizes workers compensation benefits on an accrual basis using actuarial calculations provided by the WSIB for benefits in force, benefits not yet awarded and administrative loading costs.
PUBLIC ACCOUNTS, 2012-2013 1-243
Ontario Northland Transportation Commission Notes to Consolidated Financial Statements
(dollars in thousands)
Year ended March 31, 2013
2. Significant Accounting Policies - Employee Future Benefits (continued)
Both Pension and Non-Pension expenses consist of current service costs, interest and adjustments arising from plan amendments, changes in assumptions and net actuarial gains or losses. These expenses are recorded in the year in which employees render services to the Commission. Past services pension costs were charged to net assets on transition to P5-3250. Actuarial gains and losses are amortized on a straight-line basis over the EARSL of the employees covered by the plans (approximately 12 years). Past service costs are recognized in the period of plan amendment.
Pension fund assets are valued using current market values.
Inventory
Materials and supplies, with the exception of used rail and wheel-sets, are valued at the lower of cost and net realizable value by using the weighted-average costing methodology. Used rail is shown at unamortized book value determined at the time of retirement. Wheel-sets are valued at standard cost. The Commission uses the same cost formulas for all inventories having a similar nature and use to the Commission. When net realizable value is less than carrying cost, inventory is written down accordingly. When circumstances which previously caused inventories to be written down no longer exist, that previous impairment is reversed.
The cost of inventory expensed to operations and used in capital projects for 2013 was $17,853 (2012 - $20,683).
Impairment of Capital Assets
Capital assets subject to amortization are reviewed for impairment whenever events or changes in circumstances indicate that the capital asset may not contribute to the Commission’s ability to deliver services. Recoverability is measured by a comparison of the carrying amount to the estimated undiscounted future cash flows expected to be generated by the asset. If the carrying amount of the asset exceeds its estimated future cash flows, both the asset and any related deferred capital contributions are written down by the amount by which the carrying amount of the asset exceeds the fair value of the asset. When quoted market prices are not available, the Commission uses the expected future cash flows discounted at a rate commensurate with the risks associated with the recovery of the asset as an estimate of fair value.
Foreign Currency Translation
Monetary assets and liabilities denominated in foreign currencies are translated at the prevailing rates of exchange at the Consolidated Statement of Financial Position date. Revenues and expenses are translated at the rates of exchange in effect at the transaction date. Realized and unrealized gains and losses are included in the determination of excess of revenue over expenses. Included in Rail revenue is a foreign currency gain of $36 (2012 - loss of $62) arising mainly from rail traffic settlements between Canada and the U.S.A.
1-244 PUBLIC ACCOUNTS, 2012-2013

Ontario Northland Transportation Commission Notes to Consolidated Financial Statements
(dollars in thousands)
Year ended March 31, 2013
2. Significant Accounting Policies (continued)
Income Taxes
As a not-for-profit operational enterprise of the Province, the Commission is exempt from income taxes. This exemption extends to its wholly-owned subsidiaries, and accordingly no tax provision is recorded in these financial statements.
Accounting Estimates
The preparation of the consolidated financial statements in conformity with Canadian public sector accounting standards requires management to make estimates and assumptions that affect the reported amounts of assets and liabilities and the reported amounts of revenues and expenses during the reporting period. Significant areas requiring the use of management estimates relate to the useful lives of capital assets, valuation allowances for accounts receivable and inventory and obligations for pension and non-pension post employment benefits. By their nature, these estimates are subject to measurement uncertainty. The effect of changes in such estimates on the consolidated financial statements in future periods could be significant. These estimates are reviewed periodically, and, as adjustments become necessary, they are reported in the consolidated statement of operations in the year in which they become known.
Cash
Cash include cash on hand, balances with banks, and restricted cash.
3. Cash
March 31, March 31, 2013 2012
Cash (bank overdraft) $ 3,302 $ (4,790) Cash related to Reserve for
Self Insurance (Note 9) 4,953 4,796
Cash $ 8,255 $ 6
PUBLIC ACCOUNTS, 2012-2013 1-245
Ontario Northland Transportation Commission Notes to Consolidated Financial Statements
(dollars in thousands)
Year ended March 31, 2013
4. Employee Future Benefits
The Commission is the administrator of its contributory pension plan which covers all permanent staff. The pension fund assets primarily include marketable securities, real estate and corporate and government bonds, which are invested by professional investment managers. The Commission’s pension plans have an annual measurement date of December 31st.
The accrued pension benefit asset and non-pension benefit obligation and expenses are determined annually by independent actuaries in accordance with accepted actuarial practices and Canadian public sector accounting standards using management's best estimates. The date of the most recent actuarial valuation for the contributory pension plans for funding purposes was January 1, 2011. The results of this valuation were extrapolated to December 31, 2012. In accordance with existing pension regulations, annual valuations will be completed for the Commission’s pension plans. The date of the most recent report for accounting purposes for the non-pension post employment benefit plan was December 31, 2012.
The pension plan’s asset target percentage allocation and average asset allocation as at March 31, 2013, by category are as follows:
Target 2013 2012
Equity securities – Domestic 20% - 30% 23.6% 22.1% – Foreign 10% - 30% 19.6% 18.1%
Debt securities 35% - 55% 54.0% 57.6% Real estate 0% - 15% 0.9% 1.7% Short-term and other 0% - 15% 1.9% 0.5% Total 100% 100%
1-246 PUBLIC ACCOUNTS, 2012-2013
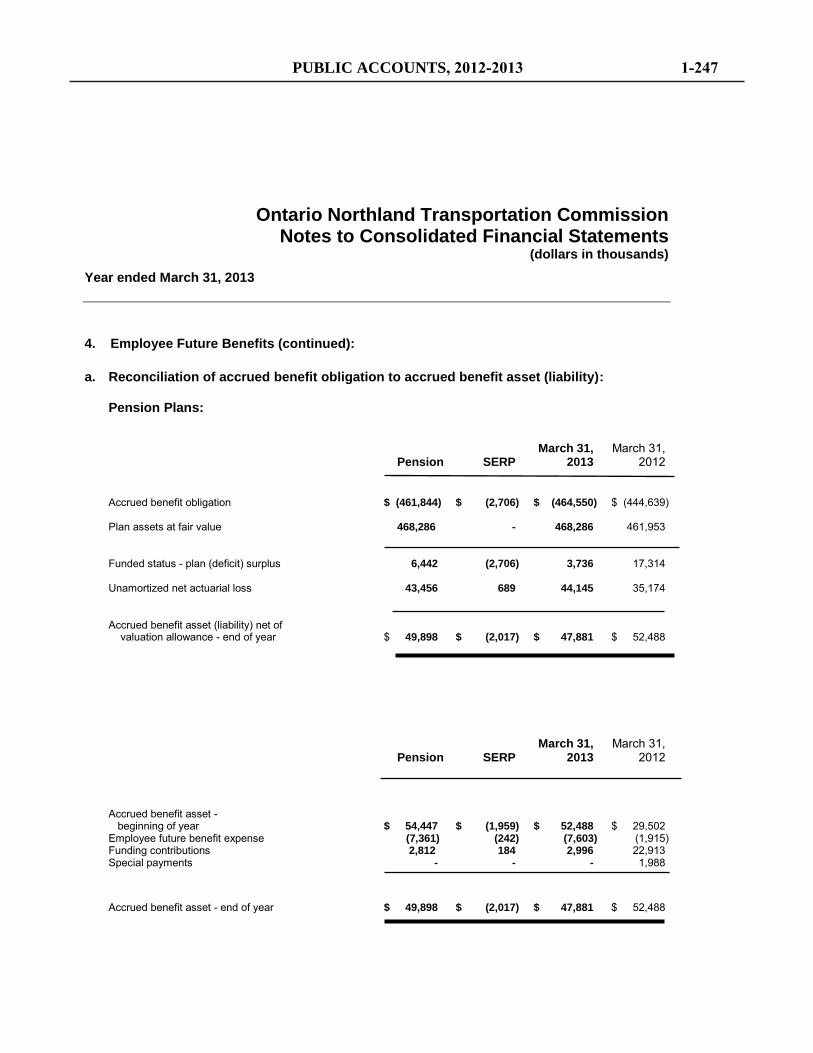
Ontario Northland Transportation Commission Notes to Consolidated Financial Statements
(dollars in thousands)
Year ended March 31, 2013
4. Employee Future Benefits (continued):
a. Reconciliation of accrued benefit obligation to accrued benefit asset (liability): Pension Plans:
March 31, March 31, Pension SERP 2013 2012 Accrued benefit obligation $ (461,844) $ (2,706) $ (464,550) $ (444,639) Plan assets at fair value 468,286 - 468,286 461,953 Funded status - plan (deficit) surplus 6,442 (2,706) 3,736 17,314
Unamortized net actuarial loss 43,456 689 44,145 35,174
Accrued benefit asset (liability) net of valuation allowance - end of year $ 49,898 $ (2,017) $ 47,881 $ 52,488
March 31, March 31, Pension SERP 2013 2012 Accrued benefit asset - beginning of year $ 54,447 $ (1,959) $ 52,488 $ 29,502 Employee future benefit expense (7,361) (242) (7,603) (1,915) Funding contributions 2,812 184 2,996 22,913 Special payments - - - 1,988
Accrued benefit asset - end of year $ 49,898 $ (2,017) $ 47,881 $ 52,488
PUBLIC ACCOUNTS, 2012-2013 1-247
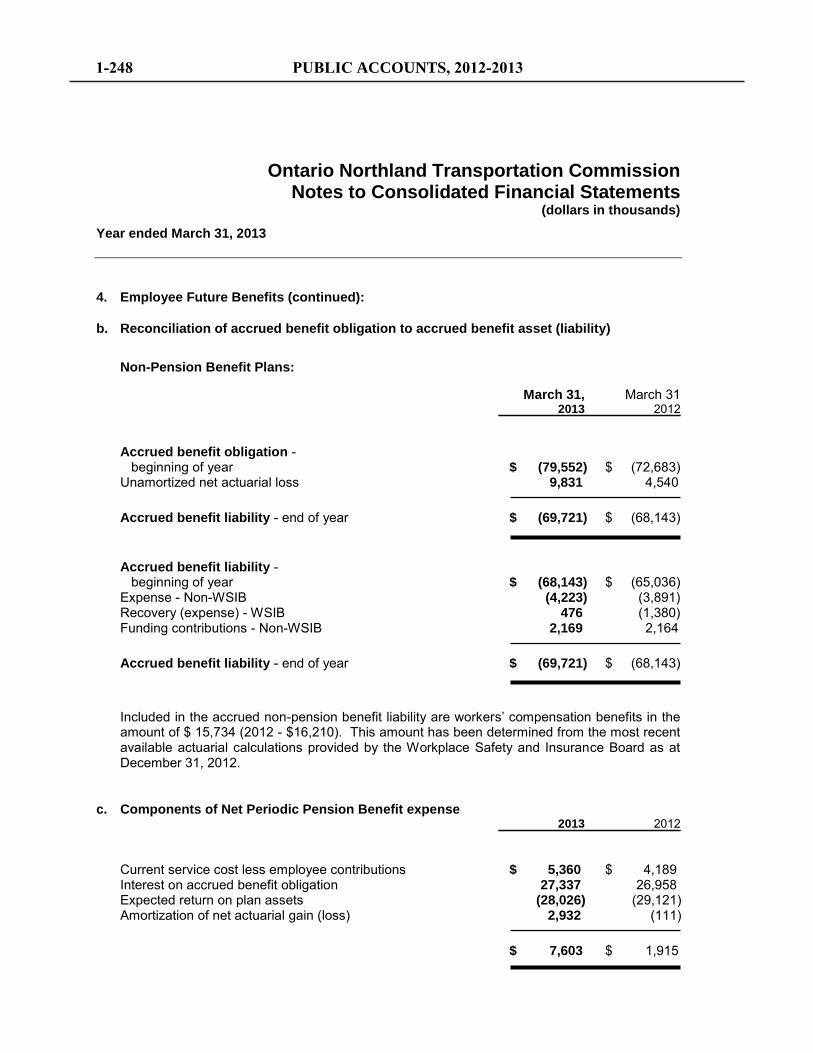
Ontario Northland Transportation Commission Notes to Consolidated Financial Statements
(dollars in thousands)
Year ended March 31, 2013
4. Employee Future Benefits (continued):
b. Reconciliation of accrued benefit obligation to accrued benefit asset (liability)
Non-Pension Benefit Plans: March 31, March 31 2013 2012
Accrued benefit obligation - beginning of year $ (79,552) $ (72,683) Unamortized net actuarial loss 9,831 4,540
Accrued benefit liability - end of year $ (69,721) $ (68,143)
Accrued benefit liability - beginning of year $ (68,143) $ (65,036) Expense - Non-WSIB (4,223) (3,891) Recovery (expense) - WSIB 476 (1,380) Funding contributions - Non-WSIB 2,169 2,164
Accrued benefit liability - end of year $ (69,721) $ (68,143)
Included in the accrued non-pension benefit liability are workers’ compensation benefits in the amount of $ 15,734 (2012 - $16,210). This amount has been determined from the most recent available actuarial calculations provided by the Workplace Safety and Insurance Board as at December 31, 2012.
c. Components of Net Periodic Pension Benefit expense 2013 2012
Current service cost less employee contributions $ 5,360 $ 4,189 Interest on accrued benefit obligation 27,337 26,958 Expected return on plan assets (28,026) (29,121) Amortization of net actuarial gain (loss) 2,932 (111)
$ 7,603 $ 1,915
1-248 PUBLIC ACCOUNTS, 2012-2013

Ontario Northland Transportation Commission Notes to Consolidated Financial Statements
(dollars in thousands)
Year ended March 31, 2013
4. Employee Future Benefits (continued):
d. Components of Net Periodic Non-Pension Benefit Expense
2013 2012
Current service cost $ 862 $ 2,568 Interest on accrued benefit obligation 2,561 2,544 Amortization of net actuarial losses 324 159
$ 3,747 $ 5,271
e. Weighted Average Assumptions
Discount rate - pension 6.00 % 6.25 % Discount rate - non pension 4.02 % 4.52 % Discount rate - WSIB 7.00 % 7.00 % Expected long-term rate of return on plan assets 6.00 % 6.25 % Rate of compensation increase 2011 1.5 % 0 % 2012 & 2013 2.0 % 0.5 % 2014 & thereafter 3.0 % 3.0 % Average remaining service period (years) 12 12 Drug cost increases (grading down to 5% in 2020) 9.0% 9.0 % Medical and hospital cost increases 5.0% 5.0% Dental cost increases 4.5% 4.5% Vision care cost increases 0% 0%
5. Operating Line of Credit
The Commission holds a demand operating line of credit with the Canadian Imperial Bank of Commerce in the amount of $1,500 which is available for letters of guarantee and is secured by the Commission’s accounts receivable. At March 31, 2013, the letter of guarantee totalling $ nil (2012 - $ 428) had been issued.
PUBLIC ACCOUNTS, 2012-2013 1-249
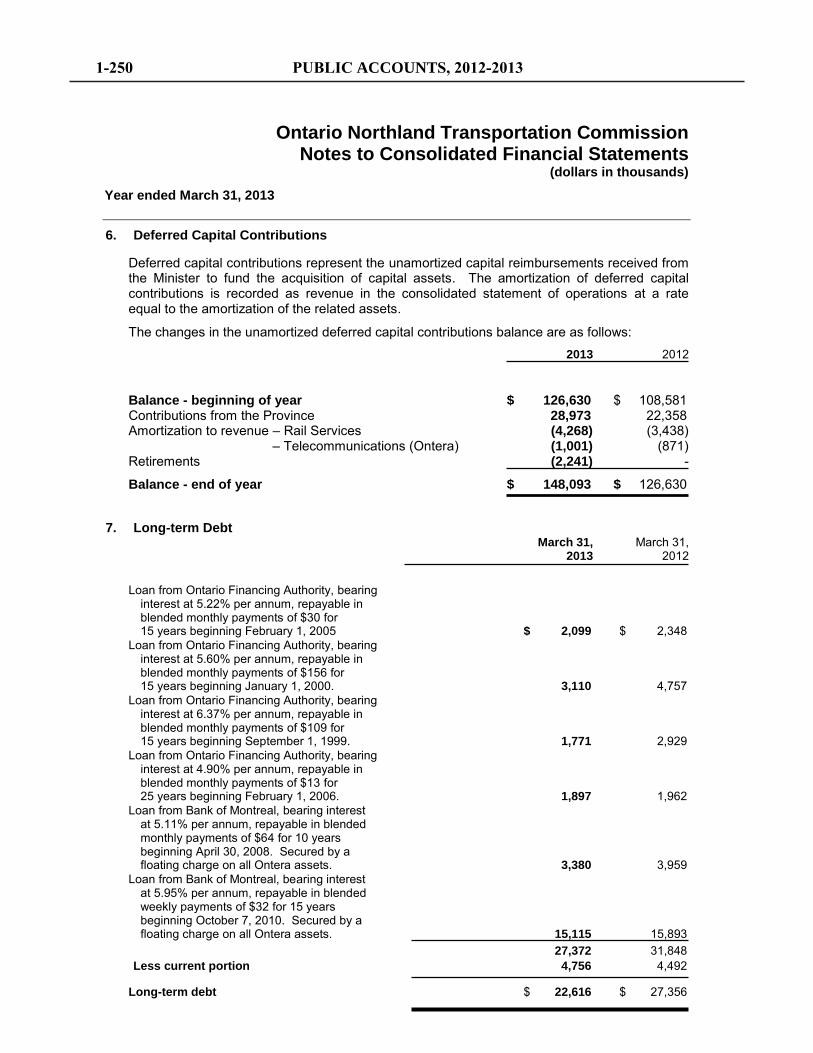
Ontario Northland Transportation Commission Notes to Consolidated Financial Statements
(dollars in thousands)
Year ended March 31, 2013
6. Deferred Capital Contributions
Deferred capital contributions represent the unamortized capital reimbursements received from the Minister to fund the acquisition of capital assets. The amortization of deferred capital contributions is recorded as revenue in the consolidated statement of operations at a rate equal to the amortization of the related assets.
The changes in the unamortized deferred capital contributions balance are as follows: 2013 2012
Balance - beginning of year $ 126,630 $ 108,581 Contributions from the Province 28,973 22,358 Amortization to revenue – Rail Services (4,268) (3,438) – Telecommunications (Ontera) (1,001) (871) Retirements (2,241) -
Balance - end of year $ 148,093 $ 126,630
7. Long-term Debt March 31, March 31, 2013 2012
Loan from Ontario Financing Authority, bearing
interest at 5.22% per annum, repayable in blended monthly payments of $30 for 15 years beginning February 1, 2005 $ 2,099 $ 2,348
Loan from Ontario Financing Authority, bearing interest at 5.60% per annum, repayable in blended monthly payments of $156 for 15 years beginning January 1, 2000. 3,110 4,757
Loan from Ontario Financing Authority, bearing interest at 6.37% per annum, repayable in blended monthly payments of $109 for 15 years beginning September 1, 1999. 1,771 2,929
Loan from Ontario Financing Authority, bearing interest at 4.90% per annum, repayable in blended monthly payments of $13 for 25 years beginning February 1, 2006. 1,897 1,962
Loan from Bank of Montreal, bearing interest at 5.11% per annum, repayable in blended monthly payments of $64 for 10 years beginning April 30, 2008. Secured by a floating charge on all Ontera assets. 3,380 3,959
Loan from Bank of Montreal, bearing interest at 5.95% per annum, repayable in blended weekly payments of $32 for 15 years beginning October 7, 2010. Secured by a floating charge on all Ontera assets. 15,115 15,893
27,372 31,848 Less current portion 4,756 4,492
Long-term debt $ 22,616 $ 27,356
1-250 PUBLIC ACCOUNTS, 2012-2013
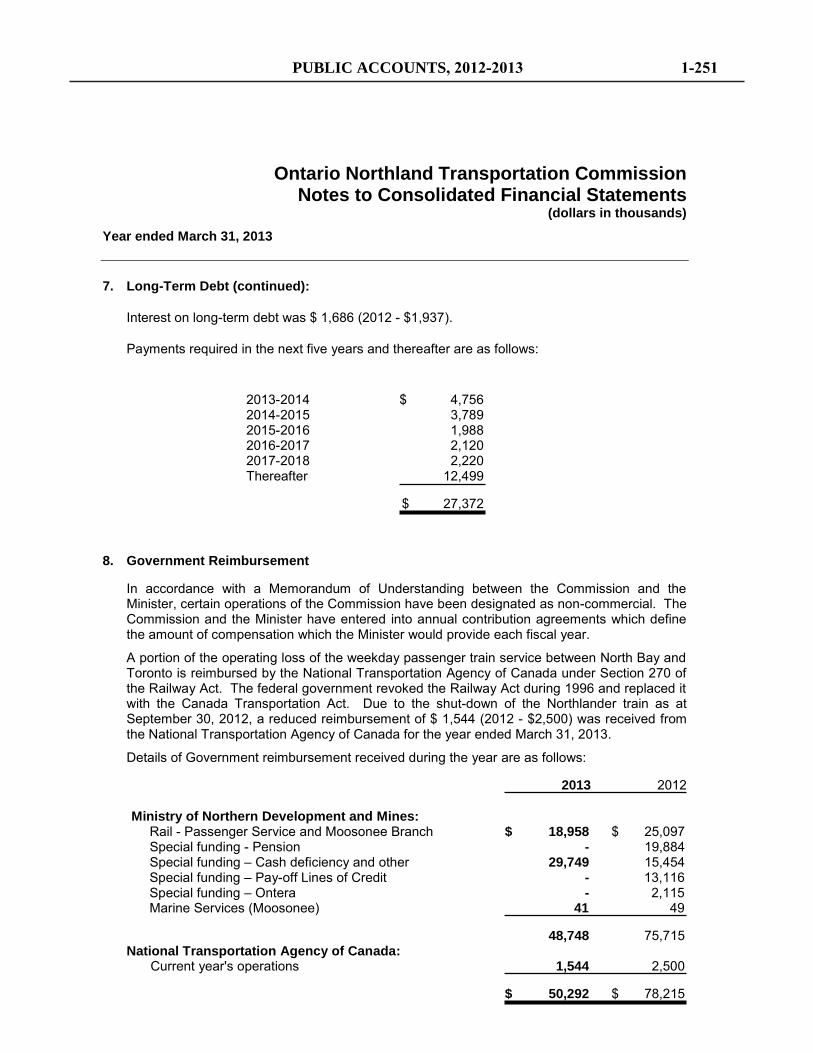
Ontario Northland Transportation Commission Notes to Consolidated Financial Statements
(dollars in thousands)
Year ended March 31, 2013
7. Long-Term Debt (continued):
Interest on long-term debt was $ 1,686 (2012 - $1,937).
Payments required in the next five years and thereafter are as follows:
2013-2014 $ 4,756 2014-2015 3,789 2015-2016 1,988 2016-2017 2,120 2017-2018 2,220 Thereafter 12,499
$ 27,372
8. Government Reimbursement
In accordance with a Memorandum of Understanding between the Commission and the Minister, certain operations of the Commission have been designated as non-commercial. The Commission and the Minister have entered into annual contribution agreements which define the amount of compensation which the Minister would provide each fiscal year.
A portion of the operating loss of the weekday passenger train service between North Bay and Toronto is reimbursed by the National Transportation Agency of Canada under Section 270 of the Railway Act. The federal government revoked the Railway Act during 1996 and replaced it with the Canada Transportation Act. Due to the shut-down of the Northlander train as at September 30, 2012, a reduced reimbursement of $ 1,544 (2012 - $2,500) was received from the National Transportation Agency of Canada for the year ended March 31, 2013.
Details of Government reimbursement received during the year are as follows:
2013 2012
Ministry of Northern Development and Mines: Rail - Passenger Service and Moosonee Branch $ 18,958 $ 25,097 Special funding - Pension - 19,884
Special funding – Cash deficiency and other 29,749 15,454 Special funding – Pay-off Lines of Credit - 13,116 Special funding – Ontera - 2,115 Marine Services (Moosonee) 41 49
48,748 75,715 National Transportation Agency of Canada:
Current year's operations 1,544 2,500
$ 50,292 $ 78,215
PUBLIC ACCOUNTS, 2012-2013 1-251
Ontario Northland Transportation Commission Notes to Consolidated Financial Statements
(dollars in thousands)
Year ended March 31, 2013
9. Internally Restricted Net Assets – Reserve for Self Insurance
The Commission follows the policy of self-insuring for damages from rolling stock derailments and for cargo damage. Annually the Commission transfers $100 from unrestricted net assets to the Reserve for Self Insurance (the “Reserve”) to finance such costs. Interest earned on the reserve balance and claims expensed in the reserve balance are recorded as revenue and expenses in the consolidated statement of operations then transferred to/from the Reserve.
Periodically, the Commission borrows cash from the Reserve for its temporary use. The Commission pays interest to the Reserve at the bank’s prime rate less 1.75% on these temporary borrowings.
10. Contingencies
In the normal course of its operations, various statements of claim have been issued against the Commission claiming damages for personal injury, property damages, environmental actions and employment-related issues. Damages, if any, cannot be estimated at this time and in any event the Commission is of the opinion that these claims are unfounded or covered by insurance after application of a $2,000 deductible. Should any loss result, it would be charged to the consolidated statement of operations when the amount is ascertained.
11. Commitments
The Commission is also obligated to certain job guarantee agreements with a significant number of its unionized employees. To the extent of any actual claims under these agreements, the Commission would maintain provisions for such items. Due to the nature of these agreements, the maximum exposure for future payments may be material. However, such exposure cannot be reasonably determined and no provision has been made as at the year-end date.
12. Economic Dependence
During 2013, the Rail Services Division derived 40% (2012 - 39%) of its revenue from three major customers.
1-252 PUBLIC ACCOUNTS, 2012-2013
PUBLIC ACCOUNTS, 2012-2013 1-253
1-254 PUBLIC ACCOUNTS, 2012-2013
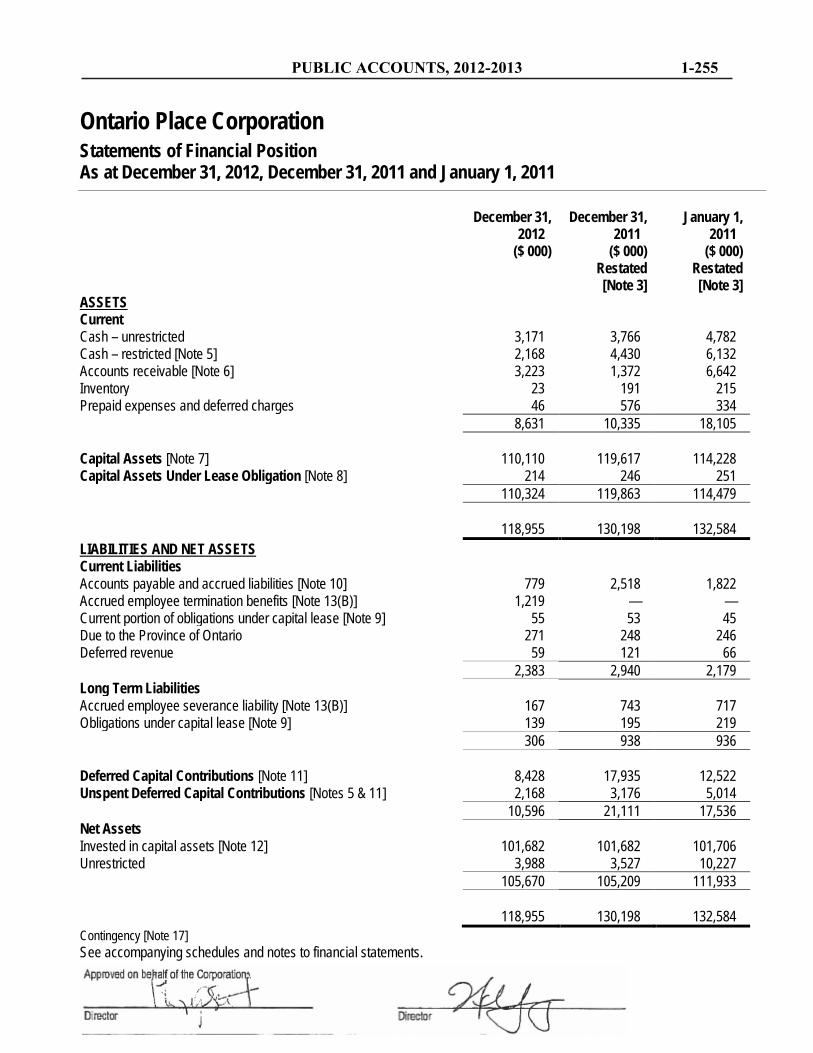
PUBLIC ACCOUNTS, 2012-2013 1-255
Ontario Place Corporation Statements of Financial Position As at December 31, 2012, December 31, 2011 and January 1, 2011
December 31,
2012 December 31,
2011 January 1,
2011 ($ 000) ($ 000) ($ 000) Restated Restated [Note 3] [Note 3] ASSETS Current Cash – unrestricted 3,171 3,766 4,782 Cash – restricted [Note 5] 2,168 4,430 6,132 Accounts receivable [Note 6] 3,223 1,372 6,642 Inventory 23 191 215 Prepaid expenses and deferred charges 46 576 334 8,631 10,335 18,105 Capital Assets [Note 7] 110,110 119,617 114,228 Capital Assets Under Lease Obligation [Note 8] 214 246 251 110,324 119,863 114,479 118,955 130,198 132,584 LIABILITIES AND NET ASSETS Current Liabilities Accounts payable and accrued liabilities [Note 10] 779 2,518 1,822 Accrued employee termination benefits [Note 13(B)] 1,219 — — Current portion of obligations under capital lease [Note 9] 55 53 45 Due to the Province of Ontario 271 248 246 Deferred revenue 59 121 66 2,383 2,940 2,179 Long Term Liabilities Accrued employee severance liability [Note 13(B)] 167 743 717 Obligations under capital lease [Note 9] 139 195 219 306 938 936 Deferred Capital Contributions [Note 11] 8,428 17,935 12,522 Unspent Deferred Capital Contributions [Notes 5 & 11] 2,168 3,176 5,014 10,596 21,111 17,536 Net Assets Invested in capital assets [Note 12] 101,682 101,682 101,706 Unrestricted 3,988 3,527 10,227 105,670 105,209 111,933 118,955 130,198 132,584 Contingency [Note 17] See accompanying schedules and notes to financial statements.
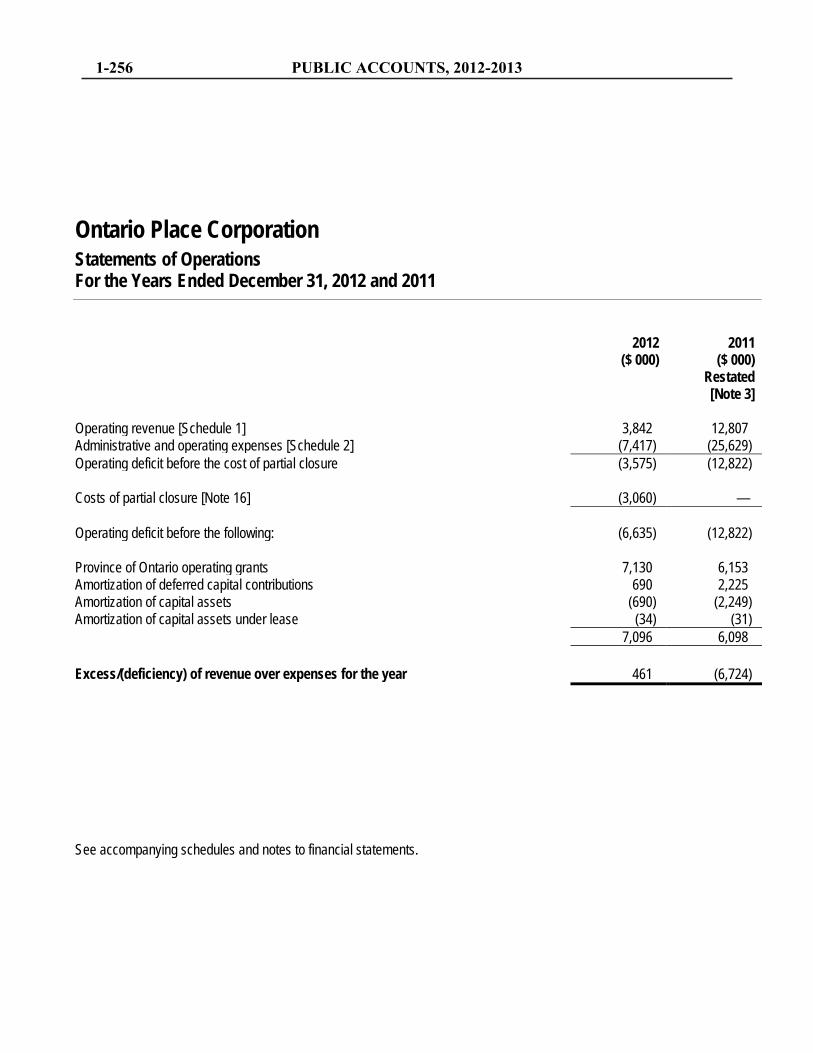
1-256 PUBLIC ACCOUNTS, 2012-2013
Ontario Place Corporation Statements of Operations For the Years Ended December 31, 2012 and 2011
2012 2011 ($ 000) ($ 000) Restated [Note 3] Operating revenue [Schedule 1] 3,842 12,807 Administrative and operating expenses [Schedule 2] (7,417) (25,629) Operating deficit before the cost of partial closure (3,575) (12,822) Costs of partial closure [Note 16] (3,060) — Operating deficit before the following: (6,635) (12,822) Province of Ontario operating grants 7,130 6,153 Amortization of deferred capital contributions 690 2,225 Amortization of capital assets (690) (2,249) Amortization of capital assets under lease (34) (31) 7,096 6,098 Excess/(deficiency) of revenue over expenses for the year 461 (6,724) See accompanying schedules and notes to financial statements.
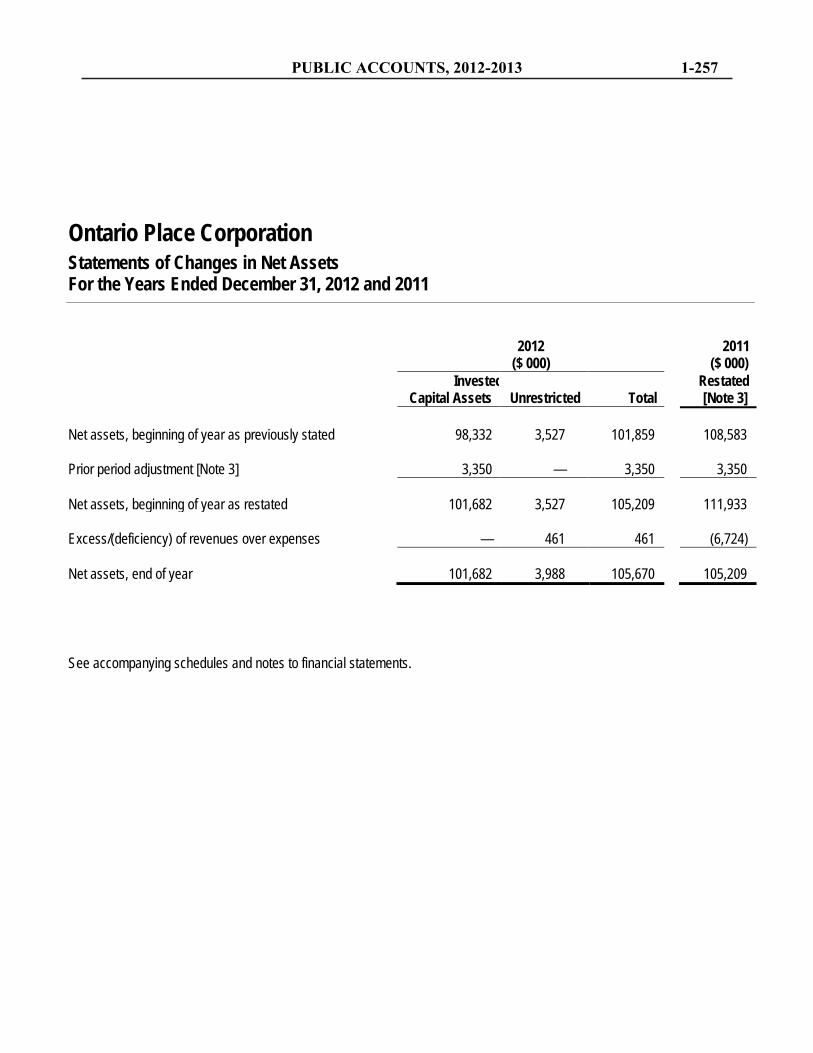
PUBLIC ACCOUNTS, 2012-2013 1-257
Ontario Place Corporation Statements of Changes in Net Assets For the Years Ended December 31, 2012 and 2011
2012
($ 000) 2011
($ 000) Invested
Capital Assets Unrestricted Total Restated
[Note 3] Net assets, beginning of year as previously stated 98,332 3,527 101,859 108,583 Prior period adjustment [Note 3] 3,350 — 3,350 3,350 Net assets, beginning of year as restated 101,682 3,527 105,209 111,933 Excess/(deficiency) of revenues over expenses — 461 461 (6,724) Net assets, end of year 101,682 3,988 105,670 105,209 See accompanying schedules and notes to financial statements.
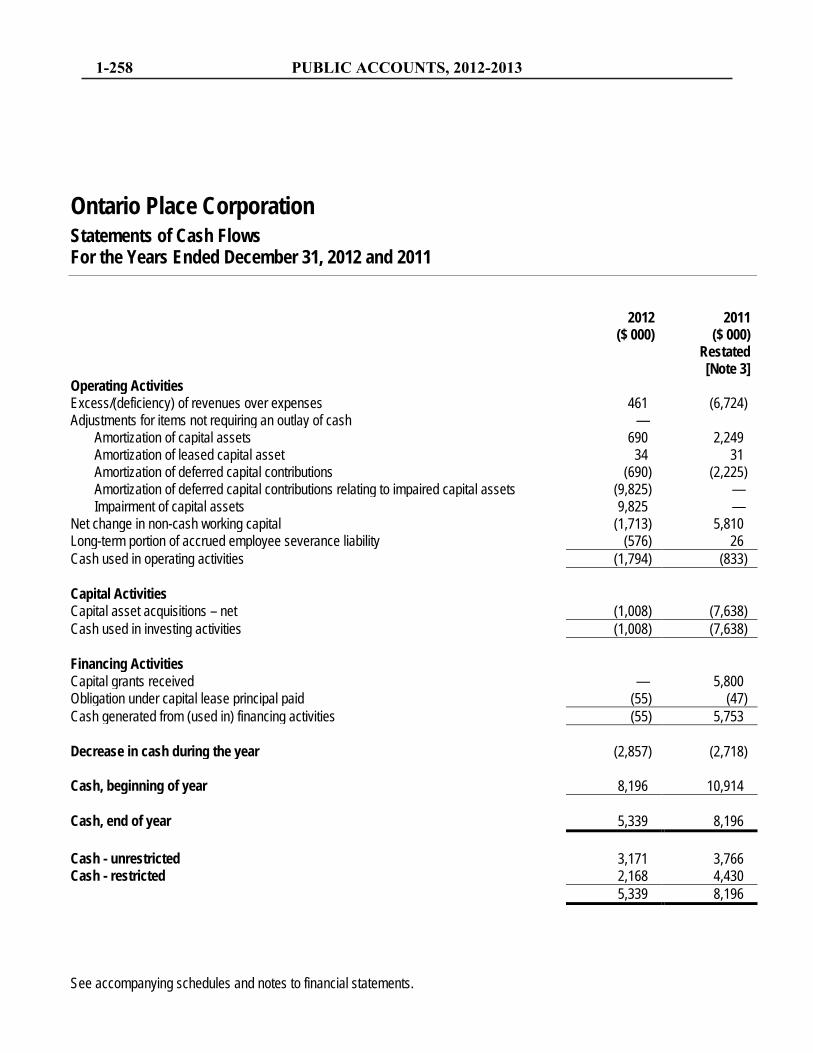
1-258 PUBLIC ACCOUNTS, 2012-2013
Ontario Place Corporation Statements of Cash Flows For the Years Ended December 31, 2012 and 2011
2012 2011 ($ 000) ($ 000) Restated [Note 3] Operating Activities Excess/(deficiency) of revenues over expenses 461 (6,724) Adjustments for items not requiring an outlay of cash —
Amortization of capital assets 690 2,249 Amortization of leased capital asset 34 31 Amortization of deferred capital contributions (690) (2,225) Amortization of deferred capital contributions relating to impaired capital assets (9,825) — Impairment of capital assets 9,825 —
Net change in non-cash working capital (1,713) 5,810 Long-term portion of accrued employee severance liability (576) 26 Cash used in operating activities (1,794) (833) Capital Activities Capital asset acquisitions – net (1,008) (7,638) Cash used in investing activities (1,008) (7,638) Financing Activities Capital grants received — 5,800 Obligation under capital lease principal paid (55) (47) Cash generated from (used in) financing activities (55) 5,753 Decrease in cash during the year (2,857) (2,718) Cash, beginning of year 8,196 10,914 Cash, end of year 5,339 8,196 Cash - unrestricted 3,171 3,766 Cash - restricted 2,168 4,430 5,339 8,196 See accompanying schedules and notes to financial statements.
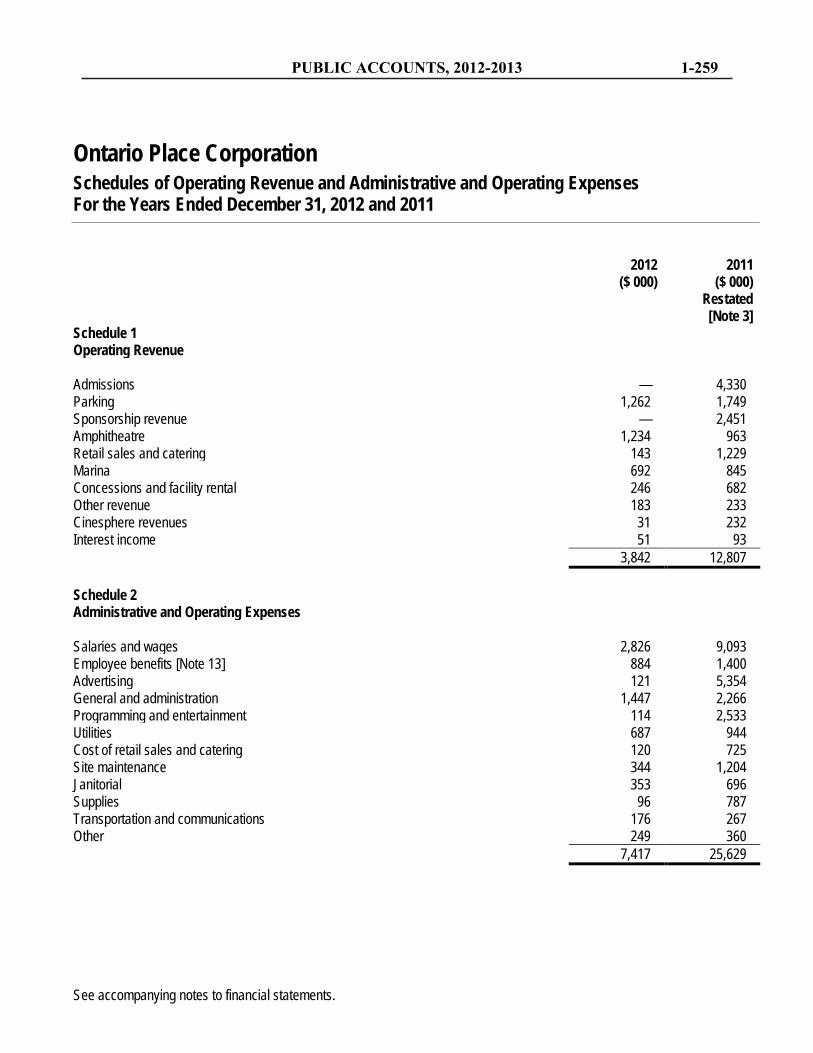
PUBLIC ACCOUNTS, 2012-2013 1-259
Ontario Place Corporation Schedules of Operating Revenue and Administrative and Operating Expenses For the Years Ended December 31, 2012 and 2011
2012 2011 ($ 000) ($ 000) Restated [Note 3] Schedule 1 Operating Revenue Admissions — 4,330 Parking 1,262 1,749 Sponsorship revenue — 2,451 Amphitheatre 1,234 963 Retail sales and catering 143 1,229 Marina 692 845 Concessions and facility rental 246 682 Other revenue 183 233 Cinesphere revenues 31 232 Interest income 51 93 3,842 12,807 Schedule 2 Administrative and Operating Expenses Salaries and wages 2,826 9,093 Employee benefits [Note 13] 884 1,400 Advertising 121 5,354 General and administration 1,447 2,266 Programming and entertainment 114 2,533 Utilities 687 944 Cost of retail sales and catering 120 725 Site maintenance 344 1,204 Janitorial 353 696 Supplies 96 787 Transportation and communications 176 267 Other 249 360 7,417 25,629 See accompanying notes to financial statements.
1-260 PUBLIC ACCOUNTS, 2012-2013
Ontario Place Corporation Notes to Financial Statements December 31, 2012 and 2011
1. Nature of Operations
The Ontario Place Corporation, (the “Corporation” or “Ontario Place”) is a provincial Crown agency, incorporated under the Ontario Place Corporation Act R.S.O. 1990. The Corporation is exempted from federal and provincial income taxes.
Up until February 1, 2012, the Corporation operated a park built on a 155-acre site extending through three islands created using landfill along the Toronto waterfront. The site was intended to provide visitors with an appreciation of the Province’s resources and accomplishments. The fees charged for the various services across the park were subject to approval by the Ministry of Tourism and Culture and Sport.
In addition to the various services operated by Ontario Place, the Corporation enters into a number of licence, ground lease and special event agreements with various private-sector companies.
On February 1, 2012 the Minister of Tourism, Culture and Sport announced the partial closure and revitalization of Ontario Place. It was announced that the following operations would remain open while plans for revitalizations were developed: Ontario Place Marina, Molson Canadian Amphitheatre, Atlantis Pavillion, and the parking lots. All other operations, including the Cinesphere, Waterpark, amusement rides and games and concession stands would be closed.
The Corporation receives grants from the Province to partially cover the costs of ongoing operations.
2. Conversion to Public Sector Accounting Standards
On January 1, 2012, the Corporation adopted Canadian generally accepted accounting principles for government not-for-profit organizations as recommended by the Public Sector Accounting Board ("PSAB") of the CPA Canada (formerly Canadian Institute of Chartered Accountants). These are the first financial statements prepared in accordance with PSAB standards.
In accordance with the transitional provisions in Public Sector Accounting Standards, the Corporation has adopted the changes retrospectively. The transition date is January 1, 2011 and all comparative information provided has been presented by applying public sector accounting standards. There were no transitional adjustments.
3. Restatement of Prior Year’s Financial Statements
In prior years, deferred capital contributions were not correctly amortized into income on the same basis that the underlying assets were amortized.
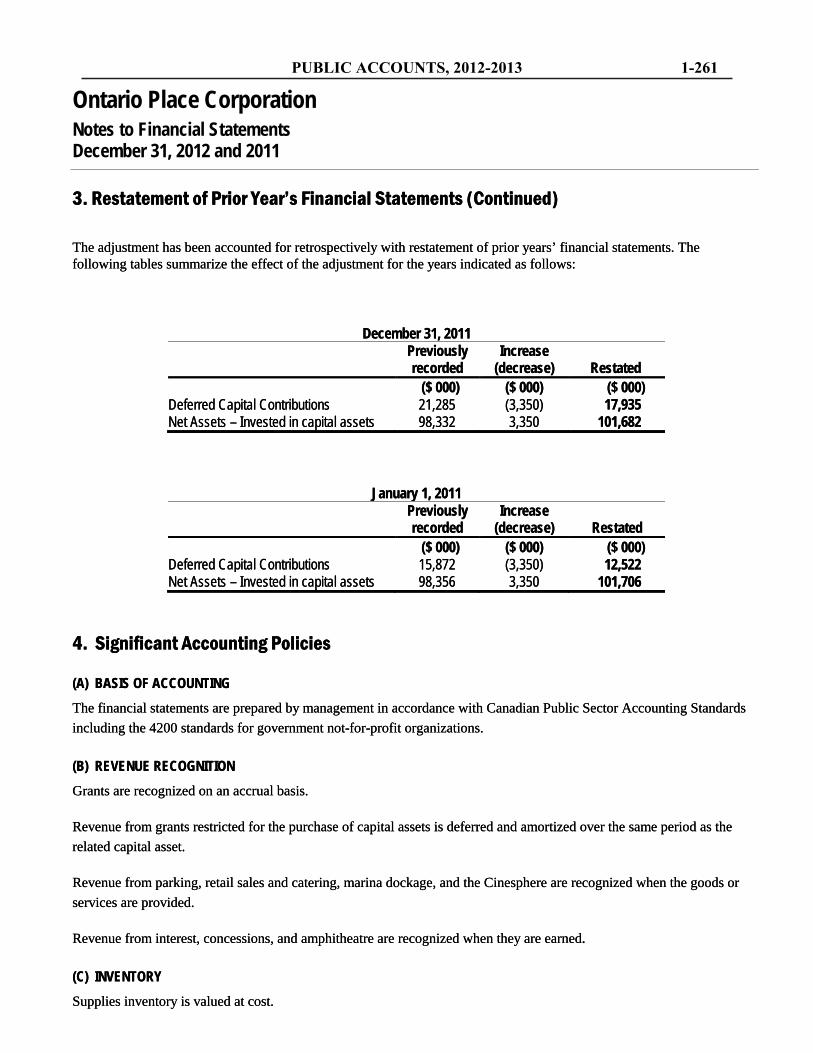
3. Restatement of Prior Year’s Financial Statements (Continued)
The adjustment has been accounted for retrospectively with restatement of prior years’ financial statements. The following tables summarize the effect of the adjustment for the years indicated as follows:
December 31, 2011
Previously recorded
Increase (decrease) Restated
($ 000) ($ 000) ($ 000) Deferred Capital Contributions 21,285 (3,350) 17,935 Net Assets – Invested in capital assets 98,332 3,350 101,682
January 1, 2011
Previously recorded
Increase (decrease) Restated
($ 000) ($ 000) ($ 000) Deferred Capital Contributions 15,872 (3,350) 12,522 Net Assets – Invested in capital assets 98,356 3,350 101,706
4. Significant Accounting Policies
(A) BASIS OF ACCOUNTING The financial statements are prepared by management in accordance with Canadian Public Sector Accounting Standards including the 4200 standards for government not-for-profit organizations.
(B) REVENUE RECOGNITION Grants are recognized on an accrual basis.
Revenue from grants restricted for the purchase of capital assets is deferred and amortized over the same period as the related capital asset.
Revenue from parking, retail sales and catering, marina dockage, and the Cinesphere are recognized when the goods or services are provided.
Revenue from interest, concessions, and amphitheatre are recognized when they are earned.
(C) INVENTORY Supplies inventory is valued at cost.
PUBLIC ACCOUNTS, 2012-2013 1-261
Ontario Place Corporation Notes to Financial Statements December 31, 2012 and 2011
3. Restatement of Prior Year’s Financial Statements (Continued)
The adjustment has been accounted for retrospectively with restatement of prior years’ financial statements. The following tables summarize the effect of the adjustment for the years indicated as follows:
December 31, 2011
Previously recorded
Increase (decrease) Restated
($ 000) ($ 000) ($ 000) Deferred Capital Contributions 21,285 (3,350) 17,935 Net Assets – Invested in capital assets 98,332 3,350 101,682
January 1, 2011
Previously recorded
Increase (decrease) Restated
($ 000) ($ 000) ($ 000) Deferred Capital Contributions 15,872 (3,350) 12,522 Net Assets – Invested in capital assets 98,356 3,350 101,706
4. Significant Accounting Policies
(A) BASIS OF ACCOUNTING The financial statements are prepared by management in accordance with Canadian Public Sector Accounting Standards including the 4200 standards for government not-for-profit organizations.
(B) REVENUE RECOGNITION Grants are recognized on an accrual basis.
Revenue from grants restricted for the purchase of capital assets is deferred and amortized over the same period as the related capital asset.
Revenue from parking, retail sales and catering, marina dockage, and the Cinesphere are recognized when the goods or services are provided.
Revenue from interest, concessions, and amphitheatre are recognized when they are earned.
(C) INVENTORY Supplies inventory is valued at cost.
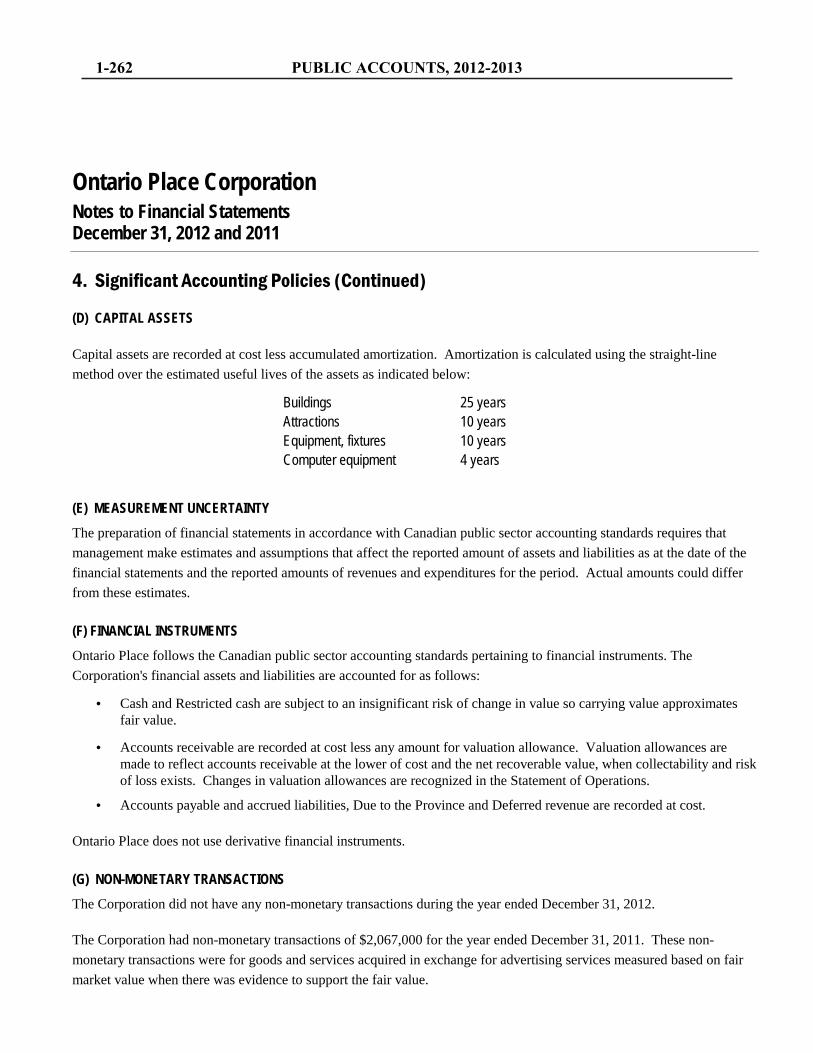
1-262 PUBLIC ACCOUNTS, 2012-2013
Ontario Place Corporation Notes to Financial Statements December 31, 2012 and 2011
4. Significant Accounting Policies (Continued)
(D) CAPITAL ASSETS
Capital assets are recorded at cost less accumulated amortization. Amortization is calculated using the straight-line method over the estimated useful lives of the assets as indicated below:
Buildings 25 years Attractions 10 years Equipment, fixtures 10 years Computer equipment 4 years
(E) MEASUREMENT UNCERTAINTY The preparation of financial statements in accordance with Canadian public sector accounting standards requires that management make estimates and assumptions that affect the reported amount of assets and liabilities as at the date of the financial statements and the reported amounts of revenues and expenditures for the period. Actual amounts could differ from these estimates.
(F) FINANCIAL INSTRUMENTS Ontario Place follows the Canadian public sector accounting standards pertaining to financial instruments. The Corporation's financial assets and liabilities are accounted for as follows:
• Cash and Restricted cash are subject to an insignificant risk of change in value so carrying value approximates fair value.
• Accounts receivable are recorded at cost less any amount for valuation allowance. Valuation allowances are made to reflect accounts receivable at the lower of cost and the net recoverable value, when collectability and risk of loss exists. Changes in valuation allowances are recognized in the Statement of Operations.
• Accounts payable and accrued liabilities, Due to the Province and Deferred revenue are recorded at cost.
Ontario Place does not use derivative financial instruments.
(G) NON-MONETARY TRANSACTIONS The Corporation did not have any non-monetary transactions during the year ended December 31, 2012.
The Corporation had non-monetary transactions of $2,067,000 for the year ended December 31, 2011. These non-monetary transactions were for goods and services acquired in exchange for advertising services measured based on fair market value when there was evidence to support the fair value.
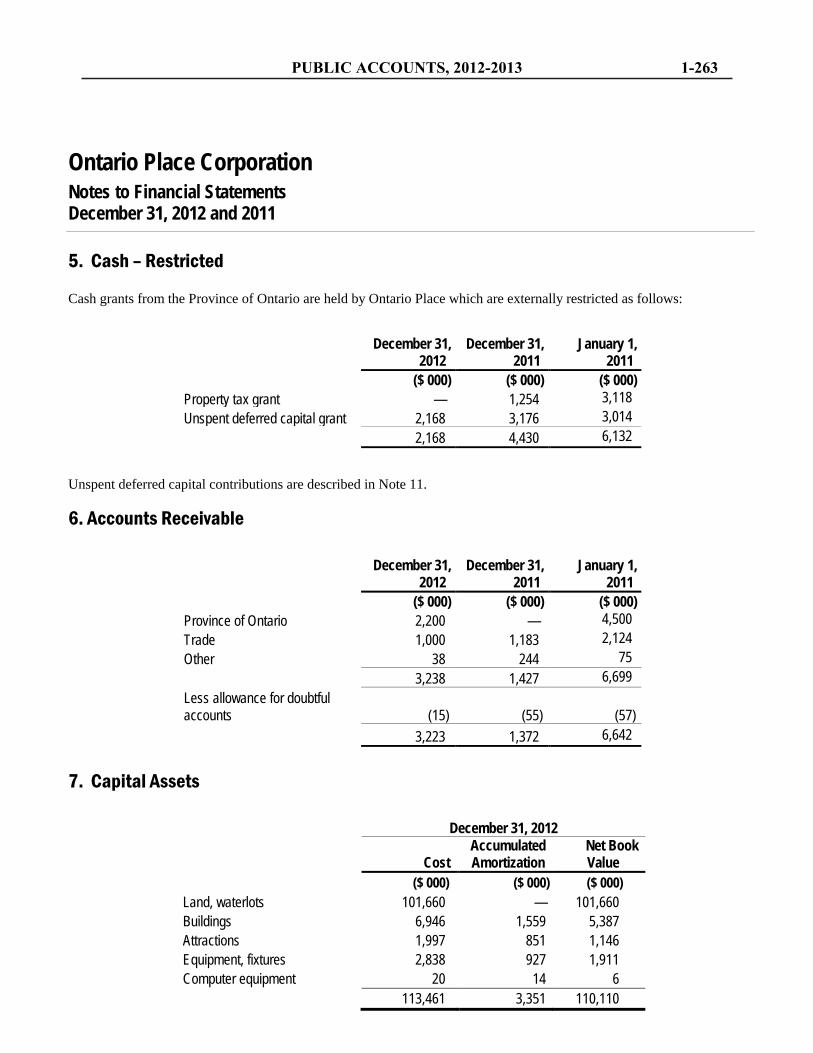
PUBLIC ACCOUNTS, 2012-2013 1-263
Ontario Place Corporation Notes to Financial Statements December 31, 2012 and 2011
5. Cash – Restricted
Cash grants from the Province of Ontario are held by Ontario Place which are externally restricted as follows:
December 31,
2012 December 31,
2011 January 1,
2011 ($ 000) ($ 000) ($ 000) Property tax grant — 1,254 3,118 Unspent deferred capital grant 2,168 3,176 3,014 2,168 4,430 6,132
Unspent deferred capital contributions are described in Note 11.
6. Accounts Receivable December 31,
2012 December 31,
2011 January 1,
2011 ($ 000) ($ 000) ($ 000) Province of Ontario 2,200 — 4,500 Trade 1,000 1,183 2,124 Other 38 244 75 3,238 1,427 6,699 Less allowance for doubtful accounts (15) (55)
(57)
3,223 1,372 6,642
7. Capital Assets December 31, 2012
Cost Accumulated Amortization
Net Book Value
($ 000) ($ 000) ($ 000) Land, waterlots 101,660 — 101,660 Buildings 6,946 1,559 5,387 Attractions 1,997 851 1,146 Equipment, fixtures 2,838 927 1,911 Computer equipment 20 14 6
113,461 3,351 110,110
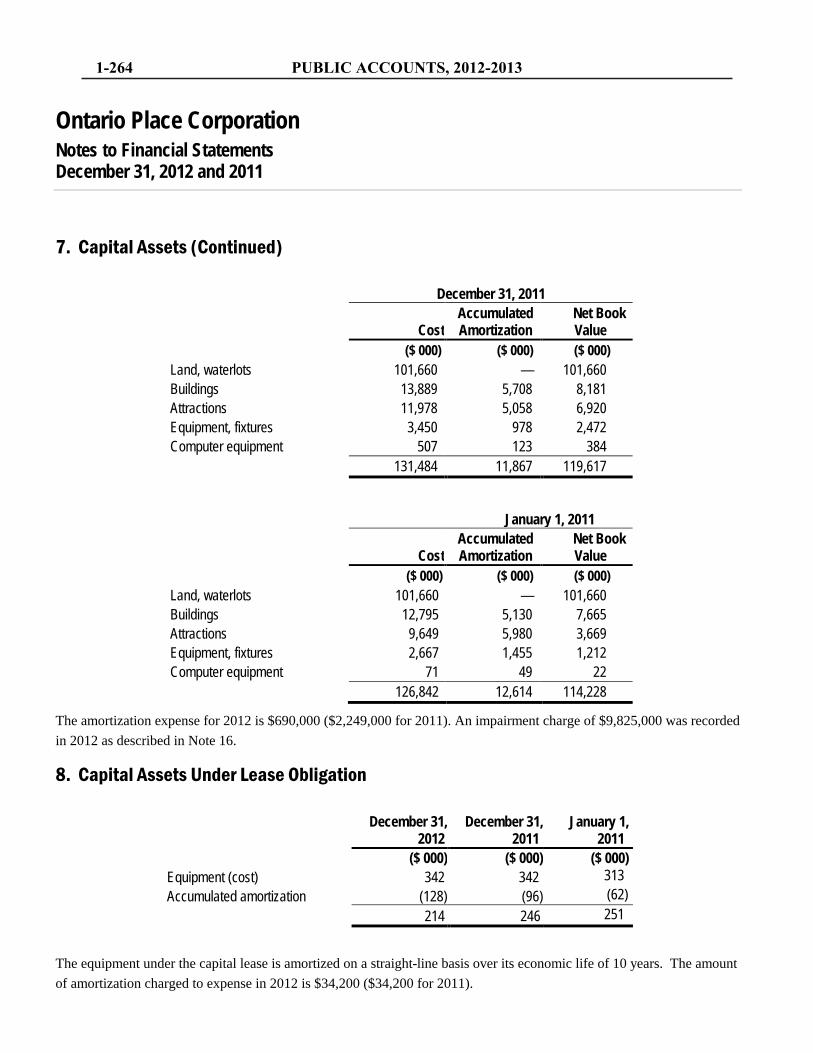
1-264 PUBLIC ACCOUNTS, 2012-2013
Ontario Place Corporation Notes to Financial Statements December 31, 2012 and 2011
7. Capital Assets (Continued)
December 31, 2011
Cost Accumulated Amortization
Net Book Value
($ 000) ($ 000) ($ 000) Land, waterlots 101,660 — 101,660 Buildings 13,889 5,708 8,181 Attractions 11,978 5,058 6,920 Equipment, fixtures 3,450 978 2,472 Computer equipment 507 123 384 131,484 11,867 119,617
January 1, 2011
Cost Accumulated Amortization
Net Book Value
($ 000) ($ 000) ($ 000) Land, waterlots 101,660 — 101,660 Buildings 12,795 5,130 7,665 Attractions 9,649 5,980 3,669 Equipment, fixtures 2,667 1,455 1,212 Computer equipment 71 49 22 126,842 12,614 114,228
The amortization expense for 2012 is $690,000 ($2,249,000 for 2011). An impairment charge of $9,825,000 was recorded in 2012 as described in Note 16.
8. Capital Assets Under Lease Obligation December 31,
2012 December 31,
2011 January 1,
2011 ($ 000) ($ 000) ($ 000) Equipment (cost) 342 342 313 Accumulated amortization (128) (96) (62) 214 246 251
The equipment under the capital lease is amortized on a straight-line basis over its economic life of 10 years. The amount of amortization charged to expense in 2012 is $34,200 ($34,200 for 2011).
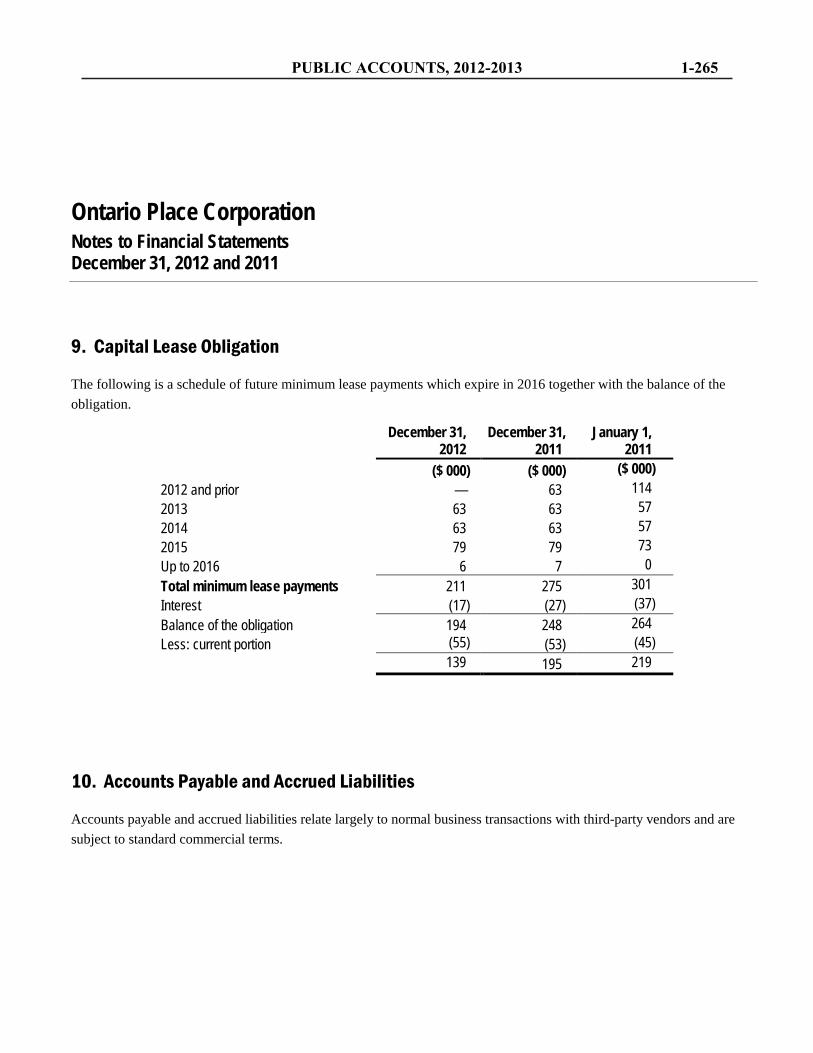
PUBLIC ACCOUNTS, 2012-2013 1-265
Ontario Place Corporation Notes to Financial Statements December 31, 2012 and 2011
9. Capital Lease Obligation
The following is a schedule of future minimum lease payments which expire in 2016 together with the balance of the obligation.
December 31, 2012
December 31, 2011
January 1, 2011
($ 000) ($ 000) ($ 000) 2012 and prior — 63 114 2013 63 63 57 2014 63 63 57 2015 79 79 73 Up to 2016 6 7 0 Total minimum lease payments 211 275 301 Interest (17) (27) (37) Balance of the obligation 194 248 264 Less: current portion (55) (53) (45) 139 195 219
10. Accounts Payable and Accrued Liabilities
Accounts payable and accrued liabilities relate largely to normal business transactions with third-party vendors and are subject to standard commercial terms.
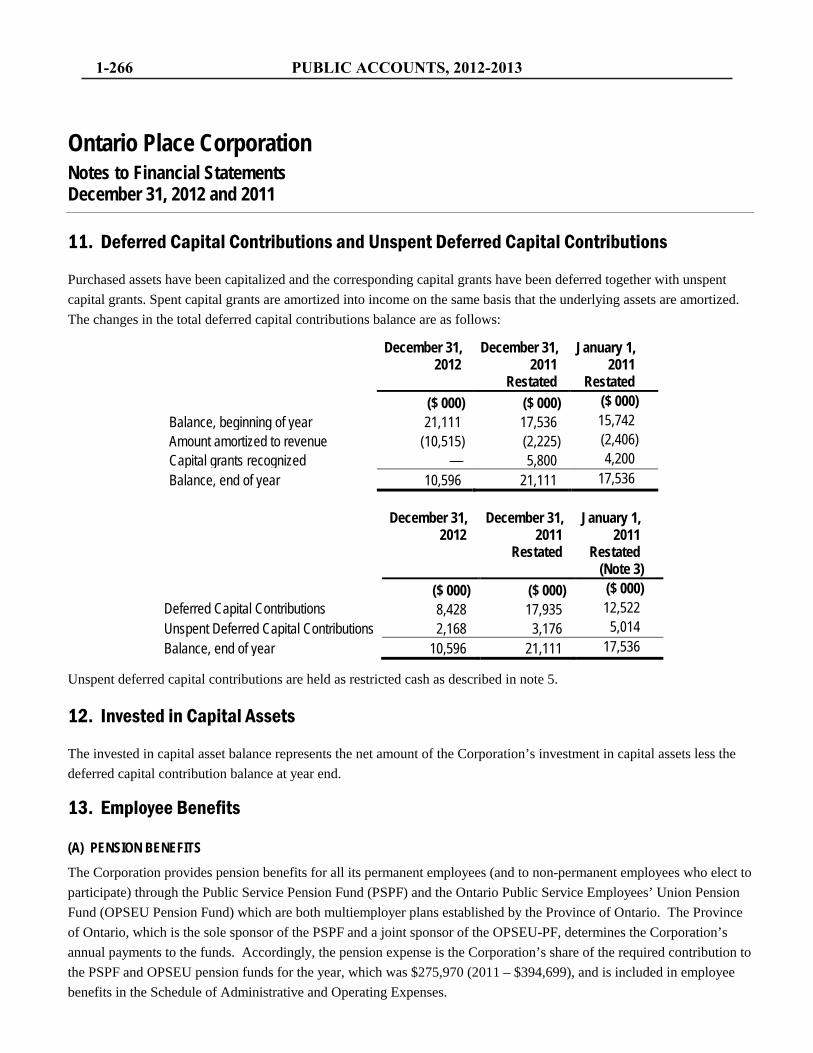
1-266 PUBLIC ACCOUNTS, 2012-2013
Ontario Place Corporation Notes to Financial Statements December 31, 2012 and 2011
11. Deferred Capital Contributions and Unspent Deferred Capital Contributions
Purchased assets have been capitalized and the corresponding capital grants have been deferred together with unspent capital grants. Spent capital grants are amortized into income on the same basis that the underlying assets are amortized. The changes in the total deferred capital contributions balance are as follows:
December 31,
2012 December 31,
2011 Restated
January 1, 2011
Restated ($ 000) ($ 000) ($ 000) Balance, beginning of year 21,111 17,536 15,742 Amount amortized to revenue (10,515) (2,225) (2,406) Capital grants recognized — 5,800 4,200 Balance, end of year 10,596 21,111 17,536
December 31,
2012 December 31,
2011 Restated
January 1, 2011
Restated (Note 3)
($ 000) ($ 000) ($ 000) Deferred Capital Contributions 8,428 17,935 12,522 Unspent Deferred Capital Contributions 2,168 3,176 5,014 Balance, end of year 10,596 21,111 17,536
Unspent deferred capital contributions are held as restricted cash as described in note 5.
12. Invested in Capital Assets
The invested in capital asset balance represents the net amount of the Corporation’s investment in capital assets less the deferred capital contribution balance at year end.
13. Employee Benefits
(A) PENSION BENEFITS The Corporation provides pension benefits for all its permanent employees (and to non-permanent employees who elect to participate) through the Public Service Pension Fund (PSPF) and the Ontario Public Service Employees’ Union Pension Fund (OPSEU Pension Fund) which are both multiemployer plans established by the Province of Ontario. The Province of Ontario, which is the sole sponsor of the PSPF and a joint sponsor of the OPSEU-PF, determines the Corporation’s annual payments to the funds. Accordingly, the pension expense is the Corporation’s share of the required contribution to the PSPF and OPSEU pension funds for the year, which was $275,970 (2011 – $394,699), and is included in employee benefits in the Schedule of Administrative and Operating Expenses.
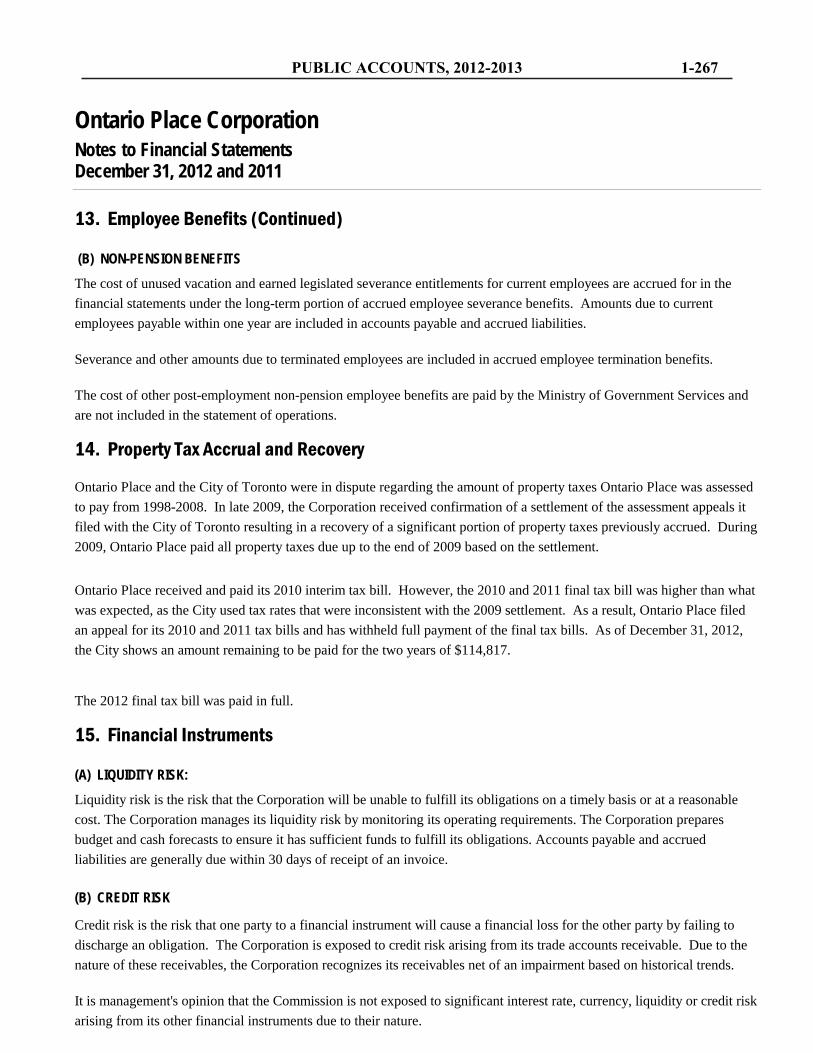
PUBLIC ACCOUNTS, 2012-2013 1-267
Ontario Place Corporation Notes to Financial Statements December 31, 2012 and 2011
13. Employee Benefits (Continued)
(B) NON-PENSION BENEFITS The cost of unused vacation and earned legislated severance entitlements for current employees are accrued for in the financial statements under the long-term portion of accrued employee severance benefits. Amounts due to current employees payable within one year are included in accounts payable and accrued liabilities.
Severance and other amounts due to terminated employees are included in accrued employee termination benefits.
The cost of other post-employment non-pension employee benefits are paid by the Ministry of Government Services and are not included in the statement of operations.
14. Property Tax Accrual and Recovery
Ontario Place and the City of Toronto were in dispute regarding the amount of property taxes Ontario Place was assessed to pay from 1998-2008. In late 2009, the Corporation received confirmation of a settlement of the assessment appeals it filed with the City of Toronto resulting in a recovery of a significant portion of property taxes previously accrued. During 2009, Ontario Place paid all property taxes due up to the end of 2009 based on the settlement.
Ontario Place received and paid its 2010 interim tax bill. However, the 2010 and 2011 final tax bill was higher than what was expected, as the City used tax rates that were inconsistent with the 2009 settlement. As a result, Ontario Place filed an appeal for its 2010 and 2011 tax bills and has withheld full payment of the final tax bills. As of December 31, 2012, the City shows an amount remaining to be paid for the two years of $114,817.
The 2012 final tax bill was paid in full.
15. Financial Instruments
(A) LIQUIDITY RISK: Liquidity risk is the risk that the Corporation will be unable to fulfill its obligations on a timely basis or at a reasonable cost. The Corporation manages its liquidity risk by monitoring its operating requirements. The Corporation prepares budget and cash forecasts to ensure it has sufficient funds to fulfill its obligations. Accounts payable and accrued liabilities are generally due within 30 days of receipt of an invoice.
(B) CREDIT RISK
Credit risk is the risk that one party to a financial instrument will cause a financial loss for the other party by failing to discharge an obligation. The Corporation is exposed to credit risk arising from its trade accounts receivable. Due to the nature of these receivables, the Corporation recognizes its receivables net of an impairment based on historical trends.
It is management's opinion that the Commission is not exposed to significant interest rate, currency, liquidity or credit risk arising from its other financial instruments due to their nature.
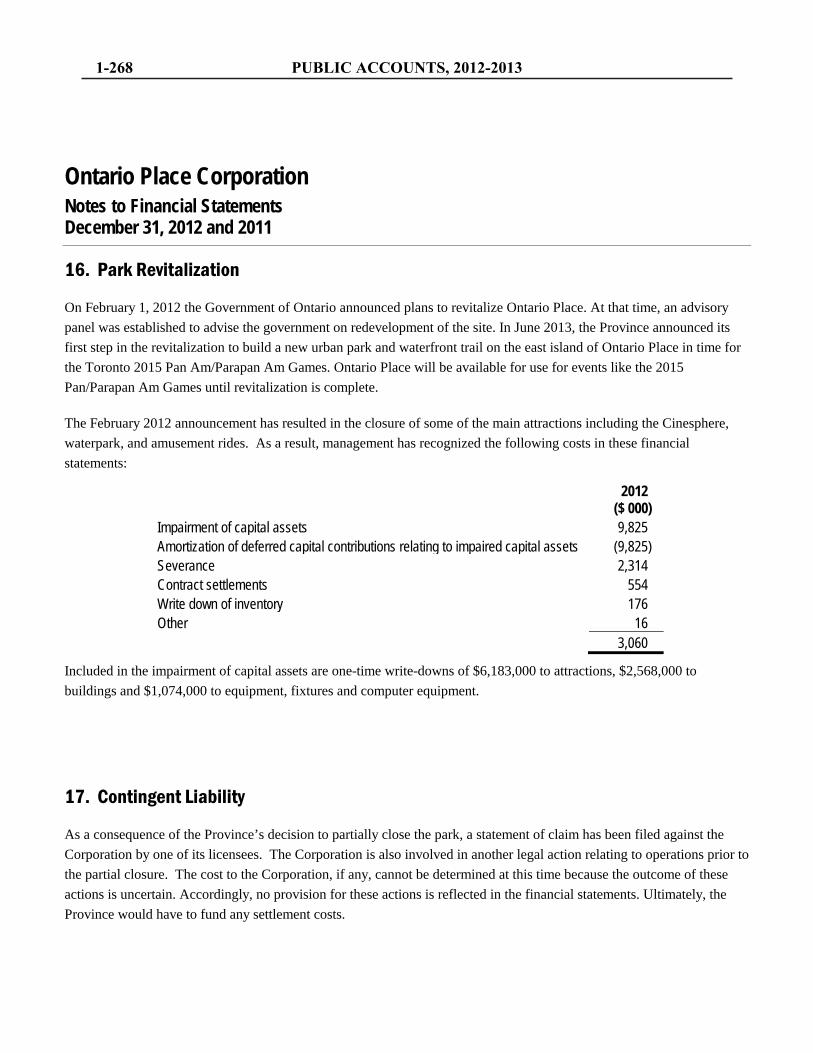
1-268 PUBLIC ACCOUNTS, 2012-2013
Ontario Place Corporation Notes to Financial Statements December 31, 2012 and 2011
16. Park Revitalization
On February 1, 2012 the Government of Ontario announced plans to revitalize Ontario Place. At that time, an advisory panel was established to advise the government on redevelopment of the site. In June 2013, the Province announced its first step in the revitalization to build a new urban park and waterfront trail on the east island of Ontario Place in time for the Toronto 2015 Pan Am/Parapan Am Games. Ontario Place will be available for use for events like the 2015 Pan/Parapan Am Games until revitalization is complete.
The February 2012 announcement has resulted in the closure of some of the main attractions including the Cinesphere, waterpark, and amusement rides. As a result, management has recognized the following costs in these financial statements:
2012 ($ 000)
Impairment of capital assets 9,825 Amortization of deferred capital contributions relating to impaired capital assets (9,825) Severance 2,314 Contract settlements 554 Write down of inventory 176 Other 16 3,060
Included in the impairment of capital assets are one-time write-downs of $6,183,000 to attractions, $2,568,000 to buildings and $1,074,000 to equipment, fixtures and computer equipment.
17. Contingent Liability
As a consequence of the Province’s decision to partially close the park, a statement of claim has been filed against the Corporation by one of its licensees. The Corporation is also involved in another legal action relating to operations prior to the partial closure. The cost to the Corporation, if any, cannot be determined at this time because the outcome of these actions is uncertain. Accordingly, no provision for these actions is reflected in the financial statements. Ultimately, the Province would have to fund any settlement costs.
KPMG LLP Telephone (416) 228-7000 Chartered Accountants Fax (416) 228-7123 Yonge Corporate Centre Internet www.kpmg.ca 4100 Yonge Street Suite 200 Toronto ON M2P 2H3 Canada
INDEPENDENT AUDITORS’ REPORT
To the Board of Directors of Ontario Power Authority We have audited the accompanying financial statements of Ontario Power Authority, which comprise the statements of financial position as at December 31, 2012, December 31, 2011 and January 1, 2011, the statements of operations, changes in net assets and cash flows for the years ended December 31, 2012 and December 31, 2011, and notes, comprising a summary of significant accounting policies and other explanatory information. Management’s Responsibility for the Financial Statements Management is responsible for the preparation and fair presentation of these financial statements in accordance with Canadian public sector accounting standards, and for such internal control as management determines is necessary to enable the preparation of financial statements that are free from material misstatement, whether due to fraud or error. Auditors’ Responsibility Our responsibility is to express an opinion on these financial statements based on our audits. We conducted our audits in accordance with Canadian generally accepted auditing standards. Those standards require that we comply with ethical requirements and plan and perform the audit to obtain reasonable assurance about whether the financial statements are free from material misstatement. An audit involves performing procedures to obtain audit evidence about the amounts and disclosures in the financial statements. The procedures selected depend on our judgment, including the assessment of the risks of material misstatement of the financial statements, whether due to fraud or error. In making those risk assessments, we consider internal control relevant to the entity’s preparation and fair presentation of the financial statements in order to design audit procedures that are appropriate in the circumstances, but not for the purpose of expressing an opinion on the effectiveness of the entity’s internal control. An audit also includes evaluating the appropriateness of accounting policies used and the reasonableness of accounting estimates made by management, as well as evaluating the overall presentation of the financial statements. We believe that the audit evidence we have obtained in our audits is sufficient and appropriate to provide a basis for our audit opinion.
KPMG LLIP is a Canadian limited liability partnership and a member firm of the KPMG Network of independent member firms affiliated with KPMG International Cooperative (“KPMG International”), a Swiss entity. KPMG Canada provides services to KPMG LLP.
PUBLIC ACCOUNTS, 2012-2013 1-269
Page 2 Opinion In our opinion, the financial statements present fairly, in all material respects, the financial position of Ontario Power Authority as at December 31, 2012, December 31, 2011 and January 1, 2011, and its results of operations, its changes in net assets and its cash flows for the years ended December 31, 2012 and December 31, 2011 in accordance with Canadian public sector accounting standards.
Chartered Accountants, Licensed Public Accountants February 20, 2013 Toronto, Canada
1-270 PUBLIC ACCOUNTS, 2012-2013
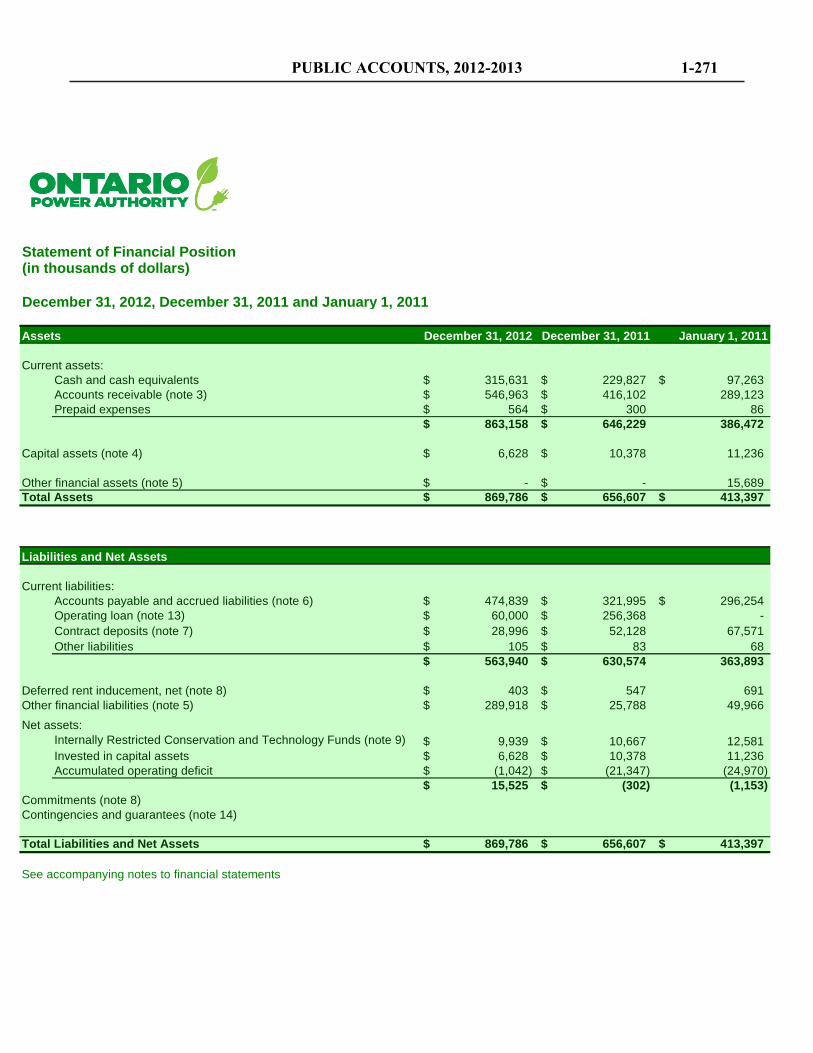
Statement of Financial Position(in thousands of dollars)
December 31, 2012, December 31, 2011 and January 1, 2011
Assets December 31, 2012 December 31, 2011 January 1, 2011
Current assets:Cash and cash equivalents 315,631$ 229,827$ 97,263$ Accounts receivable (note 3) 546,963$ 416,102$ 289,123 Prepaid expenses 564$ 300$ 86
863,158$ 646,229$ 386,472
Capital assets (note 4) 6,628$ 10,378$ 11,236
Other financial assets (note 5) -$ -$ 15,689 Total Assets 869,786$ 656,607$ 413,397$
Liabilities and Net Assets
Current liabilities:Accounts payable and accrued liabilities (note 6) 474,839$ 321,995$ 296,254$ Operating loan (note 13) 60,000$ 256,368$ - Contract deposits (note 7) 28,996$ 52,128$ 67,571 Other liabilities 105$ 83$ 68 Other liabilities 105$ 83$ 68
563,940$ 630,574$ 363,893
Deferred rent inducement, net (note 8) 403$ 547$ 691 Other financial liabilities (note 5) 289,918$ 25,788$ 49,966
Net assets:Internally Restricted Conservation and Technology Funds (note 9) 9,939$ 10,667$ 12,581 Invested in capital assets 6,628$ 10,378$ 11,236 Accumulated operating deficit (1,042)$ (21,347)$ (24,970)
15,525$ (302)$ (1,153) Commitments (note 8)Contingencies and guarantees (note 14)
Total Liabilities and Net Assets 869,786$ 656,607$ 413,397$
See accompanying notes to financial statements
PUBLIC ACCOUNTS, 2012-2013 1-271
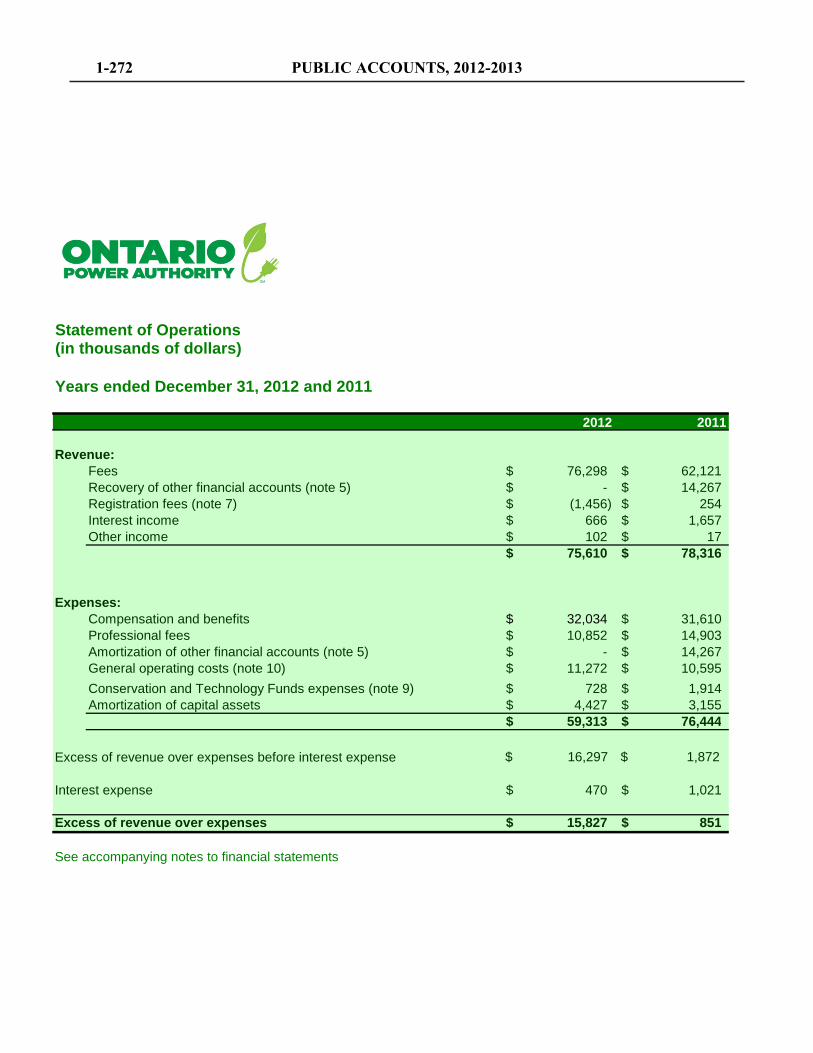
Statement of Operations(in thousands of dollars)
Years ended December 31, 2012 and 2011
2012 2011
Revenue:Fees 76,298$ 62,121$ Recovery of other financial accounts (note 5) -$ 14,267$ Registration fees (note 7) (1,456)$ 254$ Interest income 666$ 1,657$ Other income 102$ 17$
75,610$ 78,316$
Expenses:Compensation and benefits 32,034$ 31,610$ Professional fees 10,852$ 14,903$ Amortization of other financial accounts (note 5) -$ 14,267$ General operating costs (note 10) 11,272$ 10,595$
Conservation and Technology Funds expenses (note 9) 728$ 1,914$ Amortization of capital assets 4,427$ 3,155$ Amortization of capital assets 4,427$ 3,155$
59,313$ 76,444$
$ 16,297 $ 1,872
Interest expense 470$ 1,021$
Excess of revenue over expenses 15,827$ 851$
See accompanying notes to financial statements
Excess of revenue over expenses before interest expense
1-272 PUBLIC ACCOUNTS, 2012-2013
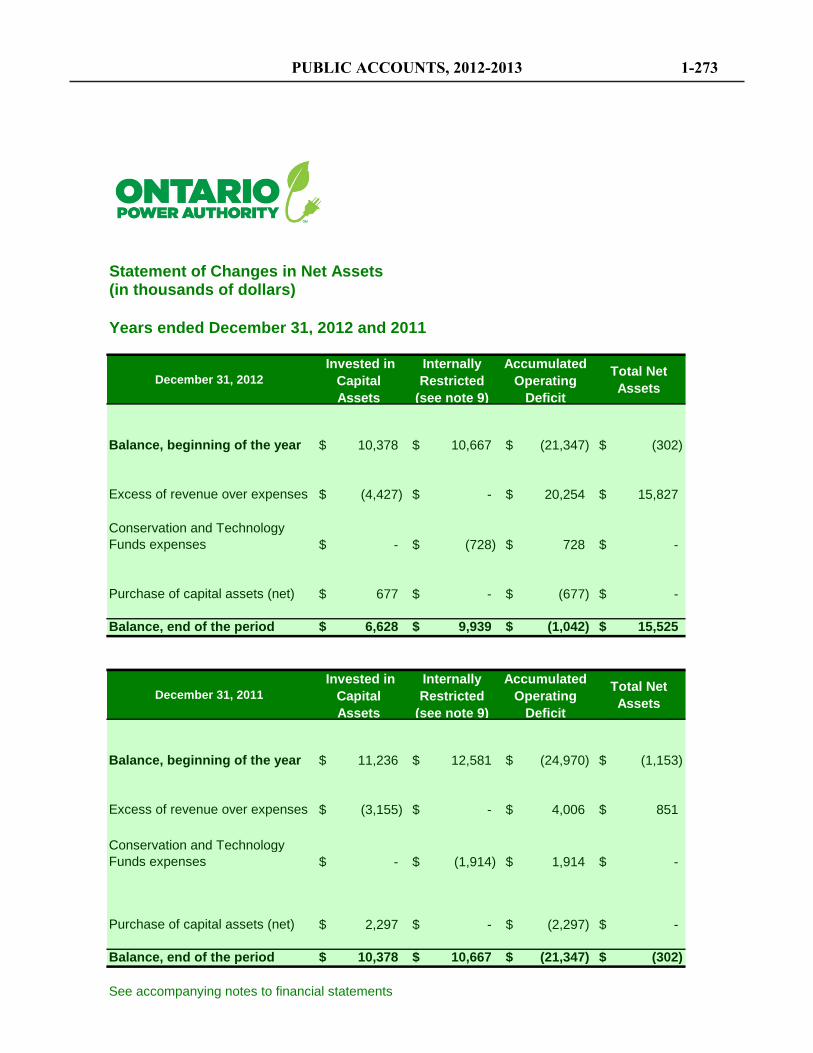
Statement of Changes in Net Assets(in thousands of dollars)
Years ended December 31, 2012 and 2011
December 31, 2012 Invested in
Capital Assets
Internally Restricted
(see note 9)
Accumulated Operating
Deficit
Total Net Assets
Balance, beginning of the year 10,378$ 10,667$ (21,347)$ (302)$
Excess of revenue over expenses (4,427)$ -$ 20,254$ 15,827$
Conservation and Technology Funds expenses -$ (728)$ 728$ -$
Purchase of capital assets (net) 677$ -$ (677)$ -$
Balance, end of the period 6,628$ 9,939$ (1,042)$ 15,525$
December 31, 2011 Invested in
Capital Assets
Internally Restricted
(see note 9)
Accumulated Operating
Deficit
Total Net Assets
Balance, beginning of the year 11,236$ 12,581$ (24,970)$ (1,153)$
Excess of revenue over expenses (3,155)$ -$ 4,006$ 851$
Conservation and Technology Funds expenses -$ (1,914)$ 1,914$ -$
Purchase of capital assets (net) 2,297$ -$ (2,297)$ -$
Balance, end of the period 10,378$ 10,667$ (21,347)$ (302)$
See accompanying notes to financial statements
PUBLIC ACCOUNTS, 2012-2013 1-273
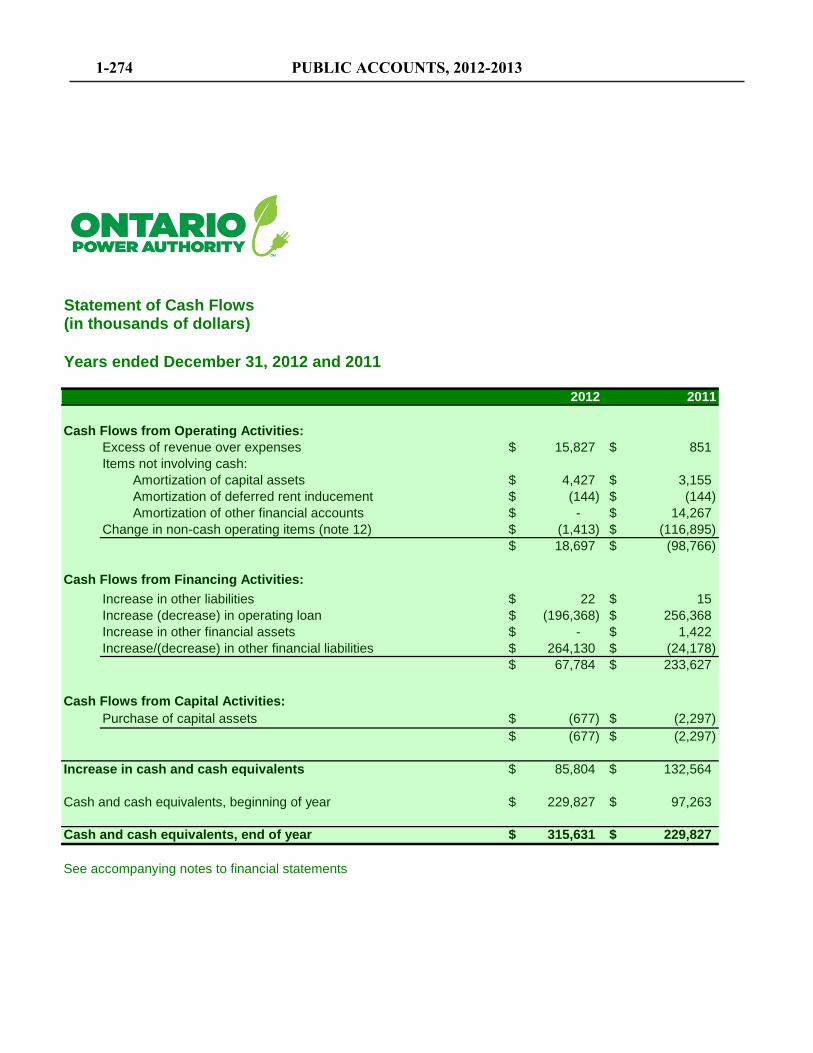
Statement of Cash Flows(in thousands of dollars)
Years ended December 31, 2012 and 2011
2012 2011
Cash Flows from Operating Activities:Excess of revenue over expenses 15,827$ 851$ Items not involving cash:
Amortization of capital assets 4,427$ 3,155$ Amortization of deferred rent inducement (144)$ (144)$ Amortization of other financial accounts -$ 14,267$
Change in non-cash operating items (note 12) (1,413)$ (116,895)$ 18,697$ (98,766)$
Cash Flows from Financing Activities:Increase in other liabilities 22$ 15$ Increase (decrease) in operating loan (196,368)$ 256,368$ Increase in other financial assets -$ 1,422$ Increase/(decrease) in other financial liabilities 264,130$ (24,178)$
67,784$ 233,627$
Cash Flows from Capital Activities:Purchase of capital assets (677)$ (2,297)$
(677)$ (2,297)$
Increase in cash and cash equivalents 85,804$ 132,564$
Cash and cash equivalents, beginning of year 229,827$ 97,263$
Cash and cash equivalents, end of year 315,631$ 229,827$
See accompanying notes to financial statements
1-274 PUBLIC ACCOUNTS, 2012-2013
Notes to Financial Statements(in thousands of dollars)
Years ended December 31, 2012 and 2011
1) Nature of operations:
�
�
�
�
�
� to engage in activities that promote electricity conservation and the efficient use of
electricity;
The Electricity Restructuring Act, 2004 (the Act), established the Ontario Power Authority (OPA) as a non-share corporation on December 20, 2004. The OPA is an independent non-profit, non-taxable corporation. The OPA is not a Crown agent and recovers its costs through fees approved by the Ontario Energy Board (OEB) and through charges to the electricity market through the global adjustment mechanism. In accordance with the Act, the OPA's main objectives are:
to engage in activities to faciliate the diversification of sources of electricity supply by promoting the use of cleaner energy sources and technologies, including alternative energy sources and renewable energy sources;to establish system-wide goals for electricity to be produced from alternative energy sources and renewable energy sources;
to forecast electricity demand and the adequacy and reliability of electricity resources for Ontario for the medium and long term;to conduct independent planning for electricity generation, demand management, conservation and transmission, and develop integrated power system plans for Ontario;to engage in activities in support of the goal of ensuring adequate, reliable and secure electricity supply and resources in Ontario;
�
�
�
�
to collect and provide to the public and the OEB information relating to medium and long-term electricity needs of Ontario and the adequacy and reliability of the integrated power system to meet those needs.
electricity;to assist the OEB by facilitating stability in rates for certain types of customers; and
the ability of the OPA to meet its obligations is provided for in legislation;
The OPA's ability to continue as a going concern is dependent upon its ability to obtain financing to support operations. The OPA's creditworthiness is attested by the following:
On January 1, 2011, the OPA adopted Canadian public sector accounting standards, ("PSAS"). The OPA has also elected to apply the 4200 standards for government not-for-profit organizations. These are the first financial statements prepared in accordance with PSAS.
In accordance with the transitional provisions in Canadian PSAS, the OPA has adopted changes retrospectively, subject to certain exemptions allowed under these standards. The transition date is January 1, 2011 and all comparative information provided has been presented by applying Canadian PSAS.
There are no adjustments to net assets as at January 1, 2011 or excess of revenue over expenses for the year ended December 31, 2011 as a result of the transition to Canadian PSAS.
During 2012 the Province of Ontario announced a plan to merge the OPA and the IESO. In October 2012, the Premier prorogued parliament thereby terminating the legislation to enact the merger. The likelihood of such a merger is indeterminable at this time.
the OPA's minimal counterparty risk, given that its principal counterparty is the Independent
Electricity System Operator (IESO), a creation of the province and a strong counterparty.
PUBLIC ACCOUNTS, 2012-2013 1-275
Notes to Financial Statements(in thousands of dollars)
Years ended December 31, 2012 and 2011
2) Significant accounting policies:
(a) Basis of presentation:
(b) Revenue recognition:
(c) Cash and cash equivalents:
Amounts received in the current year that relate to services and programs to be determined in subsequent years are not recognized as revenue and are deferred.
The financial statements have been prepared in accordance with Canadian PSAS including the 4200 standards for government not-for-profit organizations.
Fees earned by the OPA are based upon OEB-approved rates for electricity withdrawn from the IESO-controlled grid by electricity consumers of Ontario. Such revenue is recognized in the year in which it is earned.
Cash and cash equivalents are comprised of bank deposit balances, term deposits and other short-term investments with original maturity dates of up to 90 days.
(d) Capital assets:
Assets Estimated Average Service life
Furniture and equipment 10 years
Computer hardware 4 years
Computer software 3 to 5 years
Audio-visual equipment 10 years
Telephone system 5 years
Leasehold improvements Term of lease
other short-term investments with original maturity dates of up to 90 days.
Capital assets are recorded at cost and are amortized on a straight-line basis over their estimated service lives, as follows:
1-276 PUBLIC ACCOUNTS, 2012-2013
Notes to Financial Statements(in thousands of dollars)
Years ended December 31, 2012 and 2011
2) Significant accounting policies (continued):(e) Employee pension benefits:
(f) Measurement uncertainty:
The OPA provides pension benefits to its full-time employees through participation in the Public Service Pension Plan, which is a multi-employer defined benefit pension plan. This plan is accounted for as a defined contribution plan, as the OPA does not have sufficient information to apply defined benefit plan accounting to this pension plan.
The OPA is not responsible for the cost of employee post-retirement, non-pension benefits. These costs are the responsibility of the Ontario Pension Board.
Uncertainty in determining the amount at which an item is recognized in the financial statements is known as measurement uncertainty. Such uncertainty exists when it is reasonably possible that there could be a material variance between the recognized amount and another reasonably possible amount, as there is whenever estimates are used. Measurements of uncertainty in these financial statements exist in the valuation of
The preparation of financial statements requires management to make estimates and assumptions that affect the reported amounts of assets, liabilities and disclosures of contingent assets and liabilities at the date of the financial statements and the reported amounts of revenue and expenses during the year. Actual results could differ from those estimates.
used. Measurements of uncertainty in these financial statements exist in the valuation of the power purchase contracts and the estimated defeasance date for the OPA's obligations. Estimates are based on the best information available at the time of preparation of the financial statements and are updated annually to reflect new information as it becomes available.
PUBLIC ACCOUNTS, 2012-2013 1-277
Notes to Financial Statements(in thousands of dollars)
Years ended December 31, 2012 and 2011
3) Accounts receivable:
December 31, 2012
December 31, 2011
January 1, 2011
Market contracts
Generation contracts 474,424$ 326,049$ 187,789$
Conservation contracts 54,382 87,077 98,059
Renewable energy contracts 12,555 2,156 1,126
541,361 415,282 286,974
Other 262 820 1,232
HST/GST Receivable 5,340 - 917546,963$ 416,102$ 289,123$
1-278 PUBLIC ACCOUNTS, 2012-2013
Notes to Financial Statements(in thousands of dollars)
Years ended December 31, 2012 and 2011
4) Capital assets:
Accumulated Net book
December 31, 2012 Cost amortization value
Furniture and equipment 3,372$ 1,870$ 1,502$
Computer hardware 4,830 4,606 224
Computer software 7,440 4,982 2,458
Audio-visual equipment 229 150 79
Telephone system 382 350 32
Leasehold improvements 5,133 2,800 2,333
21,386$ 14,758$ 6,628$
Accumulated Net book
December 31, 2011 Cost amortization value
Furniture and equipment 3,360 1,543 1,817
Computer hardware 4,697 4,076 621
Computer software 6,966 2,325 $ 4,641
Audio-visual equipment 229 127 102 Audio-visual equipment 229 127 102
Telephone system 382 284 98
Leasehold improvements 5,075 1,976 3,099
20,709$ 10,331$ 10,378$
Accumulated Net book
January 1, 2011 Cost amortization value
Furniture and equipment 3,277 1,218 2,059
Computer hardware 4,405 3,075 1,330
Computer software 4,623 537 4,086
Audio-visual equipment 229 104 125
Telephone system 338 195 143
Leasehold improvements 5,047 1,554 3,493
17,919$ 6,683$ 11,236$
PUBLIC ACCOUNTS, 2012-2013 1-279
Notes to Financial Statements(in thousands of dollars)
Years ended December 31, 2012 and 2011
5) Other financial assets and liabilities:
December 31, 2012
December 31, 2011
January 1, 2011
Other financial assets -$ -$ 15,689$
Other financial liabilities (289,918) (25,788) (49,966)
RPP variance accounts
While prices for RPP consumers are set every six months by the OEB based upon a forecast of the cost of power over the next year, it is likely that there will be a difference between the actual and forecast cost of supplying electricity to all RPP consumers. When the hourly Ontario
Other financial assets, liabilities and deferrals arise as a result of the Electricity Act, 1998 and the regulations thereunder and are reflected by the balances in the Regulated Price Plan (RPP), retailer contract settlement deferral accounts, government procurement deferral account and the global adjustment account. In the absence of rate-regulated accounting, these amounts would have flowed through the statement of operations when incurred.
2012 2011
OPG rebate contribution (602,736)$ (602,750)$ Total RPP variance before interest 299,896 562,467 Interest earned 12,922 14,495
(289,918)$ (25,788)$
actual and forecast cost of supplying electricity to all RPP consumers. When the hourly Ontario energy price (HOEP) is greater than the RPP, the OPA pays the excess amount and records a financial asset as the electricity market funds paid are receivable from the market. When the HOEP is less than the RPP, the OPA receives the difference and records a financial liability as the funds received will be returned to the market. The OPA tracks this variance in the RPP variance account. The Ontario Power Generation (OPG) rebate is equivalent to the difference between the revenue limit for specific OPG generating facilities and the revenue OPG actually received in the IESO wholesale spot market for that generation.
1-280 PUBLIC ACCOUNTS, 2012-2013
Notes to Financial Statements(in thousands of dollars)
Years ended December 31, 2012 and 2011
5) Other financial assets and liabilities (continued):
Retailer contract settlement deferral accounts
Global adjustment account
The contracts to which the retailer settlement accounts relate have expired. The balances in these accounts have been recovered over a three-year period from 2009 - 2011. The OPA finished amortizing the accumulated balance in 2011. The amortization expense for 2012 is $nil (2011 - $14,267)
As at December 31, 2012, the balance in the retailer contract settlement and retailer contract discount settlement accounts was nil (December 31, 2011 - nil; January 1, 2011 - $15,689). As at January 1, 2011, the balance was $15,689 which was comprised of amounts related to retailer contract settlement accounts for 2005 – 2009 - $17,014, 2010 - $359 and 2011 – NIL. There was also a retailer contract discount settlement amount as at Jan 1, 2011 amounting to $1,684
The retailer contract discount settlement account captures the funds related to the retailer incentives existing at the creation of the RPP. The retailer incentives captured were held in a separate deferral account for settlement concurrent with the retailer settlement deferral accounts.
Global adjustment account
The OPA has a legislated responsibility to record the transactions flowing through the global adjustment mechanism. The global adjustment and settlement accounts have been created for this purpose. The nature of the global adjustment transactions result in a zero balance in the account on a monthly basis. The information and explanation below provide transparency for the transactions flowing through the global adjustment mechanism.
The global adjustment and settlement accounts record charges that flow between the OPA and the IESO. The account flows include the amounts paid and received for: Demand Response 2, Demand Response 3, non-utility generation, regulated nuclear generation balancing amount and regulated hydro electric generation balancing amount. These accounts are settled simultaneously by the IESO. The account also records the amounts paid and received for OPA contracts (standard offer, generation and conservation/demand management, Feed-In Tariff and hydroelectric contract initiatives) which the OPA settles on a monthly basis with the IESO.
PUBLIC ACCOUNTS, 2012-2013 1-281
Notes to Financial Statements(in thousands of dollars)
Years ended December 31, 2012 and 2011
6) Accounts payable and accrued liabilities:
December 31, 2012
December 31, 2011
January 1, 2011
Accrued contract settlements 211,522$ 12,942 189,002
HST/GST payable - 128 -
Other accrued liabilities 263,317 308,925 107,252474,839 321,995 296,254
1-282 PUBLIC ACCOUNTS, 2012-2013
Notes to Financial Statements(in thousands of dollars)
Years ended December 31, 2012 and 2011
7) Contract deposits:
Program Deposits:The OPA receives performance security in the form of deposit amounts received from renewable energy supply, Feed-In Tarrif (FIT) Program and demand response suppliers. For suppliers engaged in a contract which involves the construction of a new supply facility, the deposits are larger during the construction phase and are reduced once a project commences commercial operations. Deposits related to the FIT Program are submitted to the OPA with the supplier application and can be returned if one of the following occurs: (a) the supplier withdraws their application from the Program; (b) the supplier obtains a contract with the OPA; or (c) the supplier's application is rejected by the OPA.
The deposits are classified as current liabilities as they can be replaced by a letter of credit by the supplier on request.
Program Registration Fees:The OPA also requires a non-refundable registration fee from applicants to some renewable energy programs. Changes to FIT Program rules in 2012 affected the existing applicants to this program. As a result, the registration fees were made available for refund. Refunds were recorded as debits to the registration fee income account resulting in a negative balance.
8) Deferred rent inducement and operating lease commitments:
Lease Commitments
1,652
1,650
1,294 4,596$
The OPA reports an average rental cost for premises over the term of the lease agreement and amortizes the benefit of the lease inducements over the same period. As at December 31, 2012, the accrued liability was $189 (December 31, 2011 - $250 and January 1, 2011 - $321).
2014
2015
2013
The OPA has entered into various long-term lease commitments for office space, which include lease inducements. Deferred rent inducement represents the benefit of operating lease inducements amortized on a straight-line basis over the term of the lease. The OPA obtained an allowance for leasehold improvements of $1,430. As at December 31, 2012, the deferred rent inducement, net of amortization, was $403 (December 31, 2011 - $547 and January 1, 2011 - $691).
Lease commitments are set to terminate by October 2015. Lease commitments include amounts for leased computer hardware. Computer hardware commitments terminate between 2012-2013. The minimum annual payments under the operating lease are approximated as follows:
PUBLIC ACCOUNTS, 2012-2013 1-283
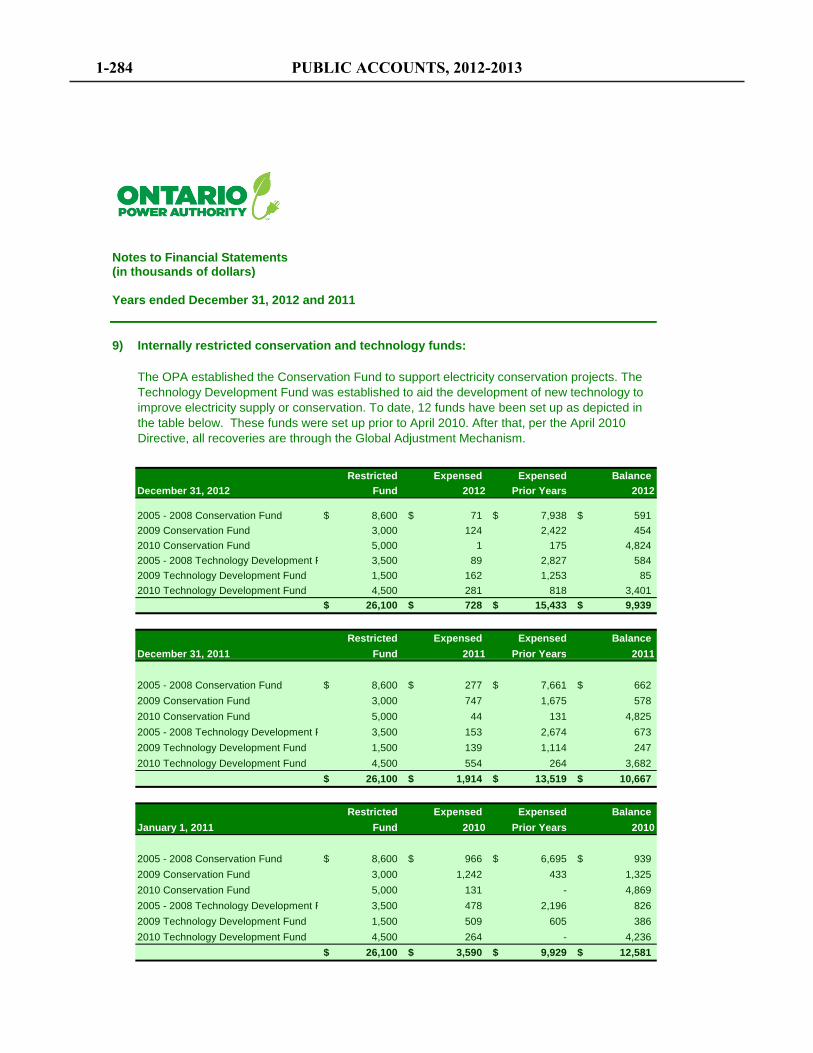
Notes to Financial Statements(in thousands of dollars)
Years ended December 31, 2012 and 2011
9) Internally restricted conservation and technology funds:
Restricted Expensed Expensed Balance December 31, 2012 Fund 2012 Prior Years 2012
2005 - 2008 Conservation Fund 8,600$ 71$ 7,938$ 591$
2009 Conservation Fund 3,000 124 2,422 454
2010 Conservation Fund 5,000 1 175 4,824
2005 - 2008 Technology Development Fund 3,500 89 2,827 584
2009 Technology Development Fund 1,500 162 1,253 85
2010 Technology Development Fund 4,500 281 818 3,401 26,100$ 728$ 15,433$ 9,939$
Restricted Expensed Expensed Balance
December 31, 2011 Fund 2011 Prior Years 2011
The OPA established the Conservation Fund to support electricity conservation projects. The Technology Development Fund was established to aid the development of new technology to improve electricity supply or conservation. To date, 12 funds have been set up as depicted in the table below. These funds were set up prior to April 2010. After that, per the April 2010 Directive, all recoveries are through the Global Adjustment Mechanism.
December 31, 2011 Fund 2011 Prior Years 2011
2005 - 2008 Conservation Fund 8,600$ 277$ 7,661$ 662$
2009 Conservation Fund 3,000 747 1,675 578
2010 Conservation Fund 5,000 44 131 4,825
2005 - 2008 Technology Development Fund 3,500 153 2,674 673
2009 Technology Development Fund 1,500 139 1,114 247
2010 Technology Development Fund 4,500 554 264 3,682
26,100$ 1,914$ 13,519$ 10,667$
Restricted Expensed Expensed Balance
January 1, 2011 Fund 2010 Prior Years 2010
2005 - 2008 Conservation Fund 8,600$ 966$ 6,695$ 939$
2009 Conservation Fund 3,000 1,242 433 1,325
2010 Conservation Fund 5,000 131 - 4,869
2005 - 2008 Technology Development Fund 3,500 478 2,196 826
2009 Technology Development Fund 1,500 509 605 386
2010 Technology Development Fund 4,500 264 - 4,236
26,100$ 3,590$ 9,929$ 12,581$
1-284 PUBLIC ACCOUNTS, 2012-2013
Notes to Financial Statements(in thousands of dollars)
Years ended December 31, 2012 and 2011
10) General operating costs:
2012 2011
General program costs 3,744$ 4,118$ Premises 3,631 3,616Information technology 3,253 1,839Office and administration 644 1,022
11,272$ 10,595$
11) Pension plan:
The OPA makes contributions to the Public Service Pension Plan, a multi-employer plan, on behalf of staff. The plan is a contributory defined pension plan, which specifies the amount of the retirement benefit to be received by the employees based on the length of service and rates of pay.
Contribution rates by employers are made at a rate of approximately eight percent of earnings. As at December 31, 2012, the OPA paid or accrued contributions totalling $2,096 (December 31, 2011 - $1,937 and January 1, 2011 - $1,916) during the year.
12) Change in non-cash operating items:
2012 2011
Increase in accounts receivable (130,861)$ (126,979)$
Increase in prepaid expenses (264) (214)
Increase in accounts payable and accrued liabilities 152,844 25,741
Decrease in contract deposits (23,132) (15,443)(1,413)$ (116,895)$
13) Related party transactions:
The Province of Ontario is a related party as it is the controlling entity of the OPA. The OEB, Hydro One, the IESO, OPG, the Ontario Financing Authority (OFA) and the Ministry of Energy are related parties of the OPA, through the common control of the Province of Ontario. Transactions between these parties and the OPA were as follows:
PUBLIC ACCOUNTS, 2012-2013 1-285
Notes to Financial Statements(in thousands of dollars)
Years ended December 31, 2012 and 2011
13) Related party transactions (continued):
The OPA receives its fee revenue from the IESO. The fee revenue is approved by the OEB and collected each month by the IESO from ratepayers through a usage rate applied to Ontario domestic electricity consumption. Fee revenue for 2012 was $76,298 (2011 - $76,388). In addition, the OPA and the IESO have agreements set up for the settlement of amounts paid and received for the global adjustment account, RPP on behalf of various market participants (see note 5). At December 31, 2012, the OPA had a net receivable of $264,304 (December 31, 2011 - $326,049 and January 1, 2011 - $187,789). The OPA also incurred $388 in 2012 (2011 -
Under the Ontario Energy Board Act, 1998, the OPA incurs registration and licence fees. Consistent with other registrants, in 2012 the OPA was allocated a portion of the operating costs of the OEB. The total of the OPA's transactions with the OEB were $1,041 in 2012 (2011 - $1,129).
The OPA procures conservation and demand management from Hydro One. The procurement costs include payments for electricity conservation, program operating costs and management fees. In 2012, the OPA procured $34,653 in conservation demand management (2011 - $39,860), from Hydro One and its wholly owned subsidiaries. Amounts receivable from Hydro One in 2012 were $nil (December 31, 2011 - $742 and January 1, 2011 - $742).
2011 - $326,049 and January 1, 2011 - $187,789). The OPA also incurred $388 in 2012 (2011 - $844) for IESO professional services.
The OPA has available a revolving operating facility in the amount of $975,000, provided by the OFA to fund its general operating expenses and support the RPP variance account. The line of credit was renewed in 2010 for a three-year term from January 1, 2011 to December 31, 2013. On December 31, 2012 the OPA has a $60,000 (December 31, 2011 - $256,368 and January 1, 2011 - nil) outstanding balance from the OFA. In 2012, the OPA incurred $470 (2011 - $1,021) in interest expenses for the loan. This is net of interest expense that was allocated to the market.
These transactions are in the normal course of operations and are measured at the exchange amount, which is the amount of consideration established and agreed to by the related parties.
1-286 PUBLIC ACCOUNTS, 2012-2013
Notes to Financial Statements(in thousands of dollars)
Years ended December 31, 2012 and 2011
14) Contingencies and guarantees:
Contingencies:
Guarantees:
In the normal course of its operations, the OPA becomes involved in various legally binding agreements. Some of these agreements contain potential liabilities that may become actual liabilities when one or more future events occur or fail to occur. To the extent that a future event becomes likely to occur or fails to occur, and a reasonable estimate of the loss can be made, an estimated liability will be accrued and the expense recorded on the OPA's financial statements. As at December 31, 2012 in the opinion of management, no such liabilities exist.
Contract conditions related to the construction of a new clean energy facility stipulate that the OPA is contingently liable to repay upgrade costs, up to a maximum of $1,000, as incurred by the energy supplier. While none of these costs have been incurred to date, the OPA is liable to cover such costs over a 20-year period ending in 2025. As at December 31, 2012 management is not aware of any information to suggest that these upgrade costs will be incurred by the supplier.
The OPA is contingently liable under a loan guarantee provision in a contract with a maximum potential exposure of $8,600. The outstanding loan balance under this contract which the OPA has guaranteed, is $nil as at December 31, 2012 and is not presently in default. This program ended in September 2012 and no obligations resulted from the guarantee.
The OPA enters into contracts with suppliers of electricity as part of its normal business operations. In some cases, these contracts require the OPA to support obligations with these entities. In 2012, the OPA entered into a letter of credit amounting to $1,349 in support of a contracted obligation. As at December 31, 2012, no amounts have been drawn on the balance.
PUBLIC ACCOUNTS, 2012-2013 1-287
Notes to Financial Statements(in thousands of dollars)
Years ended December 31, 2012 and 2011
15) Fair value of financial assets and financial liabilities
16) Capital disclosures:
Due to the OPA's primary objectives (note 1), the OPA plans for revenues to fund expenses. Any variances that occur are addressed in the following year's revenue requirement submission. As of December 31, 2012, the Minister has not provided formal approval of the OPA's business plan or the OPA's proposed usage fee for 2013.
The fair values of other financial assets and other financial liabilities are not provided because it would not provide additional useful information as they would be offset and/or would not be practical to determine.
The carrying values of the operating loan approximate their fair values as the terms and conditions for similar types of loan arrangements are comparable to current market conditions for similar items.
The carrying amounts for cash and cash equivalents, accounts receivable, accounts payable and accrued liabilities approximate their fair values because of the short-term maturity of these instruments.
1-288 PUBLIC ACCOUNTS, 2012-2013
Notes to Financial Statements(in thousands of dollars)
Years ended December 31, 2012 and 2011
17) Financial risk management:
(a) Credit risk:
(b) Liquidity risk:
The OPA is exposed to financial risks in the normal course of its business operations, including market risks resulting from credit risk, liquidity risk and interest rate risk. The nature of the financial risks and the OPA's strategy for managing these risks has not changed significantly from the prior year.
Credit risk refers to the risk that one party to a financial instrument may cause a financial loss for the other party by failing to meet its obligations under the terms of the financial instrument. The OPA is exposed directly to credit risk related from accounts receivable and bank deposits held at the chartered bank. Direct exposure to credit risk is limited to the carrying amount presented for these assets on the statement of financial position. Accounts receivable as of December 31, 2012 included no material items past due.
Liquidity risk refers to the risk that the OPA will encounter financial difficulty in meeting obligations associated with its financial liabilities. The OPA manages liquidity risk by
(c)
obligations associated with its financial liabilities. The OPA manages liquidity risk by forecasting cash flows to identify financing requirements. Cash flows from operations and maintaining appropriate credit facilities reduce liquidity risk.
Interest rate risk:
The OPA's operating loan has a variable interest rate based on the Province of Ontario's cost of funds for borrowing, with a similar term as determined by the OFA plus a margin. As a result, the OPA is exposed to interest rate risk due to fluctuations in the Province of Ontario's cost of funds for borrowing with a similar term rate.
PUBLIC ACCOUNTS, 2012-2013 1-289

Ontario Racing Commission
Commission des courses de l’Ontario
Suite 400 10 Carlson Court Toronto, Ontario M9W 6L2 Tel 416 213-0520 Fax 416 213-7827
Bureau 400 10 Carlson Court Toronto (Ontario) M9W 6L2 Tél 416 213-0520 Téléc 416 213-7827
Ontario Racing Commission Responsibility for Financial Reporting The accompanying financial statements of the Ontario Racing Commission have been prepared in accordance with Canadian public sector accounting standards and are the responsibility of management. The preparation of the financial statements necessarily involves the use of estimates based on management’s judgement, particularly when transactions affecting the current accounting period cannot be finalized with certainty until future periods. The financial statements have been properly prepared within reasonable limits of materiality and in light of information available up to June 27, 2013. Management is responsible for the integrity of the financial statements and maintains a system of internal accounting and administrative control that is designed to provide reasonable assurance the financial information is relevant, reliable and accurate and that the Commission’s assets are properly accounted for and adequately safeguarded. The appointed Commission is responsible for ensuring that management fulfills its responsibilities for financial reporting and is ultimately responsible for reviewing and approving the financial statements. The Commission meets periodically with management and the Office of the Auditor General of Ontario to discuss internal controls over the financial reporting process, auditing matters and financial reporting issues, and to satisfy itself that each party is properly discharging its responsibilities. The financial statements have been audited by the Office of the Auditor General of Ontario. The Auditor’s responsibility is to express an opinion on whether the financial statements are fairly presented in accordance with Canadian public sector accounting standards. The Independent Auditor’s Report outlines the scope of the Auditor’s examination and opinion. On behalf of management:
________________________ ______________________________ Steve Lehman Leslie Campbell Executive Director and CEO Manager, Finance and Administration
PUBLIC ACCOUNTS, 2012-2013 1-291
Independent Auditor’s Report
To the Ontario Racing Commission and to the Minister of Agriculture and Food I have audited the accompanying financial statements of the Ontario Racing Commission, which comprise the statement of financial position as at March 31, 2013, and the statements of operations, changes in net financial assets and cash flows for the year then ended, and a summary of significant accounting policies and other explanatory information.
Management’s Responsibility for the Financial Statements
Management is responsible for the preparation and fair presentation of these financial statements in accordance with Canadian public sector accounting standards, and for such internal control as management determines is necessary to enable the preparation of financial statements that are free from material misstatement, whether due to fraud or error.
Auditor’s Responsibility
My responsibility is to express an opinion on these financial statements based on my audit. I conducted my audit in accordance with Canadian generally accepted auditing standards. Those standards require that I comply with ethical requirements and plan and perform the audit to obtain reasonable assurance about whether the financial statements are free from material misstatement.
An audit involves performing procedures to obtain audit evidence about the amounts and disclosures in the financial statements. The procedures selected depend on the auditor’s judgment, including the assessment of the risks of material misstatement of the financial statements, whether due to fraud or error. In making those risk assessments, the auditor considers internal control relevant to the entity’s preparation and fair presentation of the financial statements in order to design audit procedures that are appropriate in the circumstances, but not for the purpose of expressing an opinion on the effectiveness of the entity’s internal control. An audit also includes evaluating the appropriateness of accounting policies used and the reasonableness of accounting estimates made by management, as well as evaluating the overall presentation of the financial statements.
I believe that the audit evidence I have obtained is sufficient and appropriate to provide a basis for my audit opinion.
Opinion
In my opinion, the financial statements present fairly, in all material respects, the financial position of the Ontario Racing Commission as at March 31, 2013 and the results of its operations, changes in its net financial assets, and its cash flows for the year then ended in accordance with Canadian public sector accounting standards.
Toronto, Ontario Susan Klein, CPA, CA, LPA June 27, 2013 Acting Deputy Auditor General
1-292 PUBLIC ACCOUNTS, 2012-2013
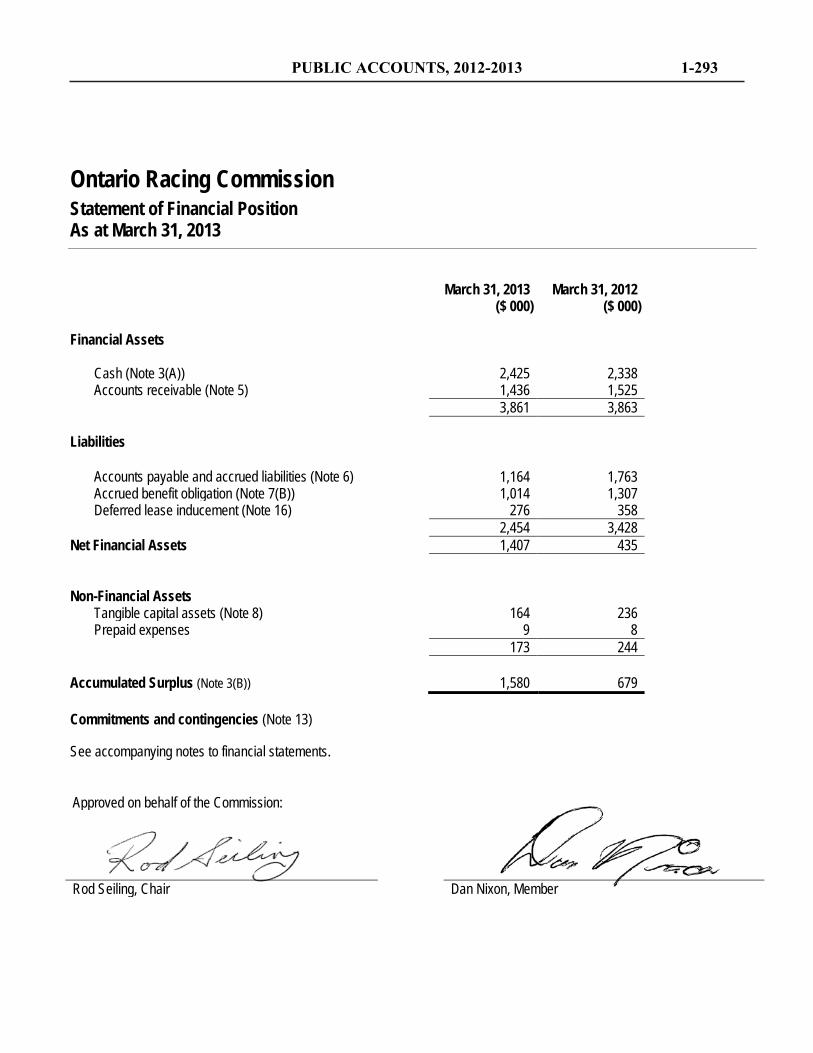
PUBLIC ACCOUNTS, 2012-2013 1-293
Ontario Racing Commission Statement of Financial Position As at March 31, 2013
March 31, 2013
($ 000) March 31, 2012
($ 000) Financial Assets
Cash (Note 3(A)) 2,425 2,338 Accounts receivable (Note 5) 1,436 1,525
3,861 3,863 Liabilities
Accounts payable and accrued liabilities (Note 6) 1,164 1,763 Accrued benefit obligation (Note 7(B)) 1,014 1,307 Deferred lease inducement (Note 16) 276 358 2,454 3,428
Net Financial Assets 1,407 435
Non-Financial Assets
Tangible capital assets (Note 8) 164 236 Prepaid expenses 9 8
173 244 Accumulated Surplus (Note 3(B)) 1,580 679 Commitments and contingencies (Note 13) See accompanying notes to financial statements.
Approved on behalf of the Commission: Rod Seiling, Chair Dan Nixon, Member
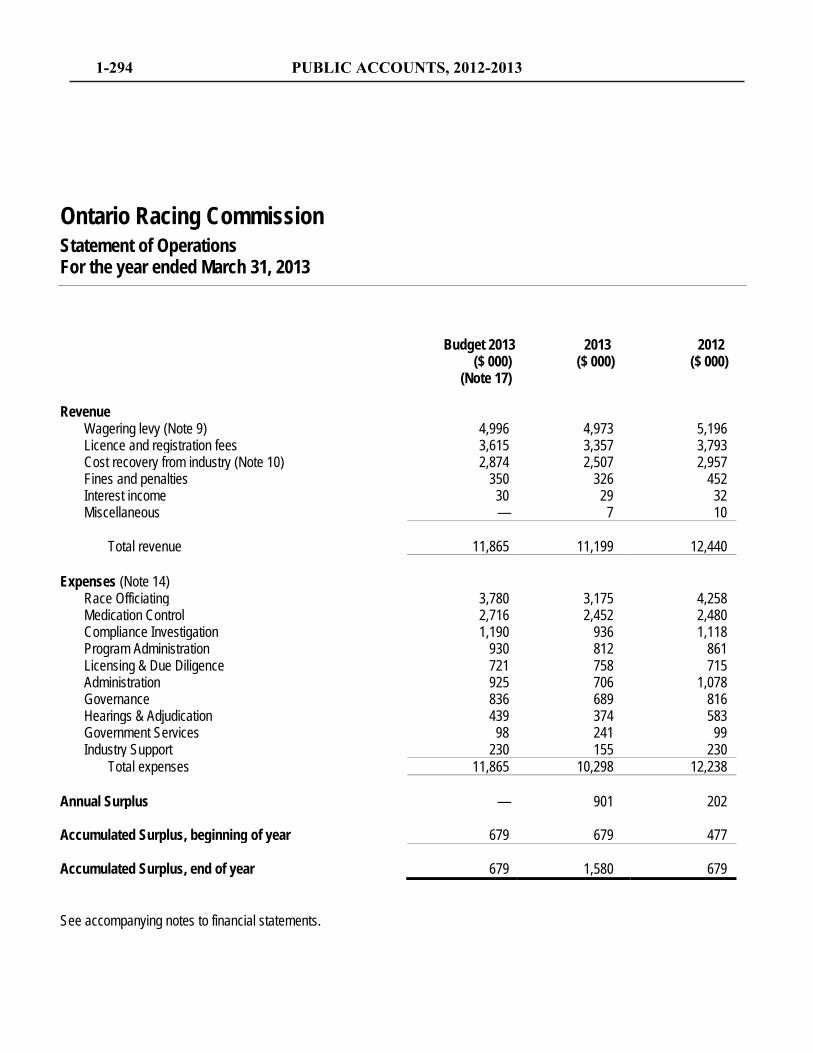
1-294 PUBLIC ACCOUNTS, 2012-2013
Ontario Racing Commission Statement of Operations For the year ended March 31, 2013
Budget 2013
($ 000) 2013 ($ 000)
2012 ($ 000)
(Note 17)
Revenue Wagering levy (Note 9) 4,996 4,973 5,196 Licence and registration fees 3,615 3,357 3,793 Cost recovery from industry (Note 10) 2,874 2,507 2,957 Fines and penalties 350 326 452 Interest income 30 29 32 Miscellaneous — 7 10
Total revenue 11,865 11,199 12,440 Expenses (Note 14)
Race Officiating 3,780 3,175 4,258 Medication Control 2,716 2,452 2,480 Compliance Investigation 1,190 936 1,118 Program Administration 930 812 861 Licensing & Due Diligence 721 758 715 Administration 925 706 1,078 Governance 836 689 816 Hearings & Adjudication 439 374 583 Government Services 98 241 99 Industry Support 230 155 230
Total expenses 11,865 10,298 12,238 Annual Surplus — 901 202 Accumulated Surplus, beginning of year 679 679 477 Accumulated Surplus, end of year 679 1,580 679 See accompanying notes to financial statements.
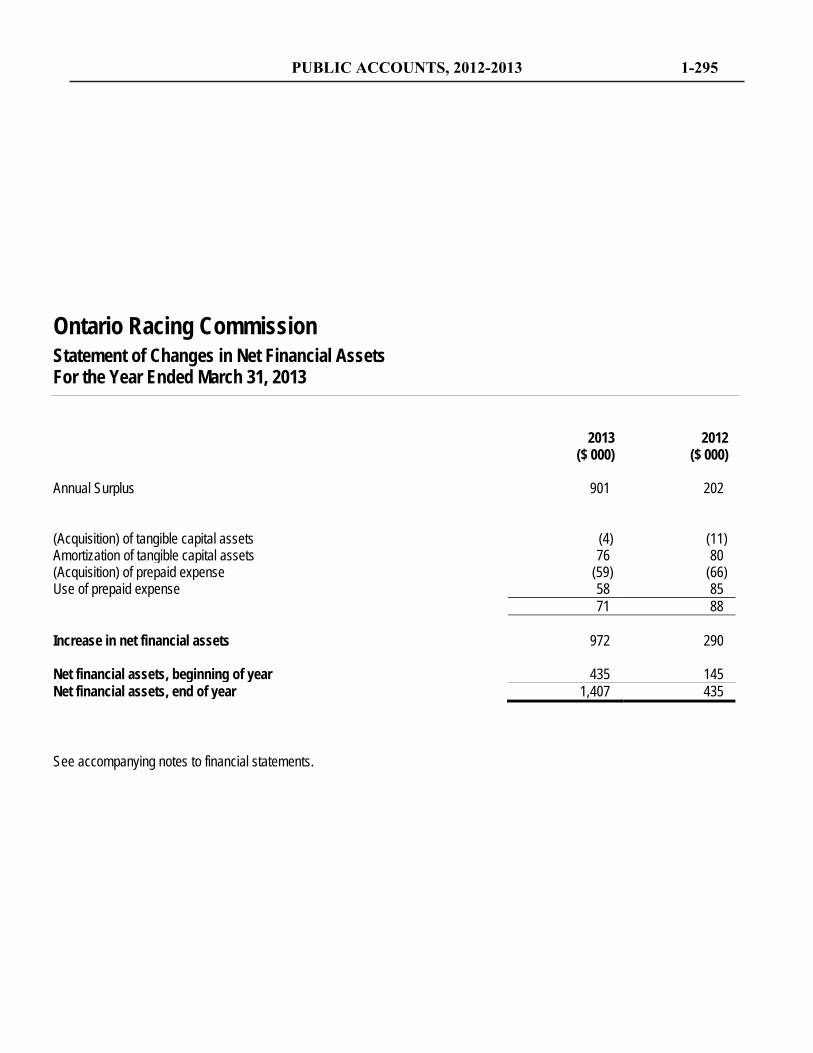
PUBLIC ACCOUNTS, 2012-2013 1-295
Ontario Racing Commission Statement of Changes in Net Financial Assets For the Year Ended March 31, 2013
2013
($ 000) 2012
($ 000) Annual Surplus 901 202 (Acquisition) of tangible capital assets (4) (11) Amortization of tangible capital assets 76 80 (Acquisition) of prepaid expense (59) (66) Use of prepaid expense 58 85 71 88 Increase in net financial assets 972 290 Net financial assets, beginning of year 435 145 Net financial assets, end of year 1,407 435 See accompanying notes to financial statements.
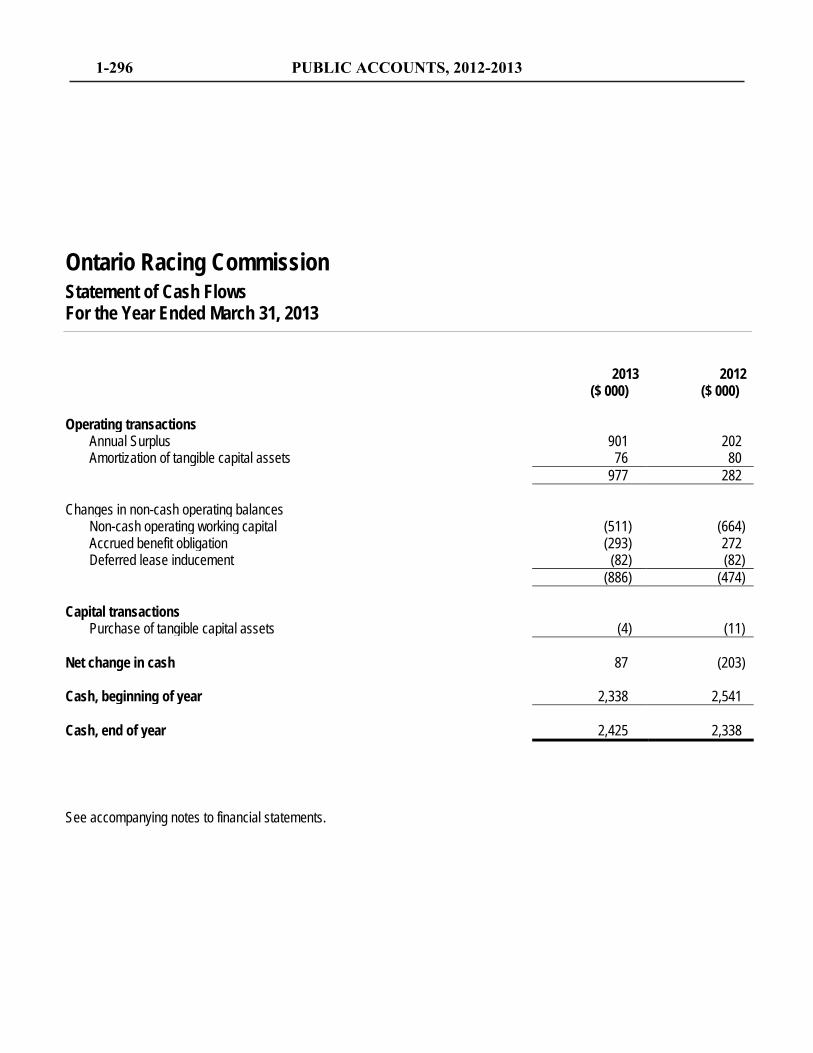
1-296 PUBLIC ACCOUNTS, 2012-2013
Ontario Racing Commission Statement of Cash Flows For the Year Ended March 31, 2013
2013
($ 000) 2012
($ 000) Operating transactions
Annual Surplus 901 202 Amortization of tangible capital assets 76 80
977 282 Changes in non-cash operating balances
Non-cash operating working capital (511) (664) Accrued benefit obligation (293) 272 Deferred lease inducement (82) (82)
(886) (474) Capital transactions
Purchase of tangible capital assets (4) (11) Net change in cash 87 (203) Cash, beginning of year 2,338 2,541 Cash, end of year 2,425 2,338 See accompanying notes to financial statements.
PUBLIC ACCOUNTS, 2012-2013 1-297
Ontario Racing Commission Notes to Financial Statements March 31, 2013
1. Objective of the Commission Effective December 15, 2000, the Racing Commission Act, 2000 continued the Ontario Racing Commission (the “Commission”) as an independent self-financing regulatory agency of the Crown. The Commission is responsible to govern, direct, control and regulate horse racing in the Province.
As an Ontario Crown agency, the Commission is exempted from federal and provincial income taxes under the Income Tax Act (Canada).
2. Significant Accounting Policies (A) BASIS OF ACCOUNTING These financial statements have been prepared by management in accordance with Canadian generally accepted accounting principles established by the Canadian Public Sector Accounting Board.
(B) TANGIBLE CAPITAL ASSETS Tangible capital assets are recorded at cost less accumulated amortization. Amortization is calculated on a straight-line basis over the estimated useful life of the asset, beginning in the year following acquisition, as follows:
Office furniture and equipment 5 years Computer equipment and software 3 years Leasehold improvements remaining term of lease
(C) REVENUE RECOGNITION The wagering levy is recognized as income in the year it is due.
Licence and registration fees are recognized as income when issued.
Revenue from fines and penalties, less a provision for uncollectible amounts, is recorded when such fines and penalties are imposed.
(D) EXPENSE RECOGNITION Expenses are recognized on an accrual basis as incurred, in the year to which they relate.
(E) EMPLOYEE BENEFITS
(I) PENSION BENEFITS The Commission’s full-time employees participate in the Public Service Pension Fund (PSPF), which is a defined benefit pension plan for employees of the Province and many provincial agencies. The Province of Ontario, which is the sole sponsor of the PSPF, determines the Commission’s annual payments to the fund. As the sponsors are responsible for ensuring that the pension fund is financially viable, any surpluses or unfunded liabilities arising from statutory actuarial funding valuations are not assets or obligations of the Commission.
1-298 PUBLIC ACCOUNTS, 2012-2013
Ontario Racing Commission Notes to Financial Statements March 31, 2013
2. Significant Accounting Policies (Continued)
(II) NON-PENSION BENEFITS The cost of post-retirement non-pension employee benefits is paid by the Province and is not included in the Statement of Operations.
(III) ACCRUED BENEFIT OBLIGATION The accrued benefit obligation records earned employee severance payments due upon termination or retirement.
(F) FINANCIAL INSTRUMENTS The Commission's financial assets and financial liabilities are accounted for as follows:
• Cash is subject to an insignificant risk of change in value so carrying value approximates fair value.
• Accounts receivable are recorded at amortized cost less any amount for valuation allowance. Valuation allowances are made to reflect accounts receivable at the lower of amortized cost and the net recoverable value, when collectability and risk of loss exists. Changes in valuation allowances are recognized in the Statement of operations.
• Accounts payable and accrued liabilities are recorded at cost.
The Commission does not use derivative financial instruments.
(G) MEASUREMENT UNCERTAINITY The preparation of financial statements in accordance with Canadian public sector accounting standards requires that management make estimates and assumptions that affect the reported amount of assets and liabilities as at the date of the financial statements and the reported amounts of revenues and expenses for the period. Items requiring the use of significant estimates include: useful life of capital assets, accrued benefit obligations, and valuation allowances.
Estimates are based on the best information available at the time of preparation of the financial statements and are reviewed annually to reflect new information as it becomes available. Measurement uncertainty exists in these financial statements. Actual results could differ from these estimates.
(H) TRUSTS UNDER ADMINISTRATION Trusts administered by the Commission are not included in the financial statements as the assets are not held for the benefit of the Commission. Details of amounts held in trust are disclosed in Note 4.
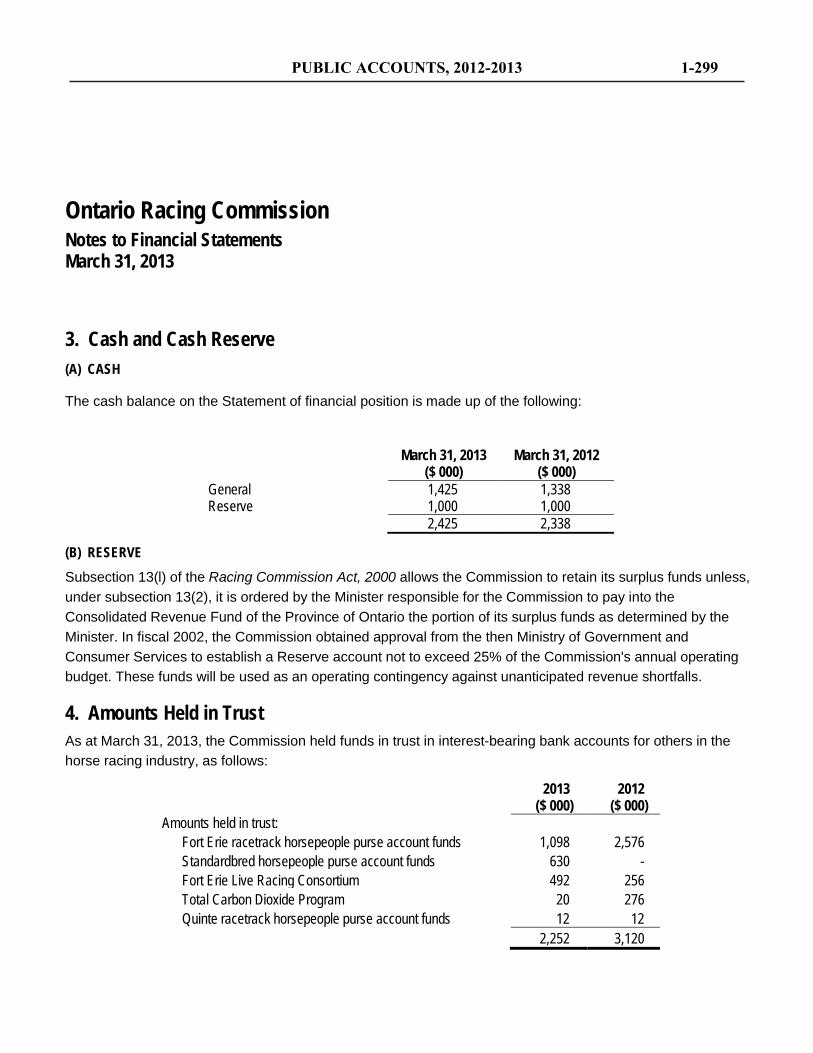
PUBLIC ACCOUNTS, 2012-2013 1-299
Ontario Racing Commission Notes to Financial Statements March 31, 2013
3. Cash and Cash Reserve (A) CASH
The cash balance on the Statement of financial position is made up of the following:
March 31, 2013
($ 000) March 31, 2012
($ 000) General 1,425 1,338 Reserve 1,000 1,000 2,425 2,338
(B) RESERVE Subsection 13(l) of the Racing Commission Act, 2000 allows the Commission to retain its surplus funds unless, under subsection 13(2), it is ordered by the Minister responsible for the Commission to pay into the Consolidated Revenue Fund of the Province of Ontario the portion of its surplus funds as determined by the Minister. In fiscal 2002, the Commission obtained approval from the then Ministry of Government and Consumer Services to establish a Reserve account not to exceed 25% of the Commission's annual operating budget. These funds will be used as an operating contingency against unanticipated revenue shortfalls.
4. Amounts Held in Trust As at March 31, 2013, the Commission held funds in trust in interest-bearing bank accounts for others in the horse racing industry, as follows:
2013 2012 ($ 000) ($ 000) Amounts held in trust:
Fort Erie racetrack horsepeople purse account funds 1,098 2,576 Standardbred horsepeople purse account funds 630 - Fort Erie Live Racing Consortium 492 256 Total Carbon Dioxide Program 20 276 Quinte racetrack horsepeople purse account funds 12 12
2,252 3,120
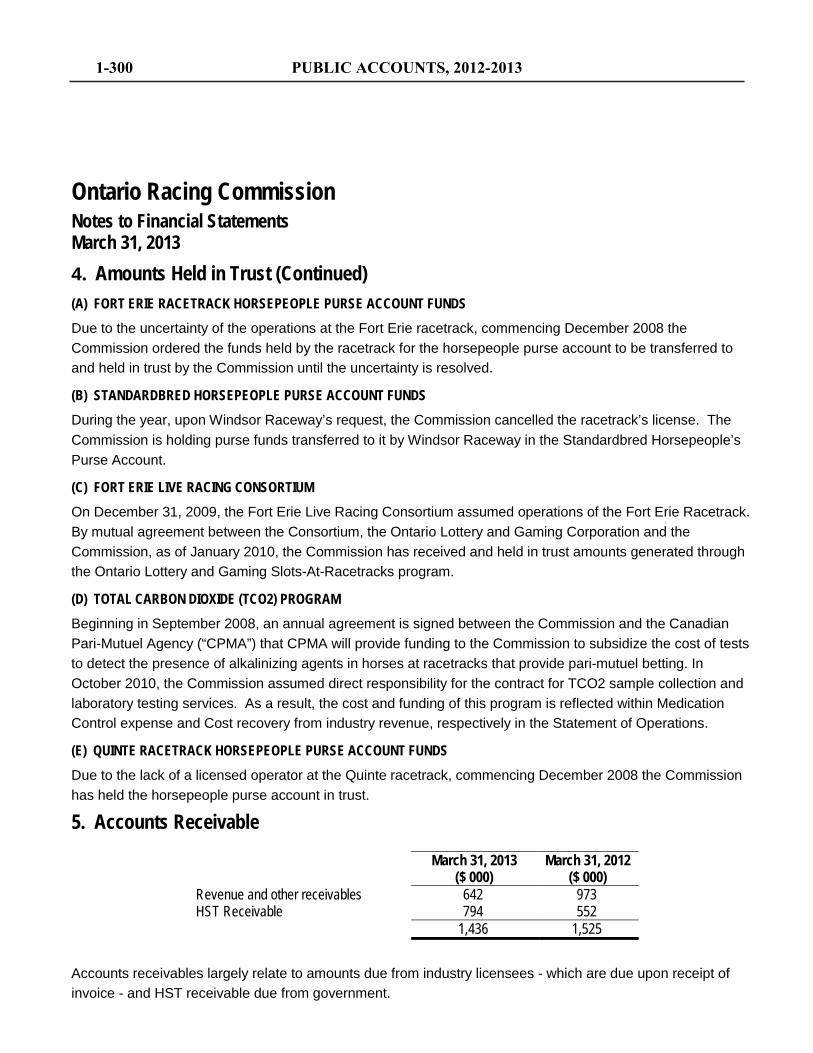
1-300 PUBLIC ACCOUNTS, 2012-2013
Ontario Racing Commission Notes to Financial Statements March 31, 2013
4. Amounts Held in Trust (Continued) (A) FORT ERIE RACETRACK HORSEPEOPLE PURSE ACCOUNT FUNDS Due to the uncertainty of the operations at the Fort Erie racetrack, commencing December 2008 the Commission ordered the funds held by the racetrack for the horsepeople purse account to be transferred to and held in trust by the Commission until the uncertainty is resolved.
(B) STANDARDBRED HORSEPEOPLE PURSE ACCOUNT FUNDS During the year, upon Windsor Raceway’s request, the Commission cancelled the racetrack’s license. The Commission is holding purse funds transferred to it by Windsor Raceway in the Standardbred Horsepeople’s Purse Account.
(C) FORT ERIE LIVE RACING CONSORTIUM On December 31, 2009, the Fort Erie Live Racing Consortium assumed operations of the Fort Erie Racetrack. By mutual agreement between the Consortium, the Ontario Lottery and Gaming Corporation and the Commission, as of January 2010, the Commission has received and held in trust amounts generated through the Ontario Lottery and Gaming Slots-At-Racetracks program.
(D) TOTAL CARBON DIOXIDE (TCO2) PROGRAM Beginning in September 2008, an annual agreement is signed between the Commission and the Canadian Pari-Mutuel Agency (“CPMA”) that CPMA will provide funding to the Commission to subsidize the cost of tests to detect the presence of alkalinizing agents in horses at racetracks that provide pari-mutuel betting. In October 2010, the Commission assumed direct responsibility for the contract for TCO2 sample collection and laboratory testing services. As a result, the cost and funding of this program is reflected within Medication Control expense and Cost recovery from industry revenue, respectively in the Statement of Operations.
(E) QUINTE RACETRACK HORSEPEOPLE PURSE ACCOUNT FUNDS Due to the lack of a licensed operator at the Quinte racetrack, commencing December 2008 the Commission has held the horsepeople purse account in trust.
5. Accounts Receivable
March 31, 2013 ($ 000)
March 31, 2012 ($ 000)
Revenue and other receivables 642 973 HST Receivable 794 552 1,436 1,525
Accounts receivables largely relate to amounts due from industry licensees - which are due upon receipt of invoice - and HST receivable due from government.
PUBLIC ACCOUNTS, 2012-2013 1-301
Ontario Racing Commission Notes to Financial Statements March 31, 2013
5. Accounts Receivable (Continued) Provisions for doubtful accounts are not necessary on most revenue-related receivables due to the licensing relationship that the Commission has with these parties. For fines revenue, a provision is recorded for uncollectible amounts. That provision is netted against revenue and accounts receivable for financial statement presentation purposes.
6. Accounts Payable and Accrued Liabilities
March 31, 2013
($ 000) March 31, 2012
($ 000) Accounts payable 559 613 Accrued Vacation, Salaries and benefits 605 1,150 1,164 1,763
Accounts Payable relates largely to normal business transactions with third-party vendors and is subject to standard commercial terms. Accrued vacation, salaries and benefits are recorded based on employment arrangements and employment practices under the related legislation. Compensation payables are paid out as required under these contractual or statutory obligations.
7. Employee Benefits (A) PENSION BENEFITS
The Commission’s annual payment of $315,000 (2012-$321,000), are included in employee benefits expense in Note 14.
(B) ACCRUED BENEFIT OBLIGATION The accrued benefit obligation records earned employee severance payments due upon termination or retirement. In fiscal 2013, due to a change in the Commission's restructuring plans, both the accrued benefit obligation and employee benefits expense (Note 14) were reduced by $91,000. In the prior year, these costs totalled $295,000.
1-302 PUBLIC ACCOUNTS, 2012-2013
Ontario Racing Commission Notes to Financial Statements March 31, 2013
8. Tangible Capital Assets
($ 000)
($ 000)
Computer equipment and
software
Office furniture and equipment
Leasehold Improvements
Net Book Value
Cost Opening balance, April 1, 2012 414 282 450 1,146
Additions 2 2 — 4 Closing Balance, March 31, 2013 416 284 450 1,150 Accumulated Amortization Opening Balance, April 1, 2012 (377) (263) (270) (910)
Amortization (22) (9) (45) (76) Closing Balance, March 31, 2013 (399) (272) (315) (986) Net Book Value, March 31, 2013 17 12 135 164
($ 000)
($ 000) Computer
equipment and software
Office furniture and equipment
Leasehold Improvements
Net Book Value
Cost Opening balance, April 1, 2011 405 280 450 1,135
Additions 9 2 — 11 Closing Balance, March 31, 2012 414 282 450 1,146 Accumulated Amortization Opening Balance, April 1, 2011 (355) (251) (225) (831)
Amortization (22) (12) (45) (79) Closing Balance, March 31, 2012 (377) (263) (270) (910) Net Book Value, March 31, 2012 37 19 180 236
9. Wagering Levy The levy was established such that the total sum of the levy and other revenues received by the Commission would be sufficient to cover all costs associated with the operation of the Commission. The levy is calculated as a percentage of total wagering made at each racing association during the 2011 calendar year.
PUBLIC ACCOUNTS, 2012-2013 1-303
Ontario Racing Commission Notes to Financial Statements March 31, 2013
10. Cost Recovery from Industry The Commission recovers certain costs from the industry for its activities as follows:
2013 ($ 000)
2012 ($ 000)
Cost recovery from: Equine Medication and Drug Control 1,060 1,044 TCO2 Program 668 726 Horse Improvement Program 358 341 Ontario Racing Program 207 325 Quarter Horse Racing Industry Development Program 178 348 Miscellaneous 28 145 Purse Examinations 8 28
2,507 2,957
(A) EQUINE MEDICATION AND DRUG CONTROL A letter of intent dated December 20, 2006, between an Ontario horse racing industry advisory group and the Commission established the Equine Medication Control and Drug Task Force. The mandate of the Task Force, which is administered by the Commission and partially funded by the racetracks and the horsepeople purse accounts, is to combat the supply and use of illegal equine medications and drugs in the Ontario horse racing industry. The agreement, which covered the two year period from January 1, 2007 through December 31, 2008, required the industry to provide regular payments to fund the Task Force and the Commission records these payments as a deferred cost recovery from industry until the related costs are incurred. Since the expiration of that initial two year agreement, the Commission has arranged to continue administering the Task Force under the same terms and financial arrangements. As of March 31, 2013 all Task Force funding from the industry had been spent.
(B) TCO2 PROGRAM As of October 1, 2010, the Commission assumed responsibility for the sample collection and laboratory testing services of the TCO2 Program. The costs of tests to detect the presence of alkalinizing agents in horses at racetracks that provide pari-mutuel betting are included as Medication Control. These test costs are fully recovered and included as Cost Recovery from Industry through charges to the racetrack operators, net of CPMA funding subsidies.
1-304 PUBLIC ACCOUNTS, 2012-2013
Ontario Racing Commission Notes to Financial Statements March 31, 2013
10. Cost Recovery from Industry (continued) (C) HORSE IMPROVEMENT PROGRAM As of May 1, 2005, the Commission assumed responsibility for the administration of the Horse Improvement Program (HIP). The HIP is a racing and breeding incentive program that was established in 1974. The objectives of the program are: to supplement purses paid; to improve the quality and quantity of racing stock in Ontario; to fund equine research; to promote the Ontario-bred horse; and to promote horse breeding and ownership in the province. A Memorandum of Understanding (MOU) effective September 30, 1996 between the then Ministry of Consumer and Commercial Relations, the Ontario Horse Racing Industry Association and the Commission provided for a reduction of pari-mutuel taxes, with these forgone revenues being allocated to various industry participants. The MOU has been supplemented by subsequent agreements to include an allocated portion of revenues from slot machines at racetracks. Separate financial statements have been prepared for the HIP, which were audited by an independent public accounting firm.
(D) ONTARIO RACING PROGRAM The Ontario Racing Program (ORP) is a province-wide approach to the conduct of horse racing. The ORP was developed in 2010 in consultation with industry stakeholders to coordinate and provide structure in addressing local, regional and provincial issues. The Program is built upon a Framework approved by the Board of the Commission. An Implementation and Monitoring Group was established to provide on-going oversight, consider variances to the Program, monitor results, ensure compliance and continue to refine and develop the ORP.
The ORP has focused on critical Standardbred racing issues, although the principles of the program apply equally to all breeds.
(E) QUARTER HORSE RACING INDUSTRY DEVELOPMENT PROGRAM As a result of an agreement between the Ontario Lottery and Gaming Corporation and owners of the Ajax Downs racetrack, the Commission assumed responsibility to administer the Quarter Horse Racing Industry Development Program (QHRIDP) with an objective to establish a program for the betterment of the Ontario quarter horse racing industry and horse racing in general. Since March 2006, the program has been funded by an allocated portion of revenues from slot machines at the racetrack. Separate financial statements have been prepared for the QHRIDP, which were audited by an independent public accounting firm.
(F) PURSE EXAMINATIONS Pursuant to changes to the Rules of Racing that were approved in fiscal 2008, the Commission recovered its costs for conducting examinations on the financial statements of the purse accounts that the racetrack operators hold in trust for the horsepeople.
11. Members’ Remuneration Total remuneration of the Chair and members of the Commission for the year was $183,000 (2012 – $198,000). Members’ remuneration is charged to Governance expense in the Statement of Operations and in Services in Note 14.
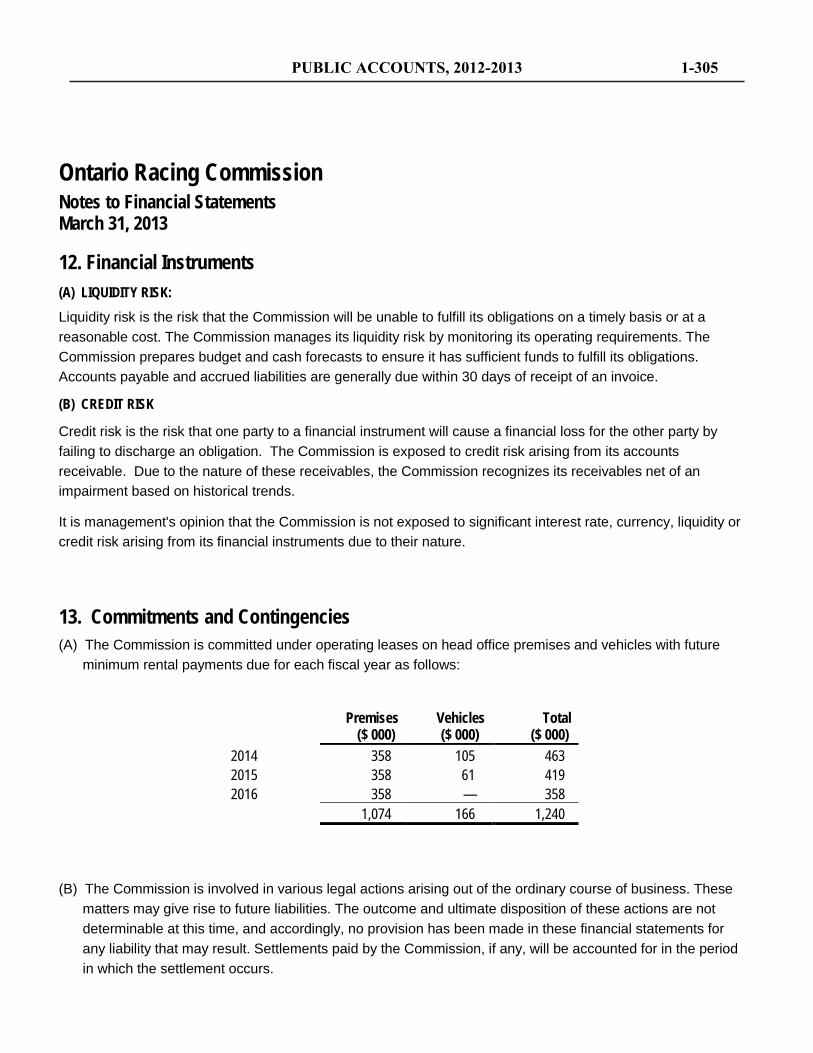
PUBLIC ACCOUNTS, 2012-2013 1-305
Ontario Racing Commission Notes to Financial Statements March 31, 2013
12. Financial Instruments (A) LIQUIDITY RISK: Liquidity risk is the risk that the Commission will be unable to fulfill its obligations on a timely basis or at a reasonable cost. The Commission manages its liquidity risk by monitoring its operating requirements. The Commission prepares budget and cash forecasts to ensure it has sufficient funds to fulfill its obligations. Accounts payable and accrued liabilities are generally due within 30 days of receipt of an invoice.
(B) CREDIT RISK
Credit risk is the risk that one party to a financial instrument will cause a financial loss for the other party by failing to discharge an obligation. The Commission is exposed to credit risk arising from its accounts receivable. Due to the nature of these receivables, the Commission recognizes its receivables net of an impairment based on historical trends.
It is management's opinion that the Commission is not exposed to significant interest rate, currency, liquidity or credit risk arising from its financial instruments due to their nature.
13. Commitments and Contingencies (A) The Commission is committed under operating leases on head office premises and vehicles with future
minimum rental payments due for each fiscal year as follows:
Premises
($ 000) Vehicles ($ 000)
Total ($ 000)
2014 358 105 463 2015 358 61 419 2016 358 — 358 1,074 166 1,240
(B) The Commission is involved in various legal actions arising out of the ordinary course of business. These matters may give rise to future liabilities. The outcome and ultimate disposition of these actions are not determinable at this time, and accordingly, no provision has been made in these financial statements for any liability that may result. Settlements paid by the Commission, if any, will be accounted for in the period in which the settlement occurs.
1-306 PUBLIC ACCOUNTS, 2012-2013
Ontario Racing Commission Notes to Financial Statements March 31, 2013
14. Expenses by Object The following is a summary of expenses by object:
2013
($ 000) 2012
($ 000) Salaries and wages 4,649 5,698 Services (Note 15) 3,856 4,213 Employee benefits (Note 7) 793 1,235 Transportation and communication 793 867 Supplies 131 145 Amortization 76 80
Total expenses 10,298 12,238
15. Related Party Transactions The Commission paid the Province of Ontario for: Ontario Provincial Police investigative and related services totalling $1,161,000 (2012– $1,209,000); and for administrative services, information technology services, and use of computer equipment totalling $182,000 (2012 – $201,000).
The Commission has governance and administrative responsibilities over certain industry-funded programs and recovers its costs as disclosed under Note 10.
16. Deferred Lease Inducement As part of its lease arrangements for its head office premise, the Commission negotiated a lease inducement of $820,000. This included the value of rent-free periods and to cover the costs of leasehold improvements. This deferred lease inducement is being amortized as a reduction of rent expense on a straight-line basis over the 10-year lease period that commenced April 1, 2006, being the start date of the lease.
17. Budgeted Figures Budgeted figures are approved by the Board of the Commission and the Ministry of Government Services. It is presented for information purposes only and have not been audited.
18. Cancellation of Slots at Racetrack Program On March 12, 2012 the Ontario Lottery and Gaming Corporation ("OLG") and the Ministry of Finance (the "Ministry") made an announcement that the Slots at Racetrack Program in Ontario would end on March 31, 2013. While the Commission does not derive any of its revenue directly from the Slots at Racetrack Program, the cancellation of this program resulted in a significant decline in industry revenue. The Provincial Government has since entered into transfer payment agreements with the majority of Ontario’s racetracks, to ensure the continuance of horse racing in the Province.
PUBLIC ACCOUNTS, 2012-2013 1-307
1-308 PUBLIC ACCOUNTS, 2012-2013
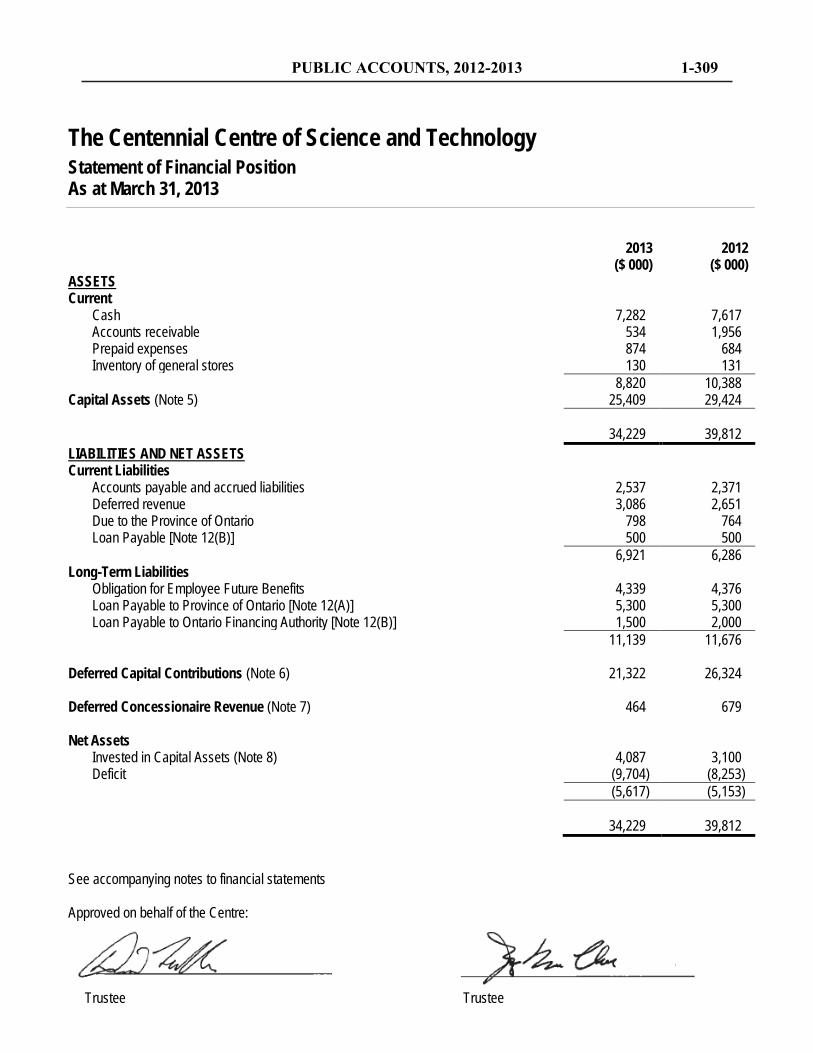
2013 2012 ($ 000) ($ 000) ASSETS Current
Cash 7,282 7,617 Accounts receivable 534 1,956 Prepaid expenses 874 684 Inventory of general stores 130 131
8,820 10,388 Capital Assets (Note 5) 25,409 29,424 34,229 39,812 LIABILITIES AND NET ASSETS Current Liabilities
Accounts payable and accrued liabilities 2,537 2,371 Deferred revenue 3,086 2,651 Due to the Province of Ontario 798 764 Loan Payable [Note 12(B)] 500 500
6,921 6,286 Long-Term Liabilities
Obligation for Employee Future Benefits 4,339 4,376 Loan Payable to Province of Ontario [Note 12(A)] 5,300 5,300 Loan Payable to Ontario Financing Authority [Note 12(B)] 1,500 2,000
11,139 11,676 Deferred Capital Contributions (Note 6) 21,322 26,324 Deferred Concessionaire Revenue (Note 7) 464 679 Net Assets
Invested in Capital Assets (Note 8) 4,087 3,100 Deficit (9,704) (8,253)
(5,617) (5,153)
34,229 39,812 See accompanying notes to financial statements Approved on behalf of the Centre:
Trustee Trustee
The Centennial Centre of Science and Technology Statement of Financial Position As at March 31, 2013
PUBLIC ACCOUNTS, 2012-2013 1-309
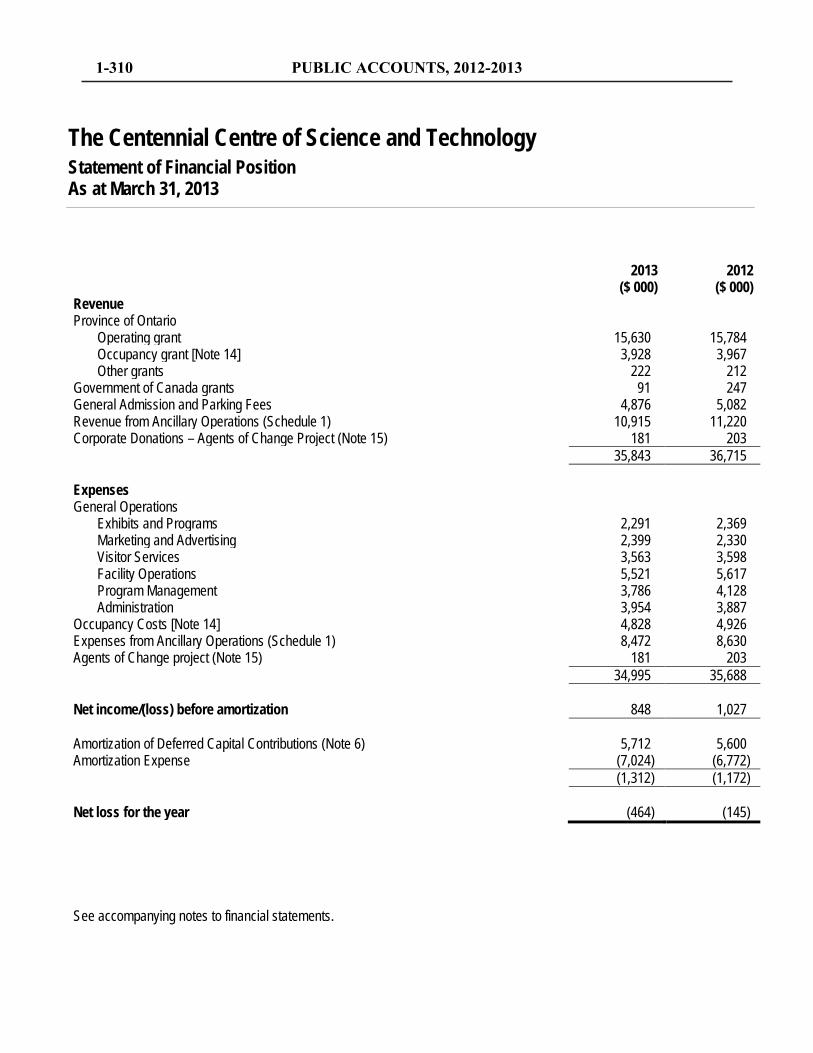
2013 2012 ($ 000) ($ 000) Revenue Province of Ontario
Operating grant 15,630 15,784 Occupancy grant [Note 14] 3,928 3,967 Other grants 222 212
Government of Canada grants 91 247 General Admission and Parking Fees 4,876 5,082 Revenue from Ancillary Operations (Schedule 1) 10,915 11,220 Corporate Donations – Agents of Change Project (Note 15) 181 203 35,843 36,715 Expenses General Operations
Exhibits and Programs 2,291 2,369 Marketing and Advertising 2,399 2,330 Visitor Services 3,563 3,598 Facility Operations 5,521 5,617 Program Management 3,786 4,128 Administration 3,954 3,887
Occupancy Costs [Note 14] 4,828 4,926 Expenses from Ancillary Operations (Schedule 1) 8,472 8,630 Agents of Change project (Note 15) 181 203 34,995 35,688 Net income/(loss) before amortization 848 1,027
Amortization of Deferred Capital Contributions (Note 6) 5,712 5,600 Amortization Expense (7,024) (6,772) (1,312) (1,172) Net loss for the year (464) (145) See accompanying notes to financial statements.
The Centennial Centre of Science and Technology Statement of Financial Position As at March 31, 2013
1-310 PUBLIC ACCOUNTS, 2012-2013
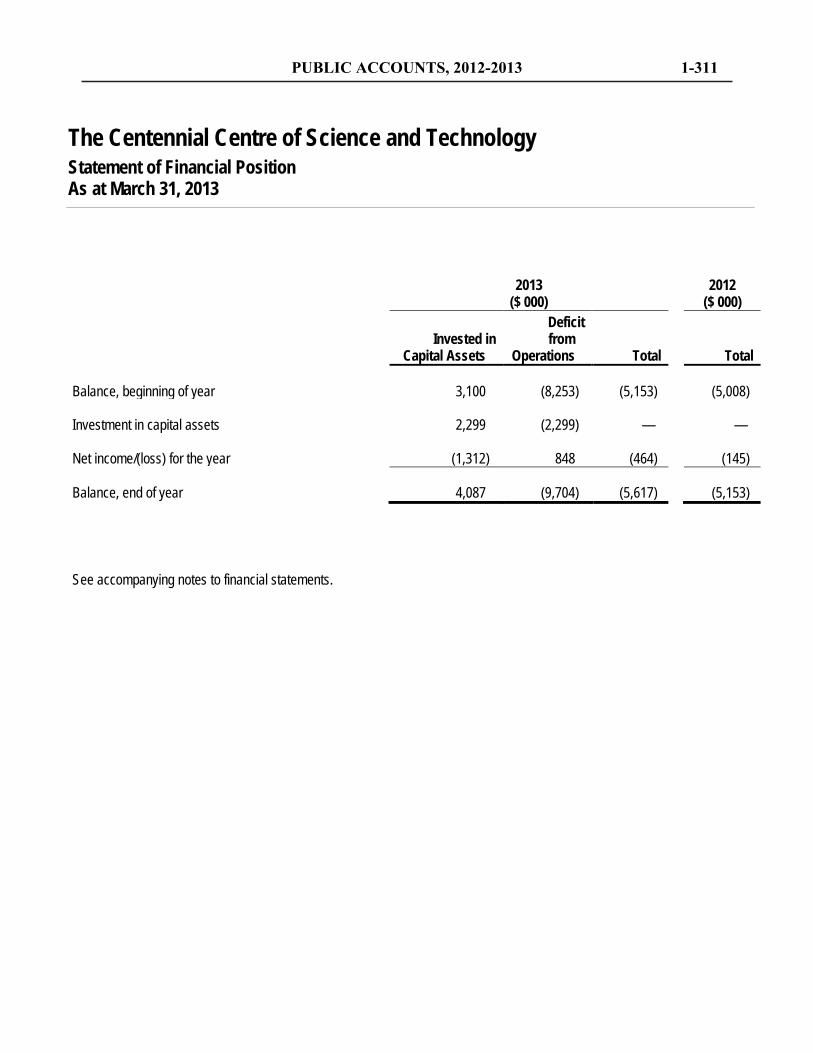
2013
($ 000) 2012
($ 000)
Invested in Capital Assets
Deficit from
Operations Total
Total Balance, beginning of year 3,100 (8,253) (5,153) (5,008) Investment in capital assets 2,299 (2,299) — — Net income/(loss) for the year (1,312) 848 (464) (145) Balance, end of year 4,087 (9,704) (5,617) (5,153) See accompanying notes to financial statements.
The Centennial Centre of Science and Technology Statement of Financial Position As at March 31, 2013
PUBLIC ACCOUNTS, 2012-2013 1-311
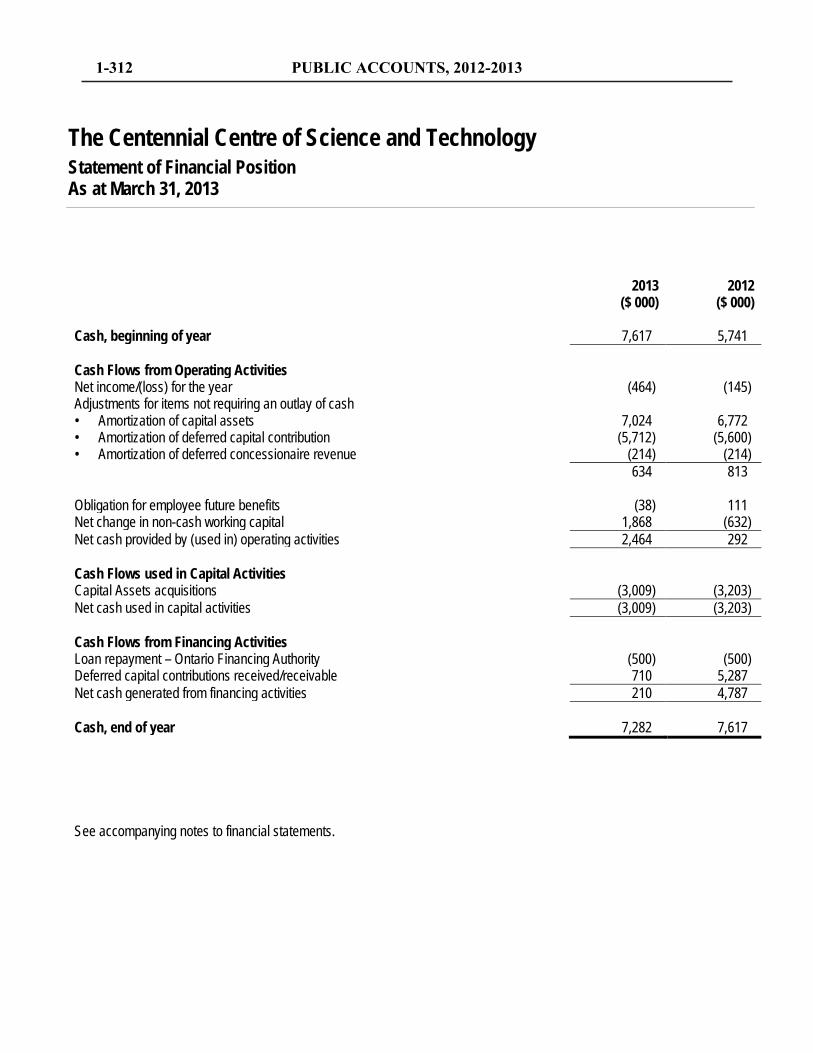
2013 2012 ($ 000) ($ 000) Cash, beginning of year 7,617 5,741 Cash Flows from Operating Activities Net income/(loss) for the year (464) (145) Adjustments for items not requiring an outlay of cash • Amortization of capital assets 7,024 6,772 • Amortization of deferred capital contribution (5,712) (5,600) • Amortization of deferred concessionaire revenue (214) (214) 634 813 Obligation for employee future benefits (38) 111 Net change in non-cash working capital 1,868 (632) Net cash provided by (used in) operating activities 2,464 292 Cash Flows used in Capital Activities Capital Assets acquisitions (3,009) (3,203) Net cash used in capital activities (3,009) (3,203) Cash Flows from Financing Activities Loan repayment – Ontario Financing Authority (500) (500) Deferred capital contributions received/receivable 710 5,287 Net cash generated from financing activities 210 4,787 Cash, end of year 7,282 7,617 See accompanying notes to financial statements.
The Centennial Centre of Science and Technology Statement of Financial Position As at March 31, 2013
1-312 PUBLIC ACCOUNTS, 2012-2013
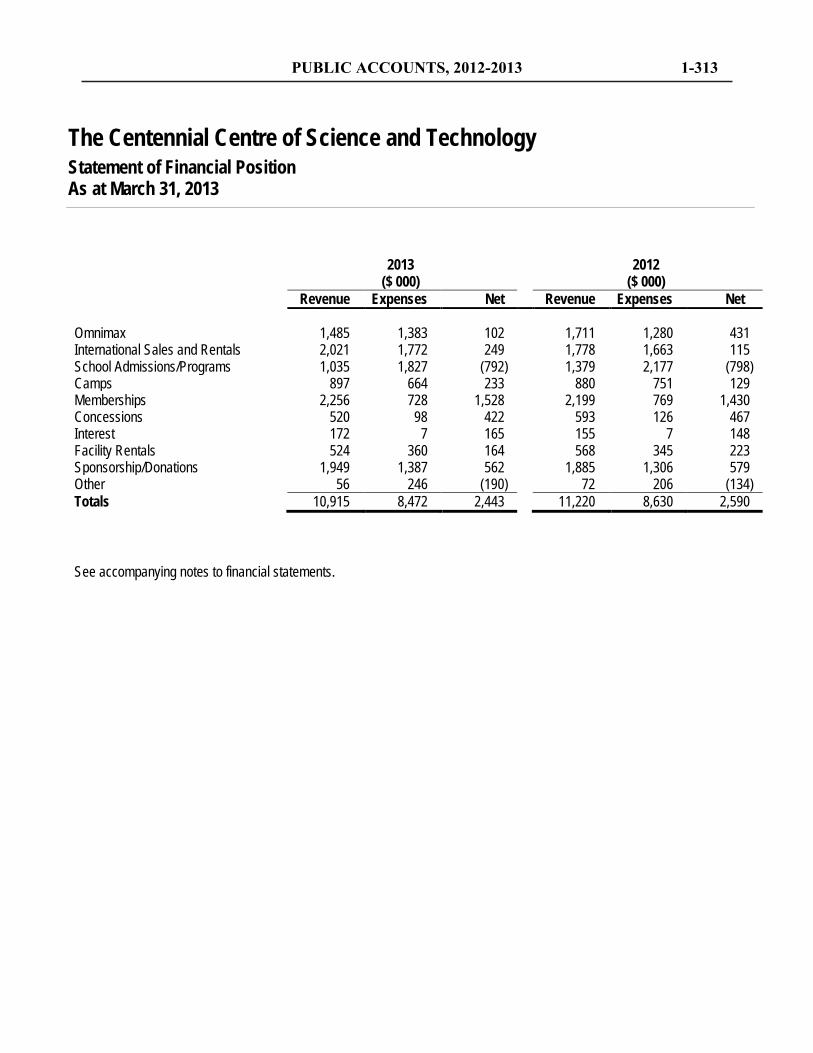
2013
($ 000) 2012
($ 000) Revenue Expenses Net Revenue Expenses Net
Omnimax 1,485 1,383 102 1,711 1,280 431 International Sales and Rentals 2,021 1,772 249 1,778 1,663 115 School Admissions/Programs 1,035 1,827 (792) 1,379 2,177 (798) Camps 897 664 233 880 751 129 Memberships 2,256 728 1,528 2,199 769 1,430 Concessions 520 98 422 593 126 467 Interest 172 7 165 155 7 148 Facility Rentals 524 360 164 568 345 223 Sponsorship/Donations 1,949 1,387 562 1,885 1,306 579 Other 56 246 (190) 72 206 (134) Totals 10,915 8,472 2,443 11,220 8,630 2,590 See accompanying notes to financial statements.
The Centennial Centre of Science and Technology Statement of Financial Position As at March 31, 2013
PUBLIC ACCOUNTS, 2012-2013 1-313

1. Nature of the Business The Centennial Centre of Science and Technology, commonly known as the Ontario Science Centre (the Centre), a government agency of the Province of Ontario, was incorporated without share capital pursuant to the Centennial Centre of Science and Technology Act. The objectives of the Centre are to:
a) maintain and operate a science centre and related facilities that will stimulate the interest of the public;
b) conduct a program of education in the origins, development and progress of science and technology, and their relationship to society;
c) depict the role of Ontario in the furtherance of science and technology; and
d) collect, manufacture, market, exhibit and sell objects and displays.
As an Ontario Crown agency, the Centre is exempted from federal and provincial income taxes.
2. Basis of Presentation These financial statements are the first financial statements which the Centre has prepared in accordance with the Public Sector Accounting Standards, which constitutes generally accepted accounting principles for government not-for-profit organizations in Canada (“GAAP”). The Centre has chosen to use the standards for government not-for-profit organizations that include the 4200 series of the Public Sector Accounting Standards. The adoption of the new standards did not result in any retroactive adjustments to previously reported financial statements.
3. Significant Accounting Policies The significant accounting policies followed to prepare these financial statements are summarized below:
(A) REVENUE RECOGNITION
Government grants are recognized in the year they become receivable.
Revenue from exhibits manufactured for sale is recognized on a percentage-of-completion basis.
Revenues from general admissions, parking and other ancillary operations are recognized when the services are provided.
Pledged donations, other than those designated for capital purposes, are recognized as revenue when funds are received.
The Centennial Centre of Science and Technology Statement of Financial Position As at March 31, 2013
1-314 PUBLIC ACCOUNTS, 2012-2013
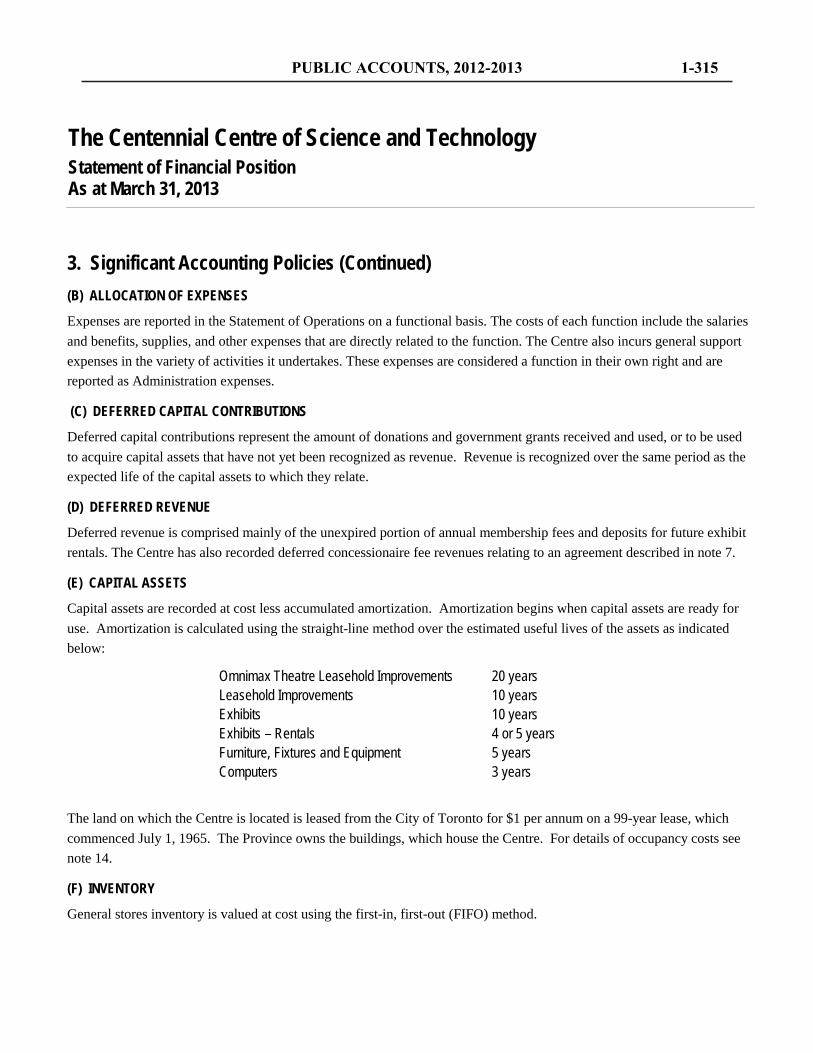
3. Significant Accounting Policies (Continued) (B) ALLOCATION OF EXPENSES
Expenses are reported in the Statement of Operations on a functional basis. The costs of each function include the salaries and benefits, supplies, and other expenses that are directly related to the function. The Centre also incurs general support expenses in the variety of activities it undertakes. These expenses are considered a function in their own right and are reported as Administration expenses.
(C) DEFERRED CAPITAL CONTRIBUTIONS
Deferred capital contributions represent the amount of donations and government grants received and used, or to be used to acquire capital assets that have not yet been recognized as revenue. Revenue is recognized over the same period as the expected life of the capital assets to which they relate.
(D) DEFERRED REVENUE
Deferred revenue is comprised mainly of the unexpired portion of annual membership fees and deposits for future exhibit rentals. The Centre has also recorded deferred concessionaire fee revenues relating to an agreement described in note 7.
(E) CAPITAL ASSETS
Capital assets are recorded at cost less accumulated amortization. Amortization begins when capital assets are ready for use. Amortization is calculated using the straight-line method over the estimated useful lives of the assets as indicated below:
Omnimax Theatre Leasehold Improvements 20 years Leasehold Improvements 10 years Exhibits 10 years Exhibits – Rentals 4 or 5 years Furniture, Fixtures and Equipment 5 years Computers 3 years
The land on which the Centre is located is leased from the City of Toronto for $1 per annum on a 99-year lease, which commenced July 1, 1965. The Province owns the buildings, which house the Centre. For details of occupancy costs see note 14.
(F) INVENTORY
General stores inventory is valued at cost using the first-in, first-out (FIFO) method.
The Centennial Centre of Science and Technology Statement of Financial Position As at March 31, 2013
PUBLIC ACCOUNTS, 2012-2013 1-315
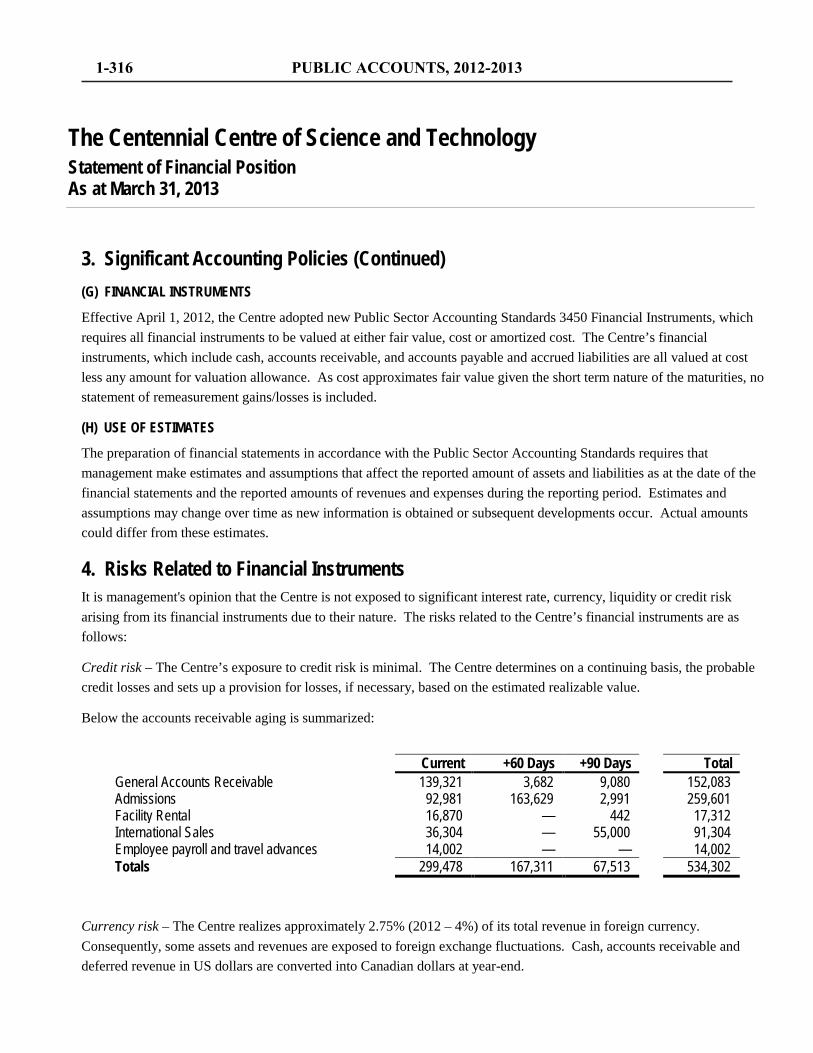
3. Significant Accounting Policies (Continued) (G) FINANCIAL INSTRUMENTS
Effective April 1, 2012, the Centre adopted new Public Sector Accounting Standards 3450 Financial Instruments, which requires all financial instruments to be valued at either fair value, cost or amortized cost. The Centre’s financial instruments, which include cash, accounts receivable, and accounts payable and accrued liabilities are all valued at cost less any amount for valuation allowance. As cost approximates fair value given the short term nature of the maturities, no statement of remeasurement gains/losses is included.
(H) USE OF ESTIMATES
The preparation of financial statements in accordance with the Public Sector Accounting Standards requires that management make estimates and assumptions that affect the reported amount of assets and liabilities as at the date of the financial statements and the reported amounts of revenues and expenses during the reporting period. Estimates and assumptions may change over time as new information is obtained or subsequent developments occur. Actual amounts could differ from these estimates.
4. Risks Related to Financial Instruments It is management's opinion that the Centre is not exposed to significant interest rate, currency, liquidity or credit risk arising from its financial instruments due to their nature. The risks related to the Centre’s financial instruments are as follows:
Credit risk – The Centre’s exposure to credit risk is minimal. The Centre determines on a continuing basis, the probable credit losses and sets up a provision for losses, if necessary, based on the estimated realizable value.
Below the accounts receivable aging is summarized:
Current +60 Days +90 Days Total
General Accounts Receivable 139,321 3,682 9,080 152,083 Admissions 92,981 163,629 2,991 259,601 Facility Rental 16,870 — 442 17,312 International Sales 36,304 — 55,000 91,304 Employee payroll and travel advances 14,002 — — 14,002 Totals 299,478 167,311 67,513 534,302
Currency risk – The Centre realizes approximately 2.75% (2012 – 4%) of its total revenue in foreign currency. Consequently, some assets and revenues are exposed to foreign exchange fluctuations. Cash, accounts receivable and deferred revenue in US dollars are converted into Canadian dollars at year-end.
The Centennial Centre of Science and Technology Statement of Financial Position As at March 31, 2013
1-316 PUBLIC ACCOUNTS, 2012-2013
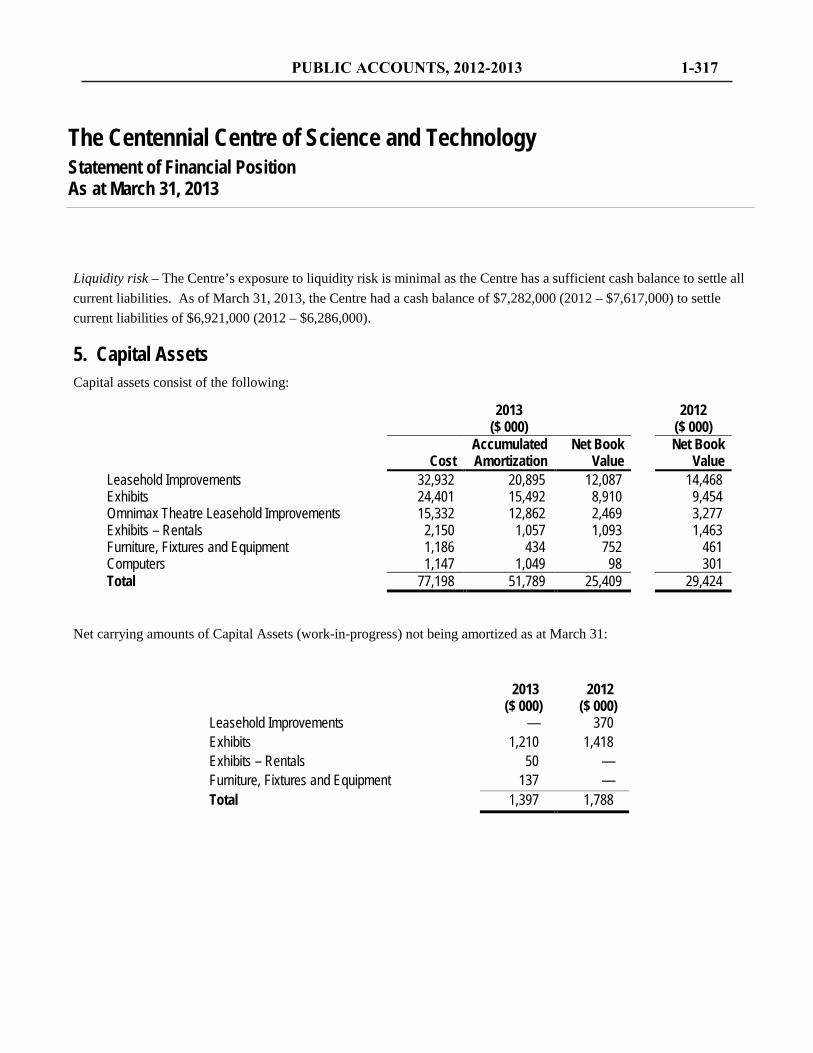
Liquidity risk – The Centre’s exposure to liquidity risk is minimal as the Centre has a sufficient cash balance to settle all current liabilities. As of March 31, 2013, the Centre had a cash balance of $7,282,000 (2012 – $7,617,000) to settle current liabilities of $6,921,000 (2012 – $6,286,000).
5. Capital Assets Capital assets consist of the following:
2013 ($ 000)
2012 ($ 000)
Accumulated Net Book Net Book Cost Amortization Value Value
Leasehold Improvements 32,932 20,895 12,087 14,468 Exhibits 24,401 15,492 8,910 9,454 Omnimax Theatre Leasehold Improvements 15,332 12,862 2,469 3,277 Exhibits – Rentals 2,150 1,057 1,093 1,463 Furniture, Fixtures and Equipment 1,186 434 752 461 Computers 1,147 1,049 98 301 Total 77,198 51,789 25,409 29,424
Net carrying amounts of Capital Assets (work-in-progress) not being amortized as at March 31:
2013
($ 000) 2012
($ 000) Leasehold Improvements — 370 Exhibits 1,210 1,418 Exhibits – Rentals 50 — Furniture, Fixtures and Equipment 137 — Total 1,397 1,788
The Centennial Centre of Science and Technology Statement of Financial Position As at March 31, 2013
PUBLIC ACCOUNTS, 2012-2013 1-317
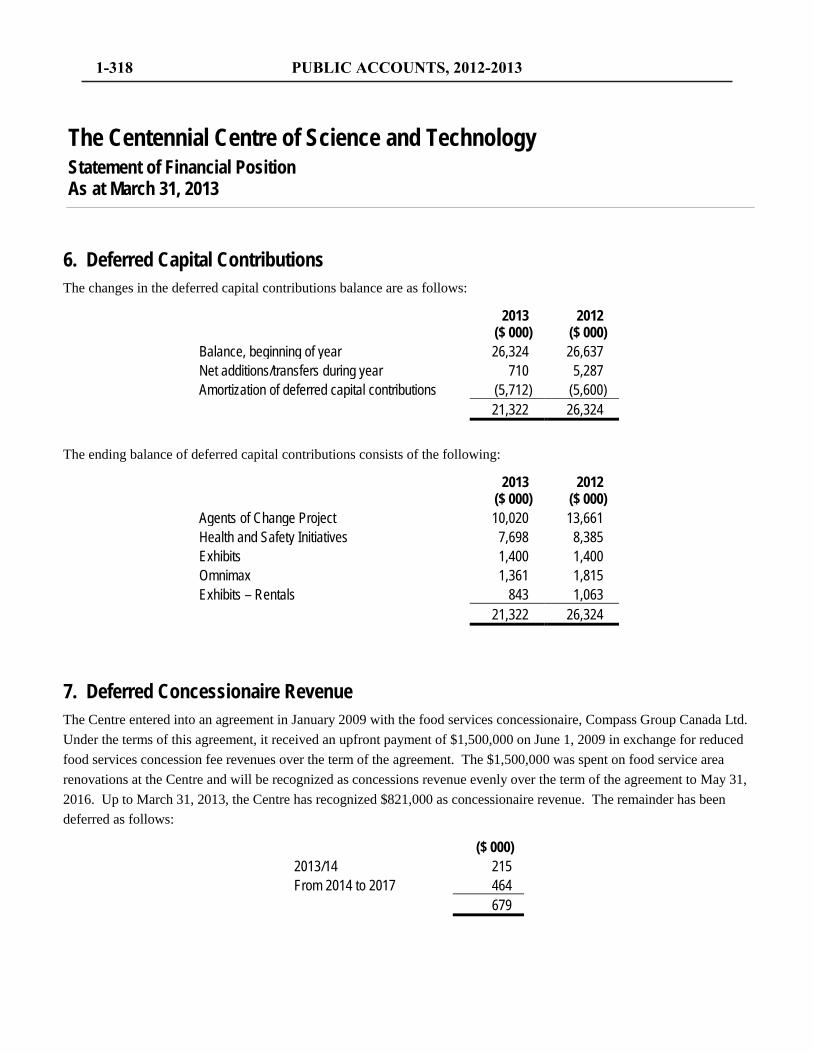
6. Deferred Capital Contributions The changes in the deferred capital contributions balance are as follows:
2013 ($ 000)
2012 ($ 000)
Balance, beginning of year 26,324 26,637 Net additions/transfers during year 710 5,287 Amortization of deferred capital contributions (5,712) (5,600) 21,322 26,324
The ending balance of deferred capital contributions consists of the following:
2013 ($ 000)
2012 ($ 000)
Agents of Change Project 10,020 13,661 Health and Safety Initiatives 7,698 8,385 Exhibits 1,400 1,400 Omnimax 1,361 1,815 Exhibits – Rentals 843 1,063 21,322 26,324
7. Deferred Concessionaire Revenue The Centre entered into an agreement in January 2009 with the food services concessionaire, Compass Group Canada Ltd. Under the terms of this agreement, it received an upfront payment of $1,500,000 on June 1, 2009 in exchange for reduced food services concession fee revenues over the term of the agreement. The $1,500,000 was spent on food service area renovations at the Centre and will be recognized as concessions revenue evenly over the term of the agreement to May 31, 2016. Up to March 31, 2013, the Centre has recognized $821,000 as concessionaire revenue. The remainder has been deferred as follows:
($ 000) 2013/14 215 From 2014 to 2017 464 679
The Centennial Centre of Science and Technology Statement of Financial Position As at March 31, 2013
1-318 PUBLIC ACCOUNTS, 2012-2013
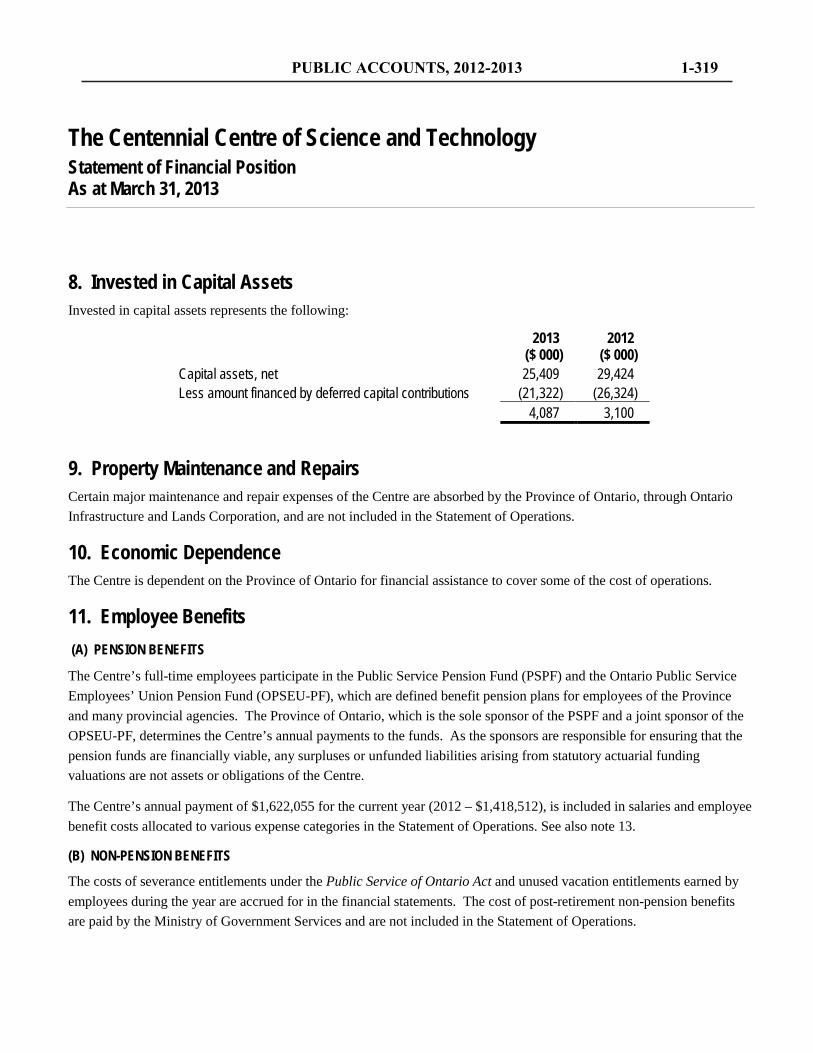
8. Invested in Capital Assets Invested in capital assets represents the following:
2013 ($ 000)
2012 ($ 000)
Capital assets, net 25,409 29,424 Less amount financed by deferred capital contributions (21,322) (26,324) 4,087 3,100
9. Property Maintenance and Repairs Certain major maintenance and repair expenses of the Centre are absorbed by the Province of Ontario, through Ontario Infrastructure and Lands Corporation, and are not included in the Statement of Operations.
10. Economic Dependence The Centre is dependent on the Province of Ontario for financial assistance to cover some of the cost of operations.
11. Employee Benefits (A) PENSION BENEFITS
The Centre’s full-time employees participate in the Public Service Pension Fund (PSPF) and the Ontario Public Service Employees’ Union Pension Fund (OPSEU-PF), which are defined benefit pension plans for employees of the Province and many provincial agencies. The Province of Ontario, which is the sole sponsor of the PSPF and a joint sponsor of the OPSEU-PF, determines the Centre’s annual payments to the funds. As the sponsors are responsible for ensuring that the pension funds are financially viable, any surpluses or unfunded liabilities arising from statutory actuarial funding valuations are not assets or obligations of the Centre.
The Centre’s annual payment of $1,622,055 for the current year (2012 – $1,418,512), is included in salaries and employee benefit costs allocated to various expense categories in the Statement of Operations. See also note 13.
(B) NON-PENSION BENEFITS
The costs of severance entitlements under the Public Service of Ontario Act and unused vacation entitlements earned by employees during the year are accrued for in the financial statements. The cost of post-retirement non-pension benefits are paid by the Ministry of Government Services and are not included in the Statement of Operations.
The Centennial Centre of Science and Technology Statement of Financial Position As at March 31, 2013
PUBLIC ACCOUNTS, 2012-2013 1-319
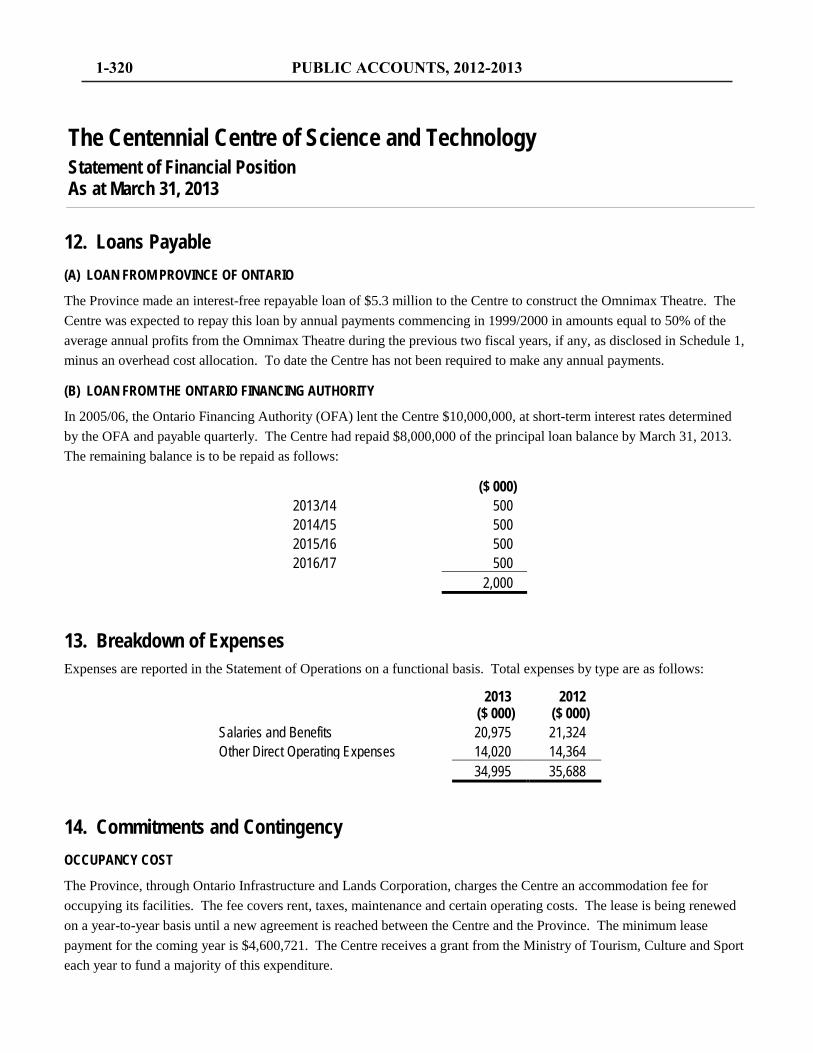
12. Loans Payable (A) LOAN FROM PROVINCE OF ONTARIO
The Province made an interest-free repayable loan of $5.3 million to the Centre to construct the Omnimax Theatre. The Centre was expected to repay this loan by annual payments commencing in 1999/2000 in amounts equal to 50% of the average annual profits from the Omnimax Theatre during the previous two fiscal years, if any, as disclosed in Schedule 1, minus an overhead cost allocation. To date the Centre has not been required to make any annual payments.
(B) LOAN FROM THE ONTARIO FINANCING AUTHORITY
In 2005/06, the Ontario Financing Authority (OFA) lent the Centre $10,000,000, at short-term interest rates determined by the OFA and payable quarterly. The Centre had repaid $8,000,000 of the principal loan balance by March 31, 2013. The remaining balance is to be repaid as follows:
($ 000) 2013/14 500 2014/15 500 2015/16 500 2016/17 500 2,000
13. Breakdown of Expenses Expenses are reported in the Statement of Operations on a functional basis. Total expenses by type are as follows:
2013 ($ 000)
2012 ($ 000)
Salaries and Benefits 20,975 21,324 Other Direct Operating Expenses 14,020 14,364 34,995 35,688
14. Commitments and Contingency OCCUPANCY COST
The Province, through Ontario Infrastructure and Lands Corporation, charges the Centre an accommodation fee for occupying its facilities. The fee covers rent, taxes, maintenance and certain operating costs. The lease is being renewed on a year-to-year basis until a new agreement is reached between the Centre and the Province. The minimum lease payment for the coming year is $4,600,721. The Centre receives a grant from the Ministry of Tourism, Culture and Sport each year to fund a majority of this expenditure.
The Centennial Centre of Science and Technology Statement of Financial Position As at March 31, 2013
1-320 PUBLIC ACCOUNTS, 2012-2013
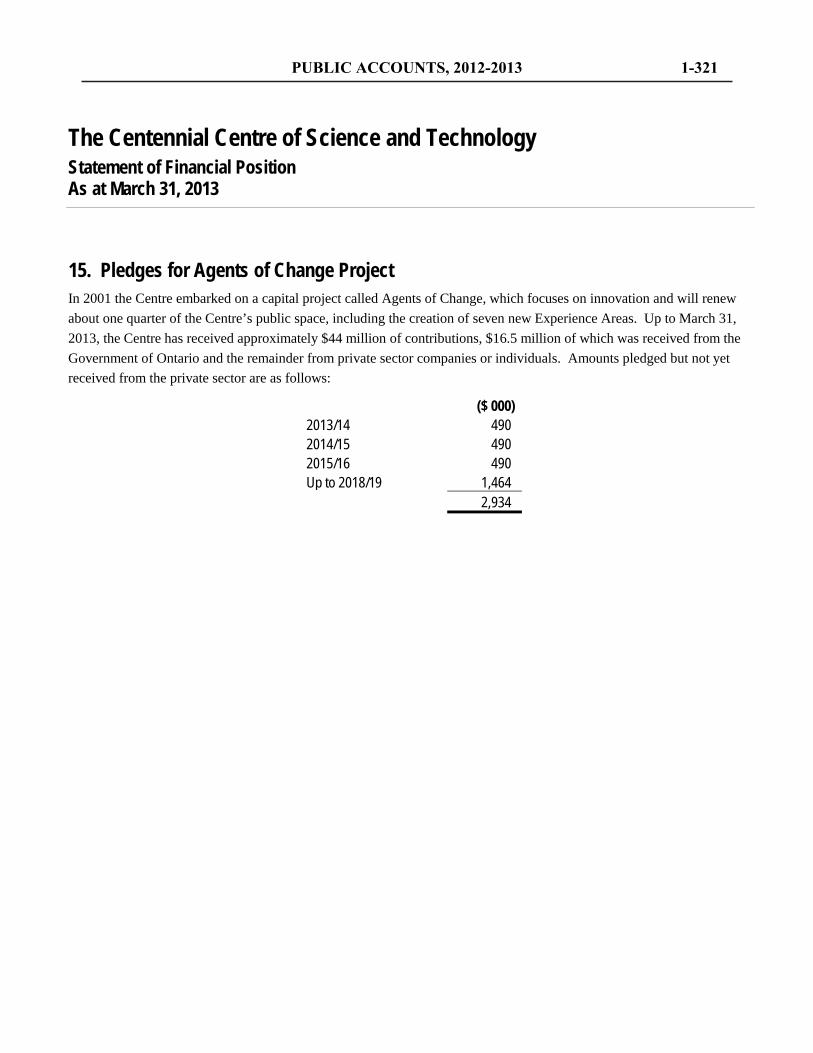
15. Pledges for Agents of Change Project In 2001 the Centre embarked on a capital project called Agents of Change, which focuses on innovation and will renew about one quarter of the Centre’s public space, including the creation of seven new Experience Areas. Up to March 31, 2013, the Centre has received approximately $44 million of contributions, $16.5 million of which was received from the Government of Ontario and the remainder from private sector companies or individuals. Amounts pledged but not yet received from the private sector are as follows:
($ 000) 2013/14 490 2014/15 490 2015/16 490 Up to 2018/19 1,464 2,934
The Centennial Centre of Science and Technology Statement of Financial Position As at March 31, 2013
PUBLIC ACCOUNTS, 2012-2013 1-321

Financial Statements
OSC ANNUAL REPORT 2013
Management’s Responsibility and Certification
Management is responsible for the integrity, consistency and reliability of the financial statements and other information presented in the annual report. The financial statements have been prepared by Management in accordance with International Financial Reporting Standards.
We certify that we have reviewed the financial statements and other information contained in the annual report, and, based on our knowledge, they do not contain any untrue statement of a material fact or omit to state a material fact required to be stated or that is necessary to make a statement not misleading in light of the circumstances under which it was made, with respect to the period covered by the statements and the annual report.
Based on our knowledge, the financial statements together with other financial information included in the annual report fairly present in all material respects the financial condition, results of operations and cash flows of the Ontario Securities Commission (the “OSC”) as of the dates and for the periods presented. The preparation of financial statements involves transactions affecting the current period which cannot be finalized with certainty until future periods. Estimates and assumptions are based on historical experience and current conditions, and are believed to be reasonable.
We are responsible for establishing and maintaining internal control over financial reporting for the OSC. We have designed such internal control over financial reporting, or caused it to be designed under our supervision, to provide reasonable assurance regarding the reliability of financial reporting and the preparation of financial statements for external purposes in accordance with Canadian generally accepted accounting principles.
We evaluated, or caused to be evaluated under our supervision, the effectiveness of the OSC’s internal control over financial reporting at the financial year-end and the OSC has disclosed in its annual MD&A our conclusion about the effectiveness of internal control over financial reporting at the financial year-end based on that evaluation.
We have also disclosed in the MD&A any change in our internal control over financial reporting that occurred during the year that has materially affected, or is reasonably likely to materially affect, our internal control over financial reporting.
The Board of Directors ensures that management fulfills its responsibility for financial reporting and internal control. The financial statements have been reviewed by the Audit and Finance Committee and approved by the Board of Directors. The Auditor General’s Report, which follows, outlines the scope of the Auditor’s examination and opinion on the financial statements.
May 21, 2013
Howard I. Wetston, Q.C.Chair and Chief Executive Officer
H.R. GossDirector, Corporate Services
ONTARIO SECURITIES COMMISSION
PUBLIC ACCOUNTS, 2012-2013 1-323
Financial Statements
OSC ANNUAL REPORT 2013
Independent Auditor’s Report
To the Ontario Securities Commission
I have audited the accompanying financial statements of the Ontario Securities Commission, which comprise the statement of financial position as at March 31, 2013, and the statement of comprehensive income, statement of changes in surplus and statement of cash flows for the year then ended, and a summary of significant accounting policies and other explanatory information.
Management’s Responsibility for the Financial Statements
Management is responsible for the preparation and fair presentation of these financial statements in accordance with International Financial Reporting Standards and for such internal control as management determines is necessary to enable the preparation of financial statements that are free from material misstatement, whether due to fraud or error.
Auditor’s Responsibility
My responsibility is to express an opinion on these financial statements based on my audit. I conducted my audit in accordance with Canadian generally accepted auditing standards. Those standards require that I comply with ethical requirements and plan and perform the audit to obtain reasonable assurance about whether the financial statements are free from material misstatement. An audit involves performing procedures to obtain audit evidence about the amounts and disclosures in the financial statements. The procedures selected depend on the auditor’s judgment, including the assessment of the risks of material misstatement of the financial statements, whether due to fraud or error. In making those risk assessments, the auditor considers internal control relevant to the entity’s preparation and fair presentation of the financial statements in order to design audit procedures that are appropriate in the circumstances, but not for the purpose of expressing an opinion on the effectiveness of the entity’s internal control. An audit also includes evaluating the appropriateness of accounting policies used and the reasonableness of accounting estimates made by management, as well as evaluating the overall presentation of the financial statements.
I believe that the audit evidence I have obtained is sufficient and appropriate to provide a basis for my audit opinion.
Opinion
In my opinion, the financial statements present fairly, in all material respects, the financial position of the Ontario Securities Commission as at March 31, 2013 and its financial performance, and its cash flows for the year then ended in accordance with International Financial Reporting Standards.
Gary R. Peall, CPA, CA, LPAActing Auditor General
May 21, 2013 Toronto, Ontario
1-324 PUBLIC ACCOUNTS, 2012-2013
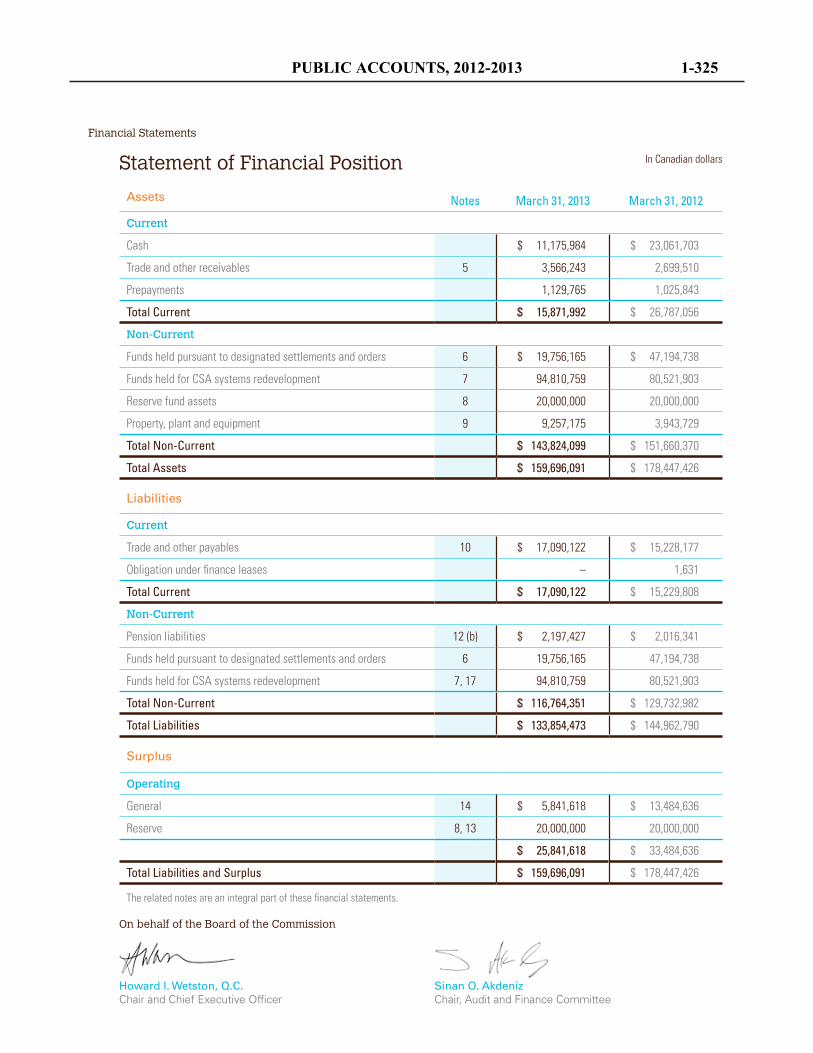
Financial Statements
Statement of Financial Position In Canadian dollars
Assets
Notes March 31, 2013 March 31, 2012
Current
Cash $ 11,175,984 $ 23,061,703
Trade and other receivables 5 3,566,243 2,699,510
Prepayments 1,129,765 1,025,843
Total Current $ 15,871,992 $ 26,787,056
Non-Current
Funds held pursuant to designated settlements and orders 6 $ 19,756,165 $ 47,194,738
Funds held for CSA systems redevelopment 7 94,810,759 80,521,903
Reserve fund assets 8 20,000,000 20,000,000
Property, plant and equipment 9 9,257,175 3,943,729
Total Non-Current $ 143,824,099 $ 151,660,370
Total Assets $ 159,696,091 $ 178,447,426
Liabilities
Current
Trade and other payables
10 $ 17,090,122 $ 15,228,177
Obligation under finance leases – 1,631
Total Current $ 17,090,122 $ 15,229,808
Non-Current
Pension liabilities 12 (b) $ 2,197,427 $ 2,016,341
Funds held pursuant to designated settlements and orders 6 19,756,165 47,194,738
Funds held for CSA systems redevelopment 7, 17 94,810,759 80,521,903
Total Non-Current
Total Liabilities
$ 116,764,351 $ 129,732,982
$ 133,854,473 $ 144,962,790
Surplus
Operating
General
14 $ 5,841,618 $ 13,484,636
Reserve 8, 13 20,000,000 20,000,000
$ 25,841,618 $ 33,484,636
Total Liabilities and Surplus $ 159,696,091 $ 178,447,426
The related notes are an integral part of these financial statements.
On behalf of the Board of the Commission
Howard I. Wetston, Q.C.Chair and Chief Executive Officer
Sinan O. AkdenizChair, Audit and Finance Committee
PUBLIC ACCOUNTS, 2012-2013 1-325
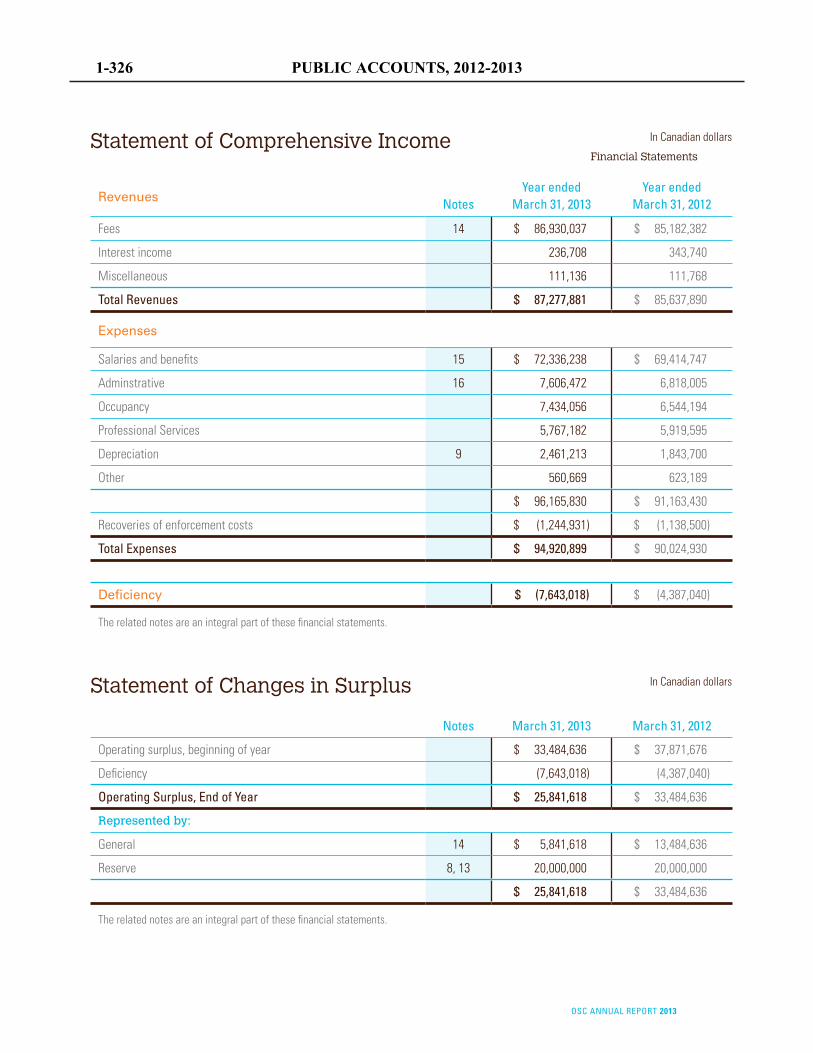
Financial Statements
OSC ANNUAL REPORT 2013
Statement of Comprehensive Income In Canadian dollars
Revenues
Notes
Year ended March 31, 2013
Year ended March 31, 2012
Fees 14 $ 86,930,037 $ 85,182,382
Interest income 236,708 343,740
Miscellaneous 111,136 111,768
Total Revenues $ 87,277,881 $ 85,637,890
Expenses
Salaries and benefits
15 $ 72,336,238 $ 69,414,747
Adminstrative 16 7,606,472 6,818,005
Occupancy 7,434,056 6,544,194
Professional Services 5,767,182 5,919,595
Depreciation 9 2,461,213 1,843,700
Other 560,669 623,189
$ 96,165,830 $ 91,163,430
Recoveries of enforcement costs $ (1,244,931) $ (1,138,500)
Total Expenses $ 94,920,899 $ 90,024,930
Deficiency $ (7,643,018) $ (4,387,040)
The related notes are an integral part of these financial statements.
Statement of Changes in Surplus In Canadian dollars
Notes
March 31, 2013 March 31, 2012
Operating surplus, beginning of year $ 33,484,636 $ 37,871,676
Deficiency (7,643,018) (4,387,040)
Operating Surplus, End of Year $ 25,841,618 $ 33,484,636
Represented by:
General 14 $ 5,841,618 $ 13,484,636
Reserve 8, 13 20,000,000 20,000,000
$ 25,841,618 $ 33,484,636
The related notes are an integral part of these financial statements.
1-326 PUBLIC ACCOUNTS, 2012-2013
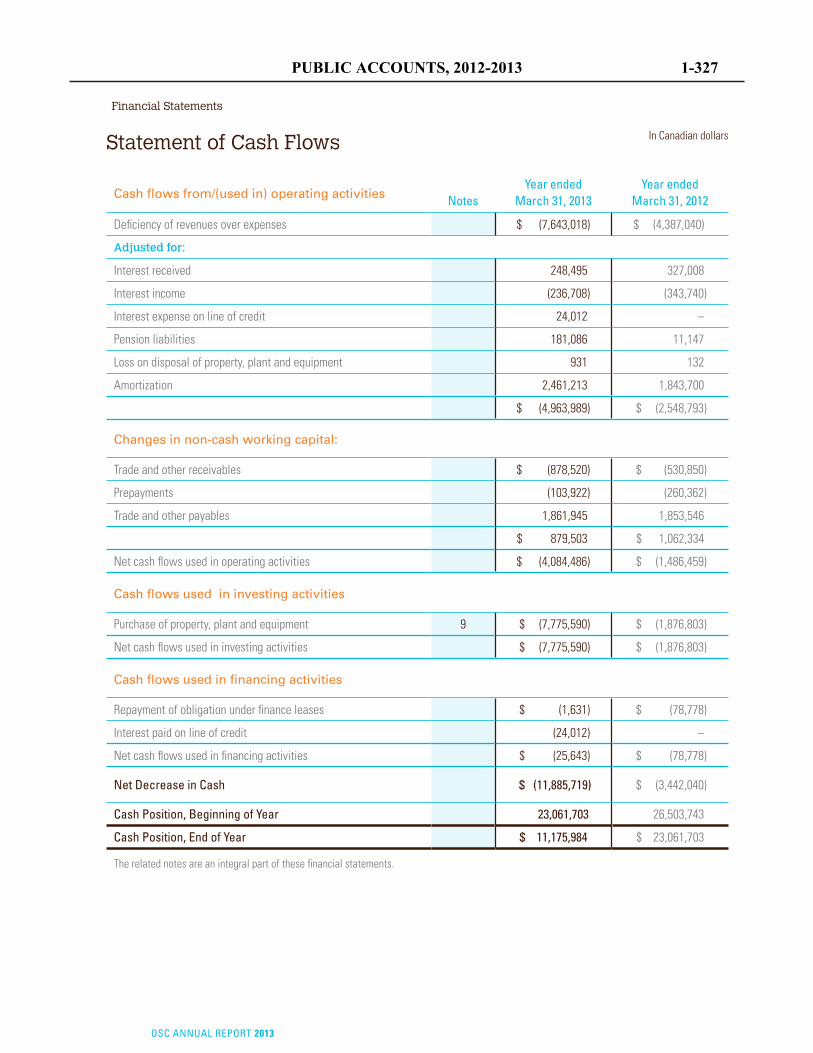
Financial Statements
OSC ANNUAL REPORT 2013
Statement of Cash Flows In Canadian dollars
Cash flows from/(used in) operating activities
Notes
Year ended March 31, 2013
Year ended March 31, 2012
Deficiency of revenues over expenses $ (7,643,018) $ (4,387,040)
Adjusted for:
Interest received 248,495 327,008
Interest income (236,708) (343,740)
Interest expense on line of credit 24,012 –
Pension liabilities 181,086 11,147
Loss on disposal of property, plant and equipment 931 132
Amortization 2,461,213 1,843,700
$ (4,963,989) $ (2,548,793)
Changes in non-cash working capital:
Trade and other receivables
$ (878,520) $ (530,850)
Prepayments (103,922) (260,362)
Trade and other payables 1,861,945 1,853,546
$ 879,503 $ 1,062,334
Net cash flows used in operating activities $ (4,084,486) $ (1,486,459)
Cash flows used in investing activities
Purchase of property, plant and equipment 9
$ (7,775,590) $ (1,876,803)
Net cash flows used in investing activities $ (7,775,590) $ (1,876,803)
Cash flows used in financing activities
Repayment of obligation under finance leases
$ (1,631) $ (78,778)
Interest paid on line of credit (24,012) –
Net cash flows used in financing activities $ (25,643) $ (78,778)
Net Decrease in Cash $ (11,885,719) $ (3,442,040)
Cash Position, Beginning of Year
Cash Position, End of Year
23,061,703 26,503,743
$ 11,175,984 $ 23,061,703
The related notes are an integral part of these financial statements.
PUBLIC ACCOUNTS, 2012-2013 1-327
Notes to the Financial Statements
March 31, 2013
OSC ANNUAL REPORT 2013
NOTES TO THEFINANCIAL STATEMENTS
1 Reporting EntityThe Ontario Securities Commission (the “OSC”) is a corporation domiciled in Canada. The address of the OSC’s registered office is 20 Queen Street West, Toronto, ON M5H 3S8. The OSC is a corporation without share capital and is the regulatory body responsible for regulating the province’s capital markets. As a Crown corporation, the OSC is exempt from income taxes.
2 Basis of Presentation
A. Statement of compliance
These financial statements are in accordance with International Financial Reporting Standards (IFRS). These financial statements for the year ended March 31, 2013 (including comparatives) were authorized for issue by the Board of Directors on May 21, 2013.
B. Basis of measurement
The financial statements have been prepared on the historical cost basis except for certain financial instruments that are measured at fair value and pension liabilities that are measured net of actuarial gain and losses, as explained in the accounting policies in the next section. Historical cost is generally based on the fair value of the consideration given in exchange for assets.
C. Functional and presentation currency
These financial statements are presented in Canadian dollars, which is the OSC’s functional currency, which have been rounded to the nearest dollar.
D. Use of judgments and estimates
The preparation of financial statements in accordance with IFRS requires that management make judgments, estimates and assumptions that affect the reported amounts of assets and liabilities as at the date of the financial statements, as well as the reported amounts of revenues and expenditures for the period. Actual amounts can differ from these estimates to the extent future outcomes differ significantly from management’s forecast expectations.
Estimates and underlying assumptions are reviewed on an ongoing basis. Revisions to accounting estimates are recognized in the period in which the estimates are revised and in any future periods affected.
1-328 PUBLIC ACCOUNTS, 2012-2013
Notes to the Financial Statements
OSC ANNUAL REPORT 2013
March 31, 2013
Judgments
The following are the judgments in applying accounting policies apart from those involving estimates that have the most significant effect on the amounts recognized in the financial statements.
Investor Education Fund (IEF or the “Fund”)
The IEF is a non-profit organization funded by settlements and fines from enforcement proceedings of the OSC. There are a number of areas where significant judgment is exercised to establish whether the Fund needs to be consolidated with the OSC. Key areas of judgment include: legal relationship, contractual terms, board and management representation, power to govern, benefits and materiality. The exercise of judgment in these areas determines whether the Fund is consolidated with the OSC. Details related to the IEF are set out in Note 19.
Estimates
The following are the key assumptions and other major sources of estimation uncertainty that have a significant risk of resulting in a material adjustment within the next financial year.
Designated settlements and orders and recovery of enforcement costs
Designated settlements and orders and recovery of enforcement costs are recognized net of amounts deemed uncollectible and when it is expected that the amount related to the sanction imposed on respondents is collectible. Significant consideration is given to determine the recognition of designated settlements and orders and recovery of enforcement costs. Key areas considered include: the ability of the respondent to pay the sanction amount, the residency of the respondent and whether the respondent owns any assets. A change in any of the above areas can have a material impact on the OSC’s financial statements. Assets and liabilities will change related to designated settlements and orders and expenses will change related to the recoveries of enforcement costs. Details of designated settlements and orders are set out in Note 6.
PUBLIC ACCOUNTS, 2012-2013 1-329

Notes to the Financial Statements
March 31, 2013
OSC ANNUAL REPORT 2013
3 Significant Accounting Policies
The following accounting policies have been applied consistently to all periods presented in these financial statements.
A. Financial Instruments
Financial assets and financial liabilities are recognized when the OSC becomes a party to the contractual provisions of the instrument.
Financial instruments are classified into one of the following categories: financial assets at fair value through profit or loss, loans and receivables, and other liabilities.
Financial assets and financial liabilities are measured initially at fair value plus transactions costs, except for financial assets carried at fair value through profit or loss, which are measured initially at fair value.
Financial assets are derecognized when the contractual rights to the cash flows from the financial asset expire, or when the financial asset and all substantial risks and rewards are transferred.
A financial liability is derecognized when it is extinguished, discharged, cancelled or expired.
The OSC has adopted the following classifications for financial assets
and financial liabilities:
Loans and receivables
Trade and other receivables and receivables from designated settlements and orders are classified as loans and receivables and are measured at amortized cost, less any impairment loss. Impairment provisions are recognized when there is objective evidence (such as significant financial difficulties on the part of a market participant, or default or significant delay in payment) that the OSC will be unable to collect all of the amounts due under the terms of the amount receivable.
Financial assets at fair value through profit or loss
Cash, Funds held pursuant to designated settlements and orders, Funds held for the Canadian Securities Administrators (CSA) systems redevelopment and Reserve fund assets are classified as held-for-trading and recorded at fair value.
Other liabilities
Trade and other payables are classified as other liabilities and measured at amortized cost.
1-330 PUBLIC ACCOUNTS, 2012-2013
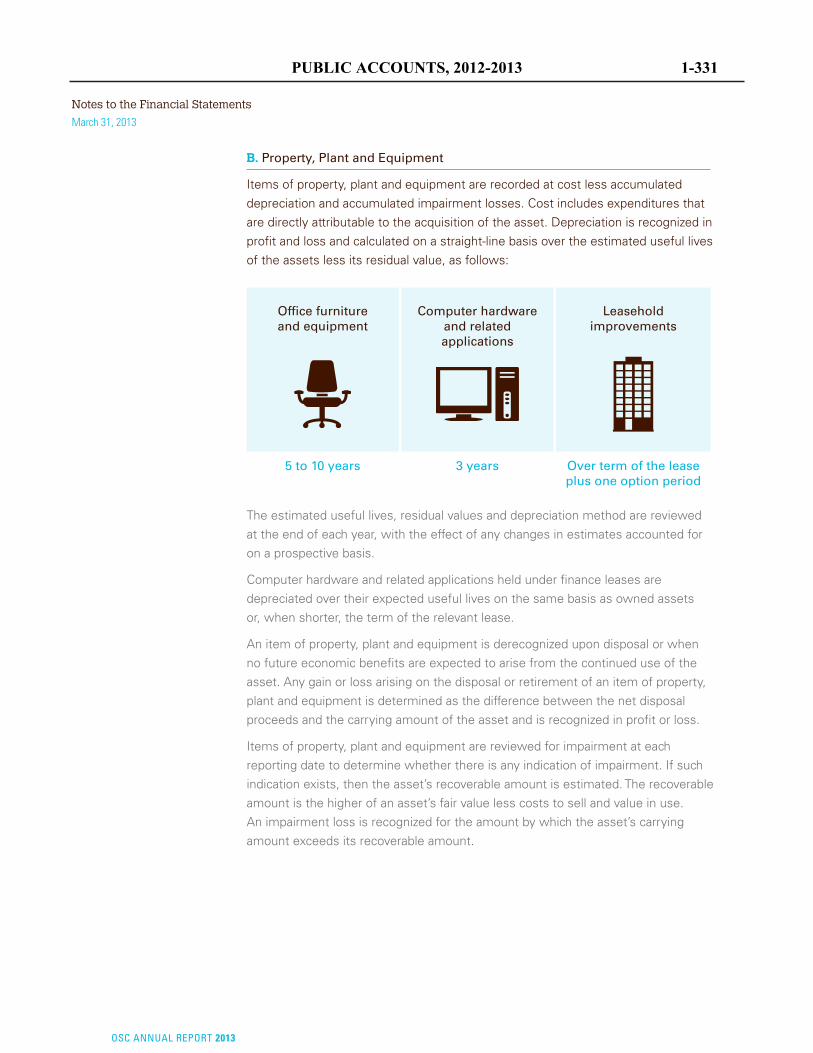
Notes to the Financial Statements
OSC ANNUAL REPORT 2013
March 31, 2013
B. Property, Plant and Equipment
Items of property, plant and equipment are recorded at cost less accumulated depreciation and accumulated impairment losses. Cost includes expenditures that are directly attributable to the acquisition of the asset. Depreciation is recognized in profit and loss and calculated on a straight-line basis over the estimated useful lives of the assets less its residual value, as follows:
Office furniture and equipment
5 to 10 years
Computer hardware and related applications
3 years
Leasehold improvements
Over term of the lease plus one option period
The estimated useful lives, residual values and depreciation method are reviewed at the end of each year, with the effect of any changes in estimates accounted for on a prospective basis.
Computer hardware and related applications held under finance leases are depreciated over their expected useful lives on the same basis as owned assets or, when shorter, the term of the relevant lease.
An item of property, plant and equipment is derecognized upon disposal or when no future economic benefits are expected to arise from the continued use of the asset. Any gain or loss arising on the disposal or retirement of an item of property, plant and equipment is determined as the difference between the net disposal proceeds and the carrying amount of the asset and is recognized in profit or loss.
Items of property, plant and equipment are reviewed for impairment at each reporting date to determine whether there is any indication of impairment. If such indication exists, then the asset’s recoverable amount is estimated. The recoverable amount is the higher of an asset’s fair value less costs to sell and value in use. An impairment loss is recognized for the amount by which the asset’s carrying amount exceeds its recoverable amount.
PUBLIC ACCOUNTS, 2012-2013 1-331
Notes to the Financial Statements
March 31, 2013
OSC ANNUAL REPORT 2013
C. Revenue Recognition
Fees are recognized when services are rendered, which is normally upon receipt.
Participation fees
Participation fees are recognized when received because these fees cannot be measured reliably as market capitalization of issuers or the specified Ontario revenue of registrants, on which their participation fees are based, is not determinable prior to receipt. These fees represent the payment for the right to participate in the Ontario capital markets and the OSC has no specific obligations throughout the year to any individual market participant. As such, the OSC’s performance consists of a single act, being the payment of the fee. Once the fee is paid, there is no obligation to refund the fees and there are no other unfulfilled conditions on behalf of the OSC. Therefore, participation fees are deemed to be earned upon receipt.
Activity fees
Activity fees represent the direct cost of OSC staff resources expended in undertaking certain activities requested of staff by market participants. Because the activities undertaken are normally completed in a relatively short period of time, activity fees are recognized when received.
Late filing fees
Late filing fees in respect of insider trading reports are recognized weekly and include fees related to all insider trading reports filed late in the preceding seven-day period.
Recoveries of enforcement costs
Recoveries of enforcement costs are recorded as offsets to total expenses on the date a settlement is approved or an order issued by the OSC, unless management determines there is significant doubt as to ultimate collection, in which case recovery is recognized when cash is received.
D. Funds Held Pursuant to Designated Settlements and Orders
Funds held pursuant to designated settlements and orders are recorded when settlements are approved or orders made by the Commission, unless management determines there is significant doubt as to ultimate collection, in which case they are recognized when cash is received.
1-332 PUBLIC ACCOUNTS, 2012-2013
Notes to the Financial Statements
OSC ANNUAL REPORT 2013
March 31, 2013
E. Employee Benefits
Ontario’s Public Service Pension Plan
The OSC provides pension benefits to its full-time employees through participation in Ontario’s Public Service Pension Plan, which is a multi-employer defined benefit pension plan. This plan is accounted for as a defined contribution plan, as sufficient information is not available to apply defined benefit plan accounting to this pension plan. The Province of Ontario is the sole sponsor of the Public Service Pension Plan. As the sponsor is responsible for ensuring that the pension funds are financially viable, any surpluses or unfunded liabilities arising from statutory actuarial funding valuations are not assets or obligations of the OSC. Payments made to the above plan are recognized as an expense when employees have rendered service entitling them to the contributions.
Supplemental Pension Plan
The OSC also maintains unfunded supplemental pension plans for certain full-time Commission members as described in Note 12(b). The liability recognized in the statement of financial position for the supplemental pension plans is the present value of the defined benefit obligation at the reporting date together with adjustments for unrecognized actuarial gains or losses and past service costs. The actuarial liability and the current service cost are determined by independent actuaries using the projected benefit method prorated on services and management’s best estimate assumptions.
The OSC recognizes all actuarial gains and losses arising from the supplemental pension plans in profit and loss using the corridor method.
Other post-employment obligations
The costs of non-pension benefits for eligible pensioners are paid by the Government of Ontario and are not included in the statement of comprehensive income as described in Note 18(b).
Termination benefits
Termination benefits are generally payable when employment is terminated before the normal retirement date or whenever an employee accepts voluntary redundancy in exchange for these benefits. The OSC recognizes termination benefits when it is demonstrably committed to either terminating the employment of current employees according to a detailed formal plan without a realistic possibility of withdrawal or providing termination benefits as a result of an offer made to encourage voluntary redundancy.
Short-term benefits
Short-term employee benefits, such as salaries, pension contributions, paid annual leaves and bonuses, are measured on an undiscounted basis and are expensed as the related service is provided.
PUBLIC ACCOUNTS, 2012-2013 1-333
Notes to the Financial Statements
March 31, 2013
OSC ANNUAL REPORT 2013
F. Leases
Leases of property, plant and equipment are classified as finance leases when the OSC obtains substantially all the risks and rewards of ownership of the underlying assets. At the inception of the lease, the OSC records an asset together with a corresponding long-term liability at the lower of the fair value of the leased asset or the present value of the minimum lease payments. Any initial direct costs are added to the amount recognized as an asset. Thereafter, the asset is amortized over the shorter of its useful life and the lease term. Minimum lease payments are apportioned between the finance charge and the reduction of the outstanding liability. The finance charge is allocated to each period during the lease term so as to produce a constant periodic rate of interest on the remaining balance of the liability.
All other leases are classified as operating leases. Lease payments are expensed on a straight-line basis over the term of the lease.
In the event that lease incentives are received to enter into operating leases, the aggregate benefit of incentives is recognized as a reduction of rental expense on a straight-line basis, except where another systematic basis is more representative of the time pattern in which economic benefits from the leased asset are consumed.
G. Provisions
Legal
A provision is recognized when a present legal or constructive obligation results from past events, it is probable that an outflow of resources will be required to settle the obligation and when a reliable estimate of the amount of the obligation can be made.
1-334 PUBLIC ACCOUNTS, 2012-2013
Notes to the Financial Statements
OSC ANNUAL REPORT 2013
March 31, 2013
4 Financial Instruments RisksThe OSC is exposed to various risks in relation to financial instruments. The OSC’s objective is to maintain a minimal risk. The OSC’s financial assets and liabilities by category are summarized in Note 3. The main types of risks related to the OSC’s financial instruments are currency risk, interest rate risk, credit risk and liquidity risk. This note presents information about the OSC’s exposure to these risks and the OSC’s objectives, policies and processes for measuring and managing these risks.
Currency Risk
The OSC’s exposure to currency risk is minimal as only a small number of transactions are in currencies other than Canadian dollars.
Interest Rate Risk
The OSC’s financial assets and liabilities are not exposed to significant interest rate risk due to their short-term nature. The OSC’s Cash, Funds held pursuant to designated settlements and orders, Funds held for CSA systems redevelopment and Reserve fund assets are held by Schedule 1 banks. As of February 1, 2013, the bank balances earn interest at a rate of 1.85% (2012 – 1.75%) below the prime rate, the average rate of interest earned for the year was 1.22% (2012 – 1.25%). The Reserve fund earned interest at an average rate of 1.23% (2012 – 1.34%).
A 25 basis points change in the interest rate would impact the OSC’s operating surplus as follows:
Impact on operating surplus
25 basis points increase in rates
25 basis points decrease in rates
Reserve fund assets
$ 17,387 $ (17,387)
Cash balance 30,961 (30,961)
$ 48,348 $ (48,348)
Credit Risk
The OSC is exposed to minimal credit risk related to Cash, Funds held pursuant to designated settlements and orders, Funds held for CSA systems redevelopment, Reserve fund assets and trade and other receivables.
The Schedule 1 banks hold approximately 98% of the OSC’s financial assets; however, given the nature of this counterparty, it is management’s opinion that exposure to concentration of credit risk is minimal. Additionally, the investment policy for Cash and for Funds held pursuant to designated settlements and orders was revised and now limits amounts held on deposit in any one of the Schedule 1 banks to $30,000,000 for each category.
PUBLIC ACCOUNTS, 2012-2013 1-335
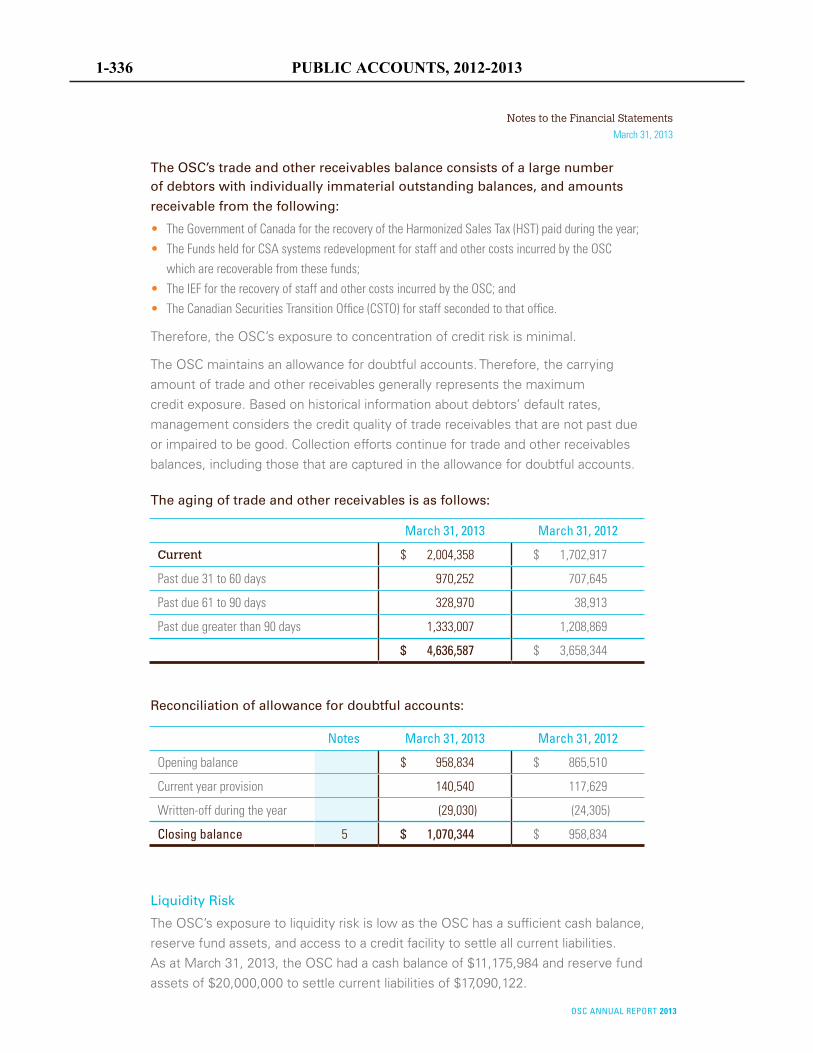
Notes to the Financial Statements
March 31, 2013
OSC ANNUAL REPORT 2013
The OSC’s trade and other receivables balance consists of a large number of debtors with individually immaterial outstanding balances, and amounts
receivable from the following:
• The Government of Canada for the recovery of the Harmonized Sales Tax (HST) paid during the year; • The Funds held for CSA systems redevelopment for staff and other costs incurred by the OSC
which are recoverable from these funds; • The IEF for the recovery of staff and other costs incurred by the OSC; and • The Canadian Securities Transition Office (CSTO) for staff seconded to that office.
Therefore, the OSC’s exposure to concentration of credit risk is minimal.
The OSC maintains an allowance for doubtful accounts. Therefore, the carrying amount of trade and other receivables generally represents the maximum credit exposure. Based on historical information about debtors’ default rates, management considers the credit quality of trade receivables that are not past due or impaired to be good. Collection efforts continue for trade and other receivables balances, including those that are captured in the allowance for doubtful accounts.
The aging of trade and other receivables is as follows:
March 31, 2013 March 31, 2012
Current
$ 2,004,358 $ 1,702,917
Past due 31 to 60 days 970,252 707,645
Past due 61 to 90 days 328,970 38,913
Past due greater than 90 days 1,333,007 1,208,869
$ 4,636,587 $ 3,658,344
Reconciliation of allowance for doubtful accounts:
Notes
March 31, 2013 March 31, 2012
Opening balance $ 958,834 $ 865,510
Current year provision 140,540 117,629
Written-off during the year (29,030) (24,305)
Closing balance 5 $ 1,070,344 $ 958,834
Liquidity Risk
The OSC’s exposure to liquidity risk is low as the OSC has a sufficient cash balance, reserve fund assets, and access to a credit facility to settle all current liabilities. As at March 31, 2013, the OSC had a cash balance of $11,175,984 and reserve fund assets of $20,000,000 to settle current liabilities of $17,090,122.
1-336 PUBLIC ACCOUNTS, 2012-2013
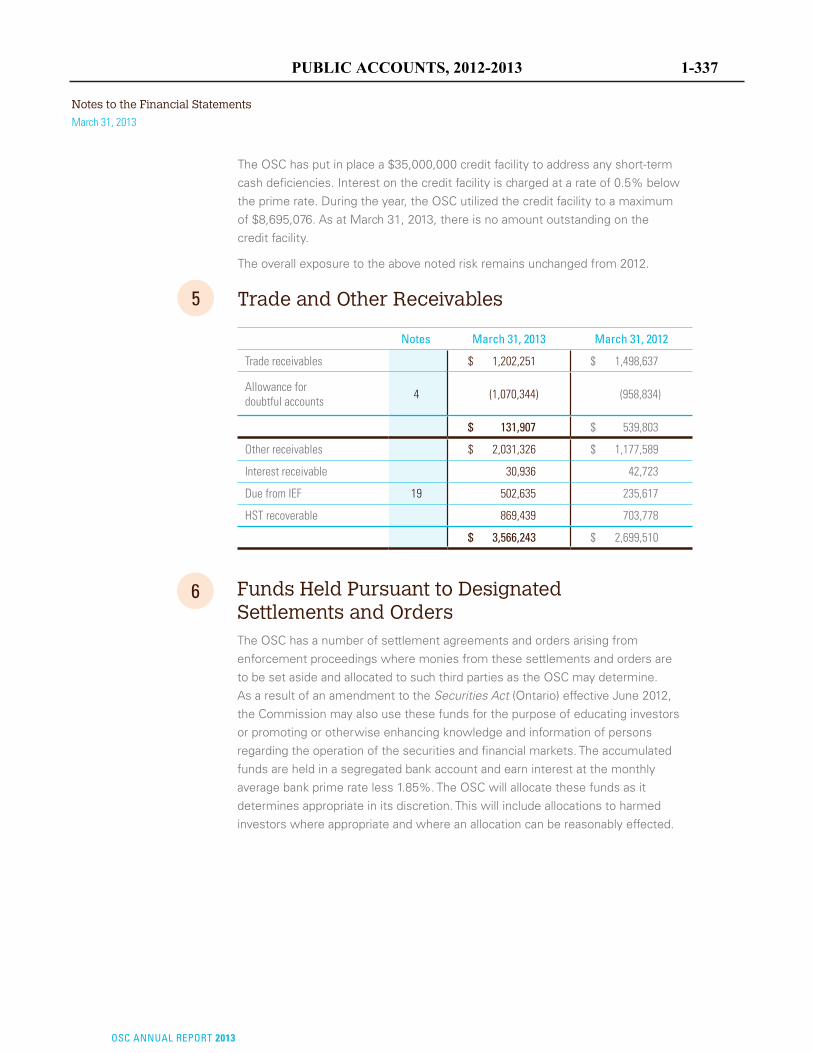
Notes to the Financial Statements
OSC ANNUAL REPORT 2013
March 31, 2013
The OSC has put in place a $35,000,000 credit facility to address any short-term cash deficiencies. Interest on the credit facility is charged at a rate of 0.5% below the prime rate. During the year, the OSC utilized the credit facility to a maximum of $8,695,076. As at March 31, 2013, there is no amount outstanding on the credit facility.
The overall exposure to the above noted risk remains unchanged from 2012.
5 Trade and Other Receivables
Notes March 31, 2013 March 31, 2012
Trade receivables $ 1,202,251 $ 1,498,637
Allowance for doubtful accounts 4 (1,070,344) (958,834)
$ 131,907 $ 539,803
Other receivables $ 2,031,326 $ 1,177,589
Interest receivable 30,936 42,723
Due from IEF 19 502,635 235,617
HST recoverable 869,439 703,778
$ 3,566,243 $ 2,699,510
6 Funds Held Pursuant to Designated Settlements and OrdersThe OSC has a number of settlement agreements and orders arising from enforcement proceedings where monies from these settlements and orders are to be set aside and allocated to such third parties as the OSC may determine. As a result of an amendment to the Securities Act (Ontario) effective June 2012, the Commission may also use these funds for the purpose of educating investors or promoting or otherwise enhancing knowledge and information of persons regarding the operation of the securities and financial markets. The accumulated funds are held in a segregated bank account and earn interest at the monthly average bank prime rate less 1.85%. The OSC will allocate these funds as it determines appropriate in its discretion. This will include allocations to harmed investors where appropriate and where an allocation can be reasonably effected.
PUBLIC ACCOUNTS, 2012-2013 1-337
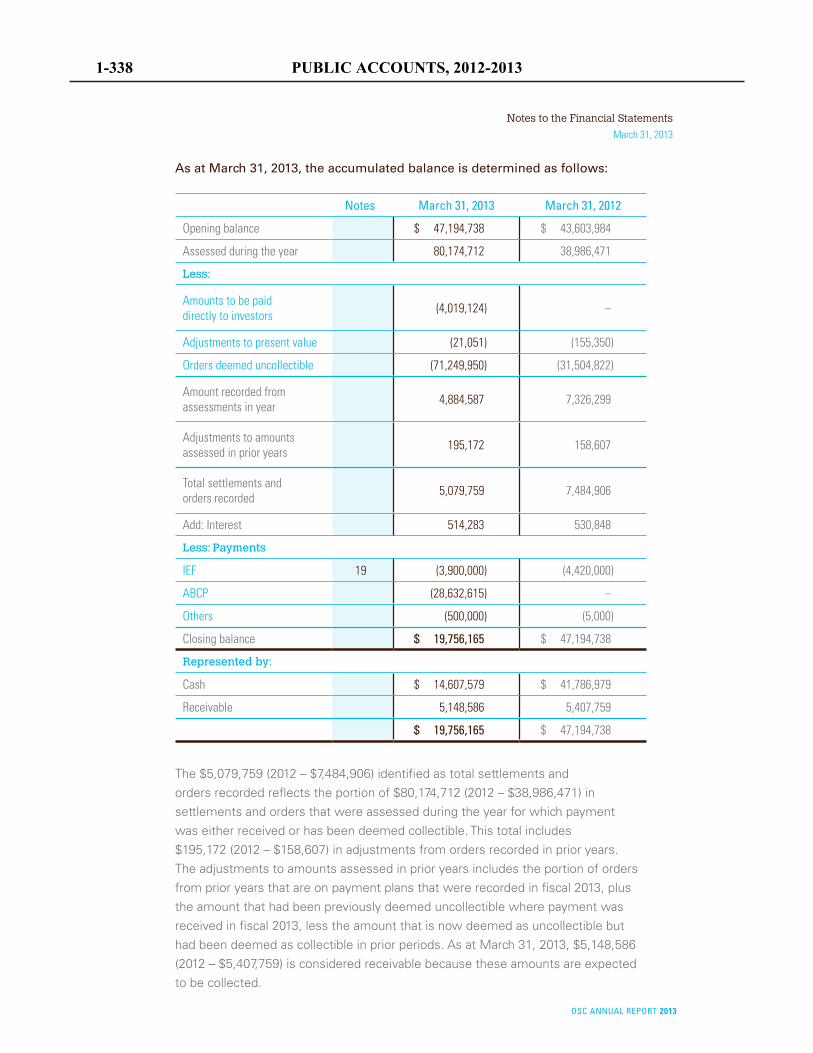
Notes to the Financial Statements
March 31, 2013
OSC ANNUAL REPORT 2013
As at March 31, 2013, the accumulated balance is determined as follows:
Notes March 31, 2013 March 31, 2012
Opening balance $ 47,194,738 $ 43,603,984
Assessed during the year 80,174,712 38,986,471
Less:
Amounts to be paid directly to investors (4,019,124) –
Adjustments to present value (21,051) (155,350)
Orders deemed uncollectible (71,249,950) (31,504,822)
Amount recorded from assessments in year 4,884,587 7,326,299
Adjustments to amounts assessed in prior years 195,172 158,607
Total settlements and orders recorded 5,079,759 7,484,906
Add: Interest 514,283 530,848
Less: Payments
IEF 19 (3,900,000) (4,420,000)
ABCP (28,632,615) –
Others (500,000) (5,000)
Closing balance $ 19,756,165 $ 47,194,738
Represented by:
Cash $ 14,607,579 $ 41,786,979
Receivable 5,148,586 5,407,759
$ 19,756,165 $ 47,194,738
The $5,079,759 (2012 – $7,484,906) identified as total settlements and orders recorded reflects the portion of $80,174,712 (2012 – $38,986,471) in settlements and orders that were assessed during the year for which payment was either received or has been deemed collectible. This total includes $195,172 (2012 – $158,607) in adjustments from orders recorded in prior years. The adjustments to amounts assessed in prior years includes the portion of orders from prior years that are on payment plans that were recorded in fiscal 2013, plus the amount that had been previously deemed uncollectible where payment was received in fiscal 2013, less the amount that is now deemed as uncollectible but had been deemed as collectible in prior periods. As at March 31, 2013, $5,148,586 (2012 – $5,407,759) is considered receivable because these amounts are expected to be collected.
1-338 PUBLIC ACCOUNTS, 2012-2013
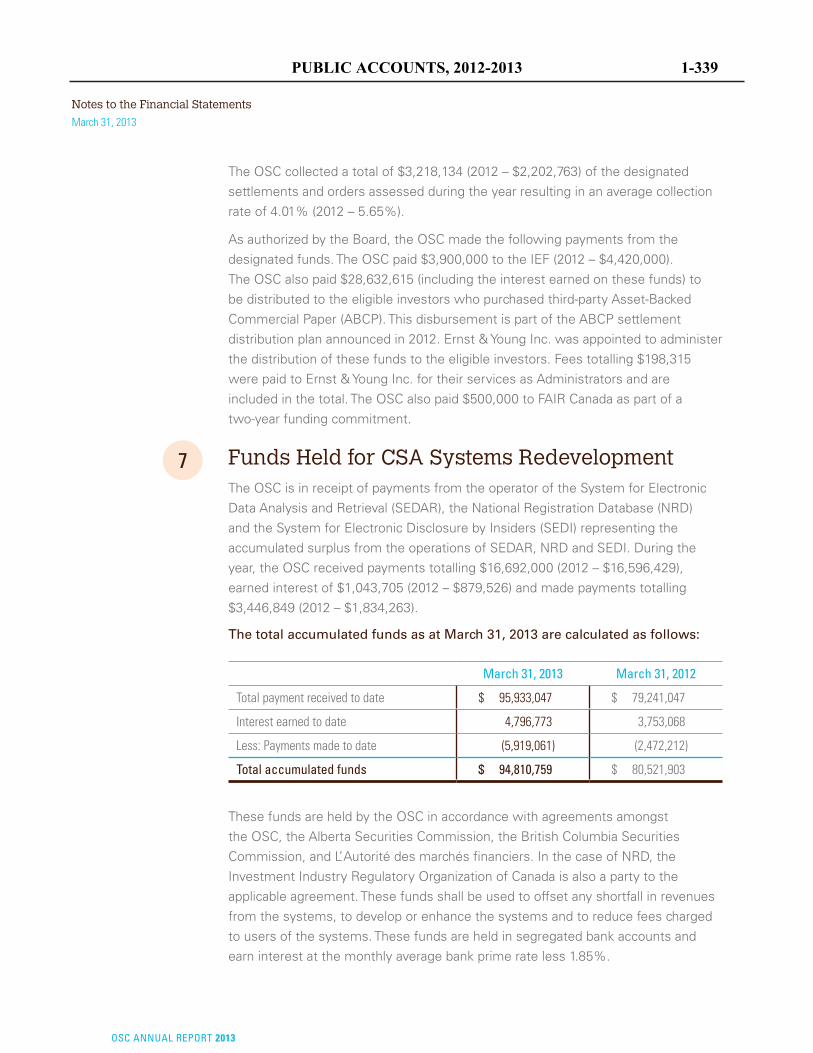
Notes to the Financial Statements
OSC ANNUAL REPORT 2013
March 31, 2013
The OSC collected a total of $3,218,134 (2012 – $2,202,763) of the designated settlements and orders assessed during the year resulting in an average collection rate of 4.01% (2012 – 5.65%).
As authorized by the Board, the OSC made the following payments from the designated funds. The OSC paid $3,900,000 to the IEF (2012 – $4,420,000). The OSC also paid $28,632,615 (including the interest earned on these funds) to be distributed to the eligible investors who purchased third-party Asset-Backed Commercial Paper (ABCP). This disbursement is part of the ABCP settlement distribution plan announced in 2012. Ernst & Young Inc. was appointed to administer the distribution of these funds to the eligible investors. Fees totalling $198,315 were paid to Ernst & Young Inc. for their services as Administrators and are included in the total. The OSC also paid $500,000 to FAIR Canada as part of a two-year funding commitment.
7 Funds Held for CSA Systems RedevelopmentThe OSC is in receipt of payments from the operator of the System for Electronic Data Analysis and Retrieval (SEDAR), the National Registration Database (NRD) and the System for Electronic Disclosure by Insiders (SEDI) representing the accumulated surplus from the operations of SEDAR, NRD and SEDI. During the year, the OSC received payments totalling $16,692,000 (2012 – $16,596,429), earned interest of $1,043,705 (2012 – $879,526) and made payments totalling $3,446,849 (2012 – $1,834,263).
The total accumulated funds as at March 31, 2013 are calculated as follows:
March 31, 2013 March 31, 2012
Total payment received to date
$ 95,933,047 $ 79,241,047
Interest earned to date 4,796,773 3,753,068
Less: Payments made to date (5,919,061) (2,472,212)
Total accumulated funds $ 94,810,759 $ 80,521,903
These funds are held by the OSC in accordance with agreements amongst the OSC, the Alberta Securities Commission, the British Columbia Securities Commission, and L’Autorité des marchés financiers. In the case of NRD, the Investment Industry Regulatory Organization of Canada is also a party to the applicable agreement. These funds shall be used to offset any shortfall in revenues from the systems, to develop or enhance the systems and to reduce fees charged to users of the systems. These funds are held in segregated bank accounts and earn interest at the monthly average bank prime rate less 1.85%.
PUBLIC ACCOUNTS, 2012-2013 1-339
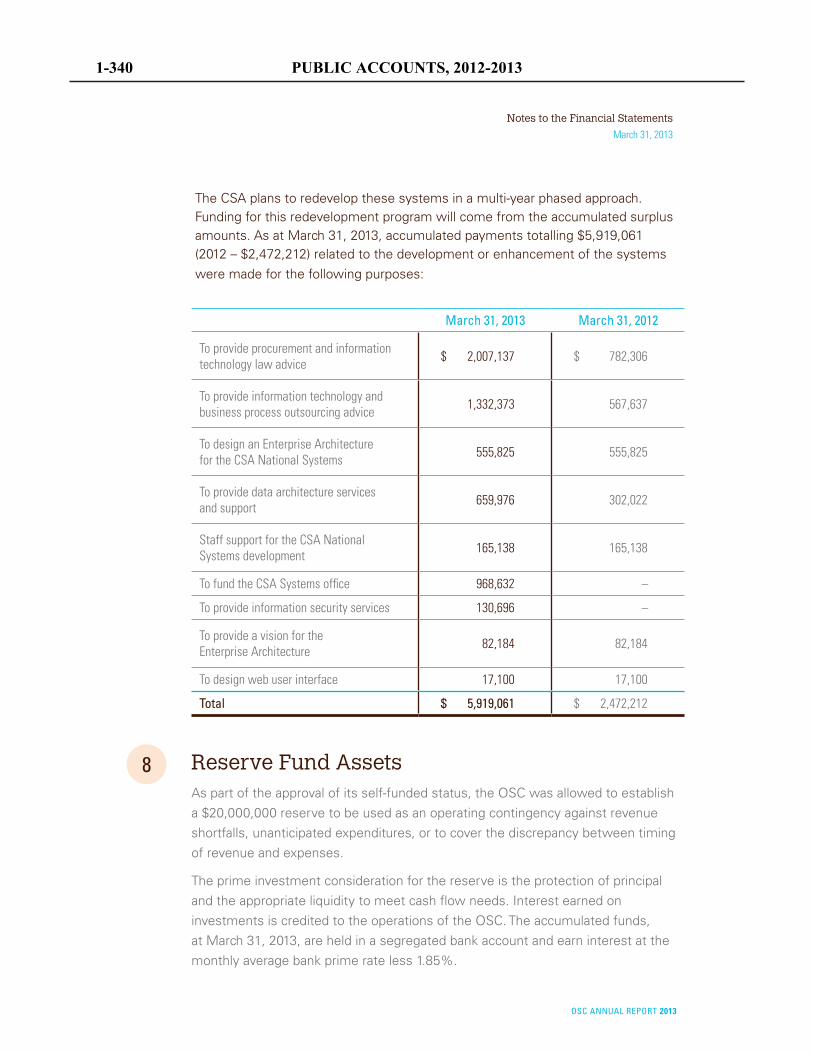
Notes to the Financial Statements
March 31, 2013
OSC ANNUAL REPORT 2013
The CSA plans to redevelop these systems in a multi-year phased approach. Funding for this redevelopment program will come from the accumulated surplus amounts. As at March 31, 2013, accumulated payments totalling $5,919,061 (2012 – $2,472,212) related to the development or enhancement of the systems were made for the following purposes:
March 31, 2013 March 31, 2012
To provide procurement and information technology law advice
$ 2,007,137 $ 782,306
To provide information technology and business process outsourcing advice 1,332,373 567,637
To design an Enterprise Architecture for the CSA National Systems 555,825 555,825
To provide data architecture services and support 659,976 302,022
Staff support for the CSA National Systems development 165,138 165,138
To fund the CSA Systems office 968,632 –
To provide information security services 130,696 –
To provide a vision for the Enterprise Architecture 82,184 82,184
To design web user interface 17,100 17,100
Total $ 5,919,061 $ 2,472,212
8 Reserve Fund AssetsAs part of the approval of its self-funded status, the OSC was allowed to establish a $20,000,000 reserve to be used as an operating contingency against revenue shortfalls, unanticipated expenditures, or to cover the discrepancy between timing of revenue and expenses.
The prime investment consideration for the reserve is the protection of principal and the appropriate liquidity to meet cash flow needs. Interest earned on investments is credited to the operations of the OSC. The accumulated funds, at March 31, 2013, are held in a segregated bank account and earn interest at the monthly average bank prime rate less 1.85%.
1-340 PUBLIC ACCOUNTS, 2012-2013
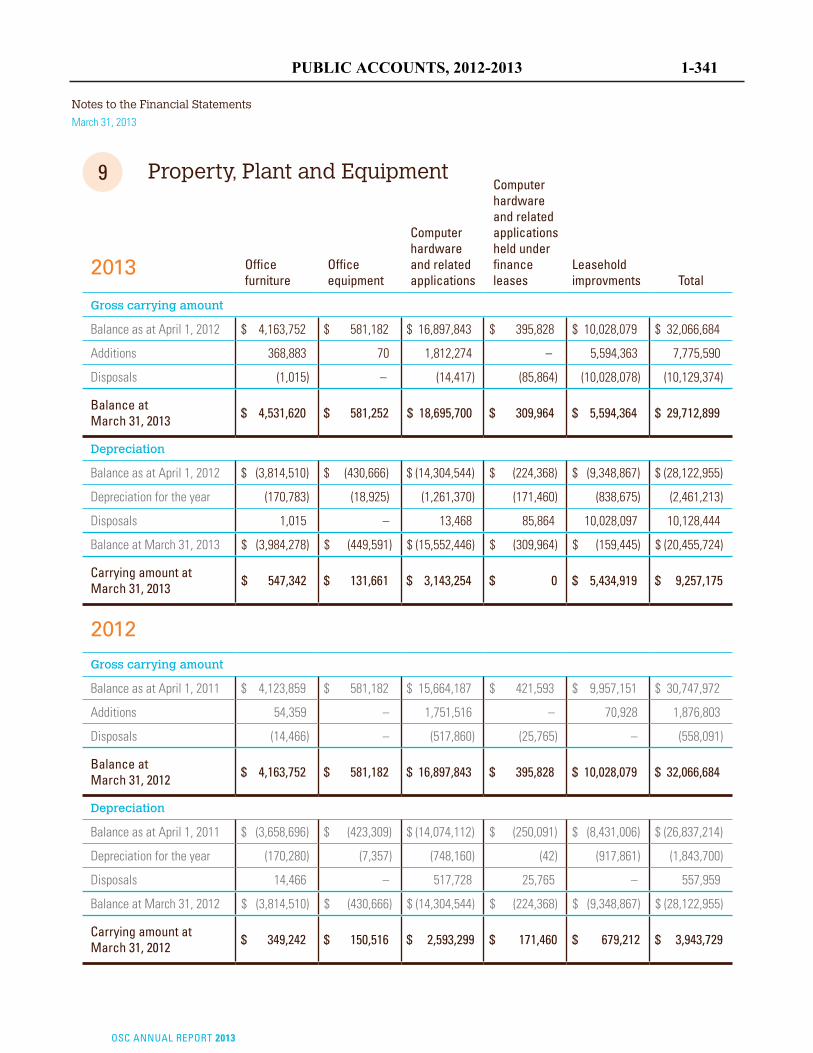
Notes to the Financial Statements
OSC ANNUAL REPORT 2013
March 31, 2013
9 Property, Plant and Equipment
2013
Office furniture
Office equipment
Computer hardware and related applications
Computer hardware and related applications held under finance leases
Leasehold improvments Total
Gross carrying amount
Balance as at April 1, 2012 $ 4,163,752 $ 581,182 $ 16,897,843 $ 395,828 $ 10,028,079 $ 32,066,684
Additions 368,883 70 1,812,274 – 5,594,363 7,775,590
Disposals (1,015) – (14,417) (85,864) (10,028,078) (10,129,374)
Balance at March 31, 2013 $ 4,531,620 $ 581,252 $ 18,695,700 $ 309,964 $ 5,594,364 $ 29,712,899
Depreciation
Balance as at April 1, 2012 $ (3,814,510) $ (430,666) $ (14,304,544) $ (224,368) $ (9,348,867) $ (28,122,955)
Depreciation for the year (170,783) (18,925) (1,261,370) (171,460) (838,675) (2,461,213)
Disposals 1,015 – 13,468 85,864 10,028,097 10,128,444
Balance at March 31, 2013 $ (3,984,278) $ (449,591) $ (15,552,446) $ (309,964) $ (159,445) $ (20,455,724)
Carrying amount at March 31, 2013 $ 547,342 $ 131,661 $ 3,143,254 $ 0 $ 5,434,919 $ 9,257,175
2012
Gross carrying amount
Balance as at April 1, 2011
$ 4,123,859 $ 581,182 $ 15,664,187 $ 421,593 $ 9,957,151 $ 30,747,972
Additions 54,359 – 1,751,516 – 70,928 1,876,803
Disposals (14,466) – (517,860) (25,765) – (558,091)
Balance at March 31, 2012 $ 4,163,752 $ 581,182 $ 16,897,843 $ 395,828 $ 10,028,079 $ 32,066,684
Depreciation
Balance as at April 1, 2011 $ (3,658,696) $ (423,309) $ (14,074,112) $ (250,091) $ (8,431,006) $ (26,837,214)
Depreciation for the year (170,280) (7,357) (748,160) (42) (917,861) (1,843,700)
Disposals 14,466 – 517,728 25,765 – 557,959
Balance at March 31, 2012 $ (3,814,510) $ (430,666) $ (14,304,544) $ (224,368) $ (9,348,867) $ (28,122,955)
Carrying amount at March 31, 2012 $ 349,242 $ 150,516 $ 2,593,299 $ 171,460 $ 679,212 $ 3,943,729
PUBLIC ACCOUNTS, 2012-2013 1-341
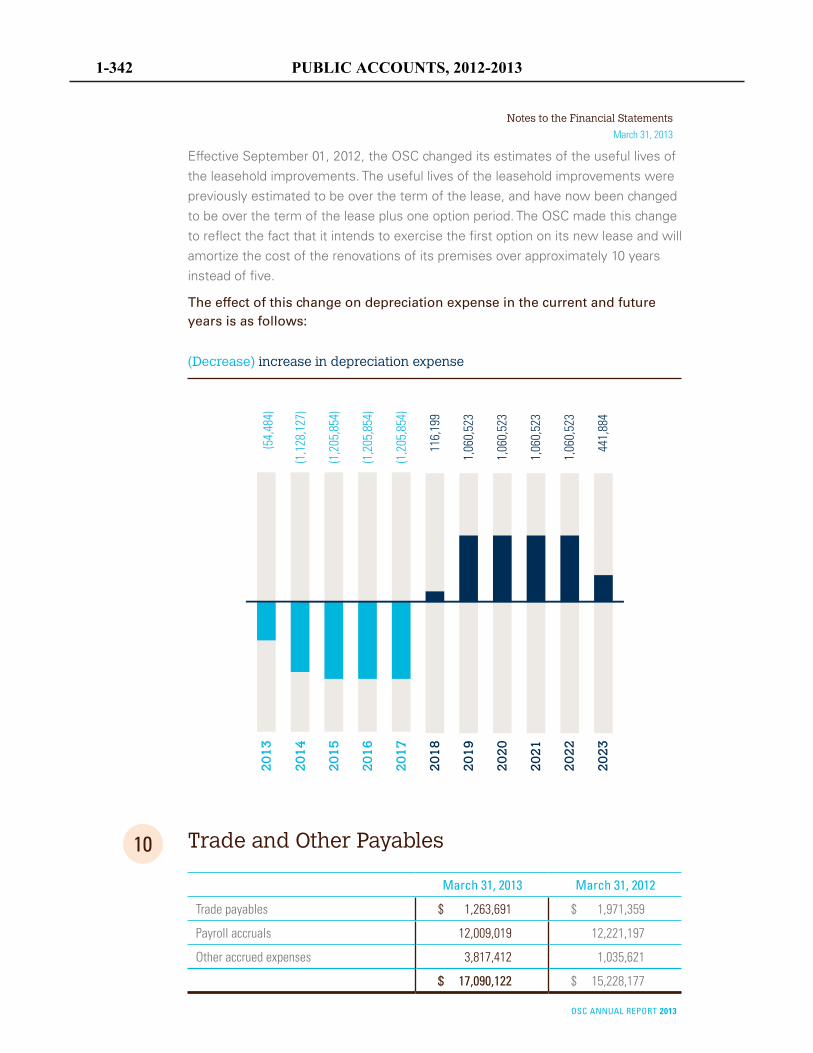
Notes to the Financial Statements
March 31, 2013
OSC ANNUAL REPORT 2013
Effective September 01, 2012, the OSC changed its estimates of the useful lives of the leasehold improvements. The useful lives of the leasehold improvements were previously estimated to be over the term of the lease, and have now been changed to be over the term of the lease plus one option period. The OSC made this change to reflect the fact that it intends to exercise the first option on its new lease and will amortize the cost of the renovations of its premises over approximately 10 years instead of five.
The effect of this change on depreciation expense in the current and future years is as follows:
20
13
20
14
20
15
20
16
20
17
(54,
484)
(1,1
28,1
27)
(1,2
05,8
54)
116,
199
1,06
0,52
3
441,
884
20
18
20
19
20
20
20
21
20
23
(1,2
05,8
54)
(1,2
05,8
54)
1,06
0,52
3
1,06
0,52
3
20
22
1,06
0,52
3
(Decrease) increase in depreciation expense
10 Trade and Other Payables
March 31, 2013 March 31, 2012
Trade payables
$ 1,263,691 $ 1,971,359
Payroll accruals 12,009,019 12,221,197
Other accrued expenses 3,817,412 1,035,621
$ 17,090,122 $ 15,228,177
1-342 PUBLIC ACCOUNTS, 2012-2013
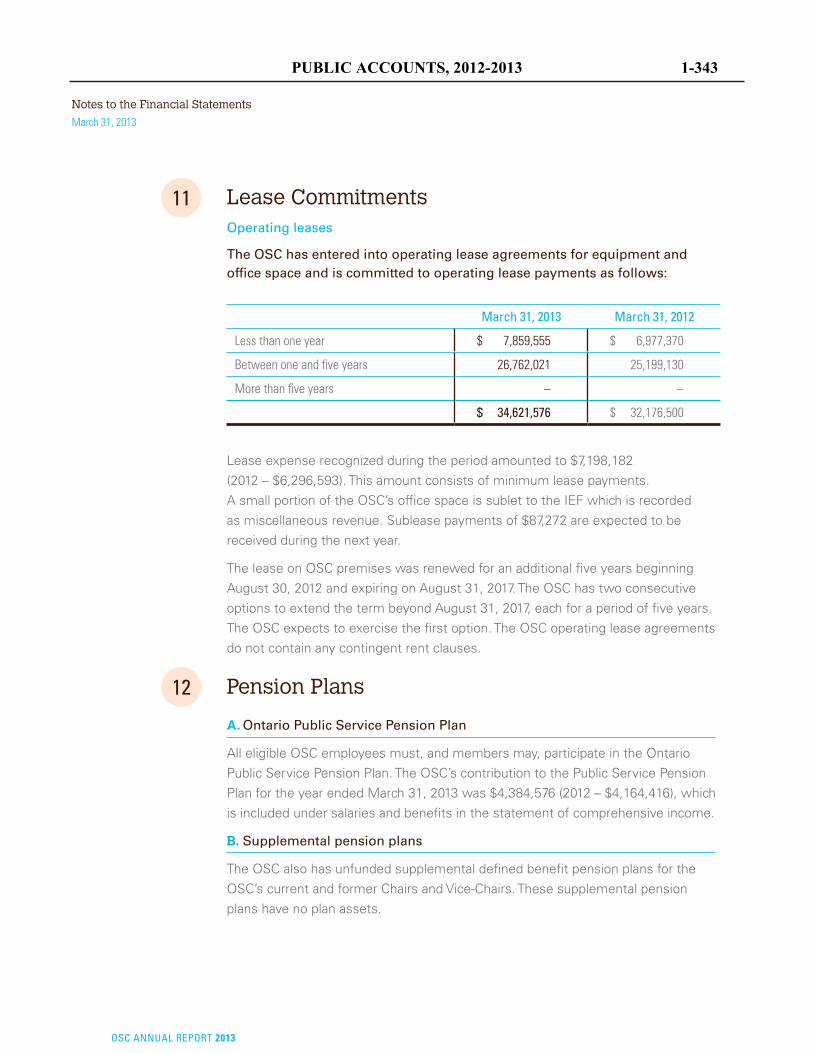
Notes to the Financial Statements
OSC ANNUAL REPORT 2013
March 31, 2013
11 Lease CommitmentsOperating leases
The OSC has entered into operating lease agreements for equipment and office space and is committed to operating lease payments as follows:
March 31, 2013 March 31, 2012
Less than one year
$ 7,859,555 $ 6,977,370
Between one and five years 26,762,021 25,199,130
More than five years – –
$ 34,621,576 $ 32,176,500
Lease expense recognized during the period amounted to $7,198,182 (2012 – $6,296,593). This amount consists of minimum lease payments. A small portion of the OSC’s office space is sublet to the IEF which is recorded as miscellaneous revenue. Sublease payments of $87,272 are expected to be received during the next year.
The lease on OSC premises was renewed for an additional five years beginning August 30, 2012 and expiring on August 31, 2017. The OSC has two consecutive options to extend the term beyond August 31, 2017, each for a period of five years. The OSC expects to exercise the first option. The OSC operating lease agreements do not contain any contingent rent clauses.
12 Pension Plans
A. Ontario Public Service Pension Plan
All eligible OSC employees must, and members may, participate in the Ontario Public Service Pension Plan. The OSC’s contribution to the Public Service Pension Plan for the year ended March 31, 2013 was $4,384,576 (2012 – $4,164,416), which is included under salaries and benefits in the statement of comprehensive income.
B. Supplemental pension plans
The OSC also has unfunded supplemental defined benefit pension plans for the OSC’s current and former Chairs and Vice-Chairs. These supplemental pension plans have no plan assets.
PUBLIC ACCOUNTS, 2012-2013 1-343
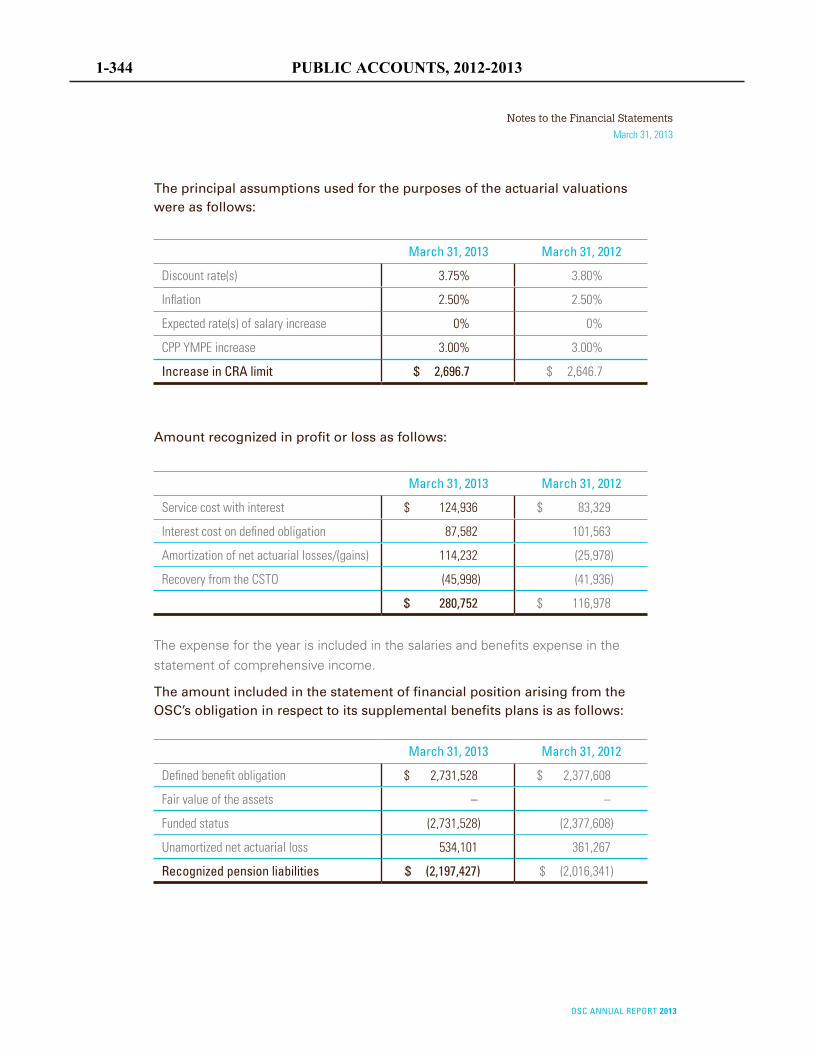
Notes to the Financial Statements
March 31, 2013
OSC ANNUAL REPORT 2013
The principal assumptions used for the purposes of the actuarial valuations were as follows:
March 31, 2013 March 31, 2012
Discount rate(s)
3.75% 3.80%
Inflation 2.50% 2.50%
Expected rate(s) of salary increase 0% 0%
CPP YMPE increase 3.00% 3.00%
Increase in CRA limit $ 2,696.7 $ 2,646.7
Amount recognized in profit or loss as follows:
March 31, 2013 March 31, 2012
Service cost with interest $ 124,936 $ 83,329
Interest cost on defined obligation 87,582 101,563
Amortization of net actuarial losses/(gains) 114,232 (25,978)
Recovery from the CSTO (45,998) (41,936)
$ 280,752 $ 116,978
The expense for the year is included in the salaries and benefits expense in the statement of comprehensive income.
The amount included in the statement of financial position arising from the OSC’s obligation in respect to its supplemental benefits plans is as follows:
March 31, 2013 March 31, 2012
Defined benefit obligation $ 2,731,528 $ 2,377,608
Fair value of the assets – –
Funded status (2,731,528) (2,377,608)
Unamortized net actuarial loss 534,101 361,267
Recognized pension liabilities $ (2,197,427) $ (2,016,341)
1-344 PUBLIC ACCOUNTS, 2012-2013
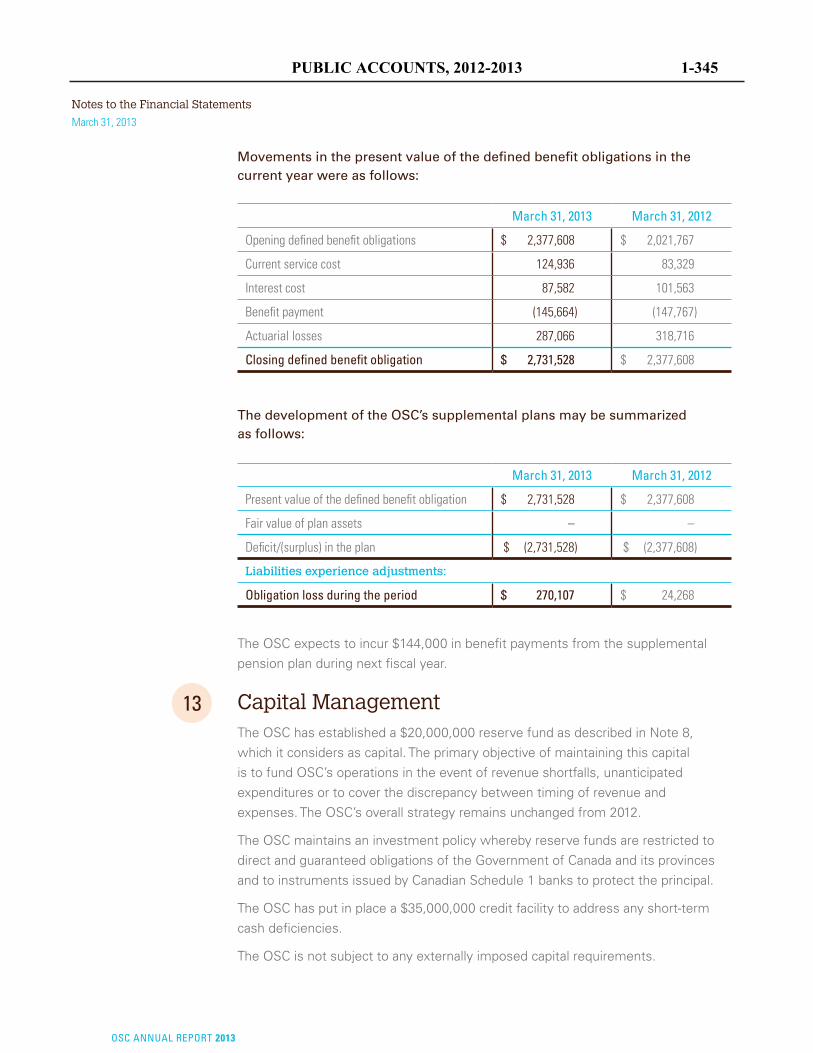
Notes to the Financial Statements
OSC ANNUAL REPORT 2013
March 31, 2013
Movements in the present value of the defined benefit obligations in the current year were as follows:
March 31, 2013 March 31, 2012
Opening defined benefit obligations $ 2,377,608 $ 2,021,767
Current service cost 124,936 83,329
Interest cost 87,582 101,563
Benefit payment (145,664) (147,767)
Actuarial losses 287,066 318,716
Closing defined benefit obligation $ 2,731,528 $ 2,377,608
The development of the OSC’s supplemental plans may be summarized as follows:
March 31, 2013 March 31, 2012
Present value of the defined benefit obligation $ 2,731,528 $ 2,377,608
Fair value of plan assets – –
Deficit/(surplus) in the plan $ (2,731,528) $ (2,377,608)
Liabilities experience adjustments:
Obligation loss during the period $ 270,107 $ 24,268
The OSC expects to incur $144,000 in benefit payments from the supplemental pension plan during next fiscal year.
13 Capital ManagementThe OSC has established a $20,000,000 reserve fund as described in Note 8, which it considers as capital. The primary objective of maintaining this capital is to fund OSC’s operations in the event of revenue shortfalls, unanticipated expenditures or to cover the discrepancy between timing of revenue and expenses. The OSC’s overall strategy remains unchanged from 2012.
The OSC maintains an investment policy whereby reserve funds are restricted to direct and guaranteed obligations of the Government of Canada and its provinces and to instruments issued by Canadian Schedule 1 banks to protect the principal.
The OSC has put in place a $35,000,000 credit facility to address any short-term cash deficiencies.
The OSC is not subject to any externally imposed capital requirements.
PUBLIC ACCOUNTS, 2012-2013 1-345
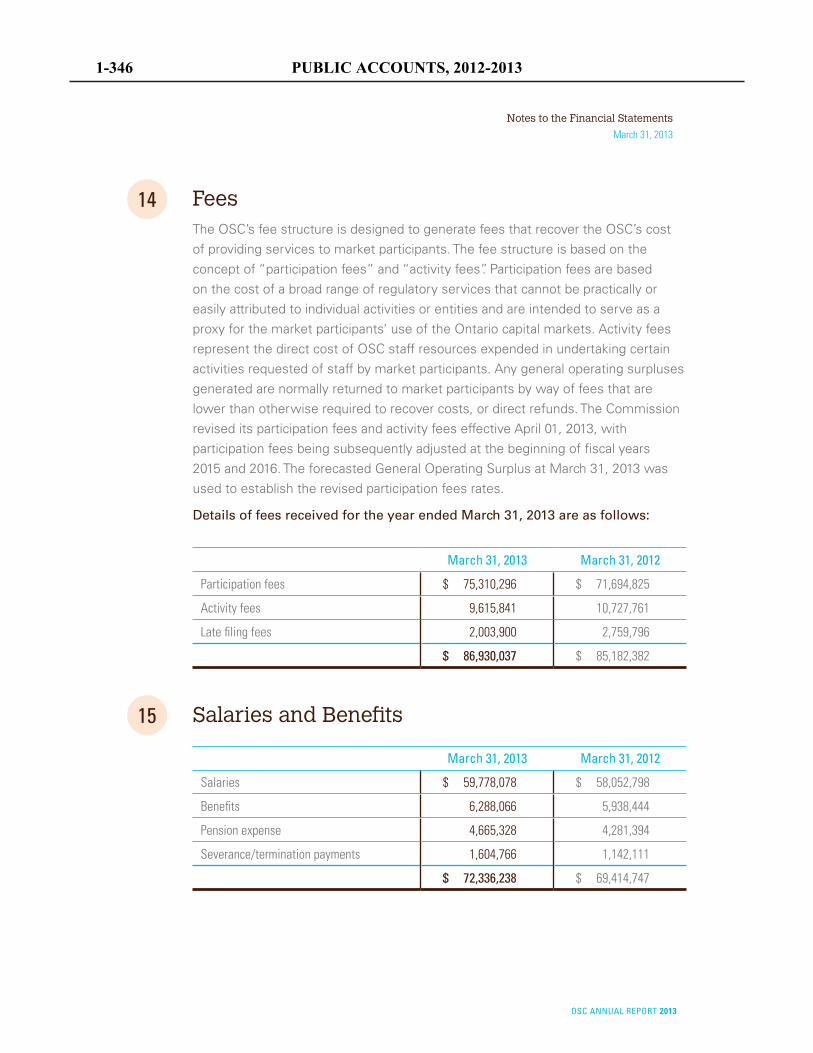
Notes to the Financial Statements
March 31, 2013
OSC ANNUAL REPORT 2013
14 FeesThe OSC’s fee structure is designed to generate fees that recover the OSC’s cost of providing services to market participants. The fee structure is based on the concept of “participation fees” and “activity fees”. Participation fees are based on the cost of a broad range of regulatory services that cannot be practically or easily attributed to individual activities or entities and are intended to serve as a proxy for the market participants’ use of the Ontario capital markets. Activity fees represent the direct cost of OSC staff resources expended in undertaking certain activities requested of staff by market participants. Any general operating surpluses generated are normally returned to market participants by way of fees that are lower than otherwise required to recover costs, or direct refunds. The Commission revised its participation fees and activity fees effective April 01, 2013, with participation fees being subsequently adjusted at the beginning of fiscal years 2015 and 2016. The forecasted General Operating Surplus at March 31, 2013 was used to establish the revised participation fees rates.
Details of fees received for the year ended March 31, 2013 are as follows:
March 31, 2013 March 31, 2012
Participation fees $ 75,310,296 $ 71,694,825
Activity fees 9,615,841 10,727,761
Late filing fees 2,003,900 2,759,796
$ 86,930,037 $ 85,182,382
15 Salaries and Benefits
March 31, 2013 March 31, 2012
Salaries $ 59,778,078 $ 58,052,798
Benefits 6,288,066 5,938,444
Pension expense 4,665,328 4,281,394
Severance/termination payments 1,604,766 1,142,111
$ 72,336,238 $ 69,414,747
1-346 PUBLIC ACCOUNTS, 2012-2013
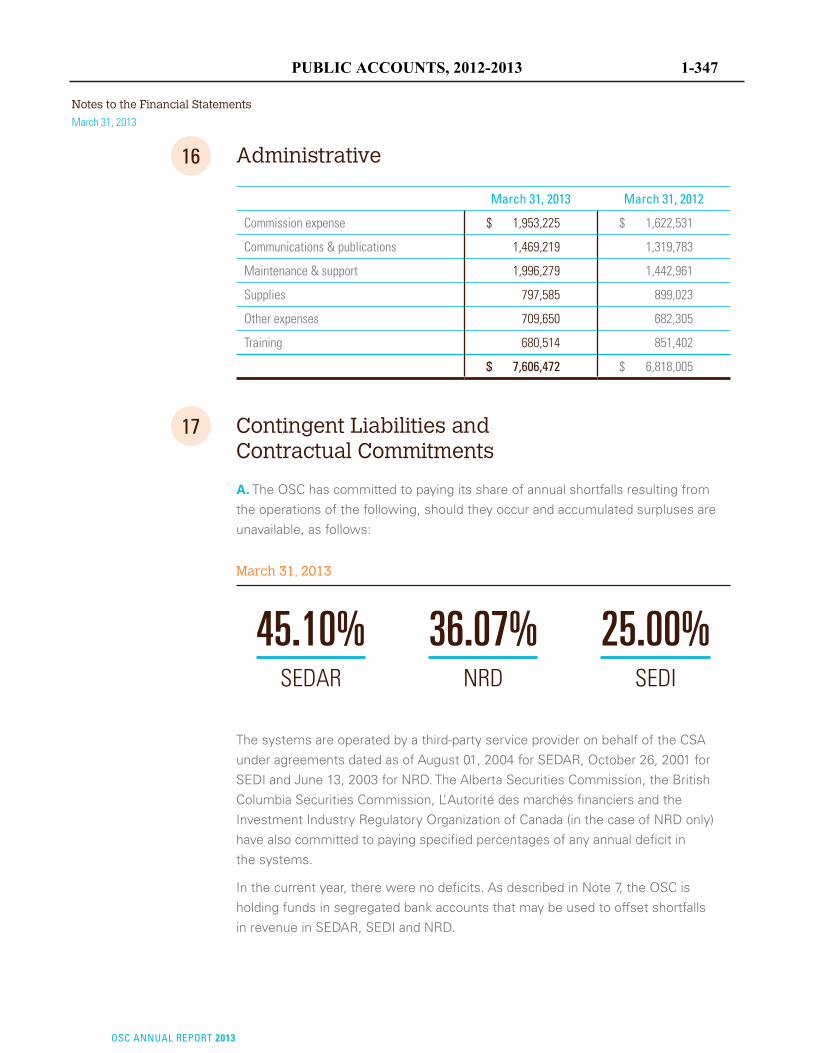
Notes to the Financial Statements
OSC ANNUAL REPORT 2013
March 31, 2013
16 Administrative
March 31, 2013 March 31, 2012
Commission expense
$ 1,953,225 $ 1,622,531
Communications & publications 1,469,219 1,319,783
Maintenance & support 1,996,279 1,442,961
Supplies 797,585 899,023
Other expenses 709,650 682,305
Training 680,514 851,402
$ 7,606,472 $ 6,818,005
17 Contingent Liabilities and Contractual Commitments
A. The OSC has committed to paying its share of annual shortfalls resulting from the operations of the following, should they occur and accumulated surpluses are unavailable, as follows:
March 31, 2013
SEDAR
45.10%NRD
36.07%SEDI
25.00%
The systems are operated by a third-party service provider on behalf of the CSA under agreements dated as of August 01, 2004 for SEDAR, October 26, 2001 for SEDI and June 13, 2003 for NRD. The Alberta Securities Commission, the British Columbia Securities Commission, L’Autorité des marchés financiers and the Investment Industry Regulatory Organization of Canada (in the case of NRD only) have also committed to paying specified percentages of any annual deficit in the systems.
In the current year, there were no deficits. As described in Note 7, the OSC is holding funds in segregated bank accounts that may be used to offset shortfalls in revenue in SEDAR, SEDI and NRD.
PUBLIC ACCOUNTS, 2012-2013 1-347
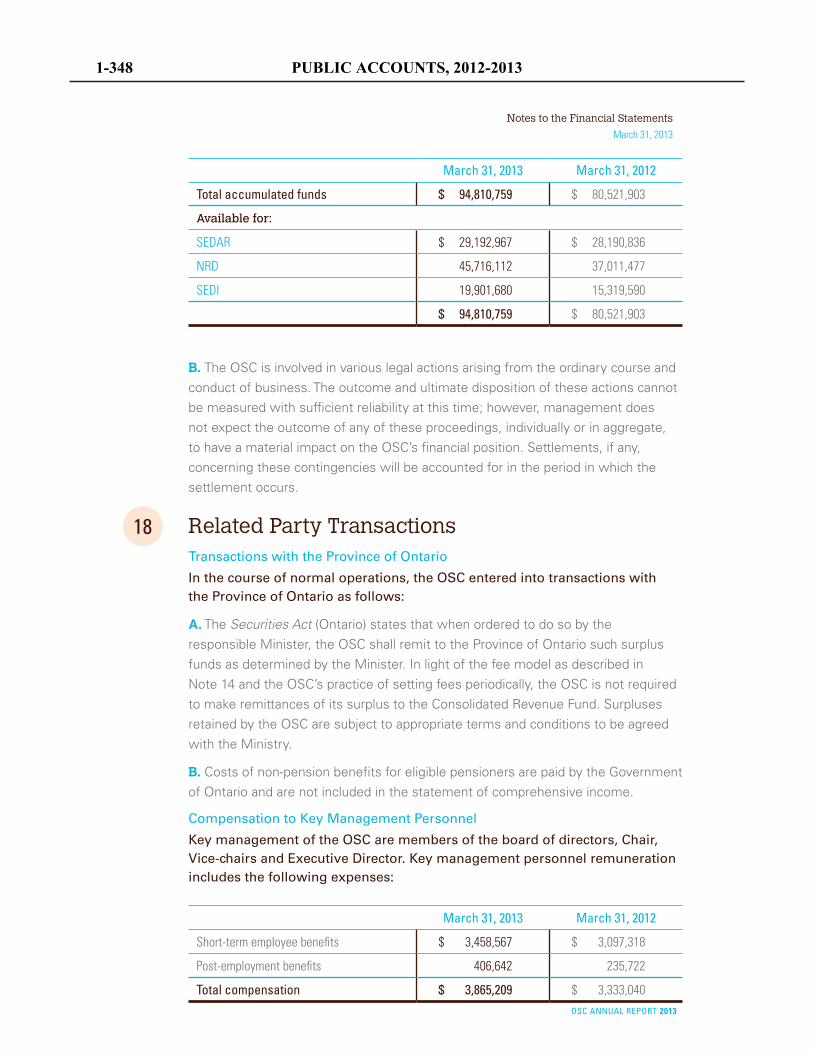
Notes to the Financial Statements
March 31, 2013
OSC ANNUAL REPORT 2013
March 31, 2013 March 31, 2012
Total accumulated funds
$ 94,810,759 $ 80,521,903
Available for:
SEDAR $ 29,192,967 $ 28,190,836
NRD 45,716,112 37,011,477
SEDI 19,901,680 15,319,590
$ 94,810,759 $ 80,521,903
B. The OSC is involved in various legal actions arising from the ordinary course and conduct of business. The outcome and ultimate disposition of these actions cannot be measured with sufficient reliability at this time; however, management does not expect the outcome of any of these proceedings, individually or in aggregate, to have a material impact on the OSC’s financial position. Settlements, if any, concerning these contingencies will be accounted for in the period in which the settlement occurs.
18 Related Party TransactionsTransactions with the Province of Ontario
In the course of normal operations, the OSC entered into transactions with the Province of Ontario as follows:
A. The Securities Act (Ontario) states that when ordered to do so by the responsible Minister, the OSC shall remit to the Province of Ontario such surplus funds as determined by the Minister. In light of the fee model as described in Note 14 and the OSC’s practice of setting fees periodically, the OSC is not required to make remittances of its surplus to the Consolidated Revenue Fund. Surpluses retained by the OSC are subject to appropriate terms and conditions to be agreed with the Ministry.
B. Costs of non-pension benefits for eligible pensioners are paid by the Government of Ontario and are not included in the statement of comprehensive income.
Compensation to Key Management Personnel
Key management of the OSC are members of the board of directors, Chair, Vice-chairs and Executive Director. Key management personnel remuneration includes the following expenses:
March 31, 2013 March 31, 2012
Short-term employee benefits
$ 3,458,567 $ 3,097,318
Post-employment benefits 406,642 235,722
Total compensation $ 3,865,209 $ 3,333,040
1-348 PUBLIC ACCOUNTS, 2012-2013
Notes to the Financial Statements
OSC ANNUAL REPORT 2013
March 31, 2013
19 Investor Education FundA. The IEF was incorporated by letters patent of Ontario dated August 03, 2000 as a non-profit corporation without share capital. The Fund is managed by a separate Board of Directors and its purpose is to increase knowledge and awareness among investors and potential investors and to support research and develop programs and partnerships which promote investor and financial education in schools and among adult learners.
The OSC is the sole voting member of the Fund. However, the OSC has determined, based on an evaluation of the terms and conditions of the arrangement, that investors in the capital market, rather than the OSC, obtain the benefit or rewards from the activities of the IEF. As such the OSC does not control the Fund, and the Fund has not been consolidated in the OSC’s financial statements as discussed in Note 2(d). The Fund is exempt from income taxes.
Financial statements of the Fund are available on request. During the year, the OSC entered into transactions with the Fund as follows:
1 The OSC paid $3,900,000 to the Fund (2012 – $4,420,000). These payments were from funds held pursuant to designated settlements and orders as described in Note 6.
2 The OSC has a Management Services agreement with the Fund for the provision of administrative and management services, at cost. For the period ended March 31, 2013, the OSC incurred costs totaling $1,000,975 (2012 – $905,438) for services related to the Fund. The total cost of these services has been charged to the Fund and, of this amount, $502,635 is owing to the OSC (2012 – $235,617).
3 Subsequent to year end, the Commission approved funding totaling $3,295,000 for the IEF for the 2014 fiscal year.
PUBLIC ACCOUNTS, 2012-2013 1-349
Notes to the Financial Statements
March 31, 2013
OSC ANNUAL REPORT 2013
20 Accounting PronouncementsA number of new standards, and amendments to standards and interpretations, are not yet effective for the year ended March 31, 2013, and have not been applied in preparing these financial statements. None of these are expected to have a material impact on the financial statements of the OSC.
IFRS9
Financial Instruments
In October 2010, the IASB released IFRS 9, Financial instruments, which is the first part of a three-part project to replace IAS 39, Financial instruments: Recognition and Measurement. This first part only covers classification and measurement of financial assets and financial liabilities, with impairment of financial assets and hedge accounting being addressed in the other two parts.
IFRS 9 uses a single approach to determine whether a financial asset is measured at amortized cost or fair value, replacing the multiple rules in IAS 39. The approach in IFRS 9 is based on how an entity manages its financial instruments and the contractual cash flow characteristics of the financial assets. Most of the requirements in IAS 39 for classification and measurement of financial liabilities were carried forward in IFRS 9. However, requirements for measuring a financial liability at fair value have changed, as the portion of the changes in fair value related to the entity’s own credit risk must be presented in OCI rather than in the statement of income. IFRS 9 will be effective for fiscal years beginning on January 01, 2015, with earlier application permitted.
IFRS10
Consolidated Financial Statements
In May 2011, the IASB issued IFRS 10 Consolidated Financial Statements to replace IAS 27 Consolidated and Separate Financial Statements and SIC 12 Consolidation – Special Purpose Entities. The new standard builds on existing principles by identifying the concept of control as the determining factor in whether an entity should be included within the consolidated financial statements of the parent company. Determination of control now includes elements of power over the investee, exposure, or rights, to variable returns from its involvement with the investee and the ability to use its power over the investee to affect the amount of the investor’s returns. The standard provides additional guidance to assist in the determination of control where this is difficult to assess. IFRS 10 will be mandatorily effective for annual periods beginning on or after January 01, 2013, on a retrospective basis. Earlier application is permitted.
1-350 PUBLIC ACCOUNTS, 2012-2013
Notes to the Financial Statements
OSC ANNUAL REPORT 2013
March 31, 2013
IFRS11
Joint Arrangements
In May 2011, the IASB issued IFRS 11, Joint Arrangements to replace IAS 31 Interests in Joint Ventures. The standard outlines the accounting by entities that jointly control an arrangement. Joint control involves the contractual agreed sharing of control and arrangements subject to joint control are classified as either a joint venture (representing a share of net assets and equity accounted) or a joint operation (representing rights to assets and obligations for liabilities, accounted for accordingly). IFRS 11 will be mandatorily effective for annual periods beginning on or after January 01, 2013, on a retrospective basis. Earlier application is permitted.
IFRS12
Disclosure of Interests in Other Entities
In May 2011, the IASB released IFRS 12, Disclosure of Interests in Other Entities. IFRS 12 is a new and comprehensive standard on disclosure requirements for all forms of interests in other entities, including subsidiaries, joint arrangements, associates, special purpose vehicles and other off-balance sheet vehicles. The standard requires an entity to disclose information regarding the nature and risks associated with its interests in other entities and the effects of those interests on its financial position, financial performance and cash flows. IFRS 12 will be mandatorily effective for annual periods beginning on or after January 01, 2013, on a retrospective basis. Earlier application is permitted.
IFRS13
Fair Value Measurement
In May 2011, the IASB released IFRS 13, Fair value measurement. IFRS 13 will improve consistency and reduce complexity by providing a precise definition of fair value and a single source of fair value measurement and disclosure requirements for use across IFRS. The standard will be mandatorily effective for annual periods beginning on or after January 01, 2013, on a retrospective basis. Earlier application is permitted.
IFRS19
Employee Benefits
In June 2011, the IASB amended IAS 19, Employee Benefits (“IAS 19”). This amendment eliminated the use of the ‘corridor’ approach and mandates that all remeasurement impacts be recognized in OCI. It also enhances the disclosure requirements, providing better information about the characteristics of defined benefit plans and the risk that entities are exposed to through participation in those plans. This amendment clarifies when a company should recognize a liability and an expense for termination benefits. The amendment to IAS 19 will be mandatorily effective for annual periods beginning on or after January 01, 2013, on a retrospective basis. Earlier application is permitted.
PUBLIC ACCOUNTS, 2012-2013 1-351

Ontario Tourism Marketing Partnership Corporation
Management Report
The accompanying financial statements are the responsibility of the management of the Ontario Tourism Marketing Partnership Corporation. The financial statements have been prepared by management in accordance with Canadian Public Sector Accounting Standards for Not-for-Profit Organizations. The statements include certain amounts based on estimates and judgements. Management has determined such amounts on a reasonable basis in order to ensure that the financial statements are presented fairly, in all material respects. Management maintains a system of internal accounting and administrative control that is designed to provide reasonable assurance the financial information is relevant, reliable and accurate and that the Corporation’s assets are properly accounted for and adequately safeguarded. The financial statements have been audited by BDO Canada LLP, a firm of independent external auditors appointed by the Board of Directors, whose report follows. Ronald Holgerson Lidia Maleckyj President and CEO Treasurer June 3, 2013 June 3, 2013
PUBLIC ACCOUNTS, 2012-2013 1-353
Independent Auditor’s Report
To the Board of Directors of Ontario Tourism Marketing Partnership Corporation We have audited the accompanying financial statements of Ontario Tourism Marketing Partnership Corporation, which comprise the statements of financial position as at March 31, 2013, March 31, 2012 and April 1, 2011 and the statements of operations, statements of changes in net assets, and statements of cash flows for the years ended March 31, 2013 and March 31, 2012, and a summary of significant accounting policies and other explanatory information. Management's Responsibility for the Financial Statements Management is responsible for the preparation and fair presentation of these financial statements in accordance with Canadian Public Sector Accounting Standards for Not-for-Profit Organizations and for such internal control as management determines is necessary to enable the preparation of financial statements that are free from material misstatement, whether due to fraud or error. Auditor's Responsibility Our responsibility is to express an opinion on these financial statements based on our audits. We conducted our audits in accordance with Canadian generally accepted auditing standards. Those standards require that we comply with ethical requirements and plan and perform the audits to obtain reasonable assurance about whether the financial statements are free from material misstatement. An audit involves performing procedures to obtain audit evidence about the amounts and disclosures in the financial statements. The procedures selected depend on the auditor's judgment, including the assessment of the risks of material misstatement of the financial statements, whether due to fraud or error. In making those risk assessments, the auditor considers internal control relevant to the entity's preparation and fair presentation of the financial statements in order to design audit procedures that are appropriate in the circumstances, but not for the purpose of expressing an opinion on the effectiveness of the entity's internal control. An audit also includes evaluating the appropriateness of accounting policies used and the reasonableness of accounting estimates made by management, as well as evaluating the presentation of the financial statements. We believe that the audit evidence we have obtained is sufficient and appropriate to provide a basis for our audit opinion. Opinion In our opinion, the financial statements present fairly, in all material respects, the financial position of Ontario Tourism Marketing Partnership Corporation as at March 31, 2013, March 31, 2012 and April 1, 2011 and the results of its operations and its cash flows for the years ended March 31, 2013 and March 31, 2012 in accordance with Canadian Public Sector Accounting Standards for Not-for-Profit Organizations.
Chartered Accountants, Licensed Public Accountants
Mississauga, Ontario June 3, 2013
Tel: 905 270-7700 Fax: 905 270-7915 Toll-free: 866 248 6660 www.bdo.ca
BDO Canada LLP 1 City Centre Drive, Suite 1700 Mississauga ON L5B 1M2 Canada
1-354 PUBLIC ACCOUNTS, 2012-2013
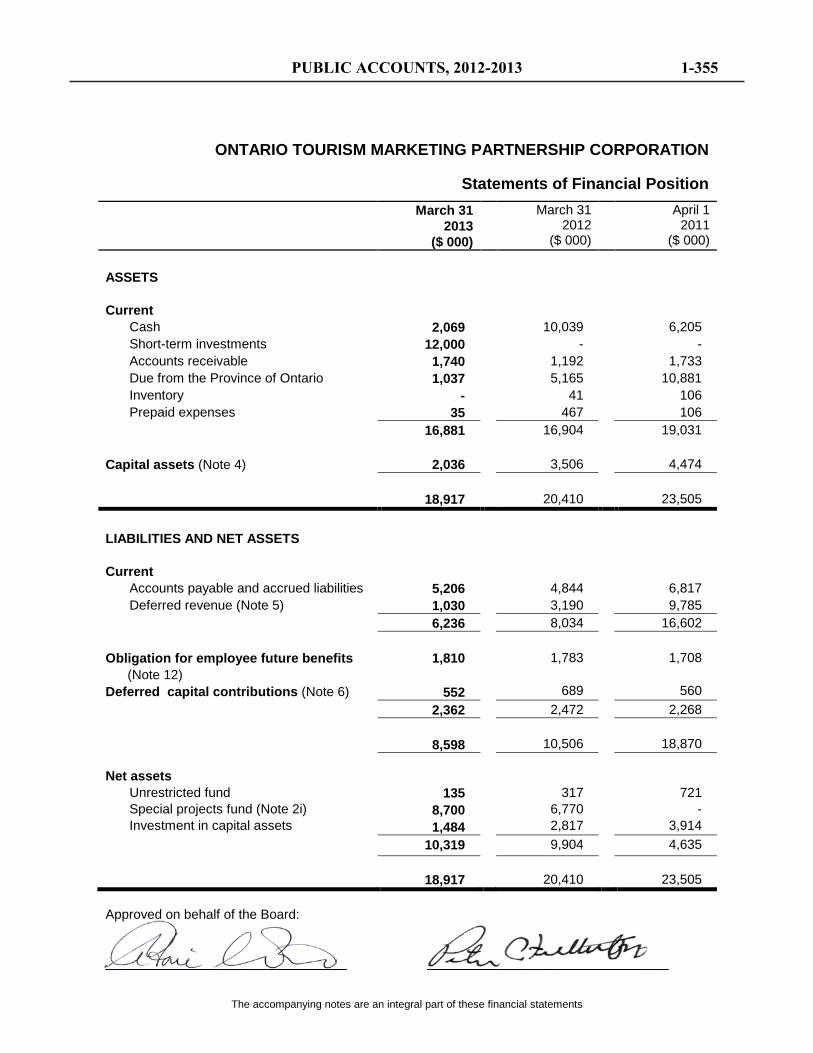
ONTARIO TOURISM MARKETING PARTNERSHIP CORPORATION
Statements of Financial Position
The accompanying notes are an integral part of these financial statements
March 31 2013
($ 000)
March 31 2012
($ 000)
April 1 2011
($ 000) ASSETS Current
Cash 2,069 10,039 6,205 Short-term investments 12,000 - - Accounts receivable 1,740 1,192 1,733 Due from the Province of Ontario 1,037 5,165 10,881 Inventory - 41 106 Prepaid expenses 35 467 106
16,881 16,904 19,031 Capital assets (Note 4) 2,036 3,506 4,474
18,917 20,410 23,505
LIABILITIES AND NET ASSETS Current
Accounts payable and accrued liabilities 5,206 4,844 6,817 Deferred revenue (Note 5) 1,030 3,190 9,785
6,236 8,034 16,602 Obligation for employee future benefits (Note 12) Deferred capital contributions (Note 6)
1,810
552
1,783
689
1,708
560 2,362 2,472 2,268
8,598
10,506
18,870
Net assets
Unrestricted fund Special projects fund (Note 2i) Investment in capital assets
135 8,700 1,484
317 6,770 2,817
721 -
3,914 10,319 9,904 4,635 18,917 20,410 23,505 Approved on behalf of the Board: ___________________________ ___________________________
PUBLIC ACCOUNTS, 2012-2013 1-355
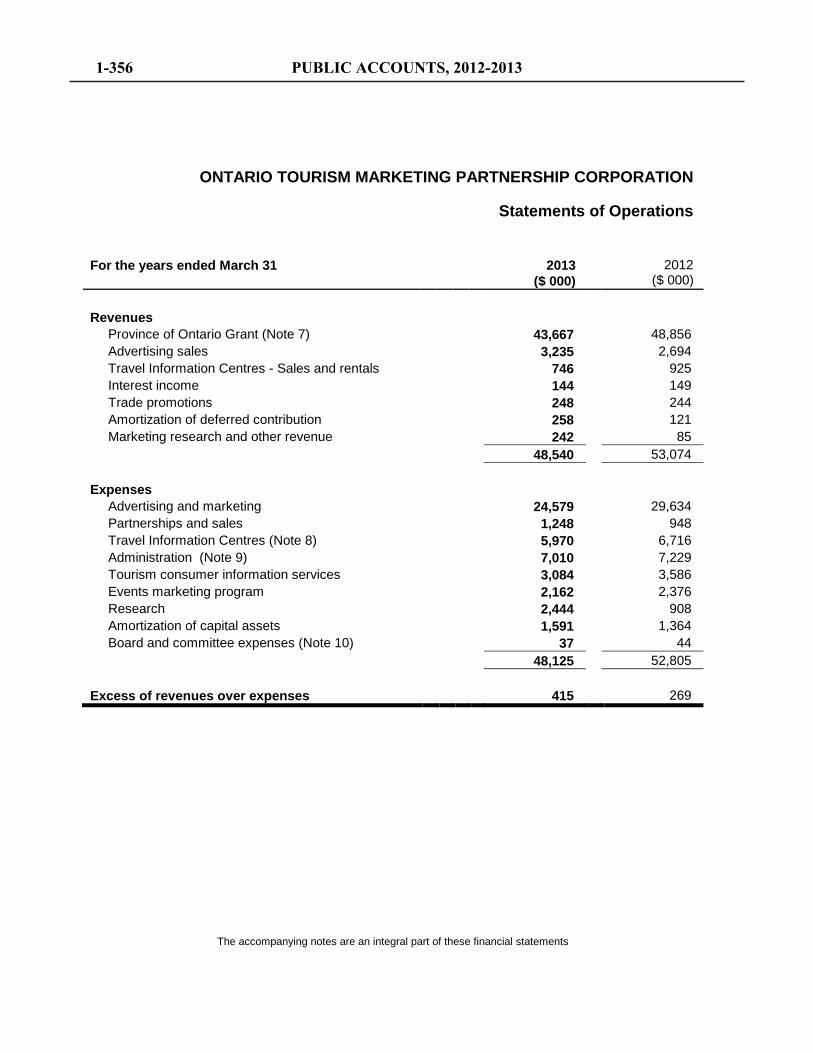
ONTARIO TOURISM MARKETING PARTNERSHIP CORPORATION
Statements of Operations
The accompanying notes are an integral part of these financial statements
For the years ended March 31 2013
($ 000) 2012
($ 000) Revenues
Province of Ontario Grant (Note 7) 43,667 48,856 Advertising sales 3,235 2,694 Travel Information Centres - Sales and rentals 746 925 Interest income 144 149 Trade promotions 248 244 Amortization of deferred contribution 258 121 Marketing research and other revenue 242 85
48,540 53,074 Expenses
Advertising and marketing 24,579 29,634 Partnerships and sales 1,248 948 Travel Information Centres (Note 8) 5,970 6,716 Administration (Note 9) 7,010 7,229 Tourism consumer information services 3,084 3,586 Events marketing program 2,162 2,376 Research 2,444 908 Amortization of capital assets 1,591 1,364 Board and committee expenses (Note 10) 37 44
48,125 52,805 Excess of revenues over expenses 415 269
1-356 PUBLIC ACCOUNTS, 2012-2013
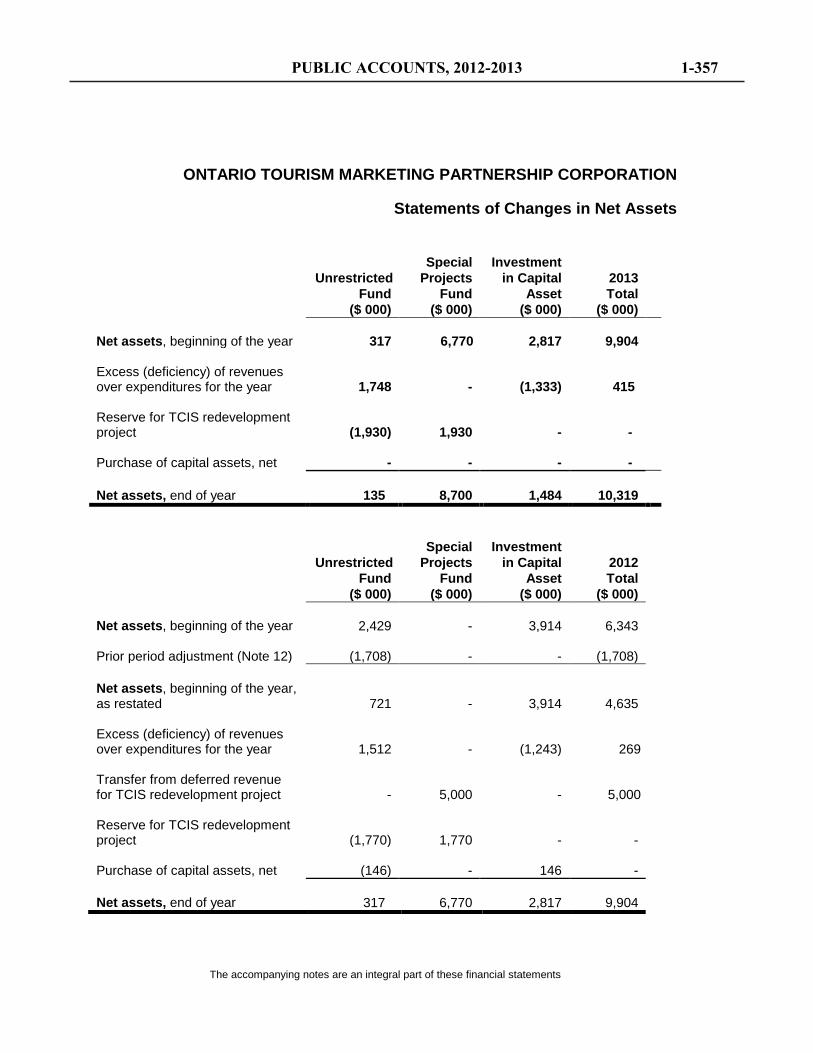
ONTARIO TOURISM MARKETING PARTNERSHIP CORPORATION
Statements of Changes in Net Assets
The accompanying notes are an integral part of these financial statements
Special Investment Unrestricted Projects in Capital 2013
Fund Fund Asset Total ($ 000) ($ 000) ($ 000) ($ 000)
Net assets, beginning of the year 317 6,770 2,817 9,904 Excess (deficiency) of revenues over expenditures for the year 1,748 - (1,333) 415 Reserve for TCIS redevelopment project (1,930) 1,930 - - Purchase of capital assets, net - - - - Net assets, end of year 135 8,700 1,484 10,319
Special Investment Unrestricted Projects in Capital 2012 Fund Fund Asset Total ($ 000) ($ 000) ($ 000) ($ 000) Net assets, beginning of the year 2,429 - 3,914 6,343 Prior period adjustment (Note 12) (1,708) - - (1,708) Net assets, beginning of the year, as restated 721 - 3,914 4,635 Excess (deficiency) of revenues over expenditures for the year 1,512 - (1,243) 269 Transfer from deferred revenue for TCIS redevelopment project - 5,000 - 5,000 Reserve for TCIS redevelopment project (1,770) 1,770 - - Purchase of capital assets, net (146) - 146 - Net assets, end of year 317 6,770 2,817 9,904
PUBLIC ACCOUNTS, 2012-2013 1-357
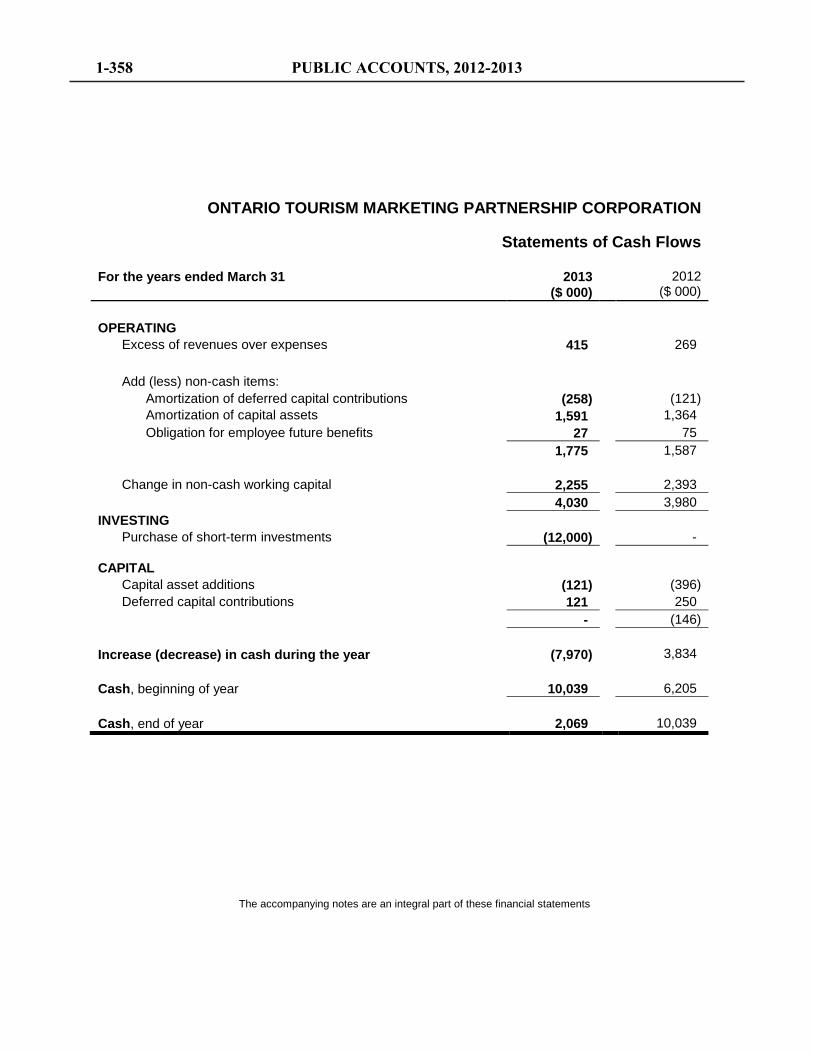
ONTARIO TOURISM MARKETING PARTNERSHIP CORPORATION
Statements of Cash Flows
The accompanying notes are an integral part of these financial statements
For the years ended March 31 2013 ($ 000)
2012 ($ 000)
OPERATING
Excess of revenues over expenses 415 269 Add (less) non-cash items:
Amortization of deferred capital contributions Amortization of capital assets
(258) 1,591
(121) 1,364
Obligation for employee future benefits 27 75 1,775 1,587
Change in non-cash working capital 2,255 2,393
4,030 3,980 INVESTING
Purchase of short-term investments (12,000) - CAPITAL
Capital asset additions (121) (396) Deferred capital contributions 121 250 - (146)
Increase (decrease) in cash during the year
(7,970)
3,834
Cash, beginning of year 10,039 6,205 Cash, end of year 2,069 10,039
1-358 PUBLIC ACCOUNTS, 2012-2013
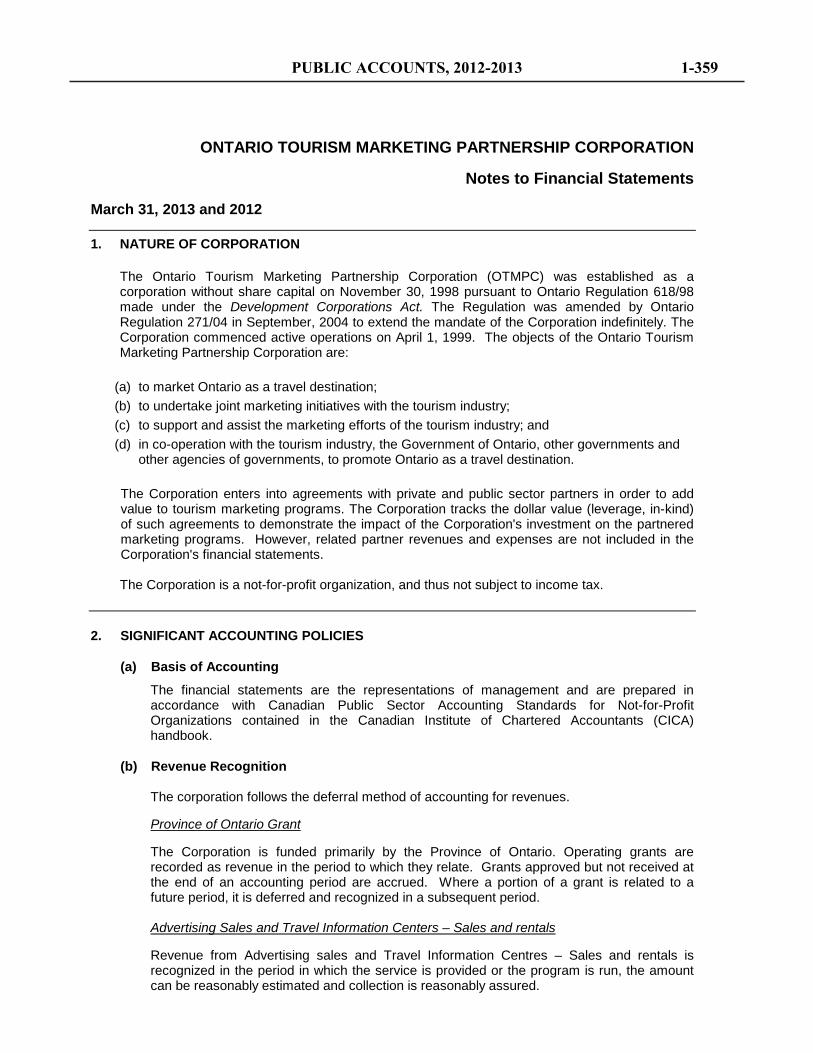
ONTARIO TOURISM MARKETING PARTNERSHIP CORPORATION
Notes to Financial Statements March 31, 2013 and 2012
1. NATURE OF CORPORATION The Ontario Tourism Marketing Partnership Corporation (OTMPC) was established as a corporation without share capital on November 30, 1998 pursuant to Ontario Regulation 618/98 made under the Development Corporations Act. The Regulation was amended by Ontario Regulation 271/04 in September, 2004 to extend the mandate of the Corporation indefinitely. The Corporation commenced active operations on April 1, 1999. The objects of the Ontario Tourism Marketing Partnership Corporation are:
(a) to market Ontario as a travel destination; (b) to undertake joint marketing initiatives with the tourism industry; (c) to support and assist the marketing efforts of the tourism industry; and (d) in co-operation with the tourism industry, the Government of Ontario, other governments and
other agencies of governments, to promote Ontario as a travel destination.
The Corporation enters into agreements with private and public sector partners in order to add value to tourism marketing programs. The Corporation tracks the dollar value (leverage, in-kind) of such agreements to demonstrate the impact of the Corporation's investment on the partnered marketing programs. However, related partner revenues and expenses are not included in the Corporation's financial statements. The Corporation is a not-for-profit organization, and thus not subject to income tax.
2. SIGNIFICANT ACCOUNTING POLICIES (a) Basis of Accounting
The financial statements are the representations of management and are prepared in accordance with Canadian Public Sector Accounting Standards for Not-for-Profit Organizations contained in the Canadian Institute of Chartered Accountants (CICA) handbook.
(b) Revenue Recognition The corporation follows the deferral method of accounting for revenues. Province of Ontario Grant The Corporation is funded primarily by the Province of Ontario. Operating grants are recorded as revenue in the period to which they relate. Grants approved but not received at the end of an accounting period are accrued. Where a portion of a grant is related to a future period, it is deferred and recognized in a subsequent period. Advertising Sales and Travel Information Centers – Sales and rentals Revenue from Advertising sales and Travel Information Centres – Sales and rentals is recognized in the period in which the service is provided or the program is run, the amount can be reasonably estimated and collection is reasonably assured.
PUBLIC ACCOUNTS, 2012-2013 1-359
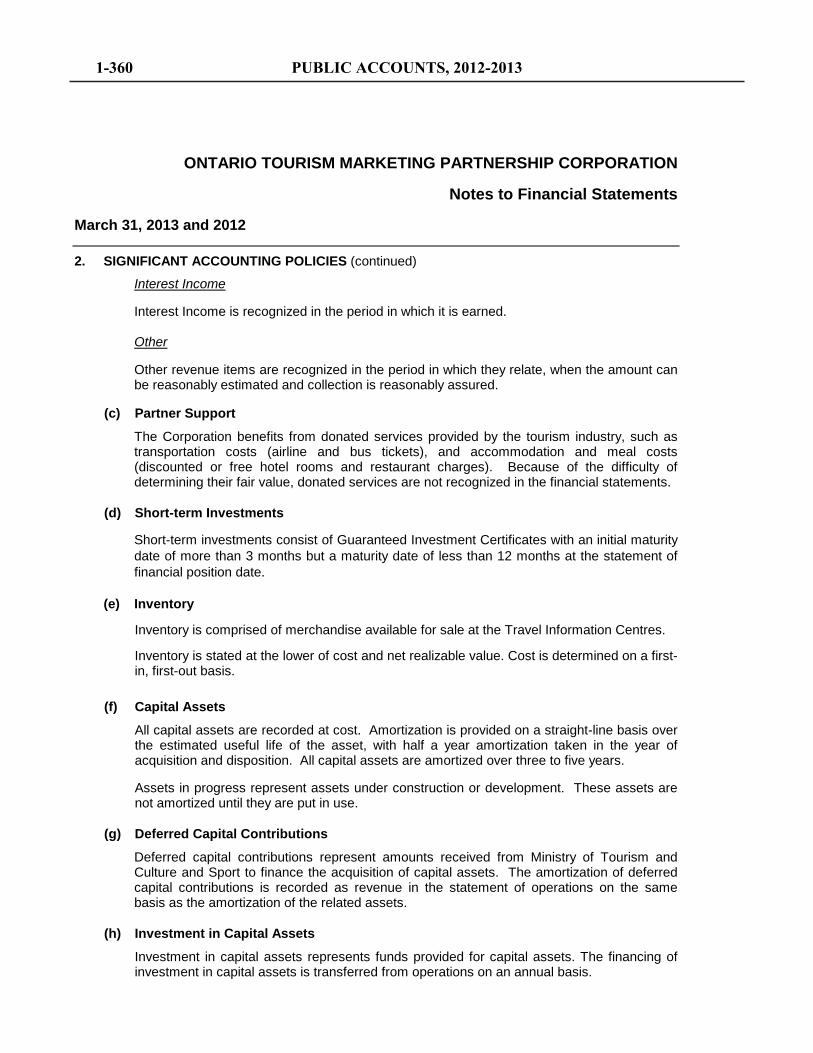
ONTARIO TOURISM MARKETING PARTNERSHIP CORPORATION
Notes to Financial Statements March 31, 2013 and 2012 2. SIGNIFICANT ACCOUNTING POLICIES (continued)
Interest Income Interest Income is recognized in the period in which it is earned. Other Other revenue items are recognized in the period in which they relate, when the amount can be reasonably estimated and collection is reasonably assured.
(c) Partner Support
The Corporation benefits from donated services provided by the tourism industry, such as transportation costs (airline and bus tickets), and accommodation and meal costs (discounted or free hotel rooms and restaurant charges). Because of the difficulty of determining their fair value, donated services are not recognized in the financial statements.
(d) Short-term Investments
Short-term investments consist of Guaranteed Investment Certificates with an initial maturity date of more than 3 months but a maturity date of less than 12 months at the statement of financial position date.
(e) Inventory
Inventory is comprised of merchandise available for sale at the Travel Information Centres.
Inventory is stated at the lower of cost and net realizable value. Cost is determined on a first-in, first-out basis.
(f) Capital Assets
All capital assets are recorded at cost. Amortization is provided on a straight-line basis over the estimated useful life of the asset, with half a year amortization taken in the year of acquisition and disposition. All capital assets are amortized over three to five years. Assets in progress represent assets under construction or development. These assets are not amortized until they are put in use.
(g) Deferred Capital Contributions
Deferred capital contributions represent amounts received from Ministry of Tourism and Culture and Sport to finance the acquisition of capital assets. The amortization of deferred capital contributions is recorded as revenue in the statement of operations on the same basis as the amortization of the related assets.
(h) Investment in Capital Assets
Investment in capital assets represents funds provided for capital assets. The financing of investment in capital assets is transferred from operations on an annual basis.
1-360 PUBLIC ACCOUNTS, 2012-2013
ONTARIO TOURISM MARKETING PARTNERSHIP CORPORATION
Notes to Financial Statements March 31, 2013 and 2012 2. SIGNIFICANT ACCOUNTING POLICIES (continued)
(i) Special Projects Fund
The Board approved the creation of a Special Projects Fund to provide for longer term special projects. The Fund represents externally and internally restricted funds required to meet financial costs of long-term special projects approved by the Board. At this time $5,000,000 (2012 - $5,000,000) of externally restricted funds and $3,700,000 (2012 - $1,770,000) of internally restricted funds are being held for the Tourism Consumer Information Services redevelopment project. Work on this project is commencing in the summer of 2013 (Note 11a). Interest is being recorded in the Fund on the $5,000,000 externally restricted funds in accordance with the funding agreement.
(j) Use of Estimates
The preparation of financial statements in accordance with Canadian Public Sector Accounting Standards for Not-for-Profit Organizations requires management to make estimates and assumptions that affect the reported amounts of assets and liabilities at the date of the financial statements, and the reported amounts of revenues and expenses during the reporting period. Actual results could differ from those estimates as additional information becomes available in the future.
(k) Financial Instruments
Unless otherwise noted, it is management's opinion that the Corporation is not exposed to significant interest, currency or credit risks arising from these financial instruments. Financial Instruments are recorded at cost when acquired or issued. In subsequent periods, investments traded in an active market are reported at fair value. All other financial instruments are reported at cost or amortized cost less impairment, if applicable. Financial assets are tested for impairment when changes in circumstances indicate the asset could be impaired. Transaction costs on the acquisition, sale or issue of financial instruments are expensed for those items remeasured at fair value at each statement of financial position date and charged to the financial instrument for those measured at amortized cost. The Corporation has short-term investments in the fair value category. This item is classified as Level 1 in the fair value hierarchy whereby the fair value is based on quoted prices in active markets for identical assets. There has been no movement from Level 1 to Level 2 or Level 3.
(l) Employee Future Benefits
The costs of any legislated severance under the Public Service Act of Ontario and unused vacation entitlements earned by employees are recognized when earned by eligible employees. These costs for the year amounted to $27,000 (2012 - $75,000) and are included in obligation for employee future benefits.
PUBLIC ACCOUNTS, 2012-2013 1-361
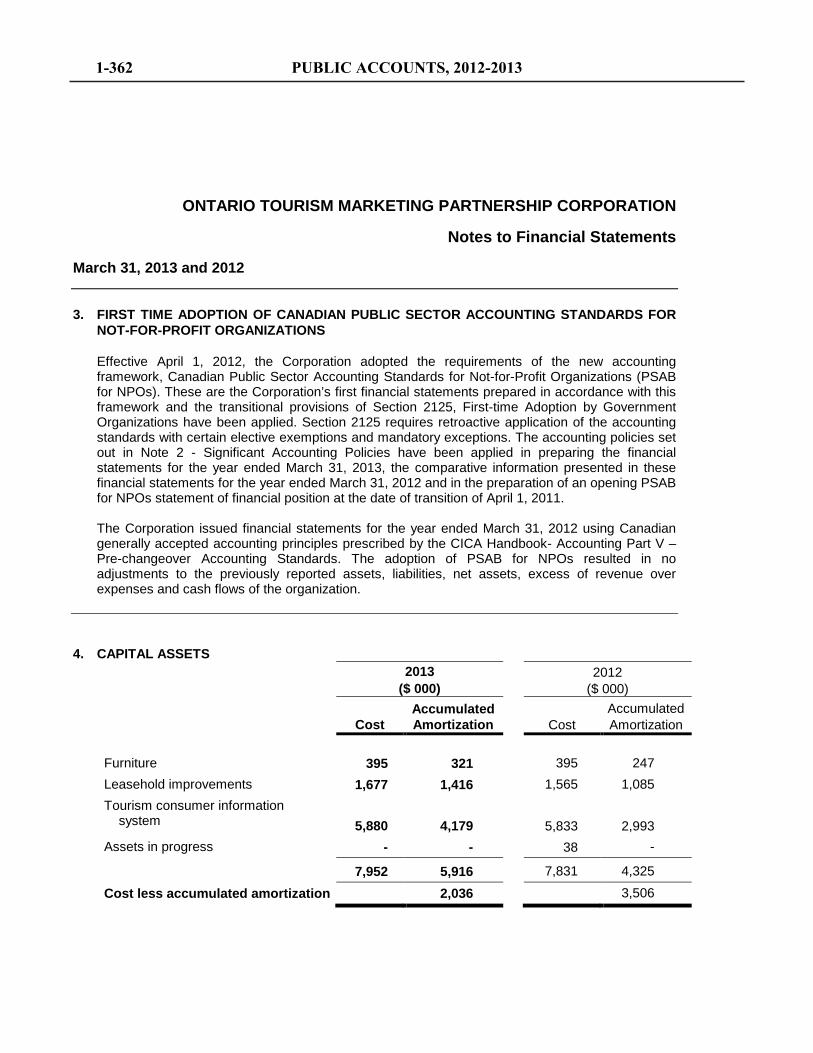
ONTARIO TOURISM MARKETING PARTNERSHIP CORPORATION
Notes to Financial Statements March 31, 2013 and 2012 3. FIRST TIME ADOPTION OF CANADIAN PUBLIC SECTOR ACCOUNTING STANDARDS FOR
NOT-FOR-PROFIT ORGANIZATIONS Effective April 1, 2012, the Corporation adopted the requirements of the new accounting framework, Canadian Public Sector Accounting Standards for Not-for-Profit Organizations (PSAB for NPOs). These are the Corporation’s first financial statements prepared in accordance with this framework and the transitional provisions of Section 2125, First-time Adoption by Government Organizations have been applied. Section 2125 requires retroactive application of the accounting standards with certain elective exemptions and mandatory exceptions. The accounting policies set out in Note 2 - Significant Accounting Policies have been applied in preparing the financial statements for the year ended March 31, 2013, the comparative information presented in these financial statements for the year ended March 31, 2012 and in the preparation of an opening PSAB for NPOs statement of financial position at the date of transition of April 1, 2011. The Corporation issued financial statements for the year ended March 31, 2012 using Canadian generally accepted accounting principles prescribed by the CICA Handbook- Accounting Part V – Pre-changeover Accounting Standards. The adoption of PSAB for NPOs resulted in no adjustments to the previously reported assets, liabilities, net assets, excess of revenue over expenses and cash flows of the organization.
4. CAPITAL ASSETS
2013
($ 000) 2012
($ 000)
Cost Accumulated Amortization Cost
Accumulated Amortization
Furniture 395 321 395 247 Leasehold improvements 1,677 1,416 1,565 1,085 Tourism consumer information system 5,880 4,179 5,833
2,993
Assets in progress - - 38 -
7,952 5,916 7,831 4,325
Cost less accumulated amortization 2,036 3,506
1-362 PUBLIC ACCOUNTS, 2012-2013
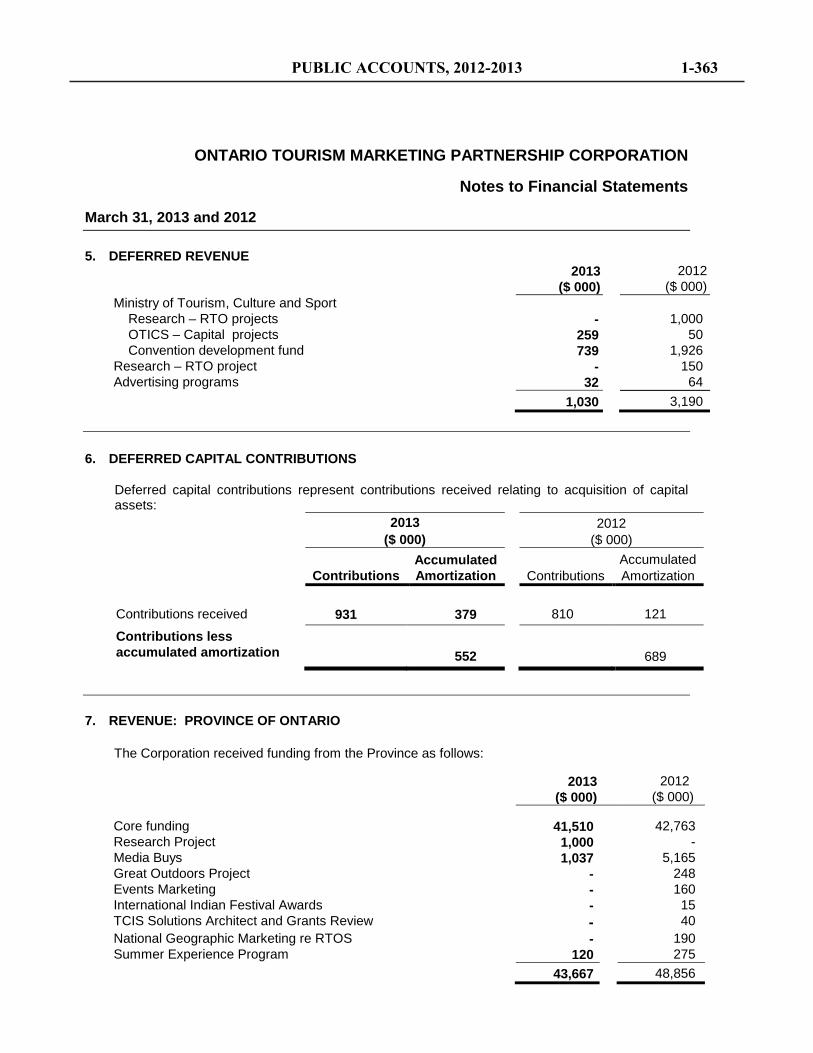
ONTARIO TOURISM MARKETING PARTNERSHIP CORPORATION
Notes to Financial Statements March 31, 2013 and 2012 5. DEFERRED REVENUE
2013 2012 ($ 000) ($ 000) Ministry of Tourism, Culture and Sport Research – RTO projects - 1,000 OTICS – Capital projects 259 50 Convention development fund 739 1,926 Research – RTO project - 150 Advertising programs 32 64 1,030 3,190
6. DEFERRED CAPITAL CONTRIBUTIONS Deferred capital contributions represent contributions received relating to acquisition of capital assets:
2013
($ 000) 2012
($ 000)
Contributions Accumulated Amortization Contributions
Accumulated Amortization
Contributions received 931 379 810 121
Contributions less accumulated amortization 552
689
7. REVENUE: PROVINCE OF ONTARIO
The Corporation received funding from the Province as follows: 2013 2012 ($ 000) ($ 000) Core funding 41,510 42,763 Research Project 1,000 - Media Buys 1,037 5,165 Great Outdoors Project - 248 Events Marketing - 160 International Indian Festival Awards - 15 TCIS Solutions Architect and Grants Review - 40 National Geographic Marketing re RTOS - 190 Summer Experience Program 120 275
43,667 48,856
PUBLIC ACCOUNTS, 2012-2013 1-363
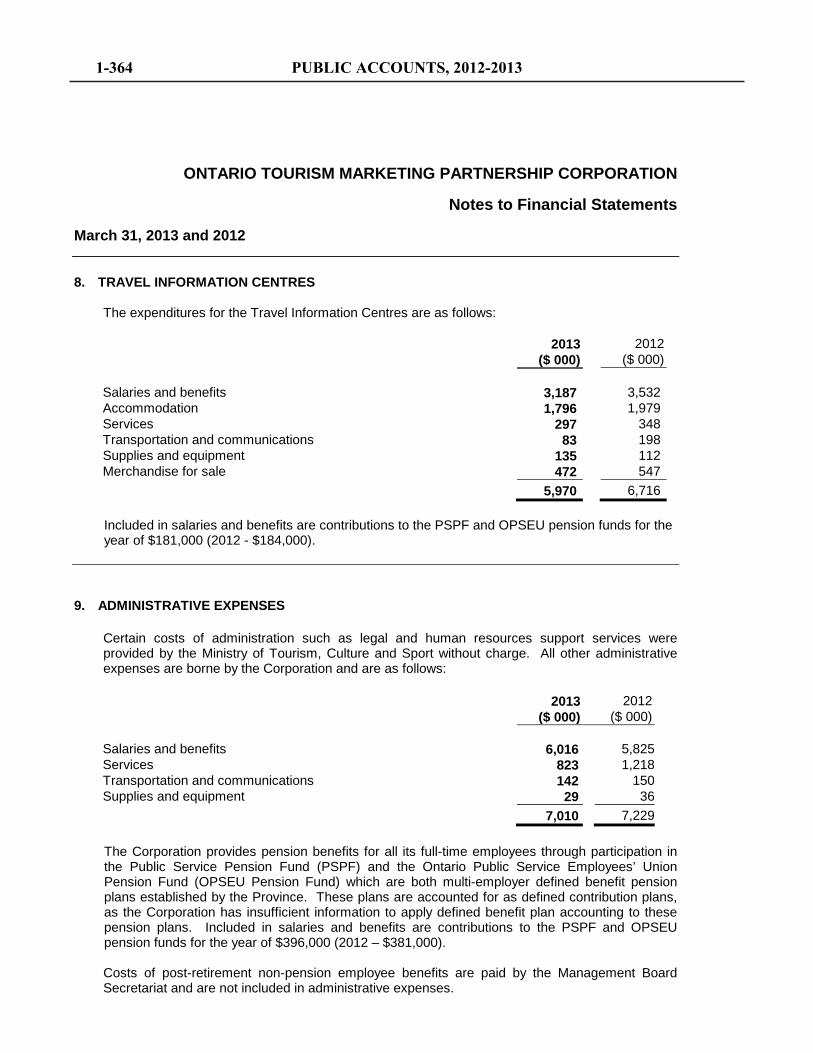
ONTARIO TOURISM MARKETING PARTNERSHIP CORPORATION
Notes to Financial Statements March 31, 2013 and 2012 8. TRAVEL INFORMATION CENTRES
The expenditures for the Travel Information Centres are as follows:
2013 2012 ($ 000) ($ 000) Salaries and benefits 3,187 3,532 Accommodation 1,796 1,979 Services 297 348 Transportation and communications 83 198 Supplies and equipment 135 112 Merchandise for sale 472 547 5,970 6,716
Included in salaries and benefits are contributions to the PSPF and OPSEU pension funds for the year of $181,000 (2012 - $184,000).
9. ADMINISTRATIVE EXPENSES Certain costs of administration such as legal and human resources support services were provided by the Ministry of Tourism, Culture and Sport without charge. All other administrative expenses are borne by the Corporation and are as follows: 2013 2012 ($ 000) ($ 000) Salaries and benefits 6,016 5,825 Services 823 1,218 Transportation and communications 142 150 Supplies and equipment 29 36 7,010 7,229 The Corporation provides pension benefits for all its full-time employees through participation in the Public Service Pension Fund (PSPF) and the Ontario Public Service Employees’ Union Pension Fund (OPSEU Pension Fund) which are both multi-employer defined benefit pension plans established by the Province. These plans are accounted for as defined contribution plans, as the Corporation has insufficient information to apply defined benefit plan accounting to these pension plans. Included in salaries and benefits are contributions to the PSPF and OPSEU pension funds for the year of $396,000 (2012 – $381,000). Costs of post-retirement non-pension employee benefits are paid by the Management Board Secretariat and are not included in administrative expenses.
1-364 PUBLIC ACCOUNTS, 2012-2013
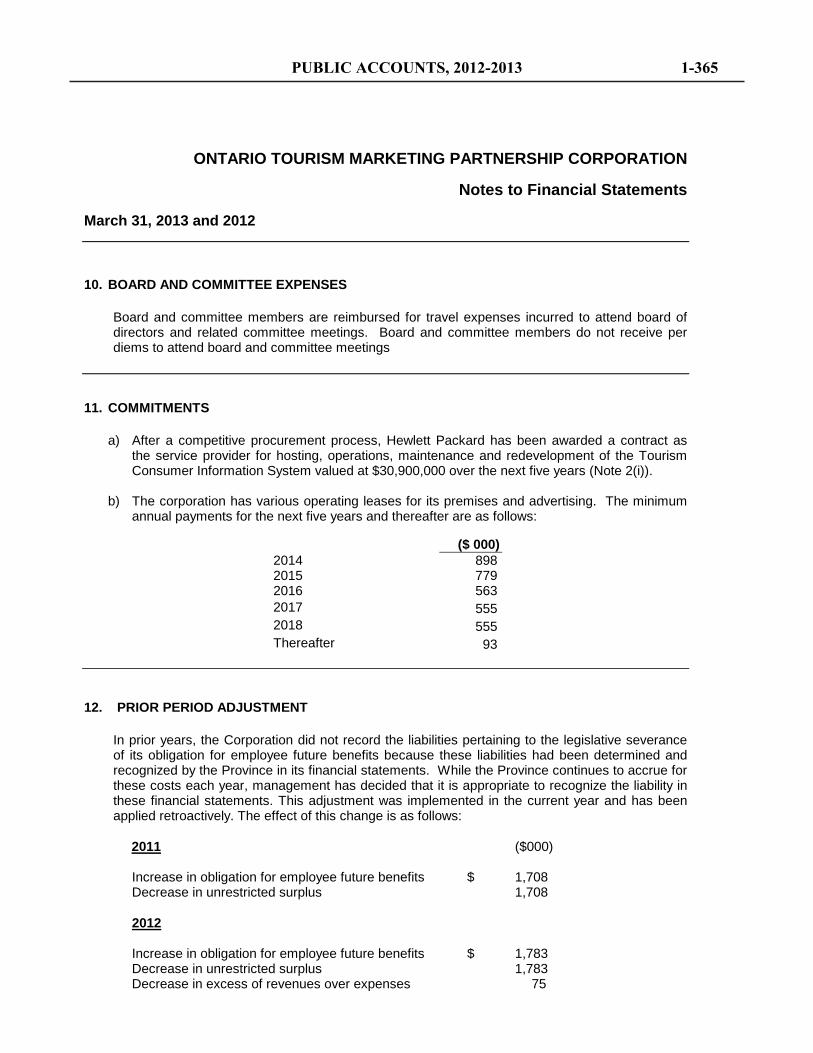
ONTARIO TOURISM MARKETING PARTNERSHIP CORPORATION
Notes to Financial Statements March 31, 2013 and 2012 10. BOARD AND COMMITTEE EXPENSES
Board and committee members are reimbursed for travel expenses incurred to attend board of directors and related committee meetings. Board and committee members do not receive per diems to attend board and committee meetings
11. COMMITMENTS
a) After a competitive procurement process, Hewlett Packard has been awarded a contract as the service provider for hosting, operations, maintenance and redevelopment of the Tourism Consumer Information System valued at $30,900,000 over the next five years (Note 2(i)).
b) The corporation has various operating leases for its premises and advertising. The minimum annual payments for the next five years and thereafter are as follows:
($ 000) 2014 898 2015 779 2016 563 2017 555 2018 555 Thereafter 93
12. PRIOR PERIOD ADJUSTMENT In prior years, the Corporation did not record the liabilities pertaining to the legislative severance of its obligation for employee future benefits because these liabilities had been determined and recognized by the Province in its financial statements. While the Province continues to accrue for these costs each year, management has decided that it is appropriate to recognize the liability in these financial statements. This adjustment was implemented in the current year and has been applied retroactively. The effect of this change is as follows:
2011 ($000)
Increase in obligation for employee future benefits $ 1,708 Decrease in unrestricted surplus 1,708 2012
Increase in obligation for employee future benefits $ 1,783 Decrease in unrestricted surplus 1,783
Decrease in excess of revenues over expenses 75
PUBLIC ACCOUNTS, 2012-2013 1-365

ONTARIO TOURISM MARKETING PARTNERSHIP CORPORATION
Notes to Financial Statements March 31, 2013 and 2012 13. COMPARATIVE FIGURES
Certain comparative amounts have been reclassified to conform to the current year’s method of presentation.
1-366 PUBLIC ACCOUNTS, 2012-2013
Ontario Trillium Foundation
Management’s Responsibility For Financial Information
The accompanying financial statements of the Ontario Trillium Foundation are the responsibility of management and have been prepared in accordance with generally accepted accounting principles. Management maintains a system of internal controls designed to provide reasonable assurance that financial information is accurate and that assets are protected. The Board of Directors ensures that management fulfils its responsibilities for financial reporting and internal control. The Finance & Audit Committee and the Board of Directors meet regularly to oversee the financial activities of the foundation, and at least annually to review the audited financial statements and the external auditors’ report thereon. The financial statements have been examined by KPMG LLP, independent external auditors appointed by the Board of Directors. The external auditors’ responsibility is to express their opinion on whether the financial statements are fairly presented in accordance with generally accepted accounting principles. The Auditors’ Report outlines the scope of the auditors’ examination and opinion.
Andrea Cohen Barrack Anne Pashley Chief Executive Officer Vice-President,
Finance and Administration
PUBLIC ACCOUNTS, 2012-2013 1-367
INDEPENDENT AUDITORS' REPORT To the Board of Directors of Ontario Trillium Foundation
We have audited the accompanying financial statements of Ontario Trillium Foundation, which comprise the statements of financial position as at March 31, 2013, March 31, 2012 and April 1, 2011, the statements of operations, changes in net assets and cash flows for the years ended March 31, 2013 and March 31, 2012, and notes, comprising a summary of significant accounting policies and other explanatory information.
Management's Responsibility for the Financial Statements
Management is responsible for the preparation and fair presentation of these financial statements in accordance with Canadian public sector accounting standards, and for such internal control as management determines is necessary to enable the preparation of financial statements that are free from material misstatement, whether due to fraud or error.
Auditors' Responsibility
Our responsibility is to express an opinion on these financial statements based on our audits. We conducted our audits in accordance with Canadian generally accepted auditing standards. Those standards require that we comply with ethical requirements and plan and perform the audit to obtain reasonable assurance about whether the financial statements are free from material misstatement.
An audit involves performing procedures to obtain audit evidence about the amounts and disclosures in the financial statements. The procedures selected depend on our judgment, including the assessment of the risks of material misstatement of the financial statements, whether due to fraud or error. In making those risk assessments, we consider internal control relevant to the entity's preparation and fair presentation of the financial statements in order to design audit procedures that are appropriate in the circumstances, but not for the purpose of expressing an opinion on the effectiveness of the entity's internal control. An audit also includes evaluating the appropriateness of accounting policies used and the reasonableness of accounting estimates made by management, as well as evaluating the overall presentation of the financial statements.
We believe that the audit evidence we have obtained in our audits is sufficient and appropriate to provide a basis for our audit opinion.
Opinion
In our opinion, the financial statements present fairly, in all material respects, the financial position of Ontario Trillium Foundation as at March 31, 2013, March 31, 2012 and April 1, 2011, and its results of operations and its cash flows for the years ended March 31, 2013 and March 31, 2012 in accordance with Canadian public sector accounting standards.
Chartered Accountants, Licensed Public Accountants June 20, 2013 Toronto, Canada
KPMG LLP Telephone (416) 228-7000 Chartered Accountants Fax (416) 228-7123 Yonge Corporate Centre Internet www.kpmg.ca 4100 Yonge Street Suite 200 Toronto ON M2P 2H3 Canada
1-368 PUBLIC ACCOUNTS, 2012-2013
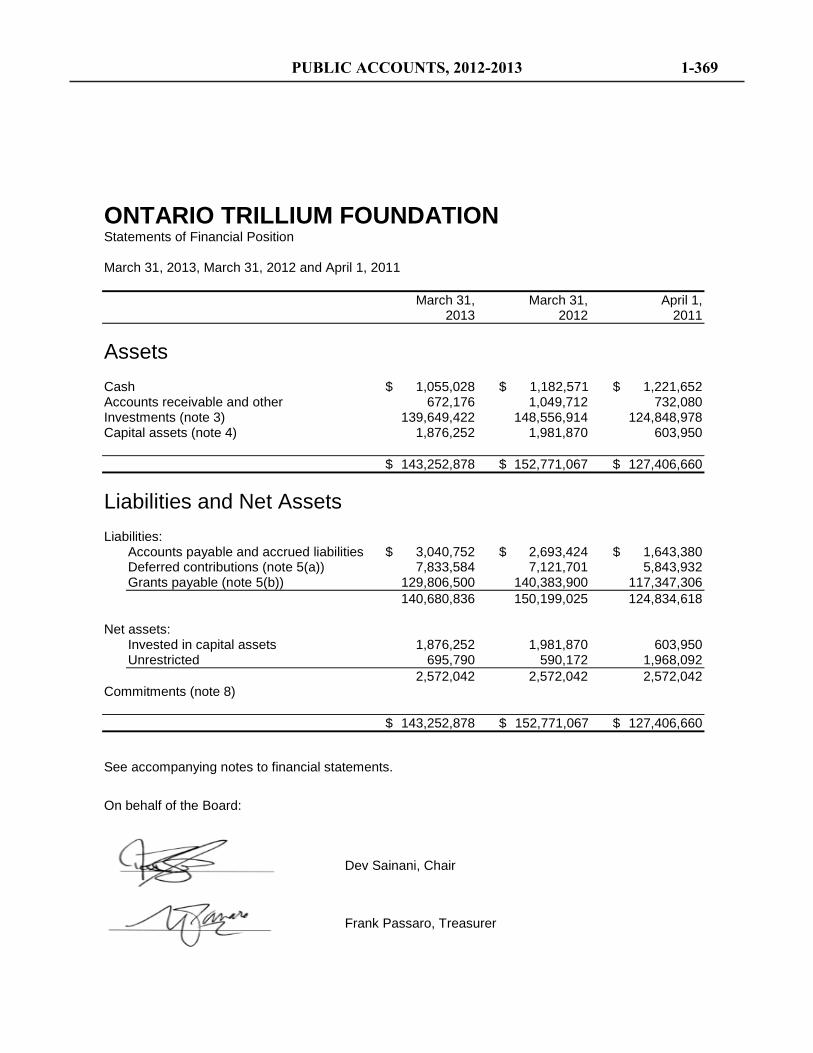
ONTARIO TRILLIUM FOUNDATION Statements of Financial Position March 31, 2013, March 31, 2012 and April 1, 2011 March 31, March 31, April 1, 2013 2012 2011
Assets Cash $ 1,055,028 $ 1,182,571 $ 1,221,652 Accounts receivable and other 672,176 1,049,712 732,080 Investments (note 3) 139,649,422 148,556,914 124,848,978 Capital assets (note 4) 1,876,252 1,981,870 603,950 $ 143,252,878 $ 152,771,067 $ 127,406,660
Liabilities and Net Assets Liabilities:
Accounts payable and accrued liabilities $ 3,040,752 $ 2,693,424 $ 1,643,380 Deferred contributions (note 5(a)) 7,833,584 7,121,701 5,843,932 Grants payable (note 5(b)) 129,806,500 140,383,900 117,347,306 140,680,836 150,199,025 124,834,618
Net assets:
Invested in capital assets 1,876,252 1,981,870 603,950 Unrestricted 695,790 590,172 1,968,092 2,572,042 2,572,042 2,572,042
Commitments (note 8) $ 143,252,878 $ 152,771,067 $ 127,406,660
See accompanying notes to financial statements.
On behalf of the Board:
Dev Sainani, Chair Frank Passaro, Treasurer
PUBLIC ACCOUNTS, 2012-2013 1-369
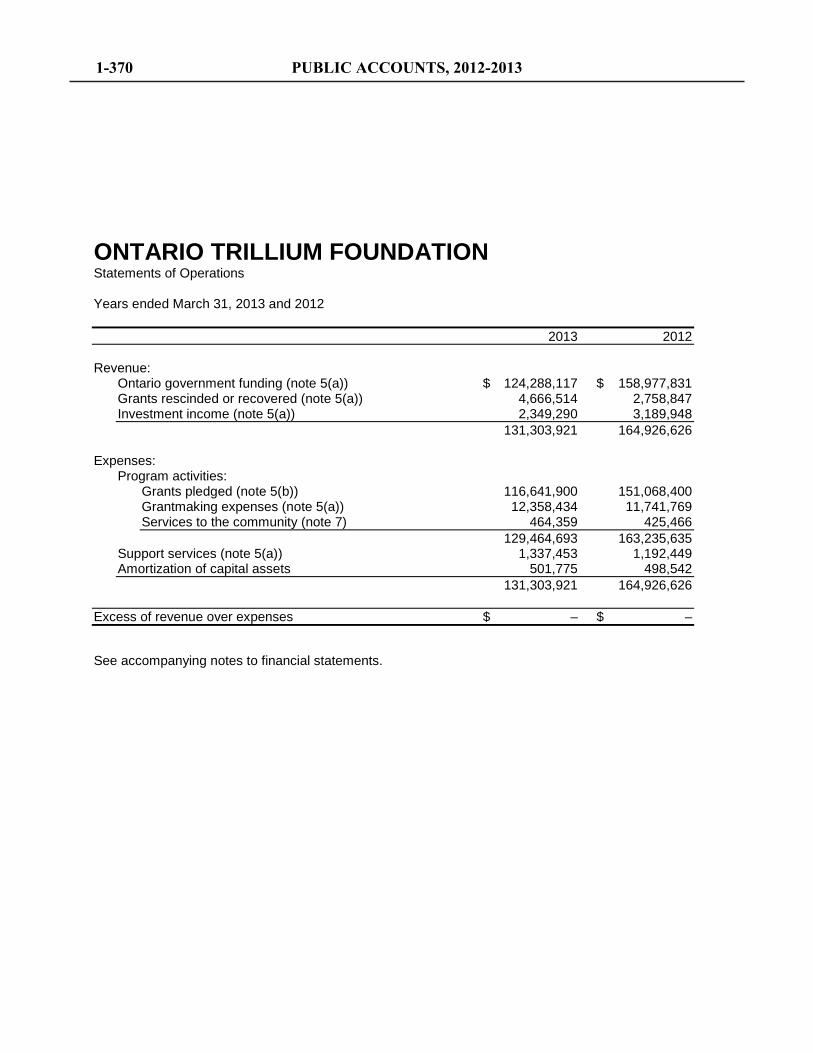
ONTARIO TRILLIUM FOUNDATION Statements of Operations Years ended March 31, 2013 and 2012 2013 2012 Revenue:
Ontario government funding (note 5(a)) $ 124,288,117 $ 158,977,831 Grants rescinded or recovered (note 5(a)) 4,666,514 2,758,847 Investment income (note 5(a)) 2,349,290 3,189,948 131,303,921 164,926,626
Expenses:
Program activities: Grants pledged (note 5(b)) 116,641,900 151,068,400 Grantmaking expenses (note 5(a)) 12,358,434 11,741,769 Services to the community (note 7) 464,359 425,466 129,464,693 163,235,635
Support services (note 5(a)) 1,337,453 1,192,449 Amortization of capital assets 501,775 498,542 131,303,921 164,926,626
Excess of revenue over expenses $ – $ –
See accompanying notes to financial statements.
1-370 PUBLIC ACCOUNTS, 2012-2013
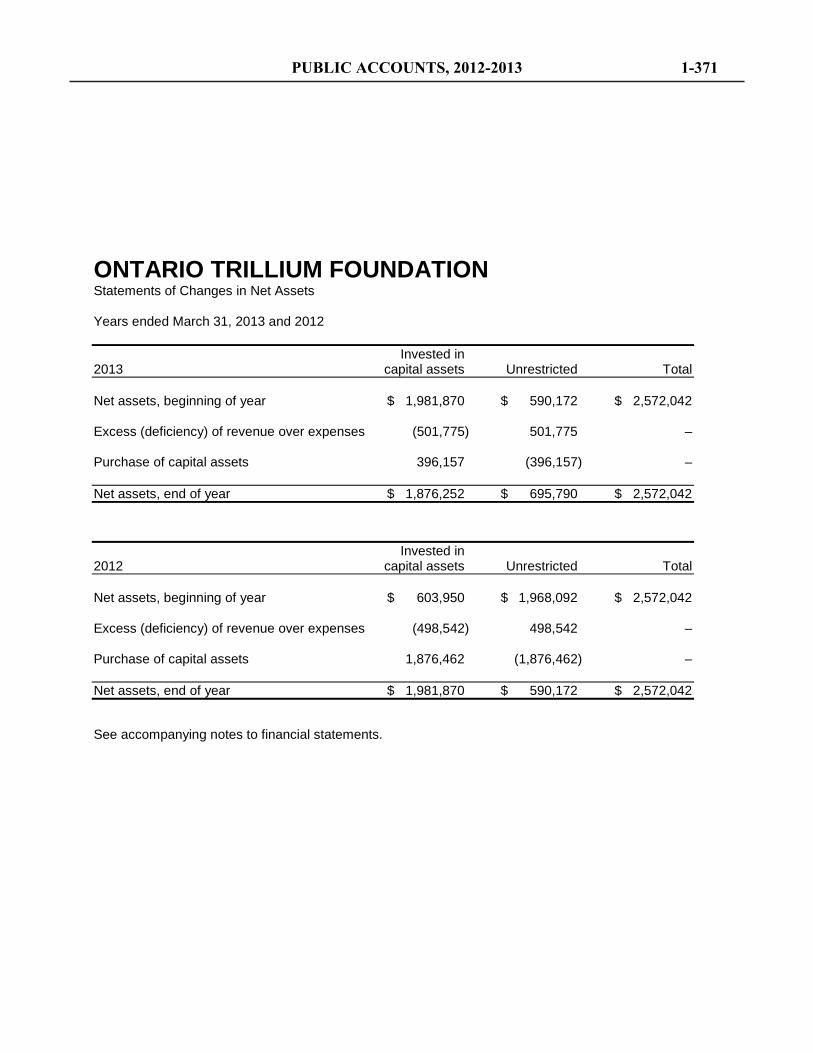
ONTARIO TRILLIUM FOUNDATION Statements of Changes in Net Assets Years ended March 31, 2013 and 2012 Invested in 2013 capital assets Unrestricted Total Net assets, beginning of year $ 1,981,870 $ 590,172 $ 2,572,042 Excess (deficiency) of revenue over expenses (501,775) 501,775 – Purchase of capital assets 396,157 (396,157) – Net assets, end of year $ 1,876,252 $ 695,790 $ 2,572,042
Invested in 2012 capital assets Unrestricted Total Net assets, beginning of year $ 603,950 $ 1,968,092 $ 2,572,042 Excess (deficiency) of revenue over expenses (498,542) 498,542 – Purchase of capital assets 1,876,462 (1,876,462) – Net assets, end of year $ 1,981,870 $ 590,172 $ 2,572,042
See accompanying notes to financial statements.
PUBLIC ACCOUNTS, 2012-2013 1-371
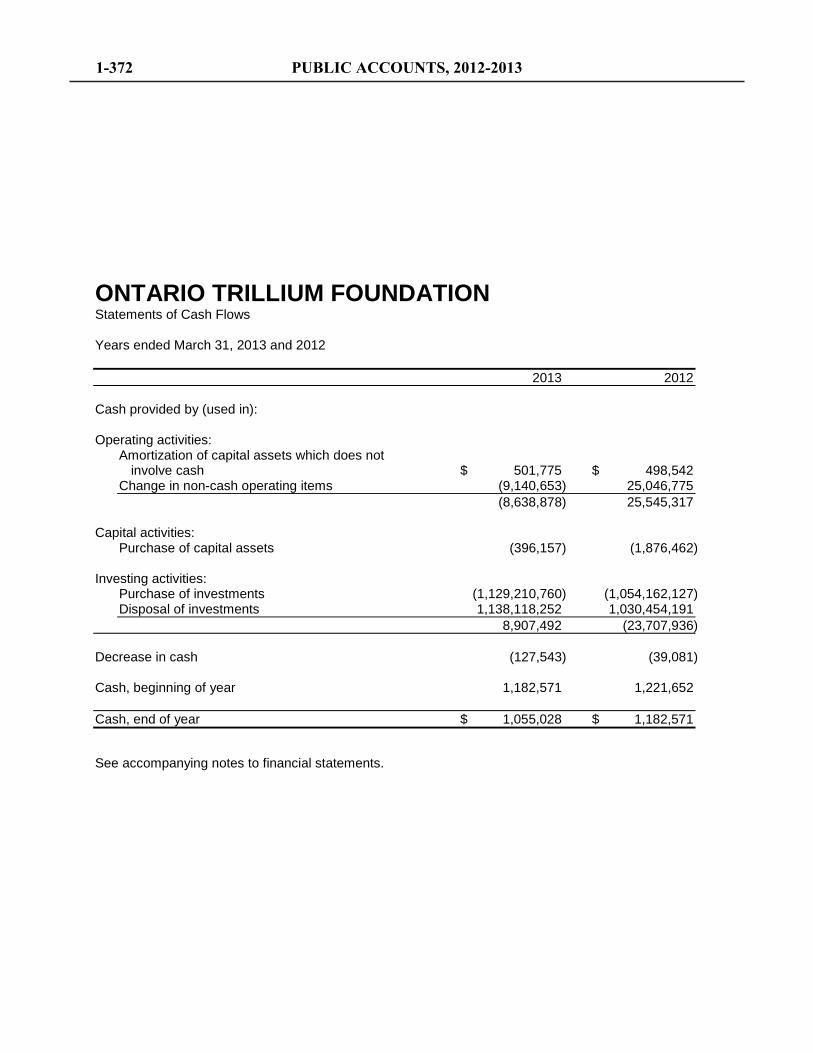
ONTARIO TRILLIUM FOUNDATION Statements of Cash Flows Years ended March 31, 2013 and 2012 2013 2012 Cash provided by (used in): Operating activities:
Amortization of capital assets which does not involve cash $ 501,775 $ 498,542
Change in non-cash operating items (9,140,653) 25,046,775 (8,638,878) 25,545,317
Capital activities:
Purchase of capital assets (396,157) (1,876,462) Investing activities:
Purchase of investments (1,129,210,760) (1,054,162,127) Disposal of investments 1,138,118,252 1,030,454,191 8,907,492 (23,707,936)
Decrease in cash (127,543) (39,081) Cash, beginning of year 1,182,571 1,221,652 Cash, end of year $ 1,055,028 $ 1,182,571
See accompanying notes to financial statements.
1-372 PUBLIC ACCOUNTS, 2012-2013
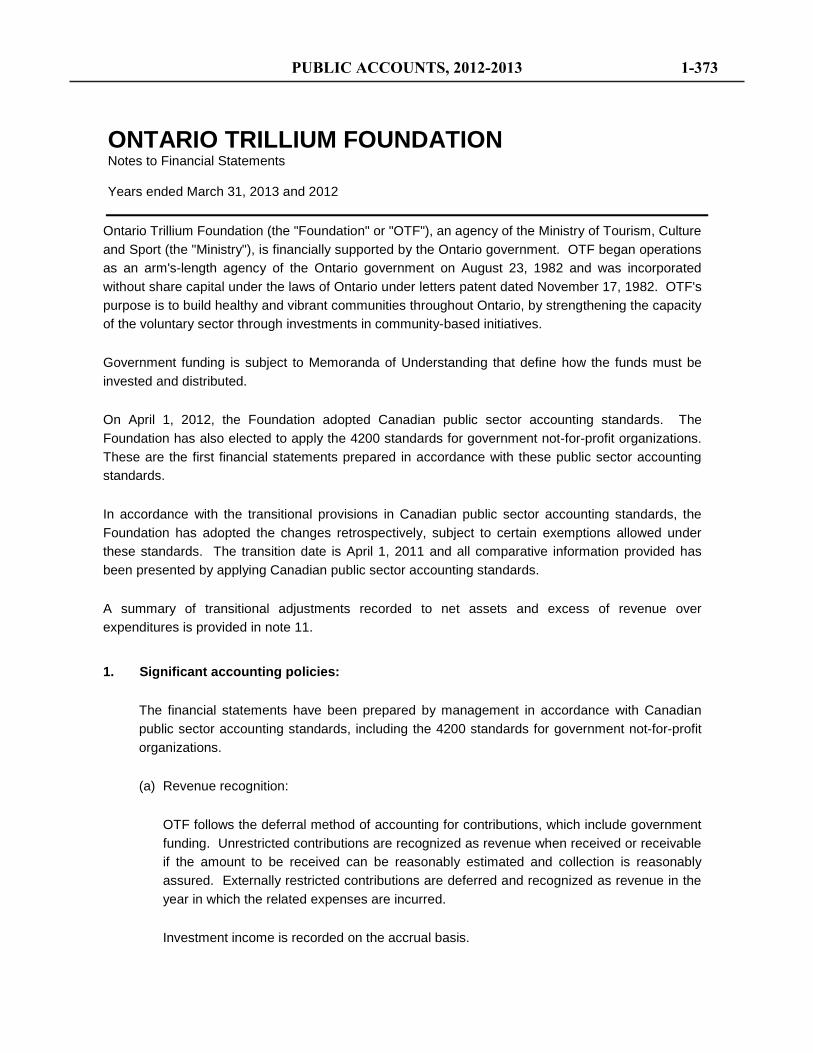
Ontario Trillium Foundation (the "Foundation" or "OTF"), an agency of the Ministry of Tourism, Culture and Sport (the "Ministry"), is financially supported by the Ontario government. OTF began operations as an arm's-length agency of the Ontario government on August 23, 1982 and was incorporated without share capital under the laws of Ontario under letters patent dated November 17, 1982. OTF's purpose is to build healthy and vibrant communities throughout Ontario, by strengthening the capacity of the voluntary sector through investments in community-based initiatives.
Government funding is subject to Memoranda of Understanding that define how the funds must be invested and distributed.
On April 1, 2012, the Foundation adopted Canadian public sector accounting standards. The Foundation has also elected to apply the 4200 standards for government not-for-profit organizations. These are the first financial statements prepared in accordance with these public sector accounting standards.
In accordance with the transitional provisions in Canadian public sector accounting standards, the Foundation has adopted the changes retrospectively, subject to certain exemptions allowed under these standards. The transition date is April 1, 2011 and all comparative information provided has been presented by applying Canadian public sector accounting standards.
A summary of transitional adjustments recorded to net assets and excess of revenue over expenditures is provided in note 11.
1. Significant accounting policies:
The financial statements have been prepared by management in accordance with Canadian public sector accounting standards, including the 4200 standards for government not-for-profit organizations.
(a) Revenue recognition:
OTF follows the deferral method of accounting for contributions, which include government funding. Unrestricted contributions are recognized as revenue when received or receivable if the amount to be received can be reasonably estimated and collection is reasonably assured. Externally restricted contributions are deferred and recognized as revenue in the year in which the related expenses are incurred.
Investment income is recorded on the accrual basis.
ONTARIO TRILLIUM FOUNDATION Notes to Financial Statements Years ended March 31, 2013 and 2012
PUBLIC ACCOUNTS, 2012-2013 1-373
1. Significant accounting policies (continued):
(b) Financial instruments:
Financial instruments are recorded at fair value on initial recognition. All other financial instruments are subsequently recorded at cost or amortized cost unless management has elected to carry the instruments at fair value. The Foundation has not elected to carry any such financial instruments at fair value.
Financial instruments are adjusted by transaction costs incurred on acquisition and financing costs, which are amortized using the effective interest rate method.
All financial assets are assessed for impairment on an annual basis. When a decline is determined to be other than temporary, the amount of the loss is reported in the statements of operations.
As financial instruments are recorded at cost or amortized costs, a statement of remeasurement gains and losses has not been included.
(c) Grants:
Grants are recorded as expenses in the year that the Foundation approves the grant.
(d) Allocation of support services expenses:
The Foundation classifies expenses on the statements of operations by function. The Foundation allocates certain costs by identifying the appropriate basis of allocating and applying that basis consistently each year. The Foundation allocates its support services expenses proportionately on a per capita basis.
(e) Capital assets:
Capital assets are recorded at cost less accumulated amortization. Amortization is provided on a straight-line basis over the following periods:
Furniture and fixtures 5 years Computer hardware 3 years Computer software 3 years Leasehold improvements Over term of lease
ONTARIO TRILLIUM FOUNDATION Notes to Financial Statements Years ended March 31, 2013 and 2012
1-374 PUBLIC ACCOUNTS, 2012-2013
1. Significant accounting policies (continued):
(f) Use of estimates:
The preparation of financial statements requires management to make estimates and assumptions that affect the reported amounts of assets and liabilities and disclosure of contingent assets and liabilities at the date of the financial statements and the reported amounts of revenue and expenses during the year. Actual results could differ from those estimates.
2. Change in accounting policy:
On April 1, 2012, the Foundation adopted Public Accounting Standards PS 3450, Financial Instruments ("PS 3450"), and PS 2601, Foreign Currency Translation. The standards were adopted prospectively from the date of adoption. The new standards provide comprehensive requirements for the recognition, measurement, presentation and disclosure of financial instruments and foreign currency transactions.
Under PS 3450, all financial instruments are included on the statements of financial position and are measured either at fair value or amortized cost based on the characteristics of the instrument and the Foundation's accounting policy choices (note 1).
3. Investments:
March 31, March 31, April 1, 2013 2012 2011 Short-term investments $ 42,688,457 $ 55,181,115 $ 94,946,600 Bonds 24,373,775 19,518,889 29,902,378 Laddered bond portfolio 72,587,190 73,856,910 – $ 139,649,422 $ 148,556,914 $ 124,848,978
All investments, excluding the laddered bond portfolio, are in fixed income securities and mature within the next nine months (March 31, 2012 - seven months; April 1, 2011 - five months). These investments bear interest from 0.96% to 1.29% (March 31, 2012 - 0.90% to 1.35%; April 1, 2011 - 0.90% to 1.20%).
ONTARIO TRILLIUM FOUNDATION Notes to Financial Statements Years ended March 31, 2013 and 2012
PUBLIC ACCOUNTS, 2012-2013 1-375
3. Investments (continued):
On April 1, 2011, OTF created a laddered bond portfolio. All bond investments are in fixed income securities and have maturity dates between six months and three years. These investments bear interest from 3.15% to 5.00% (March 31, 2012 - 3.25% to 6.00%).
The Ontario Financing Authority acts as OTF's investment manager under an investment management agreement that adheres to OTF's policies and procedures governing risk and also includes additional risk concern measures.
4. Capital assets:
Accumulated Net book March 31, 2013 Cost amortization value Furniture and fixtures $ 949,889 $ 715,120 $ 234,769 Computer hardware 1,144,048 803,213 340,835 Computer software 1,174,501 1,016,508 157,993 Leasehold improvements 1,393,393 250,738 1,142,655 $ 4,661,831 $ 2,785,579 $ 1,876,252
Accumulated Net book March 31, 2012 Cost amortization value Furniture and fixtures $ 985,061 $ 689,495 $ 295,566 Computer hardware 872,472 633,890 238,582 Computer software 1,071,710 899,421 172,289 Leasehold improvements 1,388,729 113,296 1,275,433 $ 4,317,972 $ 2,336,102 $ 1,981,870
Accumulated Net book April 1, 2011 Cost amortization value Furniture and fixtures $ 809,812 $ 756,300 $ 53,512 Computer hardware 1,175,783 980,572 195,211 Computer software 960,771 730,372 230,399 Leasehold improvements 1,623,743 1,498,915 124,828 $ 4,570,109 $ 3,966,159 $ 603,950
ONTARIO TRILLIUM FOUNDATION Notes to Financial Statements Years ended March 31, 2013 and 2012
1-376 PUBLIC ACCOUNTS, 2012-2013
5. Deferred contributions and grants payable:
(a) Deferred contributions represent funding received from the Ministry that has not yet been pledged as grants or spent on operations. These funds are restricted until grants are approved by the Board of Directors and pledged to third parties or until operating expenditures are made. OTF has controls in place to ensure that the restrictions on grant pledges are met prior to utilization of these funds.
Community General Capital March 31, 2013 operations Fund Total Deferred contributions,
beginning of year $ 6,618,706 $ 502,995 $ 7,121,701 Funding received:
Ministry of Tourism, Culture and Sport:
Annual core allocation 120,000,000 – 120,000,000 Special projects – 5,000,000 5,000,000
120,000,000 5,000,000 125,000,000 Investment income
recorded as revenue 2,349,290 – 2,349,290 Grants pledged (110,854,300) (5,787,600) (116,641,900) Grantmaking expenses (11,857,229) (501,205) (12,358,434) Support services and
amortization (1,839,228) – (1,839,228) Services to the community (464,359) – (464,359) Grants rescinded or
recovered 2,636,700 2,029,814 4,666,514 Amounts recognized as
Ontario government funding (120,029,126) (4,258,991) (124,288,117)
Change during the year (29,126) 741,009 711,883 Deferred contributions,
end of year $ 6,589,580 $ 1,244,004 $ 7,833,584
ONTARIO TRILLIUM FOUNDATION Notes to Financial Statements Years ended March 31, 2013 and 2012
PUBLIC ACCOUNTS, 2012-2013 1-377
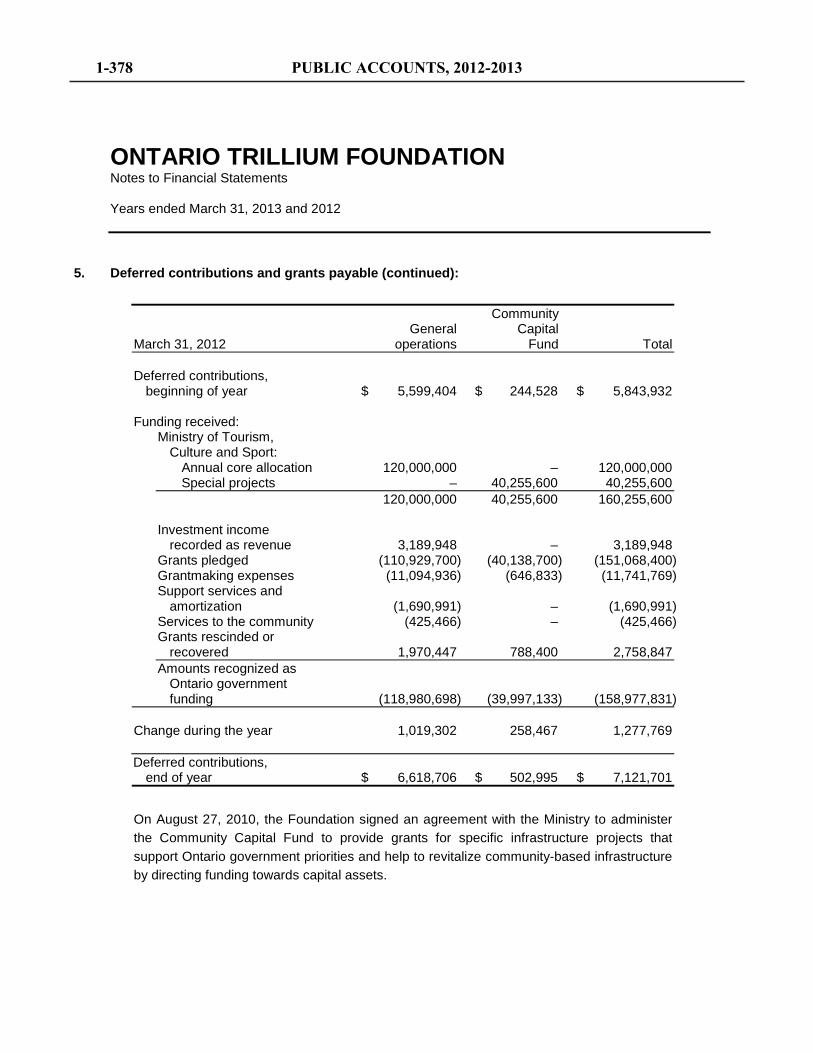
5. Deferred contributions and grants payable (continued):
Community General Capital March 31, 2012 operations Fund Total Deferred contributions,
beginning of year $ 5,599,404 $ 244,528 $ 5,843,932 Funding received:
Ministry of Tourism, Culture and Sport:
Annual core allocation 120,000,000 – 120,000,000 Special projects – 40,255,600 40,255,600
120,000,000 40,255,600 160,255,600 Investment income
recorded as revenue 3,189,948 – 3,189,948 Grants pledged (110,929,700) (40,138,700) (151,068,400) Grantmaking expenses (11,094,936) (646,833) (11,741,769) Support services and
amortization (1,690,991) – (1,690,991) Services to the community (425,466) – (425,466) Grants rescinded or
recovered 1,970,447 788,400 2,758,847 Amounts recognized as
Ontario government funding (118,980,698) (39,997,133) (158,977,831)
Change during the year 1,019,302 258,467 1,277,769 Deferred contributions,
end of year $ 6,618,706 $ 502,995 $ 7,121,701
On August 27, 2010, the Foundation signed an agreement with the Ministry to administer the Community Capital Fund to provide grants for specific infrastructure projects that support Ontario government priorities and help to revitalize community-based infrastructure by directing funding towards capital assets.
ONTARIO TRILLIUM FOUNDATION Notes to Financial Statements Years ended March 31, 2013 and 2012
1-378 PUBLIC ACCOUNTS, 2012-2013
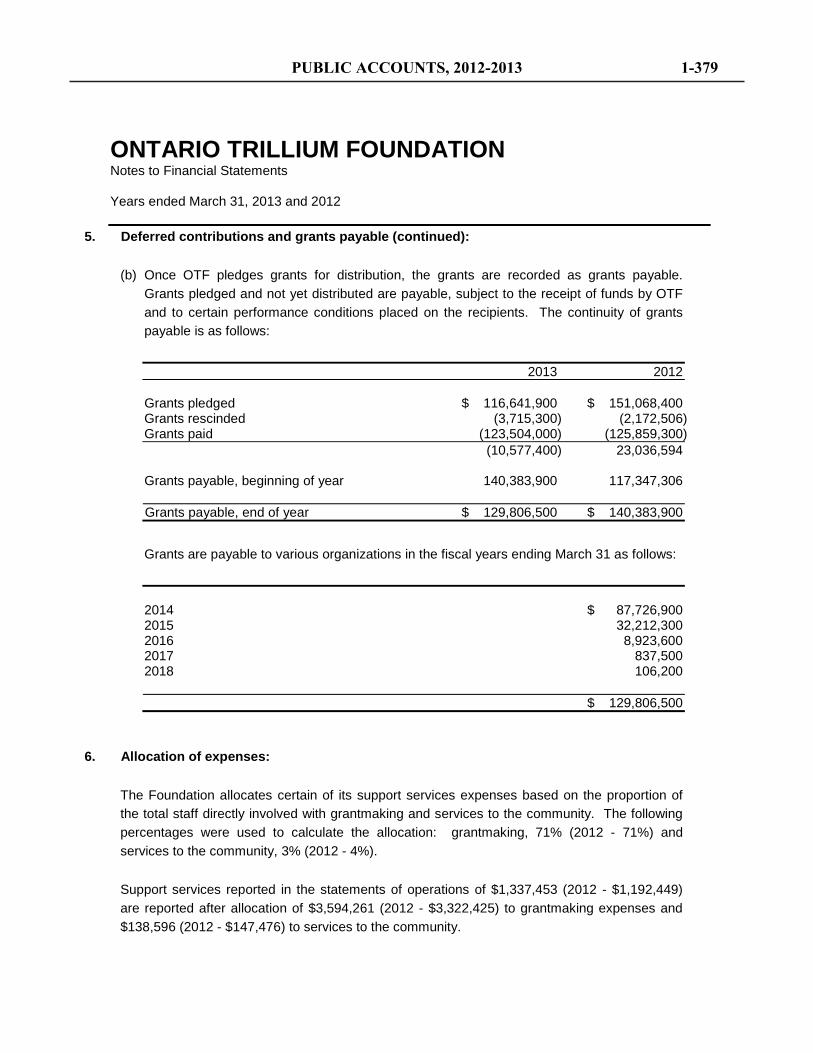
5. Deferred contributions and grants payable (continued):
(b) Once OTF pledges grants for distribution, the grants are recorded as grants payable. Grants pledged and not yet distributed are payable, subject to the receipt of funds by OTF and to certain performance conditions placed on the recipients. The continuity of grants payable is as follows:
2013 2012 Grants pledged $ 116,641,900 $ 151,068,400 Grants rescinded (3,715,300) (2,172,506) Grants paid (123,504,000) (125,859,300) (10,577,400) 23,036,594 Grants payable, beginning of year 140,383,900 117,347,306 Grants payable, end of year $ 129,806,500 $ 140,383,900
Grants are payable to various organizations in the fiscal years ending March 31 as follows:
2014 $ 87,726,900 2015 32,212,300 2016 8,923,600 2017 837,500 2018 106,200 $ 129,806,500
6. Allocation of expenses:
The Foundation allocates certain of its support services expenses based on the proportion of the total staff directly involved with grantmaking and services to the community. The following percentages were used to calculate the allocation: grantmaking, 71% (2012 - 71%) and services to the community, 3% (2012 - 4%).
Support services reported in the statements of operations of $1,337,453 (2012 - $1,192,449) are reported after allocation of $3,594,261 (2012 - $3,322,425) to grantmaking expenses and $138,596 (2012 - $147,476) to services to the community.
ONTARIO TRILLIUM FOUNDATION Notes to Financial Statements Years ended March 31, 2013 and 2012
PUBLIC ACCOUNTS, 2012-2013 1-379
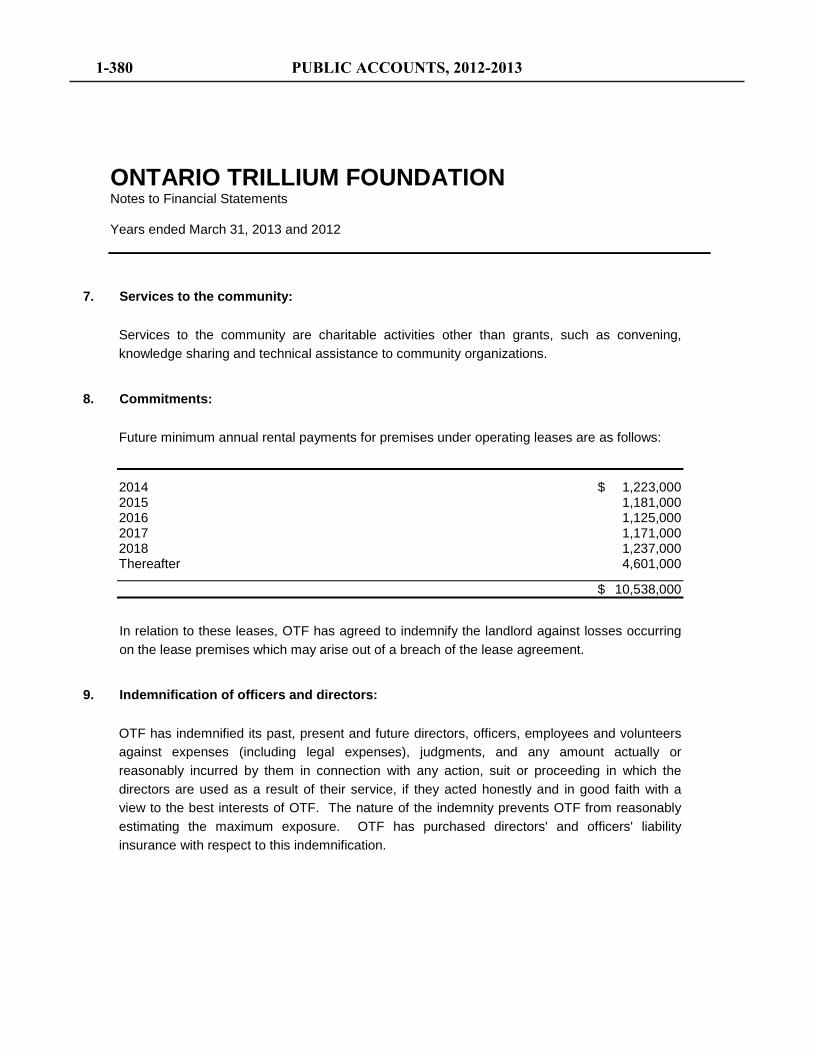
7. Services to the community:
Services to the community are charitable activities other than grants, such as convening, knowledge sharing and technical assistance to community organizations.
8. Commitments:
Future minimum annual rental payments for premises under operating leases are as follows:
2014 $ 1,223,000 2015 1,181,000 2016 1,125,000 2017 1,171,000 2018 1,237,000 Thereafter 4,601,000
$ 10,538,000
In relation to these leases, OTF has agreed to indemnify the landlord against losses occurring on the lease premises which may arise out of a breach of the lease agreement.
9. Indemnification of officers and directors:
OTF has indemnified its past, present and future directors, officers, employees and volunteers against expenses (including legal expenses), judgments, and any amount actually or reasonably incurred by them in connection with any action, suit or proceeding in which the directors are used as a result of their service, if they acted honestly and in good faith with a view to the best interests of OTF. The nature of the indemnity prevents OTF from reasonably estimating the maximum exposure. OTF has purchased directors' and officers' liability insurance with respect to this indemnification.
ONTARIO TRILLIUM FOUNDATION Notes to Financial Statements Years ended March 31, 2013 and 2012
1-380 PUBLIC ACCOUNTS, 2012-2013
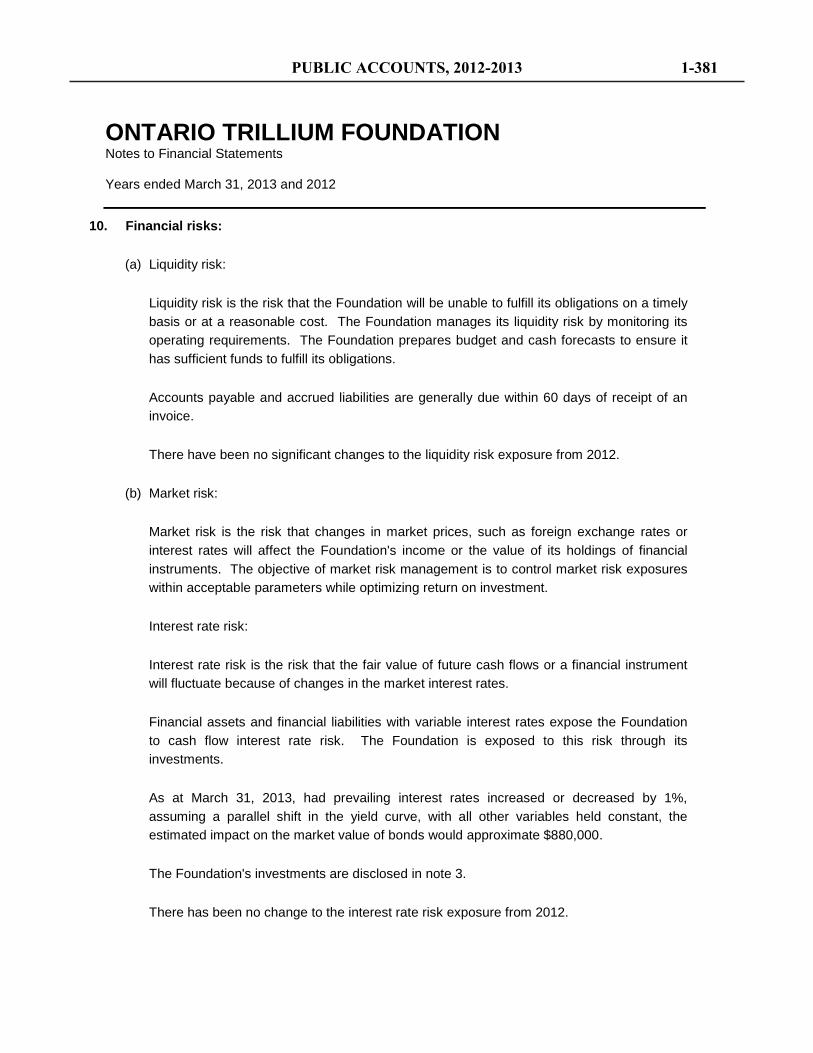
10. Financial risks:
(a) Liquidity risk:
Liquidity risk is the risk that the Foundation will be unable to fulfill its obligations on a timely basis or at a reasonable cost. The Foundation manages its liquidity risk by monitoring its operating requirements. The Foundation prepares budget and cash forecasts to ensure it has sufficient funds to fulfill its obligations.
Accounts payable and accrued liabilities are generally due within 60 days of receipt of an invoice.
There have been no significant changes to the liquidity risk exposure from 2012.
(b) Market risk:
Market risk is the risk that changes in market prices, such as foreign exchange rates or interest rates will affect the Foundation's income or the value of its holdings of financial instruments. The objective of market risk management is to control market risk exposures within acceptable parameters while optimizing return on investment.
Interest rate risk:
Interest rate risk is the risk that the fair value of future cash flows or a financial instrument will fluctuate because of changes in the market interest rates.
Financial assets and financial liabilities with variable interest rates expose the Foundation to cash flow interest rate risk. The Foundation is exposed to this risk through its investments.
As at March 31, 2013, had prevailing interest rates increased or decreased by 1%, assuming a parallel shift in the yield curve, with all other variables held constant, the estimated impact on the market value of bonds would approximate $880,000.
The Foundation's investments are disclosed in note 3.
There has been no change to the interest rate risk exposure from 2012.
ONTARIO TRILLIUM FOUNDATION Notes to Financial Statements Years ended March 31, 2013 and 2012
PUBLIC ACCOUNTS, 2012-2013 1-381
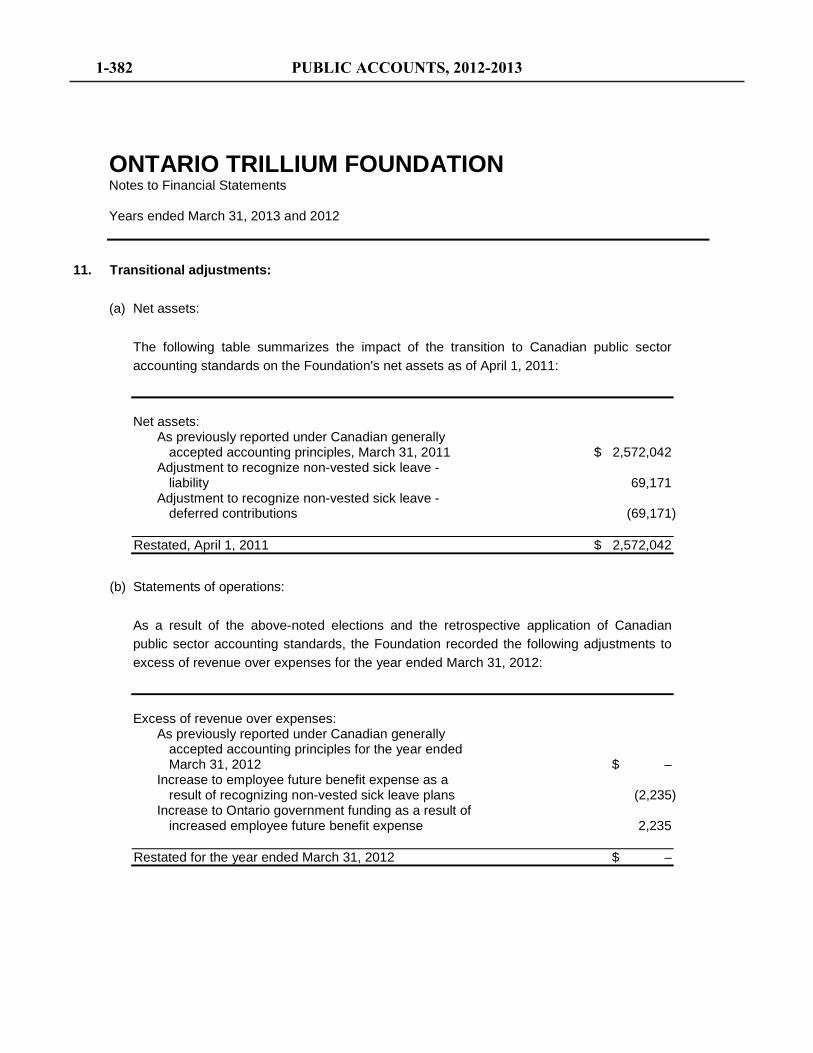
11. Transitional adjustments:
(a) Net assets:
The following table summarizes the impact of the transition to Canadian public sector accounting standards on the Foundation's net assets as of April 1, 2011:
Net assets:
As previously reported under Canadian generally accepted accounting principles, March 31, 2011 $ 2,572,042
Adjustment to recognize non-vested sick leave - liability 69,171
Adjustment to recognize non-vested sick leave - deferred contributions (69,171)
Restated, April 1, 2011 $ 2,572,042
(b) Statements of operations:
As a result of the above-noted elections and the retrospective application of Canadian public sector accounting standards, the Foundation recorded the following adjustments to excess of revenue over expenses for the year ended March 31, 2012:
Excess of revenue over expenses:
As previously reported under Canadian generally accepted accounting principles for the year ended March 31, 2012 $ –
Increase to employee future benefit expense as a result of recognizing non-vested sick leave plans (2,235)
Increase to Ontario government funding as a result of increased employee future benefit expense 2,235
Restated for the year ended March 31, 2012 $ –
ONTARIO TRILLIUM FOUNDATION Notes to Financial Statements Years ended March 31, 2013 and 2012
1-382 PUBLIC ACCOUNTS, 2012-2013
Ornge June 25, 2013 The accompanying consolidated financial statements of Ornge are the responsibility of management and have been prepared in accordance with Canadian public sector accounting standards, except for the effects of the matter described in the second paragraph of this letter. The preparation of financial statements necessarily involves the use of estimates and assumptions based on management’s judgment that affect the reported amounts of assets and liabilities and disclosure of contingent assets and liabilities at the balance sheet date and the reported amounts of revenue and expenses during the reporting period. The financial statements have been properly prepared within reasonable limits of materiality and in light of information available up to June 25, 2013. As discussed in Note 2(a) to the consolidated financial statements, Ornge has not presented comparative financial statements or an opening statement of financial position as at April 1, 2011 on transition to Canadian public sector accounting standards. These matters constitute departures from Canadian public sector accounting standards.
Management is responsible for the preparation and fair presentation of these financial statements in accordance with Canadian public sector accounting standards, and for such internal control as management determines is necessary to enable the preparation of financial statements that are free from material misstatement, whether due to fraud or error. The Board of Directors of Ornge is responsible for ensuring that management fulfills its responsibilities for financial reporting and internal controls. The Board generally meets periodically with management to satisfy itself that such responsibilities have been fulfilled. The consolidated financial statements for the year ended March 31, 2013 have been audited by Ernst & Young LLP (“E&Y”). E&Y’s responsibility is to express an opinion on whether the consolidated financial statements present fairly, in all material respects, the financial position of Ornge as at March 31, 2013 and the results of its operations and its cash flows for the year then ended in accordance with Canadian public sector accounting standards. The Auditors’ Report dated June 25, 2013 outlines the scope of E&Y’s examination and opinion on the consolidated financial statements. On behalf of management, Dr. Andrew McCallum President & Chief Executive Officer Wayne Howard Vice President, Finance
PUBLIC ACCOUNTS, 2012-2013 1-383
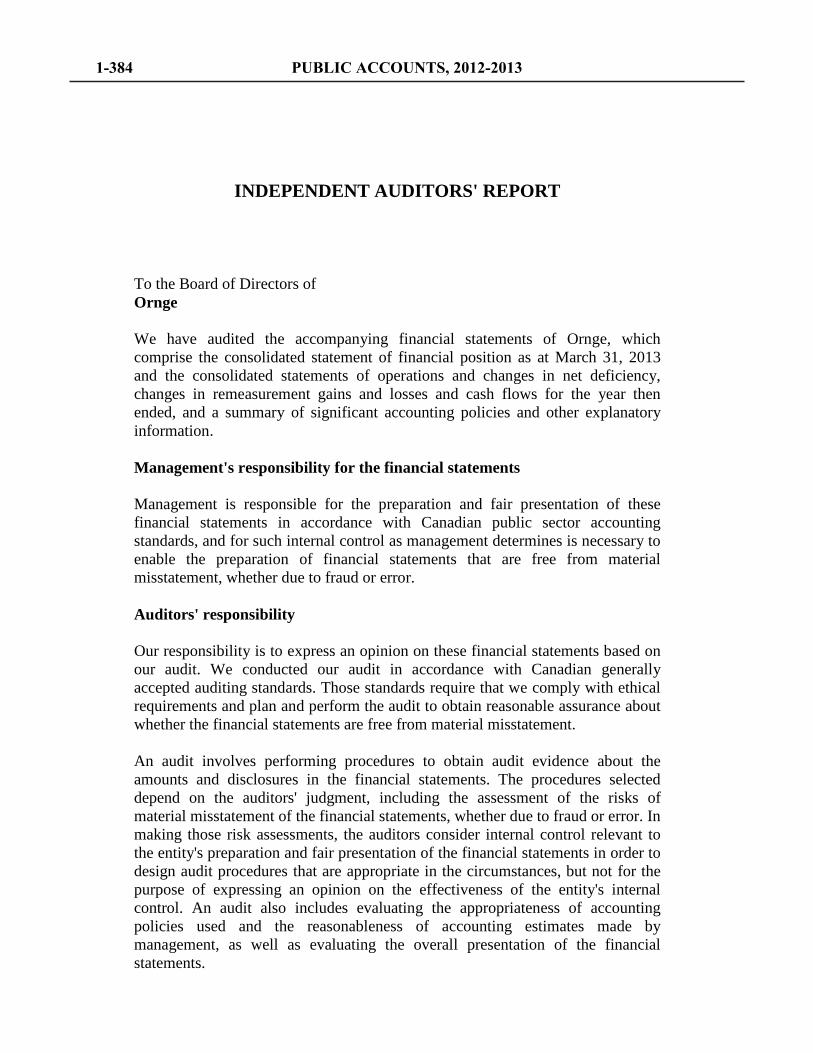
INDEPENDENT AUDITORS' REPORT
To the Board of Directors of Ornge We have audited the accompanying financial statements of Ornge, which comprise the consolidated statement of financial position as at March 31, 2013 and the consolidated statements of operations and changes in net deficiency, changes in remeasurement gains and losses and cash flows for the year then ended, and a summary of significant accounting policies and other explanatory information. Management's responsibility for the financial statements Management is responsible for the preparation and fair presentation of these financial statements in accordance with Canadian public sector accounting standards, and for such internal control as management determines is necessary to enable the preparation of financial statements that are free from material misstatement, whether due to fraud or error. Auditors' responsibility Our responsibility is to express an opinion on these financial statements based on our audit. We conducted our audit in accordance with Canadian generally accepted auditing standards. Those standards require that we comply with ethical requirements and plan and perform the audit to obtain reasonable assurance about whether the financial statements are free from material misstatement. An audit involves performing procedures to obtain audit evidence about the amounts and disclosures in the financial statements. The procedures selected depend on the auditors' judgment, including the assessment of the risks of material misstatement of the financial statements, whether due to fraud or error. In making those risk assessments, the auditors consider internal control relevant to the entity's preparation and fair presentation of the financial statements in order to design audit procedures that are appropriate in the circumstances, but not for the purpose of expressing an opinion on the effectiveness of the entity's internal control. An audit also includes evaluating the appropriateness of accounting policies used and the reasonableness of accounting estimates made by management, as well as evaluating the overall presentation of the financial statements.
1-384 PUBLIC ACCOUNTS, 2012-2013
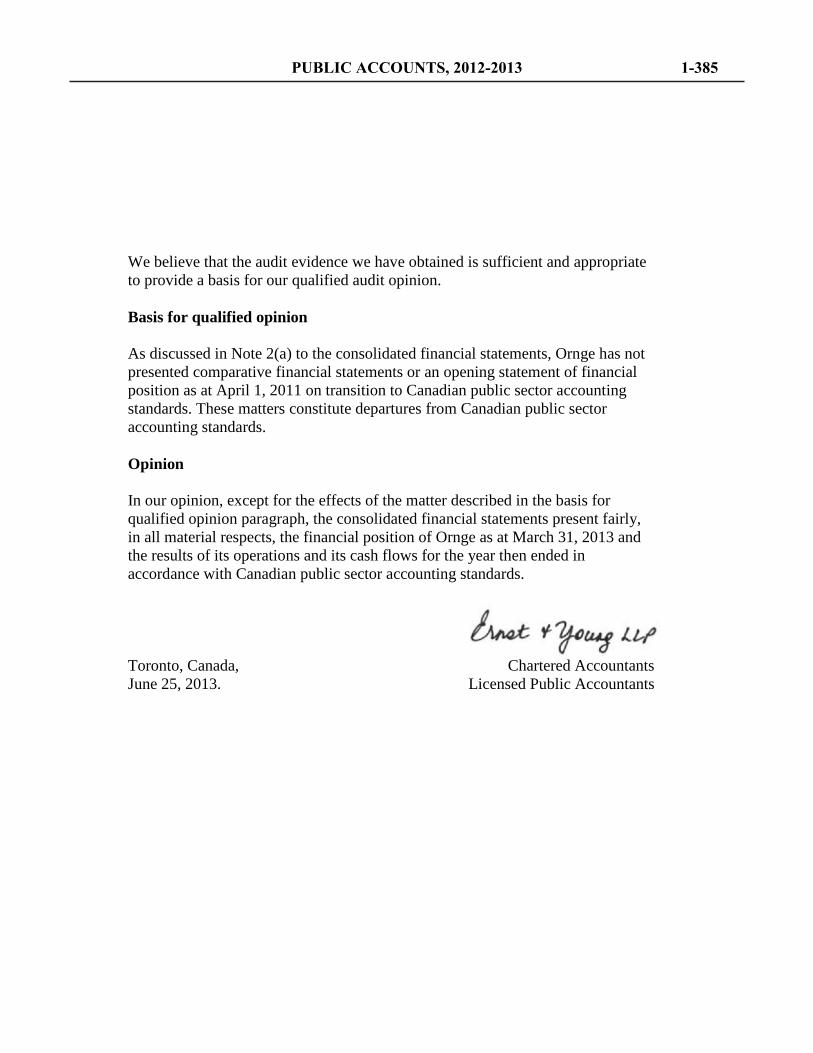
We believe that the audit evidence we have obtained is sufficient and appropriate to provide a basis for our qualified audit opinion. Basis for qualified opinion As discussed in Note 2(a) to the consolidated financial statements, Ornge has not presented comparative financial statements or an opening statement of financial position as at April 1, 2011 on transition to Canadian public sector accounting standards. These matters constitute departures from Canadian public sector accounting standards. Opinion In our opinion, except for the effects of the matter described in the basis for qualified opinion paragraph, the consolidated financial statements present fairly, in all material respects, the financial position of Ornge as at March 31, 2013 and the results of its operations and its cash flows for the year then ended in accordance with Canadian public sector accounting standards. Toronto, Canada, Chartered Accountants June 25, 2013. Licensed Public Accountants
PUBLIC ACCOUNTS, 2012-2013 1-385
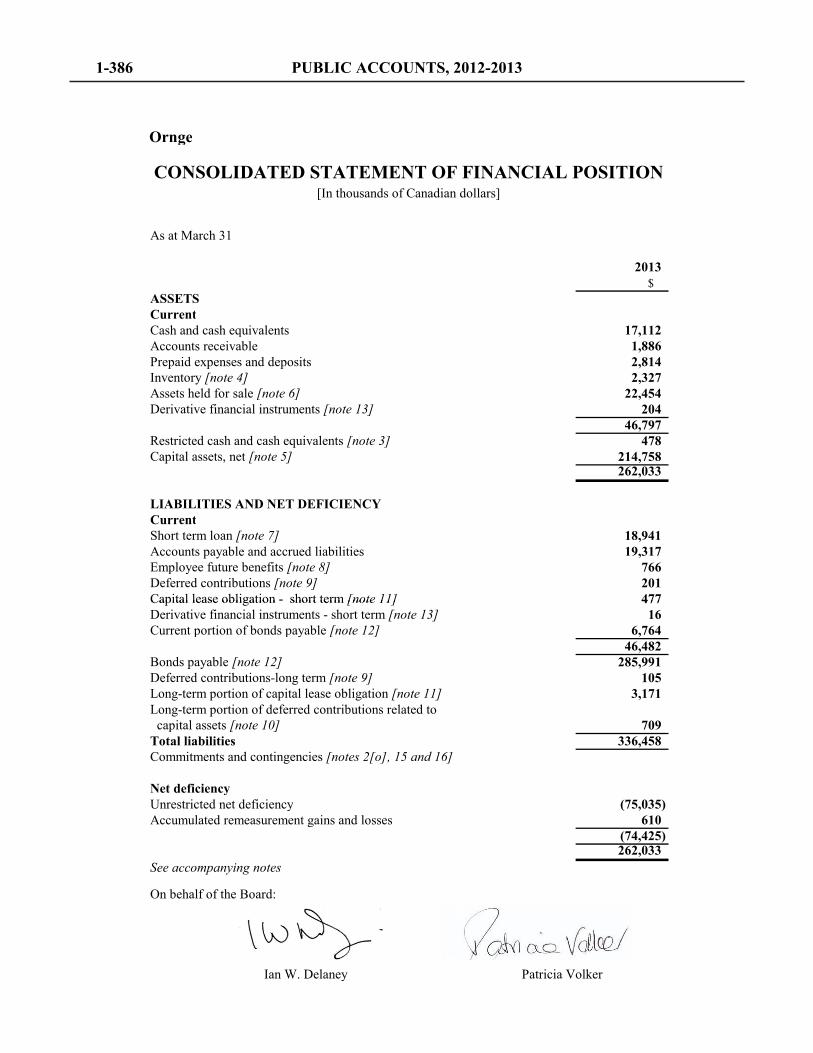
Ornge
As at March 31
2013$
ASSETSCurrentCash and cash equivalents 17,112 Accounts receivable 1,886 Prepaid expenses and deposits 2,814 Inventory [note 4] 2,327 Assets held for sale [note 6] 22,454 Derivative financial instruments [note 13] 204
46,797 Restricted cash and cash equivalents [note 3] 478 Capital assets, net [note 5] 214,758
262,033
LIABILITIES AND NET DEFICIENCYCurrentShort term loan [note 7] 18,941 Accounts payable and accrued liabilities 19,317 Employee future benefits [note 8] 766 Deferred contributions [note 9] 201 Capital lease obligation - short term [note 11] 477
CONSOLIDATED STATEMENT OF FINANCIAL POSITION[In thousands of Canadian dollars]
Capital lease obligation - short term [note 11] 477 Derivative financial instruments - short term [note 13] 16 Current portion of bonds payable [note 12] 6,764
46,482 Bonds payable [note 12] 285,991 Deferred contributions-long term [note 9] 105 Long-term portion of capital lease obligation [note 11] 3,171 Long-term portion of deferred contributions related to capital assets [note 10] 709 Total liabilities 336,458 Commitments and contingencies [notes 2[o], 15 and 16]
Net deficiencyUnrestricted net deficiency (75,035) Accumulated remeasurement gains and losses 610
(74,425) 262,033
See accompanying notes
On behalf of the Board:
Ian W. Delaney Patricia Volker
1-386 PUBLIC ACCOUNTS, 2012-2013
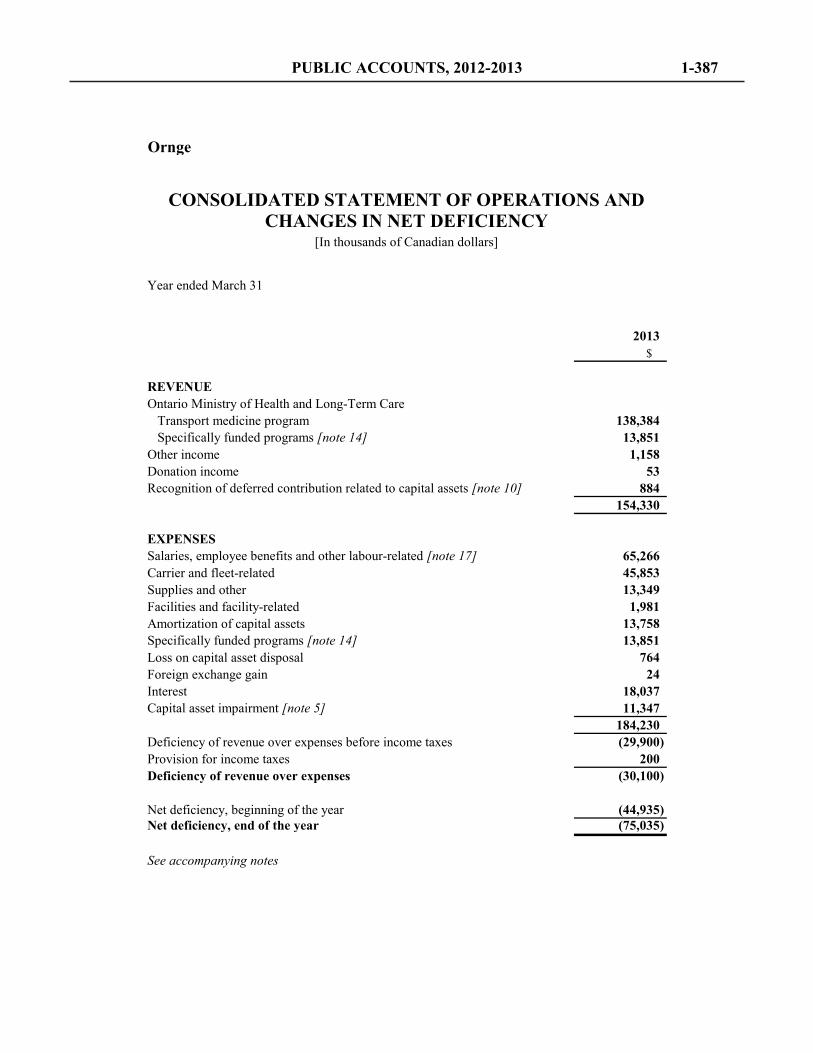
Ornge
Year ended March 31
2013$
REVENUEOntario Ministry of Health and Long-Term Care
Transport medicine program 138,384 Specifically funded programs [note 14] 13,851
Other income 1,158 Donation income 53 Recognition of deferred contribution related to capital assets [note 10] 884
154,330
EXPENSESSalaries, employee benefits and other labour-related [note 17] 65,266 Carrier and fleet-related 45,853 Supplies and other 13,349 Facilities and facility-related 1,981 Amortization of capital assets 13,758 Specifically funded programs [note 14] 13,851 Loss on capital asset disposal 764 Foreign exchange gain 24 Interest 18,037 Capital asset impairment [note 5] 11,347
184,230 Deficiency of revenue over expenses before income taxes (29,900) Provision for income taxes 200 Deficiency of revenue over expenses (30,100)
Net deficiency, beginning of the year (44,935) Net deficiency, end of the year (75,035)
See accompanying notes
CONSOLIDATED STATEMENT OF OPERATIONS ANDCHANGES IN NET DEFICIENCY
[In thousands of Canadian dollars]
PUBLIC ACCOUNTS, 2012-2013 1-387
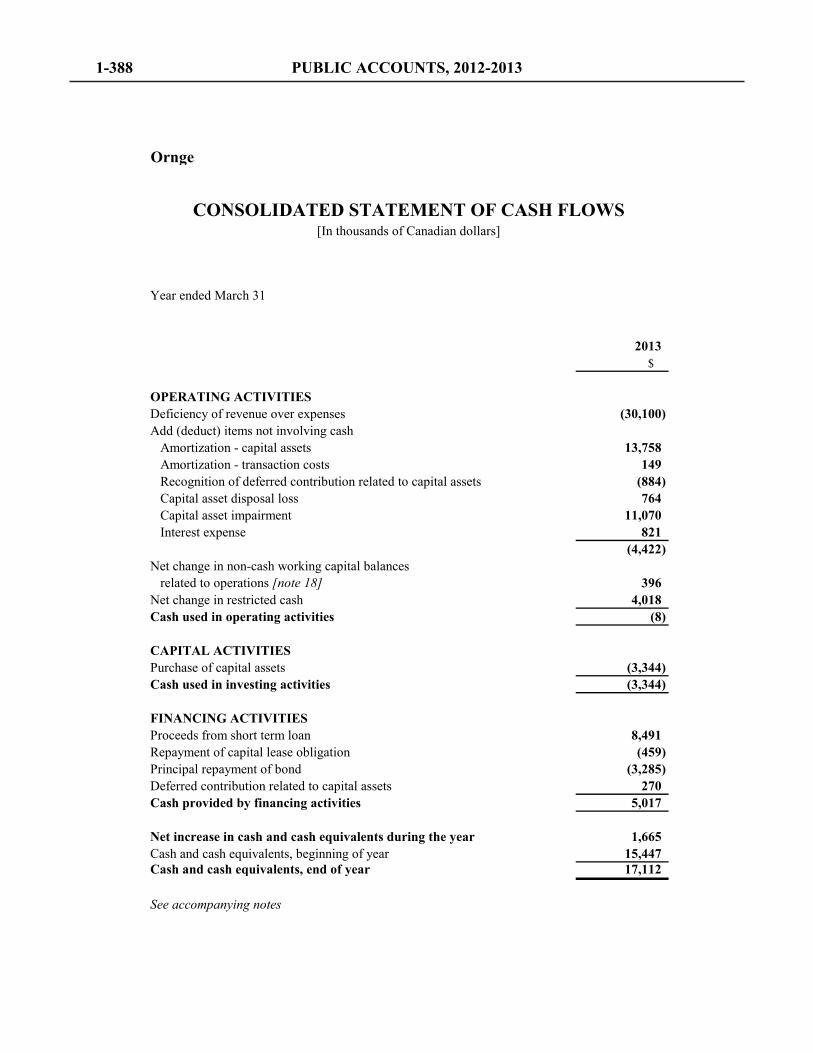
Ornge
Year ended March 31
2013$
OPERATING ACTIVITIESDeficiency of revenue over expenses (30,100) Add (deduct) items not involving cash
Amortization - capital assets 13,758 Amortization - transaction costs 149 Recognition of deferred contribution related to capital assets (884) Capital asset disposal loss 764 Capital asset impairment 11,070 Interest expense 821
(4,422) Net change in non-cash working capital balances
related to operations [note 18] 396 Net change in restricted cash 4,018 Cash used in operating activities (8)
CAPITAL ACTIVITIESPurchase of capital assets (3,344) Cash used in investing activities (3,344)
FINANCING ACTIVITIESProceeds from short term loan 8,491 Repayment of capital lease obligation (459) Principal repayment of bond (3,285) Deferred contribution related to capital assets 270 Cash provided by financing activities 5,017
Net increase in cash and cash equivalents during the year 1,665 Cash and cash equivalents, beginning of year 15,447 Cash and cash equivalents, end of year 17,112
See accompanying notes
CONSOLIDATED STATEMENT OF CASH FLOWS[In thousands of Canadian dollars]
1-388 PUBLIC ACCOUNTS, 2012-2013
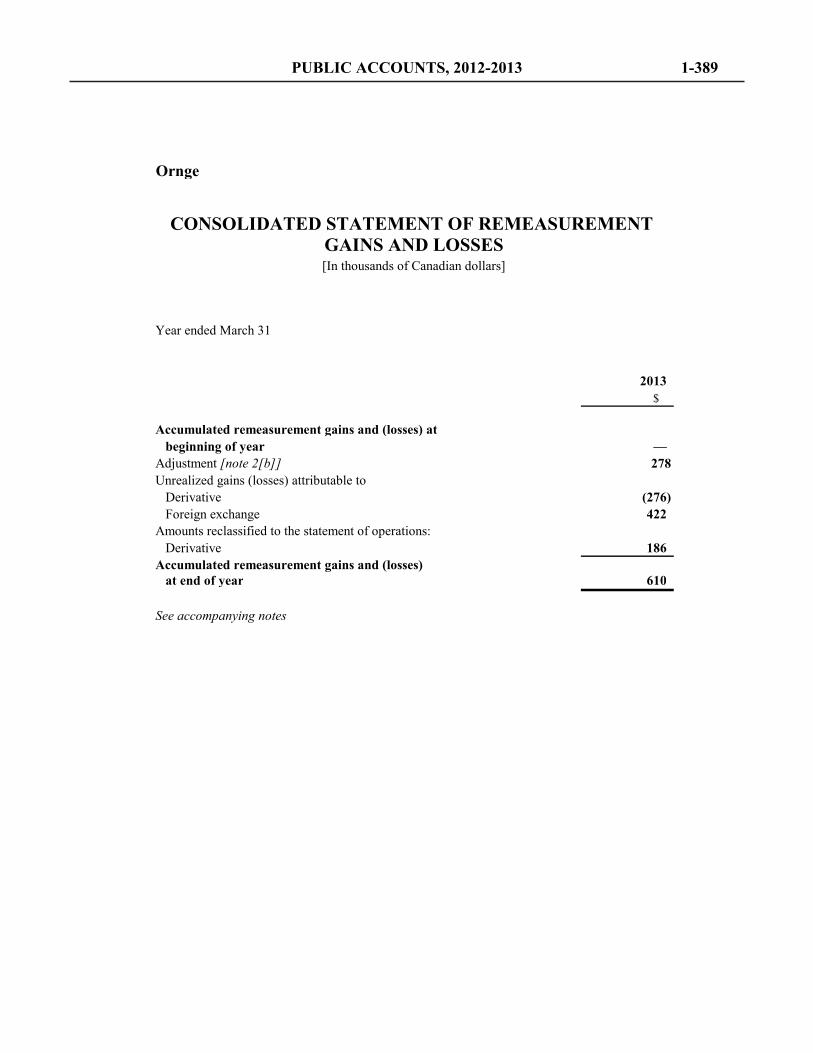
Ornge
Year ended March 31
2013$
Accumulated remeasurement gains and (losses) at beginning of year —
Adjustment [note 2[b]] 278Unrealized gains (losses) attributable to
Derivative (276) Foreign exchange 422
Amounts reclassified to the statement of operations:Derivative 186
Accumulated remeasurement gains and (losses) at end of year 610
See accompanying notes
GAINS AND LOSSES[In thousands of Canadian dollars]
CONSOLIDATED STATEMENT OF REMEASUREMENT
PUBLIC ACCOUNTS, 2012-2013 1-389
1. PURPOSE OF THE ORGANIZATION Ornge together with its consolidated wholly-owned subsidiaries (the “Organization”) operate from a number of bases across the province coordinating all aspects of Ontario's aero medical transport system, the critical care land transport program, and the screening of air and land ambulance transfers between hospitals. The wholly owned subsidiaries of the Organization are Ornge, Ornge Issuer Trust, Ornge Global Air Inc., 7506406 Canada Inc., Ornge Corporate Services Inc., Ornge Foundation, J Smarts, Ornge Global Real Estate Inc. and Ornge Real Estate Inc. Ornge is a registered charity under the Income Tax Act (Canada) (the "Act") and, as such, it is exempt from income taxes pursuant to Section 149 of the Act. On February 12, 2009, Ornge Issuer Trust was created as a special purpose entity under the laws of Ontario pursuant to a declaration of trust. Ornge is the sole beneficiary of the Trust. Pursuant to the Income Tax Act and Income Tax Regulations, the Trust is subject to income taxes. 4495128 Canada Inc. is the bare trustee of Ornge Issuer Trust. Ornge Global Air Inc. is a for profit entity incorporated under the Business Corporation Act of Ontario. The entity provides rotary wing and fixed wing services on behalf of the Organization since 2009. Pursuant to the Income Tax Act and Income Tax Regulations, Ornge Air is subject to income taxes. 7506406 Canada Inc. is a wholly-owned subsidiary of Ornge Air holding the operational certificate for rotary wing services in the province of Ontario. Ornge Corporate Services Inc. is a for profit entity incorporated under the Business Corporation Act of Ontario. The entity provides the infrastructure and back-office administrative functions to the Organization. Pursuant to the Income Tax Act and Income Tax Regulations, Ornge Corporate Services Inc. is subject to income taxes. Ornge Foundation is a registered charity incorporated to receive and maintain funds and to apply all or part of the principal and income for charitable purposes. Ornge is the sole member of the entity. Pursuant to Section 149 of the Act, Ornge Foundation is exempt from income taxes. J Smarts is a not-for-profit entity incorporated to promote safe practices and risk prevention in youth sports and recreation. Ornge is the sole member of the entity. Pursuant to Section 149 of the Act, J Smarts is exempt from income taxes. Ornge Global Real Estate Inc. (“OGRE”) is a for profit entity incorporated under the Business Corporation Act of Ontario. The entity is the registered owner of the head office building of the Organization. Pursuant to the Income Tax Act and Income Tax Regulations, OGRE is subject to income taxes.
Ornge
NOTES TO CONSOLIDATED FINANCIAL STATEMENTS [Expressed in thousands of Canadian dollars, unless otherwise indicated]
March 31, 2013
1-390 PUBLIC ACCOUNTS, 2012-2013
Ornge Real Estate Inc. (“ORE”) is a for profit entity incorporated under the Business Corporation Act of Ontario. The entity leases the head office building from OGRE and subleases to Ornge. Pursuant to the Income Tax Act and Income Tax Regulations, ORE is subject to income taxes. 2. SIGNIFICANT ACCOUNTING POLICIES [a] Comparative consolidated financial statements The Organization did not approve or authorize the issuance of consolidated financial statements as at and for the year ended March 31, 2012 due to the senior management and the Board of Directors responsible for the year then ended no longer being with the Organization. [b] Conversion to Public Sector Accounting Standards plus PS 4200 series Except for the omission of comparative financial statements, these consolidated financial statements are prepared in accordance with the Public Sector Handbook which sets out generally accepted accounting principles for government not-for-profit organizations in Canada. The Organization has chosen to use the standards for not-for-profit organizations that include PS 4200 to PS 4270, with the following exception: the Organization is not presenting comparative financial statements or an opening statement of financial position as at April 1, 2011 [refer to note 2 [a]]. These consolidated financial statements are the first financial statements for which the Organization has applied Canadian Public Sector Accounting Standards plus PS 4200 series. At transition, pursuant to PS 3255, "Post-employment benefits, compensated absences and termination benefits", the Organization has recognized its obligations with regard to non-vesting sick leave obligation. Under previous GAAP, non-vesting sick leave benefits were not recognized in the financial statements. PS 3255 requires the recording of a liability for sick leave benefits that accumulate but do not vest. As a result, the Organization has recognized a liability and charge to accumulated deficit as at March 31, 2012 of $700. Except for the above PSA transition adjustment, there is no other impact to the accumulated deficit as at April 1, 2012 arising from the PSA transition. The Public Sector Accounting Board ["PSAB"] approved the following new public sector accounting standards which were adopted by the Organization effective April 1, 2012: PS 1201 – Financial statement presentation [replacing PS 1200, Financial statement presentation] PS 2601 – Foreign currency translation [replacing PS 2600, Foreign currency translation] PS 3041 – Portfolio investments [replacing PS 3040 Portfolio investments]
Ornge
NOTES TO CONSOLIDATED FINANCIAL STATEMENTS [Expressed in thousands of Canadian dollars, unless otherwise indicated]
March 31, 2013
PUBLIC ACCOUNTS, 2012-2013 1-391
PS 3450 – Financial instruments Adoption of all of these standards was required to take place in the same fiscal period. In accordance with the requirements of these standards, prospective application of the recognition, derecognition and measurement policies are presented beginning April 1, 2012. Prior to April 1, 2012, financial instruments were recorded at fair value with changes in unrealized gains and losses recorded in the consolidated statement of operations and changes in net deficiency. There was no adjustment required to be booked as of April 1, 2012 to adopt these public sector accounting standards. [c] Basis of consolidation All controlled not-for-profit and for profit entities are consolidated into the Organization. The consolidated financial statements include the assets, liabilities and activities of the wholly owned subsidiaries (Note 1). Transactions and balances between the entities have been eliminated in arriving at the consolidated financial statements. [d] Cash and cash equivalents Cash and cash equivalents include cash on deposit and investments in highly liquid securities that are readily convertible to known amounts of cash with an original term to maturity of less than 90 days. [e] Financial instruments other than derivatives Financial instruments are classified in one of the following categories [i] fair value or [ii] amortized cost. The entity determines the classification of its financial instruments at initial recognition. Financial instruments other than derivatives: Asset/liability Measurement category Cash and cash equivalents Fair value Restricted cash and cash equivalents Fair value Accounts receivable Amortized cost Accounts payable and accrued liabilities Amortized cost Short-term loan Amortized cost Capital lease obligation Amortized cost Bonds payable Amortized cost
Ornge
NOTES TO CONSOLIDATED FINANCIAL STATEMENTS [Expressed in thousands of Canadian dollars, unless otherwise indicated]
March 31, 2013
1-392 PUBLIC ACCOUNTS, 2012-2013

Financial instruments that are measured at amortized cost are accounted for using the effective interest method. These amounts are initially recorded at their fair value and subsequently measured at amortized cost. Transaction costs related to financial instruments carried at fair value are expensed as incurred. Transaction costs related to items in the amortized cost category are added to the carrying value of the asset or netted against the carrying value of the liability and are then recognized over the expected life of the instrument using the effective interest method. [f] Capital assets Capital assets are recorded at cost less accumulated amortization. Amortization is recorded on a straight-line basis, taking into consideration estimated residual value, using the following useful lives: Equipment and vehicles 3 - 5 years Computer equipment and software 3 years Leasehold improvements Term of lease Buildings 10 - 40 years Aircraft airframes 10 - 30 years Aircraft engines 10 - 20 years Avionics 5 - 10 years Rotables 10 - 30 years Assets under construction are composed of progress payments for assets being built on behalf of the Organization. Amortization is not recorded until construction is substantially complete and the assets are ready for their intended use. When an asset is retired or abandoned, the book value and accumulated amortization of the asset are removed from the asset accounts. Any losses incurred on retirement or abandonment are recorded as an expense in the year of retirement or abandonment. When a capital asset no longer has any long-term service potential to the Organization, the excess of its net carrying amount over any residual value is recognized as an expense in the consolidated statement of operations and changes in net deficiency. Assets are classified as held for sale when all the criteria in PS 1201.055 are met. The Organization measures the assets held for sale at the lower of their carrying amount and fair value less costs to sell. The gains or losses are recorded in the consolidated statement of operations and changes in net deficiency.
Ornge
NOTES TO CONSOLIDATED FINANCIAL STATEMENTS [Expressed in thousands of Canadian dollars, unless otherwise indicated]
March 31, 2013
PUBLIC ACCOUNTS, 2012-2013 1-393
[g] Interest capitalized Interest on funds used to finance the acquisition of capital assets is capitalized for periods preceding the dates that the assets are available for service. Interest attributed to progress payments and related exchange movements on foreign currency amounts, made on account of aircraft and other significant assets under construction, are capitalized and added to the cost of the related asset. [h] Maintenance and repairs The Organization has entered into a Power by Hour ["PBH"] contract for the maintenance of fixed wing engines. Maintenance costs are expensed based on the contractual hourly rate, multiplied by actual flight hours. For maintenance not covered by the PBH contract, line maintenance, routine repairs and major maintenance are expensed as incurred. [i] Derivative financial instruments The Organization enters into fuel hedging contracts to manage its commodity price exposures for planning and risk management purposes. It is not the Organization's policy to utilize derivative financial instruments for trading or speculative purposes. These derivatives are recognized on the consolidated statement of financial position at their fair value with changes in the fair value recognized as derivative loss (gain) in the consolidated statement of remeasurement gains and losses. Fair value estimates are made at a specific point in time, based on relevant market information about the financial instruments. In the reporting period that these derivatives are derecognized, the accumulated remeasurement gain or loss associated with the derivatives are reversed and reclassified to the consolidated statement of operations and changes in net deficiency. [j] Revenue recognition The Organization follows the deferral method of accounting for contributions. The majority of the Organization's revenues are received from the Government of Ontario under the terms of its service contract with the Organization.
Ornge
NOTES TO CONSOLIDATED FINANCIAL STATEMENTS [Expressed in thousands of Canadian dollars, unless otherwise indicated]
March 31, 2013
1-394 PUBLIC ACCOUNTS, 2012-2013
Unrestricted contributions are recognized as revenue when received or receivable provided the amount to be received can be reasonably estimated and collection is reasonably assured. Externally restricted contributions are deferred and recognized as revenue in the year in which the related expenses are incurred. Other income includes billings for uninsured services, which are recognized as revenue when services are provided to non-insured patients and patients covered by WSIB, when amounts can be reasonably estimated and collection is reasonably assured. Donation income includes unrestricted donations, which are recognized as revenue when received, and restricted donations, which are recognized as revenue in the year in which the related expenses are incurred. [k] Foreign currency translation The monetary assets and liabilities of the Organization denominated in foreign currencies are translated into Canadian Dollars at the rates of exchange at the consolidated statement of financial position date. Revenue and expenses are translated at the monthly average exchange rate. Exchange gains or losses that arise prior to the settlement are recognized in the consolidated statement of remeasurement gains and losses. In the period of settlement, the cumulative amount of remeasurement gains and losses are reversed in the consolidated statement of remeasurement gains and losses and the exchange gains or losses measured in relation to the exchange rate at the date of the item's initial recognition are recognized in the consolidated statement of operations and changes in net deficiency. [l] Employee benefit plans Certain full-time employees of the Organization are members of the Hospitals of Ontario Pension Plan ["HOOPP" or the "Plan"], which is a multi-employer defined benefit pension plan. Defined contribution accounting is applied to the Plan, following the standards for multi-employer plans. Pension costs are expensed based on the funding requirements under the Plan [note 16]. For defined contribution pension plans, required contributions by the Organization are recorded as an expense. [m] Employee future benefits The Organization provides vested sick-leave programs to Rotary Wing employee group and Paramedics OPSEU and Operations Control Centre ["OCC"] CAW employee groups. The
Ornge
NOTES TO CONSOLIDATED FINANCIAL STATEMENTS [Expressed in thousands of Canadian dollars, unless otherwise indicated]
March 31, 2013
PUBLIC ACCOUNTS, 2012-2013 1-395
Organization recognizes a liability and an expense for these sick-leave programs that vest or accumulate in the period in which employees render services to the Organization in return for the benefits. The service period is the period from the date the employee is first eligible for benefits [generally the date of hire] to the expected date of the payment of the benefits. In addition, there are sick-leave programs for Fixed Wing Pilots and Non-union employees, however, these programs do not vest or accumulate, or cannot be carried forward beyond 12 months after they are earned. As such, the Organization recognizes an expense when the event [the sick leave] that obligates the Organization occurs. [n] Allocation of expenses The Organization engages in the Critical Care Land Ambulance ["CCLA"] program. The costs of the CCLA program include personnel, premises and other expenses that are directly related to providing this program. The Organization also incurs a number of general support expenses that are common to the administration of the Organization and of the CCLA program. The Organization allocates certain of its general support expenses by identifying the appropriate basis of allocation for each component expense and applies that basis consistently each year. [o] Use of estimates The preparation of financial statements requires management to make estimates and assumptions that affect the reported amounts of assets and liabilities and disclosure of contingent assets and liabilities at the date of the consolidated financial statements and the reported amounts of revenue and expenses during the year. Significant estimates are required to determine the useful life of the capital assets, the selection of an appropriate method of amortization of the capital assets, assessment of impairment of assets, valuation of derivatives and actuarial assumptions for the non-vesting sick-leave benefit plan. Actual results could differ from those estimates. The amount of revenue recognized from the MOHLTC requires a number of estimates. Ornge has entered into accountability agreements with MOHLTC that set out the rights and obligations of the two parties in respect of funding provided to Ornge by MOHLTC for fiscal year 2013. These accountability agreements set out certain performance standards and obligations that establish acceptable results for Ornge’s performance in a number of areas. If Ornge does not meet its performance standards or obligations, the MOHLTC have the right to adjust funding received by Ornge. The MOHLTC are not required to communicate certain funding adjustments until after the submission of year-end data. Since this data is not submitted until after
Ornge
NOTES TO CONSOLIDATED FINANCIAL STATEMENTS [Expressed in thousands of Canadian dollars, unless otherwise indicated]
March 31, 2013
1-396 PUBLIC ACCOUNTS, 2012-2013
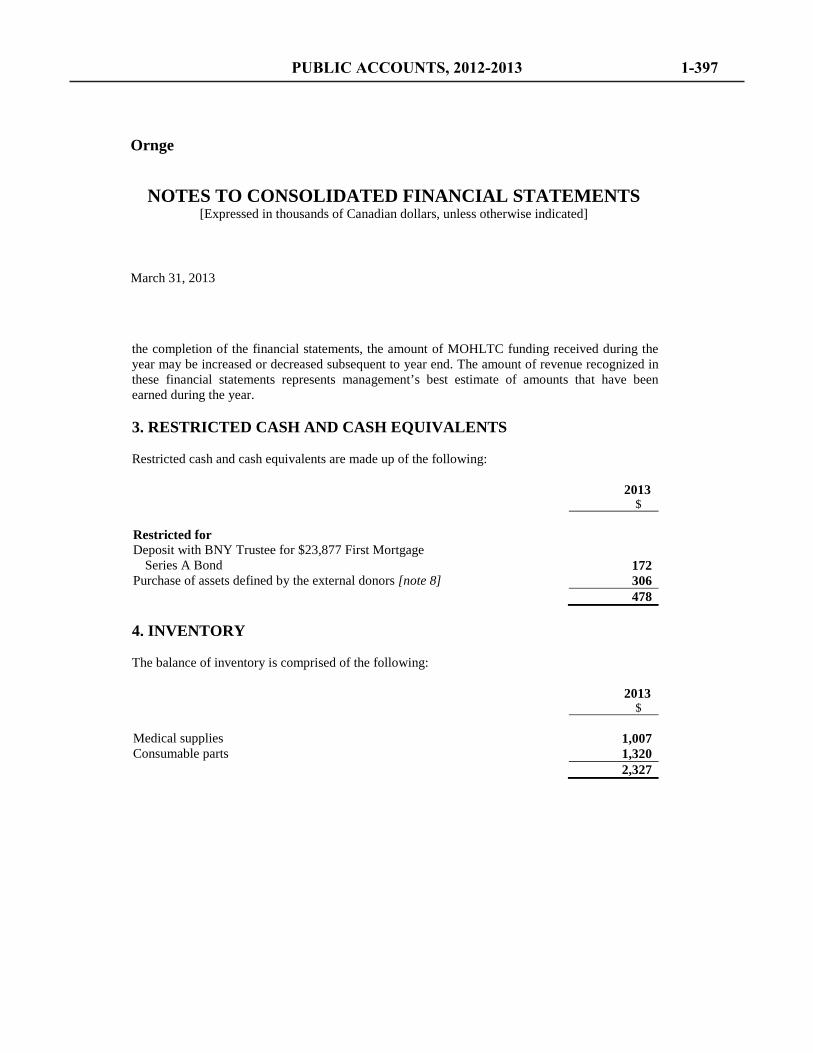
the completion of the financial statements, the amount of MOHLTC funding received during the year may be increased or decreased subsequent to year end. The amount of revenue recognized in these financial statements represents management’s best estimate of amounts that have been earned during the year. 3. RESTRICTED CASH AND CASH EQUIVALENTS Restricted cash and cash equivalents are made up of the following: 2013 $ Restricted for Deposit with BNY Trustee for $23,877 First Mortgage
Series A Bond 172 Purchase of assets defined by the external donors [note 8] 306 478 4. INVENTORY The balance of inventory is comprised of the following: 2013 $ Medical supplies 1,007 Consumable parts 1,320
2,327
Ornge
NOTES TO CONSOLIDATED FINANCIAL STATEMENTS [Expressed in thousands of Canadian dollars, unless otherwise indicated]
March 31, 2013
PUBLIC ACCOUNTS, 2012-2013 1-397
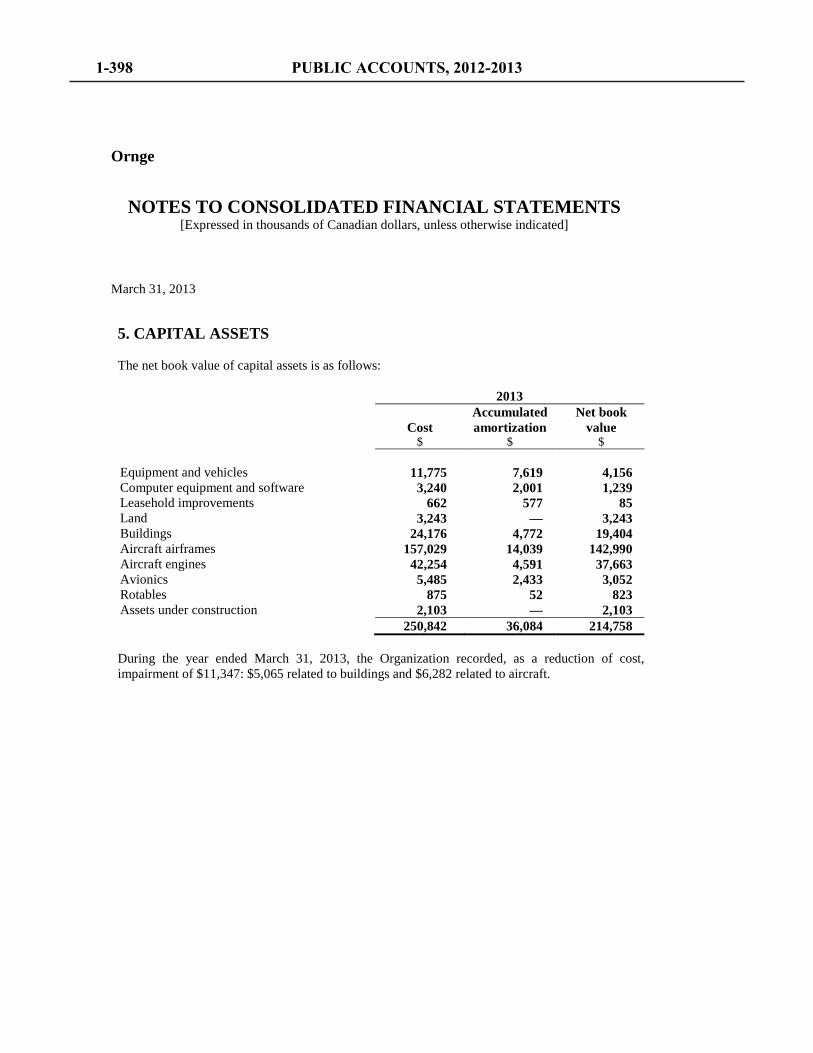
5. CAPITAL ASSETS The net book value of capital assets is as follows: 2013
Cost Accumulated amortization
Net book value
$ $ $ Equipment and vehicles 11,775 7,619 4,156 Computer equipment and software 3,240 2,001 1,239 Leasehold improvements 662 577 85 Land 3,243 — 3,243 Buildings 24,176 4,772 19,404 Aircraft airframes 157,029 14,039 142,990 Aircraft engines 42,254 4,591 37,663 Avionics 5,485 2,433 3,052 Rotables 875 52 823 Assets under construction 2,103 — 2,103 250,842 36,084 214,758 During the year ended March 31, 2013, the Organization recorded, as a reduction of cost, impairment of $11,347: $5,065 related to buildings and $6,282 related to aircraft.
Ornge
NOTES TO CONSOLIDATED FINANCIAL STATEMENTS [Expressed in thousands of Canadian dollars, unless otherwise indicated]
March 31, 2013
1-398 PUBLIC ACCOUNTS, 2012-2013
6. ASSETS HELD FOR SALE 2013 $ Building 638 Aircraft airframes, aircraft engines, avionics 21,816 22,454 Included in the aircraft airframes, aircraft engines and avionics are two Agusta Westland ["AW"] 139 and three Sikorsky ["SK"] 76 aircraft. In May 2013, the sale of two AW139 helicopters, classified as assets held for sale as at March 31, 2013, was finalized. Gross proceeds from the sale were $20,338 for the two aircraft. There is no loss on disposal as a result of the sale due to capital asset impairment recorded during the year ended March 31, 2013 [note 5]. In June 2013, the sale of Oshawa hangar, classified as assets held for sale as at March 31, 2013, was finalized. Net proceeds from the sale were $638. 7. SHORT-TERM LOAN On December 15, 2010, the Organization entered into a $60,000 short-term, unsecured credit facility for a general corporate purpose. The facility allows borrowing under a revolving and a swing line facility. Revolving facility permits borrowing up to $50,000 and swing line facility permits borrowing up to $10,000. Borrowings under revolving facilities are allowed through bankers acceptances, bankers equivalent notes and letters of credit. Swing line facility permits bank overdraft. As at March 31, 2013, borrowing under the revolving facility was $17,950 at an average rate of 1.76% and borrowing under the swing line facility was $991 at the prime rate of 3%. As at March 31, 2013, $2 in accrued interest was included in accounts payable and accrued liabilities. Subsequent to March 31, 2013, the Organization repaid the credit facility from proceeds of sale of the AW139 aircraft [note 5], as prescribed by the credit facility. As a result, the facility was reduced to $39,800: $29,800 for revolving facility and $10,000 for swing line facility.
Ornge
NOTES TO CONSOLIDATED FINANCIAL STATEMENTS [Expressed in thousands of Canadian dollars, unless otherwise indicated]
March 31, 2013
PUBLIC ACCOUNTS, 2012-2013 1-399
The Organization is subject to certain covenants associated with the credit facility. One of the covenants that the Organization must comply with is the provision of audited consolidated financial statements of the Organization and related Compliance Certificate to the lender, TD Bank (the “Bank”). The Bank has agreed in writing to waive compliance with the obligation to provide audited consolidated financial statements for year ended March 31, 2013. 8. EMPLOYEE FUTURE BENEFITS The Organization allocates to certain employee groups a specified number of days each year for use as paid absences in the event of illness or injury. Employees are permitted to accumulate their unused allocation each year up to the allowable maximum provided in their employment agreements. Accumulated days may be used in future years to the extent that employees' illness or injury exceeds the current year's allocation of sick days. Sick days are paid out at the salary in effect at the time of usage. All computations and disclosures are determined using a measurement date for accounting purposes of March 31, 2013. The most recent actuarial valuation of the non-vesting sick-leave benefit plan for accounting purposes was as of March 31, 2013. [a] Employee future benefit liabilities 2013 $ Accrued employee future benefit obligations, end of year 773 Unamortized actuarial loss, end of year (7) Employee future benefits liability, end of year 766 [b] Employee future benefit expenses 2013 $ Current year benefit cost 475 Interest on accrued benefit obligation 13 Employee future benefit expenses 488
Ornge
NOTES TO CONSOLIDATED FINANCIAL STATEMENTS [Expressed in thousands of Canadian dollars, unless otherwise indicated]
March 31, 2013
1-400 PUBLIC ACCOUNTS, 2012-2013
For the year ended March 31, 2013, $422 in benefits were paid. The significant actuarial assumptions adopted in measuring the Organization's expense for the non-vesting sick leave are as follows: 2013 % Discount rate 3.25 Salary escalation 3.50 9. DEFERRED CONTRIBUTIONS Deferred contributions consist of externally restricted funds received for various purposes. Deferred contributions will be recognized as revenue in the consolidated statement of operations and changes in net deficiency when the applicable expenditures are incurred. Deferred contributions also include amounts received that are restricted for the purchase of capital, for which the related asset has not been purchased [March 31, 2013 - $306 [note 3]]. These amounts are recorded as deferred contributions related to capital assets when spent. 2013 $ Balance, beginning of year 665 Add contributions re CCLA [note 14] 13,801 Less amount recognized as revenue 14,160 Balance, end of year 306
Ornge
NOTES TO CONSOLIDATED FINANCIAL STATEMENTS [Expressed in thousands of Canadian dollars, unless otherwise indicated]
March 31, 2013
PUBLIC ACCOUNTS, 2012-2013 1-401
10. DEFERRED CONTRIBUTIONS RELATED TO CAPITAL ASSETS Deferred contributions related to capital assets represent the unamortized amount of contributions received for the purchase of capital assets. Contributions are amortized over the life of the related asset. The changes in the deferred contribution of capital assets balance for the year ended March 31, 2013 are as follows: 2013 $ Deferred contributions related to capital assets, beginning of
year 1,323 Add contribution received for purchase of capital assets 270 Less amortization of deferred contributions related to capital
assets 884 709 11. CAPITAL LEASE OBLIGATION On October 14, 2010, the Organization entered into an agreement to lease a building and certain associated lands. The lease payments related to the building are treated as a capital lease. The following is a schedule of future minimum lease payments under the capital lease expiring November 30, 2015, together with the purchase option price under the capital lease: $ 2014 677 2015 687 2016 2,763 Total minimum lease payments 4,127 Amounts representing interest at 5.82% (479) 3,648 Less current portion 477 3,171 Under the lease, the Organization has the option to purchase the leased property from January 1, 2015 to October 1, 2015, for $2,300 plus HST and other applicable taxes with a closing date of November 30, 2015.
Ornge
NOTES TO CONSOLIDATED FINANCIAL STATEMENTS [Expressed in thousands of Canadian dollars, unless otherwise indicated]
March 31, 2013
1-402 PUBLIC ACCOUNTS, 2012-2013
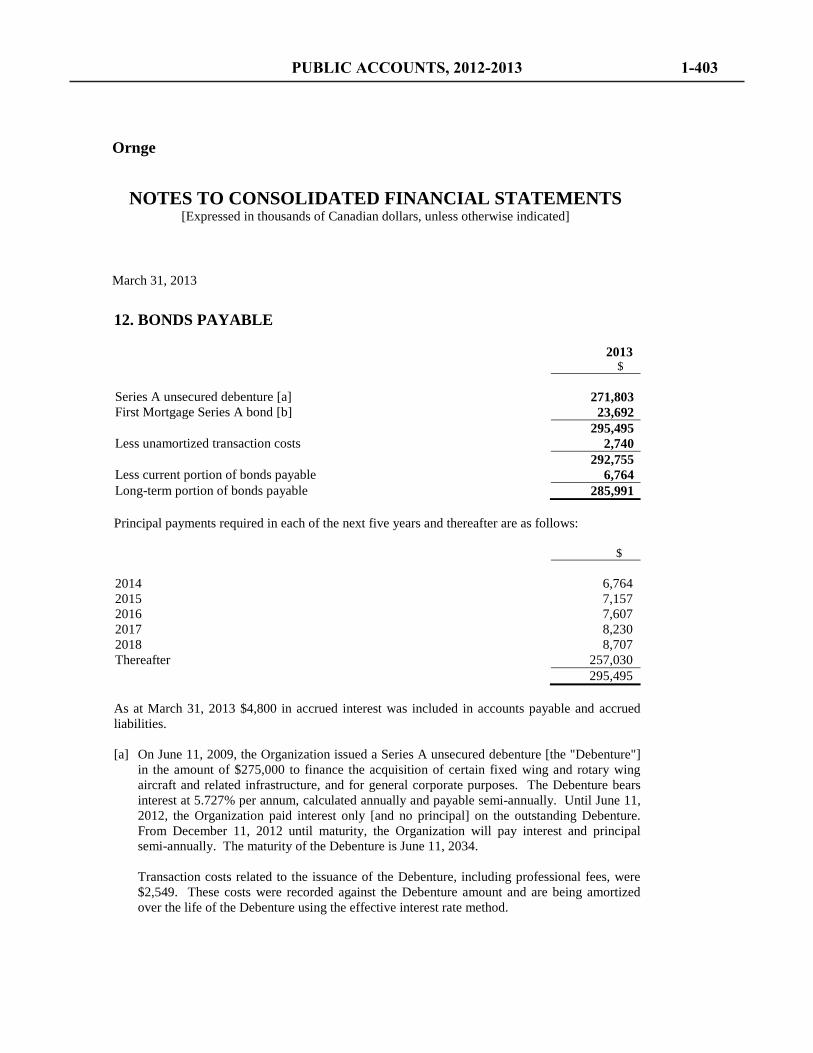
12. BONDS PAYABLE 2013 $ Series A unsecured debenture [a] 271,803 First Mortgage Series A bond [b] 23,692 295,495 Less unamortized transaction costs 2,740 292,755 Less current portion of bonds payable 6,764 Long-term portion of bonds payable 285,991 Principal payments required in each of the next five years and thereafter are as follows: $ 2014 6,764 2015 7,157 2016 7,607 2017 8,230 2018 8,707 Thereafter 257,030 295,495 As at March 31, 2013 $4,800 in accrued interest was included in accounts payable and accrued liabilities. [a] On June 11, 2009, the Organization issued a Series A unsecured debenture [the "Debenture"]
in the amount of $275,000 to finance the acquisition of certain fixed wing and rotary wing aircraft and related infrastructure, and for general corporate purposes. The Debenture bears interest at 5.727% per annum, calculated annually and payable semi-annually. Until June 11, 2012, the Organization paid interest only [and no principal] on the outstanding Debenture. From December 11, 2012 until maturity, the Organization will pay interest and principal semi-annually. The maturity of the Debenture is June 11, 2034. Transaction costs related to the issuance of the Debenture, including professional fees, were $2,549. These costs were recorded against the Debenture amount and are being amortized over the life of the Debenture using the effective interest rate method.
Ornge
NOTES TO CONSOLIDATED FINANCIAL STATEMENTS [Expressed in thousands of Canadian dollars, unless otherwise indicated]
March 31, 2013
PUBLIC ACCOUNTS, 2012-2013 1-403
The fair market value of the Debenture as at March 31, 2013 is $310,794. The yield on a similar private placement would be 4.2244%. Given that there is no active secondary market for this issue, the price quoted represents the theoretical value of the Debenture. The Organization is subject to certain covenants associated with the Debenture. During the year, the Organization was in compliance with these covenants.
[b] On January 31, 2011, the Organization issued a First Mortgage Series A bond [the "Bond"] in the amount of $23,877 for the purpose of financing head office building. The Bond bears interest at 5.598% per annum, calculated semi-annually, and shall be repaid in blended payments of principal and interest monthly. The maturity date of the Bond is January 31, 2036. A mortgage and security interest in and to the Organization's corporate building, the related land and fixtures with a carrying value of $17,257, and all benefits to be derived from these assets, including the lease of these assets, has been provided as collateral for the bond.
Transaction costs related to the issuance of the Bond, including professional fees, were $684. These costs were recorded against the Bond amount and are being amortized over the life of the Bond using the effective interest rate method.
The Organization may redeem a portion of or the entire Bond at any time prior to its maturity at a price based on the principal amount then outstanding plus a "make-whole" premium, and accrued and unpaid interest.
The fair market value of the Bond as at March 31, 2013 is $27,192. The yield on a similar private placement would be 4.2244%. Given that there is no active secondary market for this issue, the price quoted represents the theoretical value of the Bond. The Organization is subject to certain covenants associated with the Bond. One of the covenants that the Organization must comply with is the provision of audited consolidated financial statements of the Organization and separate financial statements of OGRE to BNY Trust Company of Canada ["Trustee"] and the Lead Bondholder, the Canada Life Assurance Company ["Canada Life"]. Canada Life has agreed in writing to waive compliance with the obligation to submit audited consolidated financial statements of OGRE for fiscal year 2012 and going forward and of the Organization for the fiscal year 2012 only.
Ornge
NOTES TO CONSOLIDATED FINANCIAL STATEMENTS [Expressed in thousands of Canadian dollars, unless otherwise indicated]
March 31, 2013
1-404 PUBLIC ACCOUNTS, 2012-2013
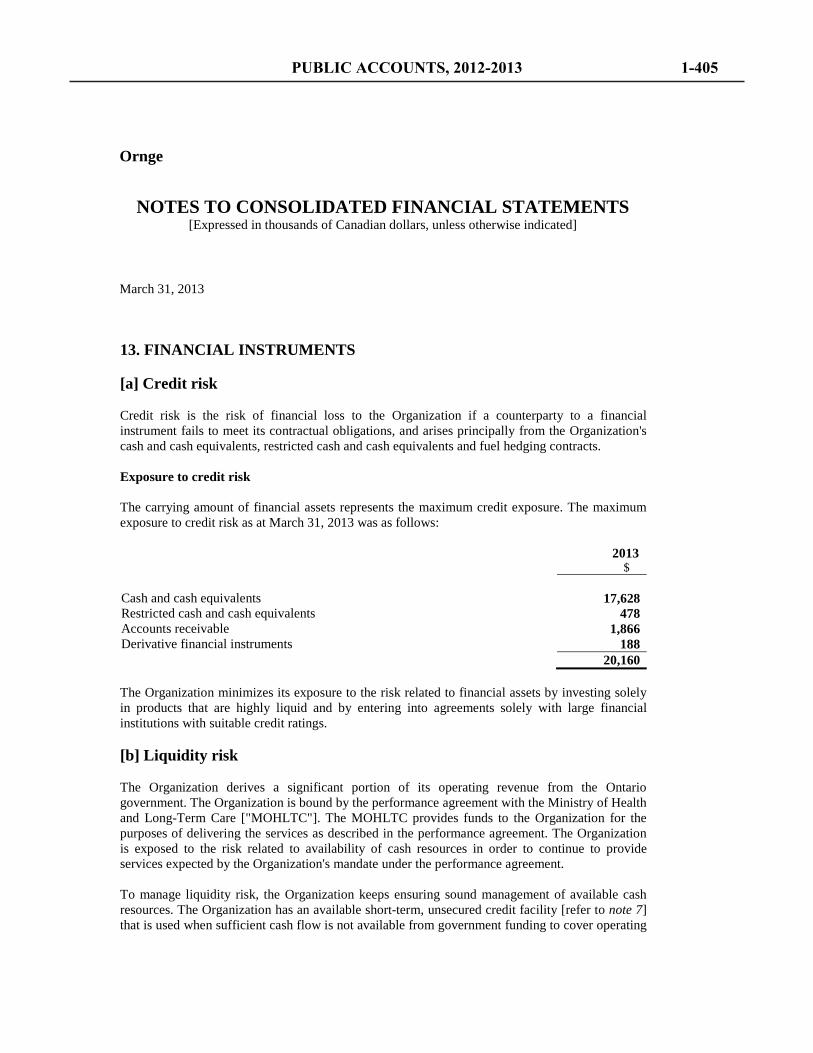
13. FINANCIAL INSTRUMENTS [a] Credit risk Credit risk is the risk of financial loss to the Organization if a counterparty to a financial instrument fails to meet its contractual obligations, and arises principally from the Organization's cash and cash equivalents, restricted cash and cash equivalents and fuel hedging contracts. Exposure to credit risk The carrying amount of financial assets represents the maximum credit exposure. The maximum exposure to credit risk as at March 31, 2013 was as follows: 2013 $ Cash and cash equivalents 17,628 Restricted cash and cash equivalents 478 Accounts receivable 1,866 Derivative financial instruments 188 20,160 The Organization minimizes its exposure to the risk related to financial assets by investing solely in products that are highly liquid and by entering into agreements solely with large financial institutions with suitable credit ratings. [b] Liquidity risk The Organization derives a significant portion of its operating revenue from the Ontario government. The Organization is bound by the performance agreement with the Ministry of Health and Long-Term Care ["MOHLTC"]. The MOHLTC provides funds to the Organization for the purposes of delivering the services as described in the performance agreement. The Organization is exposed to the risk related to availability of cash resources in order to continue to provide services expected by the Organization's mandate under the performance agreement. To manage liquidity risk, the Organization keeps ensuring sound management of available cash resources. The Organization has an available short-term, unsecured credit facility [refer to note 7] that is used when sufficient cash flow is not available from government funding to cover operating
Ornge
NOTES TO CONSOLIDATED FINANCIAL STATEMENTS [Expressed in thousands of Canadian dollars, unless otherwise indicated]
March 31, 2013
PUBLIC ACCOUNTS, 2012-2013 1-405
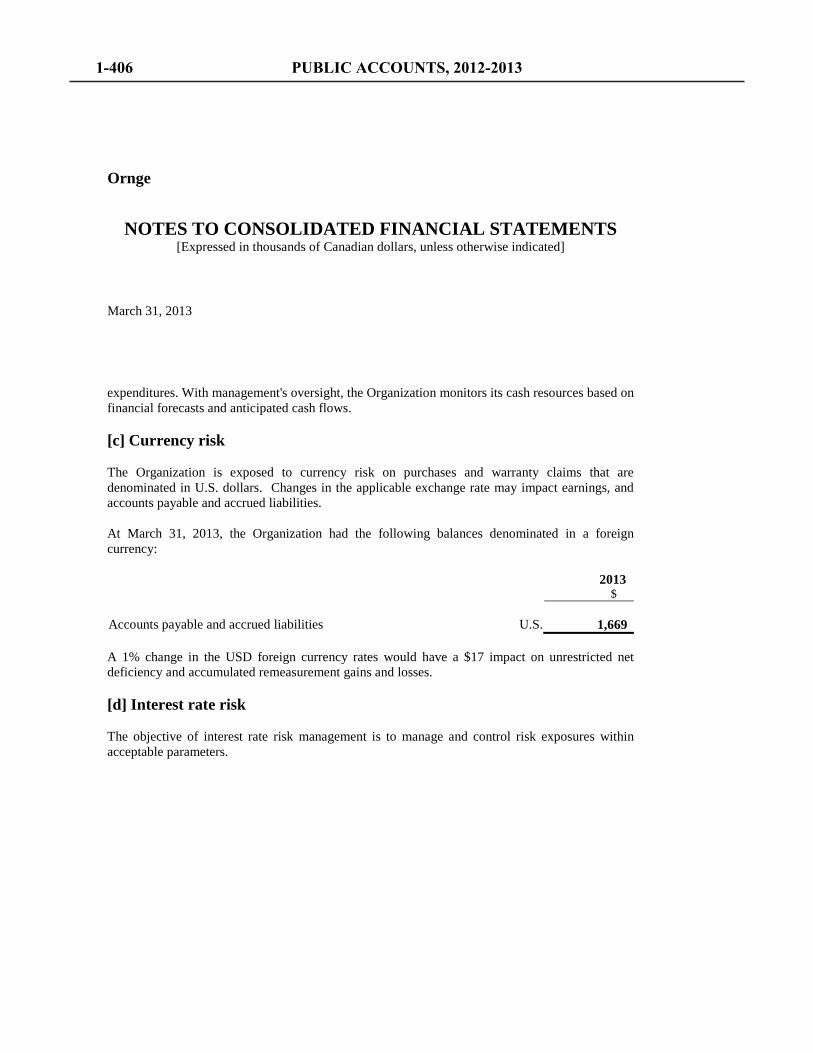
expenditures. With management's oversight, the Organization monitors its cash resources based on financial forecasts and anticipated cash flows. [c] Currency risk The Organization is exposed to currency risk on purchases and warranty claims that are denominated in U.S. dollars. Changes in the applicable exchange rate may impact earnings, and accounts payable and accrued liabilities. At March 31, 2013, the Organization had the following balances denominated in a foreign currency: 2013 $ Accounts payable and accrued liabilities U.S. 1,669 A 1% change in the USD foreign currency rates would have a $17 impact on unrestricted net deficiency and accumulated remeasurement gains and losses. [d] Interest rate risk The objective of interest rate risk management is to manage and control risk exposures within acceptable parameters.
Ornge
NOTES TO CONSOLIDATED FINANCIAL STATEMENTS [Expressed in thousands of Canadian dollars, unless otherwise indicated]
March 31, 2013
1-406 PUBLIC ACCOUNTS, 2012-2013
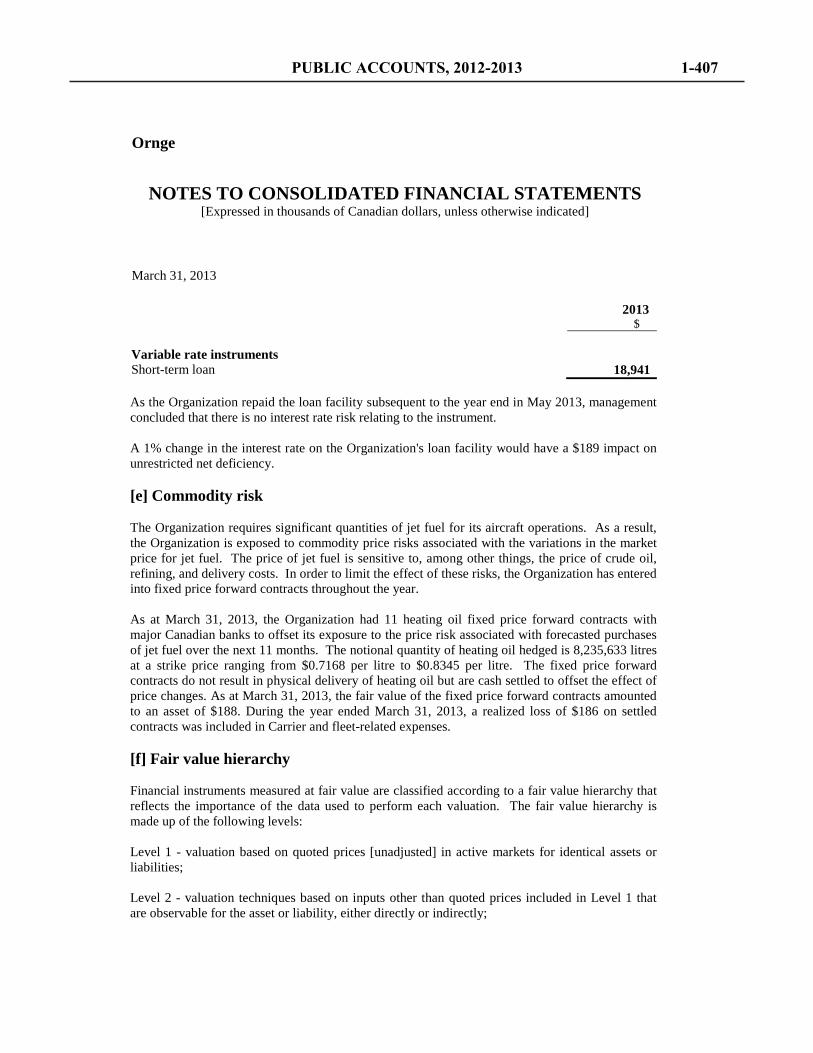
2013 $ Variable rate instruments Short-term loan 18,941 As the Organization repaid the loan facility subsequent to the year end in May 2013, management concluded that there is no interest rate risk relating to the instrument. A 1% change in the interest rate on the Organization's loan facility would have a $189 impact on unrestricted net deficiency. [e] Commodity risk The Organization requires significant quantities of jet fuel for its aircraft operations. As a result, the Organization is exposed to commodity price risks associated with the variations in the market price for jet fuel. The price of jet fuel is sensitive to, among other things, the price of crude oil, refining, and delivery costs. In order to limit the effect of these risks, the Organization has entered into fixed price forward contracts throughout the year. As at March 31, 2013, the Organization had 11 heating oil fixed price forward contracts with major Canadian banks to offset its exposure to the price risk associated with forecasted purchases of jet fuel over the next 11 months. The notional quantity of heating oil hedged is 8,235,633 litres at a strike price ranging from $0.7168 per litre to $0.8345 per litre. The fixed price forward contracts do not result in physical delivery of heating oil but are cash settled to offset the effect of price changes. As at March 31, 2013, the fair value of the fixed price forward contracts amounted to an asset of $188. During the year ended March 31, 2013, a realized loss of $186 on settled contracts was included in Carrier and fleet-related expenses. [f] Fair value hierarchy Financial instruments measured at fair value are classified according to a fair value hierarchy that reflects the importance of the data used to perform each valuation. The fair value hierarchy is made up of the following levels: Level 1 - valuation based on quoted prices [unadjusted] in active markets for identical assets or liabilities; Level 2 - valuation techniques based on inputs other than quoted prices included in Level 1 that are observable for the asset or liability, either directly or indirectly;
Ornge
NOTES TO CONSOLIDATED FINANCIAL STATEMENTS [Expressed in thousands of Canadian dollars, unless otherwise indicated]
March 31, 2013
PUBLIC ACCOUNTS, 2012-2013 1-407
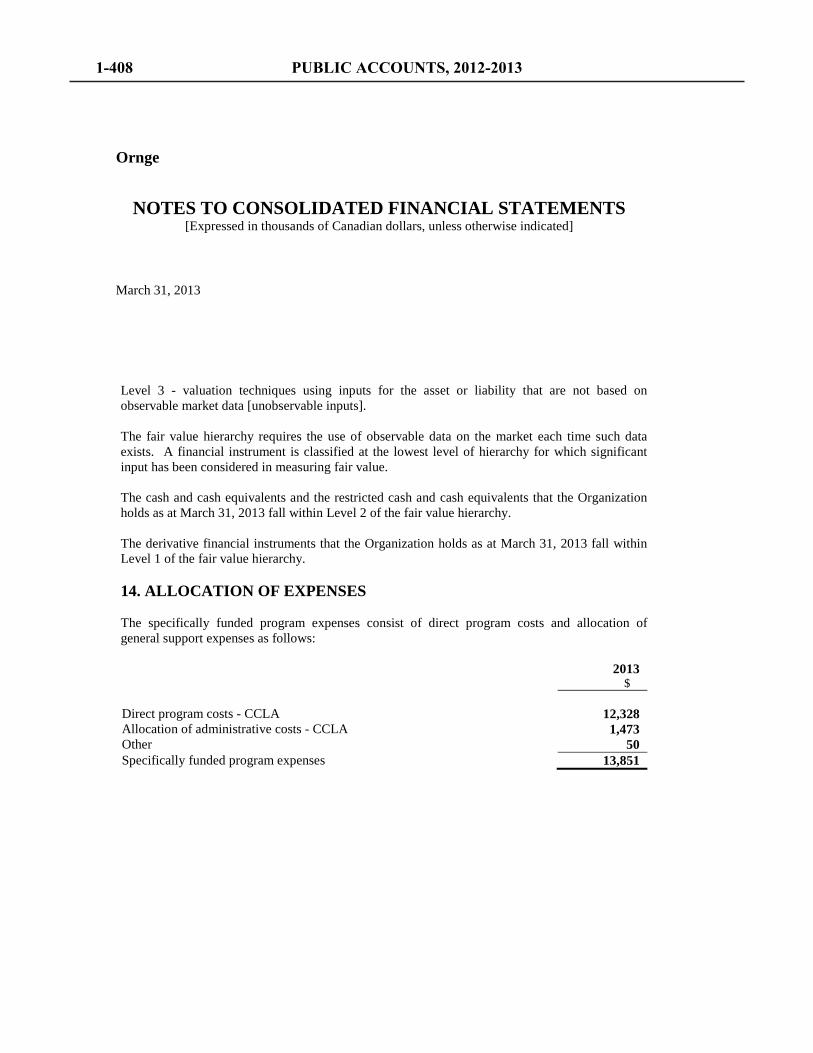
Level 3 - valuation techniques using inputs for the asset or liability that are not based on observable market data [unobservable inputs]. The fair value hierarchy requires the use of observable data on the market each time such data exists. A financial instrument is classified at the lowest level of hierarchy for which significant input has been considered in measuring fair value. The cash and cash equivalents and the restricted cash and cash equivalents that the Organization holds as at March 31, 2013 fall within Level 2 of the fair value hierarchy. The derivative financial instruments that the Organization holds as at March 31, 2013 fall within Level 1 of the fair value hierarchy. 14. ALLOCATION OF EXPENSES The specifically funded program expenses consist of direct program costs and allocation of general support expenses as follows: 2013 $ Direct program costs - CCLA 12,328 Allocation of administrative costs - CCLA 1,473 Other 50 Specifically funded program expenses 13,851
Ornge
NOTES TO CONSOLIDATED FINANCIAL STATEMENTS [Expressed in thousands of Canadian dollars, unless otherwise indicated]
March 31, 2013
1-408 PUBLIC ACCOUNTS, 2012-2013
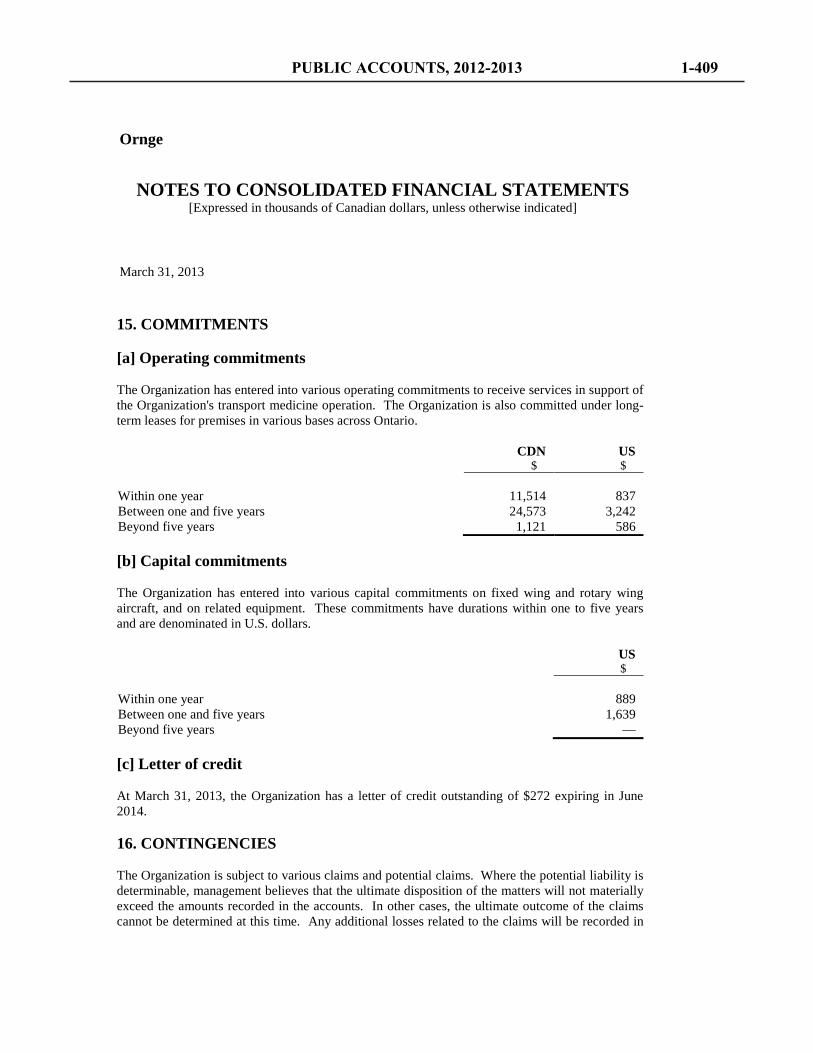
15. COMMITMENTS [a] Operating commitments The Organization has entered into various operating commitments to receive services in support of the Organization's transport medicine operation. The Organization is also committed under long-term leases for premises in various bases across Ontario. CDN US $ $ Within one year 11,514 837 Between one and five years 24,573 3,242 Beyond five years 1,121 586 [b] Capital commitments The Organization has entered into various capital commitments on fixed wing and rotary wing aircraft, and on related equipment. These commitments have durations within one to five years and are denominated in U.S. dollars. US $ Within one year 889 Between one and five years 1,639 Beyond five years — [c] Letter of credit At March 31, 2013, the Organization has a letter of credit outstanding of $272 expiring in June 2014. 16. CONTINGENCIES The Organization is subject to various claims and potential claims. Where the potential liability is determinable, management believes that the ultimate disposition of the matters will not materially exceed the amounts recorded in the accounts. In other cases, the ultimate outcome of the claims cannot be determined at this time. Any additional losses related to the claims will be recorded in
Ornge
NOTES TO CONSOLIDATED FINANCIAL STATEMENTS [Expressed in thousands of Canadian dollars, unless otherwise indicated]
March 31, 2013
PUBLIC ACCOUNTS, 2012-2013 1-409
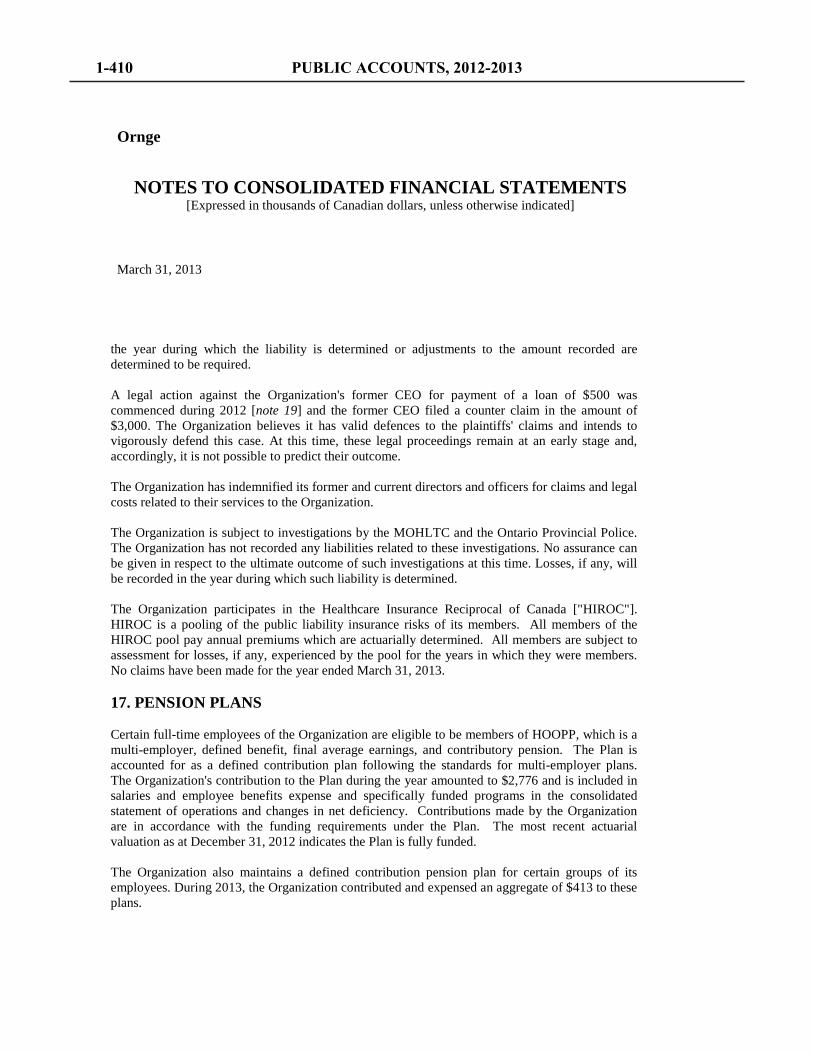
the year during which the liability is determined or adjustments to the amount recorded are determined to be required. A legal action against the Organization's former CEO for payment of a loan of $500 was commenced during 2012 [note 19] and the former CEO filed a counter claim in the amount of $3,000. The Organization believes it has valid defences to the plaintiffs' claims and intends to vigorously defend this case. At this time, these legal proceedings remain at an early stage and, accordingly, it is not possible to predict their outcome. The Organization has indemnified its former and current directors and officers for claims and legal costs related to their services to the Organization. The Organization is subject to investigations by the MOHLTC and the Ontario Provincial Police. The Organization has not recorded any liabilities related to these investigations. No assurance can be given in respect to the ultimate outcome of such investigations at this time. Losses, if any, will be recorded in the year during which such liability is determined. The Organization participates in the Healthcare Insurance Reciprocal of Canada ["HIROC"]. HIROC is a pooling of the public liability insurance risks of its members. All members of the HIROC pool pay annual premiums which are actuarially determined. All members are subject to assessment for losses, if any, experienced by the pool for the years in which they were members. No claims have been made for the year ended March 31, 2013. 17. PENSION PLANS Certain full-time employees of the Organization are eligible to be members of HOOPP, which is a multi-employer, defined benefit, final average earnings, and contributory pension. The Plan is accounted for as a defined contribution plan following the standards for multi-employer plans. The Organization's contribution to the Plan during the year amounted to $2,776 and is included in salaries and employee benefits expense and specifically funded programs in the consolidated statement of operations and changes in net deficiency. Contributions made by the Organization are in accordance with the funding requirements under the Plan. The most recent actuarial valuation as at December 31, 2012 indicates the Plan is fully funded. The Organization also maintains a defined contribution pension plan for certain groups of its employees. During 2013, the Organization contributed and expensed an aggregate of $413 to these plans.
Ornge
NOTES TO CONSOLIDATED FINANCIAL STATEMENTS [Expressed in thousands of Canadian dollars, unless otherwise indicated]
March 31, 2013
1-410 PUBLIC ACCOUNTS, 2012-2013
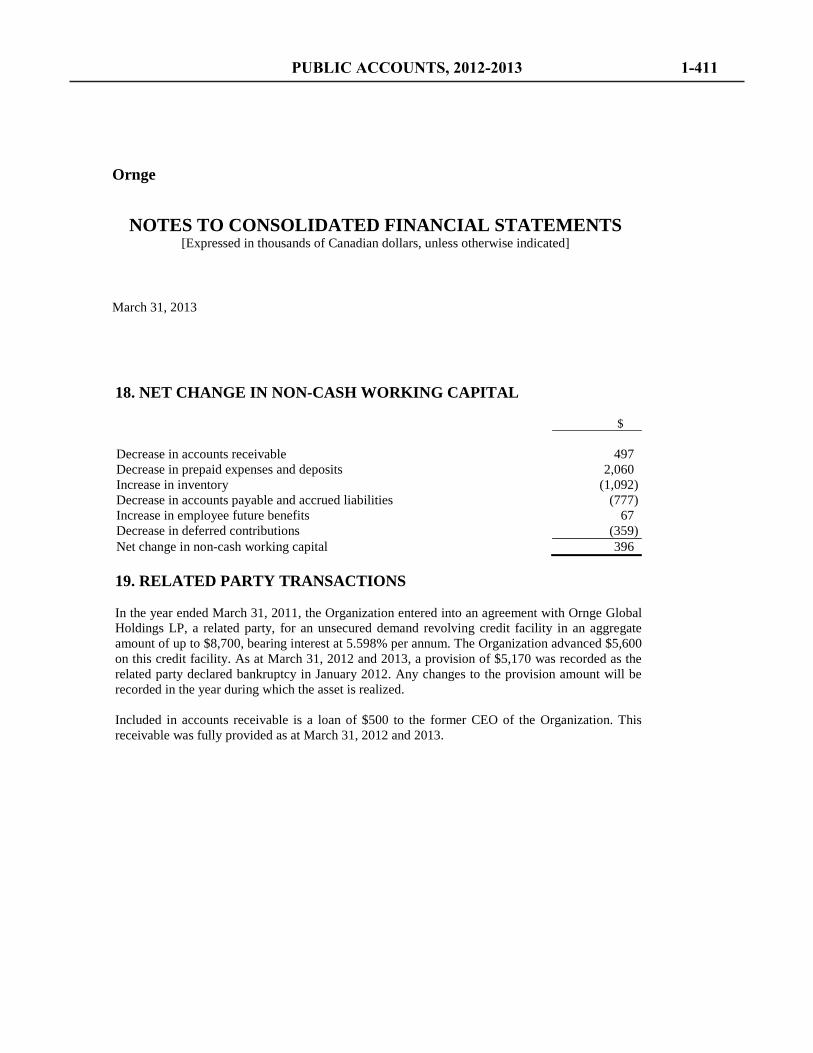
18. NET CHANGE IN NON-CASH WORKING CAPITAL $ Decrease in accounts receivable 497 Decrease in prepaid expenses and deposits 2,060 Increase in inventory (1,092) Decrease in accounts payable and accrued liabilities (777) Increase in employee future benefits 67 Decrease in deferred contributions (359) Net change in non-cash working capital 396 19. RELATED PARTY TRANSACTIONS In the year ended March 31, 2011, the Organization entered into an agreement with Ornge Global Holdings LP, a related party, for an unsecured demand revolving credit facility in an aggregate amount of up to $8,700, bearing interest at 5.598% per annum. The Organization advanced $5,600 on this credit facility. As at March 31, 2012 and 2013, a provision of $5,170 was recorded as the related party declared bankruptcy in January 2012. Any changes to the provision amount will be recorded in the year during which the asset is realized. Included in accounts receivable is a loan of $500 to the former CEO of the Organization. This receivable was fully provided as at March 31, 2012 and 2013.
Ornge
NOTES TO CONSOLIDATED FINANCIAL STATEMENTS [Expressed in thousands of Canadian dollars, unless otherwise indicated]
March 31, 2013
PUBLIC ACCOUNTS, 2012-2013 1-411

Management’s Responsibility for Financial Reporting The accompanying financial statements and the financial information in the annual report have been prepared by management. The financial statements have been prepared in accordance with Canadian public sector accounting standards. Management is responsible for the accuracy, integrity, and objectivity of the information contained in the financial statements. Financial information contained elsewhere in the annual report is consistent with that contained in the financial statements. In discharging its responsibility for the integrity and fairness of the financial statements, management maintains financial and management control systems and practices designed to provide reasonable assurance that transactions are authorized, assets are safeguarded, and proper records are maintained. The systems include formal policies and procedures and an organizational structure that provides for appropriate delegation of authority and segregation of responsibilities. The Board of Directors is responsible for ensuring management fulfills its responsibilities for financial reporting and internal control. The Board meets regularly to oversee the financial activities of the Agency and annually reviews the financial statements. The financial statements have been examined independently by PricewaterhouseCoopers. The Auditor’s Report outlines the scope of their examination and expresses their opinion on the financial statements of the company.
Patrick Kelly President & CEO
Dan Young, CMA Vice-President, Finance & Administration
July 5, 2013
PUBLIC ACCOUNTS, 2012-2013 1-413
June 21, 2013 Independent Auditor’s Report To the Members of Ottawa Convention Centre Corporation / Société du Centre des Congrès d’Ottawa We have audited the accompanying financial statements of Ottawa Convention Centre Corporation / Société du Centre des Congrès d’Ottawa, which comprise the statement of financial position as at March 31, 2013, and the statements of operations, changes in net assets and cash flows for the year then ended, and the related notes, which comprise a summary of significant accounting policies and other explanatory information. Management's responsibility for the financial statements Management is responsible for the preparation and fair presentation of these financial statements in accordance with Canadian public sector accounting standards, and for such internal control as management determines is necessary to enable the preparation of financial statements that are free from material misstatement, whether due to fraud or error. Auditor's responsibility Our responsibility is to express an opinion on these financial statements based on our audit. We conducted our audit in accordance with Canadian generally accepted auditing standards. Those standards require that we comply with ethical requirements and plan and perform the audit to obtain reasonable assurance about whether the financial statements are free from material misstatement. An audit involves performing procedures to obtain audit evidence about the amounts and disclosures in the financial statements. The procedures selected depend on the auditor's judgment, including the assessment of the risks of material misstatement of the financial statements, whether due to fraud or error. In making those risk assessments, the auditor considers internal control relevant to the entity's preparation and fair presentation of the financial statements in order to design audit procedures that are appropriate in the circumstances, but not for the purpose of expressing an opinion on the effectiveness of the entity's internal control. An audit also includes evaluating the appropriateness of accounting policies used and the reasonableness of accounting estimates made by management, as well as evaluating the overall presentation of the financial statements.
1-414 PUBLIC ACCOUNTS, 2012-2013

We believe that the audit evidence we have obtained is sufficient and appropriate to provide a basis for our audit opinion. Opinion In our opinion, the financial statements present fairly, in all material respects, the financial position of Ottawa Convention Centre Corporation / Société du Centre des Congrès d’Ottawa as at March 31, 2013, and the results of its operations, changes in its net assets and its cash flows for the year then ended in accordance with Canadian public sector accounting standards. Comparative information Without modifying our opinion, we draw attention to note 3 to the financial statements which describes that Ottawa Convention Centre Corporation / Société du Centre des Congrès d’Ottawa adopted Canadian public sector accounting standards, including accounting standards that apply to government not-for-profit organizations on April 1, 2012 with a transition date of April 1, 2011. These standards were applied retrospectively by management to the comparative information in these financial statements, including the statements of financial position as at March 31, 2012 and April 1, 2011, and the statements of operations, changes in net assets and cash flows for the year ended March 31, 2012 and related disclosures. We were not engaged to report on the restated comparative information, and as such, it is unaudited.
Chartered Accountants, Licensed Public Accountants
PUBLIC ACCOUNTS, 2012-2013 1-415
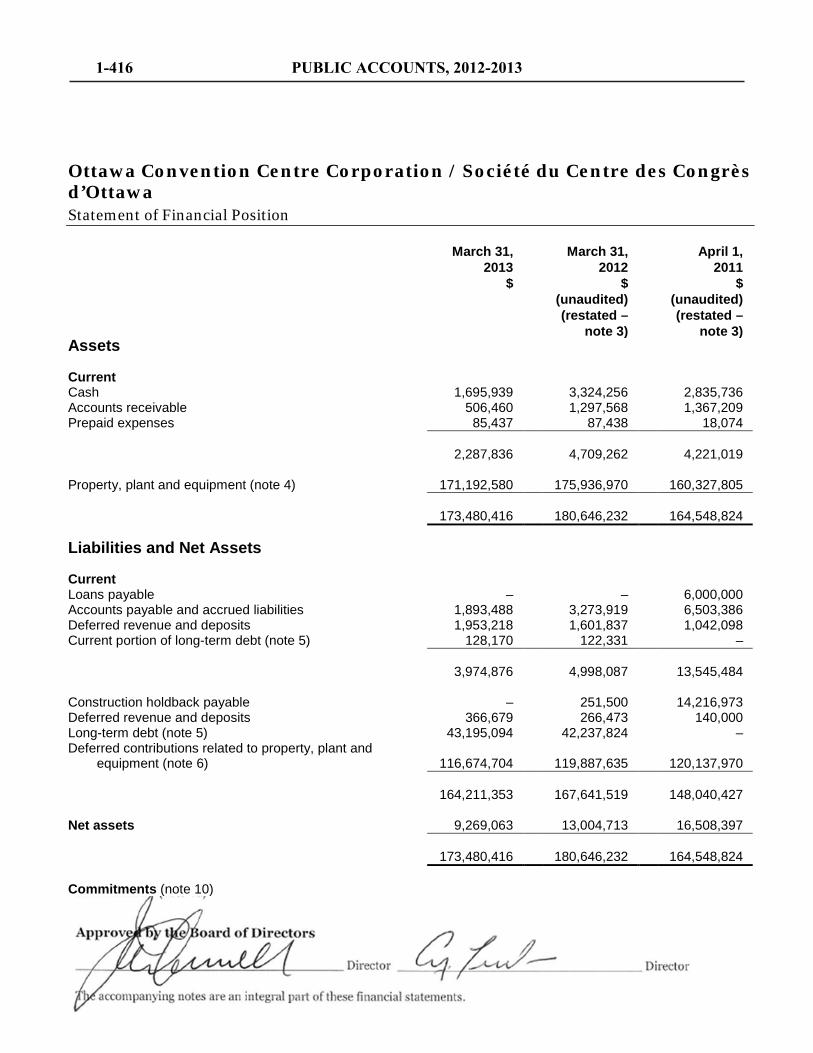
March 31, 2013
$
March 31, 2012
$
April 1, 2011
$
(unaudited) (restated –
note 3)
(unaudited) (restated –
note 3) Assets Current Cash 1,695,939 3,324,256 2,835,736 Accounts receivable 506,460 1,297,568 1,367,209 Prepaid expenses 85,437 87,438 18,074 2,287,836 4,709,262 4,221,019 Property, plant and equipment (note 4) 171,192,580 175,936,970 160,327,805 173,480,416 180,646,232 164,548,824 Liabilities and Net Assets Current Loans payable – – 6,000,000 Accounts payable and accrued liabilities 1,893,488 3,273,919 6,503,386 Deferred revenue and deposits 1,953,218 1,601,837 1,042,098 Current portion of long-term debt (note 5) 128,170 122,331 – 3,974,876 4,998,087 13,545,484 Construction holdback payable – 251,500 14,216,973 Deferred revenue and deposits 366,679 266,473 140,000 Long-term debt (note 5) 43,195,094 42,237,824 – Deferred contributions related to property, plant and
equipment (note 6) 116,674,704 119,887,635 120,137,970 164,211,353 167,641,519 148,040,427 Net assets 9,269,063 13,004,713 16,508,397 173,480,416 180,646,232 164,548,824 Commitments (note 10)
Ottawa Convention Centre Corporation / Société du Centre des Congrès d’Ottawa Statement of Financial Position
1-416 PUBLIC ACCOUNTS, 2012-2013
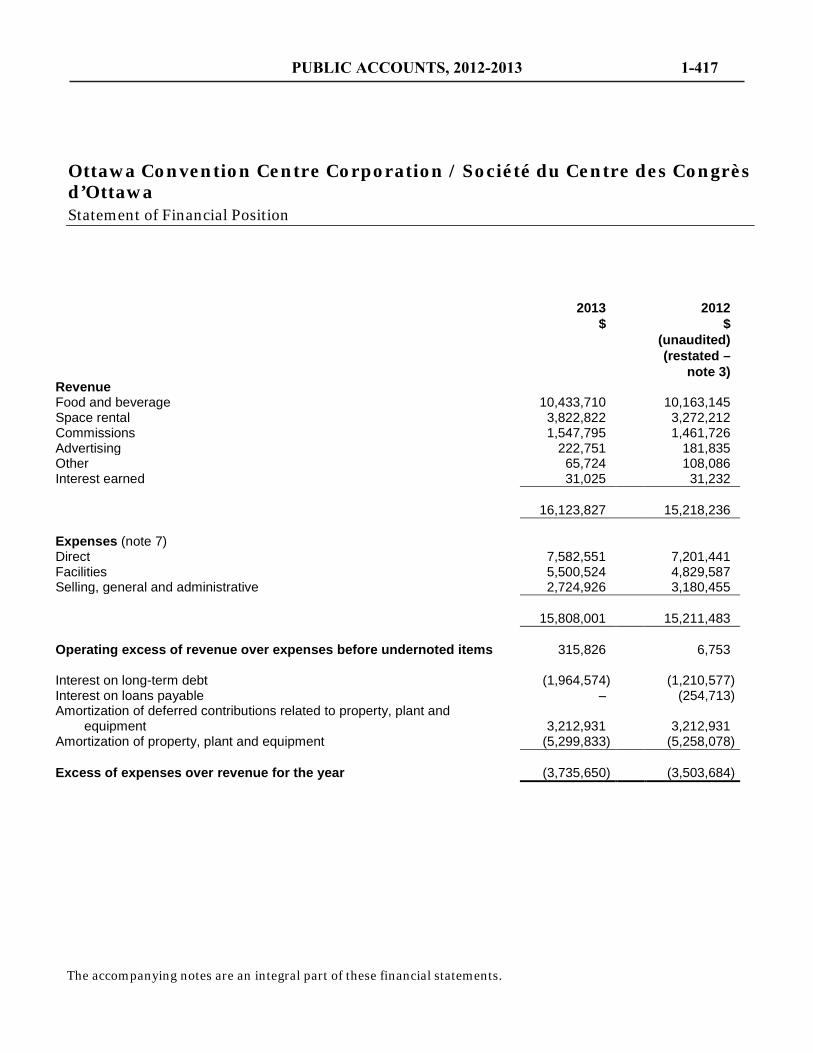
The accompanying notes are an integral part of these financial statements.
2013
$ 2012
$
(unaudited) (restated –
note 3) Revenue Food and beverage 10,433,710 10,163,145 Space rental 3,822,822 3,272,212 Commissions 1,547,795 1,461,726 Advertising 222,751 181,835 Other 65,724 108,086 Interest earned 31,025 31,232 16,123,827 15,218,236 Expenses (note 7) Direct 7,582,551 7,201,441 Facilities 5,500,524 4,829,587 Selling, general and administrative 2,724,926 3,180,455 15,808,001 15,211,483 Operating excess of revenue over expenses before undernoted items 315,826 6,753 Interest on long-term debt (1,964,574) (1,210,577) Interest on loans payable – (254,713) Amortization of deferred contributions related to property, plant and
equipment 3,212,931 3,212,931 Amortization of property, plant and equipment (5,299,833) (5,258,078) Excess of expenses over revenue for the year (3,735,650) (3,503,684)
Ottawa Convention Centre Corporation / Société du Centre des Congrès d’Ottawa Statement of Financial Position
PUBLIC ACCOUNTS, 2012-2013 1-417
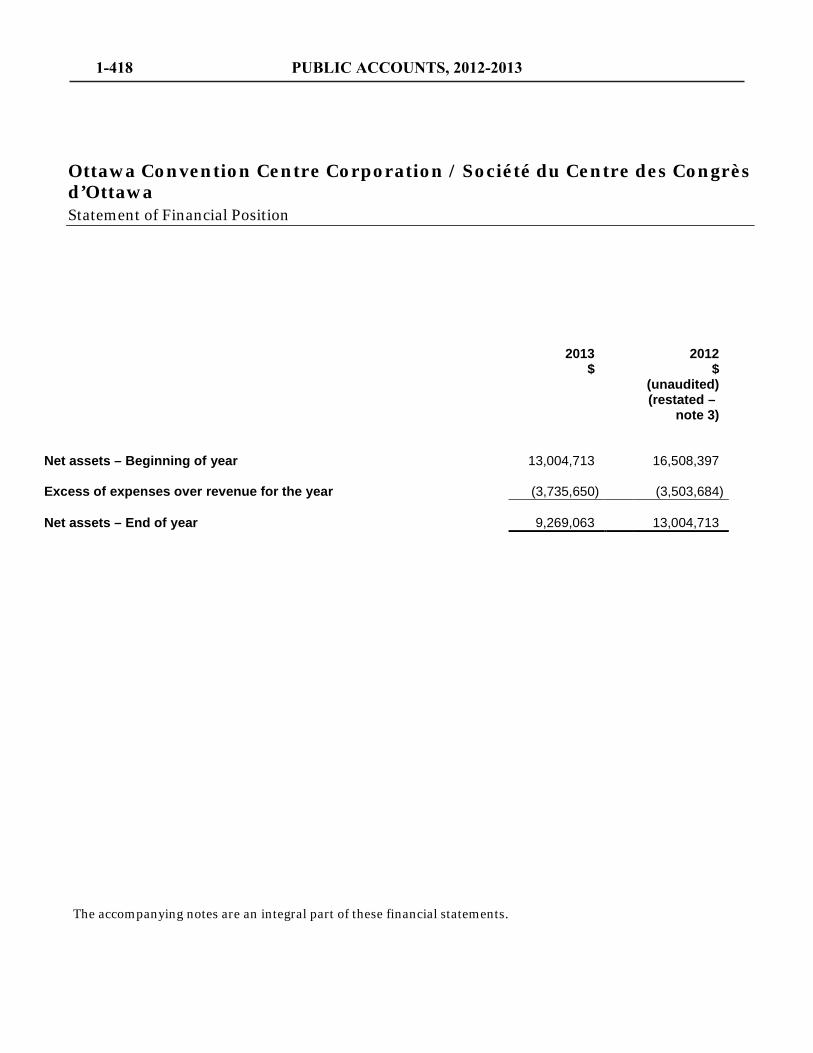
The accompanying notes are an integral part of these financial statements.
2013
$ 2012
$
(unaudited) (restated –
note 3)
Net assets – Beginning of year 13,004,713 16,508,397 Excess of expenses over revenue for the year (3,735,650) (3,503,684) Net assets – End of year 9,269,063 13,004,713
Ottawa Convention Centre Corporation / Société du Centre des Congrès d’Ottawa Statement of Financial Position
1-418 PUBLIC ACCOUNTS, 2012-2013
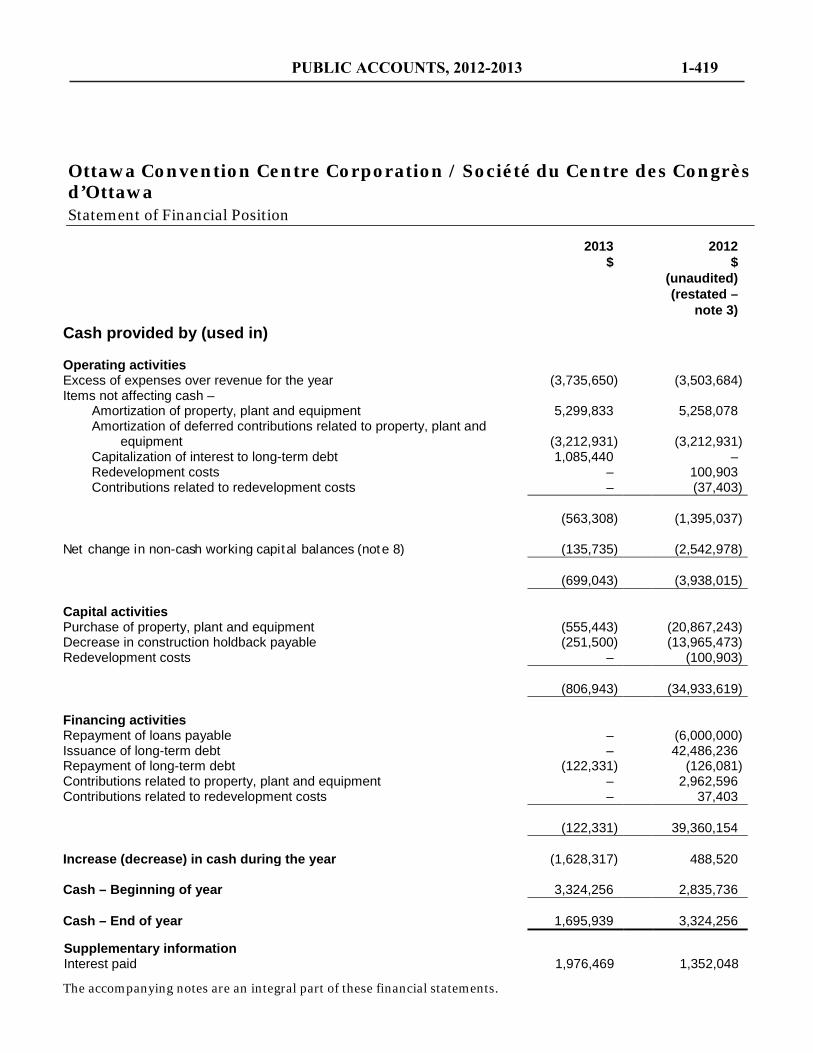
The accompanying notes are an integral part of these financial statements.
2013
$ 2012
$
(unaudited) (restated –
note 3) Cash provided by (used in)
Operating activities Excess of expenses over revenue for the year (3,735,650) (3,503,684) Items not affecting cash –
Amortization of property, plant and equipment 5,299,833 5,258,078 Amortization of deferred contributions related to property, plant and
equipment (3,212,931) (3,212,931) Capitalization of interest to long-term debt 1,085,440 – Redevelopment costs – 100,903 Contributions related to redevelopment costs – (37,403)
(563,308) (1,395,037) Net change in non-cash working capital balances (note 8) (135,735) (2,542,978) (699,043) (3,938,015) Capital activities Purchase of property, plant and equipment (555,443) (20,867,243) Decrease in construction holdback payable (251,500) (13,965,473) Redevelopment costs – (100,903) (806,943) (34,933,619) Financing activities Repayment of loans payable – (6,000,000) Issuance of long-term debt – 42,486,236 Repayment of long-term debt (122,331) (126,081) Contributions related to property, plant and equipment – 2,962,596 Contributions related to redevelopment costs – 37,403 (122,331) 39,360,154 Increase (decrease) in cash during the year (1,628,317) 488,520 Cash – Beginning of year 3,324,256 2,835,736 Cash – End of year 1,695,939 3,324,256
Supplementary information Interest paid 1,976,469 1,352,048
Ottawa Convention Centre Corporation / Société du Centre des Congrès d’Ottawa Statement of Financial Position
PUBLIC ACCOUNTS, 2012-2013 1-419
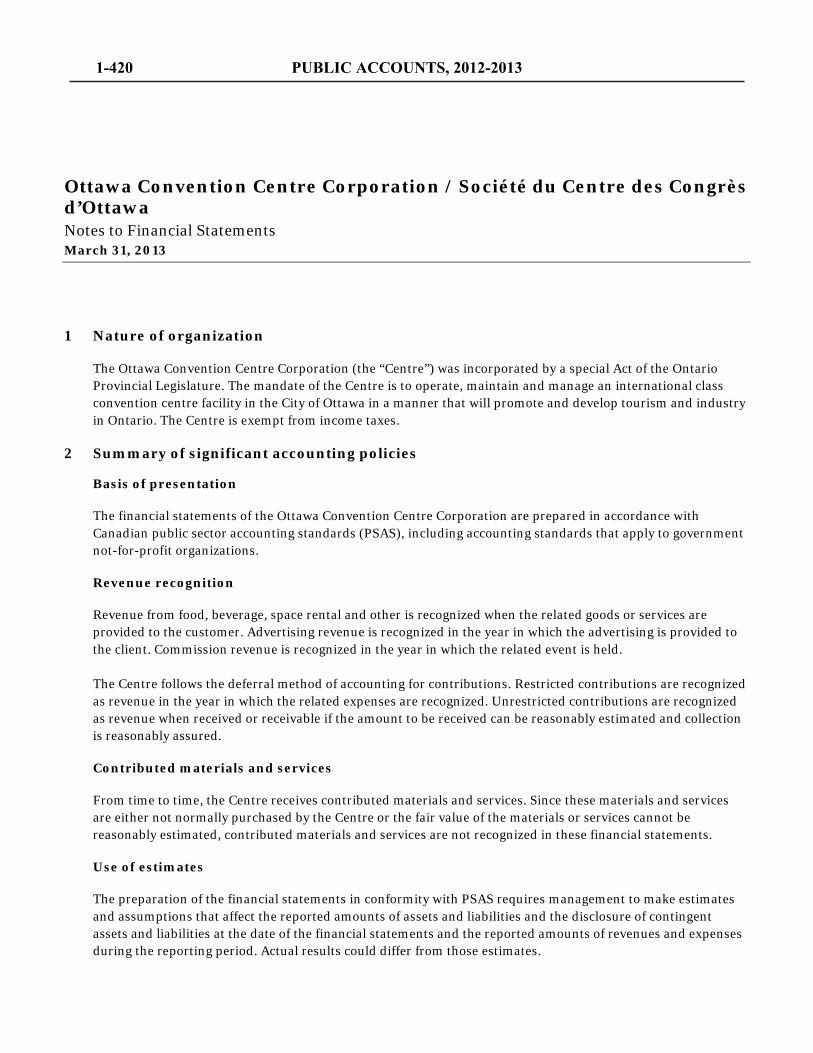
1 Nature of organization
The Ottawa Convention Centre Corporation (the “Centre”) was incorporated by a special Act of the Ontario Provincial Legislature. The mandate of the Centre is to operate, maintain and manage an international class convention centre facility in the City of Ottawa in a manner that will promote and develop tourism and industry in Ontario. The Centre is exempt from income taxes.
2 Summary of significant accounting policies
Basis of presentation
The financial statements of the Ottawa Convention Centre Corporation are prepared in accordance with Canadian public sector accounting standards (PSAS), including accounting standards that apply to government not-for-profit organizations.
Revenue recognition
Revenue from food, beverage, space rental and other is recognized when the related goods or services are provided to the customer. Advertising revenue is recognized in the year in which the advertising is provided to the client. Commission revenue is recognized in the year in which the related event is held.
The Centre follows the deferral method of accounting for contributions. Restricted contributions are recognized as revenue in the year in which the related expenses are recognized. Unrestricted contributions are recognized as revenue when received or receivable if the amount to be received can be reasonably estimated and collection is reasonably assured.
Contributed materials and services
From time to time, the Centre receives contributed materials and services. Since these materials and services are either not normally purchased by the Centre or the fair value of the materials or services cannot be reasonably estimated, contributed materials and services are not recognized in these financial statements.
Use of estimates
The preparation of the financial statements in conformity with PSAS requires management to make estimates and assumptions that affect the reported amounts of assets and liabilities and the disclosure of contingent assets and liabilities at the date of the financial statements and the reported amounts of revenues and expenses during the reporting period. Actual results could differ from those estimates.
Ottawa Convention Centre Corporation / Société du Centre des Congrès d’Ottawa Notes to Financial Statements March 31, 2013
1-420 PUBLIC ACCOUNTS, 2012-2013
Significant estimates made in the preparation of these financial statements include the useful lives of property, plant and equipment and commission revenues earned. By their nature, these estimates are subject to measurement uncertainty and the effect on the financial statements of changes in such estimates in future periods could be significant.
Property, plant and equipment
Property, plant and equipment are recorded at cost less accumulated amortization. Amortization is provided for by the straight-line method over the estimated useful life of the various classes of assets, except in the year of acquisition when a pro-rated share of the year's amortization is recorded based on the fiscal quarter in which the asset is acquired. Amortization is calculated at the following rates:
Building 40 years straight-line Software 5 years straight-line Furniture, equipment and fixtures 10 years straight-line Technology network 15 years straight-line The Centre reviews long-lived assets for impairment whenever events or changes in circumstances indicate the asset no longer has any long-term service potential to the Centre. The impairment loss, if any, is the excess of the carrying value over any residual value. Impairment losses are not reversed in future periods.
Loans payable
The Centre had available a revolving term credit facility from a commercial bank by way of prime rate based loans and/or 30, 60 and 90 day bankers’ acceptances. This credit facility is no longer available to the Centre.
Deferred revenue and deposits
Deferred revenue and deposits represent amounts received in advance from customers in relation to services to be rendered in future periods.
Construction holdback payable
These amounts represent contractual holdbacks on construction costs incurred for the Centre’s facilities. Payment of these amounts was made during fiscal 2013 upon completion of the construction.
Deferred contributions related to property, plant and equipment
Deferred contributions represent amounts received from various levels of government as well as one of the Centre’s significant partners, to be used towards the construction and purchase of property, plant and equipment.
Ottawa Convention Centre Corporation / Société du Centre des Congrès d’Ottawa Notes to Financial Statements March 31, 2013
PUBLIC ACCOUNTS, 2012-2013 1-421
Deferred contributions are recognized as revenue on the same basis as the amortization of property, plant and equipment.
Employee future benefits
All full-time employees of the Centre are eligible to be members of the Centre’s defined contribution pension plan which offers employees a pension benefit, upon retirement or termination, based on the accumulated contributions made by the individual employee and by the Centre, on their behalf, plus any investment earnings on these contributions. Contributions required to be made by the Centre are recorded in the period in which employee services are rendered.
During the year, the Centre recorded an expense of $73,788 (2012 – $71,080) for contributions made to the defined contribution pension plan, which is included in selling, general and administrative expenses.
Financial instruments
The Centre’s financial instruments consist of cash, accounts receivable, accounts payable and accrued liabilities, construction holdback payable and long-term debt.
The Centre has classified its financial instruments as follows:
Asset/Liability Measurement Cash Fair value Accounts receivable Amortized cost Accounts payable and accrued liabilities Amortized cost Construction holdback payable Amortized cost Long-term debt Amortized cost
The carrying amount of these financial assets and financial liabilities approximates their fair values unless otherwise disclosed.
3 Transition to Canadian Public Sector Accounting Standards
Commencing with the 2013 fiscal year, the Centre has adopted PSAS. These financial statements are the first financial statements for which the Centre has applied PSAS. The Centre has elected to apply PSAS standards that apply only to government not-for-profit organizations.
The impact of the transition to PSAS on the accumulated net assets at the date of transition, April 1, 2011, and the comparative annual excess of expenses over revenues are presented below. These accounting changes have been applied retrospectively with restatement of prior periods except for the accounting standards contained in PS3450 – Financial Instruments as this standard specifically prohibits retrospective application.
Ottawa Convention Centre Corporation / Société du Centre des Congrès d’Ottawa Notes to Financial Statements March 31, 2013
1-422 PUBLIC ACCOUNTS, 2012-2013
A statement of remeasurement gains and losses has not been presented as there are no financial assets or financial liabilities denominated in foreign currencies or measured at fair value (other than cash) where changes in the values of such financial assets or financial liabilities would require separate disclosure in a statement of remeasurement gains and losses.
There was no significant impact on the statement of cash flows, as the amount of cash provided by or used in each sub-category (operating, capital and financing activities) has not changed as a result of the transition to PSAS.
The following changes have been implemented to comply with PSAS:
a) Statement of financial position
The impact of the transition on the statement of financial position is as follows:
April 1, 2011
$ (unaudited)
Deferred charges – as previously stated 1,205,049 Derecognition of deferred charges (i) (1,205,049)
Deferred charges – as restated –
April 1, 2011
$ (unaudited) Deferred contributions related to deferred charges – as previously stated 512,032
Derecognition of deferred contributions related to deferred charges (ii) (512,032) Deferred contributions related to deferred charges – restated –
March 31, 2012
$ (unaudited) Deferred contributions related to property, plant and equipment – as previously
stated 119,817,402 Adjustment of amortization period for deferred contributions related to
property, plant and equipment (iii) 70,233 Deferred contributions related to property, plant and equipment – restated 119,887,635
Ottawa Convention Centre Corporation / Société du Centre des Congrès d’Ottawa Notes to Financial Statements March 31, 2013
PUBLIC ACCOUNTS, 2012-2013 1-423
b) Statement of operations
The impact of the transition on the statement of operations is as follows:
Year ended March 31, 2012
$ (unaudited) Excess of expenses over revenue for the year as originally reported (4,126,468) Adjustments to the excess of expenses over revenue for the year –
Conversion to PSAS Deferred charges (i) 1,205,049 Deferred contributions related to deferred charges (ii) (512,032) Deferred contributions related to property, plant and equipment (iii) (70,233)
Excess of expenses over revenue for the year – as restated (3,503,684)
c) Accumulated net assets
The impact of the transition on the net assets is as follows:
March 31, 2012
$ April 1, 2011
$ (unaudited) (unaudited)
Accumulated net assets – as originally reported 13,074,946 17,201,414 Adjustments to the accumulated net assets –
Conversion to PSAS Deferred charges (i) – (1,205,049) Deferred contributions related to deferred charges (ii) – 512,032 Deferred contributions related to property, plant and
equipment (iii) (70,233) – Net assets – as restated 13,004,713 16,508,397 (i) The Centre has retrospectively derecognized deferred charges which represent pre-operating costs
pertaining to the redevelopment initiative. These deferred charges have been recognized under the Centre’s previous accounting framework but do not meet the definition of assets under PSAS.
Ottawa Convention Centre Corporation / Société du Centre des Congrès d’Ottawa Notes to Financial Statements March 31, 2013
1-424 PUBLIC ACCOUNTS, 2012-2013
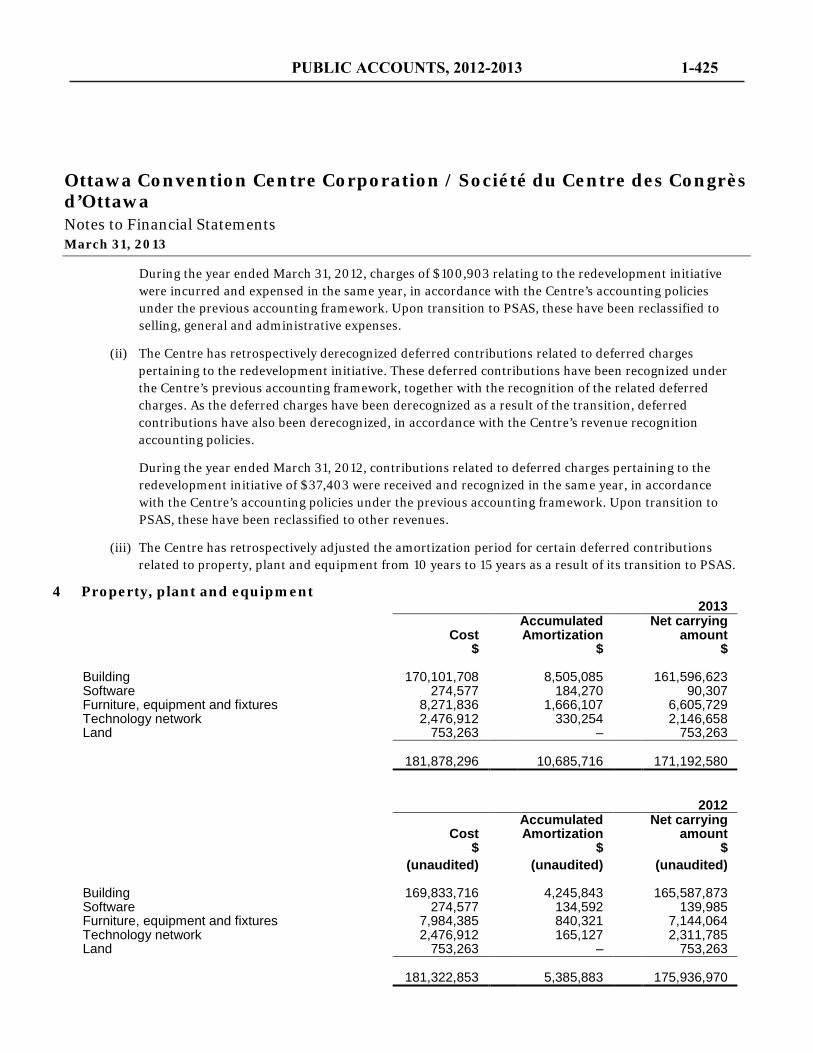
During the year ended March 31, 2012, charges of $100,903 relating to the redevelopment initiative were incurred and expensed in the same year, in accordance with the Centre’s accounting policies under the previous accounting framework. Upon transition to PSAS, these have been reclassified to selling, general and administrative expenses.
(ii) The Centre has retrospectively derecognized deferred contributions related to deferred charges pertaining to the redevelopment initiative. These deferred contributions have been recognized under the Centre’s previous accounting framework, together with the recognition of the related deferred charges. As the deferred charges have been derecognized as a result of the transition, deferred contributions have also been derecognized, in accordance with the Centre’s revenue recognition accounting policies.
During the year ended March 31, 2012, contributions related to deferred charges pertaining to the redevelopment initiative of $37,403 were received and recognized in the same year, in accordance with the Centre’s accounting policies under the previous accounting framework. Upon transition to PSAS, these have been reclassified to other revenues.
(iii) The Centre has retrospectively adjusted the amortization period for certain deferred contributions related to property, plant and equipment from 10 years to 15 years as a result of its transition to PSAS.
4 Property, plant and equipment 2013
Cost
$
Accumulated Amortization
$
Net carrying amount
$
Building 170,101,708 8,505,085 161,596,623 Software 274,577 184,270 90,307 Furniture, equipment and fixtures 8,271,836 1,666,107 6,605,729 Technology network 2,476,912 330,254 2,146,658 Land 753,263 – 753,263 181,878,296 10,685,716 171,192,580 2012
Cost
$
Accumulated Amortization
$
Net carrying amount
$ (unaudited) (unaudited) (unaudited) Building 169,833,716 4,245,843 165,587,873 Software 274,577 134,592 139,985 Furniture, equipment and fixtures 7,984,385 840,321 7,144,064 Technology network 2,476,912 165,127 2,311,785 Land 753,263 – 753,263 181,322,853 5,385,883 175,936,970
Ottawa Convention Centre Corporation / Société du Centre des Congrès d’Ottawa Notes to Financial Statements March 31, 2013
PUBLIC ACCOUNTS, 2012-2013 1-425
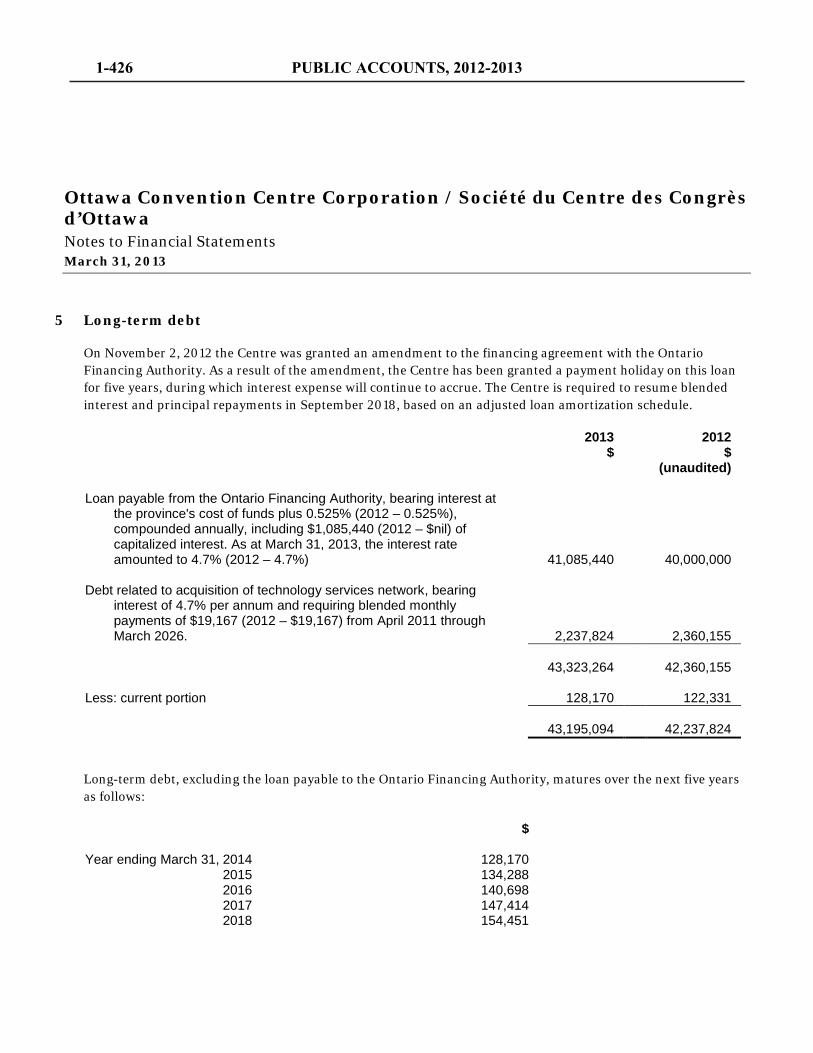
5 Long-term debt
On November 2, 2012 the Centre was granted an amendment to the financing agreement with the Ontario Financing Authority. As a result of the amendment, the Centre has been granted a payment holiday on this loan for five years, during which interest expense will continue to accrue. The Centre is required to resume blended interest and principal repayments in September 2018, based on an adjusted loan amortization schedule.
2013
$ 2012
$ (unaudited)
Loan payable from the Ontario Financing Authority, bearing interest at the province's cost of funds plus 0.525% (2012 – 0.525%), compounded annually, including $1,085,440 (2012 – $nil) of capitalized interest. As at March 31, 2013, the interest rate amounted to 4.7% (2012 – 4.7%) 41,085,440 40,000,000
Debt related to acquisition of technology services network, bearing
interest of 4.7% per annum and requiring blended monthly payments of $19,167 (2012 – $19,167) from April 2011 through March 2026. 2,237,824 2,360,155
43,323,264 42,360,155 Less: current portion 128,170 122,331 43,195,094 42,237,824 Long-term debt, excluding the loan payable to the Ontario Financing Authority, matures over the next five years as follows:
$ Year ending March 31, 2014 128,170 2015 134,288 2016 140,698 2017 147,414 2018 154,451
Ottawa Convention Centre Corporation / Société du Centre des Congrès d’Ottawa Notes to Financial Statements March 31, 2013
1-426 PUBLIC ACCOUNTS, 2012-2013
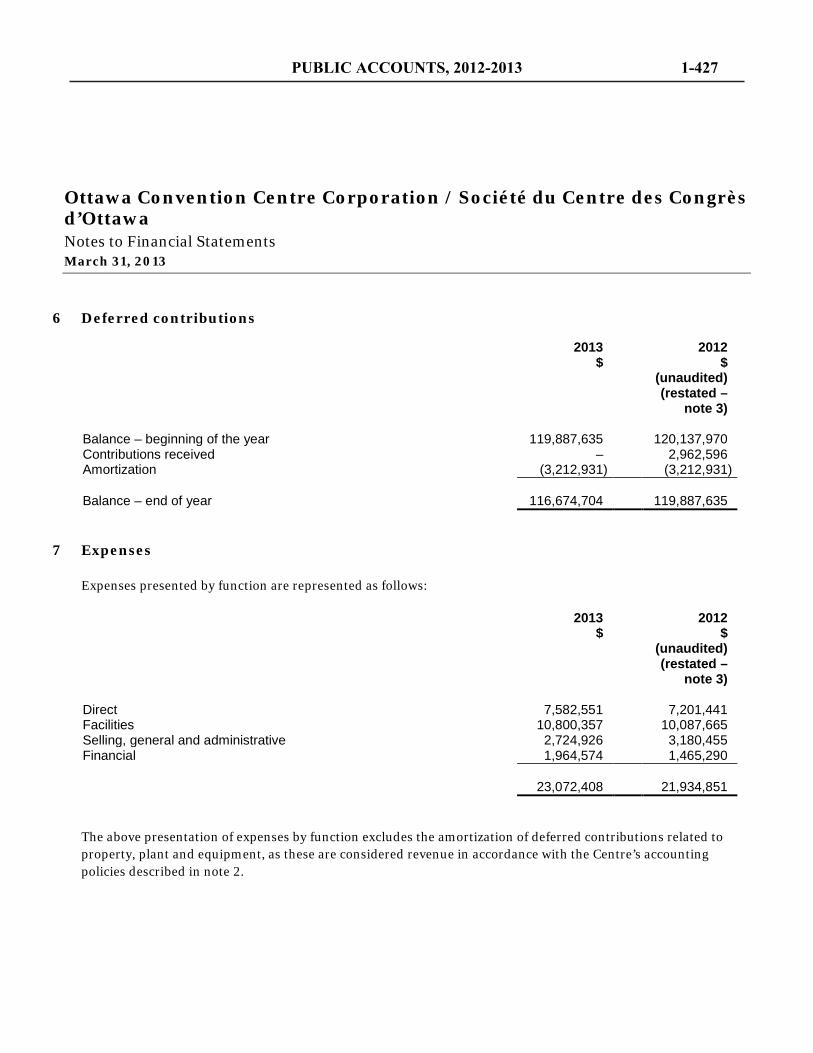
6 Deferred contributions
2013
$ 2012
$
(unaudited) (restated –
note 3)
Balance – beginning of the year 119,887,635 120,137,970 Contributions received – 2,962,596 Amortization (3,212,931) (3,212,931) Balance – end of year 116,674,704 119,887,635
7 Expenses
Expenses presented by function are represented as follows:
2013
$ 2012
$
(unaudited) (restated –
note 3)
Direct 7,582,551 7,201,441 Facilities 10,800,357 10,087,665 Selling, general and administrative 2,724,926 3,180,455 Financial 1,964,574 1,465,290 23,072,408 21,934,851 The above presentation of expenses by function excludes the amortization of deferred contributions related to property, plant and equipment, as these are considered revenue in accordance with the Centre’s accounting policies described in note 2.
Ottawa Convention Centre Corporation / Société du Centre des Congrès d’Ottawa Notes to Financial Statements March 31, 2013
PUBLIC ACCOUNTS, 2012-2013 1-427
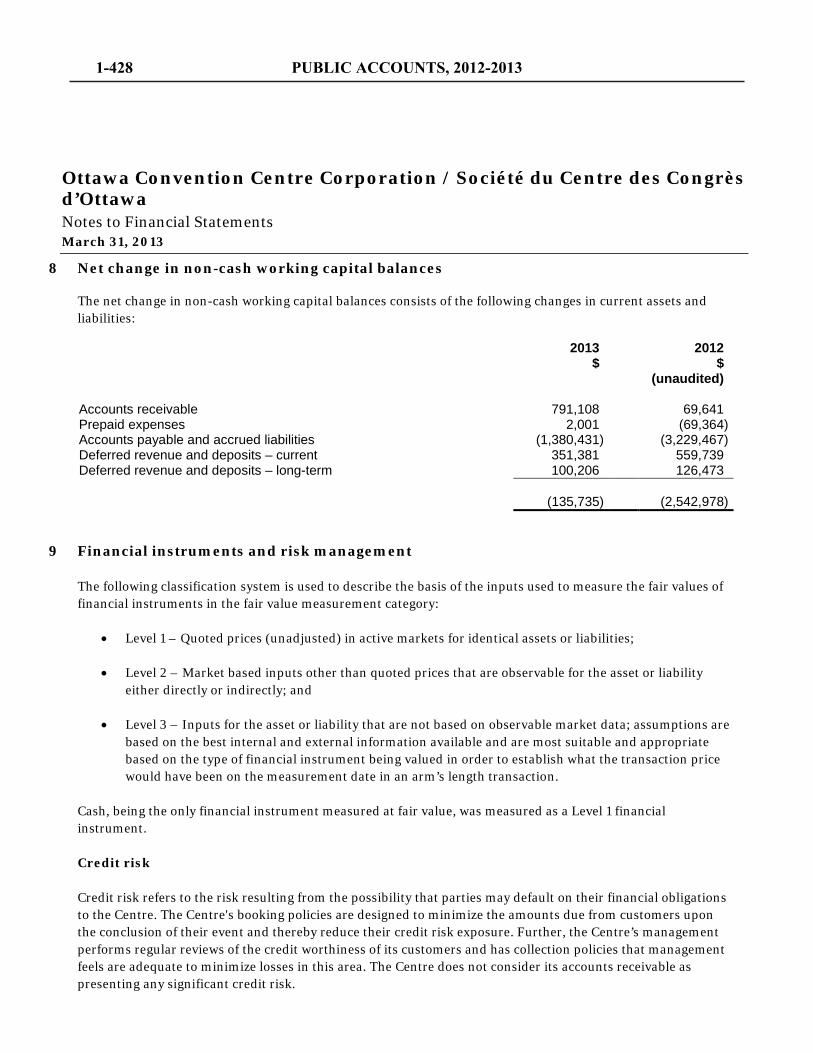
8 Net change in non-cash working capital balances
The net change in non-cash working capital balances consists of the following changes in current assets and liabilities:
2013
$ 2012
$ (unaudited)
Accounts receivable 791,108 69,641 Prepaid expenses 2,001 (69,364) Accounts payable and accrued liabilities (1,380,431) (3,229,467) Deferred revenue and deposits – current 351,381 559,739 Deferred revenue and deposits – long-term 100,206 126,473 (135,735) (2,542,978)
9 Financial instruments and risk management
The following classification system is used to describe the basis of the inputs used to measure the fair values of financial instruments in the fair value measurement category:
• Level 1 – Quoted prices (unadjusted) in active markets for identical assets or liabilities;
• Level 2 – Market based inputs other than quoted prices that are observable for the asset or liability either directly or indirectly; and
• Level 3 – Inputs for the asset or liability that are not based on observable market data; assumptions are based on the best internal and external information available and are most suitable and appropriate based on the type of financial instrument being valued in order to establish what the transaction price would have been on the measurement date in an arm’s length transaction.
Cash, being the only financial instrument measured at fair value, was measured as a Level 1 financial instrument.
Credit risk
Credit risk refers to the risk resulting from the possibility that parties may default on their financial obligations to the Centre. The Centre's booking policies are designed to minimize the amounts due from customers upon the conclusion of their event and thereby reduce their credit risk exposure. Further, the Centre’s management performs regular reviews of the credit worthiness of its customers and has collection policies that management feels are adequate to minimize losses in this area. The Centre does not consider its accounts receivable as presenting any significant credit risk.
Ottawa Convention Centre Corporation / Société du Centre des Congrès d’Ottawa Notes to Financial Statements March 31, 2013
1-428 PUBLIC ACCOUNTS, 2012-2013
As at March 31, 2013, based on their invoice date, the following accounts receivable were past due but not impaired.
31 – 60 days 61 – 90 days 91 – 120 days Over 120 days $ $ $ $
Accounts receivable – – – 1,000 Liquidity risk
Liquidity risk refers to the risk that the Centre will encounter difficulty in meeting obligations associated with financial liabilities. The Centre is exposed to this risk mainly in respect of its long-term debt. As at March 31, 2013, the Centre was in compliance with loan covenants and was able to discharge its liabilities. In November 2012, the Centre successfully renegotiated its long-term debt agreement with the Ontario Financing Authority (note 5), and as a result, the Centre expects to continue to be in compliance with loan covenants and be able to discharge its liabilities in fiscal 2014 and beyond.
The table below is a maturity analysis of the Centre’s financial liabilities as at March 31, 2013:
Up to 6 months
$
More than 6 months up
to 1 year $
More than 1 year up to 5
years $
More than 5 years
$ Total
$
Accounts payable and accrued liabilities 1,833,363 5,010 27,558 27,557 1,893,488
Long-term debt (excluding non-capitalized interest) 63,338 64,832 738,676 42,456,418(1) 43,323,264
1,896,701 69,842 766,234 42,483,975 45,216,752 (1) As a result of the Centre’s renegotiation of its debt agreement, no payments are required until September
2018. Included in the amount of long-term debt maturing in the more than 5 years category is the interest expense which has been capitalized to the long-term debt.
Interest rate risk
Interest rate risk refers to the risk that the fair value of financial instruments or future cash flows associated with the instruments will fluctuate due to changes in market interest rates. The Centre has $40,000,000 (2012 – $40,000,000) in debt bearing interest at the Province of Ontario's cost of funds plus 0.525% annually (note 5). Management does not consider the Centre to be exposed to significant interest rate risk.
Ottawa Convention Centre Corporation / Société du Centre des Congrès d’Ottawa Notes to Financial Statements March 31, 2013
PUBLIC ACCOUNTS, 2012-2013 1-429
As at March 31, 2013, the Centre’s total exposure to interest rate risk is $40,000,000. The Centre’s estimate of the effect on net assets, as at March 31, 2013 of a one percent increase or decrease in the interest rate on long-term debt, with all other variables held constant, would amount to an approximate increase or decrease of $400,000. In practice, the actual results may differ from this sensitivity analysis and the difference could be material.
Financing available
The Centre has an unused line of credit of $5,000,000 (2012 – $5,000,000) which is available until March 2016. Interest is charged at prime.
Sensitivity analysis
The sensitivity analysis included in this note should be used with caution as the changes are hypothetical and are not predictive of future performance. The above sensitivities are calculated with reference to year-end balances and will change due to fluctuations in the balances in the future. In addition, for the purpose of the sensitivity analysis, the effect of a variation in a particular assumption on the fair value of the financial instruments was calculated independently of any change in another assumption. Actual changes in one factor may contribute to changes in another factor, which may magnify or counteract the effect on the fair value of the financial instrument.
10 Commitments
The Centre has entered into facility services and technology services agreements related to the operation of the new facility, both elapsing in 2026. Under the facility services agreement, among other terms, the Centre will pay a facility management fee of $210,000 (2012 – $200,000) with annual escalations of $10,000 thereafter. Under the technology services agreement, the Centre will make annual payments of $284,000 (2012 – $276,000) attributable to the ongoing service agreement. All figures are excluding applicable taxes.
11 Capital management
The Centre's objective when managing capital is to maintain its ability to continue as a going concern in order to execute its mandate to operate a world class convention facility. The Centre's capital structure is comprised of its net assets and deferred contributions related to property, plant and equipment. The Centre's objective in management of its capital structure is to ensure access to sufficient cash flow to carry out its ongoing operations and service the debt obligations to the Ontario Financing Authority.
Ottawa Convention Centre Corporation / Société du Centre des Congrès d’Ottawa Notes to Financial Statements March 31, 2013
1-430 PUBLIC ACCOUNTS, 2012-2013
ROYAL ONTARIO MUSEUM Management’s Responsibility for Financial Reporting The accompanying financial statements of the Royal Ontario Museum for the year ending March 31, 2013 are the responsibility of management and have been prepared in accordance with accounting principles generally accepted in Canada. The significant accounting policies followed by the Royal Ontario Museum are described in the Summary of Significant Accounting Policies contained in Note 1 in the financial statements. The preparation of financial statements necessarily involves the use of estimates based on management’s judgement, particularly when transactions affecting the current accounting period cannot be finalized with certainty until future periods. The financial statements have been prepared within reasonable limits of materiality and in light of information available up to June 20, 2013. Management maintained a system of internal controls designed to provide reasonable assurance that the assets were safeguarded and that reliable information was available on a timely basis. The system included formal policies and procedures and an organizational structure that provided for the appropriate delegation of authority and segregation of responsibilities. These financial statements have been examined by KPMG LLP, a firm of independent external auditors appointed by the Board of Trustees. The external auditors’ responsibility is to express their opinion on whether the financial statements are fairly presented in accordance with generally accepted accounting principles in Canada. The Auditor’s Report, which follows, outlines the scope of their examination and their opinion. On behalf of Royal Ontario Museum management, ______________________ _______________________________ Bonny Wong, Glenn Dobbin, AVP & Corporate Controller Deputy Director & COO/Board Secretary
PUBLIC ACCOUNTS, 2012-2013 1-431
INDEPENDENT AUDITORS' REPORT
To the Trustees of The Royal Ontario Museum
We have audited the accompanying financial statements of The Royal Ontario Museum, which comprise the statement of financial position as at March 31, 2013, the statements of operations, changes in net deficit and cash flows for the year then ended, and notes, comprising a summary of significant accounting policies and other explanatory information.
Management's Responsibility for the Financial Statements
Management is responsible for the preparation and fair presentation of these financial statements in accordance with Canadian public sector accounting standards, and for such internal control as management determines is necessary to enable the preparation of financial statements that are free from material misstatement, whether due to fraud or error.
Auditors' Responsibility
Our responsibility is to express an opinion on these financial statements based on our audit. We conducted our audit in accordance with Canadian generally accepted auditing standards. Those standards require that we comply with ethical requirements and plan and perform the audit to obtain reasonable assurance about whether the financial statements are free from material misstatement.
An audit involves performing procedures to obtain audit evidence about the amounts and disclosures in the financial statements. The procedures selected depend on our judgment, including the assessment of the risks of material misstatement of the financial statements, whether due to fraud or error. In making those risk assessments, we consider internal control relevant to the entity's preparation and fair presentation of the financial statements in order to design audit procedures that are appropriate in the circumstances, but not for the purpose of expressing an opinion on the effectiveness of the entity's internal control. An audit also includes evaluating the appropriateness of accounting policies used and the reasonableness of accounting estimates made by management, as well as evaluating the overall presentation of the financial statements.
We believe that the audit evidence we have obtained is sufficient and appropriate to provide a basis for our audit opinion.
Opinion
In our opinion, the financial statements present fairly, in all material respects, the financial position of The Royal Ontario Museum as at March 31, 2013, and its results of operations and its cash flows for the year then ended in accordance with Canadian public sector accounting standards.
Chartered Accountants, Licensed Public Accountants June 20, 2013 Toronto, Canada
1-432 PUBLIC ACCOUNTS, 2012-2013
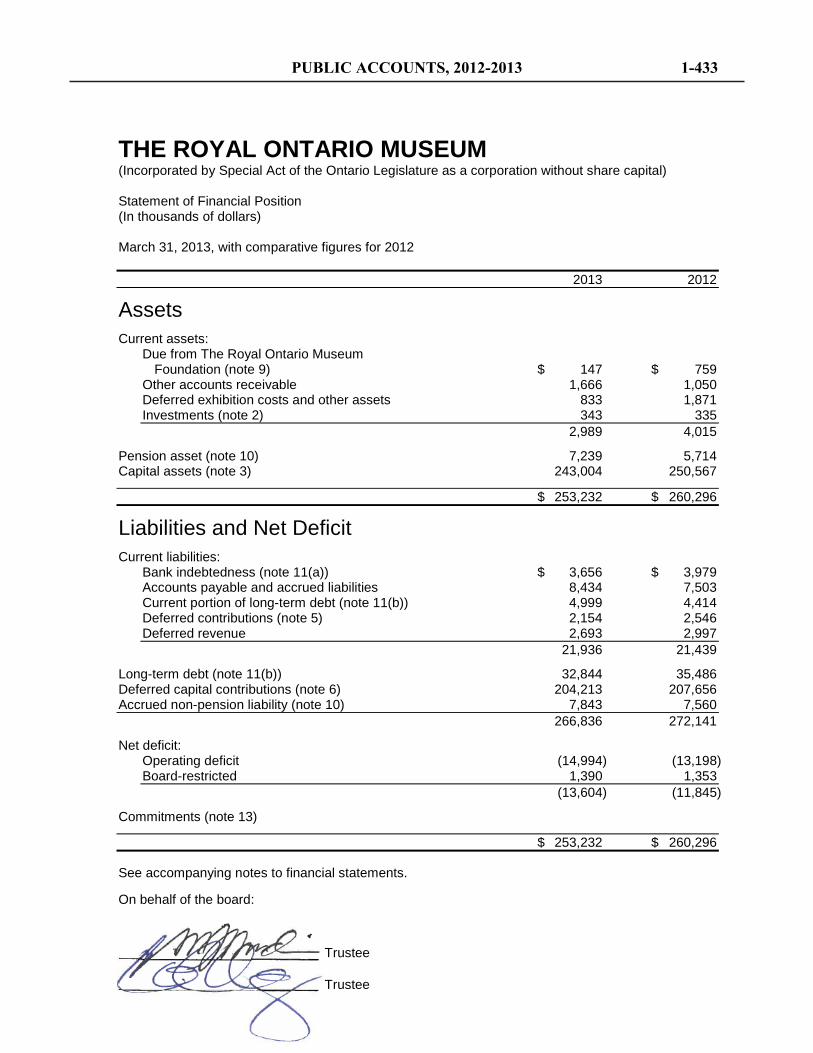
THE ROYAL ONTARIO MUSEUM (Incorporated by Special Act of the Ontario Legislature as a corporation without share capital) Statement of Financial Position (In thousands of dollars) March 31, 2013, with comparative figures for 2012 2013 2012
Assets
Current assets: Due from The Royal Ontario Museum
Foundation (note 9) $ 147 $ 759 Other accounts receivable 1,666 1,050 Deferred exhibition costs and other assets 833 1,871 Investments (note 2) 343 335 2,989 4,015
Pension asset (note 10) 7,239 5,714 Capital assets (note 3) 243,004 250,567
$ 253,232 $ 260,296
Liabilities and Net Deficit
Current liabilities: Bank indebtedness (note 11(a)) $ 3,656 $ 3,979 Accounts payable and accrued liabilities 8,434 7,503 Current portion of long-term debt (note 11(b)) 4,999 4,414 Deferred contributions (note 5) 2,154 2,546 Deferred revenue 2,693 2,997 21,936 21,439
Long-term debt (note 11(b)) 32,844 35,486 Deferred capital contributions (note 6) 204,213 207,656 Accrued non-pension liability (note 10) 7,843 7,560 266,836 272,141
Net deficit: Operating deficit (14,994) (13,198) Board-restricted 1,390 1,353 (13,604) (11,845)
Commitments (note 13)
$ 253,232 $ 260,296 See accompanying notes to financial statements.
On behalf of the board:
Trustee
Trustee
PUBLIC ACCOUNTS, 2012-2013 1-433
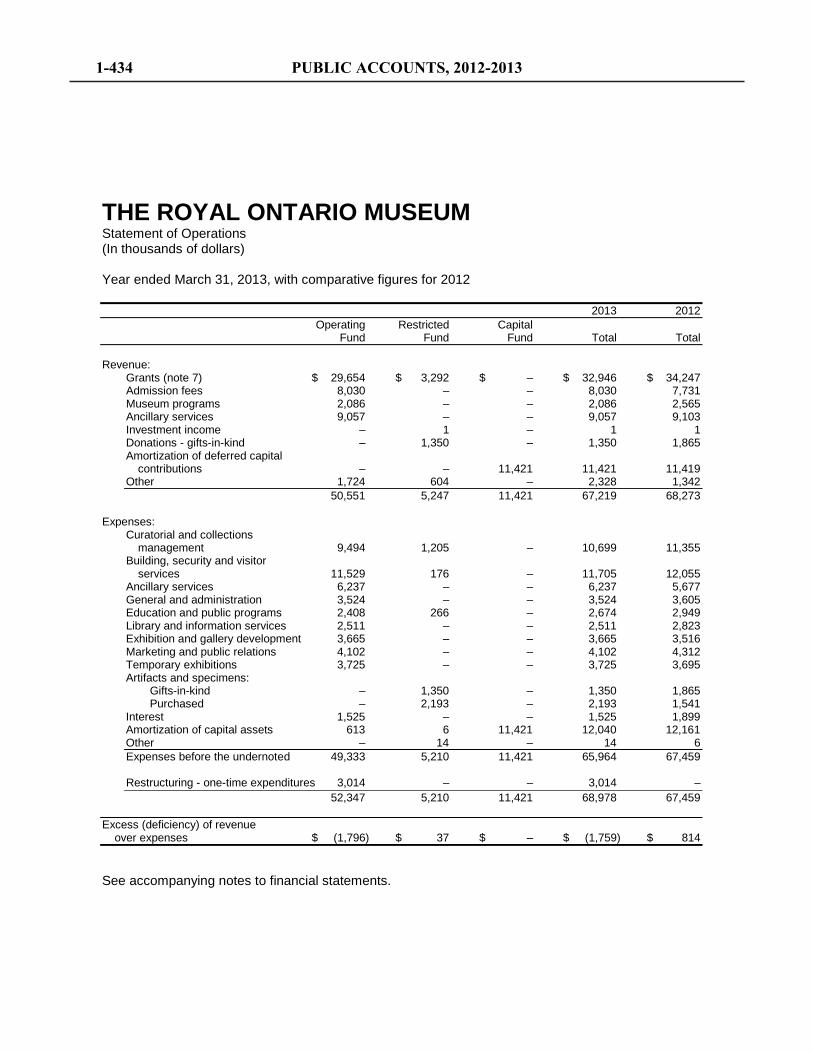
THE ROYAL ONTARIO MUSEUM Statement of Operations (In thousands of dollars) Year ended March 31, 2013, with comparative figures for 2012 2013 2012 Operating Restricted Capital Fund Fund Fund Total Total Revenue:
Grants (note 7) $ 29,654 $ 3,292 $ – $ 32,946 $ 34,247 Admission fees 8,030 – – 8,030 7,731 Museum programs 2,086 – – 2,086 2,565 Ancillary services 9,057 – – 9,057 9,103 Investment income – 1 – 1 1 Donations - gifts-in-kind – 1,350 – 1,350 1,865 Amortization of deferred capital
contributions – – 11,421 11,421 11,419 Other 1,724 604 – 2,328 1,342 50,551 5,247 11,421 67,219 68,273
Expenses:
Curatorial and collections management 9,494 1,205 – 10,699 11,355
Building, security and visitor services 11,529 176 – 11,705 12,055
Ancillary services 6,237 – – 6,237 5,677 General and administration 3,524 – – 3,524 3,605 Education and public programs 2,408 266 – 2,674 2,949 Library and information services 2,511 – – 2,511 2,823 Exhibition and gallery development 3,665 – – 3,665 3,516 Marketing and public relations 4,102 – – 4,102 4,312 Temporary exhibitions 3,725 – – 3,725 3,695 Artifacts and specimens:
Gifts-in-kind – 1,350 – 1,350 1,865 Purchased – 2,193 – 2,193 1,541
Interest 1,525 – – 1,525 1,899 Amortization of capital assets 613 6 11,421 12,040 12,161 Other – 14 – 14 6 Expenses before the undernoted 49,333 5,210 11,421 65,964 67,459 Restructuring - one-time expenditures 3,014 – – 3,014 – 52,347 5,210 11,421 68,978 67,459
Excess (deficiency) of revenue
over expenses $ (1,796) $ 37 $ – $ (1,759) $ 814
See accompanying notes to financial statements.
1-434 PUBLIC ACCOUNTS, 2012-2013
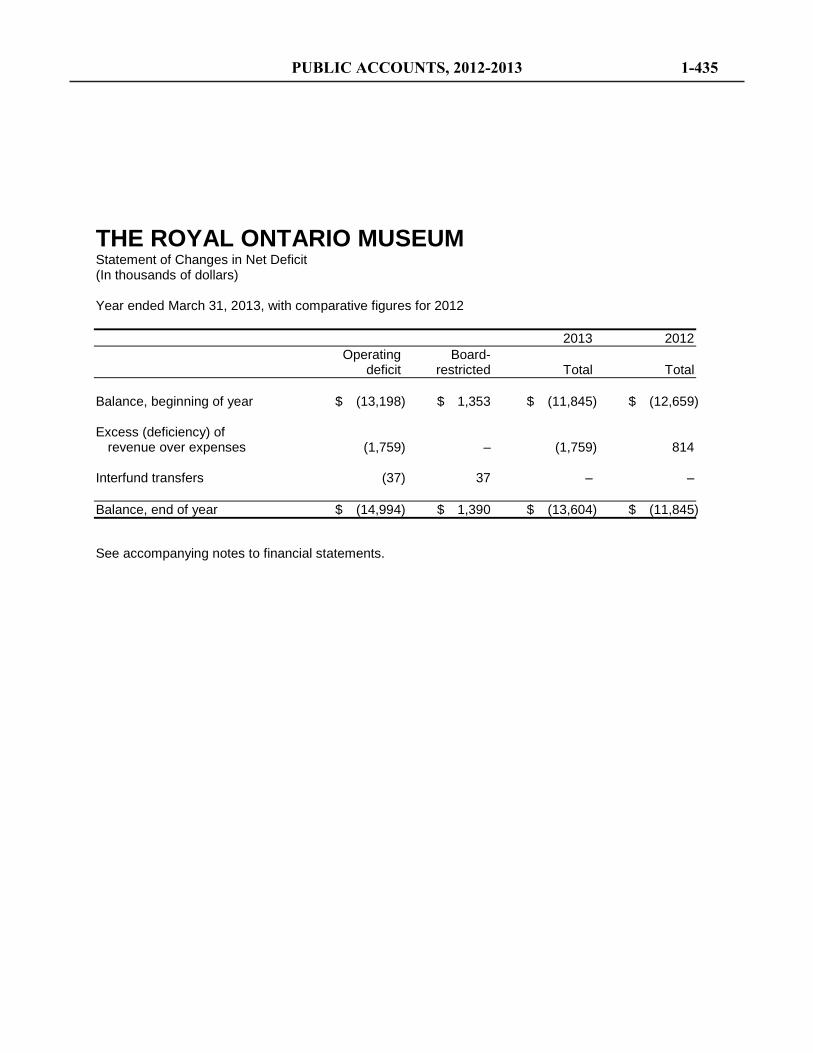
THE ROYAL ONTARIO MUSEUM Statement of Changes in Net Deficit (In thousands of dollars) Year ended March 31, 2013, with comparative figures for 2012 2013 2012 Operating Board- deficit restricted Total Total Balance, beginning of year $ (13,198) $ 1,353 $ (11,845) $ (12,659) Excess (deficiency) of
revenue over expenses (1,759) – (1,759) 814 Interfund transfers (37) 37 – – Balance, end of year $ (14,994) $ 1,390 $ (13,604) $ (11,845)
See accompanying notes to financial statements.
PUBLIC ACCOUNTS, 2012-2013 1-435
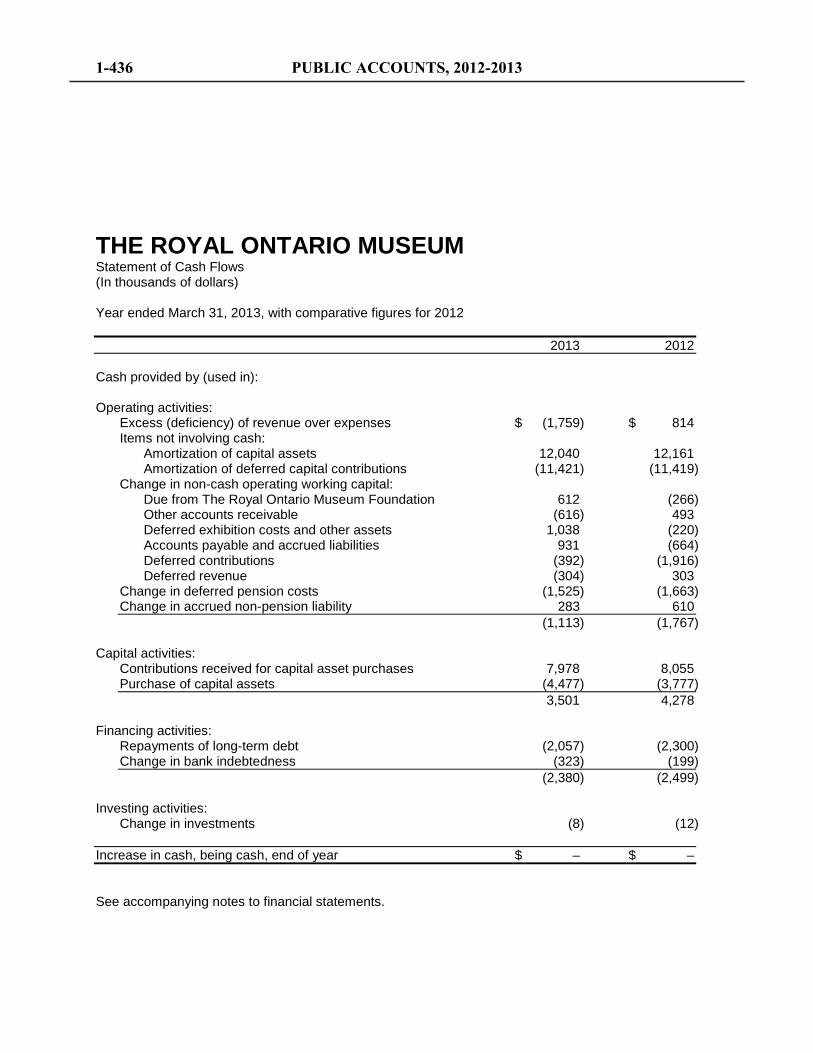
THE ROYAL ONTARIO MUSEUM Statement of Cash Flows (In thousands of dollars) Year ended March 31, 2013, with comparative figures for 2012 2013 2012 Cash provided by (used in): Operating activities:
Excess (deficiency) of revenue over expenses $ (1,759) $ 814 Items not involving cash:
Amortization of capital assets 12,040 12,161 Amortization of deferred capital contributions (11,421) (11,419)
Change in non-cash operating working capital: Due from The Royal Ontario Museum Foundation 612 (266) Other accounts receivable (616) 493 Deferred exhibition costs and other assets 1,038 (220) Accounts payable and accrued liabilities 931 (664) Deferred contributions (392) (1,916) Deferred revenue (304) 303
Change in deferred pension costs (1,525) (1,663) Change in accrued non-pension liability 283 610 (1,113) (1,767)
Capital activities:
Contributions received for capital asset purchases 7,978 8,055 Purchase of capital assets (4,477) (3,777) 3,501 4,278
Financing activities:
Repayments of long-term debt (2,057) (2,300) Change in bank indebtedness (323) (199) (2,380) (2,499)
Investing activities:
Change in investments (8) (12) Increase in cash, being cash, end of year $ – $ –
See accompanying notes to financial statements.
1-436 PUBLIC ACCOUNTS, 2012-2013
The Royal Ontario Museum (the "Museum") is an operating enterprise agency of the Province of Ontario incorporated without share capital by Special Act of the Ontario Legislature. The Museum is Canada's largest museum and one of the few of its kind to explore and exhibit both the art and archaeology of human cultures and the history of the natural world. The Museum's mission is to inspire wonder and build understanding of human cultures and the natural world.
The Museum is registered as a charitable organization under the Income Tax Act (Canada) (the "Act") and, as such, is exempt from income taxes and is able to issue donation receipts for income tax purposes. In order to maintain its status as a registered charity under the Act, the Museum must meet certain requirements within the Act. In the opinion of management, these requirements have been met.
The Museum's multi-year business plan and ongoing forecasts and projections to the Ministry of Tourism, Culture and Sport show that the Museum should be able to operate within the level of its current facility. During the year, the Museum incurred one-time costs of $3,014 related to a restructuring which will result in reducing the ongoing operational costs of the Museum. The Board of Trustees and management will continue to monitor progress to ensure business risks are effectively managed.
1. Significant accounting policies:
The financial statements have been prepared in accordance with Canadian public sector accounting standards, including the 4200 standards for government not-for-profit organizations ("Standards").
(a) Fund accounting:
For financial reporting purposes, the accounts have been classified into the following funds:
(i) Operating Fund:
The Operating Fund accounts for the Museum's general programs, fundraising and administrative activities. The Operating Fund reports resources available for immediate purposes.
(ii) Restricted Fund:
The Restricted Fund consists of those funds where resources are to be used for an identified purpose as specified by the donors and funders.
THE ROYAL ONTARIO MUSEUM Notes to Financial Statements (In thousands of dollars) Year ended March 31, 2013
PUBLIC ACCOUNTS, 2012-2013 1-437
1. Significant accounting policies (continued):
(iii) Capital Fund:
The Capital Fund reports the revenue and expenses related to the Museum's building, building improvements, galleries and the Renaissance ROM Project ("ROM Project").
(b) Revenue recognition:
The Museum follows the deferral method of accounting for contributions, which include donations and government grants. Contributions are recognized as revenue when received or receivable if the amount to be received can be reasonably estimated and collection is reasonably assured. Donations are recorded on a cash basis since pledges are not legally enforceable claims.
Contributions externally restricted for purposes other than endowment are deferred and recognized as revenue in the period in which the related expenses are recognized. Externally restricted contributions for the purchase of land are credited directly to net assets. Externally restricted contributions for the purchase of other capital assets are deferred and amortized over the life of the related capital asset.
Membership fees are deferred and recognized as revenue over the term covered by the fees.
Admission fees, museum programs and ancillary services revenue are recorded as revenue when the services have been provided or the goods delivered.
(c) Financial instruments:
Financial instruments are recorded at fair value on initial recognition. Derivative instruments and equity instruments that are quoted in an active market are reported at fair value. All other financial instruments are subsequently recorded at cost or amortized cost. Management records all investments at fair value as they are managed and evaluated on a fair value basis. Long-term debt is recorded at cost.
Unrealized changes in fair value are recognized, when material, in the statement of remeasurement gains and losses until they are realized, when they are transferred to the statement of operations. A statement of remeasurement gains/losses has not been included in these financial statements as the adjustments are not material.
THE ROYAL ONTARIO MUSEUM Notes to Financial Statements (In thousands of dollars) Year ended March 31, 2013
1-438 PUBLIC ACCOUNTS, 2012-2013
1. Significant accounting policies (continued):
Transaction costs incurred on the acquisition of financial instruments measured subsequently at fair value are expensed as incurred.
All financial assets are assessed for impairment on an annual basis. When a decline is determined to be other than temporary, the amount of the loss is reported in the statement of operations.
The Standards require an organization to classify fair value measurements using a fair value hierarchy, which includes three levels of information that may be used to measure fair value:
• Level 1 - unadjusted quoted market prices in active markets for identical assets or liabilities;
• Level 2 - observable or corroborated inputs, other than Level 1, such as quoted prices for similar assets or liabilities in inactive markets or market data for substantially the full term of the assets or liabilities; and
• Level 3 - unobservable inputs that are supported by little or no market activity and that are significant to the fair value of the assets and liabilities.
Derivative financial instruments are contracts that provide the opportunity to exchange cash flows that are determined by applying certain rates, indices or changes to notional contract amounts. From time to time, the Museum uses interest rate swaps to manage exposure to fluctuations in interest rates and forward foreign currency contracts to manage exposure to fluctuations in exchange rates. These instruments are used for hedging an on-balance sheet liability or a future contractual obligation.
Derivative financial instruments are carried at fair value. As at March 31, 2013, there are no derivative instruments held by the Museum.
(d) Deferred exhibition costs:
Costs of exhibitions are deferred until the exhibitions are opened to the public and then are expensed over the period of the exhibitions to which they relate.
THE ROYAL ONTARIO MUSEUM Notes to Financial Statements (In thousands of dollars) Year ended March 31, 2013
PUBLIC ACCOUNTS, 2012-2013 1-439
1. Significant accounting policies (continued):
(e) Employee future benefits:
The Museum provides defined retirement and other future benefits for substantially all retirees and employees. These future benefits include pension and health and dental benefits.
The Museum accrues its obligations under the defined benefit plans as the employees render the services necessary to earn the pension, compensated absences and other retirement benefits. The actuarial determination of the accrued benefit obligations for pensions and other retirement benefits uses the projected benefit method prorated on service (which incorporates management's best estimate of future salary levels, other cost escalation, retirement ages of employees and other actuarial factors). The most recent actuarial valuation of the defined benefit pension plan for funding purposes was as of January 1, 2011, and the next required valuation will be as of January 1, 2014. The most recent actuarial valuation of the non-pension plan for funding purposes was as of March 31, 2012, and the next required valuation will be as of March 31, 2014.
Actuarial gains (losses) on plan assets arise from the difference between the actual return on plan assets for a period and the expected return on plan assets for that period. Actuarial gains (losses) on the accrued benefit obligation arise from differences between actual and expected experience and from changes in the actuarial assumptions used to determine the accrued benefit obligation. The net accumulated actuarial gains (losses) are amortized over the average remaining service period of active employees. The average remaining service period of the active employees covered by the pension plan is 10 years for the Registered Plan and 11 years for the Supplemental Plan (2012 - 10 years for the Registered Plan and 11 years for the Supplemental Plan). The average remaining service period of the active employees covered by the non-pension plan is 11 years (2012 - 11 years).
Past service costs arising from plan amendments are recognized immediately in the period the plan amendments occur.
Compensated absences, such as parental leaves, accumulated sick days, and sabbaticals that provide compensated, unrestricted time off for past service, are accrued for as they vest or accumulate in the period in which employees render services to the Museum.
THE ROYAL ONTARIO MUSEUM Notes to Financial Statements (In thousands of dollars) Year ended March 31, 2013
1-440 PUBLIC ACCOUNTS, 2012-2013
1. Significant accounting policies (continued):
(f) Capital assets:
Purchased capital assets are recorded at cost. Contributed capital assets are recorded at fair value at the date of contribution. Capital assets are amortized on a straight-line basis using the following annual rates:
Building 40 years Galleries 20 years Building improvements 5 - 10 years Furniture and equipment 3 - 10 years
Construction in progress comprises direct construction and other costs associated with the ROM Project, including capitalized interest. Interest costs are capitalized during the construction period. No amortization is recorded until construction is substantially complete and the assets are ready for use.
(g) Foreign currency translation:
Foreign currency transactions are recorded at the exchange rate at the time of the transaction.
Assets and liabilities denominated in foreign currencies are recorded at fair value using the exchange rate at the financial statement date. Unrealized foreign exchange gains and losses are recognized in the statement of remeasurement gains and losses when material. In the period of settlement, the realized foreign exchange gains and losses are recognized in the statement of operations and the unrealized balances are reversed from the statement of measurement gains and losses.
THE ROYAL ONTARIO MUSEUM Notes to Financial Statements (In thousands of dollars) Year ended March 31, 2013
PUBLIC ACCOUNTS, 2012-2013 1-441
1. Significant accounting policies (continued):
(h) Artifacts and specimens:
The value of artifacts and specimens has been excluded from the statement of financial position. Gifted artifacts and specimens are recorded as revenue at values based on appraisals by independent appraisers. The acquisition of both gifted and purchased artifacts and specimens is expensed.
(i) Contributed materials and services:
Because of the difficulty in determining their fair market value, contributed materials and services are not recognized in these financial statements.
(j) Use of estimates:
The preparation of financial statements requires management to make estimates and assumptions that affect the reported amounts of assets and liabilities and disclosure of contingent assets and liabilities at the date of the financial statements and the reported amounts of revenue and expenses during the year. Significant items subject to such estimates and assumptions include the carrying amount of capital assets, and obligations related to employee future benefits. Actual amounts could differ from those estimates.
2. Investments:
Fair value Level 2013 2012 Bond funds 2 $ 121 $ 113 Preferred securities 1 24 24 Bankers' acceptance – 198 198 $ 343 $ 335
The fixed income securities bear a yield to maturity at 1% (2012 - 0.98%) with a maturity date of May 14, 2013 (April 5, 2012).
THE ROYAL ONTARIO MUSEUM Notes to Financial Statements (In thousands of dollars) Year ended March 31, 2013
1-442 PUBLIC ACCOUNTS, 2012-2013
3. Capital assets:
2013 2012 Accumulated Net book Net book Cost amortization value value Land $ 931 $ – $ 931 $ 931 Building 41,476 32,896 8,580 9,620 Galleries 17,540 16,062 1,478 2,016 Building improvements 26,123 17,516 8,607 7,715 ROM Project:
Building 205,064 32,392 172,672 178,222 Galleries 64,148 16,907 47,241 49,523
Furniture and equipment 6,073 2,578 3,495 2,540 $ 361,355 $ 118,351 $ 243,004 $ 250,567
As at March 31, 2013, the total cost of assets included assets which are under construction. These assets are not in use and to date have not been amortized. The cost of these assets is $1,476 (2012 - $102).
4. Artifacts and specimens:
As at March 31, 2013, the collection consisted of approximately 6,000,000 artifacts and specimens. During the year ended March 31, 2013, the Museum accessioned approximately 4,320 (2012 - 24,450) objects to its collections through the donation and purchase of artifacts.
5. Deferred contributions:
Deferred contributions represent grants from federal and provincial governments, corporations and The Royal Ontario Museum Foundation (the "Foundation") (note 9) related primarily to this year's operations. Grants which carry restrictions are deferred until spent on the intended purpose.
THE ROYAL ONTARIO MUSEUM Notes to Financial Statements (In thousands of dollars) Year ended March 31, 2013
PUBLIC ACCOUNTS, 2012-2013 1-443
6. Deferred capital contributions:
Deferred capital contributions represent the unamortized amount and unspent amount of grants and donations received for the purchase of capital assets and gallery development. The amortization of deferred capital contributions is recorded as revenue in the statement of operations. The changes in the deferred capital contributions balance are as follows:
2013 2012 Balance, beginning of year $ 207,656 $ 211,020 Amortization of deferred capital contributions (11,421) (11,419) Contributions received for capital asset
purchases (notes 3 and 9) 7,978 8,055 Balance, end of year $ 204,213 $ 207,656
7. Grants:
2013 2012 Province of Ontario:
Operating $ 27,725 $ 28,631 Other 13 32
Government of Canada 36 436 Foundation (note 9) 5,172 5,148 $ 32,946 $ 34,247
8. Expenses:
Expenses are reported in the statements of operations on a functional basis. Expenses by category are as follows:
2013 2012 Salaries and benefits $ 29,765 $ 31,042 Purchased goods and services 22,809 22,391 Amortization of capital assets 12,040 12,161 Gifts-in-kind 1,350 1,865 Restructuring - one-time expenditures 3,014 – $ 68,978 $ 67,459
THE ROYAL ONTARIO MUSEUM Notes to Financial Statements (In thousands of dollars) Year ended March 31, 2013
1-444 PUBLIC ACCOUNTS, 2012-2013
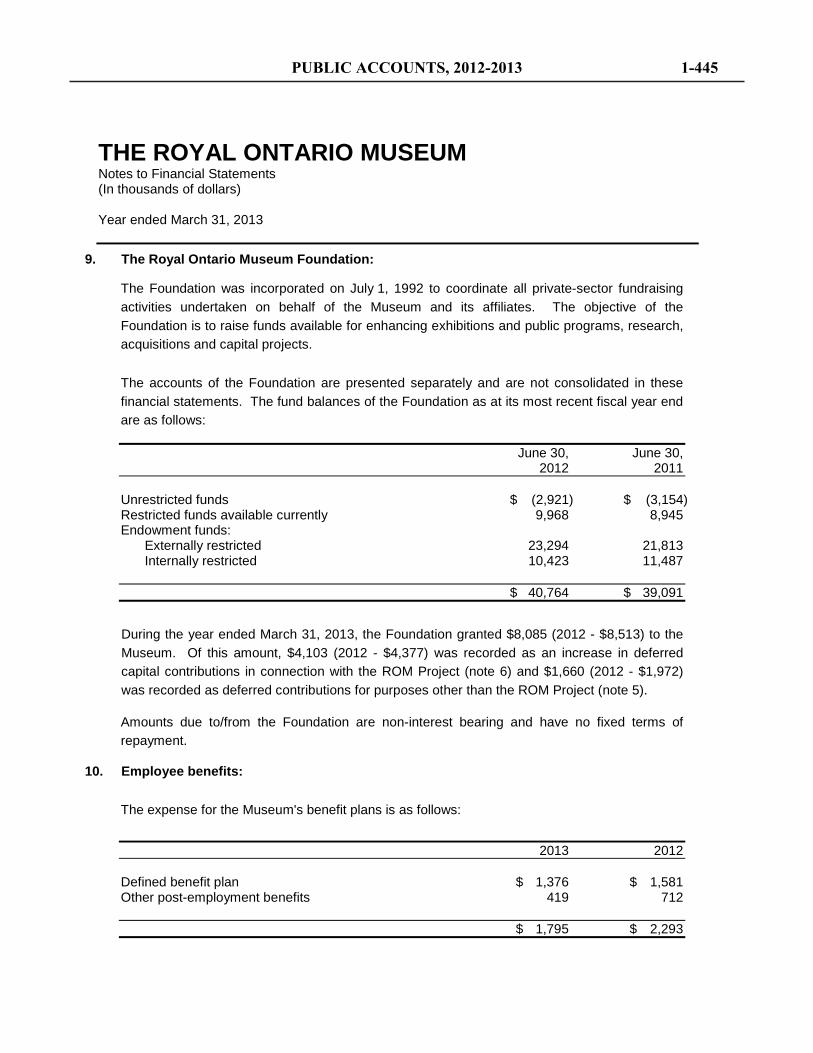
9. The Royal Ontario Museum Foundation:
The Foundation was incorporated on July 1, 1992 to coordinate all private-sector fundraising activities undertaken on behalf of the Museum and its affiliates. The objective of the Foundation is to raise funds available for enhancing exhibitions and public programs, research, acquisitions and capital projects.
The accounts of the Foundation are presented separately and are not consolidated in these financial statements. The fund balances of the Foundation as at its most recent fiscal year end are as follows: June 30, June 30, 2012 2011 Unrestricted funds $ (2,921) $ (3,154) Restricted funds available currently 9,968 8,945 Endowment funds:
Externally restricted 23,294 21,813 Internally restricted 10,423 11,487
$ 40,764 $ 39,091
During the year ended March 31, 2013, the Foundation granted $8,085 (2012 - $8,513) to the Museum. Of this amount, $4,103 (2012 - $4,377) was recorded as an increase in deferred capital contributions in connection with the ROM Project (note 6) and $1,660 (2012 - $1,972) was recorded as deferred contributions for purposes other than the ROM Project (note 5).
Amounts due to/from the Foundation are non-interest bearing and have no fixed terms of repayment.
10. Employee benefits:
The expense for the Museum's benefit plans is as follows:
2013 2012 Defined benefit plan $ 1,376 $ 1,581 Other post-employment benefits 419 712 $ 1,795 $ 2,293
THE ROYAL ONTARIO MUSEUM Notes to Financial Statements (In thousands of dollars) Year ended March 31, 2013
PUBLIC ACCOUNTS, 2012-2013 1-445
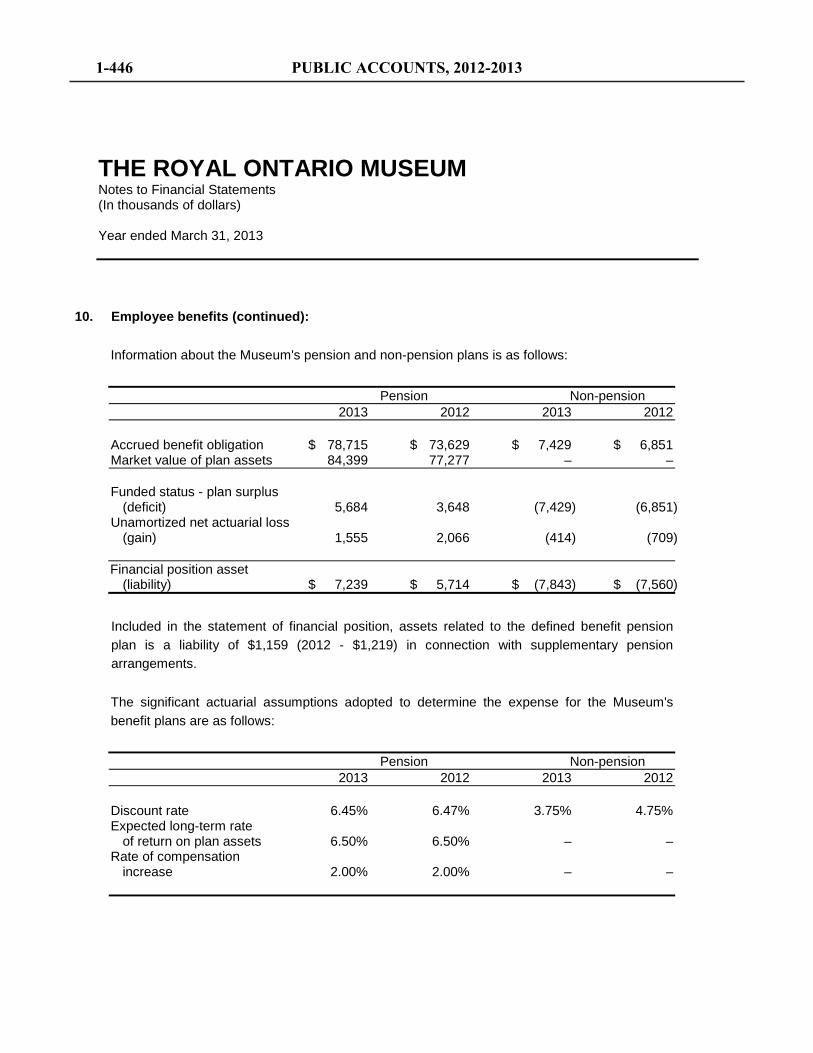
10. Employee benefits (continued):
Information about the Museum's pension and non-pension plans is as follows:
Pension Non-pension 2013 2012 2013 2012 Accrued benefit obligation $ 78,715 $ 73,629 $ 7,429 $ 6,851 Market value of plan assets 84,399 77,277 – – Funded status - plan surplus
(deficit) 5,684 3,648 (7,429) (6,851) Unamortized net actuarial loss
(gain) 1,555 2,066 (414) (709) Financial position asset
(liability) $ 7,239 $ 5,714 $ (7,843) $ (7,560)
Included in the statement of financial position, assets related to the defined benefit pension plan is a liability of $1,159 (2012 - $1,219) in connection with supplementary pension arrangements.
The significant actuarial assumptions adopted to determine the expense for the Museum's benefit plans are as follows:
Pension Non-pension 2013 2012 2013 2012 Discount rate 6.45% 6.47% 3.75% 4.75% Expected long-term rate
of return on plan assets 6.50% 6.50% – – Rate of compensation
increase 2.00% 2.00% – –
THE ROYAL ONTARIO MUSEUM Notes to Financial Statements (In thousands of dollars) Year ended March 31, 2013
1-446 PUBLIC ACCOUNTS, 2012-2013
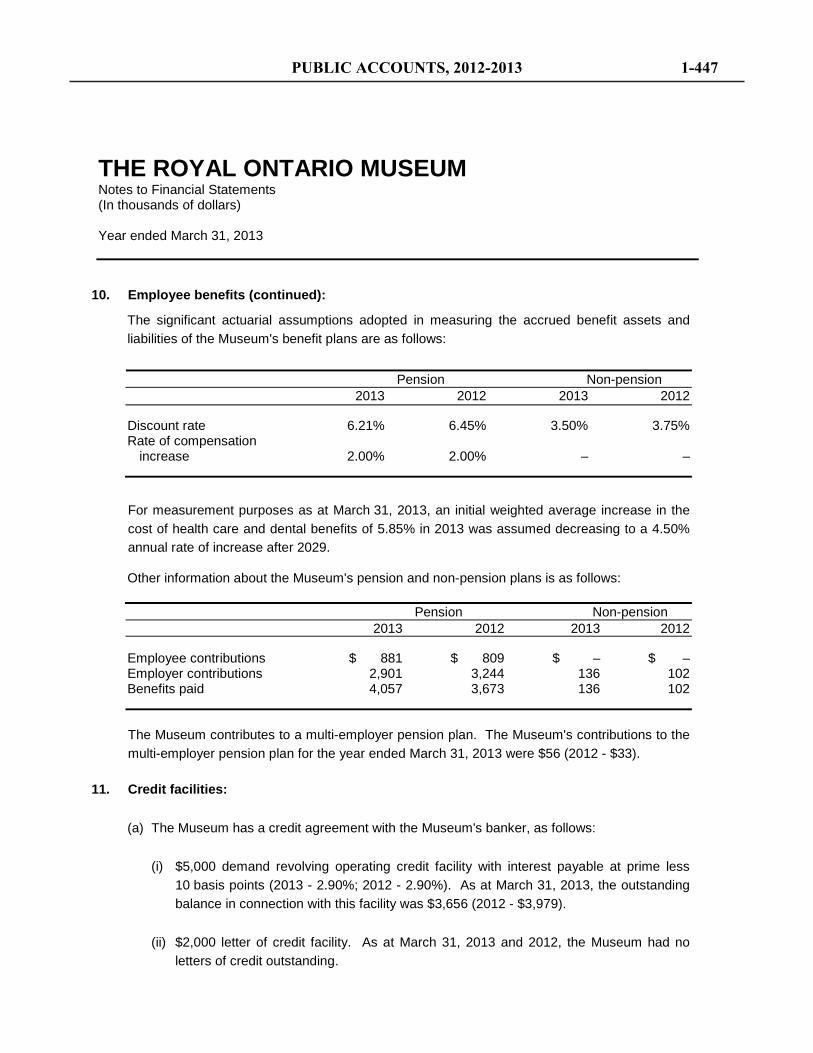
10. Employee benefits (continued):
The significant actuarial assumptions adopted in measuring the accrued benefit assets and liabilities of the Museum's benefit plans are as follows:
Pension Non-pension 2013 2012 2013 2012 Discount rate 6.21% 6.45% 3.50% 3.75% Rate of compensation
increase 2.00% 2.00% – –
For measurement purposes as at March 31, 2013, an initial weighted average increase in the cost of health care and dental benefits of 5.85% in 2013 was assumed decreasing to a 4.50% annual rate of increase after 2029.
Other information about the Museum's pension and non-pension plans is as follows: Pension Non-pension 2013 2012 2013 2012 Employee contributions $ 881 $ 809 $ – $ – Employer contributions 2,901 3,244 136 102 Benefits paid 4,057 3,673 136 102 The Museum contributes to a multi-employer pension plan. The Museum's contributions to the multi-employer pension plan for the year ended March 31, 2013 were $56 (2012 - $33).
11. Credit facilities:
(a) The Museum has a credit agreement with the Museum's banker, as follows:
(i) $5,000 demand revolving operating credit facility with interest payable at prime less 10 basis points (2013 - 2.90%; 2012 - 2.90%). As at March 31, 2013, the outstanding balance in connection with this facility was $3,656 (2012 - $3,979).
(ii) $2,000 letter of credit facility. As at March 31, 2013 and 2012, the Museum had no letters of credit outstanding.
THE ROYAL ONTARIO MUSEUM Notes to Financial Statements (In thousands of dollars) Year ended March 31, 2013
PUBLIC ACCOUNTS, 2012-2013 1-447
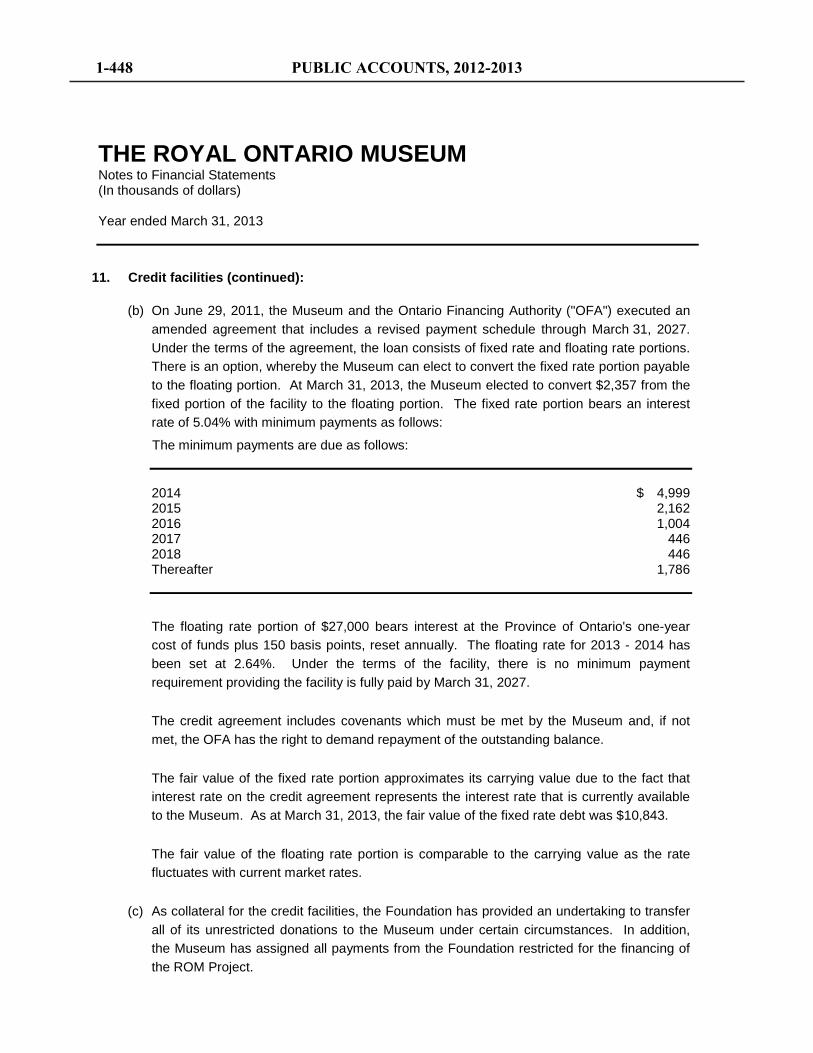
11. Credit facilities (continued):
(b) On June 29, 2011, the Museum and the Ontario Financing Authority ("OFA") executed an amended agreement that includes a revised payment schedule through March 31, 2027. Under the terms of the agreement, the loan consists of fixed rate and floating rate portions. There is an option, whereby the Museum can elect to convert the fixed rate portion payable to the floating portion. At March 31, 2013, the Museum elected to convert $2,357 from the fixed portion of the facility to the floating portion. The fixed rate portion bears an interest rate of 5.04% with minimum payments as follows:
The minimum payments are due as follows: 2014 $ 4,999 2015 2,162 2016 1,004 2017 446 2018 446 Thereafter 1,786
The floating rate portion of $27,000 bears interest at the Province of Ontario's one-year cost of funds plus 150 basis points, reset annually. The floating rate for 2013 - 2014 has been set at 2.64%. Under the terms of the facility, there is no minimum payment requirement providing the facility is fully paid by March 31, 2027.
The credit agreement includes covenants which must be met by the Museum and, if not met, the OFA has the right to demand repayment of the outstanding balance.
The fair value of the fixed rate portion approximates its carrying value due to the fact that interest rate on the credit agreement represents the interest rate that is currently available to the Museum. As at March 31, 2013, the fair value of the fixed rate debt was $10,843.
The fair value of the floating rate portion is comparable to the carrying value as the rate fluctuates with current market rates.
(c) As collateral for the credit facilities, the Foundation has provided an undertaking to transfer all of its unrestricted donations to the Museum under certain circumstances. In addition, the Museum has assigned all payments from the Foundation restricted for the financing of the ROM Project.
THE ROYAL ONTARIO MUSEUM Notes to Financial Statements (In thousands of dollars) Year ended March 31, 2013
1-448 PUBLIC ACCOUNTS, 2012-2013
12. Financial risks:
(a) Credit risk:
Credit risk refers to the risk that a counterparty may default on its contractual obligations resulting in a financial loss. The Museum is exposed to credit risk with respect to other accounts receivable. However, it does not expect counterparties to fail to meet their obligations given their high credit rating. There have been no significant changes to the credit risk exposure from 2012.
(b) Liquidity risk:
Liquidity risk is the risk that the Museum will be unable to fulfill its obligations on a timely basis or at a reasonable cost. The Museum manages its liquidity risk by monitoring its operating requirements. The Museum prepares budget and cash forecasts to ensure it has sufficient funds to fulfill its obligations. The contractual maturities of long-term debt are disclosed in note 11. There have been no significant changes to the liquidity risk exposure from 2012.
(c) Market risk:
Market risk is the risk that changes in market prices, such as foreign exchange rates or interest rates will affect the Museum's income or the value of its holdings of financial instruments. The objective of market risk management is to control market risk exposures within acceptable parameters while optimizing return on investment.
(i) Foreign exchange risk:
The Museum is exposed to financial risks as a result of exchange rate fluctuations and the volatility of these rates with respect to contractual obligations payable in foreign currencies.
THE ROYAL ONTARIO MUSEUM Notes to Financial Statements (In thousands of dollars) Year ended March 31, 2013
PUBLIC ACCOUNTS, 2012-2013 1-449
12. Financial risks (continued):
(ii) Interest rate risk:
Interest rate risk is the risk that the fair value of future cash flows or a financial instrument will fluctuate because of changes in the market interest rates. Financial assets and financial liabilities with variable interest rates expose the Museum to cash flow interest rate risk. The Museum is exposed to this risk through its interest-bearing long-term debt, which has fixed and floating rate portions. The Museum mitigates interest rate risk by entering into derivative financial instruments from time to time, as well as by holding primarily debt issued by the financial institutions. There has been no change to the interest rate risk exposure from 2012.
13. Commitments:
The Museum's future commitments under long-term leases for equipment are as follows:
2014 $ 266 2015 266 2016 266 2017 260 2018 254
THE ROYAL ONTARIO MUSEUM Notes to Financial Statements (In thousands of dollars) Year ended March 31, 2013
1-450 PUBLIC ACCOUNTS, 2012-2013
Grant Thornton LLP Suite 200 41 Valleybrook Drive Toronto, ON M3B 2S6
T +1 416 449 9171 F +1 416 449 7401 E [email protected] www.GrantThornton.ca
Audit • Tax • Advisory Grant Thornton LLP. A Canadian Member of Grant Thornton International Ltd
1
Independent Auditor’s Report
To the Board of Directors of the Toronto Organizing Committee for the 2015 Pan American and Parapan American Games We have audited the accompanying financial statements of the Toronto Organizing Committee for the 2015 Pan American and Parapan American Games, which comprise the statement of financial position as at March 31, 2013, and the statements of operating activities and changes in fund balance, venue development activities and changes in fund balance and cash flows for the year then ended, and a summary of the significant accounting policies and other explanatory information. Management’s responsibility for the financial statements Management is responsible for the preparation and fair presentation of these financial statements in accordance with Canadian accounting standards for not-for-profit organizations, and for such internal control as management determines is necessary to enable the preparation of financial statements that are free from material misstatement, whether due to fraud or error. Auditor’s responsibility Our responsibility is to express an opinion on these financial statements based on our audit. We conducted our audit in accordance with Canadian generally accepted auditing standards. Those standards require that we comply with ethical requirements and plan and perform the audit to obtain reasonable assurance about whether the financial statements are free from material misstatement. An audit involves performing procedures to obtain audit evidence about the amounts and disclosures in the financial statements. The procedures selected depend on the auditor’s judgment, including the assessment of the risks of material misstatement of the financial statements, whether due to fraud or error. In making those risk assessments, the auditor considers internal control relevant to the entity’s preparation and fair presentation of the financial statements in order to design audit procedures that are appropriate in the circumstances, but not for the purpose of expressing an opinion on the effectiveness of the entity’s internal control. An audit also includes evaluating the appropriateness of accounting policies used and the reasonableness of accounting estimates made by management, as well as evaluating the overall presentation of the financial statements.
4
Toronto Organizing Committee for the 2015 Pan American and Parapan American Games
PUBLIC ACCOUNTS, 2012-2013 1-451
Independent Auditor’s Report (continued)
2
We believe that the audit evidence we have obtained is sufficient and appropriate to provide a basis for our audit opinion. Opinion In our opinion, the financial statements present fairly, in all material respects, the financial position of the Toronto Organizing Committee for the 2015 Pan American and Parapan American Games, as at March 31, 2013, and the results of its operations and its cash flows for the year then ended in accordance with Canadian accounting standards for not-for-profit organizations. Toronto, Canada Chartered Accountants June 27, 2013 Licensed Public Accountants
1-452 PUBLIC ACCOUNTS, 2012-2013
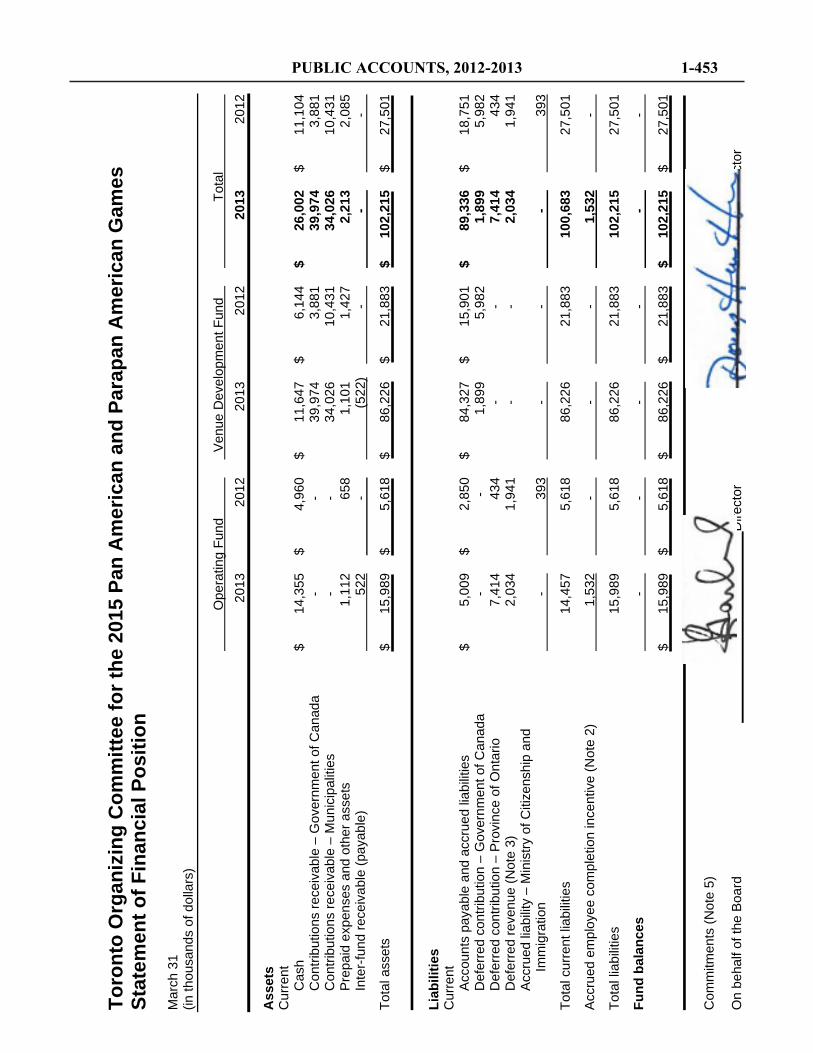
3 To
ront
o O
rgan
izin
g C
omm
ittee
for t
he 2
015
Pan
Am
eric
an a
nd P
arap
an A
mer
ican
Gam
es
Stat
emen
t of F
inan
cial
Pos
ition
M
arch
31
(in th
ousa
nds
of d
olla
rs)
Ope
ratin
g Fu
nd
V
enue
Dev
elop
men
t Fun
d
Tota
l
2013
2012
2013
2012
2013
2012
A
sset
s C
urre
nt
C
ash
$ 14
,355
$
4,96
0 $
11,6
47
$ 6,
144
$ 26
,002
$
11,1
04
C
ontri
butio
ns re
ceiv
able
– G
over
nmen
t of C
anad
a
-
-
39,9
74
3,
881
39
,974
3,88
1
Con
tribu
tions
rece
ivab
le –
Mun
icip
aliti
es
-
-
34
,026
10,4
31
34
,026
10,4
31
P
repa
id e
xpen
ses
and
othe
r ass
ets
1,
112
65
8
1,10
1
1,42
7
2,21
3
2,08
5
Inte
r-fu
nd re
ceiv
able
(pay
able
)
522
-
(5
22)
-
-
-
Tota
l ass
ets
$
15,9
89
$ 5,
618
$ 86
,226
$
21,8
83
$ 10
2,21
5 $
27,5
01
Li
abili
ties
Cur
rent
Acc
ount
s pa
yabl
e an
d ac
crue
d lia
bilit
ies
$ 5,
009
$ 2,
850
$ 84
,327
$
15,9
01
$ 89
,336
$
18,7
51
D
efer
red
cont
ribut
ion
– G
over
nmen
t of C
anad
a
-
-
1,89
9
5,98
2
1,89
9
5,98
2
Def
erre
d co
ntrib
utio
n –
Pro
vinc
e of
Ont
ario
7,41
4
434
-
-
7,
414
43
4
Def
erre
d re
venu
e (N
ote
3)
2,
034
1,
941
-
-
2,
034
1,
941
A
ccru
ed li
abilit
y –
Min
istry
of C
itize
nshi
p an
d
Imm
igra
tion
-
39
3
-
-
-
393
Tota
l cur
rent
liab
ilitie
s
14,4
57
5,
618
86
,226
21,8
83
1
00,6
83
27
,501
A
ccru
ed e
mpl
oyee
com
plet
ion
ince
ntiv
e (N
ote
2)
1,
532
-
-
-
1,
532
-
Tota
l lia
bilit
ies
15
,989
5,61
8
86,2
26
21
,883
102,
215
27
,501
Fu
nd b
alan
ces
-
-
-
-
-
-
$
15,9
89
$ 5,
618
$ 86
,226
$
21,8
83
$ 10
2,21
5 $
27,5
01
Com
mitm
ents
(Not
e 5)
O
n be
half
of th
e B
oard
Dire
ctor
Dire
ctor
PUBLIC ACCOUNTS, 2012-2013 1-453
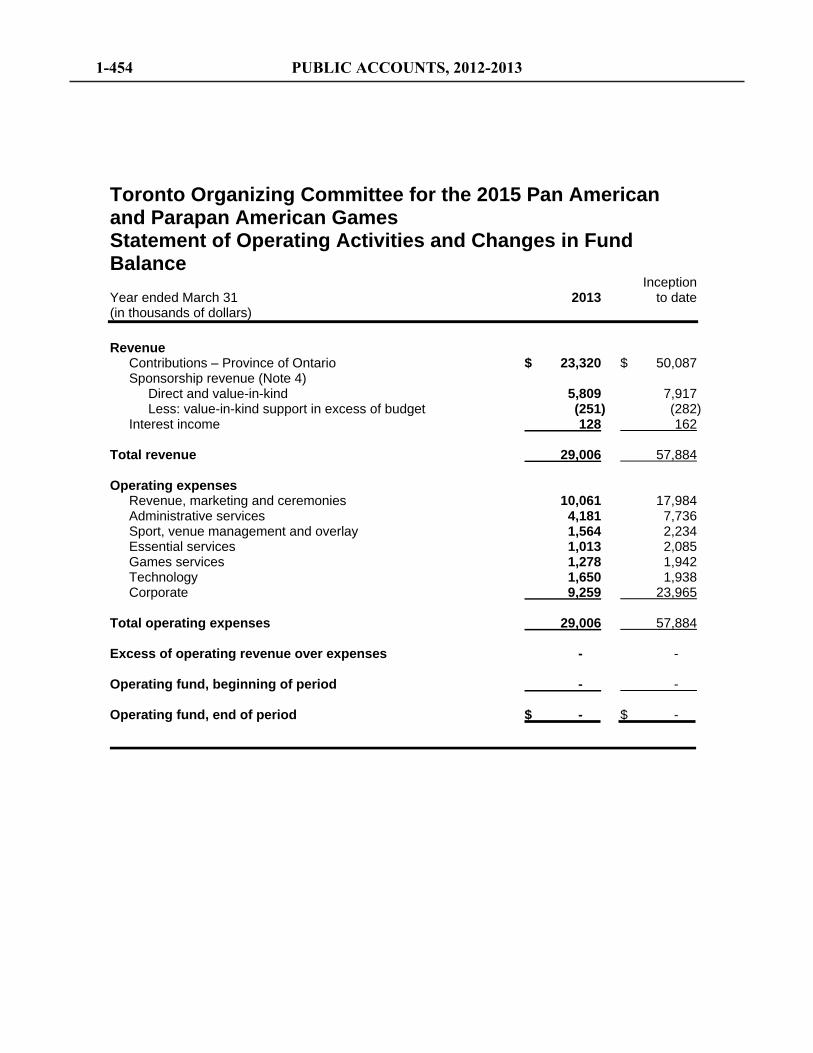
4
Toronto Organizing Committee for the 2015 Pan American and Parapan American Games Statement of Operating Activities and Changes in Fund Balance Inception Year ended March 31 2013 to date (in thousands of dollars) Revenue Contributions – Province of Ontario $ 23,320 $ 50,087 Sponsorship revenue (Note 4) Direct and value-in-kind 5,809 7,917 Less: value-in-kind support in excess of budget (251) (282) Interest income 128 162 Total revenue 29,006 57,884 Operating expenses Revenue, marketing and ceremonies 10,061 17,984 Administrative services 4,181 7,736 Sport, venue management and overlay 1,564 2,234 Essential services 1,013 2,085 Games services 1,278 1,942 Technology 1,650 1,938 Corporate 9,259 23,965 Total operating expenses 29,006 57,884 Excess of operating revenue over expenses - - Operating fund, beginning of period - - Operating fund, end of period $ - $ -
1-454 PUBLIC ACCOUNTS, 2012-2013
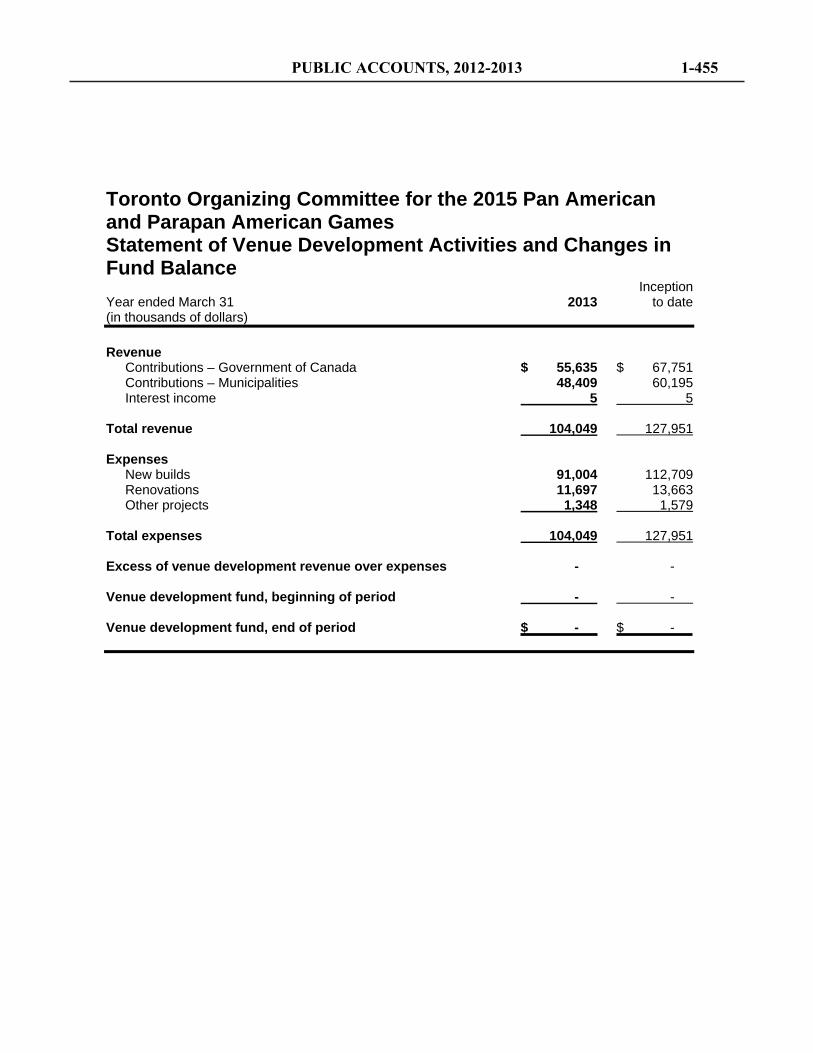
5
Toronto Organizing Committee for the 2015 Pan American and Parapan American Games Statement of Venue Development Activities and Changes in Fund Balance Inception Year ended March 31 2013 to date (in thousands of dollars) Revenue Contributions – Government of Canada $ 55,635 $ 67,751 Contributions – Municipalities 48,409 60,195 Interest income 5 5 Total revenue 104,049 127,951 Expenses New builds 91,004 112,709 Renovations 11,697 13,663 Other projects 1,348 1,579 Total expenses 104,049 127,951 Excess of venue development revenue over expenses - - Venue development fund, beginning of period - - Venue development fund, end of period $ - $ -
PUBLIC ACCOUNTS, 2012-2013 1-455
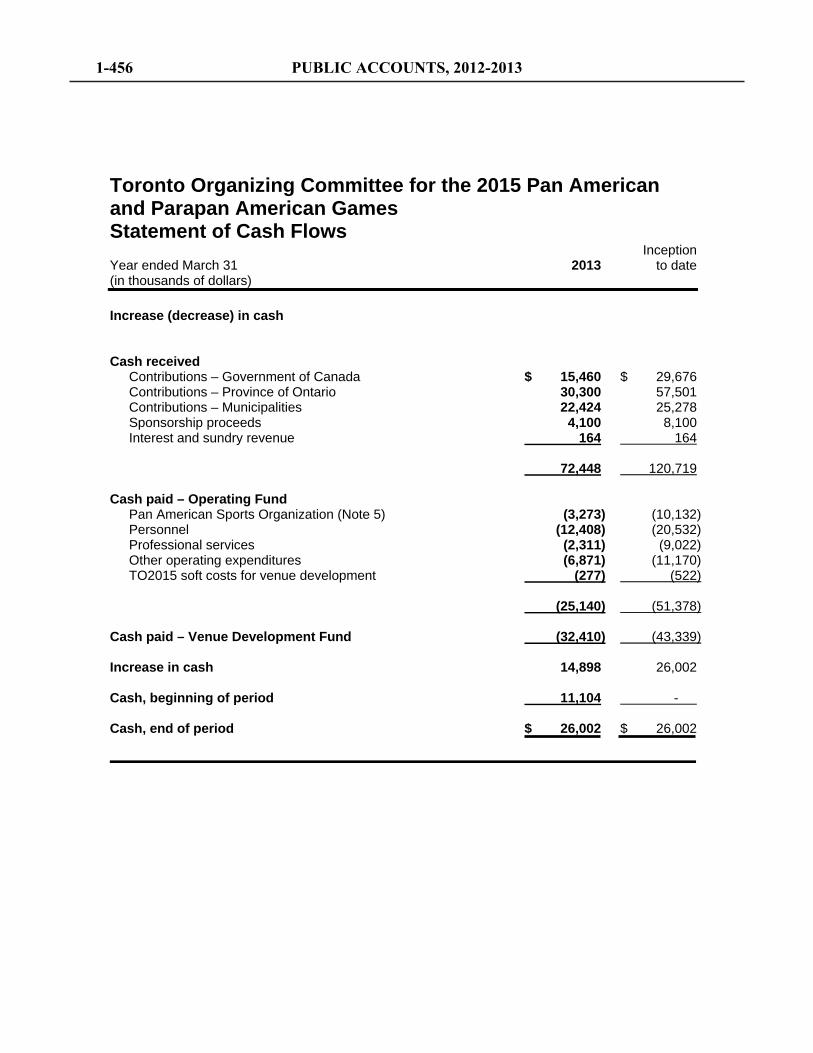
6
Toronto Organizing Committee for the 2015 Pan American and Parapan American Games Statement of Cash Flows Inception Year ended March 31 2013 to date (in thousands of dollars) Increase (decrease) in cash Cash received Contributions – Government of Canada $ 15,460 $ 29,676 Contributions – Province of Ontario 30,300 57,501 Contributions – Municipalities 22,424 25,278 Sponsorship proceeds 4,100 8,100 Interest and sundry revenue 164 164 72,448 120,719 Cash paid – Operating Fund Pan American Sports Organization (Note 5) (3,273) (10,132) Personnel (12,408) (20,532) Professional services (2,311) (9,022) Other operating expenditures (6,871) (11,170) TO2015 soft costs for venue development (277) (522) (25,140) (51,378) Cash paid – Venue Development Fund (32,410) (43,339) Increase in cash 14,898 26,002 Cash, beginning of period 11,104 - Cash, end of period $ 26,002 $ 26,002
1-456 PUBLIC ACCOUNTS, 2012-2013
Toronto Organizing Committee for the 2015 Pan American and Parapan American Games Notes to Financial Statements March 31, 2013 (in thousands of dollars)
7
1. Organization On November 6th 2009, the City of Toronto, Ontario (ON), Canada, was awarded the right to host the 2015 Pan American and ParaPan American Games (the “Games”) by the Pan American Sports Organization (PASO) based in part upon the efforts of the Toronto 2015 Bid Corporation (BIDCO). The Games will be staged in Toronto and the Greater Golden Horseshoe Area from July 10th to July 26th, 2015 and August 7th to August 14th, 2015, respectively. Toronto Organizing Committee for the 2015 Pan American and Parapan American Games (TO2015) was incorporated by Letters Patent pursuant to the Corporations Act (Ontario) on January 21, 2010 (date of inception) and is a corporation without share capital. TO2015 is exempt from income taxes under the Income Tax Act (Canada). TO2015 is governed by a Board of Directors consisting of twelve members. Three of these members are appointed by the Government of Canada; three are appointed by the Province of Ontario; one is appointed by the City of Toronto; four are appointed by the Canadian Olympic Committee (COC), and one by the Canadian Paralympic Committee (CPC). TO2015’s primary purpose is to plan, organize, finance, promote and stage the Games. The Multi-Party agreement (MPA) which is between the Government of Canada, the Province of Ontario, the City of Toronto, the COC, the CPC, and TO2015, outlines the rights and obligations of each party to the agreement with respect to the funding and staging of the Games. TO2015 will execute its purpose through the terms of the following key agreements: • The Host City agreement establishes the rights and obligations of PASO, COC and TO2015. • The Joint Marketing Programme Agreement between the COC, the Province of Ontario and
TO2015 establishes the rights and obligations pertaining to marketing and sponsorship activities.
• The 2015 Pan Parapan American Games Ontario Support Agreement between the Province of Ontario, the City of Toronto and TO2015 establishing the rights and obligations pertaining to operational funding.
• The Transfer Payment Agreement (TPA) between the Province of Ontario and TO2015 establishes the rights and obligations pertaining to the Operating Fund.
• The Hosting Program Contribution Agreement between the Government of Canada and TO2015 establishes the rights and obligations pertaining to the Venue Development Fund.
PUBLIC ACCOUNTS, 2012-2013 1-457
Toronto Organizing Committee for the 2015 Pan American and Parapan American Games Notes to Financial Statements March 31, 2013 (in thousands of dollars)
8
2. Summary of significant accounting policies These financial statements have been prepared in accordance with Canadian accounting standards for not-for-profit organizations (ASNPO) in Canadian dollars, applied within the framework of the significant accounting policies summarized below: Use of estimates The preparation of TO2015’s financial statements in accordance with ASNPO requires management to make estimates and assumptions. These estimates and assumptions affect the reported amounts of assets and liabilities and the disclosure of contingent assets and liabilities at the date of the financial statements and the reported amounts of revenue and expenses during the reporting period. The most significant estimates made by management are the assessment of percentage of completion of the venue development projects as at each fiscal year end, and the fair value of value-in-kind goods and services received. Actual results could differ from those estimates. Fund accounting The financial statements have been prepared in accordance with the restricted fund method of accounting. Receipt and use of resources restricted to venue development are recorded in the Venue Development Fund. All other activity is recorded in the Operating Fund. Venue Development Fund TO2015’s responsibility is to ensure that the Pan American and Parapan American venues (“Games Venues”) are available and meet specified standards for use during the Games. TO2015 enters into various agreements regarding the development and use of the required Games Venues. TO2015 has no ownership interest in these Games Venues. The Venue Development Fund is established to record the receipt and use of resources that are designated for the development of the Games Venues. Revenue is recognized in the period it is earned. Contributions and hard cost construction expenditures are recognized using the percentage-of-completion method, when the expenditures incurred to date can be estimated reliably. Operating Fund Revenue and expenses of TO2015 not related to venue development activity are recorded in the Operating Fund. Unrestricted contributions are recognized as revenue in the period that they are received or receivable, if the amount to be received can be reasonably estimated and collection is reasonably assured. Restricted contributions related to operating activities are recognized as revenue in the period in which the related expenditure is incurred. Interest revenue is recognized in the period earned.
1-458 PUBLIC ACCOUNTS, 2012-2013
Toronto Organizing Committee for the 2015 Pan American and Parapan American Games Notes to Financial Statements March 31, 2013 (in thousands of dollars)
9
2. Summary of significant accounting policies (continued) Direct sponsorship revenue Direct sponsorship revenue is cash acquired by TO2015 under domestic sponsorship arrangements in exchange for value awarded to a sponsor (e.g., venue naming rights, brand partnering). Management has assumed that value provided in exchange for cash is awarded over the term of the contract. Therefore, revenue recognition of cash sponsorship is spread evenly over the term of the contract to match the value provided. Value in Kind (VIK) goods and services VIK goods and services are acquired by TO2015 under international or domestic sponsorship arrangements or are donated to TO2015 for no consideration. VIK are recognized in the financial statements when the goods and services are consumed by TO2015 in the normal course of operations and would otherwise have been purchased, and when a fair value can be reasonably estimated. They are recorded at the lesser of the amount reflected in the budget or fair market value. Employee Completion Incentive Plan TO2015 established an Employee Completion Incentive Plan (“Completion Incentive”) to support the retention of key senior employees through to the end of the term of their employment agreements. The Completion Incentive is being recognized evenly over the term of the employment agreements. Financial instruments TO2015’s financial instruments consist of cash, contribution receivable, accounts payable, and accrued employee completion incentive payable. Cash is stated at fair value. The carrying value of contributions receivable and accounts payable approximate fair value due to their short-term maturities. The accrued employee completion incentive payable is recorded at amortized cost. Foreign currency translation Revenue and expenses are translated at the exchange rates prevailing on the transaction dates. Realized exchange gains and losses are included in the statement of operating activities.
PUBLIC ACCOUNTS, 2012-2013 1-459
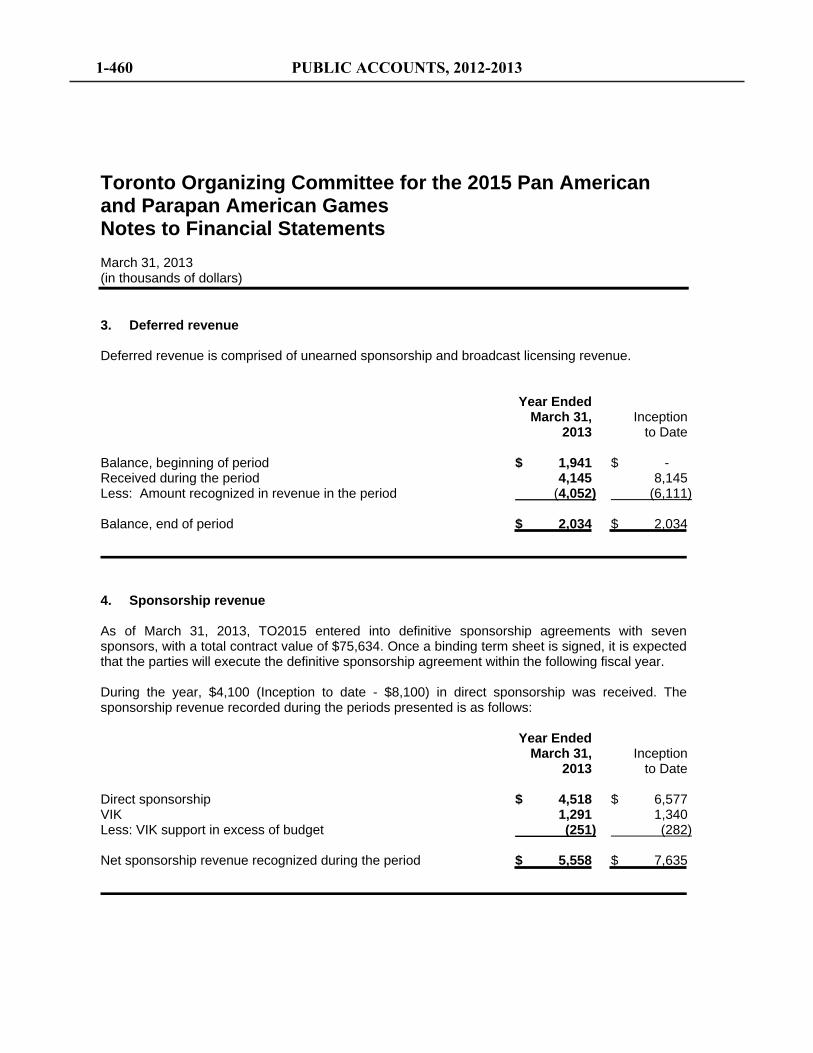
Toronto Organizing Committee for the 2015 Pan American and Parapan American Games Notes to Financial Statements March 31, 2013 (in thousands of dollars)
10
3. Deferred revenue Deferred revenue is comprised of unearned sponsorship and broadcast licensing revenue. Year Ended March 31, Inception 2013 to Date Balance, beginning of period $ 1,941 $ - Received during the period 4,145 8,145 Less: Amount recognized in revenue in the period (4,052) (6,111) Balance, end of period $ 2,034 $ 2,034
4. Sponsorship revenue As of March 31, 2013, TO2015 entered into definitive sponsorship agreements with seven sponsors, with a total contract value of $75,634. Once a binding term sheet is signed, it is expected that the parties will execute the definitive sponsorship agreement within the following fiscal year. During the year, $4,100 (Inception to date - $8,100) in direct sponsorship was received. The sponsorship revenue recorded during the periods presented is as follows: Year Ended March 31, Inception 2013 to Date Direct sponsorship $ 4,518 $ 6,577 VIK 1,291 1,340 Less: VIK support in excess of budget (251) (282) Net sponsorship revenue recognized during the period $ 5,558 $ 7,635
1-460 PUBLIC ACCOUNTS, 2012-2013
Toronto Organizing Committee for the 2015 Pan American and Parapan American Games Notes to Financial Statements March 31, 2013 (in thousands of dollars)
11
5. Commitments PASO commitment Pursuant to the Host City Agreement (“Agreement”) with PASO, TO2015 is required to pay a total of US$20,000 in six equal instalments on April 30 of each year in exchange for all rights with respect to the marketing and domestic broadcasting and ticket sales program related to the Games. The Agreement outlines other requirements and payments that TO2015 will be responsible for including expense reimbursements for costs incurred by PASO officials for the Games and the portion of the ticket sale revenue from the Games. During the period, TO2015 paid $3,273 (US$3,333) (Inception to date - $10,132) to PASO as part of the Agreement. This amount represents the third instalment of the US$20,000 commitment. Operating lease commitment Future minimum annual obligations under premises and equipment lease (excluding operating costs) at 25 Dockside Drive, Toronto to December 31, 2015 are estimated as follows: 2014 $ 1,900 2015 2,200 2016 1,800 Other operating and venue development commitments TO2015 has entered into various contracts for goods and services related to the planning and staging of the Games and for the development of venue sites during the Games. As of March 31, 2013, TO2015 has outstanding commitments related to the Operating Fund of approximately $17,586, and $283,000 related to the Venue Development Fund. These commitments will be disbursed at various times leading up to the Games.
6. Credit facility TO2015 has a line of credit facility in place with the Ontario Infrastructure Projects Corporation (OIPC) to provide working capital and for general operating requirements. The maximum available credit under the facility is $10 million. The term of the facility is for one year from March 17, 2012 with automatic yearly renewal up to December 31, 2015. The rate of interest is variable as determined on a monthly basis by the OIPC. The facility is unsecured except that the Minister of Finance may deduct from any monies owing to TO2015 any amounts that TO2015 fails to repay to OIPC. The facility has not been drawn on during the fiscal year.
PUBLIC ACCOUNTS, 2012-2013 1-461
Toronto Organizing Committee for the 2015 Pan American and Parapan American Games Notes to Financial Statements March 31, 2013 (in thousands of dollars)
12
7. Financial instruments TO2015 has a risk management framework to monitor, evaluate and manage the principal risks assumed with its financial instruments. The risks that arise from financial instruments include credit, liquidity, market, and foreign currency risks. Credit risk Credit risk is the risk that one party to a financial instrument will cause a financial loss for another party by failing to discharge an obligation. TO2015 is exposed to credit risk in the event of the non-performance by counterparties in connection with its contributions receivable from the Government of Canada and Municipalities. Given the sources of these receivables, it is management’s opinion that it is not exposed to significant credit risk related to these contributions receivable. TO2015 depends on the Government of Canada, Province of Ontario and Municipal contributions for its operations. These grants represent 96% (Inception to date – 96%) of its revenue during the current period. Liquidity risk Liquidity risk is the risk that TO2015 may encounter difficulty in meeting its obligations associated with its financial liabilities as they become due. It is management’s opinion that it is not exposed to significant liquidity risks arising from its financial instruments. Market risk Market risk is the risk that changes in the market interest rate, or other changes in market prices will affect the value of the financial instruments or their related cash flows. Given the nature of the TO2015’s financial instruments, it is management’s opinion that it is not exposed to significant risks related to market interest rate and other changes in market prices arising from its financial instruments. Foreign currency risk TO2015 is exposed to foreign currency risk with respect to its commitment to pay PASO as the commitment is in US dollars.
1-462 PUBLIC ACCOUNTS, 2012-2013
Management’s Responsibility for theFinancial StatementsJune 26, 2013
The integrity and objectivity of the accompanying financial statements of the Toronto Waterfront Revitalization Corporation (“the Corporation”) is the responsibility of management. These financial statements have been prepared in accordance with Canadian generally accepted accounting principles for not-for-profit organizations established by the Canadian Institute of Chartered Accountants. Significant accounting policies of the Corporation are described in Note 2 to financial statements.
Management is also responsible for maintaining a system of internal controls designed to provide reasonable assurance that assets are safeguarded, transactions are properly authorized and recorded, and reliable financial information is available on a timely basis for the preparation of the financial statements.
Management meets with the external auditors, the Finance, Audit and Risk Management Committee and the Board of Directors to review the financial statements and discuss any significant financial reporting or internal control matters prior to approval of the financial statements.
The financial statements have been audited by BDO Canada LLP, the independent external auditors appointed by the Board of Directors. The accompanying Independent Auditor’s Report outlines Management’s responsibilities, the auditor’s responsibilities, the scope of its examination and its opinion on the Corporation’s financial statements.
PUBLIC ACCOUNTS, 2012-2013 1-463
BDO Canada LLP, a Canadian limited liability partnership, is a member of BDO International Limited, a UK company limited by guarantee, and forms part of the international BDO network of independent member firms
Tel: 905 270-7700 Fax: 905 270-7915 Toll-free: 866 248 6660 www.bdo.ca
BDO Canada LLP 1 City Centre Drive, Suite 1700 Mississauga ON L5B 1M2 Canada
Independent Auditor's Report To the Board of Directors of Toronto Waterfront Revitalization Corporation We have audited the accompanying financial statements of Toronto Waterfront Revitalization Corporation, which comprise the statements of financial position as at March 31, 2013, March 31, 2012 and April 1, 2011, and the statements of financial activities, remeasurement gains and losses, changes in net assets and cash flows for the years ended March 31, 2013 and March 31, 2012, and a summary of significant accounting policies and other explanatory information.
Management's Responsibility for the Financial Statements Management is responsible for the preparation and fair presentation of these financial statements in accordance with Canadian public sector accounting standards for not-for-profit organizations, and for such internal control as management determines is necessary to enable the preparation of financial statements that are free from material misstatement, whether due to fraud or error.
Auditor's Responsibility Our responsibility is to express an opinion on these financial statements based on our audits. We conducted our audits in accordance with Canadian generally accepted auditing standards. Those standards require that we comply with ethical requirements and plan and perform the audits to obtain reasonable assurance about whether the financial statements are free from material misstatement.
An audit involves performing procedures to obtain audit evidence about the amounts and disclosures in the financial statements. The procedures selected depend on the auditors' judgment, including the assessment of the risks of material misstatement of the financial statements, whether due to fraud or error. In making those risk assessments, the auditor considers internal control relevant to the entity's preparation and fair presentation of the financial statements in order to design audit procedures that are appropriate in the circumstances, but not for the purpose of expressing an opinion on the effectiveness of the entity's internal control. An audit also includes evaluating the appropriateness of accounting policies used and the reasonableness of accounting estimates made by management, as well as evaluating the overall presentation of the financial statements.
We believe that the audit evidence we have obtained is sufficient and appropriate to provide a basis for our audit opinion.
Opinion In our opinion, the financial statements present fairly, in all material respects, the financial position of Toronto Waterfront Revitalization Corporation as at March 31, 2013, March 31, 2012, and April 1, 2011 and the results of its operations, its remeasurement gains and losses and its cash flows for the years ended March 31, 2013 and March 31, 2012, in accordance with Canadian public sector accounting standards for not-for-profit organizations.
Chartered Accountants, Licensed Public Accountants Mississauga, Ontario June 26, 2013
1-464 PUBLIC ACCOUNTS, 2012-2013
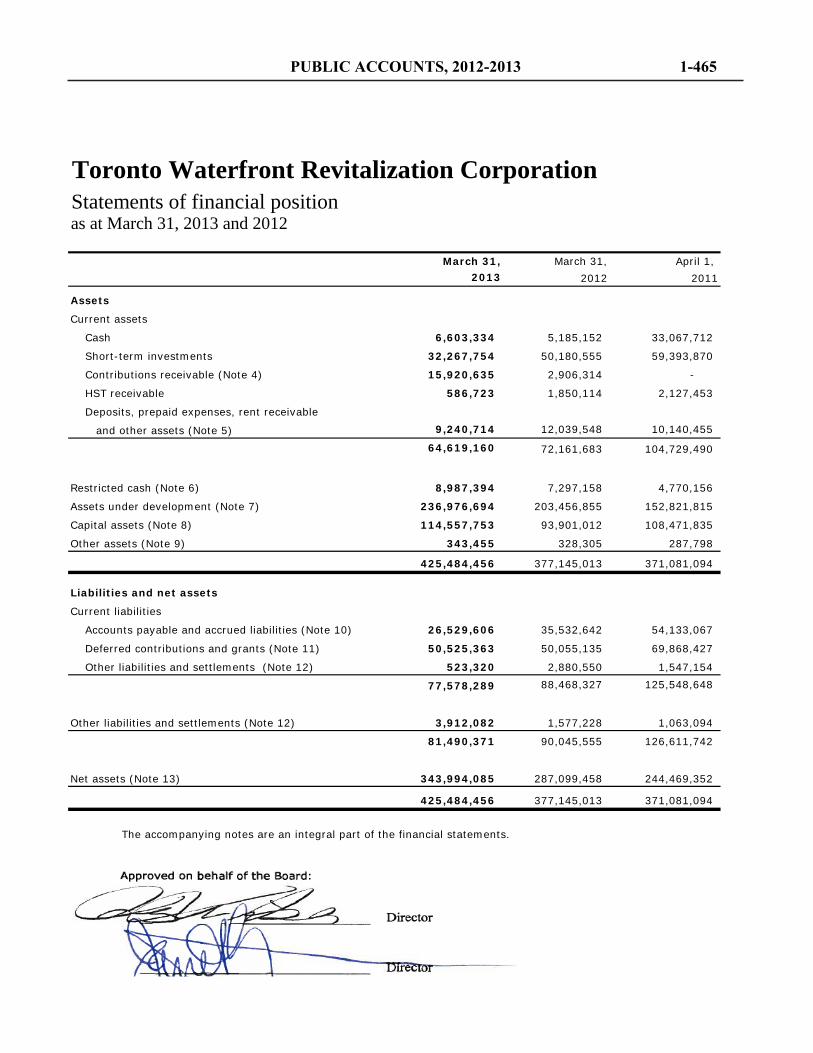
Toronto Waterfront Revitalization CorporationStatements of financial positionas at March 31, 2013 and 2012
March 31, March 31, April 1, 2013 2012 2011
Assets
Current assets
Cash 6,603,334 5,185,152 33,067,712
Short-term investments 32,267,754 50,180,555 59,393,870
Contributions receivable (Note 4) 15,920,635 2,906,314 -
HST receivable 586,723 1,850,114 2,127,453
Deposits, prepaid expenses, rent receivable
and other assets (Note 5) 9,240,714 12,039,548 10,140,455
64,619,160 72,161,683 104,729,490
Restricted cash (Note 6) 8,987,394 7,297,158 4,770,156
Assets under development (Note 7) 236,976,694 203,456,855 152,821,815
Capital assets (Note 8) 114,557,753 93,901,012 108,471,835
Other assets (Note 9) 343,455 328,305 287,798
425,484,456 377,145,013 371,081,094
Liabilities and net assets
Current liabilities
Accounts payable and accrued liabilities (Note 10) 26,529,606 35,532,642 54,133,067
Deferred contributions and grants (Note 11) 50,525,363 50,055,135 69,868,427
Other liabilities and settlements (Note 12) 523,320 2,880,550 1,547,154
77,578,289 88,468,327 125,548,648
Other liabilities and settlements (Note 12) 3,912,082 1,577,228 1,063,094
81,490,371 90,045,555 126,611,742
Net assets (Note 13) 343,994,085 287,099,458 244,469,352
425,484,456 377,145,013 371,081,094
The accompanying notes are an integral part of the financial statements.
PUBLIC ACCOUNTS, 2012-2013 1-465
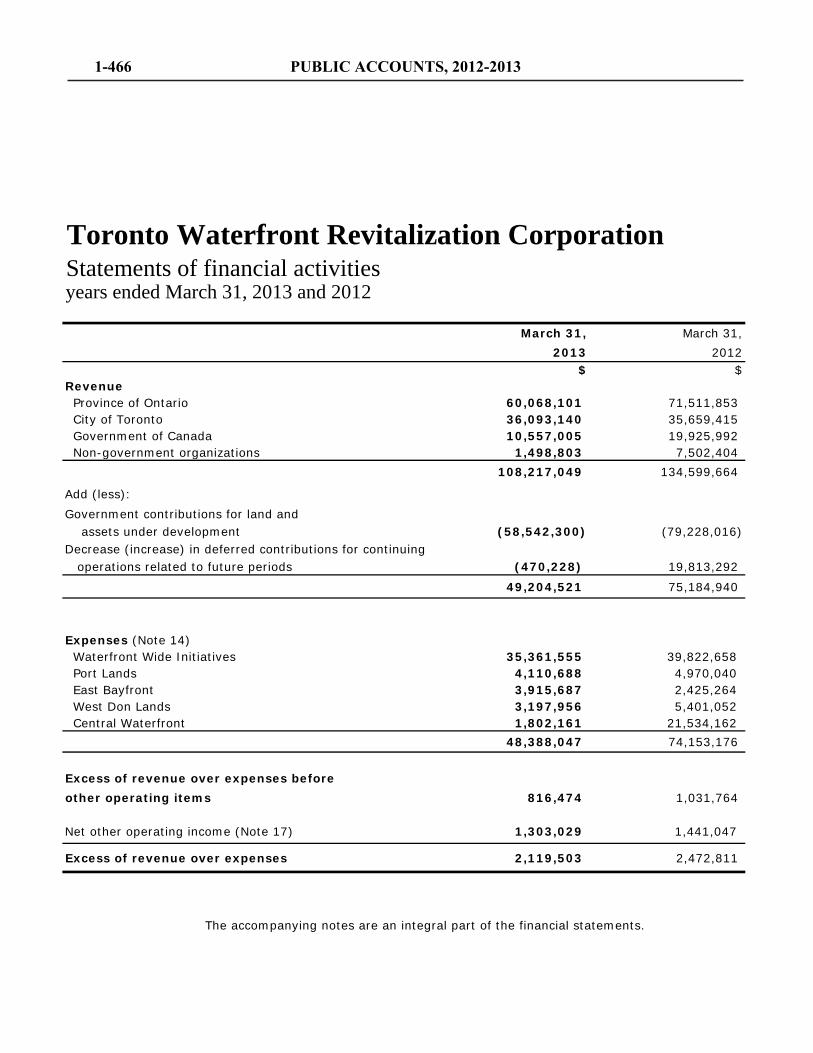
Toronto Waterfront Revitalization CorporationStatements of financial activitiesyears ended March 31, 2013 and 2012
March 31, March 31,2013 2012
$ $Revenue Province of Ontario 60,068,101 71,511,853 City of Toronto 36,093,140 35,659,415 Government of Canada 10,557,005 19,925,992 Non-government organizations 1,498,803 7,502,404
108,217,049 134,599,664
Add (less):Government contributions for land and assets under development (58,542,300) (79,228,016)Decrease (increase) in deferred contributions for continuing operations related to future periods (470,228) 19,813,292
49,204,521 75,184,940
Expenses (Note 14) Waterfront Wide Initiatives 35,361,555 39,822,658 Port Lands 4,110,688 4,970,040 East Bayfront 3,915,687 2,425,264 West Don Lands 3,197,956 5,401,052 Central Waterfront 1,802,161 21,534,162
48,388,047 74,153,176
Excess of revenue over expenses beforeother operating items 816,474 1,031,764
Net other operating income (Note 17) 1,303,029 1,441,047
Excess of revenue over expenses 2,119,503 2,472,811
The accompanying notes are an integral part of the financial statements.
1-466 PUBLIC ACCOUNTS, 2012-2013
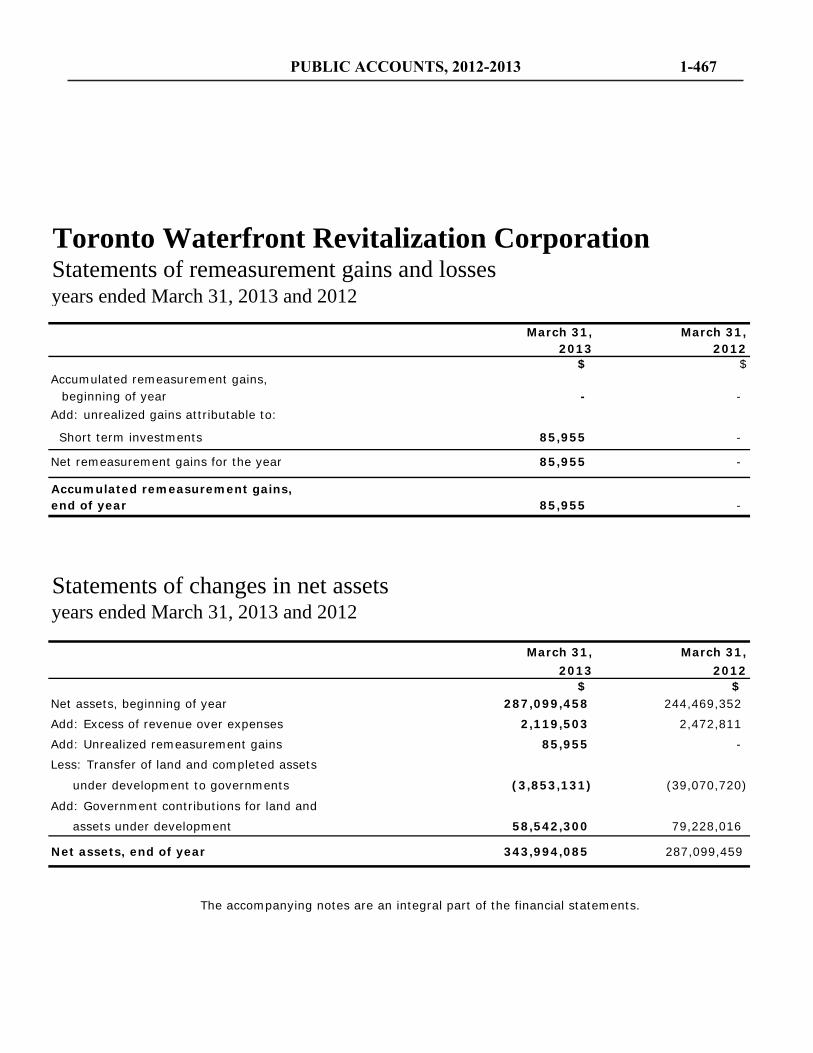
Toronto Waterfront Revitalization CorporationStatements of remeasurement gains and lossesyears ended March 31, 2013 and 2012
March 31, March 31,2013 2012
$ $Accumulated remeasurement gains,
beginning of year - - Add: unrealized gains attributable to:
Short term investments 85,955 -
Net remeasurement gains for the year 85,955 -
Accumulated remeasurement gains,end of year 85,955 -
Statements of changes in net assetsyears ended March 31, 2013 and 2012
March 31, March 31,2013 2012
$ $Net assets, beginning of year 287,099,458 244,469,352
Add: Excess of revenue over expenses 2,119,503 2,472,811
Add: Unrealized remeasurement gains 85,955 -
Less: Transfer of land and completed assets
under development to governments (3,853,131) (39,070,720)
Add: Government contributions for land and
assets under development 58,542,300 79,228,016
Net assets, end of year 343,994,085 287,099,459
The accompanying notes are an integral part of the financial statements.
PUBLIC ACCOUNTS, 2012-2013 1-467
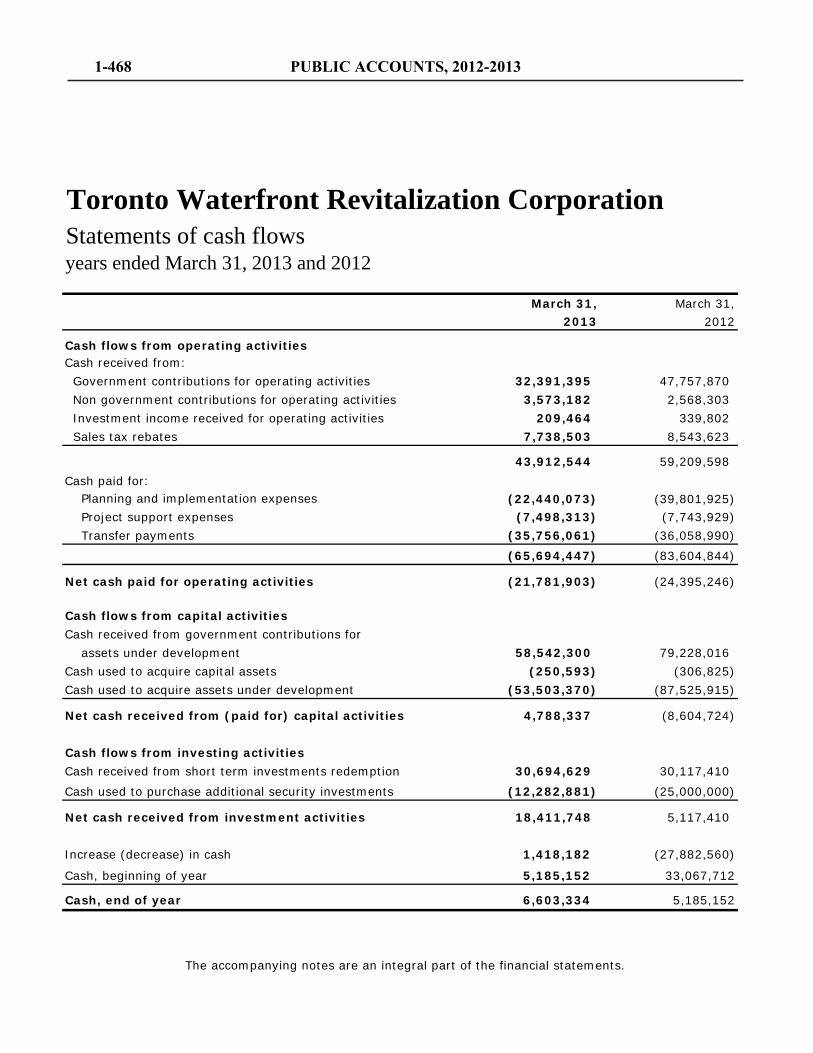
Toronto Waterfront Revitalization CorporationStatements of cash flowsyears ended March 31, 2013 and 2012
March 31, March 31,2013 2012
Cash flows from operating activitiesCash received from: Government contributions for operating activities 32,391,395 47,757,870 Non government contributions for operating activities 3,573,182 2,568,303 Investment income received for operating activities 209,464 339,802 Sales tax rebates 7,738,503 8,543,623
43,912,544 59,209,598 Cash paid for: Planning and implementation expenses (22,440,073) (39,801,925) Project support expenses (7,498,313) (7,743,929) Transfer payments (35,756,061) (36,058,990)
(65,694,447) (83,604,844)
Net cash paid for operating activities (21,781,903) (24,395,246)
Cash flows from capital activitiesCash received from government contributions for assets under development 58,542,300 79,228,016 Cash used to acquire capital assets (250,593) (306,825) Cash used to acquire assets under development (53,503,370) (87,525,915)
Net cash received from (paid for) capital activities 4,788,337 (8,604,724)
Cash flows from investing activitiesCash received from short term investments redemption 30,694,629 30,117,410
Cash used to purchase additional security investments (12,282,881) (25,000,000)
Net cash received from investment activities 18,411,748 5,117,410
Increase (decrease) in cash 1,418,182 (27,882,560)
Cash, beginning of year 5,185,152 33,067,712
Cash, end of year 6,603,334 5,185,152
The accompanying notes are an integral part of the financial statements.
1-468 PUBLIC ACCOUNTS, 2012-2013
1. Description of Corporation
(a)
(b)
(c) (d) (e)
2. First-time adoption of Canadian Public Sector Accounting Standards for not-for -profit organizations
3. Significant accounting policies
(a)
The Toronto Waterfront Revitalization Corporation (the “Corporation” or “TWRC”) was initially incorporated on November 1, 2001 under the Ontario Business Corporations Act with the Province of Ontario being its sole shareholder.
Pursuant to the Toronto Waterfront Revitalization Corporation Act, 2002 (the “Act”), the Corporation was continued as a corporation without share capital on May 15, 2003. The Corporation is deemed not to be a Crown Agency within the meaning of the Crown Agency Act.
Under the Act, the Corporation's objects are to:
encourage public input into the development of the designated waterfront area; andengage in such other activities as may be prescribed by regulation.
implement a plan that enhances the economic, social and cultural value of the land in the designated waterfront area and create an accessible and active waterfront for living, working and recreation and to do so in a fiscally and environmentally responsible manner;ensure that ongoing development in the designated waterfront area can continue in a financially self-sustaining manner;promote and encourage involvement of the private sector in the development of the designated waterfront area;
Effective April 1, 2012, the Corporation adopted the requirements of the new accounting framework, Canadian Public Sector Accounting Standards for Not-for-Profit Organizations (PSAB for NPOs). These are the Corporation's first financial statements prepared in accordance with this framework and the transitional provisions of Section 2125, First-time Adoption by Government Organizations have been applied. Section 2125 requires retrospective application of the accounting standards with certain elective exemptions and mandatory requirements. The accounting policies set out in Note 3 - Significant Accounting Policies have been applied in preparing the financial statements for the year ended March 31 2013, the comparative information presented in these financial statements for the year ended March 31, 2012 and in the preparation of an opening PSAB for NPOs statement of financial position at the date of transition of April 1, 2011.
The Corporation issued financial statements for the year ended March 31, 2012 using generally accepted accounting principles prescribed by the CICA Handbook - Accounting Part V - Pre-changeover Accounting Standards. The adoption of PSAB for NPOs resulted in no adjustments to the previously reported assets, liabilities, net assets, excess of revenue over expenses and cash flows of the Corporation.
Basis of presentationThese financial statements have been prepared with Canadian public sector accounting standards for not-for-profit organizations contained in the Canadian Institute of Chartered Accountants (CICA) handbook.
Toronto Waterfront Revitalization CorporationNotes to the financial statementsMarch 31, 2013 and 2012______________________________________________________________________________
PUBLIC ACCOUNTS, 2012-2013 1-469
3. Significant accounting policies (cont.)
(b)
(c)
(d)
(e)
(f)
The Corporation has entered into agreements with third parties who are responsible for managing various projects on Toronto's Waterfront. Expenditures related to these projects are recorded in the statement of financial activities as transfer payments and grants. Under the terms of the agreements, the Corporation does not assume ownership or ongoing operational responsibility during development or upon project completion.
Allocation of general support expenses
The Corporation incurs a number of general support expenses that are common to the administration of the organization and each of its projects. General support expenses are incurred to support the functional areas of construction/implementation, planning, design and approvals, and project management. The expenses are allocated using a burden rate based on general support expenses as a proportion of direct labour costs.
Transfer payments and grants
Financial instrumentsFinancial instruments are recorded at cost when acquired, except for contributions that are recorded at fair value. In subsequent periods, investments traded in an active market are reported at fair value, with any unrealized gains and losses reported in the statement of remeasurement gains and losses. All other financial instruments are recorded at cost or amortized cost less impairment, if applicable. Financial assets are tested for impairment when changes in circumstances indicate the asset could be impaired. Transaction costs on the acquisiton, sale or issue of financial instruments are expensed for those items remeasured at fair value at each balance sheet date and charged to the financial instrument for those measured at amortized cost.
The Corporation has short-term investments in the fair value category. This item is classified as Level 1 in the fair value hierarchy whereby their fair value is based on quoted prices in active markets for identical assets. There have been no movement from Level 1 to Level 2 or Level 3.
Revenue recognition
The Corporation follows the deferral method of accounting for restricted contributions. Under this method, restricted contributions are recognized as revenue in the year in which the related expenses are incurred. Restricted contributions for which the related restrictions remain unfulfilled are accumulated as deferred contributions.
Contributions used for the purchase of amortized capital assets are deferred and amortized into revenue at a rate corresponding with the amortization rate for the related capital assets. Contributions for the purchase of non-amortized capital assets such as land as well as assets under development which will be transferred to government(s) upon completion are recognized as a direct contribution to net assets.
Under the Contribution Agreements, contributions from the Governments can only be applied towards payments of eligible costs in respect of project activities, as defined in the Contribution Agreements. Unrestricted contributions such as other operating items are recognized as revenue in the current period.
Taxes
The Corporation is exempt from income taxes pursuant to paragraph 149(1) (d.3) of the Income Tax Act (Canada) and is eligible to claim a rebate of approximately 86.5% for HST paid on property and services acquired pursuant to section 123(1)(b) of the Excise Tax Act.
Toronto Waterfront Revitalization CorporationNotes to the financial statementsMarch 31, 2013 and 2012______________________________________________________________________________
1-470 PUBLIC ACCOUNTS, 2012-2013
3. Significant accounting policies (cont.)
(g)
(h)
10 years5 years5 years
Computer hardware and software 3 years5 years
(i)
●
●
(j)
Assets under development
Capital assets are recorded at cost less accumulated amortization. With the exception of land which is not amortized, capital assets less residual value are amortized on a straight-line basis over their estimated useful lives as follows:Parking facility
Office equipment
Leasehold improvements
Capital assets
Use of estimates
Assets under development represent those investments in assets which the Corporation has been directed to develop under an executed agreement and the Corporation has actual or beneficial ownership during the development stage. Land under this category represents all costs associated with getting a parcel of land site ready for development, including costs associated with contracting with a developer, rezoning, and soil management and treatment.
Upon substantial completion these assets are either transferred to a respective government who assumes ownership and ongoing operational responsibility, transferred to capital assets for those assets the Corporation continues to have actual or beneficial ownership over, or sold to a third party. These assets transferred to a respective government are considered a related party transaction and the difference between cost and proceeds is recorded directly to net assets. Any gain or loss on assets sold to a third party is recorded through the statement of financial activities.
Assets under development are recognized at cost, are not amortized and include both direct project costs as well as overhead costs directly attributable to the asset under development.
Furniture and fixtures
Executive pension plan
The preparation of financial statements requires management to make estimates and assumptions that affect the reported amounts of assets and liabilities and disclosure of contingent assets and liabilities at the date of the financial statements and the reported amounts of revenue and expenses during the period. Actual results could differ from those estimates. The items subject to the most significant estimates are contributions recoverable, the amortization of capital assets, accrued liabilities, deferred revenue and accrued benefit liability.
The Corporation accrues its obligations under the executive pension plan (the “Plan”) and the related costs, net of plan assets. The Corporation has adopted the following policies:
The cost of pension benefits earned is actuarially determined using the projected unit credit method pro-rated on service and management’s best estimate of expected plan performance, salary escalation and retirement age of the executive.For the purpose of calculating the expected return on plan assets, those assets are valued at fair value.
The cost incurred to enhance the service potential of a capital asset, including land, is a betterment and capitalized to the asset. Repairs and maintenance costs are charged to expense.
Toronto Waterfront Revitalization CorporationNotes to the financial statementsMarch 31, 2013 and 2012______________________________________________________________________________
PUBLIC ACCOUNTS, 2012-2013 1-471
Toronto Waterfront Revitalization CorporationNotes to the financial statementsMarch 31, 2013 and 2012______________________________________________________________________________4. Contributions receivable
March 31, March 31,2013 2012
$ $Government of Canada - 2,225,000 City of Toronto - 681,314 Province of Ontario 15,920,635 -
15,920,635 2,906,314
5. Deposits, prepaid expenses, rent receivable and other assets
March 31, March 31,2013 2012
$ $Construction deposits 6,456,997 6,456,997Developer receivables, rent and other 2,478,420 3,585,720Prepaid expenses 272,830 401,176
32,467 1,595,6559,240,714 12,039,548
6. Restricted cash
7. Assets under development
The following table details assets under development by category:March 31, March 31,
2013 2012$ $
Roads, public realm, utilities 188,010,824 136,932,659 Parkland 33,809,427 31,632,752 Land under development 15,156,443 12,909,859 Parking facility - 21,981,585
236,976,694 203,456,855
Current portion of prepaid expenses and rent receivables (Note 9)
The Corporation has $8,987,394 (2012 - $7,297,158) in cash which is subject to restrictions that prevent its use for current purposes. Of this cash balance $4,728,290 forms part of a security fund set up with the City for infrastructure works being completed by the Corporation in West Don Lands. Under the terms of the agreement, TWRC cannot withdraw funds from the security fund without the authorization of the City and the City can only draw on the security fund subject to certain conditions and providing sufficient and appropriate notice to TWRC. The remaining balance of $4,259,104 pertains to funds in escrow required to satisfy Waterfront Toronto’s future obligations to third party developers.
The Corporation has provided the City of Toronto (the “City”) and Toronto Hydro with certain construction deposits to guarantee satisfactory performance, completion of work and related obligations required for the construction of municipal and hydro infrastructure by the Corporation. The construction deposits will be released to Waterfront Toronto at the expiration of certain performance and guarantee periods. The construction deposits paid to the City of $2,181,199 (2012 - $2,181,199) are non-interest bearing; and the construction deposits outstanding from Toronto Hydro of $4,275,273 (2012 - $4,275,273) will be returned to TWRC including interest at the Prime Business Rate set by the Bank of Canada less two percent.
1-472 PUBLIC ACCOUNTS, 2012-2013
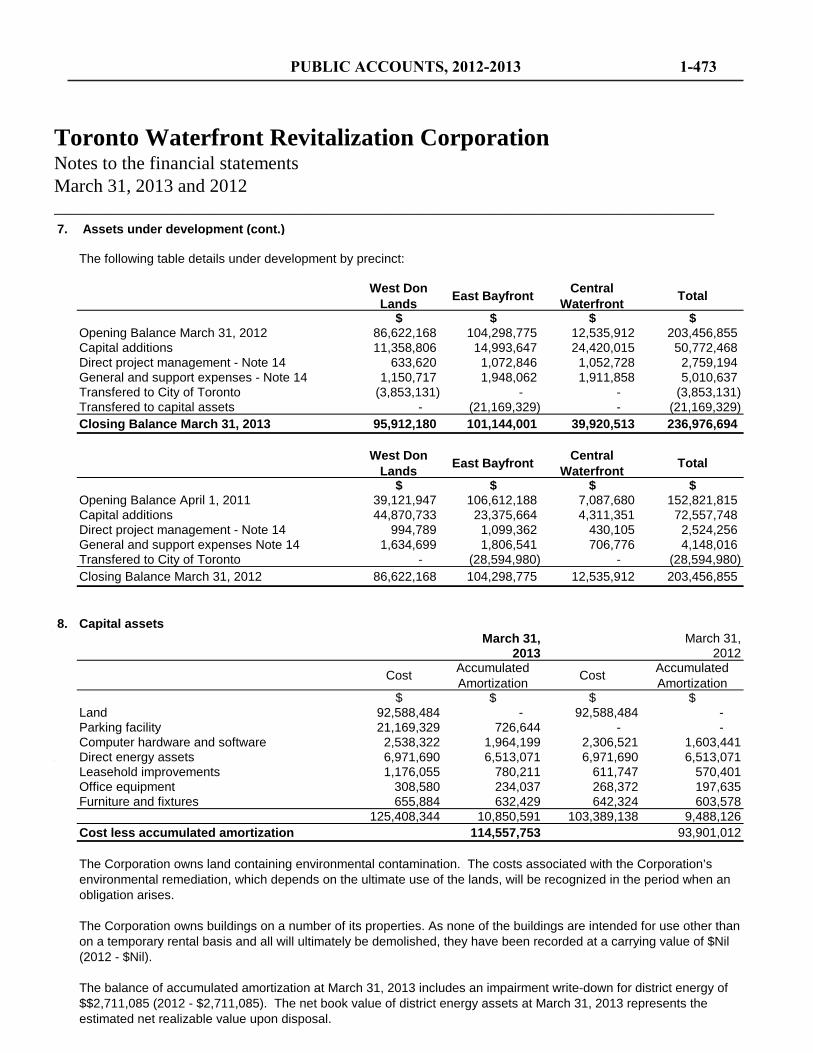
Toronto Waterfront Revitalization CorporationNotes to the financial statementsMarch 31, 2013 and 2012______________________________________________________________________________7. Assets under development (cont.)
The following table details under development by precinct:
West Don Lands East Bayfront Central
Waterfront Total
$ $ $ $Opening Balance March 31, 2012 86,622,168 104,298,775 12,535,912 203,456,855 Capital additions 11,358,806 14,993,647 24,420,015 50,772,468 Direct project management - Note 14 633,620 1,072,846 1,052,728 2,759,194 General and support expenses - Note 14 1,150,717 1,948,062 1,911,858 5,010,637 Transfered to City of Toronto (3,853,131) - - (3,853,131)Transfered to capital assets - (21,169,329) - (21,169,329)Closing Balance March 31, 2013 95,912,180 101,144,001 39,920,513 236,976,694
West Don Lands East Bayfront Central
Waterfront Total
$ $ $ $Opening Balance April 1, 2011 39,121,947 106,612,188 7,087,680 152,821,815 Capital additions 44,870,733 23,375,664 4,311,351 72,557,748 Direct project management - Note 14 994,789 1,099,362 430,105 2,524,256 General and support expenses Note 14 1,634,699 1,806,541 706,776 4,148,016 Transfered to City of Toronto - (28,594,980) - (28,594,980)Closing Balance March 31, 2012 86,622,168 104,298,775 12,535,912 203,456,855
8. Capital assetsMarch 31, March 31,
2013 2012
Cost Accumulated Amortization Cost Accumulated
Amortization$ $ $ $
Land 92,588,484 - 92,588,484 - Parking facility 21,169,329 726,644 - - Computer hardware and software 2,538,322 1,964,199 2,306,521 1,603,441Direct energy assets 6,971,690 6,513,071 6,971,690 6,513,071Leasehold improvements 1,176,055 780,211 611,747 570,401Office equipment 308,580 234,037 268,372 197,635Furniture and fixtures 655,884 632,429 642,324 603,578
125,408,344 10,850,591 103,389,138 9,488,126Cost less accumulated amortization 114,557,753 93,901,012
The Corporation owns land containing environmental contamination. The costs associated with the Corporation’s environmental remediation, which depends on the ultimate use of the lands, will be recognized in the period when an obligation arises.
The Corporation owns buildings on a number of its properties. As none of the buildings are intended for use other than on a temporary rental basis and all will ultimately be demolished, they have been recorded at a carrying value of $Nil (2012 - $Nil).
The balance of accumulated amortization at March 31, 2013 includes an impairment write-down for district energy of $$2,711,085 (2012 - $2,711,085). The net book value of district energy assets at March 31, 2013 represents the estimated net realizable value upon disposal.
PUBLIC ACCOUNTS, 2012-2013 1-473
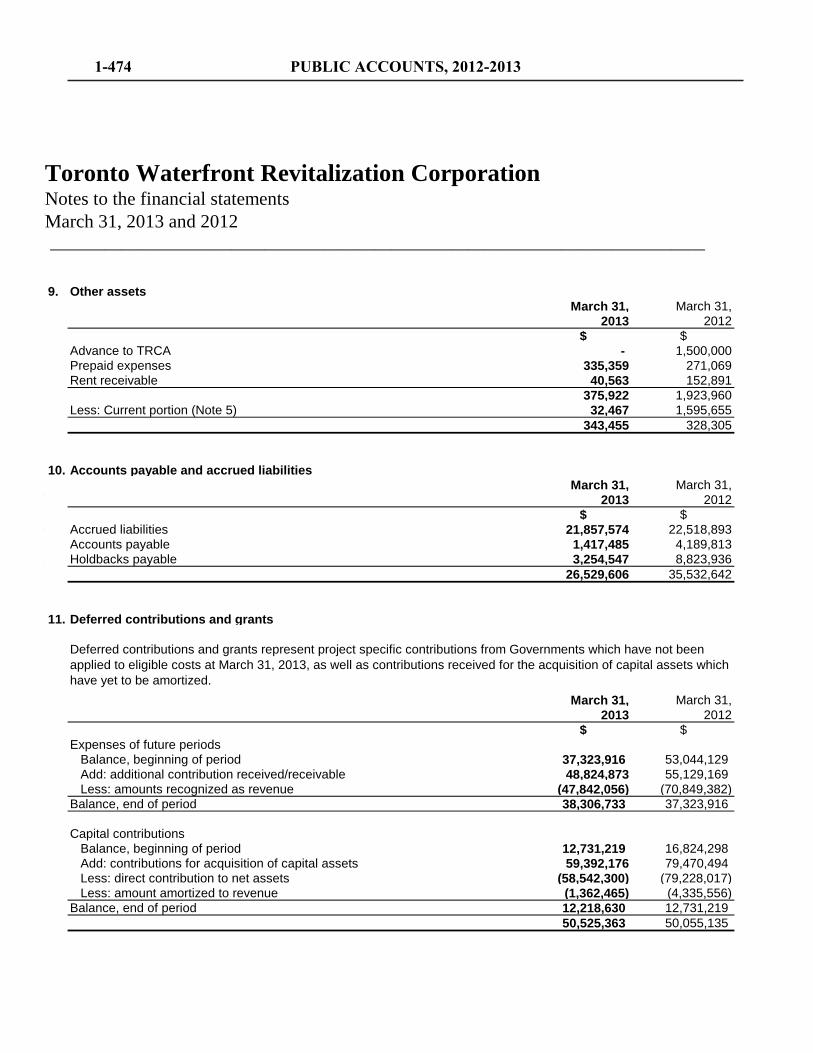
Toronto Waterfront Revitalization CorporationNotes to the financial statementsMarch 31, 2013 and 2012______________________________________________________________________________
9. Other assetsMarch 31, March 31,
2013 2012$ $
Advance to TRCA - 1,500,000Prepaid expenses 335,359 271,069Rent receivable 40,563 152,891
375,922 1,923,960Less: Current portion (Note 5) 32,467 1,595,655
343,455 328,305
10. Accounts payable and accrued liabilitiesMarch 31, March 31,
2013 2012$ $
Accrued liabilities 21,857,574 22,518,893Accounts payable 1,417,485 4,189,813Holdbacks payable 3,254,547 8,823,936
26,529,606 35,532,642
11. Deferred contributions and grants
March 31, March 31,2013 2012
$ $Expenses of future periods Balance, beginning of period 37,323,916 53,044,129 Add: additional contribution received/receivable 48,824,873 55,129,169 Less: amounts recognized as revenue (47,842,056) (70,849,382)Balance, end of period 38,306,733 37,323,916
Capital contributions Balance, beginning of period 12,731,219 16,824,298 Add: contributions for acquisition of capital assets 59,392,176 79,470,494 Less: direct contribution to net assets (58,542,300) (79,228,017) Less: amount amortized to revenue (1,362,465) (4,335,556)Balance, end of period 12,218,630 12,731,219
50,525,363 50,055,135
Deferred contributions and grants represent project specific contributions from Governments which have not been applied to eligible costs at March 31, 2013, as well as contributions received for the acquisition of capital assets which have yet to be amortized.
1-474 PUBLIC ACCOUNTS, 2012-2013
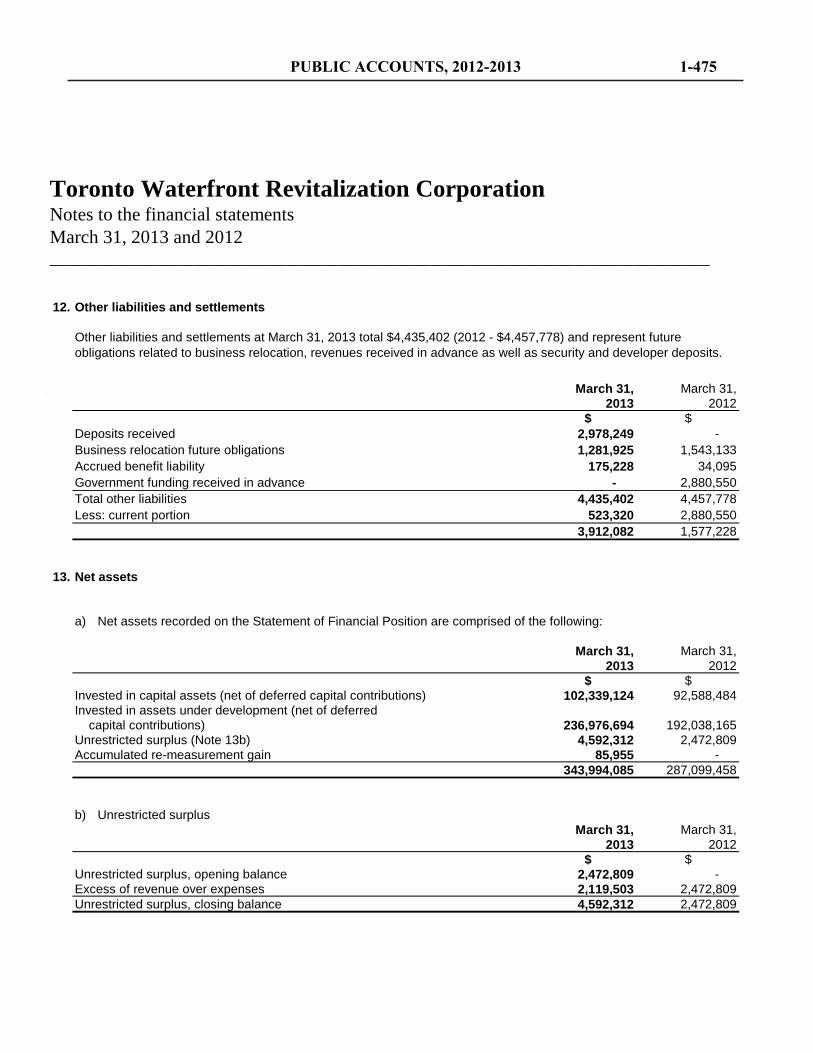
Toronto Waterfront Revitalization CorporationNotes to the financial statementsMarch 31, 2013 and 2012______________________________________________________________________________
12. Other liabilities and settlements
March 31, March 31,2013 2012
$ $Deposits received 2,978,249 - Business relocation future obligations 1,281,925 1,543,133Accrued benefit liability 175,228 34,095Government funding received in advance - 2,880,550Total other liabilities 4,435,402 4,457,778Less: current portion 523,320 2,880,550
3,912,082 1,577,228
13. Net assets
a) Net assets recorded on the Statement of Financial Position are comprised of the following:
March 31, March 31,2013 2012
$ $Invested in capital assets (net of deferred capital contributions) 102,339,124 92,588,484Invested in assets under development (net of deferred capital contributions) 236,976,694 192,038,165Unrestricted surplus (Note 13b) 4,592,312 2,472,809Accumulated re-measurement gain 85,955 -
343,994,085 287,099,458
b) Unrestricted surplusMarch 31, March 31,
2013 2012$ $
Unrestricted surplus, opening balance 2,472,809 - Excess of revenue over expenses 2,119,503 2,472,809Unrestricted surplus, closing balance 4,592,312 2,472,809
Other liabilities and settlements at March 31, 2013 total $4,435,402 (2012 - $4,457,778) and represent future obligations related to business relocation, revenues received in advance as well as security and developer deposits.
PUBLIC ACCOUNTS, 2012-2013 1-475
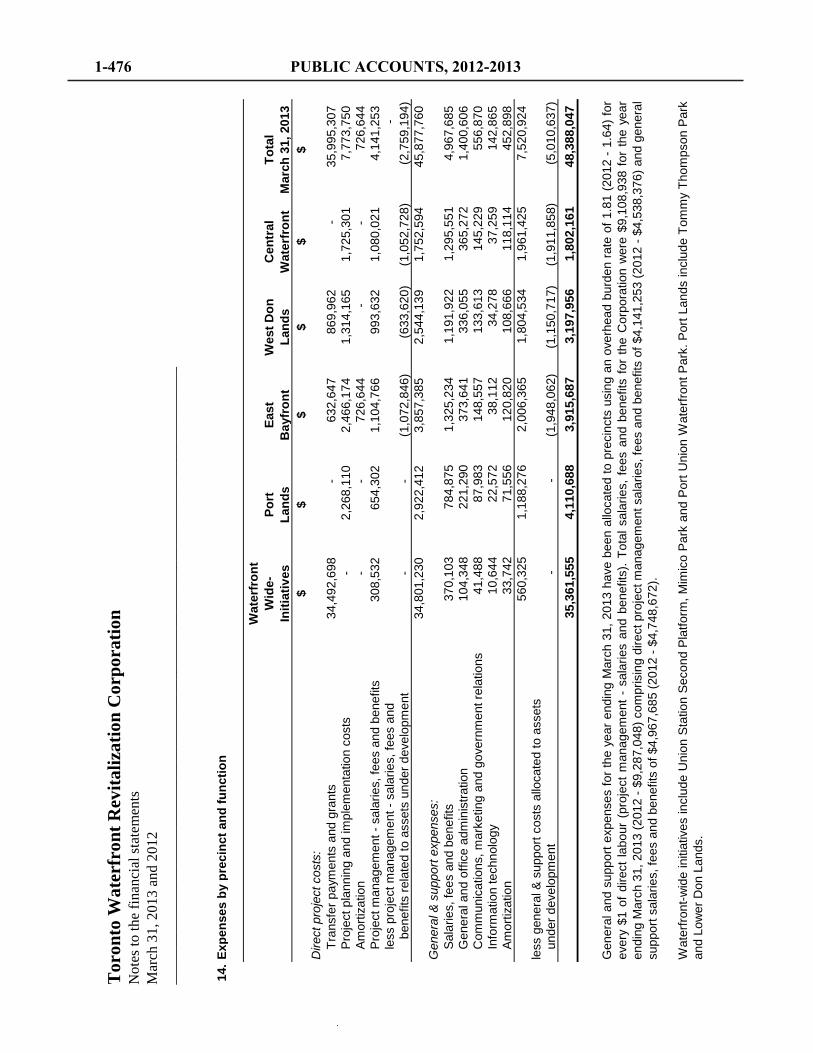
Tor
onto
Wat
erfr
ont R
evita
lizat
ion
Cor
pora
tion
Not
es to
the
finan
cial
stat
emen
tsM
arch
31,
201
3 an
d 20
12__
____
____
____
____
____
____
____
____
____
____
____
____
____
____
____
____
____
____
____
____
_
14.E
xpen
ses
by p
reci
nct a
nd fu
nctio
n
Wat
erfr
ont
Wid
e-
Initi
ativ
esPo
rt
Land
sEa
st
Bay
fron
tW
est D
on
Land
sC
entr
al
Wat
erfr
ont
Tota
lM
arch
31,
201
3$
$$
$$
$D
irect
pro
ject
cos
ts:
Tran
sfer
pay
men
ts a
nd g
rant
s34
,492
,698
-
63
2,64
7
869,
962
-
35
,995
,307
Pr
ojec
t pla
nnin
g an
d im
plem
enta
tion
cost
s-
2,26
8,11
0
2,46
6,17
4
1,
314,
165
1,
725,
301
7,77
3,75
0
Am
ortiz
atio
n-
-
72
6,64
4
-
-
726,
644
Pr
ojec
t man
agem
ent -
sal
arie
s, fe
es a
nd b
enef
its30
8,53
2
654,
302
1,10
4,76
6
99
3,63
2
1,
080,
021
4,14
1,25
3
le
ss p
roje
ct m
anag
emen
t - s
alar
ies,
fees
and
-
bene
fits
rela
ted
to a
sset
s un
der d
evel
opm
ent
-
-
(1,0
72,8
46)
(633
,620
)(1
,052
,728
)(2
,759
,194
)34
,801
,230
2,92
2,41
2
3,85
7,38
5
2,
544,
139
1,
752,
594
45,8
77,7
60
Gen
eral
& s
uppo
rt ex
pens
es:
Sala
ries,
fees
and
ben
efits
370,
103
78
4,87
5
1,
325,
234
1,
191,
922
1,
295,
551
4,96
7,68
5
G
ener
al a
nd o
ffice
adm
inis
tratio
n10
4,34
8
221,
290
373,
641
336,
055
365,
272
1,
400,
606
Com
mun
icat
ions
, mar
ketin
g an
d go
vern
men
t rel
atio
ns41
,488
87,9
83
148,
557
133,
613
145,
229
55
6,87
0
Info
rmat
ion
tech
nolo
gy10
,644
22,5
72
38,1
12
34
,278
37,2
59
14
2,86
5
Amor
tizat
ion
33,7
42
71
,556
12
0,82
0
10
8,66
6
11
8,11
4
452,
898
56
0,32
5
1,18
8,27
6
2,00
6,36
5
1,80
4,53
4
1,96
1,42
5
7,
520,
924
less
gen
eral
& s
uppo
rt co
sts
allo
cate
d to
ass
ets
unde
r dev
elop
men
t-
-
(1,9
48,0
62)
(1,1
50,7
17)
(1,9
11,8
58)
(5,0
10,6
37)
35,3
61,5
55
4,
110,
688
3,
915,
687
3,
197,
956
1,
802,
161
48,3
88,0
47
Gen
eral
and
supp
orte
xpen
ses
fort
heye
aren
ding
Mar
ch31
,201
3ha
vebe
enal
loca
ted
topr
ecin
cts
usin
gan
over
head
burd
enra
teof
1.81
(201
2-1
.64)
for
ever
y$1
ofdi
rect
labo
ur(p
roje
ctm
anag
emen
t-sa
larie
san
dbe
nefit
s).T
otal
sala
ries,
fees
and
bene
fits
for
the
Cor
pora
tion
wer
e$9
,108
,938
for
the
year
endi
ngM
arch
31,2
013
(201
2-$
9,28
7,04
8)co
mpr
isin
gdi
rect
proj
ectm
anag
emen
tsal
arie
s,fe
esan
dbe
nefit
sof
$4,1
41,2
53(2
012
-$4,
538,
376)
and
gene
ral
supp
ort s
alar
ies,
fees
and
ben
efits
of $
4,96
7,68
5 (2
012
- $4,
748,
672)
.
Wat
erfro
nt-w
ide
initi
ativ
esin
clud
eU
nion
Stat
ion
Seco
ndPl
atfo
rm,M
imic
oPa
rkan
dPo
rtU
nion
Wat
erfro
ntPa
rk.P
ortL
ands
incl
ude
Tom
my
Thom
pson
Park
and
Low
er D
on L
ands
.
1-476 PUBLIC ACCOUNTS, 2012-2013
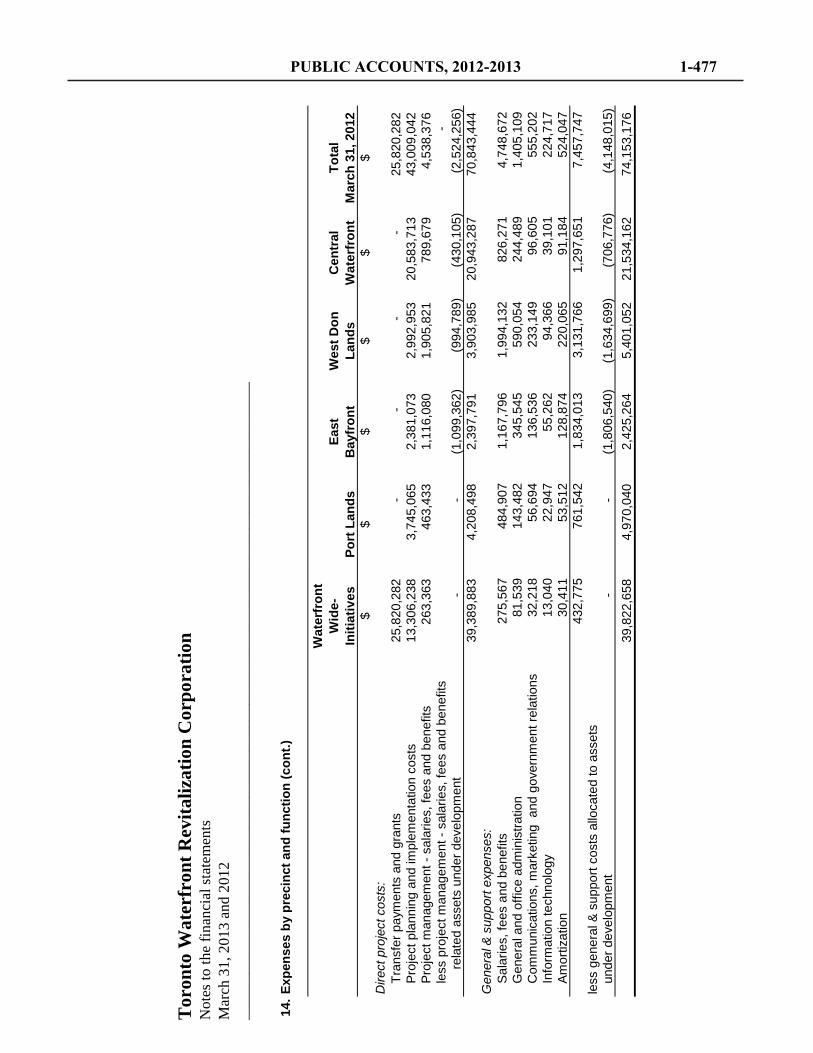
Tor
onto
Wat
erfr
ont R
evita
lizat
ion
Cor
pora
tion
Not
es to
the
finan
cial
stat
emen
tsM
arch
31,
201
3 an
d 20
12__
____
____
____
____
____
____
____
____
____
____
____
____
____
____
____
____
____
____
____
____
_
14.E
xpen
ses
by p
reci
nct a
nd fu
nctio
n (c
ont.)
Wat
erfr
ont
Wid
e-
Initi
ativ
esPo
rt L
ands
East
B
ayfr
ont
Wes
t Don
La
nds
Cen
tral
W
ater
fron
tTo
tal
Mar
ch 3
1, 2
012
$$
$$
$$
Dire
ct p
roje
ct c
osts
:Tr
ansf
er p
aym
ents
and
gra
nts
25,8
20,2
82
-
-
-
-
25
,820
,282
Pr
ojec
t pla
nnin
g an
d im
plem
enta
tion
cost
s13
,306
,238
3,74
5,06
5
2,38
1,07
3
2,
992,
953
20
,583
,713
43
,009
,042
Pr
ojec
t man
agem
ent -
sal
arie
s, fe
es a
nd b
enef
its26
3,36
3
463,
433
1,11
6,08
0
1,
905,
821
78
9,67
9
4,53
8,37
6
le
ss p
roje
ct m
anag
emen
t - s
alar
ies,
fees
and
ben
efits
-
rela
ted
asse
ts u
nder
dev
elop
men
t-
-
(1
,099
,362
)(9
94,7
89)
(430
,105
)(2
,524
,256
)39
,389
,883
4,20
8,49
8
2,39
7,79
1
3,
903,
985
20
,943
,287
70
,843
,444
G
ener
al &
sup
port
expe
nses
:Sa
larie
s, fe
es a
nd b
enef
its27
5,56
7
484,
907
1,16
7,79
6
1,99
4,13
2
826,
271
4,
748,
672
Gen
eral
and
offi
ce a
dmin
istra
tion
81,5
39
14
3,48
2
34
5,54
5
59
0,05
4
24
4,48
9
1,40
5,10
9
C
omm
unic
atio
ns, m
arke
ting
and
gov
ernm
ent r
elat
ions
32,2
18
56
,694
13
6,53
6
23
3,14
9
96
,605
555,
202
In
form
atio
n te
chno
logy
13,0
40
22
,947
55
,262
94,3
66
39
,101
224,
717
Am
ortiz
atio
n30
,411
53,5
12
128,
874
220,
065
91,1
84
52
4,04
7
432,
775
76
1,54
2
1,
834,
013
3,
131,
766
1,
297,
651
7,45
7,74
7
le
ss g
ener
al &
sup
port
cost
s al
loca
ted
to a
sset
s un
der d
evel
opm
ent
-
-
(1,8
06,5
40)
(1,6
34,6
99)
(706
,776
)(4
,148
,015
)39
,822
,658
4,97
0,04
0
2,42
5,26
4
5,
401,
052
21
,534
,162
74
,153
,176
PUBLIC ACCOUNTS, 2012-2013 1-477
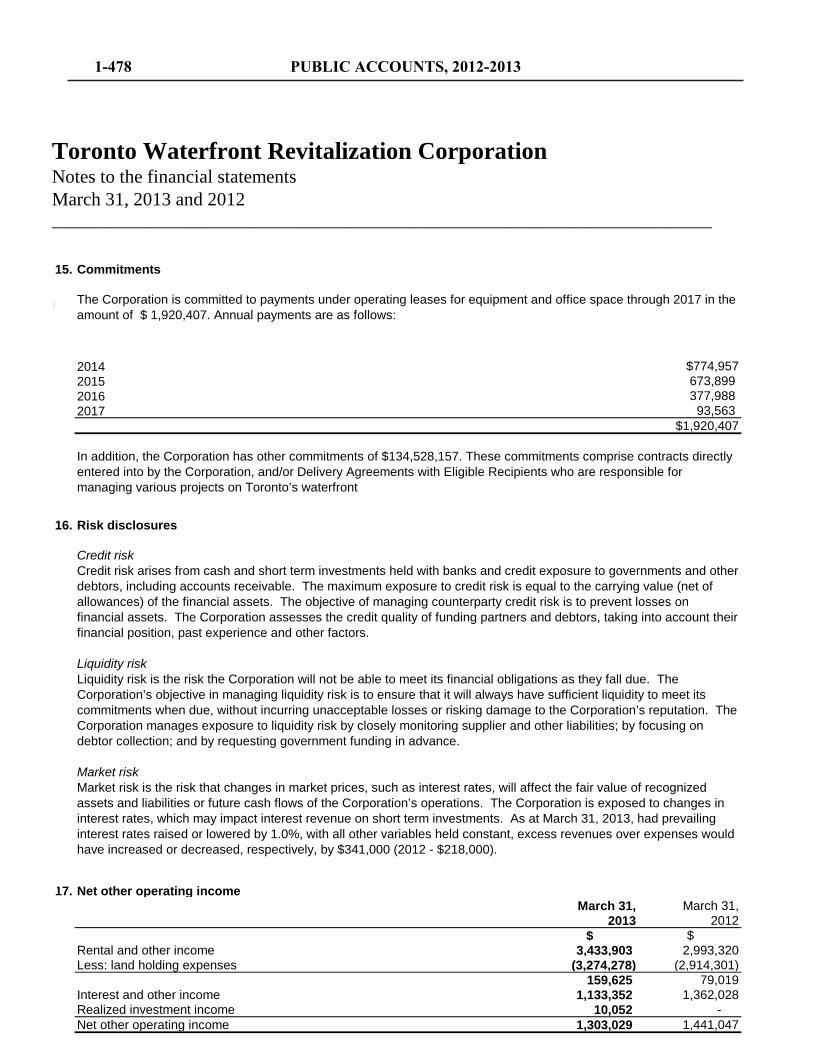
Toronto Waterfront Revitalization CorporationNotes to the financial statementsMarch 31, 2013 and 2012______________________________________________________________________________
15. Commitments
$774,957673,899 377,988
93,563 $1,920,407
16. Risk disclosures
17. Net other operating incomeMarch 31, March 31,
2013 2012$ $
Rental and other income 3,433,903 2,993,320Less: land holding expenses (3,274,278) (2,914,301)
159,625 79,019Interest and other income 1,133,352 1,362,028Realized investment income 10,052 - Net other operating income 1,303,029 1,441,047
Credit risk Credit risk arises from cash and short term investments held with banks and credit exposure to governments and other debtors, including accounts receivable. The maximum exposure to credit risk is equal to the carrying value (net of allowances) of the financial assets. The objective of managing counterparty credit risk is to prevent losses on financial assets. The Corporation assesses the credit quality of funding partners and debtors, taking into account their financial position, past experience and other factors.
Liquidity riskLiquidity risk is the risk the Corporation will not be able to meet its financial obligations as they fall due. The Corporation’s objective in managing liquidity risk is to ensure that it will always have sufficient liquidity to meet its commitments when due, without incurring unacceptable losses or risking damage to the Corporation’s reputation. The Corporation manages exposure to liquidity risk by closely monitoring supplier and other liabilities; by focusing on debtor collection; and by requesting government funding in advance.
Market riskMarket risk is the risk that changes in market prices, such as interest rates, will affect the fair value of recognized assets and liabilities or future cash flows of the Corporation’s operations. The Corporation is exposed to changes in interest rates, which may impact interest revenue on short term investments. As at March 31, 2013, had prevailing interest rates raised or lowered by 1.0%, with all other variables held constant, excess revenues over expenses would have increased or decreased, respectively, by $341,000 (2012 - $218,000).
The Corporation is committed to payments under operating leases for equipment and office space through 2017 in the amount of $ 1,920,407. Annual payments are as follows:
2014201520162017
In addition, the Corporation has other commitments of $134,528,157. These commitments comprise contracts directly entered into by the Corporation, and/or Delivery Agreements with Eligible Recipients who are responsible for managing various projects on Toronto’s waterfront
1-478 PUBLIC ACCOUNTS, 2012-2013
Toronto Waterfront Revitalization CorporationNotes to the financial statementsMarch 31, 2013 and 2012______________________________________________________________________________
18. Comparatives
Certain comparative amounts have been reclassified to conform with the current year’s method of presentation.
19. Contingent liabilities
(a)
(i)
(ii)
(b)
(i)
(ii)
(c)
(d)
The Corporation requires all Eligible Recipients to indemnify the Corporation from and against liability on the same basis outlined above.
The Corporation requires most third party contractors to indemnify each level of government and the Corporation, its officers, employees and agents against all claims, liabilities and demands with respect to any injury to persons (including death), damage to, loss or destruction of property or infringement of rights caused by or arising directly from:
The Corporation has entered into a number of Development Agreements with third party builders with respect to lands located in the West Don Lands and East Bayfront. Under these agreements, the Corporation has provided the builders certain milestone representations based on specific Corporation development obligations. The representations primarily relate to schedule delays. The maximum potential future liability related to these representations is $7.5 million under one development agreement with one builder and although under the other development agreements the amounts are not determinable, they are limited to the amount up to the respective builder's carrying costs and/or out of pocket expenses incurred on the development. No amount for these representations has been accrued in these financial statements. Management attempts to limit the Corporation's potential exposure under these guarantees through appropriate schedule, cost and scope management practices.
Under the terms and conditions of the Contribution Agreements, the Corporation provides an indemnity to the City, Province of Ontario and Government of Canada and their respective officers, employees and agents, from and against all claims, losses, damages, costs, expenses, actions and other proceedings related to any injury to or death of a person or damage to or loss of property, infringement of rights or any other loss or damages whatsoever arising directly or indirectly from any willful or negligent act, omission or delay on the part of the Corporation, the Corporation’s directors, officers, employees, contractors, agents or Third Party Contractors, in carrying out a project or as a result of the project, except to the extent that the injury, loss or damage has been caused by the City, Province of Ontario and/or Government of Canada or their respective officers, employees or agents.
The Corporation has a municipal access agreement with the City of Toronto for the ongoing maintenance and potential removal of district energy pipes in West Don Lands. Management estimates the maximum potential liability to be $1,600,000. These costs are currently unfunded.
any breach by the Corporation of the Delivery Agreement or documents or certificates given pursuant to the Agreement, or
the breach of any term or condition of the contract by the third party contractor or its officers, employees or agents; orany omission or any willful or negligent act of the third party contractor or its officers, employees or agents in relation to the applicable project.
Under the Delivery Agreement with each Eligible Recipient respectively, the Corporation provides an indemnity to the Eligible Recipient and its respective officers, employees and agents, from and against any claims with respect to direct loss arising from:
any negligent or willful acts or omissions of the Corporation, its officers, directors, employees or agents, in relation to the project.
Management attempts to limit the Corporation's exposure under these indemnifications through the purchase of directors and officers insurance, the allocation of risk to Eligible Recipients and contractors (outlined above) and through enforcing the Corporation’s and Eligible Recipients’ policies and procedures, as well as intense oversight where appropriate.
PUBLIC ACCOUNTS, 2012-2013 1-479
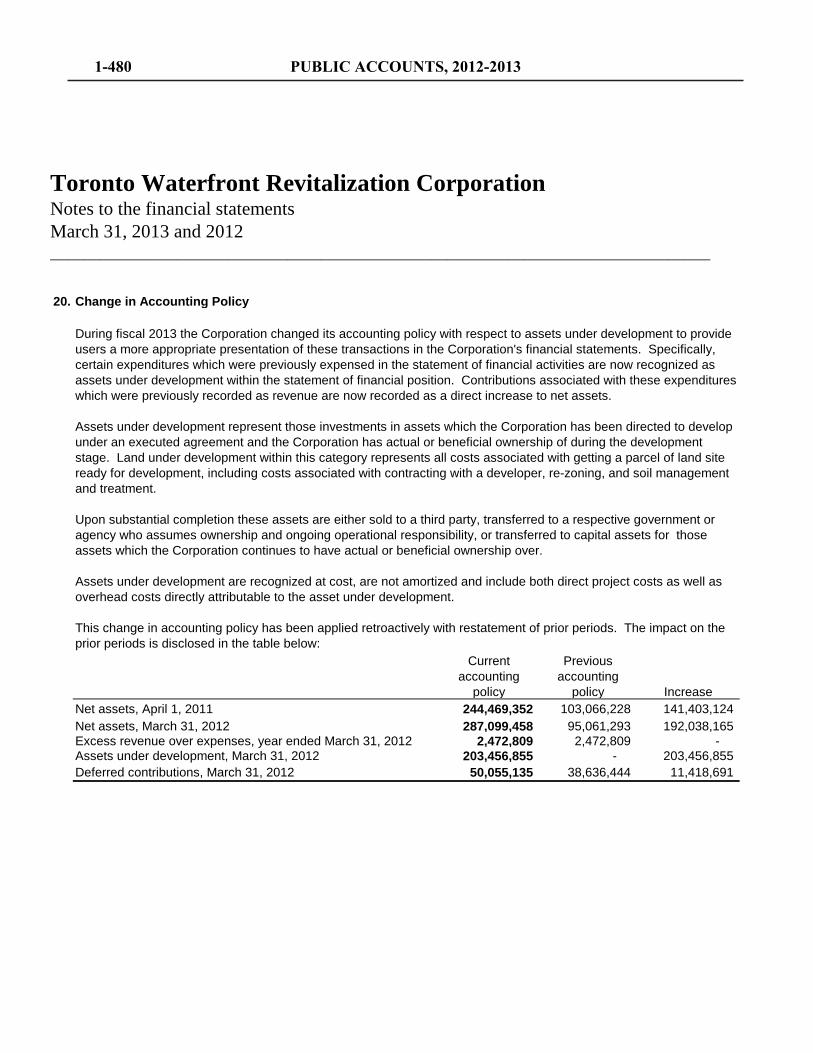
Toronto Waterfront Revitalization CorporationNotes to the financial statementsMarch 31, 2013 and 2012______________________________________________________________________________
20. Change in Accounting Policy
Current accounting
policy
Previous accounting
policy IncreaseNet assets, April 1, 2011 244,469,352 103,066,228 141,403,124 Net assets, March 31, 2012 287,099,458 95,061,293 192,038,165 Excess revenue over expenses, year ended March 31, 2012 2,472,809 2,472,809 - Assets under development, March 31, 2012 203,456,855 - 203,456,855 Deferred contributions, March 31, 2012 50,055,135 38,636,444 11,418,691
During fiscal 2013 the Corporation changed its accounting policy with respect to assets under development to provide users a more appropriate presentation of these transactions in the Corporation's financial statements. Specifically, certain expenditures which were previously expensed in the statement of financial activities are now recognized as assets under development within the statement of financial position. Contributions associated with these expenditures which were previously recorded as revenue are now recorded as a direct increase to net assets.
Assets under development represent those investments in assets which the Corporation has been directed to develop under an executed agreement and the Corporation has actual or beneficial ownership of during the development stage. Land under development within this category represents all costs associated with getting a parcel of land site ready for development, including costs associated with contracting with a developer, re-zoning, and soil management and treatment.
Upon substantial completion these assets are either sold to a third party, transferred to a respective government or agency who assumes ownership and ongoing operational responsibility, or transferred to capital assets for those assets which the Corporation continues to have actual or beneficial ownership over.
Assets under development are recognized at cost, are not amortized and include both direct project costs as well as overhead costs directly attributable to the asset under development.
This change in accounting policy has been applied retroactively with restatement of prior periods. The impact on the prior periods is disclosed in the table below:
1-480 PUBLIC ACCOUNTS, 2012-2013