the case for young people and nature: a path to a healthy...
TRANSCRIPT

1
The Case for Young People and Nature: A Path to a Healthy, Natural, Prosperous Future
James Hansen1, Pushker Kharecha
1, Makiko Sato
1, Paul Epstein
2, Paul J. Hearty
3, Ove Hoegh-
Guldberg4, Camille Parmesan
5, Stefan Rahmstorf
6, Johan Rockstrom
7, Eelco J.Rohling
8, Jeffrey
Sachs1, Peter Smith
9, Konrad Steffen
10, Karina von Schuckmann
11, James C. Zachos
12,
Abstract. We describe scenarios that define how rapidly fossil fuel emissions must be
phased down to restore Earth's energy balance and stabilize global climate. A scenario that
stabilizes climate and preserves nature is technically possible and it is essential for the future of
humanity. Despite overwhelming evidence, governments and the fossil fuel industry continue to
propose that all fossil fuels must be exploited before the world turns predominantly to clean
energies. If governments fail to adopt policies that cause rapid phase-down of fossil fuel
emissions, today's children, future generations, and nature will bear the consequences through no
fault of their own. Governments must act immediately to significantly reduce fossil fuel
emissions to protect our children's future and avoid loss of crucial ecosystem services, or else be
complicit in this loss and its consequences.
1. Background
Humanity is now the dominant force driving changes of Earth's atmospheric composition
and thus future climate on the planet. Carbon dioxide (CO2) emitted in burning of fossil fuels is,
according to best available science, the main cause of global warming in the past century. It is
also well-understood that most of the CO2 produced by burning fossil fuels will remain in the
climate system for millennia. The risk of deleterious or even catastrophic effects of climate
change driven by increasing CO2 is now widely recognized by the relevant scientific community.
The climate system has great inertia because it contains a 4-kilometer deep ocean and 2-
kilometer thick ice sheets. As a result, global climate responds only slowly, at least initially, to
natural and human-made forcings of the system. Consequently, today's changes of atmospheric
composition will be felt most by today's young people and the unborn, in other words, by people
who have no possibility of protecting their own rights and their future well-being, and who
currently depend on others who make decisions today that have consequences over future
decades and centuries.
Governments have recognized the need to stabilize atmospheric composition at a level
that avoids dangerous anthropogenic climate change, as formalized in the Framework
Convention on Climate Change in 1992. Yet the resulting 1997 Kyoto Protocol was so
ineffective that global fossil fuel emissions have since accelerated by 2.5% per year, compared to
1.5% per year in the preceding two decades.
1 Columbia University Earth Institute, New York
2 Center for Health and the Global Environment, Harvard Medical School, Boston
3 Department of Environmental Studies, University of North Carolina at Wilmington, North Carolina
4 Global Change Institute, University of Queensland, St. Lucia, Queensland, Australia
5 Integrative Biology, University of Texas, Austin, Texas
6 Potsdam Institute for Climate Impact Research, Germany
7 Stockholm Resilience Center, Stockholm University, Sweden
8 Southhampton University, United Kingdom
9 University of Aberdeen, United Kingdom
10 Cooperative Institute for Research in Environmental Sciences, University of Colorado
11 Centre National de la Recherche Scientifique, LOCEAN, Paris (hosted by Ifremer, Brest), France
12 Earth and Planetary Science, University of California at Santa Cruz

2
Governments and businesses have learned to make assurances that they are working on
clean energies and reduced emissions, but in view of the documented emissions pathway it is not
inappropriate to describe their rhetoric as being basically 'greenwash'. The reality is that most
governments13
, strongly influenced by the fossil fuel industry, continue to allow and even
subsidize development of fossil fuel deposits. This situation was aptly described in a special
energy supplement in the New York Times entitled 'There Will Be Fuel' (Krauss, 2010), which
described massive efforts to expand fossil fuel extraction. These efforts include expansion of oil
drilling to increasing depths of the global ocean, into the Arctic, and onto environmentally fragile
public lands; squeezing of oil from tar sands; hydro-fracking to expand extraction of natural gas;
and increased mining of coal via mechanized longwall mining and mountain-top removal.
The true costs of fossil fuels to human well-being and the biosphere is not imbedded in
their price. Fossil fuels are the cheapest energy source today only if they are not made to pay for
their damage to human health, to the environment, and to the future well-being of young people
who will inherit on-going climate changes that are largely out of their control. Even a moderate
but steadily rising price on carbon emissions would be sufficient to move the world toward clean
energies, but such an approach has been effectively resisted by the fossil fuel industry.
The so-called 'north-south' injustice of climate disruption has been emphasized in
international discussions, and payment of $100B per year to developing countries has been
proposed. Focus on this injustice, as developed countries reap the economic benefits of fossil
fuels while developing countries are among the most vulnerable to the impacts of climate
change, is appropriate. Payments, if used as intended, will support adaptation to climate change
and mitigation of emissions from developing countries. We must be concerned, however, about
the degree to which such payment, from adults in the North to adults in the South, are a modern
form of indulgences, allowing fossil fuel emissions to continue with only marginal reductions or
even increase.
The greatest injustice of continued fossil fuel dominance of energy is the heaping of
climate and environmental damages onto the heads of young people and those yet to be born in
both developing and developed countries. The tragedy of this situation is that a pathway to a
clean energy future is not only possible, but even economically sensible.
Fossil fuels today power engines of economic development and thus raise the standards
of living throughout most of the world. But air and water pollution due to extraction and burning
of fossil fuels kills more than 1,000,000 people per year and affects the health of billions of
people (Cohen et al., 2005). Burning all fossil fuels would have a climate impact that literally
produces a different planet than the one on which civilization developed. The consequences for
young people, future generations, and other species would continue to mount over years and
centuries. Ice sheet disintegration would cause continual shoreline adjustments with massive
civil engineering cost implications as well as widespread heritage loss in the nearly uncountable
number of coastal cites. Shifting of climatic zones and repeated climate disruptions would have
enormous economic and social costs, especially in the developing world.
These consequences can be avoided via prompt transition to a clean energy future. The
benefits would include a healthy environment with clean air and water, preservation of the
shorelines and climatic zones that civilization is adapted to, and retention of the many benefits
humanity derives from the remarkable diversity of species with which we share this planet.
13
Some nations are working hard to reduce their emissions, some with notable success. But there is not global
recognition that most of the remaining fossil fuel carbon cannot be emitted to the atmosphere without great damage
to the future of young people.

3
It is appropriate that governments, instituted for the protection of all citizens, should be
required to safeguard the future of young people and the unborn. Specific policies cannot be
imposed by courts, but courts can require governments to present realistic plans to protect the
rights of the young. These plans should be consistent with the scientifically-established rate at
which emissions must be reduced to stabilize climate.
Science can also make clear that rapid transition to improved energy efficiency and clean
energies is not only feasible but economically sensible, and that rapid transition requires a
steadily rising price on undesirable emissions. Other actions by governments are needed, such as
enforcement of energy efficiency standards and investment in technology development.
However, without the underlying incentive of a price on carbon emissions, such actions, as well
as voluntary actions by concerned citizens, are only marginally effective. This is because such
actions reduce the demand for fossil fuels, lower their price, and thus encourage fossil fuel use
elsewhere. The price on carbon emissions, to be most effective, must be transparent and across-
the-board, for the sake of public acceptance, for guidance of consumer decisions, and for
guidance of business decisions including technology investments.
Here we summarize the emission reductions required to restore Earth's energy balance,
limit CO2 change to a level that avoids dangerous human-made interference with climate, assure
a bright future for young people and future generations, and provide a planet on which both
humans and our fellow species can continue to survive and thrive.

4
Figure 1. Global surface temperature anomalies relative to 1951-1980 mean for (a) annual and 5-year
running means through 2010, and (b) 60-month and 132-month running means through March 2011.
Green bars are 2-σ error estimates, i.e., 95% confidence intervals (data from Hansen et al., 2010).
2. Global Temperature
Global surface temperature fluctuates chaotically within a limited range and it also
responds to natural and human-made climate forcings. Climate forcings are imposed
perturbations of Earth's energy balance. Examples of climate forcings are changes in the
luminosity of the sun, volcanic eruptions that inject aerosols (fine particles) into Earth's
stratosphere, and human-caused alterations of atmospheric composition, most notably the
increase of atmospheric carbon dioxide (CO2) due to burning of fossil fuels.
2.1. Modern Temperature
Figure 1(a) shows annual-mean global temperature change over the past century. The
year-to-year variability is partly unforced chaotic variability and partly forced climate change.
For example, the global warmth of 1998 was a consequence of the strongest El Nino of the
century, a natural warming of the tropical Pacific Ocean surface associated with a fluctuation of
ocean dynamics. The strong cooling in 1992 was caused by stratospheric aerosols from the
Mount Pinatubo volcanic eruption, which temporarily reduced sunlight reaching Earth's surface
by as much as 2 percent.
Figure 1(b) shows global temperature change averaged over 5 years (60 months) and 11
years (132 months), for the purpose of minimizing year-to-year variability. The rapid warming
during the past three decades is a forced climate change that has been shown to be a consequence
of the simultaneous rapid growth of human-made atmospheric greenhouse gases, predominately
CO2 from fossil fuel burning (IPCC, 2007).
The basic physics underlying this global warming, the greenhouse effect, is simple. An
increase of gases such as CO2 makes the atmosphere more opaque at infrared wavelengths. This
added opacity causes the planet's heat radiation to space to arise from higher, colder levels in the
atmosphere, thus reducing emission of heat energy to space. The temporary imbalance between
the energy absorbed from the sun and heat emission to space, causes the planet to warm until
planetary energy balance is restored.
The great thermal inertia of Earth, primarily a consequence of the 4-kilometer (2½ mile)
deep ocean, causes the global temperature response to a climate forcing to be slow. Because

5
atmospheric CO2 is continuing to increase, Earth is significantly out of energy balance – the solar
energy being absorbed by the planet exceeds heat radiation to space. Measurement of Earth's
energy imbalance provides the most precise quantitative evaluation of how much CO2 must be
reduced to stabilize climate, as discussed in Section 2.
However, we should first discuss global temperature, because most efforts to assess the
level of climate change that would be 'dangerous' for humanity have focused on estimating a
permissible level of global warming. Broad-based assessments, represented by the 'burning
embers' diagram in IPCC (2001, 2007), suggested that major problems begin with global
warming of 2-3°C relative to global temperature in year 2000. Sophisticated probabilistic
analyses (Schneider and Mastrandrea, 2005) found a median 'dangerous' threshold of 2.85°C
above global temperature in 2000, with the 90 percent confidence range being 1.45-4.65°C.
The conclusion that humanity could readily tolerate global warming up to a few degrees
Celsius seemed to mesh with common sense. After all, people readily tolerate much larger
regional and seasonal climate variations.
The fallacy of this logic became widely apparent only in recent years. (1) Summer sea
ice cover in the Arctic plummeted in 2007 to an area 30 percent less than a few decades earlier.
Continued growth of greenhouse gases will likely cause the loss of all summer sea ice within the
next few decades, with large effects on wildlife and indigenous people, increased heat absorption
at high latitudes, and potentially the release of massive amounts of methane, a powerful
greenhouse gas, presently frozen in Arctic sediments on both land and sea floor. (2) The great
continental ice sheets of Greenland and Antarctic have begun to shed ice at a rate, now several
hundred cubic kilometers per year, which is continuing to accelerate. With the loss of protective
sea ice and buttressing ice shelves, there is a danger that ice sheet mass loss will reach a level
that causes catastrophic, and for all practical purposes irreversible, sea level rise. (3) Mountain
glaciers are receding rapidly all around the world. Summer glacier melt provides fresh water to
major world rivers during the dry season, so loss of the glaciers would be highly detrimental to
billions of people. (4) The hot dry subtropical climate belts have expanded, affecting climate
most notably in the southern United States, the Mediterranean and Middle East regions, and
Australia, contributing to more intense droughts, summer heat waves, and devastating wildfires.
(5) Coral reef ecosystems are already being impacted by a combination of ocean warming and
acidification (a direct consequence of rising atmospheric CO2), resulting in a 1-2% per year
decline in geographic extent. Coral reef ecosystems will be eliminated with continued increase
of atmospheric CO2, with huge consequences for an estimated 500 million people that depend on
the ecosystem services of coral reefs (Bruno and Selig, 2007; Hoegh-guldberg et al., 2007;
Veron et al., 2009). (6) So-called mega-heatwaves have become noticeably more frequent, for
example the 2003 and 2010 heatwaves over Europe and large parts of Russia, each with heat-
death tolls in the range of 55,000 to 70,000 (Barriopedro et al., 2011).
Reassessment of the dangerous level of global warming has been spurred by realization
that large climate effects are already beginning while global warming is less than 1°C above
preindustrial levels. The best tool for assessment is provided by paleoclimate, the history of
ancient climates on Earth.

6
Figure 2. Global temperature relative to peak Holocene temperature (Hansen and Sato, 2011).
2.2. Paleoclimate Temperature
Hansen and Sato (2011) illustrate Earth's temperature on a broad range of time scales.
Figure 2(a) shows estimated global mean temperature14
during the Pliocene and Pleistocene,
approximately the past five million years. Figure 2(b) shows higher temporal resolution, so that
the more recent glacial to interglacial climate oscillations are more apparent.
Climate variations summarized in Figure 2 are huge. During the last ice age, 20,000
years ago, global mean temperature was about 5°C lower than today. But regional changes on
land were larger. Most of Canada was under an ice sheet. New York City was buried under that
ice sheet, as were Minneapolis and Seattle. On average the ice sheet was more than a mile (1.6
km) thick. Although thinner near its southern boundary, its thickness at the location of the above
cities dwarfs the tallest buildings in today's world. Another ice sheet covered northwest Europe.
These huge climate changes were instigated by minor perturbations of Earth's orbit about
the sun and the tilt of Earth's spin axis relative to the orbital plane. By altering the seasonal and
geographical distribution of sunlight, the orbital perturbations cause small temperature change.
Temperature change then drives two powerful amplifying feedbacks: higher temperature melts
ice globally, thus exposing darker surfaces that absorb more sunlight; higher temperature also
causes the ocean and soil to release CO2 and other greenhouse gases. These amplifying
feedbacks are responsible for practically the entire glacial-to-interglacial temperature change.
In these slow natural climate changes the amplifying feedbacks (ice area and CO2
amount) acted as slaves to weak orbital forcings. But today CO2, global temperature, and ice
area are under the command of humanity: CO2 has increased to levels not seen for at least 3
million years, global temperature is rising, and ice is melting rapidly all over the planet. Another
ice age will never occur, unless humans go extinct. A single chlorofluorocarbon factory can
produce gases with a climate forcing that exceeds the forcing due to Earth orbital perturbations.
14
This estimate of global mean temperature is obtained from ocean sediments at many locations around the world
(Zachos et al., 2001; Hansen et al., 2008). The composition of the shells of deep-sea-dwelling microscopic animals
(foraminifera), preserved in ocean sediments, carry a record of ocean temperature. Deep ocean temperature change
is about two-thirds as large as global mean surface temperature change for the range of climates from the last ice age
to the present interglacial period; that proportionality factor is included in Figure 2.

7
During the climate oscillations summarized in Figure 2, Earth's climate remained in near
equilibrium with its changing boundary conditions, i.e., with changing ice sheet area and
changing atmospheric CO2. These natural boundary conditions changed slowly, over millennia,
because the principal Earth orbital perturbations occur on time scales predominately in the range
of 20,000 to 100,000 years.
Human-made changes of atmospheric composition are occurring much faster, on time
scales of decades and centuries. The paleoclimate record does not tell us how rapidly the climate
system will respond to the high-speed human-made change of climate forcings – our best guide
will be observations of what is beginning to happen now. But the paleoclimate record does
provide an indication of the eventual consequences of a given level of global warming.
The Eemian and Hosteinian interglacial periods, also known as marine isotope stages 5e
and 11, respectively about 130,000 and 400,000 years ago, were warmer than the Holocene, but
global mean temperature in those periods was probably less than 1°C warmer than peak
Holocene temperature (Figure 2b). Yet it was warm enough for sea level to reach mean levels 4-
6 meters higher than today.
Global mean temperature 2°C higher than peak Holocene temperature has not existed
since at least the Pliocene, a few million years ago. Sea level at that time was estimated to have
been 15-25 meters higher than today (Dowsett et al., 1999). Changes of regional climate during
these warm periods were much greater than the global mean changes.
How does today's global temperature, given the warming of the past century, compare
with prior peak Holocene temperature? Holocene climate has been highly variable on a regional
basis (Mayewski et al., 2004). However, Hansen and Sato (2011) show from records at several
places around the globe that mean temperature has been remarkably constant during the
Holocene. They estimate that the warming between the 1800s and the period 1951-1980 (a
warming of ~0.25°C in the Goddard Institute for Space Studies analysis, Hansen et al., 2010)
brought global temperatures back to approximately the peak Holocene level.
If the 1951-1980 global mean temperature approximates peak Holocene temperature, this
implies that global temperature in 2000 (5-year running mean) was already 0.45°C above the
peak Holocene temperature. The uncertainty in the peak Holocene temperature is a least several
tenths of a degree Celsius. However, strong empirical evidence that global temperature has
already risen above the prior peak Holocene temperature is provided by the ongoing mass loss of
the Greenland and West Antarctic ice sheets, which began within the last fewdecades. Sea level
was relatively stable for the past five to six thousand years, indicating that these ice sheets were
in near mass balance. Now, however, both Greenland and West Antarctica are shedding ice at
accelerating rates. This is strong evidence that today's global temperature has reached a level
higher than prior Holocene temperatures.
The conclusion is that global warming of 1°C relative to 1880-1920 mean temperature
(i.e., 0.75°C above the 1951-1980 temperature or 0.3°C above the 5-year running mean
temperature in 2000), if maintained for long, is already close to or into the 'dangerous' zone. The
suggestion that 2°C global warming may be a 'safe' target is extremely unwise based on critical
evidence accumulated over the past three decades. Global warming of this amount would be
putting Earth on a path toward Pliocene-like conditions, i.e., a very different world marked by
massive and continual disruptions to both society and ecosystems. It would be a world in which
the world's species and ecosystems will have had no recent evolutionary experience, surely with
consequences and disruptions to the ecosystem services that maintain human communities today.
There are no credible arguments that such rapid change would not have catastrophic
circumstances for human well-being.

8
Figure 3. (a) Estimated planetary energy imbalance in 1993-2008, and (b) in 2005-2010. Data sources
are given by Hansen et al. (2011).
3. Earth's Energy Imbalance
Earth's energy balance is the ultimate measure of the status of Earth's climate. In a period
of climate stability, Earth radiates the same amount of energy to space that it absorbs from
incident sunlight. Today it is anticipated that Earth is out of balance because of increasing
atmospheric CO2. Greenhouse gases such as CO2 reduce Earth's heat radiation to space, thus
causing a temporary energy imbalance, more energy coming in than going out. This imbalance
causes Earth to warm until energy balance is restored.
The immediate planetary energy imbalance due to an increase of CO2 can be calculated
precisely. It does not require a climate model. The radiation physics is rigorously understood.
However, the current planetary energy imbalance is complicated by the fact that increasing CO2
is only one of the factors affecting Earth's energy balance, and Earth has already partly
responded to the net climate forcing by warming 0.8°C in the past century.
Thus authoritative determination of the state of the climate system requires measuring the
planet's current energy imbalance. This is a technical challenge, because the magnitude of the
imbalance is expected to be only about 1 W/m2 or less, so measurements must have an accuracy
that approaches 0.1 W/m2. The most promising approach to achieve this accuracy is to measure
ongoing changes of the heat content of the ocean, atmosphere, land, and ice on the planet.
The vast global ocean is the primary reservoir for changes of Earth's heat content.
Because of the importance of this measurement, nations of the world launched a cooperative
Argo float program, which has distributed more than 3000 floats around the world ocean
(Roemmich and Gilson, 2009). Each float repeatedly yoyos an instrument package to a depth of
two kilometers and satellite-communicates the data to shore.
The Argo program did not attain planned distribution of floats until late 2007, but
coverage reached 90% by 2005, allowing good accuracy provided that systematic measurement
errors are kept sufficiently small. Prior experience showed how difficult it is to eliminate all
measurement biases, but the exposure of the difficulties over the past decade leads to
expectationthat the data for the 6-year period 2005-2010 are the most precise achieved so far.
The estimated standard error for that period, necessarily partly subjective, is 0.15 W/m2.15
15
Barker et al. (2011) describe a remaining bias due to sensor drift in pressure measurements. That bias is reduced
in the analysis of von Schuckmann and Le Traon by excluding data from floats on a pressure-bias black list and data
from profiles that fail climatology checks, but errors remain and require further analysis.

9
Smaller contributions to the planetary energy imbalance, from changes in the heat
content of the land, ice and atmosphere, are also know more accurately in recent years. A key
improvement during the past decade has been provided by the GRACE satellite that measures
Earth's gravitational field with a precision that allows the rate of ice loss by Greenland and
Antarctica to be monitored accurately.
Figure 3 summarizes the results of analyses of Earth's energy imbalance averaged over
the periods 1993-2008 and 2005-2010. In the period 1993-2008 the planetary energy imbalance
ranges from 0.57 W/m2 to 0.80 W/m
2 among different analyses, with the lower value based on
upper ocean heat content analysis of Levitus et al. (2009) and the higher value based on Lyman
et al. (2010). For the period 2005-2010 the upper ocean heat content change is based on analysis
of the Argo data by von Schuckmann and Le Traon (2011), which yields a planetary energy
imbalance of 0.59 ± 0.15 W/m2 (Hansen et al., 2011).
The energy imbalance in 2005-2010 is particularly important, because that period
coincides with the lowest level of solar irradiance in the period since satellites began measuring
the brightness of the sun in the late 1970s. Changes of solar irradiance are often hypothesized as
being the one natural climate forcing with the potential to compete with human-made climate
forcings, so measurements during the strongest solar minimum on record provide a conclusive
evaluation of the sun's potential to reduce the planet's energy imbalance.
The conclusion is that Earth is out of energy balance by at least ~0.5 W/m2. Our
measured 0.59 W/m2 for 2005-2010 suggests that the average imbalance over the 11-year solar
cycle may be closer to 0.75 W/m2.
This planetary energy imbalance is substantial, with implications for future climate
change. It means that global warming will continue on decadal time scales, as the 0.8°C global
warming so far is the response to only about half of the net human-made climate forcing.
Knowledge of Earth's energy imbalance allows us to specify accurately how much CO2
must be reduced to restore energy balance and stabilize climate. CO2 must be reduced from the
current level of 390 ppm to 360 ppm to increase Earth's heat radiation to space by 0.5 W/m2, or
to 345 ppm to increase heat radiation to space by 0.75 W/m2, thus restoring Earth's energy
balance and stabilizing climate.
Earth's energy imbalance thus provides accurate affirmation of a conclusion reached
earlier (Hansen et al., 2008), that the appropriate initial target level of atmospheric CO2 to
stabilize climate is "<350 ppm". This target level may need to be adjusted as it is approached,
but, considering the time required to achieve a reversal of atmospheric CO2 growth, more precise
knowledge of the ultimate target for CO2 will be available by the time CO2 has been restored to a
level approaching 350 ppm.
One reason that more precise specification than "<350 ppm" is inadvisable now is the
uncertainty about the net effect of changes of other human-made climate forcings such as
methane, other trace gases, reflecting aerosols, black soot, and the surface reflectivity. These
forcings are smaller than that by CO2, but not negligible.
Indeed, there is a concern that expected future reductions of particulate air pollution will
exacerbate global warming via reduction of reflective aerosols. It has been suggested (Hansen et
al., 2000) that a concerted effort to reduce methane, tropospheric ozone, other trace gases and
black soot could substantially reduce the human-made climate forcing, possibly enough to
counteract the warming effect of a decline in reflective aerosols. Our calculations of future
global temperature in section 5 assume that a major effort will be made to reduce the non-CO2
forcings sufficient to obviate warming due to a decline of reflective aerosols. To the degree that
this goal is not achieved, future warming could exceed that which we calculate.

10
Figure 4. (a) Decay of instantaneous (pulse) injection and extraction of atmospheric CO2, (b)
atmospheric CO2 if fossil fuel emissions terminated at end of 2011, 2030, 2050.
The important point is that CO2 is the dominant climate forcing agent and it will be all
the more so in the future. The CO2 injected into the climate system by burning fossil fuels will
continue to affect our climate for millennia. We cannot burn all of the fossil fuels without
producing a different planet, with changes occurring with a rapidity that will make Earth far less
hospitable for young people, future generations, and most other species.
4. Carbon Cycle and Atmospheric CO2
The 'carbon cycle' that defines the fate of fossil fuel carbon injected into the climate
system is well understood. This knowledge allows accurate estimation of the amount of fossil
fuels that can be burned consistent with stabilization of climate this century.
Atmospheric CO2 is already about 390 ppm. Is it possible to return to 350 ppm or less
within this century? Yes. Atmospheric CO2 would decrease if we phased out fossil fuels. The
CO2 injected into the air by burning fossil fuels becomes distributed, over years, decades, and
centuries, among the surface carbon reservoirs: the atmosphere, ocean, soil, and biosphere.
Carbon cycle models simulate how the CO2 injected into the atmosphere becomes
distributed among the carbon reservoirs. We use the well-tested Bern carbon cycle model (Joos
et al., 1996)16
to illustrate how rapidly atmospheric CO2 can decrease.
Figure 4 (a) shows the decay of a pulse of CO2 injected into the air. The atmospheric
amount is reduced by half in about 25 years. However, after 500 years about one-fifth of the
CO2 is still in the atmosphere. Eventually, via weathering of rocks, this excess CO2 will be
deposited on the ocean floor as carbonate sediments. However, that process requires millennia.
It is informative, for later policy considerations, to note that a negative CO2 pulse decays
at about the same rate as positive pulse. Thus if we decide to suck CO2 from the air, taking CO2
out of the carbon cycle, for example by storing it in carbonate bricks, the magnitude of the CO2
change will decline as the negative increment becomes spread among the carbon reservoirs.
It is also informative to examine how fast atmospheric CO2 would decline if fossil fuel
use were halted today, or in 20 years, or in 40 years. Results are shown in Figure 4 (b). If
emissions were halted in 2011, CO2 would decline to 350 ppm at mid-century. With a 20 year
16
Specifically, we use the dynamic-sink pulse-response function representation of the Bern carbon cycle model
(Joos et al., 1996), as described by Kharecha and Hansen (2008) and Hansen et al. (2008).

11
delay in halting emissions, CO2 returns to 350 ppm at about 2250. With a 40 year delay, CO2
does not return to 350 ppm until after year 3000.
The scenarios in Figure 4 (b) assume that emissions continue to increase at the 'business-
as-usual' (BAU) rate of the past decade (increasing by just over 2% per year) until they are
suddenly halted. The results are indicative of how difficult it will be to get back to 350 ppm, if
fossil fuel emissions continue to accelerate.
Do these results imply that it is implausible to get back to 350 ppm in a way that is
essentially 'natural', i.e., in a way other than a 'geo-engineering' approach that sucks CO2 from
the air? Not necessarily. There is one other major factor, in addition to fossil fuel use, that
affects atmospheric CO2 amount: deforestation/reforestation.
Fossil fuel emissions account for about 80 percent of the increase of atmospheric CO2
from 275 ppm in the preindustrial atmosphere to 390 ppm today. The other 20 percent is from
net deforestation (here net deforestation accounts for any forest regrowth in that period). We
take net deforestation over the industrial era to be about 100 GtC (gigatons of carbon), with an
uncertainty of at least 50 percent (Stocker et al., 2011)17
.
There is considerable potential for extracting CO2 from the atmosphere via reforestation
and improved forestry and agricultural practices. The largest practical extraction is probably
about 100 GtC (IPCC, 2001), i.e., equivalent to restoration of deforested land. Complete
restoration of deforested areas is unrealistic, yet a 100 GtC drawdown seems feasible for the
following reasons: (1) the current human-enhanced atmospheric CO2 level leads to an increase
of carbon uptake by vegetation and soils, (2) improved agricultural practices can convert
agriculture from being a large CO2 source into a carbon sink, as discussed in the following
paragraph, (3) part of this CO2 drawdown can be achieved by burning biomass at powerplants
and capturing the CO2, with the provision that the feedstock for this bioenergy is residues and
wastes, unlike most current-generation bioenergy sources, thus avoiding loss of natural
ecosystems and cropland (Tilman et al., 2006; Fargione et al., 2008; Searchinger et al., 2008).
Competing uses for land – primarily expansion of agriculture to supply a growing world
population – could complicate reforestation efforts. A decrease in the use of animal products
would substantially decrease the demand for agricultural land, as more than half of all crops are
currently fed to livestock (Stehfest et al., 2009; UNEP, 2010).
The 100 GtC 'reforestation' thus is a major task, but it is needed to get CO2 back to 350
ppm and it is an opportunity to achieve other major benefits. Present agricultural practices,
based on plowing and chemical fertilizers, are dependent on fossil fuels and contribute to loss of
carbon from soil via land degradation. World agriculture could sequester 0.4-1.2 GtC per year
by adopting minimum tillage and biological nutrient recycling (Lal, 2004). Such a strategy can
also increase water conservation in soils, build agricultural resilience to climate change, and
increase productivity especially in smallholder rain-fed agriculture, thereby reducing expansion
of agriculture into forested ecosystems (Rockstrom et al., 2009).
We thus assume a 100 GtC drawdown (biospheric C uptake) in our reforestation
scenarios, with this obtained via a sinusoidal drawdown over the period 2031-2080. Alternative
timings for this reforestation drawdown of CO2 would have no qualitative effect on our
conclusions about the potential for achieving a given CO2 level such as 350 ppm.
17
Net historical deforestation of 100 GtC and historical fossil fuel use yield good agreement with historical growth
of atmospheric CO2 (Figure S16 of Hansen et al., 2008), based on simulations with the Bern carbon cycle model.

12
Figure 5. (a) Atmospheric CO2 if fossil fuel emissions are cut 6% per year beginning in 2012 and 100
GtC reforestation drawdown occurs in the 2031-2080 period, (b) Atmospheric CO2 with BAU emission
increases until 2020, 2030, 2045, and 2060, followed by 5% per year emission reductions.
Figure 5 (a) shows that 100 GtC reforestation results in atmospheric CO2 declining to 350
ppm by the end of this century, provided that fossil fuel emissions decline by 6% per year
beginning in 2013. Figure 5 (b) shows the effect of continued BAU fossil fuel emission (just
over 2% per year) until 2020, 2030, 2045 and 2060 with 100 GtC reforestation in 2031-2080.
The scenario with emission cuts beginning in 2020 has atmospheric CO2 return to 350
ppm at about 2300. If the initiation of emissions reduction is delayed to 2030 or later, then
atmospheric CO2 does not return to the 350 ppm level even by 2500.
The conclusion is that a major reforestation program does permit the possibility of
returning CO2 to the 350 ppm level within this century, but only if fossil fuel emission reductions
begin promptly.
What about artificially drawing down atmospheric CO2? Some people may argue that,
given the practical difficulty of overcoming fossil fuel lobbyists and persuading governments to
move rapidly toward post-fossil-fuel clean energy economies, 'geo-engineering' is the only hope.
At present there are no large-scale technologies for air capture of CO2. It has been suggested
that with strong research and development support and industrial scale pilot projects sustained
over decades, it may be possible to achieve costs of about ~$200/tC (Keith et al., 2006).
At this rate, the cost of removing 50 ppm18
of CO2 is ~$20 trillion. However, as shown
by Figure 4 (a), the resulting atmospheric CO2 reduction is only ~15 ppm after 100 years,
because most of the extraction will have leaked into other surface carbon reservoirs. The cost of
CO2 extraction needed to maintain a 50 ppm reduction on the century time scale is thus better
estimated as ~$60 trillion.
In section 7 we note the economic and social benefits of rapidly phasing over to clean
energies and increased energy efficiency, as opposed to continued and expanded extraction of
fossil fuels. For the moment, we simply note that the present generation will be passing the CO2
clean-up costs on to today's young people and future generations.
5. Future Global Temperature Change
Future global temperature change will depend primarily upon atmospheric CO2 amount.
Although other greenhouse gases, such as methane and chlorofluorocarbons, contributed almost
18
The conversion factor to convert atmospheric CO2 in ppm to GtC is 1 ppm ~ 2.12 GtC.
13
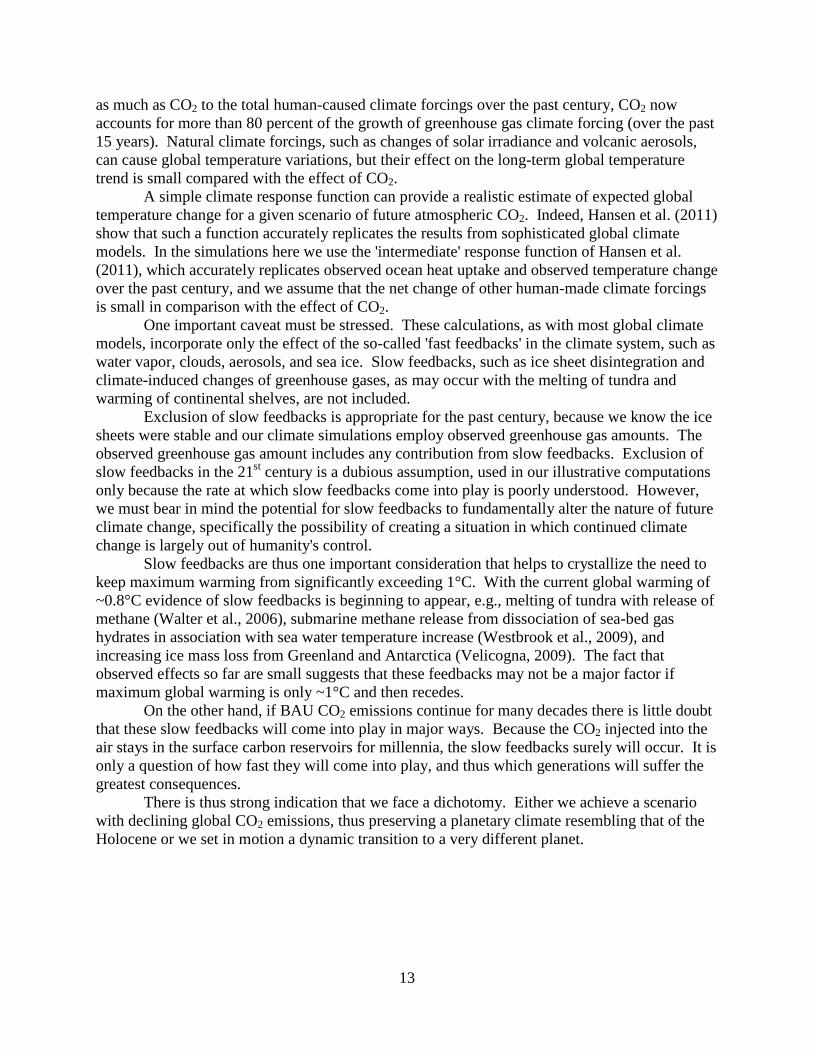
as much as CO2 to the total human-caused climate forcings over the past century, CO2 now
accounts for more than 80 percent of the growth of greenhouse gas climate forcing (over the past
15 years). Natural climate forcings, such as changes of solar irradiance and volcanic aerosols,
can cause global temperature variations, but their effect on the long-term global temperature
trend is small compared with the effect of CO2.
A simple climate response function can provide a realistic estimate of expected global
temperature change for a given scenario of future atmospheric CO2. Indeed, Hansen et al. (2011)
show that such a function accurately replicates the results from sophisticated global climate
models. In the simulations here we use the 'intermediate' response function of Hansen et al.
(2011), which accurately replicates observed ocean heat uptake and observed temperature change
over the past century, and we assume that the net change of other human-made climate forcings
is small in comparison with the effect of CO2.
One important caveat must be stressed. These calculations, as with most global climate
models, incorporate only the effect of the so-called 'fast feedbacks' in the climate system, such as
water vapor, clouds, aerosols, and sea ice. Slow feedbacks, such as ice sheet disintegration and
climate-induced changes of greenhouse gases, as may occur with the melting of tundra and
warming of continental shelves, are not included.
Exclusion of slow feedbacks is appropriate for the past century, because we know the ice
sheets were stable and our climate simulations employ observed greenhouse gas amounts. The
observed greenhouse gas amount includes any contribution from slow feedbacks. Exclusion of
slow feedbacks in the 21st century is a dubious assumption, used in our illustrative computations
only because the rate at which slow feedbacks come into play is poorly understood. However,
we must bear in mind the potential for slow feedbacks to fundamentally alter the nature of future
climate change, specifically the possibility of creating a situation in which continued climate
change is largely out of humanity's control.
Slow feedbacks are thus one important consideration that helps to crystallize the need to
keep maximum warming from significantly exceeding 1°C. With the current global warming of
~0.8°C evidence of slow feedbacks is beginning to appear, e.g., melting of tundra with release of
methane (Walter et al., 2006), submarine methane release from dissociation of sea-bed gas
hydrates in association with sea water temperature increase (Westbrook et al., 2009), and
increasing ice mass loss from Greenland and Antarctica (Velicogna, 2009). The fact that
observed effects so far are small suggests that these feedbacks may not be a major factor if
maximum global warming is only ~1°C and then recedes.
On the other hand, if BAU CO2 emissions continue for many decades there is little doubt
that these slow feedbacks will come into play in major ways. Because the CO2 injected into the
air stays in the surface carbon reservoirs for millennia, the slow feedbacks surely will occur. It is
only a question of how fast they will come into play, and thus which generations will suffer the
greatest consequences.
There is thus strong indication that we face a dichotomy. Either we achieve a scenario
with declining global CO2 emissions, thus preserving a planetary climate resembling that of the
Holocene or we set in motion a dynamic transition to a very different planet.

14
Figure 6. Simulated future global temperature for the CO2 scenarios of Figure 5. Observed temperature
record is from Hansen et al. (2010). Temperature is relative to the 1880-1920 mean. Subtract 0.26°C to
use 1951-1980 as zero-point. Subtract 0.70°C to use 5-year running mean in 2000 as zero point.
Can we define the level of global warming that would necessarily push us into such a
dynamic transition? Given present understanding of slow feedbacks, we cannot be precise.
However, consider the case in Figure 6 in which BAU emissions continue to 2030. In that case,
even though CO2 emissions are phased out rapidly (5% per year emission reductions) after 2030
and 100 GtC reforestation occurs in 2031-2080, the (fast-feedback) human-caused global
temperature rise reaches 1.5°C and stays above 1°C until after 2500. It is highly unlikely that the
major ice sheets could remain stable at their present size with such long-lasting warmth. Even if
BAU is continued only until 2020, the temperature rise exceeds 1°C for about 100 years.
In contrast to scenarios with continued BAU emissions, Figure 6 (a) shows the scenario
with 6% per year decrease of fossil fuel CO2 emissions and 100 GtC reforestation in the period
2031-2080. This scenario yields additional global warming of ~0.3°C. Global temperature
relative to the 1880-1920 mean would barely exceed 1°C and would remain above 1°C for only
about 3 decades. Thus this scenario provides the prospect that young people, future generations,
and other life on the planet would have a chance of residing in a world similar to the one in
which civilization developed.
The precise consequences if BAU emissions continue several decades are difficult to
define, because such rapid growth of climate forcing would take the world into uncharted
territory. Earth has experienced a huge range of climate states during its history, but there has
never been such a large rapid increase of climate forcings as would occur with burning of most
fossil fuels this century. The closest analogy in Earth's history is probably the PETM
(Paleocene-Eocene Thermal Maximum) in which rapid global warming of at least 5°C occurred
(Zachos et al., 2001), probably as a consequence of melting methane hydrates (Zeebe et al.,
2009). The PETM is instructive because it occurred during a 10-million year period of global
warming, and thus the methane release was probably a feedback effect magnifying the warming.
Global warming that occurred over the period from 60 Mya (million years ago) to 50
Mya can be confidently ascribed to increasing atmospheric CO2. That was the period in which
the Indian subcontinent was moving rapidly through the Indian Ocean, just prior to its collision
with Asia, when it began to push up the Himalayan Mountains and Tibetan Plateau. Continental

15
drift over carbonate-rich ocean crust is the principal source of CO2 from the solid Earth to the
surface reservoirs of carbon.19
The global warming between 60 Mya and 50 Mya was about 5°C, thus at a rate less than
1°C per million years. Approximately 55 Mya there was, by paleoclimae standards, a very rapid
release of 3000-5000 GtC into the surface climate system, presumably from melting of methane
hydrates based on the absence of any other known source of that magnitude. This injection of
carbon and rapid additional warming of about 5°C occurred over a period of about 10,000 years,
with most of the carbon injection during two 1-2 thousand year intervals. The PETM witnessed
the extinction of almost half of the deep ocean foraminifera (microscopic shelled animals, which
serve as a biological indicator for ocean life in general), but, unlike several other large warming
events in Earth's history, there was little extinction of land plants and animals.
The important point is that the rapid PETM carbon injection was comparable to what will
occur if humanity burns most of the fossil fuels, but the PETM occurred over a period that was
10-100 times longer. The ability of life on Earth today to sustain a climate shock comparable to
the PETM but occurring 10-100 times faster is highly problematic, at best. Climate zones would
be shifting at a speed far faster than species have ever faced. Thus if humanity continues to burn
most of the fossil fuels, Earth, and all of the species residing on it, will be pushed into uncharted
climate change territory, with consequences that are practically impossible to foresee.
6. Consequences of Continued Global Warming
The unparalleled rapidity of the human-made increase of global climate forcing implies
that there are no close paleoclimate analogies to the current situation. However, the combination
of paleoclimate data and observations of ongoing climate change provide useful insight.
Paleoclimate data serve mainly as an indication of likely long-term responses to changed
boundary conditions. Observations of ongoing climate change provide information relevant to
the rate at which changes may occur.
Yet we must bear in mind that some important processes, such as ice sheet disintegration
and species extermination, have the potential to be highly non-linear. That means changes can
be slow until a tipping point is reached (Lenton et al., 2008) and more rapid change occurs.
Sea level. If most fossil fuels are burned global temperatures will rise at least several
degrees Celsius. The eventual sea level change in response to the global warming will be many
meters and global coast lines will be transfigured. We do not know how rapidly ice sheets can
disintegrate, because Earth has never experienced such rapid global warming. However, even
moderate sea level rise will create millions of global warming refugees from highly-populated
low-lying areas, who must migrate from the coastline, throwing existing global demographics
into chaos.
During the most recent prior interglacial period, the Eemian, global temperature was at
most of the order of 1°C warmer than the Holocene (Figure 2). Sea level reached heights several
meters above today's level and there were instances of sea level change by 1-2 meters per century
(Rohling et al., 2008; Muhs et al., 2011). Hearty and Neumann (2001) and Hearty et al. (2007)
interpret geologic shoreline evidence as indicating a rapid sea level rise to a peak 6-9 meters
above present late in the Eemian followed by a precipitous sea level fall, but there is not
unanimity in the research community about this specific history. The important point is that the
19
The principal sink of CO2, i.e., the mechanism that returns carbon to the solid Earth on long time scales, is the
weathering process. Chemical reactions associated with weathering of rocks results in rivers carrying carbonate
sediments that are deposited on the ocean floor.

16
high sea level excursions in the Eemian imply rapid partial melting of Antarctic and/or
Greenland ice when the world was little warmer than today. During the Pliocene, when global
mean temperature may have been 2°C warmer than the Holocene (Figure 2), sea level was
probably 15-25 meters higher than today (Dowsett et al., 1999, 2009; Naish et al., 2009).
Expected sea level rise due to human-caused climate change has been controversial partly
because the discussion and the predictions of IPCC (2001, 2007) have focused on sea level rise
at a specific date, 2100. Recent estimates of likely sea level rise by 2100 are of the order of 1 m
(Vermeer and Rahmstorf, 2009; Grinsted et al., 2010). Ice-dynamics studies estimate that rates
of sea-level rise of 0.8 to 2 m per century are feasible (Pfeffer et al., 2008) and Antarctica alone
may contribute up to 1.5 m per century (Turner et al., 2009). Hansen (2005, 2007) has argued
that BAU CO2 emissions produce a climate forcing so much larger than any experienced in prior
interglacial periods that a non-linear ice sheet response with multi-meter sea level rise may occur
this century.
The best warning of an imminent period of sustained nonlinear ice sheet loss will be
provided by accurate measurements of ice sheet mass. The GRACE satellite, which has been
measuring Earth's gravitational field since 2003 reveals that the Greenland ice sheet is losing
mass at an accelerating rate, now more than 200 cubic kilometers per year, and Antarctica is
losing more than 100 cubic kilometers per year (Sorensen and Forsberg, 2010; Rignot et al.,
2011). However, the present rate of sea level rise, 3 cm per decade, is moderate, and the ice
sheet mass balance record is too short to determine whether we have entered a period of
continually accelerating ice loss.
Satellite observations of Greenland show that the surface area with summer melting has
increased over the period of record, which extends back to the late 1970s (Steffen et al., 2004;
Tedesco et al., 2011). Yet the destabilizing mechanism of greatest concern is melting of ice
shelves, tongues of ice that extend from the ice sheets into the oceans and buttress the ice sheets,
limiting the rate of discharge of ice to the ocean. Ocean warming is causing shrinkage of ice
shelves around Greenland and Antarctica (Rignot and Jacobs, 2002).
Loss of ice shelves can open a pathway to the ocean for portions of the ice sheets that rest
on bedrock below sea level. Most of the West Antarctic ice sheet, which alone could raise sea
level by 6 meters, is on bedrock below sea level, so it is the ice sheet most vulnerable to rapid
change. However, parts of the larger East Antarctic ice sheet are also vulnerable. Indeed,
satellite gravity and radar altimetry reveal that the Totten Glacier of East Antarctica, fronting a
large ice mass grounded below sea level, is already beginning to lose mass (Rignot et al., 2008)
The important point is that uncertainties about sea level rise mainly concern the timing of
large sea level rise if BAU emissions continue, not whether it will occur. If all or most fossil
fuels are burned, the carbon will be in the climate system for many centuries, in which case
multi-meter sea level rise should be expected (e.g., Rohling et al., 2009).
Children born today can expect to live most of this century. If BAU emissions continue,
will they suffer large sea level rise, or will it be their children, or their grandchildren?
Shifting climate zones. Theory and climate models indicate that subtropical regions will
expand poleward with global warming (Held and Soden, 2006; IPCC, 2007). Observations
reveal that a 4-degree poleward expansion of the subtropics has occurred already on average
(Seidel and Randel, 2006), yielding increased aridity in southern United States (Barnett et al.,
2008; Levi, 2008), the Mediterranean region, and Australia. Increased aridity and temperatures
have contributed to increased forest fires that burn hotter and are more destructive in all of these
regions (Westerling et al., 2006).
17
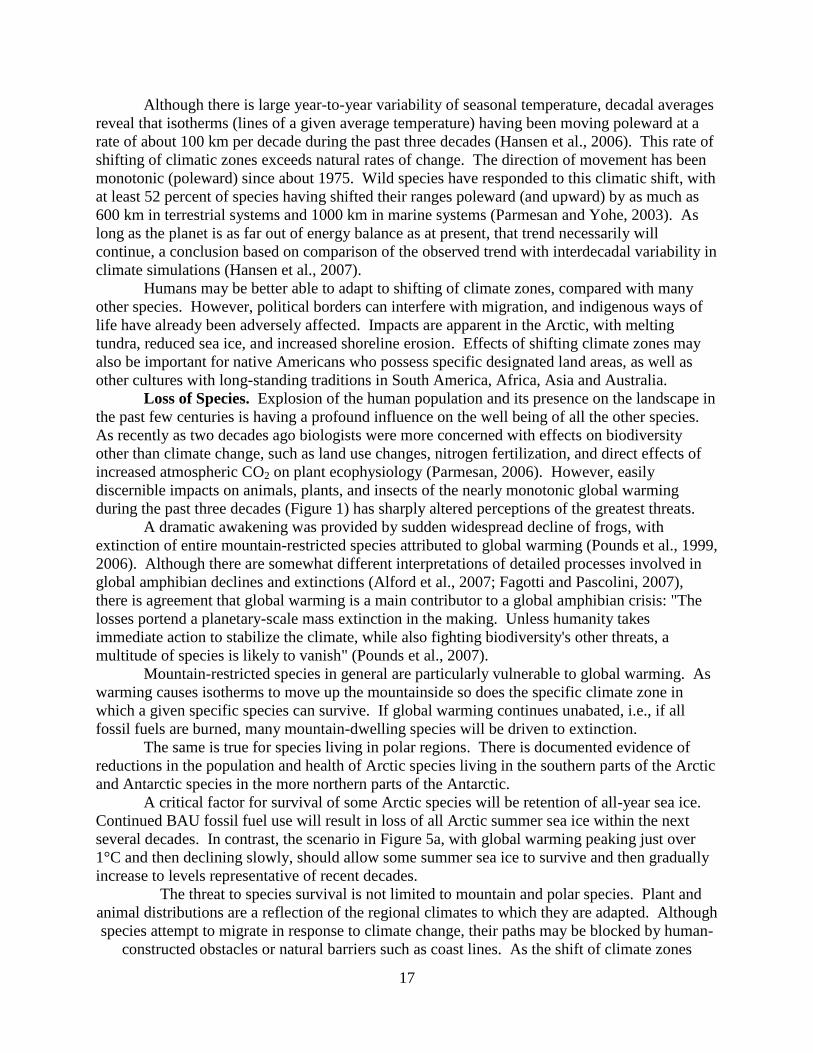
Although there is large year-to-year variability of seasonal temperature, decadal averages
reveal that isotherms (lines of a given average temperature) having been moving poleward at a
rate of about 100 km per decade during the past three decades (Hansen et al., 2006). This rate of
shifting of climatic zones exceeds natural rates of change. The direction of movement has been
monotonic (poleward) since about 1975. Wild species have responded to this climatic shift, with
at least 52 percent of species having shifted their ranges poleward (and upward) by as much as
600 km in terrestrial systems and 1000 km in marine systems (Parmesan and Yohe, 2003). As
long as the planet is as far out of energy balance as at present, that trend necessarily will
continue, a conclusion based on comparison of the observed trend with interdecadal variability in
climate simulations (Hansen et al., 2007).
Humans may be better able to adapt to shifting of climate zones, compared with many
other species. However, political borders can interfere with migration, and indigenous ways of
life have already been adversely affected. Impacts are apparent in the Arctic, with melting
tundra, reduced sea ice, and increased shoreline erosion. Effects of shifting climate zones may
also be important for native Americans who possess specific designated land areas, as well as
other cultures with long-standing traditions in South America, Africa, Asia and Australia.
Loss of Species. Explosion of the human population and its presence on the landscape in
the past few centuries is having a profound influence on the well being of all the other species.
As recently as two decades ago biologists were more concerned with effects on biodiversity
other than climate change, such as land use changes, nitrogen fertilization, and direct effects of
increased atmospheric CO2 on plant ecophysiology (Parmesan, 2006). However, easily
discernible impacts on animals, plants, and insects of the nearly monotonic global warming
during the past three decades (Figure 1) has sharply altered perceptions of the greatest threats.
A dramatic awakening was provided by sudden widespread decline of frogs, with
extinction of entire mountain-restricted species attributed to global warming (Pounds et al., 1999,
2006). Although there are somewhat different interpretations of detailed processes involved in
global amphibian declines and extinctions (Alford et al., 2007; Fagotti and Pascolini, 2007),
there is agreement that global warming is a main contributor to a global amphibian crisis: "The
losses portend a planetary-scale mass extinction in the making. Unless humanity takes
immediate action to stabilize the climate, while also fighting biodiversity's other threats, a
multitude of species is likely to vanish" (Pounds et al., 2007).
Mountain-restricted species in general are particularly vulnerable to global warming. As
warming causes isotherms to move up the mountainside so does the specific climate zone in
which a given specific species can survive. If global warming continues unabated, i.e., if all
fossil fuels are burned, many mountain-dwelling species will be driven to extinction.
The same is true for species living in polar regions. There is documented evidence of
reductions in the population and health of Arctic species living in the southern parts of the Arctic
and Antarctic species in the more northern parts of the Antarctic.
A critical factor for survival of some Arctic species will be retention of all-year sea ice.
Continued BAU fossil fuel use will result in loss of all Arctic summer sea ice within the next
several decades. In contrast, the scenario in Figure 5a, with global warming peaking just over
1°C and then declining slowly, should allow some summer sea ice to survive and then gradually
increase to levels representative of recent decades.
The threat to species survival is not limited to mountain and polar species. Plant and
animal distributions are a reflection of the regional climates to which they are adapted. Although
species attempt to migrate in response to climate change, their paths may be blocked by human-
constructed obstacles or natural barriers such as coast lines. As the shift of climate zones

18
Figure 7. Extant reefs used as analogs (Hoegh-Guldberg et al., 2007) for ecological structures anticipated
for scenarios A (375 ppm CO2, +1°C), B (450-500 ppm CO2, +2°C), C (>500 ppm CO2, >+3°C)
becomes comparable to the range of some species, the less mobile species will be driven to
extinction. Because of extensive species interdependencies, this can lead to mass extinctions.
The IPCC Working Group II assessment (IPCC WG-II, 2007) reviews studies relevant to
estimating the eventual extinction rate for different magnitudes of global warming. If global
warming relative to the pre-industrial level exceeds 1.5°C, they estimate that 9-31 percent of
species will be committed to extinction. With global warming of 2.7°C, an estimated 21-52
percent of species will be committed to extinction.
Mass extinctions have occurred in conjunction with rapid climate change during Earth's
long history, and new species evolved over hundreds of thousands and millions of years. But
such time scales are almost beyond human comprehension. If we drive many species to
extinction we will leave a more desolate planet for our children, grandchildren, and as many
generations as we can imagine.
Coral reef ecosystems. Coral reef ecosystems are the most biologically diverse marine
ecosystem, often described as the rainforests of the ocean. An estimated 1-9 million species
(most of which have not yet been described; Reaka-Kudla 1997) populate coral reef ecosystems
generating ecosystem services that are crucial to the well-being of at least 500 million people
that populate tropical coastal areas. These coral reef ecosystems are vulnerable to current and
future warming and acidification of tropical oceans. Acidification arises due to the production of
carbonic acid as increasing amounts of CO2 enter the world's oceans. Comparison of current
changes with those seen in the palaeontological record indicate that ocean pH is already outside
where it has been for several million years (Raven et al. 2005; Pelejero et al. 2010).
Mass coral bleaching and a slowing of coral calcification are already disrupting coral reef
ecosystem health (Hoegh-Guldberg et al 2007; De’Ath et al. 2009). The decreased viability of
reef-building corals have led to mass mortalities, increasing coral disease, and slowing of reef
carbonate accretion. Together with more local stressors, the impacts of global climate change
and ocean acidification are driving a rapid contraction (1-2% per year, Bruno and Selig 2007) in
the extent of coral reef ecosystems.
Figure 7 shows extant reefs that are analogs for ecological structures anticipated by
Hoegh-Guldberg et al. (2007) to be representative of ocean warming and acidification expected
to accompany CO2 levels of 375 ppm with +1°C, 450-500 ppm with +2°C, and >500 ppm with >

19
+3°C. Loss of the three-dimensional framework that typifies coral reefs today has consequences
for the millions of species that depend on this coral reef framework for their existence. The loss
of these three-dimensional frameworks also has consequences for other important roles coral
reefs play in supporting fisheries and protecting coastlines from wave stress. The consequences
of losing coral reefs are likely to be substantial and economically devastating for multiple nations
across the planet when combined with other impacts such as sea level rise.
The situation with coral reefs is summarized by Schuttenberg and Hoegh-Guldberg
(2007) thus: "Although the current greenhouse trajectory is disastrous for coral reefs and the
millions of people who depend on them for survival, we should not be lulled into accepting a
world without corals. Only by imagining a world with corals will we build the resolve to solve
the challenges ahead. We must avoid the "game over" syndrome and marshal the financial,
political, and technical resources to stabilize the climate and implement effective reef
management with unprecedented urgency."
Hydrologic extremes and storms. The extremes of the hydrologic cycle are intensified
as Earth becomes warmer. A warmer atmosphere holds more moisture, so heavy rains become
more intense and increase flooding. Higher temperatures, on the other hand, cause an
intensification of droughts, as does expansion of the subtropics with global warming. The most
recent IPCC (2007) report confirms existence of expected trends, e.g., precipitation has generally
increased over land north of 30°N and decreased in more tropical latitudes. Heavy precipitation
events have increased substantially. Droughts are more common, especially in the tropics and
subtropics. Tropospheric water vapor has increased.
Mountain glaciers. Mountain glaciers are in near-global retreat (IPCC, 2007). After a
one-time added flush of fresh water, glacier demise will yield summers and autumns of
frequently dry rivers originating in the Himalayas, Andes, and Rocky Mountains (Barnett et al.,
2008) that now supply water to hundreds of millions of people. Present glacier retreat, and
warming in the pipeline, indicate that 390 ppm of CO2 is already a threat for future fresh water
security.
Human health. Children are especially vulnerable to the health impacts of climate
change. Principal effects are categorized in Table 1 under the headings: (1) heat waves, (2)
asthma and allergies, (3) infectious disease spread, (4) pests and disease spread across taxa:
forests, crops and marine life, (5) winter weather anomalies, (6) drought, (7) food insecurity.
Climate change poses a threat to child health through many pathways, especially by placing
additional stress on the availability of food, clean air, clean water, and potentially expanding the
burden of disease from vector-borne diseases (Bernstein and Myers, 2011).
World health experts have concluded with "very high confidence" that climate change
already contributes to the global burden of disease and premature death (IPCC WG-II, 2007). At
this point the effects are small but are projected to progressively increase in all countries and
regions. IPCC (WG-II, 2007) describes evidence that climate change has already altered the
distribution of some infectious disease vectors, altered the seasonal distribution of some
allergenic pollen species, and increased heat-related deaths.

20
Table 1. Climate Change Impacts on Human Health
Heatwaves.
Heatwaves are not only increasing in frequency, intensity and duration, but their nature is changing. Warmer
nighttime temps [double the increase of average temperature since 1970 (Karl et al.)] and higher humidity (7%
more for each 1ºC warming) that raises heat indices and makes heat-waves all the more lethal.
Asthma and allergies.
Asthma prevalence has more than doubled in the U.S. since 1980 and several exacerbating factors stem from
burning fossil fuels.
Increased CO2 and warming boost pollen production from fast growing trees in the spring and ragweed in the
fall (the allergenic proteins also increase). Particulates help deliver pollen and mold spores deep into the lung sacs.
Ground-level ozone primes the allergic response (and O3 increases in heat-waves). Climate change has extended
the allergy and asthma season two-four weeks in the Northern Hemisphere (depending on latitude) since 1970.
Increased CO2 stimulates growth of poison ivy and a chemical in it (uruschiol) that causes contact dermatitis.
Infectious disease
spread.
The spread of infectious diseases is influenced by climate change in two ways: warming expands the
geographic and temporal conditions conducive to transmission of vector-borne diseases (VBDs), while floods can
leave “clusters” of mosquito-, water – and rodent-borne diseases (and spread toxins). With the ocean the repository
for global warming and the atmosphere holding more water vapor, rain is increasing in intensity -- 7% overall in
the U.S. since 1970, 2”/day rains 14%, 4”/day rains 20%, and 6”/day rains 27% since 1970 (Groisman et al.,
2005), with multiple implications for health, crops and nutrition.
Tick-borne Lyme disease (LD) is the most important VBD in the U.S. LD case reports rose 8-fold in New
Hampshire in the past decade and 10-fold (and now include all of its 16 counties). Warmer winters and
disproportionate warming toward the poles mean that the changes in range are occurring faster than models based
on changes in average temperatures project. Biological responses of vectors (and plants) to warming are, in
general, underestimated and may be seen as leading indicators of warming due to the disproportionate winter
(Tminimum or Tmin) and high latitude warming.
Pests and disease
spread across taxa:
forests, crops and
marine life.
Pests and diseases of forests, crops and marine life are favored in a warming world. Bark beetles are
overwintering (absent sustained killing frosts) and expanding their range, and getting in more generations, while
droughts in the West dry the resin that drowns the beetles as they try to drive through the bark. (Warming
emboldens the pests while extremes weaken the hosts.) Forest health is also threatened in the Northeast U.S.
(Asian Long-horned beetle and wooly adelgid of hemlock trees), setting the stage for increased wildfires with
injury, death and air pollution, loss of carbon stores, and damage to oxygen and water supplies. In sum, forest pests
threaten basic life support systems that underlie human health.
Crop pests and diseases are also encouraged by warming and extremes. Warming increases their potential
range, while floods foster fungal growth and droughts favor whiteflies, aphid and locust. Higher CO2 also
stimulates growth of agricultural weeds. More pesticides, herbicides and fungicides (where available) pose other
threats to human health. Crop pests take up to 40% of yield annually, totaling ~$300 billion in losses (Pimentel)
Marine diseases (e.g., coral, sea urchin die-offs, and others), harmful algal blooms (from excess nutrients, loss
of filtering wetlands, warmer seas and extreme weather events that trigger HABs by flushing nutrients into
estuaries and coastal waters), plus the over 350 “dead zones” globally affect fisheries, thus nutrition and health.
Winter weather
anomalies.
Increasing winter weather anomalies is a trend to be monitored. More winter precipitation is falling as rain
rather than snow in the Northern Hemisphere, increasing the chances for ice storms, while greater atmospheric
moisture increases the chances of heavy snowfalls. Both affect ambulatory health (orthopedics), motor vehicle
accidents, cardiac disease and power outages with accompanying health effects.
Drought.
Droughts are increasing in frequency, intensity, duration, and geographic extent. Drought and water stress are
major killers in developing nations, are associated with disease outbreaks (water-borne cholera, mosquito-borne
dengue fever (mosquitoes breed in stored water containers)), and drought and higher CO2 increase the cyanide
content of cassava, a staple food in Africa, leading to neurological disabilities and death.
Food insecurity.
Food insecurity is a major problem worldwide. Demand for meat, fuel prices, displacement of food crops with
those grown for biofuels all contribute. But extreme weather events today are the acute driver. Russia’s extensive
2010 summer heat-wave (over six standard deviations from the norm, killing over 50,000) reduced wheat
production ~40%; Pakistan and Australian floods in 2010 also affected wheat and other grains; and drought in
China and the U.S. Southwest are boosting grain prices and causing shortages in many nations. Food riots are
occurring in Uganda and Burkino Faso, and the food and fuel hikes may be contributing to the uprisings in North
Africa and the Middle East. Food shortages and price hikes contribute to malnutrition that underlies much of poor
health and vulnerability to infectious diseases. Food insecurity also leads to political instability, conflict and war.

21
If global warming increases IPCC (WG-II, 2007) projects the following trends, where we
include only those that are assigned either high confidence or very high confidence: (1) increased
malnutrition and consequent disorders, including those related to child growth and development,
(2) increased death, disease and injuries from heat waves, floods, storms, fires and droughts, (3)
increased cardio-respiratory morbidity and mortality associated with ground-level ozone, (4)
some benefits to health, including fewer deaths from cold, although it is expected that these
would be outweighed by the negative effects.
7. Societal Implications
The science is clear. Human-made climate forcing agents, principally CO2 from burning
of fossil fuels, have driven planet Earth out of energy balance – more energy coming in than
going out. The human-made climate forcing agents are the principal cause of the global
warming of 0.8°C in the past century, most of which occurred in the past few decades.
Earth's energy imbalance today is the fundamental quantity defining the state of the
planet. With the completion of the near-global distribution of Argo floats and reduction of
calibration problems, it is confirmed that the planet's energy imbalance averaged over several
years, is at least 0.5 W/m2. The imbalance averaged over the past solar cycle is probably closer
to 0.75 W/m2. An imbalance of this magnitude assures that continued global warming is in the
pipeline, and thus so are increasing climate impacts.
Global climate effects are already apparent. Arctic warm season sea ice has decreased
more than 30 percent over the past few decades. Mountain glaciers are receding rapidly all over
the world. The Greenland and Antarctic ice sheets are shedding mass at an accelerating rate,
already several hundred cubic kilometers per year. Climate zones are shifting poleward. The
subtropics are expanding. Climate extremes are increasing. Summer heat of a degree that
occurred only 2-3 percent of the time in the period 1950-1980, or, equivalently, in a typical
summer covered 2-3 percent of the globe, now occurs over 20-40 percent of Earth's surface each
summer (http://www.columbia.edu/~jeh1/mailings/2011/20110327_Perceptions.pdf). Within
these expanded areas smaller regions of more extreme anomalies, such as the European heat
wave of 2003 and the Moscow and Pakistan heat waves of 2010.
Global climate anomalies and climate impacts will continue to increase if fossil fuel use
continues at current levels or increases. Earth's history provides our best measure of the ultimate
climate response to a given level of climate forcing and global temperature change.
Continuation of business-as-usual fossil fuel emissions for even a few decades would guarantee
that global warming would pass well beyond the warmest interglacial periods in the past million
years, implying transition to literally a different planet than the one that humanity has
experienced. Today's young people and following generations would be faced with continuing
climate change and climate impacts that would be out of their control.
Yet governments are taking no actions13
to substantially alter business-as-usual fossil fuel
emissions. Rhetoric about a 'planet in peril' abounds. But actions speak louder than words.
Continued investments in infrastructure to expand the scope and nature of fossil fuel extraction
expose reality.
The matter is urgent. CO2 injected into the atmosphere by burning fossil fuels remains in
the surface climate system for millennia. The practicality of any scheme to extract CO2 from the
air is dubious. Potentially huge costs would be left to young people and future generations.
The apparent solution is to phase out fossil fuel emissions in favor of clean energies and
energy efficiency. Governments have taken steps to promote renewable energies and encourage
energy efficiency. But renewable energies total only a few percent of all energy sources, and

22
improved efficiency only slows the growth of energy use. The transition to a post-fossil fuel
world of clean energies is blocked by a fundamental fact, as certain as the law of gravity: as long
as fossil fuels are the cheapest energy, they will be burned.
However, fossil fuels are cheapest only because they are subsidized directly and
indirectly, and because they are not made to pay their costs to society – the costs of air and water
pollution on human health and costs of present and future climate disruption and change.
Those people who prefer to continue business-as-usual assert that transition to fossil fuel
alternatives would be economically harmful, and they implicitly assume that fossil fuel use can
continue indefinitely. In reality, it will be necessary to move to clean energies eventually, and
most economists believe that it would be economically beneficial to move in an orderly way to
the post fossil fuel era via a steadily increasing price on carbon emissions.
A comprehensive assessment of the economics, the arguments for and against a rising
carbon price, is provided in the book The Case for a Carbon Tax (Hsu, 2011). An across-the-
board price on all fossil fuel CO2 emissions emerges as the simplest, easiest, fastest and most
effective way to phase down carbon emissions, and this approach presents fewer obstacles to
international agreement.
The chief obstacles to a carbon price are often said to be the political difficulty, given the
enormous resources that interest groups opposing it can bring to bear, and the difficulty of
getting the public to understand arcane economic issues. On the other hand, a simple,
transparent, gradually rising fee on carbon emissions collected, with the proceeds distributed to
the public, can be described succinctly, as it has by Jim DiPeso, Policy Director of Republicans
for Environmental Protection http://www.rep.org/opinions/weblog/weblog10-10-11.html
A gradually rising carbon price is the sine qua non, but it must be combined with a
portfolio of other actions: energy research and development with demonstration programs; public
investment in complementary infrastructure such as improved electric grids; global monitoring
systems; energy efficiency regulations; public education and awareness; support for climate
change mitigation and adaptation in undeveloped countries. In economic theory, within a nation
or a common block of nations, a carbon trading system may be useful, but given the need for
rapid global emissions reduction, a simple across-the-board carbon tax is the preferred approach
from the standpoint of conservative economics (Mankiw, 2007).
The basic matter, however, is not one of economics. It is a matter of morality – a matter
of intergenerational justice. The blame, if we fail to stand up and demand a change of course,
will fall on us, the current generation of adults. Our parents honestly did not know that their
actions could harm future generations. We, the current generation, can only pretend that we did
not know.
Acknowledgements. A number of helpful suggestions have been received, which will be
addressed before this paper is submitted for publication.
References
Ackerman, F., E.A. Stanton, S.J. DeCaanio, E. Goodstein, R.B. Howarth, R.B. Norgaard, C.S. Norman, K.A.
Sheeran, 2009: The economics of 350: the benefits and costs of climate stabilization, October 2009 report for
ecotrust (www.ecotrust.org) and Stockholm environment Institute (www.sei-us.org), 50 pp.
Alford, R.A., K.S. Bradfield, S.J. Richards, 2007: Global warming and amphibian losses, Nature, 447, E3-E4.
Barker, P.M., J.R. Dunn, C.M. Domingues, S.E. Wijffels, 2011: Pressure sensor drifts in Argo and their impacts, J.
Atmos. Ocean. Technology, Early Online Release. doi: 10.1175/2011JTECHO831.1.

23
Barnett, T.P., D.W. Pierce, H.D. Hidalgo, et al., 2008: Human-induced changes in the hydrology of the Western
United States, Science, 319, 1080-1083.
Barriopedro, D., E. M. Fischer, J. Luterbacher, R.M. Trigo, R. Garcia-Herrera, 2011: The hot summer of 2010:
redrawing the temperature record map of Europe, Science Express, 10.1126/science.1201224.
Bernstein, A., S. Myers, 2011: Climate change and children's health, Current Opin. Pediatrics, 23, 221-226.
Bruno, J.F., E.R. Selig, 2007, Regional decline of coral cover in the Indo-Pacific: timing, extent, and subregional
comparisons: PLoS ONE, v. 2, p. e711.
Cohen, A.J., H.R. Andrson, B. Ostro, K.D. Pandey, M. Krzyzanowski, N. Kunzli, K. Gutschmidt, A. Pope, I.
Romieu, J.M. Samet, K. Smith, 2005: The global burden of disease due to outdoor air pollution, J. Toxicol. Environ.
Health, 68, 1301-1307, doi:10.1080/152873905909361666
De'ath, G., J.M. Lough, K.E. Fabricius, 2009: Declining Coral Calcification on the Great Barrier Reef, Science, 323,
116-119.
Dowsett, H. J., J. A. Barron, R. Z. Poore, R. S. Thompson, T. M. Cronin, S. E. Ishman, and D. A. Willard, 1999:
Middle Pliocene paleoenvironmental reconstruction: PRISM2, U.S. Geol. Surv. Open File Rep., 99-535. (Available
at http://pubs.usgs.gov/openfile/of99-535)
Dowsett, H.J., M.M. Robinson, K.M. Foley, 2009: Pliocene three-dimensional global ocean temperature
reconstruction, Clim. Past, 5, 769-783.
Epstein, P.R., J.J. Buonocore, K. Eckerle, M. Hendryx, B.M. Stout, R. Heinberg, R.W. Clapp, B. May, N.L.
Reinhart, M.M. Ahern, S.K. Doshi, L. Glustrom, 2011: Full cost accounting for the life cycle of coal, Ann. New York
Acad. Sci., 1219, 73-98.
Fargione, J., J. Hill, D. Tilman, S. Polansky, P. Hawthorne, 2009: Land clearing and the biofuel carbon debt,
Science, 319, 1235-1238.
Fagotti, A., R. Pascolini, 2007: The proximate cause of frog declines? Nature, 447, E4-E5.
Grinsted, A., J.C. Moore, S. Jevrejeva, 2010: Reconstructing sea level from paleo and projected temperatures 200 to
2100 AD, Clim. Dyn., 34, 461-472.
Groisman, P.Y., R.W. Knight, D.R. Easterling, T.R. Karl, G.C. Hegerl, V.N. Razuvaev, 2005: Trends in intense
precipitation in the climate record, J. Clim., 18, 1326-1350.
Hansen, J.E., 2005: A slippery slope: How much global warming constitutes "dangerous anthropogenic
interference"? An editorial essay. Climatic Change, 68, 269-279, doi:10.1007/s10584-005-4135-0.
Hansen, J., M. Sato, R. Ruedy, K. Lo, D.W. Lea, M. Medina-Elizade, 2006: Global temperature change, Proc. Nat.
Acad. Sci., 103, 14288-14293.
Hansen, J.E., 2007: Scientific reticence and sea level rise, Environ. Res. Lett., 2, 1-6.
Hansen, J., M. Sato, R. Ruedy, et al., 2007: Dangerous human-made interference with climate: a GISS modelE
study, Atmos. Chem. & Phys., 7, 2287-2312.
Hansen, J., M. Sato, P. Kharecha, D. Beerling, R. Berner, V. Masson-Delmotte, M. Pagani, M. Raymo, D.L. Royer,
and J.C. Zachos, 2008: Target atmospheric CO2: where should humanity aim? Open Atmos. Sci. J., 2, 217-231.
Hansen, J., R. Ruedy, M. Sato, K. Lo, 2010: Global surface temperature change, Rev. Geophys., 48, RG4004, 29 pp.
Hansen, J.E., and Mki. Sato, 2011: Paleoclimate implications for human-made climate change.
http://arxiv.org/abs/1105.0968 pdf also available at http://www.columbia.edu/~jeh1/
Hansen, J., Mki. Sato, P. Kharecha, and K. von Schuckmann, 2011:Earth's energy imbalance and implications.
http://arxiv.org/abs/1105.1140 pdf also available at http://www.columbia.edu/~jeh1/
Hearty, P.J., A.C. Neumann, 2001: Rapid sea level and climate change at the close of the Last Interglaciation (MIS
5e): evidence from the Bahama Islands, 2001: Quatern. Sci. Rev., 20, 1881-1895.
Hearty, P.J., J.T. Hollin, A.C. Neumann, M.J. O'Leary, M. McCulloch, 2007: Global sea-level fluctuations during
the last interglaciation (Mis 5e), Quarter. Sci. Rev., 26, 2090-2112.

24
Held, I.M., B.J. Soden, 2006: Robust rsponses of the hydrological cycle to global warming, J. Clim, 19, 5686-5699.
Hoegh-Guldberg, O., P.J. Mumby, A.J. Hooten, R.S. Stenek, P. Greenfield, E. Gomez, C.D. Harvell, P.F. Sale, A.J.
Edwards, K. Caldeira, N. Knowlton, C.M. Eakin, R. Iglesias-Prieto, N. Muthiga, R.H. Bradbury, A. Dubi, M.E.
Hatziolos, 2007: Coral reefs under rapid climate change and ocean acidification, Science, 318, 1737-1742.
Hsu, S.-L., 2011: The Case for a Carbon Tax, Island Press, Washington (in pressf).
Intergovernmental Panel on Climate Change (IPCC), Climate Change 2001: The Scientific Basis, Houghton, J.T., Y.
Ding, D.J. Griggs, et al. (eds., Cambridge University Press, 881 pp.
Intergovernmental Panel on Climate Change (IPCC), Climate Change 2007: The Physical Science Basis, S.
Solomon, Q. Dahe, M. Manning, et al. (eds., Cambridge Univ. Press, 996 pp.
Intergovernmental Panel on Climate Change (WGII), Climate Change 2007: Impacts, Adaptation and Vulnerability,
M.L. Parry, O.F. Canziani, J.P. Palutikof, P.J. van der Linden, C.E. Hanson (eds., Cambridge Univ. Press, 996 pp.
Joos, F., M. Bruno, R. Fink, U. Siegenthaler, T. F. Stocker, C. Le Quéré, J. Sarmiento, 1996: An efficient and
accurate representation of complex oceanic and biospheric models of anthropogenic carbon uptake, Tellus B, 48/3,
397-417.
Karl, T.R., P.D. Jones, R.W. Knight, G. Kukla, N. Plummer, V. Razuvayev, K.P. Gallo, J. Linday, R.J. Charlson,
T.C. Peterson, 1993: A new perspective on recent global warming: asymmetric trends of daily maximum and
minimum temperature, Bull. Amer. Meteorol. Soc., 74, 1007-1023.
Keith, D.W., M. Ha-Duong, J.K. Stolaroff, 2006: Clim. Change, 74, 17-45.
Kharecha, P.A., and J.E. Hansen, 2008: Implications of "peak oil" for atmospheric CO2 and climate. Global
Biogeochem. Cycles, 22, GB3012.
Lal, R., 2004: Soil carbon sequestration impacts on global climate change and food security, Science, 304, 1623 –
1627.
Lenton, T.M., H. Held, E. Kriegler, J.W. Hall, W. Lucht, S. Rahmstorf, H.J. Schellnhuber, 2008: Tipping elements
in the Earth's climate system, Proc. Natl. Acad. Sci., 105, 1786-1793.
Levi, B.G., 2008: Trends in the hydrology of the western U.S. bear the imprint of manmade climate change, Phys.
Today, April 16-18.
Levitus, S., J. Antonov, T. Boyer, R.A. Locarnini, H.E. Garcia, A.V. Mishonov, 2009: Global ocean heat content
1955-2008 in light of recently revealed instrumentation problems, Geophys. Res. Lett., 36, L07608,
doi:10.1029/2008GL037155 http://www.nodc.noaa.gov/OC5/3M_HEAT_CONTENT/basin_data.html (1955-2010)
Lyman, J.M., S.A. Good, V.V. Gouretski, M. Ishii, G.C. Johnson, M.D. Palmer, D.A. Smith, J.K. Willis, 2010:
Robust warming of the global upper ocean, Nature, 465, 334-337, doi:10.1038/nature09043
Mankiw, N.G., 2007: One answer to global warming: a new tax, New York Times, 16 September,
http://www.nytimes.com/2007/09/16/business/16view.html).
Mayewski, P.A., E.E. Rohling, J.C. Stager, W. Karlen, K.A. Maasch, L.D. Meeker, E.A. Meyerson, F. Gasse, S. van
Kreveld, K. Holmgren, J. Lee-Thorp, G. Rosqvist, F. Rack, M. Staubwasser, R.R. Schneider, E. J. Steig, 2004:
Holocene climate variability, Quat. Res., 62, 243-255.
Muhs, D.R., K.R. Simmons, R.R. Schumann, R.B. Halley, 2011: Sea-level history of the past two interglacial
periods: new evidence from U-series cating of reef corals from south Florida, Quarter. Sci. Rev., 30, 570-590.
Kopp, R.E., F.J. Simons, J.X. Mitrovica, A.C. Maloof, M. Oppenheimer, 2009: Probabilistic assessment of sea level
during the last interglacial stage. Nature 462, 863-867
Krauss, C., 2010: There will be fuel, New York Times, Page F1 of the New York edition, November 17, 2010.
Naish, T. et al., 2009: Obliquity-paced Pliocene West Antarctic ice sheet oscillations. Nature 458, 322–328).
Olson, S.I., P.J. Hearrty, 2009: A sustained +21 m highstand during MIS 11 (400 ka): direct fossil and sedimentary
evidence from Bermuda, Quat. Sci. Rev., 28, 271-285.

25
Pelejero, C., E. Calvo, O. Hoegh-Guldberg, 2010: Paleo-perspectives on ocean acidification, Trends in Ecology &
Evolution. doi: 10.1016/j.tree.2010.02.002.
Parmesan, C., G. Yohe, 2003: A globally coherent fingerprint of climate change impacts in natural systems, Nature,
421, 37-42.
Parmesan, C., 2006: Ecological and evolutionary responses to recent climate change, Ann. Rev. Ecol. Evol. Syst., 37,
637-669.
Pfeffer, W.T., J.T. Harper, S. O’Neel, 2008: Kinematic constraints on glacier contributions to 21st-century sea-level
rise. Science 321, 1340–1343.
Pounds, J.A., M.P.L. Fogden, J.H. Campbell, 1999: Biological response to climate change on a tropical mountain,
Nature, 398, 611-615.
Pounds, J.A., M.R. Bustamante, L.A. Coloma, J.A. Consuegra, M.P.L. Fogden, P.N. Foster, E. La Marcall, K.L.
Masters, A. Merino-Viteri, R. Puschendorf, S.R. Ron, G.A. Sanchez-Azofeifa, C.J. Still, B.E. Young, 2006:
Widespread amphibian extinctions from epidemic disease driven by global warming, Nature, 439, 161-167.
Pounds, J.A., M.R. Bustamante, L.A. Coloma, J.A. Consuegra, M.P.L. Fogden, P.N. Foster, E. La Marcall, K.L.
Masters, A. Merino-Viteri, R. Puschendorf, S.R. Ron, G.A. Sanchez-Azofeifa, C.J. Still, B.E. Young, 2007: Reply,
Nature, 447, E5-E6.
Raven, J., K. Caldeira, H. Elderfield, O. Hoegh-Guldberg, P. Liss, U. Riebesell, J. Shepherd, C. Turley, A. Watson,
2005: Ocean acidification due to increasing atmospheric carbon dioxide, Policy document 12/05, Volume ISBN 0
85403 617 2: London Royal Society.
Reaka-Kudla, M.L., 1997, Global biodiversity of coral reefs: a comparison with rainforests., in Reaka-Kudla, M.L.,
and Wilson, D.E., eds., Biodiversity II: Understanding and Protecting Our Biological Resources, Volume II, Joseph
Henry Press, p. 551.
Rignot, E., S.S. Jacobs, 2002: Rapid bottom melting widespread near Antarctic ice sheet grounding lines, Science,
296, 2020-2023.
Rignot, E., J.L. Bamber, M.R. van den Broeke, C. Davis, Y. Li, W.J. van de Berg, E. van Meijgaard, 2008: Recent
Antarctic ice mass loss from radar interferometry and regional climate modeling, Nature Geoscience, 1, 106 – 110.
Rignot, E., I. Velicogna, M.R. van den Brooke, A. Monaghan, J.T.M. Lenarts, 2011: Acceleration of the
contribution of the Greenland and Antarctic ice sheets to sea level rise, Geophys. Res.. Lett., 38, L05503,
doi:10.1029/2011GL046583
Rockström, J., M. Falkenmark, L. Karlberg, H. Hoff, S. Rost, D. Gerten, 2009: Future water availability
for global food production: The potential of green water for increasing resilience to global change, Water
Resour. Res., 45, W00A12, doi: 10.1029/2007WR006767.
Roemmich, D., J. Gilson, 2009: The 2004-2008 mean and annual cycle of temperature, salinity, and steric height in
the global ocean from the Argo Program, Prog. Oceanogr., 82, 81-100.
Rohling, E.J., K. Grant, M. Bolshaw, A.P. Roberts, M. Siddall, Ch. Hemleben, M. Kucera,, 2009: Antarctic
temperature and global sea level closely coupled over the past five glacial cycles. Nat. Geosci. 2, 500-504.
Rohling, E.J., K. Grant, C. Hemleben, M. Siddall, B.A. Hoogakker, M. Bolshaw, M. Kucera, 2008: High rates of
sea-level rise during the last interglacial period, Nat. Geosci., 1, 38-42.
Schneider, S.H., and M.D. Mastrandrea, 2005: Probabilistic assessment of “dangerous” climate change and
emissions pathways, Proc. Nat. Acad. Sci., 102, 15728-15735.
Searchinger, T., R. Heimlich, R.A. Houghton, F. Dong, A. Elobeid, J. Fabiosa, S. Tokgoz, D. Hayes, T. Yu, 2008:
Use of U.S. croplands for biofuels increases greenhouse gases through emissions from land-use change, Science,
319, 1238-1240.
Seidel, D.J., W.J. Randel, 2006: Variability and trends in the global tropopause estimated from radiosonde data, J.
Geophys. Res., 111, D21101

26
Sherwood, S.C., M. Huber, 2010: An adaptability limit to climate change due to heat stress, Proc. Natl. Acad. Sci.,
Early Edition, www.pnas.org/cgi/doi/10.1073/pnas.0913352107
Socolow, R., et al., 2011: Direct air capture of CO2 with chemicals, American Physical Society report, 28 April,
http://www.aps.org/policy/reports/popa-reports/loader.cfm?csModule=security/getfile&PageID=244407
Sorensen, L.S., R. Forsberg, 2010: Greenland ice sheet mass loss from GRACE monthly models, in Gravity, Geoid
and Earth Observations, S.P. Mertikas (ed.), International Association of Geodesy Symposia 135, doi 10.1007/978-
3-10634-7_70
Steffen, K., S.V. Nghiem, R. Huff, G. Neumann, 2004: The melt anomaly of 2002 on the Greenland Ice Sheet from
active and passive microwave satellite observations, Geophys. Res. Lett., 34, L204210/2004GL020444
Stocker, B.D., K. Strassmann1, F. Joos, 2011: Sensitivity of Holocene atmospheric CO2 and the modern carbon
budget to early human land use: analyses with a process-based model. Biogeosciences, 8, 69–88.
Stehfest, E., L. Bouwman, D.P. van Vuuren, M.G.J. den Elzen, B. Eikhout, P. Kabat, 2009: Climate benefits of
changing diet, Clim. Change, 95, 83-102.
Tedesco, M., X. Fettweis, M.R. van den Broeke, R.S.W. van de Wal, C.J.P.P. Smeets, W.J. van de berg, M.C.
Serreze, J.E. Box, 2011: The role of albedo and accumulation in the 2010 melting record in Greenland, Environ.
Res. Lett., 6, 014005.
Tilman, D., J. Hill, C. Lehman, 2006: Carbon-negative biofuels from low-input high-diversity grassland biomass,
Science, 314, 1598-1600.
Turner J. et al. (eds.), 2009: Antarctic Climate change and the environment: a contribution to the International
Polar year 2007-2008, Scientific Committee on Antarctic Research, Scott Polar Research Institute, Lensfield Road,
Cambridge UK.
United Nations Environment Programme (UNEP), 2010: Assessing the Enviromental Impacts of Consumption and
Production: Priority Products and Materials, A Report of the Working Group on the Environmental Impacts of
Products and Materials to the International Panel for Sustainable Resource Management, Hertwich, E. E. van der
Voet, S. Suh, A. Tukker, M. Huijbregts, P. Kazmierczyk, M. Lenzen, J. McNeely, Y. Moriguchi.
Velicogna, I., 2009: Increasing rates of ice mass loss from the Greenland and Antarctic ice sheets revealed by
GRACE, Geophys. Res. Lett., 36, L19503, doi:10.1029/2009GL040222.
Vermeer, M., and S. Rahmstorf, 2009: Global sea level linked to global temperature, Proc. Natl. Acad. Sci., 106,
21527-21532.
Veron, J.E.N., O.Hoegh-Guldberg, T.M. Lenton, J.M. Lough, D.O. Obura, P. Pearce-Kelly, C.R.C. Sheppard, M.
Spalding, M.G. Stafford-Smith, A.D. Rogers, 2009: The coral reef crisis: the critical importance of <350 ppm CO2,
Marine Poll. Bull., 58, 1428-1436.
von Schuckmann, K., P.-Y. Le Traon, 2011: How well can we derive global ocean indicators from Argo data?
Walter, K.M., S.A. Zimov, J.P. Chanton, D. Verbyla, F.S. Chapin, III, 2006: Methane bubbling from Siberian thaw
lakes as a positive feedback to climate warming, Nature, 443, 71-75.
Westbrook, G.K., Thatcher, K.E., Rohling, E.J., Piotrowski, A.M., Pälike, H., Osborne, A.H., Nisbet, E.G.,
Minshull, T.A., Lanoisellé, M., James, R.H., Hühnerbach, V., Green, D., Fisher, R.E., Crocker, A.J., Chabert, A.,
Bolton, C., Beszczynska-Möller, A., Berndt, C., and Aquilina, A., 2009: Escape of methane gas from the seabed
along the West Spitsbergen continental margin. Geophys. Res. Lett., 36, L15608, doi:10.1029/2009GL 039191.
Westerling, A., H. Hidalgo, D. Cayan, T. Swetnam, 2006: Warming and earlier spring increases western U.S. forest
wildfire activity, Science, 313, 940-943.
Zachos, J., M. Pagani, L. Sloan, E. Thomas, and K. Billups, 2001: Trends, rhythms, and aberrations in global
climate 65 Ma to present. Science, 292, 686-693.
Zeebe, R.E., J.C. Zachos, G.R. Dickens, 2009: Carbon dioxide forcing alone insufficient to explain Paleocene-
Ereocene Thermal Maximum warming, Nature Geoscience, 2, 576-580.