cd10, scored as positive versus negative all path 1 path 2 path 3 path 4 path 5 path 6 path 7 path 8...
TRANSCRIPT
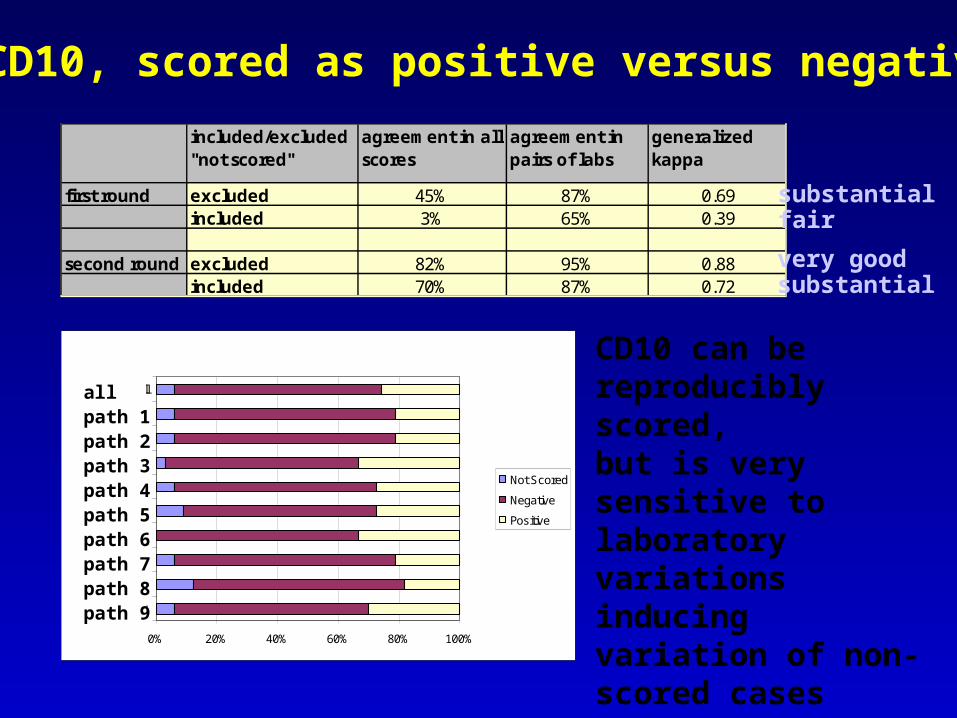
CD10, scored as positive versus negative
Figure 2e
0% 20% 40% 60% 80% 100%
BNLI
ECAMPO
EORTC
GELA
KIEL
LUBECK
NORDIC
VANCOUVER
WURZBURG
All
Not Scored
Negative
Positive
included/excluded "not scored"
agreement in all scores
agreement in pairs of labs
generalized kappa
first round excluded 45% 87% 0.69included 3% 65% 0.39
second round excluded 82% 95% 0.88included 70% 87% 0.72
allpath 1path 2path 3path 4path 5path 6path 7path 8path 9
CD10 can be reproducibly scored,but is very sensitive to laboratory variations inducing variation of non-scored cases
substantialfair
very goodsubstantial
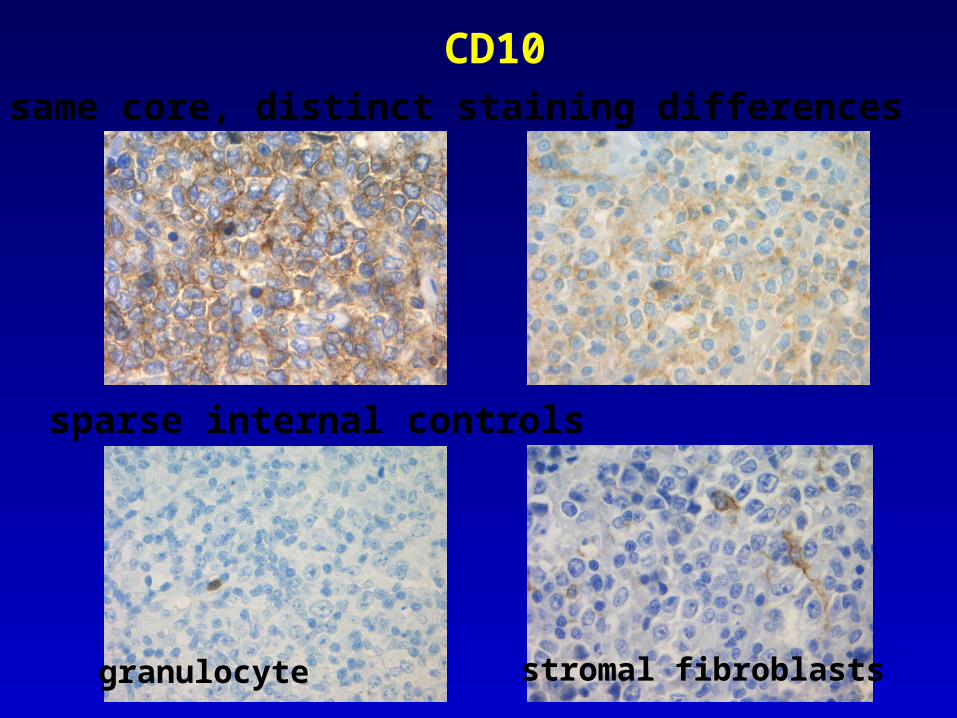
CD10
same core, distinct staining differences
sparse internal controls
granulocyte stromal fibroblasts
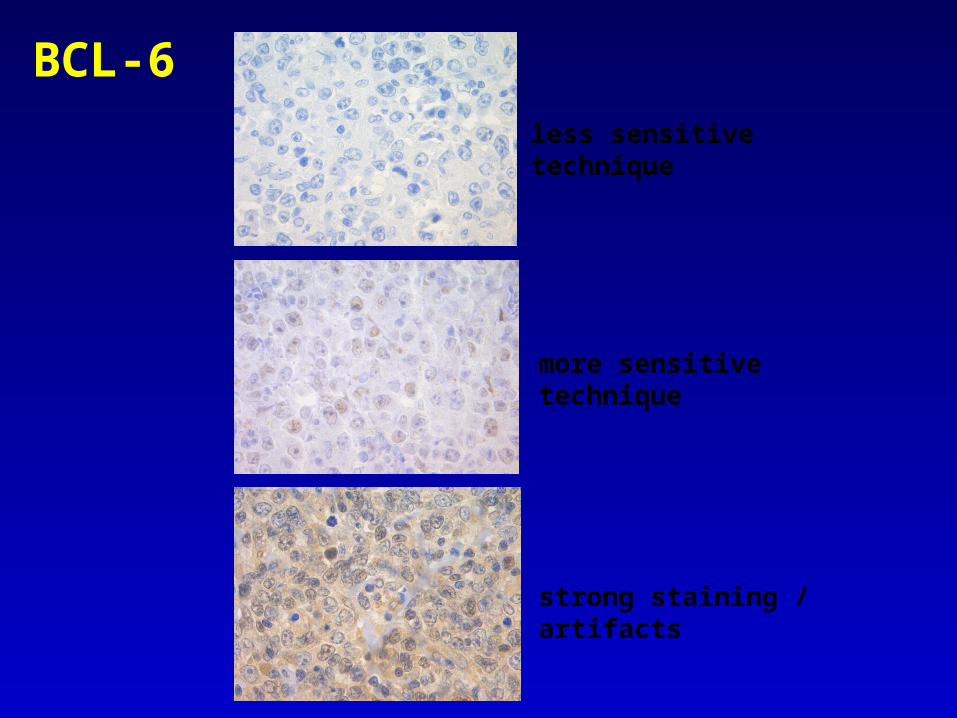
less sensitive technique
more sensitive technique
strong staining / artifacts
BCL-6
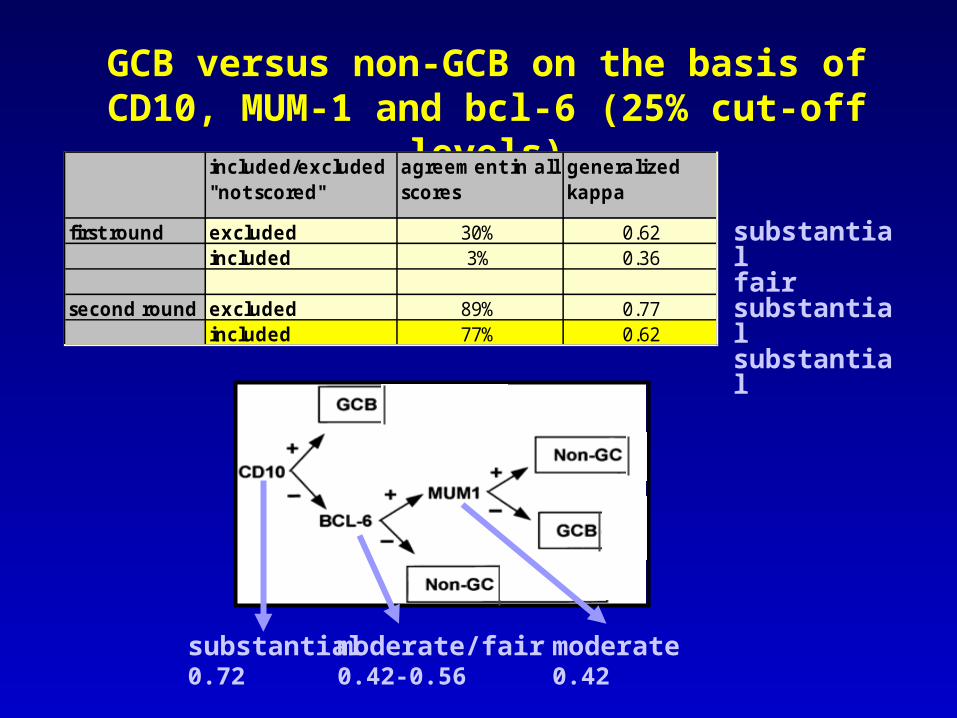
GCB versus non-GCB on the basis of CD10, MUM-1 and bcl-6 (25% cut-off
levels)
substantialfair
substantialsubstantial
substantial0.72
moderate/fair0.42-0.56
moderate0.42
included/excluded "not scored"
agreement in all scores
generalized kappa
first round excluded 30% 0.62included 3% 0.36
second round excluded 89% 0.77included 77% 0.62
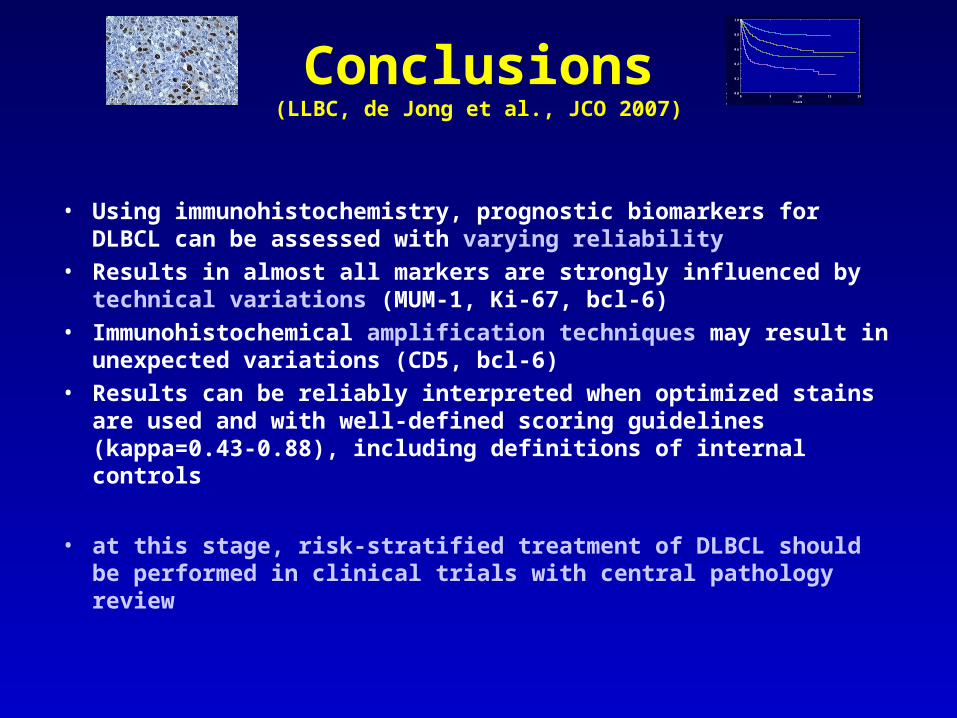
Conclusions(LLBC, de Jong et al., JCO 2007)
• Using immunohistochemistry, prognostic biomarkers for DLBCL can be assessed with varying reliability
• Results in almost all markers are strongly influenced by technical variations (MUM-1, Ki-67, bcl-6)
• Immunohistochemical amplification techniques may result in unexpected variations (CD5, bcl-6)
• Results can be reliably interpreted when optimized stains are used and with well-defined scoring guidelines (kappa=0.43-0.88), including definitions of internal controls
• at this stage, risk-stratified treatment of DLBCL should be performed in clinical trials with central pathology review
Years
Cu
mu
lativ
e P
rop
ortio
n S
urv
ivin
g
0,0
0,2
0,4
0,6
0,8
1,0
0 5 10 15 20
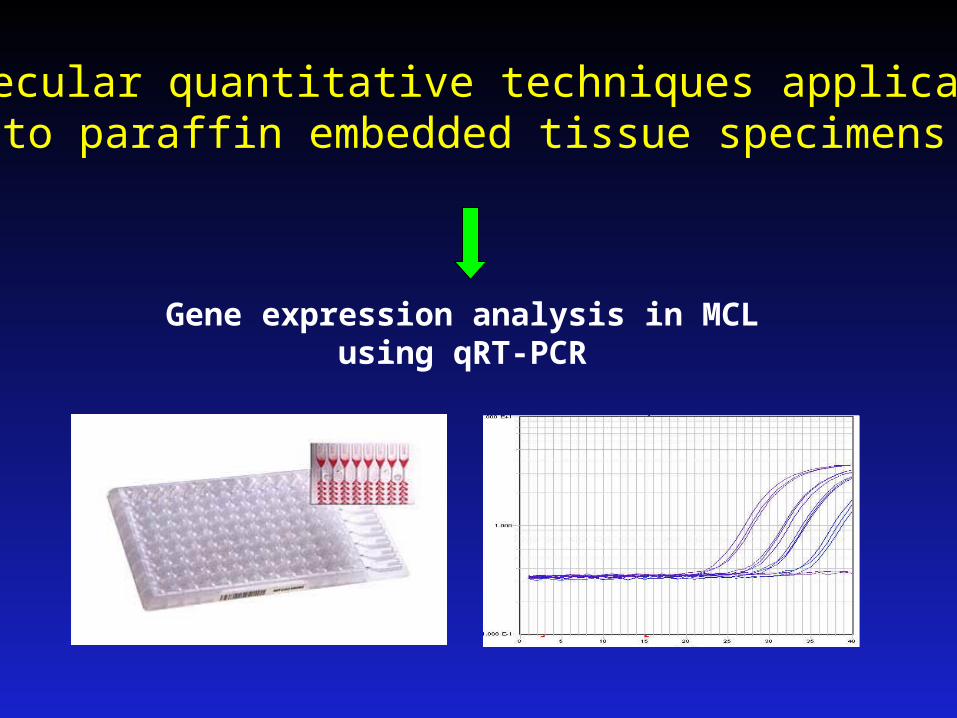
Molecular quantitative techniques applicableto paraffin embedded tissue specimens
Gene expression analysis in MCLusing qRT-PCR
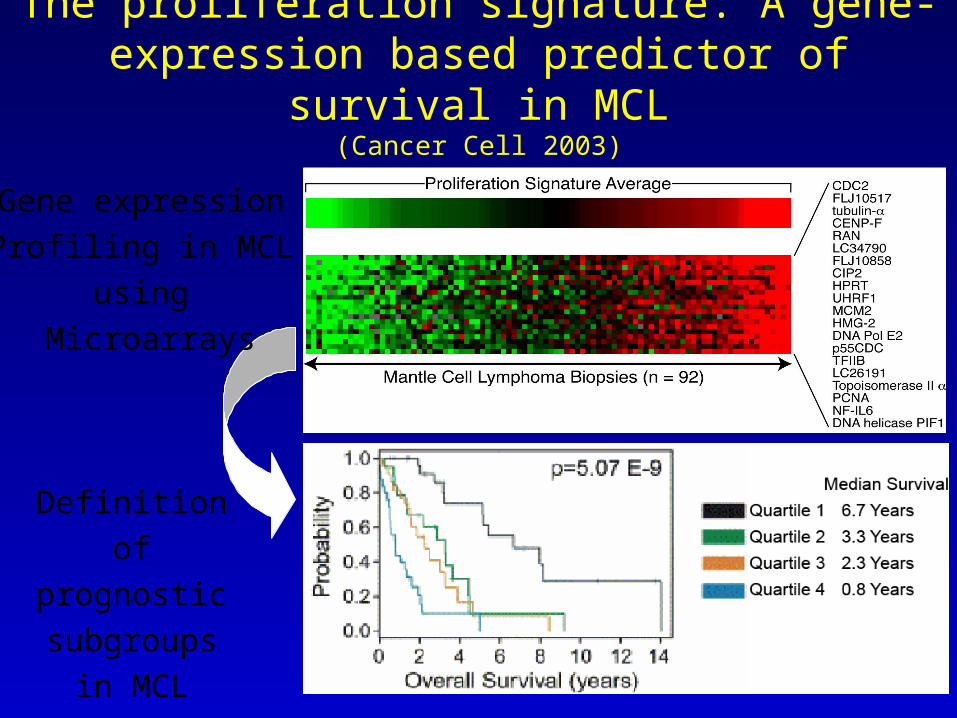
The proliferation signature: A gene-expression based predictor of survival in MCL
(Cancer Cell 2003)
Definition of
prognostic
subgroups in
MCL
Gene expression
Profiling in MCL
using
Microarrays
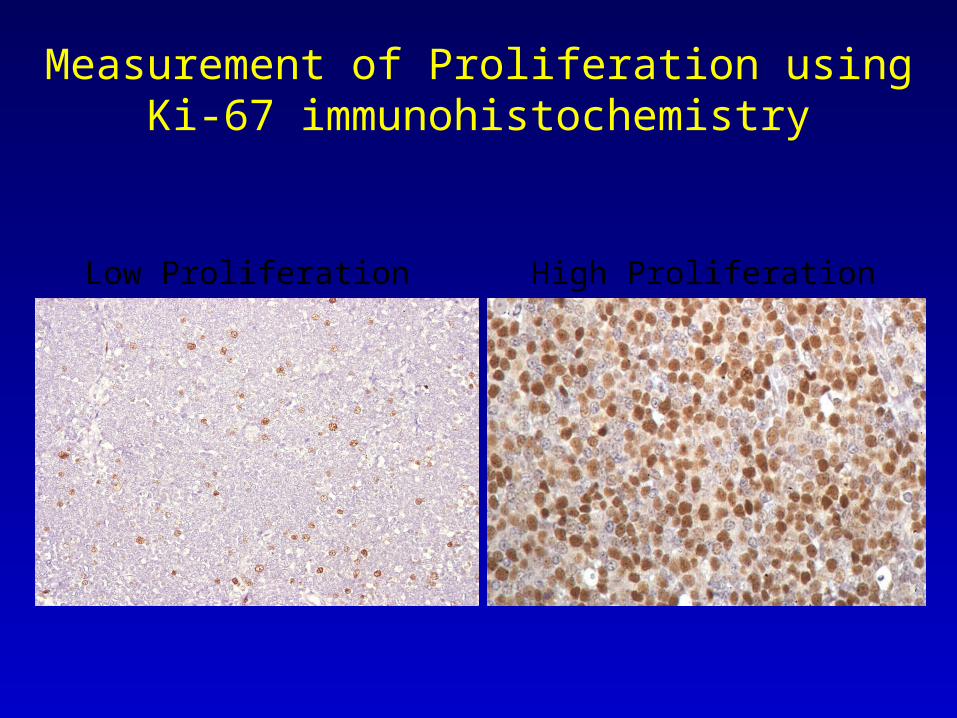
Measurement of Proliferation using Ki-67 immunohistochemistry
Low Proliferation High Proliferation
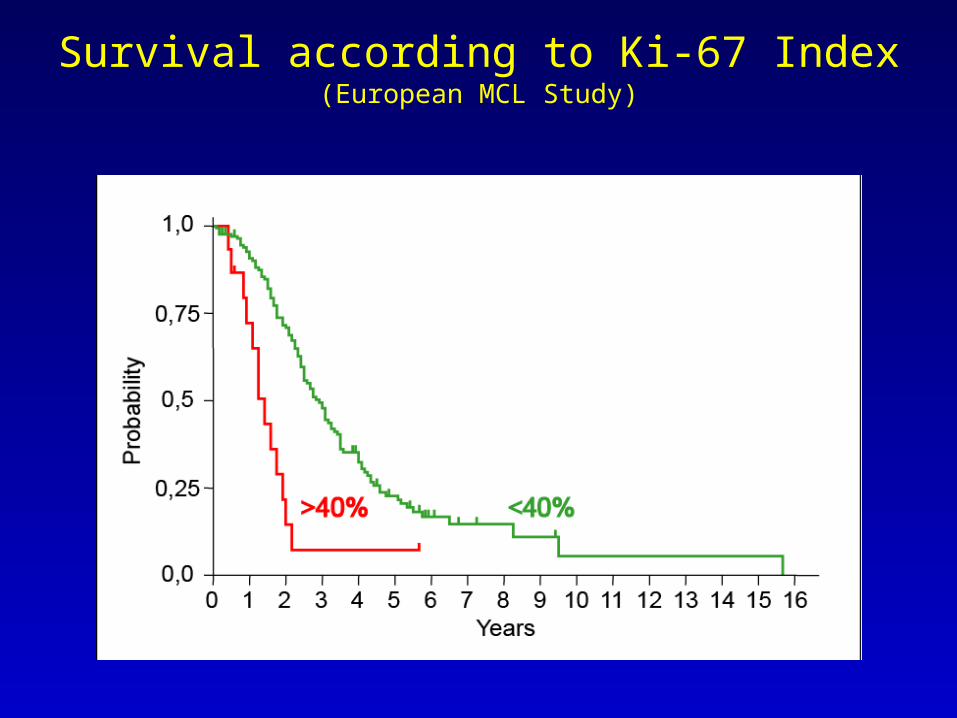
Survival according to Ki-67 Index (European MCL Study)
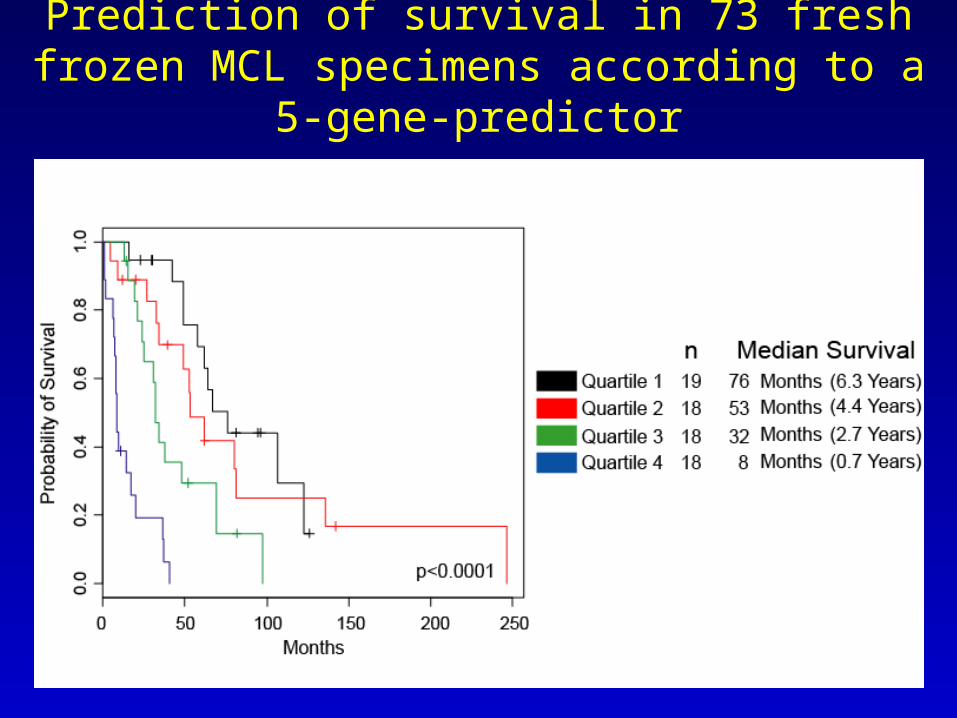
Prediction of survival in 73 fresh frozen MCL specimens according to a 5-gene-predictor
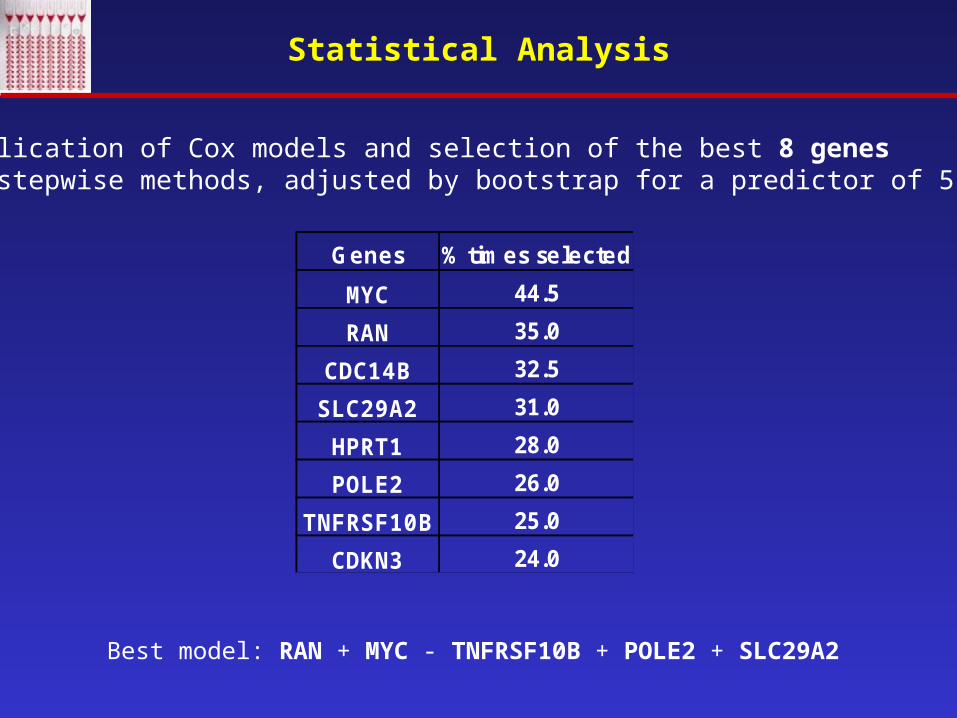
Statistical Analysis
Genes % times selected
MYC 44.5
RAN 35.0
CDC14B 32.5
SLC29A2 31.0
HPRT1 28.0
POLE2 26.0
TNFRSF10B 25.0
CDKN3 24.0
Application of Cox models and selection of the best 8 genes by stepwise methods, adjusted by bootstrap for a predictor of 5 genes
Best model: RAN + MYC - TNFRSF10B + POLE2 + SLC29A2
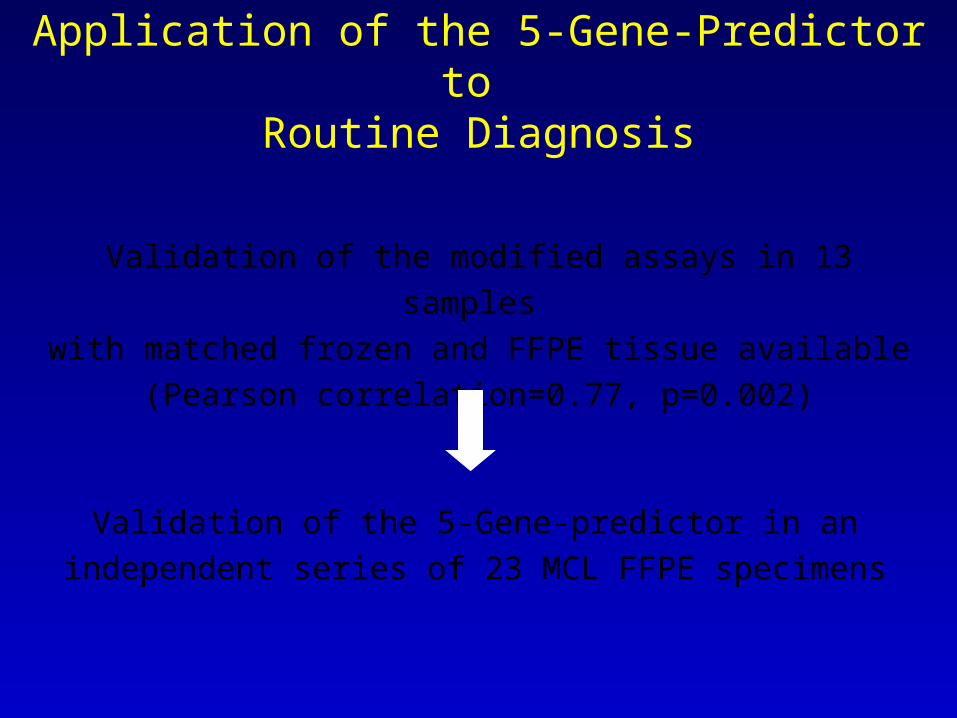
Application of the 5-Gene-Predictor to Routine Diagnosis
Validation of the modified assays in 13 samples
with matched frozen and FFPE tissue available
(Pearson correlation=0.77, p=0.002)
Validation of the 5-Gene-predictor in an independent series
of 23 MCL FFPE specimens
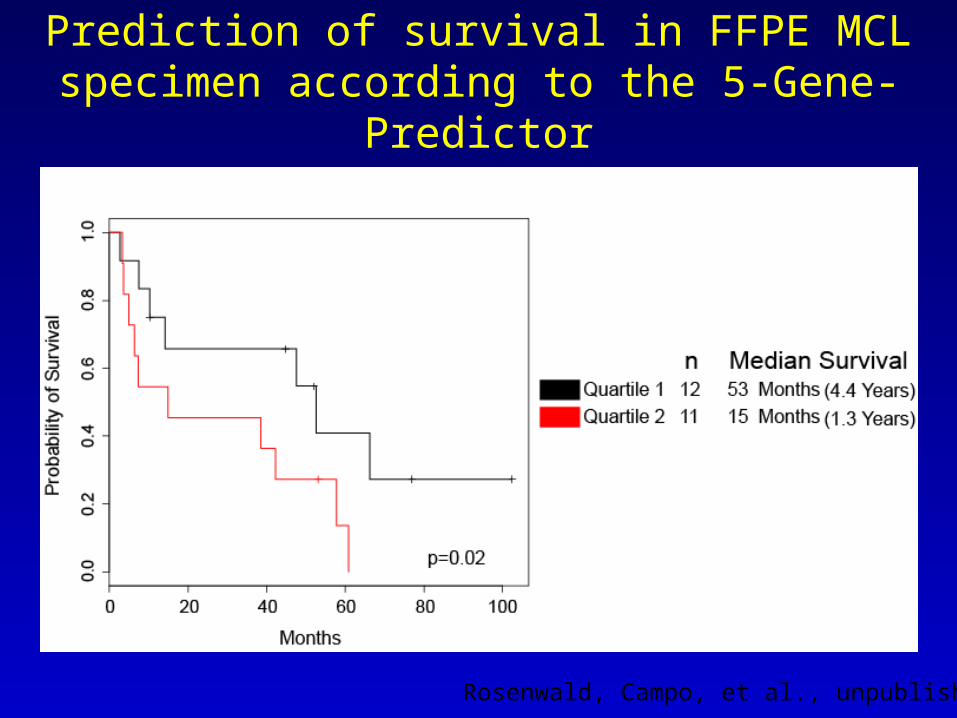
Prediction of survival in FFPE MCL specimen according to the 5-Gene-Predictor
Rosenwald, Campo, et al., unpublished