the capital structure of islamic-compliant firms: …
TRANSCRIPT

AAMJAF Vol. 16, No. 2, 123–144, 2020
© Asian Academy of Management and Penerbit Universiti Sains Malaysia, 2020. This work is licensed under the terms of the Creative Commons Attribution (CC BY) (http://creativecommons.org/licenses/by/4.0/).
AsiAn AcAdemy of mAnAgement JournAl
of Accounting and FinAnce
THE CAPITAL STRUCTURE OF ISLAMIC-COMPLIANT FIRMS: IS THERE A FINANCING HIERARCHY?
Muncef Guizani
College of Science and Humanity Studies in Slayel, Prince Sattam Bin Abdulaziz University, Kingdom of Saudi Arabia
E-mail: [email protected]
ABSTRACT
This article examines whether the basic premises according to the pecking order theory (POT) provide an explanation for the capital structure choice of firms operating under Islamic principles. Random effect regressions were performed to test the POT applying data from a sample of 93 Islamic-compliant firms listed on Saudi stock market over the period of 2006 to 2016. The results show that sale-based instruments (Murabahah, Ijara) track the financial deficit quite closely followed by equity financing and as a last alternative to finance deficit, Islamic-compliant firms’ issue Sukuk. In the crisis period, these firms seem more reliant on equity, then on sale-based instrument and on Sukuk as last option. The study findings also indicate that the cumulative financing deficit does not wipe out the effects of conventional variables, although it is empirically significant. This provides no support for the POT attempts by Saudi Islamic-compliant firms.
Keywords: Pecking order theory, capital structure, Murabahah, Ijara, Sukuk, Islamic-compliant firms
INTRODUCTION
Making financing decisions for firms is one of the most fundamental topics in contemporary finance research since the influential studies of Modigliani and
Publication date: 23 December 2020
To cite this article: Guizani, M. (2020). The capital structure of Islamic-compliant firms: Is there a financing hierarchy? Asian Academy of Management Journal of Accounting and Finance, 16(2), 123–144. https://doi.org/10.21315/aamjaf2020.16.2.6
To link to this article: https://doi.org/10.21315/aamjaf2020.16.2.6

124
Muncef Guizani
Miller (1958) on capital structure irrelevancy. This is the case because the choice of capital structure has become one of the most significant challenges facing corporate finance. Once we move away from a model of perfect capital markets, most theories have sought to explain how companies choose a particular combination of debt and equity by introducing frictions omitted in the original Modigliani and Miller framework. Two traditional theories of capital structure, the trade-off theory (TOT) and the pecking order theory (POT), guide most of the capital structure studies.
The TOT relaxed some of the assumptions of the Modigliani and Miller (1958) theory, particularly those related to the absence of taxes and distress cost. The development of this theory goes back to Kraus and Litzenberger (1973). It states that firms set their optimal leverage ratio based on a trade-off between the tax saving benefits and the costs of bankruptcy of debt financing.
Contrasting with the optimal capital structure view of the TOT, Myers (1984) and Myers and Majluf (1984) developed the POT based on asymmetric information problems. It states that managers prefer internal to external financing, and, when outside funds are necessary, they prefer debt to equity because of lower information costs associated with debt issues. They issue equity as a last alternative. Managers follow this financing hierarchy behaviour to avoid both the wealth transfer to outsiders and the negative effect of adverse selection inherent to external funding sources.
In the last two decades, Islamic funds have experienced a forceful growth all over the world. A particular attention has been devoted to Islamic finance from stock market participants. Studies including Naz, Shah and Kutan (2017) and Guizani (2019) revealed that there has been an increasing trend towards investment in Sharia-compliant financial products over the past few years.
Although the extant literature provides ample evidence of the capital structure choice of firms under a conventional finance perspective, scarce effort has been accorded to the financing behavior of firms which operate under Islamic principles. As stated by Guizani (2019), our understanding of corporate financing decisions remains incomplete, particularly in respect of the use of Islamic financing instrument.
The present study addresses this concern and examines corporate finance decisions of Kingdom of Saudi Arabia (KSA) firms operating under the Sharia principles.

The Capital Structure of Islamic Firms
125
Despite of an enormous volume of research, the debate on whether the TOT or the POT is an accurate means to describe corporate capital structure remains equivocal. In the case of Islamic-compliant firms, we argue that the POT outperforms the trade-off model. There are several reasons that explain why the trade-off model does not apply to Islamic-compliant firms in KSA. First, debt financing does not incur tax advantages for Saudi companies and thus, tax will not be considered as a determinant factor of their capital structure decision. This is because the KSA legal system is derived from Islamic law that imposes to Saudi companies the payment of zakat rather than income taxes. There are some differences between zakat and Taxes whether on whom to impose, the manner of collection, or calculation. Zakat is levied at a flat rate of 2.5% and is chargeable on the total of the company’s capital resources and income that are not invested in fixed assets. Second, in the case of Islamic-compliant firms, Sharia law imposes that debt must be asset-backed, thus reducing their risk exposure. As argued by Bitar, Hassan and Hippler (2018), the higher share of tangible assets of Islamic-compliant firms helps reduce the bankruptcy costs for liability claimholders.
In contrast to TOT, the POT does not provide for the costs and benefits of debt. This theory proposes a predefined financial hierarchy of firm financing choices based on information asymmetry opposing managers to and outside investors. In an Islamic finance context, Ahmed (2007) suggests that the theoretical capital structure framework of firms operating under Sharia regulations is consistent with the POT.
There have been debates in the literature about whether the Pecking Order Model is better than the trade-off model in relation to finance structure or vice versa (Myers & Majluf, 1984). Accordingly, in a quest for a better understanding of the financing behaviour of Islamic-compliant firms, this study sheds light on whether the basic premises according to the POT provide an explanation for the capital structure mix of these firms in KSA.
The present study makes several original contributions to the related literature. First, this research highlights the capital structure choice of firms operating under Islamic principles. It explores the choice of capital structure for KSA companies within the bound of Sharia requirement. The respect of Sharia principles raises the question on whether the corporate capital structure choice of Islamic firms will be influenced by a set of factors similar to conventional finance. Second, the present paper provides further evidence on the impact of financial crisis on the firms’ capital structure choice in a period of considerable slowdown in the world. The credit shortages that characterise the last financial crisis have resulted in changing of firms’ demand for credit. This has raised the role of

126
Islamic-based financing as a substitution for the conventional finance system. Therefore, given the high penetration of Islamic finance against conventional finance in KSA, this study provides insights into how the contraction of bank lending during the 2008–2009 crisis affects the corporate capital structure choice in an Islamic finance setting. Finally, the findings help managers to predict the best capital structure to be achieved by firms that would like to operate under Islamic principles.
LITERATURE REVIEW
Empirical Findings of Capital Structure Decisions
There has been an intense debate over the capital structure choice for conventional firms, particularly in the recent literature. Empirically, studies on capital structure choice are inconclusive about the hierarchy or pecking order among different sources of funds. One branch of research has provided evidence in line with managers’ pecking order preference. Shyam-Sunder and Myers (1999) find that the Pecking Order Model is an excellent first-order descriptor of financing behaviour in a sample of 157 U.S. firms over the period 1971 to 1989. In the same vein, Lemmon, Roberts and Zender (2008) find evidence in tune with the POT. After controlling for debt capacity, the authors show that firms’ financing behaviour follows the financing hierarchy described by the Pecking Order Model.
However, other empirical studies have found no support of the POT’s predictions. For instance, Frank and Goyal (2003) find results that are surprising from the perspective of the POT. Using a sample of publicly traded U.S. firms, the authors provide evidence inconsistent with the POT predictions. In particular, debt financing does not dominate equity financing in magnitude. Compared to net debt, net equity issues track the financing deficit quite closely. Further, Fama and French (2005) observe no support for the POT. They reveal that firms rely heavily on equity financing to recover deficiency needs. Similarly, Komera and Lukose (2015) argue that the POT fails to explain Indian firms’ financing choices. Their estimated annual pecking order coefficients show no support for the financing choices described by the POT.
Further to this, another branch of research has provided evidence close to the predictions of POT what is referred to as a “modified” or “revised” POT. For instance, Chen (2004) finds support for a “new pecking order” characterised by the following order: retained profit, equity, and long-term debt. To their part, Allini, Rakha, McMillan and Caldarelli (2018) support the predictions of the

The Capital Structure of Islamic Firms
127
modified POT in Egypt. They identify that internal funds are the preferred option for Egyptian firms followed by equity, where a financial deficit is present, and finally debt finance as a last resort.
Classifying firms according to their compliance to Sharia, few prior studies report significant differences in financial behaviour between Sharia-compliant (SC) and non-Sharia-compliant (NSC) firms. Using a sample from Pakistan and the U.K., Naz et al. (2017) find that leveraging, dividend payouts and working capital policies at SC firms significantly differ from those at NSC firms. Yildirim, Masih and Bacha (2018) compared the key capital structure determinants between SC and NSC firms. Due to the restrictions imposed by Sharia rules, it is expected that SC firms exhibit different capital structure compared to their NSC peers. Their results show that most of the determinants do exhibit different effects among both firm types. The authors document that capital structure decisions for SC and NSC firms are better explained by the POT for book leverage and by the TOT for market leverage. In the same token, Alnori and Alqahtani (2019) investigate the effect of Sharia principles on firms’ capital structure decisions for a sample of Saudi firms. They find lower levels of leverage and slower speeds of adjustment for SC firms. The authors explain these findings by the financing restrictions to which SC firms are subject, creating a finance supply gap for these firms and higher adjustment costs.
Capital Structure of an Islamic Firm
Islamic modes of finance
Islamic rules impose three principles to financial instruments to maintain their compliance status: (i) excluding interest (riba), (ii) not possessing major uncertainty (gharar), and (iii) not having gambling like features (Maysir). Under these principles, Islamic financing instruments can be mostly classified into sale-based, profit-loss sharing (PLS) and hybrid instruments. Sale-based instruments are fixed-income instruments that replicate the payoff of a debt instrument consisting in paying the sum in advance increased by a predefined. They include:
1. Murabahah: Murabahah is a sale contract at a mark-up. The contractengages the bank to purchase goods on the basis of specific indicationsby the purchaser. Then, the bank sells them to the client at an arrangedmark-up.
2. Salam: Salam is the sale of a prescribed commodity for postponed deliveryagainst an immediate and full payment of its price.

128
3. Istisna: Istisna is a contract similar to salam with the difference that inistisna the buyer specifies the characteristics of the good.
4. Ijara: A lease contract whereby a party is given the right to use the object(the usufruct) for a period of time against fixed rental payments.
Profit sharing instruments are Islamic participation contracts involving the sharing of losses and profits. They include:
1. Mudarabah: Mudarabah is a contract based on a partnership betweena financer (Rab al Mal) and a fund manager (Mudarib). The financerprovides the required capital by the joint venture in return for a givenpercentage of the profits shared with the manager. The financial loss isborne by the financer while the manager loses the opportunity cost of his/her time and effort.
2. Musharakah: Sharikah is a partnership or joint venture for an economicactivity between the bank and one or more clients. All parties involvedhave a right to participate in the management of the project. The partnersshare profits on a predetermined ratio while losses are borne by all partnersproportionally to their contribution.
3. Sukuk: The Accounting and Auditing Organisation for Islamic FinancialInstitutions (AAOIFI) defines Sukuk as “certificates of equal valuerepresenting undivided shares in the ownership of tangible assets, usufructsand services or (in the ownership of) the assets of particular projects orspecial investment activities”. Sukuk are different from other existing debtinstruments since they have the characteristics of both, debt and equity.
Cost structure of Islamic financial instruments
Islamic financial contracts may generally involve direct and indirect costs. To quantify different costs, we follow Ahmed (2007) by ranking them as high, medium, low and negligible. The following table summarises the cost structure of different financial instruments.
Murabahah and Ijara are considered as debt-based instruments. They have low risk relative to equity-based instruments. Accordingly, they have the lower cost of funds. Given that they are negotiated with financial institutions, their contracting costs are relatively low and they imply no floatation costs as in case of securities (Ahmed, 2007). As financing techniques, Murabahah and Ijara involve no ownership dilution and thus their dilution costs are negligible. In addition, since the bank holds the ownership of the asset until the maturity,

The Capital Structure of Islamic Firms
129
these instruments have negligible information costs. Furthermore, there is no adverse selection and moral hazard problem associated with Murabahah and Ijara contracts as their rate of return is fixed and predetermined (Siddiqui, 2008). In contrast, as they are debt-based instruments, they have inherent distress costs.
Table 1Costs of various Islamic financial instruments
InstrumentsDirect costs Indirect costs
Total costsFunds Contracting/
Floatation Dilution Distress Information
Debt-based
Murabahah L(=1) L(=1) N(=0) M(=2) N(=0) 4
Ijara L(=1) L(=1) N(=0) M(=2) N(=0) 4
Equity-based
Mudarabah M(=2) M(=2) M(=2) N(=0) H(=3) 9
Musharakah H(=3) H(=3) H(=3) N(=0) M(=2) 11
Hybrid Sukuk L(=1) M(=2) L(=1) M(=2) H(=3) 9
Note: H = High (with value 3), M = Medium (with value 2), L = low (with value 1), and N = negligible (with value 0).
With respect to equity-based instruments, they are based on the principle of PLS. Their costs of funds are relatively high. However, given that Mudarabah contracts are not affected by dividend policy, their cost of funds will be smaller than the Musharakah contracts (Ahmed, 2007). Similarly, because Mudarabah contracts are not affected by dividend policy, their floatation costs will be relatively lower than that for Musharakah contracts. On the other hand, a firm that would prefer not to dilute ownership will chose Mudarabah instead of Musharakah contract. Mudarabah is a PLS contract where the fund provider maintains the ownership of the capital or invested assets at all times and the entrepreneur provides effort and management expertise. In contrast, the Musharakah contract involves a partnership where all partners jointly contribute to the capital and the management of the project. Further, PLS contracts are inherently vulnerable to asymmetric information problems. These problems are relatively higher in the case of Mudarabah contract. Asymmetric information on Mudarabah contract arise because the entrepreneur who manages the Mudarabah fund has full control of the project and have more information about the project, which the capital provider does not usually have access to. Consequently, two major problems are issued from the inefficiency in information delegation: adverse selection and moral hazard problems (Sapuan, 2016).
As for Sukuk, they are considered as hybrid securities, bearing the features of stocks and bonds. Similar to a bond, Sukuk has a maturity date, regular periodic

130
income streams and a final payment at the maturity date (Zolfaghari, 2017). Sukuk holders are ranked senior to unsecured creditors as they have recourse to the assets in the event of default, or if the issuers have difficulty in repaying. This involves that they have low cost of funds. In addition, given their tradability in secondary market, Sukuk are liquid instruments which involve a medium low floatation costs. On the other hand, although the Sukuk are indicative of some sort of partnership and ownership of the holder in respect of the asset, they lack right of voting and interfering in underlying asset. These Islamic instruments involve a high information cost. Due to their specific structuring, Sukuk a re e specially exposed to moral hazard and adverse selection problems (Klein & Weill, 2016).
DATA AND SUMMARY STATISTICS
Data Sources and Sample
The study sample consists of non-financial companies listed on the KSA stock exchange. The analysis is about the period from 2006 to 2016. The financial and market data used in this research were hand-collected from listed firms’ annual reports provided by the website https://www.argaam.com. We exclude financial firms (banks and insurance) due to their specific regulations. We also exclude firms with missing information over the study period.
This study uses the AAOIFI list to distinguish SC firms from NSC firms. AAOIFI updates listed firms annually and issues a list of firms that are Islamic compliant. According to the listed Islamic companies list published by the AAOIFI, 12 non-financial listed firms are NSC. As a result, the final sample is an unbalanced panel comprised of 93 firms with a total of 946 firm-year observations.
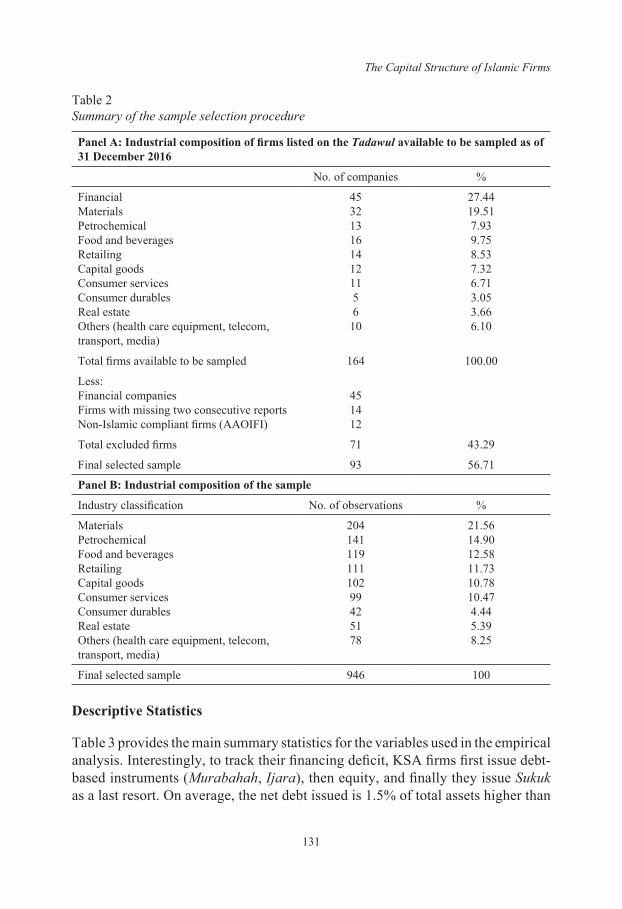
Panel A of Table 2 displays the sample selection procedure over the period of 2006 to 2016. Our initial sample comprises 164 KSA listed firms. We exclude 45 bank and insurance companies, 14 firms with missing two consecutive financial reports and 12 non-Islamic compliant firms, giving us a final sample of 93 firms with a total of 946 firm-year observations. Panel B of Table 2 shows that 21.56% of our sample is derived from the material sector, followed by firms belonging to the petrochemical industry (14.90%), food and beverages (12.58%), retailing (11.73%), capital goods (10.78%) and consumer services (10.47%).
The Capital Structure of Islamic Firms
131
Table 2Summary of the sample selection procedure
Panel A: Industrial composition of firms listed on the Tadawul available to be sampled as of 31 December 2016
No. of companies %
FinancialMaterials Petrochemical Food and beveragesRetailingCapital goodsConsumer services Consumer durablesReal estate Others (health care equipment, telecom, transport, media)
453213161412115610
27.4419.517.939.758.537.326.713.053.666.10
Total firms available to be sampled 164 100.00
Less: Financial companiesFirms with missing two consecutive reportsNon-Islamic compliant firms (AAOIFI)
451412
Total excluded firms 71 43.29
Final selected sample 93 56.71
Panel B: Industrial composition of the sample
Industry classification No. of observations %
Materials Petrochemical Food and beveragesRetailingCapital goodsConsumer services Consumer durablesReal estate Others (health care equipment, telecom, transport, media)
20414111911110299425178
21.5614.9012.5811.7310.7810.474.445.398.25
Final selected sample 946 100
Descriptive Statistics
Table 3 provides the main summary statistics for the variables used in the empirical analysis. Interestingly, to track their financing deficit, KSA firms first issue debt-based instruments (Murabahah, Ijara), then equity, and finally they issue Sukuk as a last resort. On average, the net debt issued is 1.5% of total assets higher than

132
0.9% of net equity issued and 0.2% of net Sukuk. This suggests the preference of KSA firms to issue debt-based instruments rather than equity and Sukuk.
The average values of book-based debt and market-based debt are 27.5% and 25.9% respectively. Looking at these results in comparison to those in other developing countries, Allini et al. (2018) find that the book-based debt and market-based debt means in Egypt are 17% and 14%, respectively. Chen et al. (2013) find them to be 39% and 35% in Taiwan.
With regard to other variables, the results show a mean value of market-to-book ratio of 1.923, with a range from 0.738 to 6.675. The tangible assets as a percentage of total assets average 58.2%. The average firms’ size measured by the log of total assets is about 9.287. The KSA firms’ profitability averages 8.6% and ranges between –51.7% and 110.3%.
Table 3Descriptive statistics
Variables Mean STD Min Max
DEF 0.058 0.212 –1.746 1.252
NDI 0.015 0.084 –0.311 0.758
NSKI 0.002 0.029 –0.094 0.326
NQI 0.009 0.162 –4.457 0.628
BBD 0.275 0.472 0 0.897
MBD 0.259 0.774 0 0.949
MTB 1.923 1.037 0.738 6.675
LS 9.287 0.731 7.722 11.531
TAN 0.582 0.209 0.018 0.974
PRF 0.086 0.104 –0.517 1.103Notes: DEF = deficit; NDI = net debt issued; NSKI = net sukuk issued; NQI = net equity issued; BBD = book-based debt; MTB = market-to-book ratio; LS = firm size; TAN = tangibility; PRF = profitability
THEORETICAL FRAMEWORK AND MEASURES OF VARIABLES
To test the POT, this study employs the methodology of Shyam-Sunder and Myers (1999) and Frank and Goyal (2003) according to which the inter-temporal variation in net debt issue (ΔD) should be explained by the funds flow deficit (DEF). The DEF variable is given by the following identity:
DEFt = DIVt + It + ΔWt – Ct = ΔDt + ΔEt (1)

The Capital Structure of Islamic Firms
133
where,DIVt = dividends paid in year t;It = net investment in year t;ΔWt = working capital change in year t; Ct = cash flows after interest and taxes in year t;ΔDt = net debt issued in year t;ΔEt = net equity issued in year t.
According to Shyam-Sunder and Myers (1999), the testing strategy of the pecking order hypothesis relies on the Equation 2:
ΔDi,t = αpo + βpoDEFi,t + ei,t (2)
where αpo and βpo are the pecking order parameters and ei,t is an error term. In Equation 2, the strong form test of the Pecking Order Model predicts that αpo = 0 and βpo = 1 (Shyam-Sunder & Myers, 1999). However, according to Chirinko and Singha (2000), the later form is very restrictive. They propose a semi-strong form according to which firms meet their financing deficit not only on debt financing.
Given the characteristics of Islamic financial instruments, we propose the following equations:
NDIi,t = αpo + βpoDEFi,t + ei,t (3)
where NDI is net debt issued (Murabahah, Ijara).
NSKIi,t = αpo + βpoDEFi,t + ei,t (4)
where NSKI is net Sukuk issued.
Considering the presence of debt capacity constraints, firms must resort to equity issues. Following Chirinko and Singha (2000) argument, the present study uses Equation 5 to be compared with Equations 3 and 4.
NQIi,t = αpo + βpoDEFi,t + ei,t (5)
where NQI is net equity issued.
Moreover, to test the predictions of the POT in KSA context, the present paper refers to the modified conventional regression of leverage of Frank and Goyal (2003). In the following regression equation, the cumulative financing deficit (CDEF) replaces the financing deficit (DEF) because of using levels of leverage rather than changes in leverage (Chen et al., 2013).

134
LEVi,t = α + βTANTANi,t + βMTBMTBi,t + βLSLSi,t + βPRFPRFi,t + βCDEFCDEFi,t + µi + υi,t (6)
where LEV refers to book leverage (long-term debt/total assets) or market-based debt (long-term debt to market capitalisation), TAN is the tangibility of assets (the ratio of fixed assets to total assets), MTB is the market-to-book ratio (the sum of the market value of equity and the book value of debt divided by the book value of assets), LS is the size of the firm (log of assets), PRF is the profitability (the ratio of operating income to total assets), CDEF is the cumulative financing deficit (the cumulative financing deficit divided by the book value of assets). According to Frank and Goyal (2003), the pecking order predicts that βTAN < 0, βMTB < 0, βLS > 0, βPRF < 0, and βCDEF > 0.
Equation 6 is simply a modified conventional regression with cumulative financing deficit as an added factor. If the inclusion of the cumulative financial deficit variable wipes out the effect of the other variables, then the predictions of the POT would be supported. Otherwise, the predictions of the POT would be contradicted (Chen et al., 2013; Allini et al., 2018).
RESULTS AND DISCUSSION
Tests of Pecking Order of Islamic Financial Instruments
Consistent with previous works (Shyam-Sunder & Myers, 1999; Chirinko & Singha, 2000), this study seeks to examine how well Islamic financial instruments track the financing deficit.
Table 4 summarises the regression results where the dependent variables are net debt (Murabahah, Ijara) issued, net Sukuk issued, total debt issued and net equity issued, all scaled by book assets. The selection of the appropriate model was made following three different tests developed by Baltagi (1995), Hausman (1978), and Breusch and Pagan (1980). The F-test (Baltagi, 1995) determines the best model between pooled OLS and the alternatives of panel data (i.e., fixed and random effects, respectively). The Breusch and Pagan Lagrangian multiplier (LM test) was performed to examine the existence of random effects. The Hausman test is used to select the best model between the random effects (RE) model and the alternative fixed effects (FE) model. The model specifications results reported in Table 4 reveal that the RE model is the most appropriate.
As highlighted in Table 4, the constant, α, is close to zero in all regressions. The slope parameter, β, ranges from 0.085 to 0.669 depending on the dependent

The Capital Structure of Islamic Firms
135
variable. Interestingly, it seems that sale-based instruments (Murabahah, Ijara) track the financial deficit much closer as they are cheaper than other alternatives and they do not dilute ownership. The estimated coefficient on financial deficit as 0.588 is still far below from observed coefficient for conventional firms in the U.S. market, that ranging between 0.75 and 0.85 (Shyam-Sunder & Myers, 1999). However, it is still far above from observed coefficients in Egypt market and Taiwan market that are 0.340 and 0.309, respectively (Allini et al., 2018; Chen et al., 2013).
If Islamic firms need more funds but cannot use debt-based instruments due to the debt-ratio constraint, then they move to equity financing. Regarding net equity issued, the results show a positive and significant coefficient (0.359) associated with financial deficit. Looking at these results in comparison to those in other developing countries, Allini et al. (2018) find a coefficient of 0.519 in Egypt, and Chen et al. (2013) find it to be 0.675 in Taiwan.
As a last alternative to finance deficit, Islamic firms issue Sukuk. The results reveal a positive low coefficient (0.085) of financial deficit on net Sukuk issued. This can be explained by the under-development of Sukuk market in KSA. According to Alshamrani (2014), the Sukuk market in KSA is new and immature, the first issuance of Sukuk was in 2004. In the KSA context, the issuance of Sukuk is suffering from heavy regulation and supervision drawbacks. This argument aligns with Alnori and Alqahtani (2019), who state that because of its complexity, firms are discouraged from issuing a Sukuk or at least making it their first option.
In sum, capital choice decision of Islamic-compliant firms seems to follow a modified POT, in which firms rely on retained earnings, followed by sale-based instrument (Murabahah, Ijara), then equity, with Sukuk as a last option.
We also ran tests using deficits, debt issues, Sukuk issues and equity issues over a varying firms’ classification. Table 5 presents the regression results for each subgroup. Empirical findings provide evidence that the capital choice decision of Petrochemical and non-Petrochemical firms follow similar modified POT consistent with the results already described. However, the impact of financial deficit is markedly different in the two subgroups. The coefficients associated with financial deficit in all regressions (debt, Sukuk and equity) are higher for Petrochemical firms compared to non-Petrochemical firms. This suggests that external resources track the financing deficit quite closely in liquid-rich firms (Petrochemical firms). This result can be explained by the easiness of

136
accessing external resources. Since they are large firms and have more tangible assets, they have the ability to negotiate financial contracts.
Table 4The estimators for Pecking Order Model for the full sample
Net debt issued
(1)
Net Sukuk issued
(2)
Total debt issued
(3)
Net equity issued
(4)
α 0.008***
(3.87)0.002*
(1.67)0.011***
(3.44)0.006
(1.26)
β 0.588***
(33.59)0.085***
(8.50)0.669***
(35.03)0.302***
(7.56)
N 946 946 946 946
R2 0.619 0.118 0.604 0.149
F-test (ui = 0)Wald χ2
Hausman testB-P Lagrangian test
3.42***
290.76***
0.38152.63***
2.13***
78.62***
0.1093.54***
2.62***
249.17***
0.17127.23***
1.86***
47.29***
0.2278.59***
Note: t-statistics are shown in parentheses. ***, **, and * indicate significance at the 1%, 5% and 10% level, respectively.
When we split firms according to crisis period, the results support the same modified POT in the pre and post-crisis only. Financial deficit is financed by sale-based instrument (Murabahah, Ijara), then equity, and lastly by Sukuk. However, the POT is highly violated in the crisis period. The results displayed in Table 5 show less reliance of firms on debt issuance in the crisis period. KSA firms seem more reliant on equity, then on sale-based instrument and on Sukuk as last alternative. KSA firms face higher credit constraints in the crisis period and therefore, they find it difficult to obtain financing from financial institutions. The financial crisis arguably provides a shock to the supply of external financing resulting in a liquidity crunch and lending contraction for banking systems globally. Consequently, corporate borrowing and capital expenditures fall sharply. This reflects in less leverage ratios in the crisis period. As argued by Ivashina and Scharfstein (2009), financial crisis results in banks’ curtailed lending to the corporate sector. This argument aligns with Dewally and Shao (2014) who suggest that the liquidity shocks to the short-term funding markets impose liquidity constraints to banks, resulting in lending cut and changes in the capital structure of corporations.

The Capital Structure of Islamic Firms
137
Tabl
e 5
The
estim
ator
s for
Pec
king
Ord
er M
odel
acc
ordi
ng to
liqu
idity
abu
ndan
ce a
nd c
risi
s per
iod
clas
sific
atio
n
Liqu
id a
bund
ance
Fina
ncia
l cris
is
Petro
chem
ical
Non
-pet
roch
emic
alPr
e-cr
isis
Cris
isPo
st-c
risis
ND
NS
NE
ND
NS
NE
ND
NS
NE
ND
NS
NE
ND
NS
NE
α0.
007
(1.0
4)0.
001
(0.9
2)0.
015**
(2.0
3)0.
007**
*
(3.9
8)0.
001*
(1.7
1)0.
006
(1.1
9)0.
001
(0.1
2)0.
001
(0.0
9)0.
007
(–0.
22)
0.01
5***
(3.1
4)0.
002
(0.7
1)0.
013**
(2.0
8)0.
005**
*
(3.6
2)0.
001
(1.2
1)0.
011**
*
(5.0
4)
β0.
611**
*
(17.
85)
0.09
8***
(7.6
3)0.
334**
*
(9.9
8)0.
465**
*
(31.
15)
0.02
5***
(5.0
8)0.
264**
*
(5.9
3)0.
542**
*
(17.
92)
0.07
8***
(6.2
3)0.
371**
*
(4.5
8)0.
358**
*
(12.
48)
0.05
8***
(3.2
3)0.
436**
*
(7.8
2)0.
576**
*
(28.
44)
0.02
2***
(5.1
3)0.
218**
*
(9.7
8)
N13
013
013
081
681
681
615
215
215
218
118
118
161
361
361
3
R20.
710
0.31
20.
458
0.61
30.
058
0.07
50.
722
0.24
20.
082
0.54
70.
065
0.31
20.
642
0.05
20.
174
F-te
st1.
45**
2.12
***
1.84
***
1.89
***
2.62
***
1.96
***
2.01
***
2.28
***
1.71
**3.
22**
*1.
96**
*2.
32**
*3.
27**
*1.
78**
*3.
17**
*
Wal
d χ2
112.
3***
77.2
1***
88.5
6***
252.
3***
101.
5***
46.8
4***
65.8
9***
44.5
3***
92.2
1***
104.
8***
62.8
9***
122.
4***
188.
9***
30.2
6***
70.5
4***
Hau
sman
0.89
0.22
0.52
1.52
0.88
0.66
1.04
0.91
0.51
1.86
0.43
0.14
2.08
0.47
0.49
B-P
test
52.6
3***
32.5
8***
74.2
3***
135.
6***
65.4
1***
39.5
8***
79.6
3***
66.8
4***
71.8
2***
114.
2***
47.6
2***
99.6
5***
162.
3***
55.3
2***
51.9
8***
Not
es:
t-sta
tistic
s ar
e sh
own
in p
aren
thes
es.
***, *
* an
d *
indi
cate
sig
nific
ance
at
the
1%,
5% a
nd 1
0% l
evel
, re
spec
tivel
y. N
D =
net
deb
t; N
S =
net
Suku
k;
NE
= ne
t equ
ity.

138
Tests of Conventional Leverage Regressions
The next test of the POT consists of adding the financing deficit to the conventional leverage regression and see whether the R2 increases considerably relative to the regression without this variable. In addition, we would expect that the inclusion of the financing deficit variable should render the effects of the other conventional explanatory variables insignificant.
First, we carry out two tests to check the existence of multicollinearity among the explanatory variables: the pairwise correlation matrix among the explanatory variables and the variance inflation factor (VIF). According to Kennedy (1985), a multicollinearity problem arises if the correlation among the independent variables is greater than or equal to 0.80. As shown in Table 6, all Pearson correlation coefficients are less than 0.8 indicating that multicollinearity is not a problem for the sample. Furthermore, as highlighted in Table 6, all VIF values of explanatory variables are less than 4, supporting the previous conclusion of the absence of multicollinearity problem in the data. According to O’Brien (2007), a VIF value exceeding 4 warrants further investigations. While a VIF value exceeding 10 is a sign of serious multicollinearity requiring correction.
Table 6Correlation matrix and VIF values
TANG MTB LS PRF CDEF VIF
TANG 1 1.10
MTB –0.006 1 1.21
LS 0.244 –0.211 1 1.12
PRF –0.192 0.302 0.072 1 1.25
CDEF 0.093 –0.019 0.088 –0.118 1 1.06Notes: TANG = tangibility; MTB = market-to-book ratio; LS = firm size; PRF = profitability; CDEF = cumulative financing deficit
Second, the selection of the appropriate model was made following tests developed by Baltagi (1995), Hausman (1978), and Breusch and Pagan (1980). The results reported in Tables 7 and 8 reveal that the F-test and Breusch-Pagan test are significant in all regressions. This implies that individual effect models (FE and RE) are the most appropriate. The results also show that all values of Hausman test are insignificant implying that the RE model is preferred to the FE model.
Table 7 provides the results for the full sample using Book-based debt and Market-based debt as independent variables. The results of the conventional

The Capital Structure of Islamic Firms
139
regressions without the deficit variable are provided in Columns (1) and (3). As indicated, the coefficients associated with tangibility, the MTB ratio, firm size, and profitability have the usual signs. Moreover, we find that the tangibility is positively related to both leverage measures which is inconsistent with the POT prediction. As Sharia principles impose that debt should be asset-backed, leverage will increase with the increase in tangible assets.
The MTB ratio is associated with negative coefficients for both leverage measures. Like conventional firms, debt instruments in Islamic-compliant firms have high distress costs (see Table 1). Consequently, a negative relationship between growth opportunities and leverage will be established because growth firms are exposed to more value loosing when they become financially distressed (Frank & Goyal, 2009). This argument aligns with Myers (1984) who states that there may be a concern that debt could limit a firm’s ability to seize such growth opportunities.
The coefficients associated with the size variable are positive and significant on both leverage measures consistent with the findings of Frank and Goyal (2009). In term of information asymmetry, large firms are expected to convey more information than small firms. Therefore, they have easy access to the credit market which enhances their debt capacity. Consistent with the POT, profitability is negatively related to both leverage measures. This result is supported by most empirical research (e.g., Frank & Goyal, 2009; Alnori & Alqahtani, 2019).
In Columns (2) and (4), both leverage regressions are estimated with financing deficit as an additional explanatory variable. The results show that the cumulative financing deficit added about 2% and 4% to the explanatory power of the book-based debt and market-based debt regressions, respectively. Further, the results indicate that the inclusion of the deficit variable to the regression does not result in an effect on the magnitudes and significance of the coefficients on the conventional variables. Thus, the cumulative financing deficit works well in both leverage regressions, although the POT is rejected. This reflects that the capital structure of Islamic-compliant firms in KSA is strongly derived by the cumulative financing deficit.
This result aligns with previous works including Chen et al. (2013) and Allini et al. (2018) who find that the introduction of the cumulative financial deficit in leverage specifications did not have much influence on the significance of other conventional variables’ coefficients. Moreover, there is no gain in terms of the explanatory power of the regressions.

140
Table 7Leverage regressions with conventional variables and cumulative financial deficit
Variables Book-based debt Market-based debt
(1) (2) (3) (4)
Constant –2.548***
(–7.22)–2.953***
(–7.89)–1.289**
(–2.36)–1.285**
(–2.38)
TAN 0.562***
(5.95)0.558***
(6.17)0.396**
(2.12)0.0.354**
(1.98)
MTB –0.038**
(–2.42)–0.037***
(–2.39)–0.129***
(–3.79)–0.132***
(–3.86)
LS 0.287***
(7.02)0.282***
(6.89)0.172***
(2.88)0.164***
(2.94)
PRF –0.475***
(–3.01)–0.470***
(–2.96)–0.241(–0.74)
–0.173(–0.43)
CDEF 0.358***
(4.23)0.894***
(4.16)
R2 0.416 0.417 0.326 0.382
N 946 946 946 946
F-test (ui = 0) 12.52*** 12.26*** 2.99*** 2.77***
Wald χ2 160.98*** 174.58*** 37.84*** 66.51***
Hausman test 6.48 7.92 8.32 9.67
B-P LM test 1052.36*** 1008.22*** 74.60*** 58.98***
Note: t-statistics are shown in parentheses. ***, **, and * indicate significance at the 1%, 5%, and 10% level, respectively.
The same tests are done considering liquidity abundance and crisis period classifications. Table 8 provides empirical results. To save space, we only report the results using the Book-based debt regression. Except market-to-book ratio, most variables show the similar sign and significance to the all-firms’ sample. The coefficient associated with MTB variable is not significant for Petrochemical firms as well as in crisis and post-crisis periods.
Further, the results show that the signs, magnitudes, and significance of the coefficients of conventional factors are not influenced by the inclusion of the cumulative financing deficit to the regression. As reported in Table 8, the coefficient of the cumulative financing deficit is significant in all regression except in crisis period. This aligns with the original results about the reject of the POT in KSA Islamic-compliant firms. In addition, the findings reflect the financial behaviour disturbance of KSA firms during the crisis period.

The Capital Structure of Islamic Firms
141
Tabl
e 8
Leve
rage
regr
essi
ons a
ccor
ding
to li
quid
ity a
bund
ance
and
cri
sis p
erio
d cl
assi
ficat
ions
Var
iabl
es
Liqu
idity
abu
ndan
ceFi
nanc
ial c
risis
Petro
chem
ical
Non
-pet
roch
emic
alPr
e-cr
isis
Cris
isPo
st-c
risis
(1)
(2)
(3)
(4)
(5)
(6)
(7)
(8)
(9)
(10)
Con
stan
t–5
.422
***
(–2.
92)
–5.6
32**
*
(–3.
03)
–2.2
64**
*
(–8.
32)
–1.9
82**
*
(7.4
8)–3
.095
***
(–4.
84)
–1.8
16**
*
(–3.
69)
–2.6
77**
*
(–4.
80)
–2.6
28**
*
(–4.
66)
–2.6
92**
*
(–5.
27)
–2.6
92**
*
(–5.
17)
TAN
1.54
6***
(2.7
1)1.
493**
*
(2.6
8)0.
396**
*
(6.5
2)0.
402**
*
(6.8
1)0.
285*
(1.7
1)0.
199
(1.5
0)0.
531**
*
(3.0
8)0.
546**
*
(3.1
2)0.
768**
*
(5.8
4)0.
828**
*
(6.4
1)
MTB
–0.1
42(–
1.31
)–0
.130
(–1.
27)
–0.0
31**
*
(–2.
71)
–0.0
32**
*
(–2.
78)
–0.0
64*
(–1.
73)
–0.0
45*
(–1.
64)
–0.0
45(–
1.37
)–0
.047
(–1.
41)
–0.0
29(–
1.56
)–0
.027
(–1.
49)
LS0.
507**
*
(2.7
2)0.
521**
*
(3.2
1)0.
230**
*
(8.2
2)0.
217**
*
(8.1
4)0.
369**
*
(5.2
6)0.
219**
*
(4.0
2)0.
298**
*
(4.9
5)0.
291**
*
(4.7
7)0.
278**
*
(5.1
2)0.
269**
*
(4.9
5)
PRF
–1.4
73**
(–1.
99)
–1.5
43**
(–2.
12)
–0.1
72*
(–1.
72)
–0.1
71*
(–1.
68)
–1.2
65**
*
(–2.
85)
–0.6
95**
(–1.
98)
–0.2
83(–
1.02
)–0
.257
(–0.
91)
–0.2
57*
(–1.
71)
–0.2
84*
(–1.
95)
CD
EF0.
572**
(2.1
2)0.
276**
*
(4.3
6)1.
141**
*
(7.6
7)0.
045
(0.6
1)0.
583**
*
(5.0
7)
R20.
372
0.42
30.
376
0.39
20.
303
0.56
50.
371
0.37
20.
322
0.31
2
N13
013
081
681
615
215
218
118
161
361
3
12.5
3***
11.0
8***
10.0
2***
10.0
4***
6.87
***
4.71
***
22.9
7***
22.6
0***
19.4
2***
20.7
4***
F-te
st
Wal
d χ 2
38.4
5***
44.6
2***
161.
30**
*18
3.07
***
49.7
2***
131.
56**
*50
.89**
*51
.05**
*86
.45**
*11
5.06
***
Hau
sman
te
st0.
784.
424.
956.
144.
783.
431.
120.
492.
482.
83
B-P
LM
test
149.
02**
*12
2.07
***
505.
22**
*48
2.05
***
26.9
6***
13.8
6***
56.2
9***
56.1
9***
718.
90**
*74
5.19
***
Not
e: t-
stat
istic
s are
show
n in
par
enth
eses
. ***, **
and
* ind
icat
e si
gnifi
canc
e at
the
1%, 5
% a
nd 1
0% le
vel,
resp
ectiv
ely.

142
CONCLUSION
The objective of this study was to investigate whether the POT is an accurate means to describe the incremental financing practices by firms operating under Islamic principles.
Employing panel data analysis, this study first examines how well Islamic financial instruments track the financing deficit. The results show that sale-based instruments (Murabahah, Ijara) track the financial deficit much closer as they are cheaper than other alternatives and they do not dilute ownership. If the firm needs more funds but cannot use debt-based instruments due to the debt-ratio constraint, then it moves to equity financing. As a last alternative to finance deficit, Islamic-compliant firms issue Sukuk. This can be explained by the under-development of Sukuk market in KSA. Further, the results reveal high violation of the POT in the crisis period. Islamic-compliant firms seem more reliant on equity, then on sale-based instrument and on Sukuk as last alternative. Due to credit constraints in the crisis period, equity capital financing is preferred to debt financing.
Next, following Frank and Goyal (2003), the study focuses on examining how the financing deficit performs in a nested model including conventional factors. The study findings indicate no change in the effects of conventional variables when adding cumulative financing deficit to the regression. This provides no support for the POT attempts by KSA Islamic-compliant firms.
In total, it seems that the issuance activity of Islamic-compliant firms is more closely to the need of funds instead of adhering to a hierarchy of financing sources.
Several implications can be derived from the study results. First, due to the lack of regulatory framework of Sukuk issuance, it is recommended to update the present regulations of securities’ issuance in KSA to cover Sukuk. In this regard, policymakers, bankers and standard-setting organisations should collaborate to simplify the process of issuing Islamic financial instruments, including Sukuk. Given that Malaysia is the global hub of Islamic finance sector, Saudi legislation authority can profit from its experience in the field of Sukuk. Second, the Saudi government has to encourage the private sector to develop products and services compliant with Sharia principles. Finally, to attract investors, the CMA has to encourage transaction, efficiency and liquidity of Islamic financial instruments.
The paper identifies some areas where further research on topics related to capital structure of Islamic-compliant firms is needed. The failure of the POT
The Capital Structure of Islamic Firms
143
to explain KSA firms’ financing choices strongly pushed researchers to test the market timing theory for the Saudi stock market. Further researches could re-examine the TOT in the absence of interest tax shield as in an Islamic economy.
REFERENCES
Ahmed, H. (2007).Issues in Islamic corporate finance: Capital structure in firms. IRTI Research Paper Series No. 70, Jeddah, Saudi Arabia.
Allini, A., Rakha, S., McMillan, D. G., & Caldarelli, A. (2018). Pecking order and market timing theory in emerging markets: The case of Egyptian firms. Research in International Business and Finance, 44(2), 297–308. https://doi.org/10.1016/j.ribaf.2017.07.098
Alnori, F., & Alqahtani, F. (2019). Capital structure and speed of adjustment in non-financial firms: Does sharia compliance matter? Evidence from Saudi Arabia. Emerging Markets Review, 39(1), 50–67. https://doi.org/10.1016/j.ememar.2019.03.008
Alshamrani, A. (2014). Sukuk issuance and its regulatory framework in Saudi Arabia. Journal of Islamic Banking and Finance, 2(1), 305–333.
Baltagi, B. H. (1995). Econometric analysis of panel data. New York: John Wiley.Bitar, M., Hassan, M. K., & Hippler, W. J. (2018). The determinants of Islamic bank
capital decisions. Emerging Markets Review, 35(2), 48–68. Breusch, S., & Pagan, R. (1980). The Lagrange multiplier test and its applications to model
specification in econometrics. Review of Economic Studies, 47(1), 239–253.Chen, D. H., Chen, C. D., Chen, J., & Huang, Y. F. (2013). Panel data analyses of the
pecking order theory and the market timing theory of capital structure in Taiwan. International Review of Economics and Finance, 27(3), 1–13. https://doi.org/10.1016/j.iref.2012.09.011
Chen, J. J. (2004). Determinants of capital structure of Chinese-listed companies. Journal of Business Research, 57(12), 1341–1351. https://doi.org/10.1016/S0148-2963(03)00070-5
Chirinko, R. S., & Singha, A. R. (2000). Testing static tradeoff against pecking order models of capital structure: A critical comment. Journal of Financial Economics, 58(3), 417–425.
Dewally, M., & Shao, Y. (2014). Liquidity crisis, relationship lending and corporate finance. Journal of Banking & Finance, 39(2), 223–239.
Fama, E. F., & French, K. R. (2005). Financing decisions: Who issues stock? Journal of FinancialEconomics, 76(3), 549–582. https://doi.org/10.1016/j.jfineco.2004.10.003
Frank, M. Z., & Goyal, V. K. (2003). Testing the pecking order theory of capital structure. Journal of Financial Economics, 67(2), 217–248. https://doi.org/10.1016/S0304-405X(02)00252-0
Frank, M. Z., & Goyal, V. K. (2009). Capital structure decisions: Which factors are reliably important? Financial Management, 38(1), 1–37.

144
Guizani, M. (2019). The investment-cash flow sensitivity in gulf countries: Does Sharia-compliance matter? Review of Behavioral Finance, 11(4), 406–425. https://doi.org/10.1108/RBF-03-2018-0024
Hausman, J. (1978). Specification tests in econometrics. Econometrica, 46, 1251–1271.Ivashina, V., & Scharfstein, D. (2009). Bank lending during the financial crisis of 2008.
Journal of Financial Economics, 97(3), 319–338. https://doi.org/10.1016/j.jfineco.2009.12.001
Kennedy, P. (1985). A guide to econometrics. Cambridge, MA: Massachusetts Institute of Technology Press.
Klein, P. O., & Weill, L. (2016). Why do companies issue Sukuk? Review of Financial Economics, 31(4), 26–33. https://doi.org/10.1016/j.rfe.2016.05.003
Komera, S., & Lukose, J. (2015). Capital structure choice, information asymmetry, and debt capacity: Evidence from India. Journal of Economics and Finance, 39(4), 807–823.
Kraus, A., & Litzenberger, R. H. (1973). A state-preference model of optimal financial leverage. The Journal of Finance, 28(4), 911–922.
Lemmon, M. L., Roberts, M. R., & Zender, J. F. (2008). Back to the beginning: Persistence and the cross-section of corporate capital structure. The Journal of Finance, 63(4), 1575–1608.
Modigliani, F., & Miller, M. (1958). The cost of capital corporation finance, and the theory of investment. American Economic Review, 48(3), 261–297.
Myers, S. C. (1984). The capital structure puzzle. The Journal of Finance, 39(3), 575–592. Myers, S. C., & Majluf, N. S. (1984). Corporate financing and investment decisions
when firms have information that investors do not have. Journal of Financial Economics, 13(2), 187–221.
Naz, I. Shah, S. M. A., & Kutan, A. M. (2017). Do managers of sharia-compliant firms have distinctive financial styles? Journal of International of Financial Markets, Institutions and Money, 46(1), 174–187. https://doi.org/10.1016/j.intfin.2016.05.005
O’Brien, R. M. (2007). A caution regarding rules of thumb for variance inflation factors. Quality & Quantity, 41(5), 673–690.
Sapuan, N. M. (2016). An evolution of mudarabah contract: A viewpoint from classical and contemporary Islamic scholars. Procedia Economics and Finance, 35, 349–358. https://doi.org/10.1016/S2212-5671(16)00043-5
Shyam-Sunder, L., & Myers, S. (1999). Testing static trade-off against pecking order models of capital structure. Journal of Financial Economics, 51(2), 219–244. https://doi.org/10.1016/S0304-405X(98)00051-8
Siddiqui, A. (2008). Financial contracts, risk and performance of Islamic banking. Managerial Finance, 34(10), 680–694. https://doi.org/10.1108/03074350810891001
Yildirim, R., Masih, M., & Bacha, O. I. (2018). Determinants of capital structure:Evidence from Shari’ah compliant and non-compliant firms. Pacific-Basin Finance
Journal, 51(5), 198–219. https://doi.org/10.1016/j.pacfin.2018.06.008Zolfaghari, P. (2017). An introduction to Islamic securities (Sukuk). Uppsala Faculty of
Law Working Paper 2017: 2. Retrieved from http://uu.diva-portal.org