the capital structure decisions of new firms nber · pdf filethe capital structure decisions...
TRANSCRIPT

NBER WORKING PAPER SERIES
THE CAPITAL STRUCTURE DECISIONS OF NEW FIRMS
Alicia M. RobbDavid T. Robinson
Working Paper 16272http://www.nber.org/papers/w16272
NATIONAL BUREAU OF ECONOMIC RESEARCH1050 Massachusetts Avenue
Cambridge, MA 02138August 2010
The authors are grateful to the Kauffman Foundation for generous financial support. Malcolm Baker,Thomas Hellmann, Antoinette Schoar, Ivo Welch, and seminar participants at the Kauffman/ClevelandFederal Reserve Bank Entrepreneurial Finance Conference, the University of Michigan, the StockholmSchool of Economics, the Atlanta Fed, and the NBER Summer Institute Entrepreneurship Meetingsand the Kauffman/RFS conference on entrepreneurial finance provided helpful comments on previousdrafts. Juan Carlos Suarez Serrato provided expert research assistance. The usual disclaimer applies.The views expressed herein are those of the authors and do not necessarily reflect the views of theNational Bureau of Economic Research.
NBER working papers are circulated for discussion and comment purposes. They have not been peer-reviewed or been subject to the review by the NBER Board of Directors that accompanies officialNBER publications.
© 2010 by Alicia M. Robb and David T. Robinson. All rights reserved. Short sections of text, notto exceed two paragraphs, may be quoted without explicit permission provided that full credit, including© notice, is given to the source.
The Capital Structure Decisions of New FirmsAlicia M. Robb and David T. RobinsonNBER Working Paper No. 16272August 2010JEL No. G21,G24,L26
ABSTRACT
This paper investigates the capital structure choices that firms make in their initial year of operation,using restricted-access data from the Kauffman Firm Survey. Contrary to many accounts of startupactivity, the firms in our data rely heavily on external debt sources such as bank financing, and lessextensively on friends and family-based funding sources. This fact is robust to numerous controls forcredit quality, industry, and business owner characteristics. The heavy reliance on external debt underscoresthe importance of well functioning credit markets for the success of nascent business activity.
Alicia M. RobbUC, Santa [email protected]
David T. RobinsonFuqua School of BusinessDuke UniversityOne Towerview DriveDurham, NC 27708and [email protected]

1 Introduction
Understanding how capital markets affect the growth and survival of newly created
firms is perhaps the defining question of entrepreneurial finance. Yet, much of what we
know about entrepreneurial finance comes from firms that are already established, have
already received venture capital funding, or are on the verge of going public—the dearth
of data on very early stage firms makes it difficult for researchers to look further back in
firms’ life histories.1 Even data sets that are oriented towards small businesses do not
allow us to measure systematically the decisions that firms make at their founding. This
paper uses a novel data set, the Kauffman Firm Survey (KFS), to study the behavior
and decision-making of newly founded firms. As such, it provides a first-time glimpse
into the capital structure decisions of nascent firms.
In this paper we use the confidential, restricted-access version of the KFS, which
tracks nearly 5,000 firms from their birth in 2004 through their early years of operation.2
Because the survey identifies firms at their founding and follows the cohort over time,
recording growth, death, and any later funding events, it provides a rich picture of firms’
early fundraising decisions.
Rather than attempt to test specific theories of capital structure, our main goal is a
more modest, descriptive one: to examine the financing choices that firms make when
they launch, and ask whether any patterns emerge from the data. This is motivated
in part by the widely held view that frictions in capital markets prevent startups from
achieving their optimal size, or indeed, from starting up at all. In the presence of such
acute frictions, startups are assumed to pursue financing from informal channels, or
1Some noteworthy recent exceptions are Kaplan, Sensoy and Stromberg, 2009, which follows a smallsample of firms beginning at business plan stage, and Reynolds (2008) which uses data from individualswho are contemplating starting businesses.
2To be eligible for inclusion in the KFS, at least one of the following activities had to have beenperformed in 2004 and none performed in a prior year: Payment of state unemployment (UI) taxes;Payment of Federal Insurance Contributions Act (FICA) taxes; Presence of a legal status for thebusiness; Use of an Employer Identification Number (EIN); Use of Schedule C to report business incomeon a personal tax return.
2

through the heavy reliance on trade credit (see, for example, Peterson and Rajan, 1994,
2000.) The richness of the KFS data allows us to explore the extent to which startups
rely on friends and family versus more formal financing arrangements, such as bank
loans, credit cards, and venture capital.
A working null hypothesis for this descriptive exercise is that no clear patterns in
capital structure are present, because idiosyncracies in firm and owner characteristics,
market conditions and access to financial and human capital are associated with a high
degree of variability in the capital structure choices that nascent firms make. The
alternative offered by conventional wisdom is that informal capital dominates the capital
structure.
Our main result is that newly founded firms rely heavily on formal debt financing:
owner-backed bank loans, business bank loans and business credit lines. Indeed, funding
from formal debt dwarfs funding from friends and family. The average amount of bank
financing is seven times greater than the average amount of insider-financed debt; three
times as many firms rely on outside debt as do inside debt. Even among firms that rely
on inside debt, the average amount of outside debt is nearly twice that of inside debt.
The reliance on formal credit channels over personal credit cards and informal lending
holds true even for the smallest firms at the earliest stages of founding. The average pre-
revenue firm in our sample has twice as much capital from bank loans than from insider
sources. And when we look at only those firms who access outside equity sources, such
as venture capital or angel financing, we still see a heavy reliance on debt: the average
firm that accesses external private equity markets still has around 25% of its capital
structure in the form of outside debt.
We also examine trade credit as a potential source of capital, especially since it may
be especially important in scenarios where trade creditors possess information (or stand
to forge relationships through supply channels) that banks might not be able to obtain
(Peterson and Rajan, 1997). While our data show that trade credit is undoubtedly
3
important, the average firm uses less than half as much trade credit as it does outside
debt, and almost twice as many firms rely on outside debt than do trade credit. Indeed,
if trade credit were counted as a source of financial capital (instead of operating capital),
it would rank third, behind outside debt and owner equity, but ahead of outside equity
and inside debt/equity.
Of course, these statements only speak to the equilibrium amount of borrowing from
inside and outside sources; the quantities are determined by both the supply and the
demand of different types of capital. Ultimately, it is challenging to separate supply
and demand in the absence of some quasi-experiment. We nevertheless take some small
steps in this direction.
First, to control for the fact that differences in firm quality or creditworthiness may
be driving the patterns we see in the data, we make use of commercial credit scores of
the firms. This gives us two avenues to control for demand-side variation. The first is
simply to include the credit score directly in our analysis as a proxy for firm quality.
(Alternatively, we can partition the data into high credit and low credit samples and
compare capital structures in the two sub-samples.) Surprisingly, this partitioning has
little effect on the observed capital structure choices firms make. Firms with high credit
scores simply have more financial capital. The level of financing of these firms is nearly
three times larger on average than low-credit firms. But the relative amount of outside
debt to total capital is about the same for both types of firms.
Second, we identify plausibly exogenous variation in access to capital by using hous-
ing price elasticity data calculated by Saiz (2010). Using sophisticated GIS techniques to
measure geographical constraints on local land supply, as well as factors that account for
endogenous restrictions on land use through zoning, he estimates housing supply elastic-
ities at the MSA level which, in turn, allow us to capture the effect of the housing boom
on access to capital. Roughly speaking, high elasticity areas saw housing inventories in-
crease as the housing bubble expanded, while low elasticity areas saw home prices spike
4

instead. In areas with high elasticity of supply, homes provide better loan collateral,
because the underlying home equity is less sensitive to local pricing conditions.
This is exactly what we find. Entrepreneurs in areas with high supply elasticity were
more reliant on bank loans as a source of capital. Because our data do not map the
entrepreneurs’ actual home prices onto bank financing choices, we must remain cautious;
nevertheless, we find evidence that high price stability acts as a catalyst for bank loans.
This of course raises the concern that credit conditions at the time of our survey
were so unique that they do not necessarily reflect broader patterns from other time
periods. While ultimately we are limited to the data that are available, we speak to this
possibility by considering the impact of capital structure decisions on outcome variables
like firm survival, employment growth, and profitability growth. We find that having a
capital structure that is more heavily tilted towards formal credit channels results in a
greater likelihood of success. This fact holds even when we include the credit score as
a measure of firm quality to guard against the possibility that unobserved factors drive
both success and credit access. Our findings indicate that even if credit conditions in
2004 were unique, credit market access had an important impact on firm success.
This paper is related to a number of papers in the banking, capital structure, and
entrepreneurship literature. Given the emphasis in the current work on the role of formal
banking channels and trade credit, our paper is also related to the literature on the role
of banks and other sources of financing for small firms (Peterson and Rajan, 1994, 1997,
2000). Cosh, Cumming and Hughes (2008) find a similarly important role for bank
capital using British data, but they observe firms at a later point in their life cycle.
The remainder of the paper is as follows. We begin in Section 2 by describing the KFS
in greater detail. Section 3 examines initial capital structure choices. We incorporate
credit scores and other firm characteristics in Section 4. Section 5 explores multivari-
ate regressions of capital structure on a range of business and owner characteristics to
explain capital structure decisions. Section 6 explores the link between home supply
5

elasticity and bank debt. In Section 7 we examine how initial capital structure affects
firm outcomes. Section 8 concludes.
2 The Kauffman Firm Survey
The KFS is a longitudinal survey of new businesses in the United States. This survey
collected information on 4,928 firms that started in 2004 and surveys them annually.
These data contain detailed information on both the firm and up to ten business owners
per firm. In addition to the 2004 baseline year data there are four years of follow up
data (2005 through 2007) now available. Additional years are planned. Detailed infor-
mation on the firm includes industry, physical location, employment, profits, intellectual
property, and financial capital (equity and debt) used at start-up and over time.
Information on up to ten owners includes age, gender, race, ethnicity, education,
previous industry experience, and previous startup experience. For more information
about the KFS survey design and methodology, please see Robb et. al (2009). A public-
use dataset is available for download from the Kauffman Foundation’s website and a
more detailed confidential dataset is available to researchers through a secure, remote
access data enclave provided by the National Opinion Research Center (NORC). For
more details about how to access these data, please see www.kauffman.org/kfs.
A subset of the confidential dataset is used in this research—those firms that either
have data for all three survey years or have been verified as going out of business in 2005,
2006 or 2007. This reduces the sample size to 3,972 businesses. The method we used for
assigning owner demographics at the firm level was to define a primary owner. For firms
with multiple owners (35 percent of the sample), the primary owner was designated by
the largest equity share. In cases where two or more owners owned equal shares, hours
worked and a series of other variables were used to create a rank ordering of owners
in order to define a primary owner. (For more information on this methodology, see
6

Robb et. al, 2009). For this research, multi-race/ethnic owners are classified into one
race/ethnicity category based on the following hierarchy: black, Asian, other, Hispanic,
and white. As a result of the ordering, the white category includes only non-Hispanic
white.
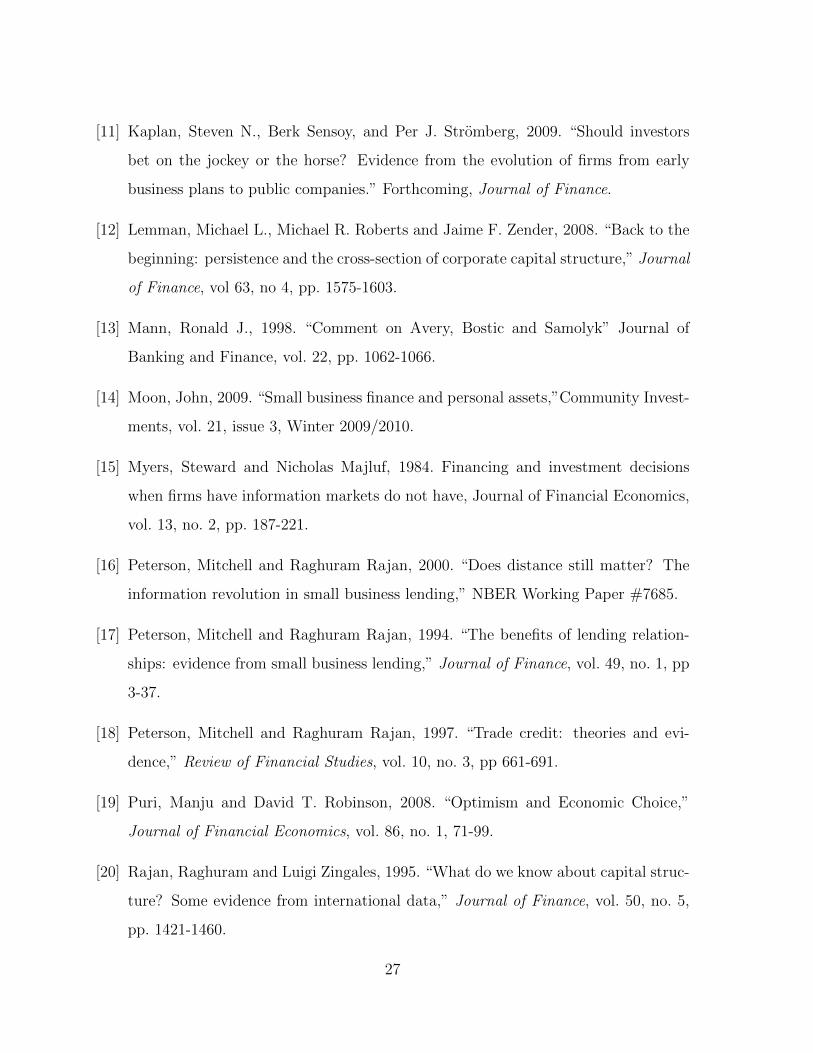
Tables 1 and 2 provide details on business characteristics. In Table 1, we report
key features of the business—its legal form, location, and other features of operations.
Roughly 36% of all businesses in the data are sole proprietorships, and about 58% are
structured to provide some form of limited liability to owners. About 28% are organized
as S or C corporations.
Half of the businesses in the survey operate out of the respondents home or garage; the
vast majority (86%) market a service, and only a quarter of the firms in the survey have
any form of intellectual property (patents, copyrights, and/or trademarks). Reflecting
the fact that they are being measured at their inception, the firms are also tiny by almost
any conceivable measure. Nearly 60% of the firms have no employees other than the
founder, and less than 8% of firms in the sample have more than five employees in their
first year of operations.
Table 2 considers the cash flow characteristics of these nascent businesses. Even
though these firms are small, nearly twenty percent of firms (16.8%) have over $100,000
in revenue in their first year. Indeed, 45% of the firms in the sample have more than
$10,000 in annual revenue in their first year. Of course, over 57% of firms have more
than $10,000 in expenses, and almost one firm in four reports zero profit or loss.
Table 3 examines owner characteristics in more detail. The entrepreneurs in our
data are overwhelmingly male and white: less than one-third of respondents are female
and over three-quarters are non-Hispanic white. In spite of the fact that most of the
businesses in our data begin at home, in people’s garages, with fewer than five employees,
the overwhelming majority of business owners have at least some industry experience.
Less than ten percent of owners have no previous industry experience, while more than
7
half have more than five years of industry experience. Likewise, more than forty percent
of business owners have started a business before. More than 80% of respondents are
over the age of 35 when they start their business, and roughly half the sample is aged
45 or older.
The entrepreneurs in our sample are relatively well educated. Less than 20% of re-
spondents have less than a high school degree, while well over half of respondents have
completed some form of a college degree. Finally, nearly a quarter of all respondents
have received some form of advanced, post-graduate education. In broad terms, these
demographics match those reported in other data sources. For example, these demo-
graphics are similar to those reported in Puri and Robinson (2008), using the Survey of
Consumer Finances, and Fairlie and Robb (2007), using the Characteristics of Business
Owners Survey.
3 Where do startups go for capital?
This section explores descriptive statistics about the capital structure decisions that
startup firms make. To impose some structure on the details of startup fundraising,
we first put forward a scheme for classifying the different types of capital available to
startups.
We distinguish capital sources on two main dimensions. The first is debt vs. equity.
Because we do not delve into the contractual details of VC funding agreements, simply
distinguishing debt and equity serves our purposes: loans, credit cards, lines of credit
and the like are classified as debt.
Next, we distinguish capital according to its source. Capital can be provided either
by owners, by insiders, or by outsiders. The KFS is careful to distinguish owner equity
from cash that a business owner obtained through, say, a home equity line, which in our
8

classification scheme, would be a source of outside debt, since it was provided through a
formal contract with a lending institution. Informal financing channels include debt or
equity from family members and personal affiliates of the firm, while formal financing
channels include debt accessed through formal credit markets (banks, credit cards, lines
of credit) as well as venture capital and angel financing.
The most notable implication of our classification scheme is that it groups together
personal debt on the business owner’s household balance sheet with business bank loans,
and places these under the “outside debt” category. We do this for several reasons. First,
if the business is structured as a sole proprietorship, then there is no legal difference be-
tween the assets of the firm and those of the owner. Thus, for around 40% of our
sample, the distinction is meaningless in the first place. But more importantly, research
has shown that personal guarantees and personal collateral must often be posted to se-
cure financing for startups (Moon, 2009; Avery, Bostic and Samalyk, 1998; Mann, 1998).
This means that in the remaining 60% of the firms, the limited liability offered by incor-
poration would often be contractually circumvented in the borrower/lender agreement
with the bank. As such, our primary distinction is not whether the debt is claim on the
business owner’s household assets or her business assets, but rather, whether this debt
was issued by an institution, or by friends and family.
3.1 A detailed look at capital structure
In Table 4, we use this classification scheme to provide a detailed look at the capital struc-
ture choices that nascent firms make. The thirty different sources of capital for startup
businesses are grouped into the six categories described above (owner/insider/outsider
× debt/equity). Over 75% of firms have at least some owner equity; of these, the mean
amount is just over $40,500. If we include the quarter of firms with no reported owner’s
equity, the average owner equity amount drops to $31,734.
9

Owner debt plays a much smaller role. Only about 1/4 of firms have some form of
owner personal debt, and the vast majority of this is mostly in the form of debt carried
on an owner’s personal credit card. The overall average amount of credit card debt used
to finance startups is a modest $5,000, but this includes the roughly 75% of owners
who do not use personal credit cards to start their businesses. Among those who do,
the balance is considerably larger—$15,700, or about 1/3 of the size of owner equity.
But in general, personal credit card balances make up a relatively small fraction of the
startup’s overall capital structure at inception—only about 4 to 5% of the firm’s total
capitalization is in the form personal credit card balances held by firm owners.
While owner-provided capital is heavily tilted towards equity, the capital from other
sources is heavily tilted towards debt. If we include the firms with zero values, firms use
about five times as much debt as they do equity. This holds for both inside debt ($6,362)
to equity ($2,102), as well as outside debt ($47,847) to equity ($15,935). But seven times
as many firms report outside debt as report outside equity. Yet, among those who do
receive outside equity, there is no question that it is important. The average amount of
outside equity among the 205 firms who access this source of financing is over $350,000,
roughly twice as large as the total financial capital for the average firm in the survey.
Turning first to insiders, we see that equity is uncommon. Only about five percent
of the sample relies on equity from a spouse or other family members, and the overall
average amount (including the 95% with no family equity) is only about two percent
of the average funding. Yet, among the group who uses family equity, the source is
important: the magnitude of insider equity is roughly the same as that of owner equity,
and many times larger than the magnitude of owner debt.
Insider debt is more common, but still a small source of funding relative to outside
debt and equity. The mean value of inside debt for all firms is $6,362, and this primarily
comes from personal loans received by the respondent from family and other owners.
Loans directly to the business from owners or other family members are also important,
10

but the fact that less than ten percent of surveyed firms rely on any one type of inside
debt suggests that this funding source is not commonly relied upon by new firms.
When we turn to outsider debt, we see that on average it is the largest single financing
category for startups during their first year of operation. While this no doubt reflects
the relative supply of outside debt to other funding sources, it is noteworthy that only a
relatively small fraction of this comes from credit card balances issued to the business.
Of the $47,847 average debt level, less than $2,500 on average comes from business credit
cards.
One widely held view about entrepreneurial finance is that startups lack access to
formal capital markets, and thus are forced to rely on an informal network of family,
friends, and other financing sources like credit cards to bootstrap their initial financing.
Table 4 speaks against this idea. First, outside capital is extremely important, even at
the earliest stages of a firm’s life. The average new firm has approximately $109,000 of
financial capital. Of that, roughly half comes from outside sources.
To be clear, however, informal investors do play an important role for those firms who
obtain external equity funding. Looking solely at the external equity funding, of the 205
firms who received some form of external equity funding, over half received funding from
outside informal investors. The average amount, around $245,000, is roughly one-fourth
the average for the handful of firms that report obtaining venture capital.3
Second, the vast majority of this outside capital comes in the form of credit, either
through personal loans made directly to the owner or through business credit cards.
Moreover, credit cards play a relatively small role for the average startup. If we total
the average credit card holdings on all personal and business accounts associated with
the business, the amount sums to less than half the average personal bank loan. If we
tally the average personal bank loan and the average business bank loan, this amount is
3Some firms may indeed misclassify angel investors as venture capital, as the average amounts arequite low.
11
roughly four times the size of the average total credit card balances outstanding.
3.2 Capital Structure and Firm Type
Perhaps the most surprising finding in Table 4 is that formal credit channels—business
and personal bank loans—are the most important sources of funding for startups. To
push this observation further, we segment the data in Table 5 to report capital structure
patterns for different types of startup firms.
The idea behind Table 5 is to isolate those firms that are in their very earliest stages
of starting up, to see if the overall capital structure patterns hold there as well. This can
be done according to a number of criteria. In the first column of Table 5, we examine
the 2,425 firms who have no employees other than the founder. These firms are small
relative to the average reported for all firms in Table 4—there total capital is only around
$45,000 as compared to the roughly $110,000 in Table 4. But proportionately, outside
debt plays a quite similar role: the average non-employer firm has $19,500 in outside
debt, or about 43% of its total capital, compared to approximately $48,000, or about
44% of total capital on average for firms overall. Of the outside debt, we again see that
business bank loans and personal bank loans make up the bulk of the $19,500. Only
about $2,500 comes from other sources on average.
The second column examines the 2,168 businesses which are home-based, meaning
that they do not operate any office or warehouse space outside the home. These too are
small, presumably including the proverbial “garage business” as well as businesses of a
professional nature that operate out of a home office. The capital structure patterns
for these businesses are remarkably similar to the non-employer businesses: about forty
percent of their total capital is financed through outside debt, and the lion’s share of
that comes from personal and business bank loans, rather than credit card balances.
12

Another way to pinpoint firms at their earliest stages is to focus only on pre-revenue
or pre-profit firms. We examine these firms in columns (3) and (4), respectively. These
firms are considerably larger than the previous two categories, presumably because these
include many firms that have secured inventories in advance of sales, or require external
building space to operate. Indeed, these columns look quite similar to the averages
reported in Table 4 for the whole sample.
Because the first four columns of Table 5 monotonically expand the size and scope
of firms under consideration, they offer an alternative way to examine capital choice,
albeit descriptively. Moving from the first column of data to the fourth column of data
more than doubles the firm’s size by adding an additional $80,000 of total capital to the
firm. By far the bulk of this comes from outside debt and equity, which together make
up about half the increase in firm capital. Since columns (3) and (4) also contain some
non-employer and home-based firms, this comparison understates the magnitude of the
shift in capital structure. Thus, the comparisons across the columns of Table 5 indicate
that friends and family is probably an earlier source of financing than outside debt, as
previous accounts have indicated. It is just not terribly important in terms of total size.
The final two columns of Table 5 split the data according to whether the firm contin-
ued to operated throughout the first four waves of the KFS, or whether the firm ceased
operations. Firms that survive look very much like the overall average reported in Table
4. On the other hand, firms that ceased operations sometime before 2007 not only began
smaller, but also had considerably smaller proportions of outside debt to total capital.
Rather than focus on the firms least likely to access debt markets from a size perspec-
tive, in Table 6 we focus on firms that demonstrated an ability to access outside equity.
Since here we are conditioning the sample on the presence of outside equity, we would
naturally expect outside equity to play an important role for these firms. It does. For
example, angel-backed firms are about 50% outside equity, and they are considerably
larger than the average firm on the KFS. The ratio of outside equity to total capital
13

is even higher for VC-backed and corporate-equity backed firms. Notwithstanding the
reliance on outside equity, these firms have large amounts of outside debt. Outside debt
is the second largest source of capital for these firms, behind outside equity, for all types
except corporate-backed firms. Outside debt dwarfs trade credit for these firm types,
again, with the exception of corporate equity backed firms.
4 Firm Quality and Capital Structure Decisions
4.1 Credit worthiness, technology and the financing pyramid
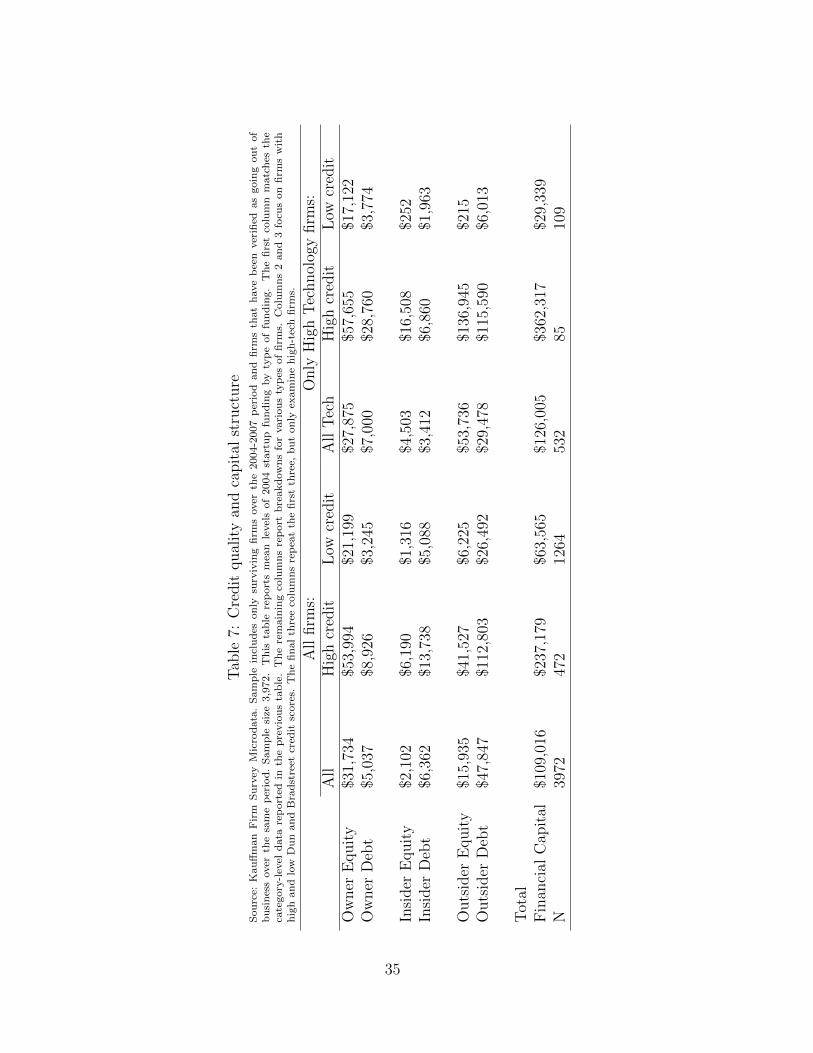
Table 7 takes the detail of the preceding tables and boils it down to six categories:
owner debt, owner equity, inside debt, inside equity, outside debt, and outside equity.
These classifications are as described in the left-most column of Table 4. Reducing the
amount of detail not only makes the firms’ capital structure choice more apparent, it
also facilitates more comparisons across different types of firms.
The rows of Table 7 are arranged from highest to lowest in terms of the overall
weighted average level of 2004 funding. If we interpret the magnitudes as an indication
of relative importance, then if not a pecking order, we at least see we see a clear “financing
pyramid” emerge: first outside debt, then owner equity, then debt from insiders. Fourth
in the pyramid is outside equity, followed by owner debt; the least used source is inside
equity.
An alternative way to characterize the financing pyramid of nascent firms is to com-
bine owner debt and equity into a single category, internal funding. Looking at capital
structure this way, the average firm is roughly equal parts internal funding and outside
debt. These two sources of funding are each roughly four times larger than the next
largest source of financing. Regardless of how the financial pieces are assembled, outside
debt plays a paramount role in funding newly founded firms.
14
One reason for this may simply be that outside debt is more plentiful than other
sources of funding. To explore this possibility, we obtained commercial credit scores
for each firm to identify high credit worthiness and low credit worthiness firms. Table 7
shows that while high credit worthiness firms have access to much more financial capital,
they access capital in roughly the same proportions as low credit worthiness firms. Thus,
a firm’s credit score induces a first-order shift in the level of financing it obtains, but
only a second-order shift in capital structure choice it makes.
Outside equity plays a substantially more important role in the capital structure of
high tech firms. Across all high tech firms, outside equity is the third largest funding
source behind outside debt and owner equity. Among high tech firms with high credit
scores, outside equity is the largest form of financing. It is only the low credit score firms
in the high tech sector that display a capital structure that resembles the average firm
in the data—but for those firms, owner equity is a more important source of financing
than outside debt.
4.2 Separating credit quality from owner wealth
Of course, one reason why the capital structures of high and low credit quality firms may
be so similar is that the credit scores of the business are highly correlated with those
of the founders. All else equal, wealthier individuals may have higher credit scores, and
simultaneously find it easier to post their own equity to start the business, leaving the
overall capital structure unchanged as underlying credit quality changes.
One way to account for this possibility is to regress the firm’s credit score on variables
that proxy for owner characteristics that would influence credit ratings. We consider
two models. First, we run the following regression:
scoreij = α + βj + εi (1)
15
where scoreij is the credit score of firm i in industry j, βj are industry fixed effects. Thus,
the first estimation simply includes a set of 60 industry dummies. If some industries
faced systematically lower entry costs, this would control for the fact that individuals
with systematically lower wealth levels could enter this industry to start their business.
For the second specification, we run the following regression:
scoreij = α + βj + γ1Fij + γ2Kij + εi (2)
where scoreij is the credit score of firm i in industry j, βj are industry fixed effects, and
F is a vector of owner characteristics, and K is a vector of firm characteristics, both
of which likely vary with demand for credit. For this specification, we include a full
set of industry dummies, a set of education dummies corresponding to the breakdown
presented in Table 3, and we also include factors such as race, ethnicity, industry ex-
perience, intellectual property, legal structure of the enterprise, whether the business is
home-based, and whether the business sells a product or provides a service. While these
coefficient estimates are interesting in their own right, a full discussion is beyond the
scope of this paper. Indeed, in Robb, Fairlie and Robinson (2009) we explore the issue
of race and access to credit in greater detail.
The idea behind both specifications is that by purging the credit score of variation
that is linked to factors affecting personal credit scores, the remaining variation in credit
score would reflect supply-side credit restrictions. Firms with high unexplained credit
scores should have easier access to capital, while firms with low unexplained credit scores
should have relatively more difficult access to capital. Moreover, the differences in their
access to capital could reflect suppliers willingness to lend, rather than differences in
capital needs.
Recovering the regression errors from these two models gives us a mechanism for
classifying firms as credit constrained or unconstrained. Of course, a firm with a low
16

unconditional credit score is constrained, but this low score may arise endogenously
because the firm has little need for external capital, low growth prospects, etc. By
relying on the conditional credit score as opposed to the raw credit score, we circumvent
these problems.
Table 8 reports financing choices for firms in the lowest and highest quintiles of the
unexplained credit score distribution. Firms in the lowest quintile face the most severe
unexplained restrictions to credit access, since their credit scores are much lower than
would be predicted based on their demand characteristics. In contrast, the top quintile
have the easiest access to credit, since they have high unexplained credit scores, given
their access to capital.
In general, the results of Table 8 mimic the results from the previous table, in that
they show a first order affect on the amount of capital raised, but only a second or-
der effect on capital structure choice. Credit constrained firms have capital structures
that look very similar to those of unconstrained firms. The primary difference is that
unconstrained firms have much higher levels of capital investment.
5 Explaining Funding Decisions
Having described initial capital structure choices in detail, we now turn to the task of
decomposing capital structure choice in a multivariate framework. We do this in Table
9, where we regress capital structure ratios on owner and firm characteristics. In general,
Table 9 reports OLS regressions of the following form:
Financing Category
Total Capital= α + βj + γ1Fij + γ2Kij + εi (3)
where βj are industry fixed effects, F is a vector of owner characteristics, and K is
a vector of firm characteristics. The dependent variable in each column is a financial
17

ratio—either outside debt, outside equity, outside loans, or inside finance—each scaled
by the firm’s total capital. (The unmeasured category is the ratio of owner financing
to total capital.) Outside loans are a subset of outside debt that include only personal
bank loans and business loans. The firm characteristics include not only the survey
characteristics described in Tables 1-3, but also the firm’s credit score, a measure of
quality that might well be unobserveable to the econometrician in other circumstances,
but would be readily observable to credit market participants.
Are gender and race correlated with initial capital structure choices? Table 9 suggests
that this is definitely the case. First, gender: women receive significantly less outside
capital than other groups. The results for women indicate that the average female-
owned business holds about 5% less outside debt than the same male-owned business.
Although these results may reflect the fact that women face more restricted access to
capital in the credit market, the data do not allow us to rule out the possibility that,
notwithstanding the industry fixed effects, female-owned businesses simply may demand
less outside capital, perhaps because they are more likely to be second-income businesses.
Next, the question of race. Table 9 shows that black-owned businesses hold much
less outside debt in their initial capital structure than other businesses. The magnitudes
are similar to those found for gender: the ratio of outside debt to total capital is about
13% lower for black-owned businesses than for otherwise equal white-owned businesses.
Whether this attributable to supply-side or demand-side considerations, it is important
to note that these regressions hold constant the industry of the business, the firm’s
credit quality, the owner’s education, and their prior industry and startup experience.
Thus, unobserved heterogeneity in underlying business quality seems unlikely to be a
first-order explanation for the difference.
We also observe other racial differences in capital structure choice. Hispanics and
Asians, but not Blacks, rely heavily on inside finance.4 While Hispanic or Asian ethnicity
4This is measured as the sum of inside equity and debt.
18

explains little variation in access to external capital, these groups average about 25%
more inside capital in their total capital structure. Given that the average firm in Table
4 has an inside-to-total capital ratio of around 12%, this effect is enormous in economic
magnitude, representing a 75% increase in the average amount.
Across the board, increasing hours worked in the business is associated with greater
outside and inside capital, and consequently, lower owner financing. Similarly, owner
age has an increasing but concave relationship with access to external capital, for both
debt and equity, while it has the opposite relationship for inside financing.
Prior experience plays an interesting role in determining initial capital structure.
Owners with prior startup experience tend to rely on external equity more than others.
In contrast, Table 9 indicates that owners with more industry experience rely signifi-
cantly more on their own financing, since the association between industry experience
and capital type is negative across all types reported in the table.
The regressions also include, but do not report, owner education. Different categories
of education have similar experiences accessing external debt equity, but there is a
pronounced effect associated with inside financing. Namely, those who do not finish
high school are significantly more likely to rely on inside financing than other groups.
Since the regressions include industry fixed effects, it is not the case that this is driven
by sorting of low education respondents into industries with low capital requirements.
Rather, this is probably an indication that lower quality businesses are more likely to
rely on inside financing instead of accessing external capital markets.
The business characteristics reported in the bottom of the table demonstrate that
firms with lower asymmetric information problems enjoy more ready access to external
capital sources, and in particular, external credit funding. Home-based businesses rely
more heavily on owner financing, while firms with multiple owners have larger fractions
of outside-to-total capital. Comparing the point estimates in Table 9 to the averages
in Table 4 suggests that multiple-owner firms receive about a ten percent increase in
19
the baseline amount of outside debt, and about a 25% increase in the baseline level of
external equity (from around 8% to around 10%). Firms that have intellectual property
are not more likely to access outside debt, but are more likely to access external equity,
than those that do not.
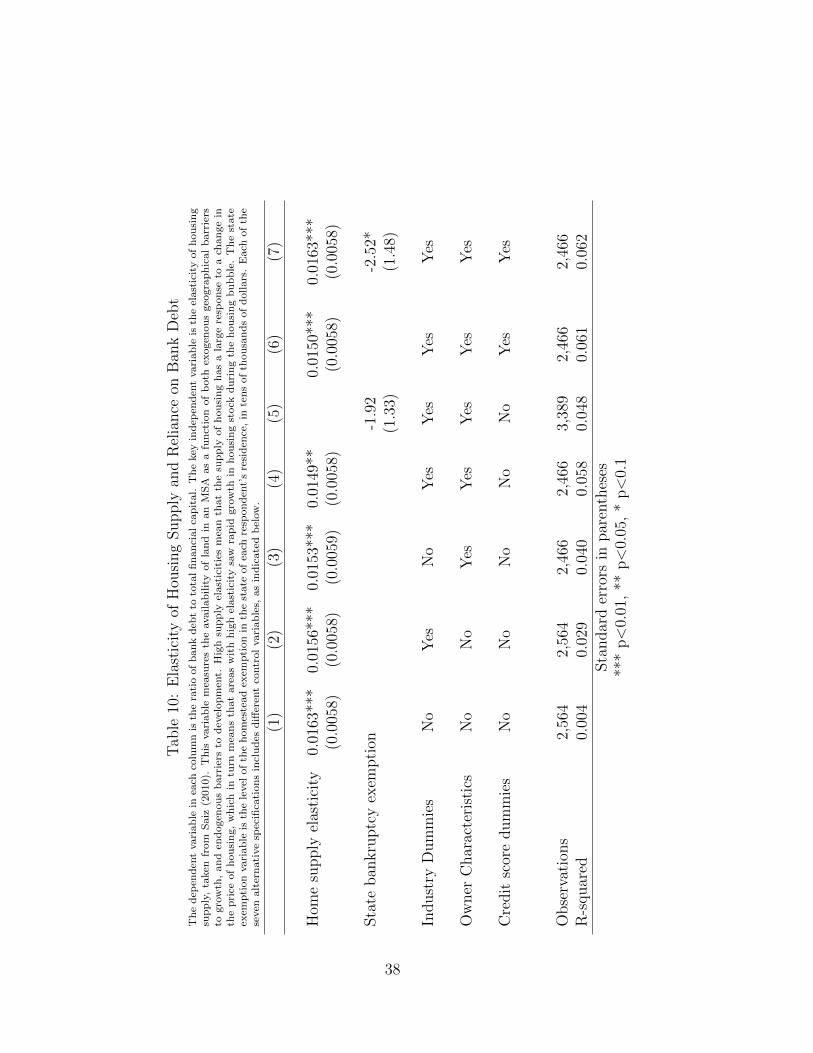
6 Housing Markets, Bankruptcy Exemptions, and
Access to Debt
In this section we explore two potential strategies for decoupling supply and demand for
capital. The first is to examine housing price appreciation as a potentially exogenous
source of variation in collateral that drives the availability of credit. Since housing prices
are likely to be endogenous to the expected future profitability of the business ventures,
we instead link housing supply elasticity to bank credit. This variable is obtained from
Saiz (2010) and is based on exogenous geographical factors that affect the amount of
developable land, as well as factors like zoning restrictions. Because the housing price
elasticity is largely predetermined prior to 2004, it provides an exogenous source of
variation in collateral values.
The data provided by Saiz (2010) contain housing supply elasticity estimates for
269 metropolitan statistical areas (MSAs) in the United States. While this includes
all the major metropolitan areas in the United States, it also includes a great many
smaller regions. For example, the 1st percentile of the population distribution (using
the population in 2000) is less than 80,000 residents. The size of the 25th percentile is
around 163,000 residents. Nevertheless, this variable does not measure the actual home
price appreciation (or home ownership status) of the respondents of the KFS; it contains
only a regional measure of land developability.
20

If housing supply were perfectly inelastic, then demand shocks would translate di-
rectly into price shocks, and home equity values would be highly sensitive to underlying
changes in housing demand. In such a world, home equity would provide poor collateral
for business loans, because the value of the collateral would be sensitive to factors that
were outside the borrower’s control. In contrast, a region with a perfectly elastic supply
of housing would experience no price change whatsoever as housing demand changed. In
such a world, home equity would be unaffected by fluctuations in housing demand. Thus,
in regions where housing supply is elastic, we should expect to see a greater reliance on
outside debt, since the underlying home equity is more pledgeable.5
Table 10 tests this prediction by regressing the fraction of bank capital on the housing
supply elasticity, controlling for a variety of owner and business characteristics. Across
the various specifications reported, increasing supply elasticity raises the fraction of
bank debt by about 2%. To translate this into economic magnitudes, moving from the
25th to 75th percentile, which is approximately moving from Reno, Nevada to Peoria,
Illinois, is associated with a 3% increase in bank debt. Since the average startup is about
40% bank financed, this effect seems economically large.
The second potential channel for decoupling supply and demand is to examine state-
level bankruptcy exemptions. All else equal, borrowers in states with higher bankruptcy
exemption levels should expect to receive less total outside capital in the form of bank
debt, since increased bankruptcy protection impairs the collateral value of the assets they
own.6 Since state-level bankruptcy laws are unlikely to be determined by local varia-
tion in entrepreneurial opportunity, including an exemption measure gives us another
opportunity to separate credit supply from credit demand.
5The KFS survey instrument explicitly instructs respondents to exclude from owner’s equity any cashthey put into the business from home equity loans or lines of credit. The survey instrument allocatesthese funding sources to personal bank debt.
6This argument is consistent with Berkowitz and White (2004), who show that higher personalbankruptcy exemption levels are associated with more credit denials among small businesses.
21
Column (5) of Table 10 includes a bankruptcy exemption variable, which is the
bankruptcy homestead exemption in the respondent’s state of residence, in tens of thou-
sands of dollars. Taken by itself, the variable has the expected sign, but is statistically
insignificant. But Column (5) does not include credit score dummies. When we include
credit score information, as in Column (7), we see that the loading on the bankruptcy
exemption is both negative and statistically significant. This indicates that borrowers
in states with higher bankruptcy exemptions indeed obtained a lower ratio of outside
bank debt to total capital (see also Cerquiero and Fabiana Penas, 2010).
7 Does Financial Access Affect Survival?
One possible explanation for our findings that certainly merits consideration is that the
fact that startups rely extensively on external credit markets to fund their early life is
being driven by peculiarities in the credit market in 2004.
We address this possibility in two ways. First, in Table 11 we examine the importance
of debt for later-stage fundraising decisions. Is the reliance on debt a feature of the
starting conditions of the business only? Do businesses wean themselves off of outside
debt as they grow? Table 11 suggests not. It suggests that they continue to rely on debt
in the years after the firm’s founding.
Table 11 shows that, for the average firm, the fraction of new capital coming into
the firm that is made up of outside debt is actually increasing as the firm matures. If
anything, the fraction of owner equity falls as the firm ages. This supports life-cycle
theories such as Berger and Udell (1998) in favor of the idea that startups used personal
loans to kick start the business and then moved away from debt as the firm matured.
The columns of Table 11 consider different types of firms to see if the increased
reliance on outside debt is particularly important for certain kinds of firms. Column (2)
22

reports firms that have some form of outside equity at startup. These firms typically
receive a large equity injection in the first year after founding, but in the following years,
they rely much more heavily on outside debt. This is consistent with outside equity being
staged to coincide with milestones, but at the same time, the reliance on outside debt
in 2006 and 2007 suggest that these firms too continue to rely on outside debt.
The final two columns of Table 11 look at opposite ends of the spectrum. Column
(3) only considers the set of firms that are incorporated, have employees, and have assets
such as inventories in the year of their founding. These firms typically have about 40%
of their initial capital coming from outside debt, and this ratio grows over time. By the
time of the third year (2007), the total capital coming into the firm is over 55% outside
debt. And while the absolute levels of financing are considerably smaller for home-based
firms (column 4), the story is very much the same: these firms rely on outside debt to
an increasing degree as they age.
If our findings simply reflect the fact that credit was readily available in 2004, then
there is no reason to believe that access to external credit should affect firm success.
To test this, we report Probit analysis of three key measures of growth from 2004-
2007. First, we create a dummy for whether a firm has above median revenues in 2007.
Then we repeat this calculation for profits and for employees. Our key explanatory
variable is the ratio of outside debt to total capital. The hypothesis that we are testing
is that firms with greater levels of external capital had better growth prospects.
Table 12 presents the findings. It includes the same basic set of owner and firm
characteristics, plus the ratio of outside debt to total capital and the level of 2004 sales.
The outside debt ratio has a positive and highly significant effect on revenue growth and
employee growth, but a statistically insignificant positive effect on profit growth.
Before it is possible to attach a causal interpretation to these findings, it is important
to control for unobserved characteristics that might affect access to debt and success.
23

In that regard, including the credit score and other firm characteristics are essential
for interpreting our findings. Including the credit score allows us to conclude that
controlling for firm creditworthiness, firms that accessed more external debt were nearly
ten percent more likely to be in the top revenue group, and nearly six percent more likely
to have hired employees. Note too that this also controls for the initial revenues the firm
experienced in 2004, therefore the effect is not attributable to initial size. Table 12
indicates that, indeed, initial capital structure decisions are important for firm success.
The owner and firm characteristics, which are included as controls in Table 12, are
interesting in their own right and raise many questions for future research. First, they
show that female-owned businesses are significantly less likely to grow than male-owned
businesses. Black-owned businesses are significantly less likely to have grown in terms
of profits or sales, but they are more likely to have added employees than white-owned
businesses. Asian-owned businesses are also more likely to have added employees, al-
though Asian ownership is unrelated to revenue or profit growth. And finally, the vector
of firm characteristics that might describe a firm, a priori, as a lifestyle business or not
indeed predicts whether a firm has grown.
8 Conclusions
This paper uses a novel data set to explore the capital structure decisions that firms
make in their initial year of operation. In the vast majority of cases, this is when the
firms in question are still being incubated in their founders’ homes or garages, before
outside employees have joined the firm in any significant number, and certainly well
before the firms in question would be attractive to the types of funding sources that are
the focus of most discussions of early stage financing.
In spite of the fact that these firms are at their very beginning of life, they rely to
a surprising degree on bank debt. Partly this is a function of the availability of bank
24

debt: in regions that experienced an increase in the supply of home loans, startups relied
to a larger extent on bank debt. Higher quality firms operate at a larger scale in part
because they can access larger amounts of bank financing.
The notion that startups commonly rely on the beneficence of a loose coalition of
family and friends seems misleading given our findings. While the data suggest that
informal investors are important for the handful of firms that rely on outside equity
at their startup, the data also indicate that most firms turn elsewhere for their initial
capital. Indeed, roughly 80-90% of most firms’ startup capital is made up in equal parts
of owner equity and bank debt.
To be sure, our findings underscore the importance of liquid credit markets for the
formation and success of young firms. Because startups rely so extensively on outside
debt as a source of startup capital, they are especially sensitive to changes in bank
lending conditions, perhaps more sensitive than would be suggested based on accounts
of entrepreneurial finance that focus on the importance of informal capital.
25

References
[1] Avery, Robert B. and Raphael W. Bostic and Katherine A. Samolyk, 1998. “The
role of personal wealth in small business finance,” Journal of Banking and Finance,
vol. 22, pp. 1019 - 1061.
[2] Berkowitz, Jeremy and Michelle J. White, 2004. “Bankruptcy and small firms’
access to credit,” RAND Journal of Economics, vol. 35, no. 1, Spring. pp. 69-84.
[3] Cerqueiros, Geraldo and Maria Fabiana Penas, 2010. “Debtor protection and start-
up financing sources: evidence from the US” Working Paper, Tilburg University.
[4] Cosh, Andrew, Douglas Cumming and Alan Hughes, 2008. “Outside En-
trepreneurial Capital,” forthcoming, Economic Journal.
[5] Fairlie, Robert and Harry Krashinsky, 2007. ”Liquidity Constraints, Household
Wealth, and Entrepreneurship Revisited,” working paper, University of California,
Santa Cruz.
[6] Fairlie, Robert and Alicia Robb, 2008. ”Why are Black-Owned Businesses Less
Successful than White-Owned Businesses: The Role of Families, Inheritances, and
Business Human Capital,” Journal of Labor Economics, 25(2): 289-323.
[7] Faulkender, Michael and Mitchell Peterson, 2006. “Does the source of capital affect
capital structure?” Review of Financial Studies, vol. 19, pp. 45-79.
[8] Gompers, Paul and Josh Lerner, 2001. “The venture capital revolution.” Journal
of Economic Perspectives.
[9] Helwege, Jean and N. Liang, 1996. “Is there a pecking order? Evidence from a
panel of IPO firms.” Journal of Financial Economics, vol 40, no. 429-458.
[10] Hurst, Erik and Annamaria Lusardi, 2004. Liquidity Constraints, Household
Wealth, and Entrepreneurship, Journal of Political Economy, vol. 112.
26
[11] Kaplan, Steven N., Berk Sensoy, and Per J. Stromberg, 2009. “Should investors
bet on the jockey or the horse? Evidence from the evolution of firms from early
business plans to public companies.” Forthcoming, Journal of Finance.
[12] Lemman, Michael L., Michael R. Roberts and Jaime F. Zender, 2008. “Back to the
beginning: persistence and the cross-section of corporate capital structure,” Journal
of Finance, vol 63, no 4, pp. 1575-1603.
[13] Mann, Ronald J., 1998. “Comment on Avery, Bostic and Samolyk” Journal of
Banking and Finance, vol. 22, pp. 1062-1066.
[14] Moon, John, 2009. “Small business finance and personal assets,”Community Invest-
ments, vol. 21, issue 3, Winter 2009/2010.
[15] Myers, Steward and Nicholas Majluf, 1984. Financing and investment decisions
when firms have information markets do not have, Journal of Financial Economics,
vol. 13, no. 2, pp. 187-221.
[16] Peterson, Mitchell and Raghuram Rajan, 2000. “Does distance still matter? The
information revolution in small business lending,” NBER Working Paper #7685.
[17] Peterson, Mitchell and Raghuram Rajan, 1994. “The benefits of lending relation-
ships: evidence from small business lending,” Journal of Finance, vol. 49, no. 1, pp
3-37.
[18] Peterson, Mitchell and Raghuram Rajan, 1997. “Trade credit: theories and evi-
dence,” Review of Financial Studies, vol. 10, no. 3, pp 661-691.
[19] Puri, Manju and David T. Robinson, 2008. “Optimism and Economic Choice,”
Journal of Financial Economics, vol. 86, no. 1, 71-99.
[20] Rajan, Raghuram and Luigi Zingales, 1995. “What do we know about capital struc-
ture? Some evidence from international data,” Journal of Finance, vol. 50, no. 5,
pp. 1421-1460.
27
Robb, A., Ballou, J., Barton, T., DesRoches, D., Potter, F., Reedy, E.J., & Zhao,
Z. (2009). An Overview of the Kauffman Firm Survey: Results from the 2004-2007
Data. Kauffman Foundation.
[21] Robb, Alicia M., Robert Fairlie and David T. Robinson, 2009. “Capital Injections
among New Black and White Business Ventures: Evidence from the Kauffman Firm
Survey,” Working paper.
[22] Saiz, Albert (forthcoming) ”The Geographic Determinants of Housing Supply”
Quarterly Journal of Economics.
[23] Shyam Sunder and Stewart Myers, 1999. ”Testing static tradeoff against pecking
order models of capital structure, Journal of Financial Economics, vol 51.
[24] Wong, Andrew, 2003. “Angel finance: the ‘other’ venture capital.” PhD disserta-
tion, University of Chicago.
28
Table 1: Business CharacteristicsSample includes 3,972 firms that either survived over the 2004-2007 period or were verified as goingout of business over the same period. Corporation includes C- or S-corporations. Limited liabilitycorporation includes LLC or LLP designations. Home based business means that the primarybusiness location was the same as the owner’s home. Credit score is a quintile score of the creditquality of the business.
WeightedPercentage
Business Legal StatusSole Proprietorship 0.360
Partnership 0.057Corporation 0.277
Limited Liability Corporation 0.306
Business LocationHome Based 0.500
Leased Space 0.396Other 0.104
Business Product/Service OfferingsService Offered 0.858
Product Offered 0.516Business Offers Both Service(s)/Product(s) 0.378
Intellectual PropertyPatents 0.022
Copyrights 0.086Trademarks 0.137
Employment SizeZero 59.2
1 14.02 9.13 4.6
4-5 5.86-10 3.911+ 3.6
Credit ScoreHigh Credit Score 0.115
Medium Credit Score 0.553Low Credit Score 0.332
29

Table 2: Cash flow characteristics of startups in the KFSSample includes 3,972 firms that either survived over the 2004-2007 period or were verified as going out of business overthe same period. Panel A refers to the distribution of revenues and expenses, while Panel B refers to the distribution ofprofits and losses. In Panel B, 44.5% of the sample reported earning profits, of whom 19.4% indicated approximately zeroprofits; likewise, 55.5% reported losses, of whom around 3.4% reported zero loss.
Panel A: Percent of Businesses by Revenues and ExpensesWeighted Weighted
Revenues Percentage Expenses PercentageZero 35.3% Zero 6.7%$1,000 or less 5.1% $1,000 or less 8.5%$1,001- $5,000 7.7% $1,001- $5,000 16.0%$5,001- $10,000 6.1% $5,001- $10,000 11.3%$10,001- $25,000 10.5% $10,001- $25,000 16.2%$25,001- $100,000 18.6% $25,001- $100,000 25.3%$100,001 or more 16.8% $100,001 or more 15.8%
Panel B: Percent of Businesses by Amount of Profits or LossesWeighted Weighted
Profit (44.5 %) Percentage Loss (55.5%) PercentageZero 19.4% Zero 3.4%$1,000 or less 10.2% $1,000 or less 13.2%$1,001- $5,000 16.4% $1,001- $5,000 27.3%$5,001- $10,000 12.5% $5,001- $10,000 17.0%$10,001- $25,000 17.4% $10,001- $25,000 17.9%$25,001- $100,000 20.0% $25,001- $100,000 16.9%$100,001 or more 4.1% $100,001 or more 4.2%
30

Table 3: Business owner demographicsSample includes 3,972 firms that either survived over the 2004-2007 period or were verified asgoing out of business over the same period.
Weighted WeightedCharacteristics Percentage Characteristics: PercentageMale 69.2Female 30.8 Industry Exp. (Yrs.)
Zero 9.8White 79.3 1-2 13.9Black 8.6 3-5 15.6Asian 4.2 6-9 9.9Others 2.3 10-14 13.6
15-19 11.3Non-Hispanic 94.5 20-24 9.3Hispanic 5.5 25-29 7.5
30+ 9.3Owner Age24 or younger 1.325-34 16.5 Previous Start-ups35-44 33.6 0 57.545-54 29.0 1 21.555 or older 19.6 2 10.2
3 5.0Owner Education 4 or more 5.8HS Grad or Less 13.9Tech/Trade/Voc. Deg. 6.4Some Coll., no deg. 21.8 Hours WorkedAssociate’s 8.6 Less than 20 18.5Bachelor’s 25.3 20-35 19.5Some Grad, No Deg. 5.9 36-45 14.3Master’s Degree 13.4 46-55 15.2Professional/Doctorate 4.7 56 or more 32.5
31

Table 4: Sources of Financing for 2004 StartupsSample includes 3,972 firms that either survived over the 2004-2007 period or were verified as going out of business overthe same period. The mean, in dollars, for all firms is reported in the first column. The second column reports the mean,in dollars, for only firms with positive amounts of that source of funding. The sample size for that source of funding isreported in the third column.
Category Funding Source Grand Mean Mean if > 0 Count
Owner Equity 31,734 40,536 3,093Owner Debt 5,037 15,765 1,241
Personal CC balance, resp. 2,811 9,375 1,158Personal loan, other owners 1,989 124,124 67
Personal CC balance, others 238 7,415 132
Insider Equity 2,102 44,956 177Parent Equity 1,456 42,509 126Spouse Equity 646 40,436 62
Insider Debt 6,362 47,873 480Personal Loan from family 2,749 29,232 327Business loan from family 1,760 57,207 115
Family loan to other owners 284 34,509 29Personal loan to other owners 550 28,988 73
Other personal loans 924 81,452 45Business loan by owner 15 9,411 5Business loan by emp. 79 22,198 9
Outsider Equity 15,935 354,540 205Angel investors 6,350 244,707 110
Venture Capital 4,804 1,162,898 26Business equity 3,645 321,351 56
Govt. equity 798 146,624 27Other equity 337 187,046 8
Outsider Debt 47,847 128,706 1,439Business bank loan 17,075 261,358 243Personal bank loan 15,859 92,433 641Credit line balance 5,057 95,058 210
Non-bank bus. Loan 3,627 214,920 72Personal bank loan by other owners 1,859 80,650 92
Govt. bus. Loan 1,331 154,743 34Owner bus. CC balance 1,009 7,107 543
Bus. CC balance 812 6,976 452Other Bus. CC balance 135 7,852 62
Other bus. Loan 231 78,281 19Other individual loan 226 43,202 22
Other debt 626 119,493 22
Total Financial Capital 109,016 121,981 3,972Trade credit 21,793 93,536 83832

Table 5: Sources of Financing for 2004 Startups by Firm Type
This sample includes the 3,972 firms that either survived over the 2004-2007 period or were verified as going out of business over thesame period. Non-employer means the firm had no employees apart from the owner. Home-based means that the firm did not have aplace of business outside the owner’s home.
Non- Home- Pre- Pre- Survived ClosedFunding Source Employer Based Revenue Profits thru 2006 by 2006
Owner Equity $17,269 $20,035 $31,201 $35,433 $31,784 $31,609
Owner Debt $2,318 $2,624 $3,720 $5,445 $4,896 $5,392Personal Credit Card -Owner $1,896 $2,093 $1,937 $3,499 $2,634 $3,256
Personal Credit Card-Other Owners $159 $218 $133 $305 $217 $291
Insider Equity $698 $1,024 $2,271 $2,553 $1,705 $3,101Spouse Equity $270 $215 $612 $638 $468 $1,094Parent Equity $428 $809 $1,659 $1,915 $1,237 $2,007
Insider Debt $2,381 $3,074 $6,456 $7,852 $5,856 $7,635Personal Family Loan $1,051 $1,683 $2,451 $3,342 $2,437 $3,535
Business Loan from family $350 $580 $2,114 $2,335 $1,481 $2,464Other Personal Loan $475 $302 $1,233 $1,177 $1,191 $252
Outsider Equity $2,774 $4,731 $16,268 $21,530 $18,753 $8,841Other Informal Investors $785 $2,489 $7,006 $9,704 $7,992 $2,218
Other Business Equity $1,529 $1,568 $4,539 $4,727 $3,840 $3,155Government Equity $10 $226 $550 $945 $1,083 $81
Venture Capital Equity $441 $443 $4,164 $5,618 $5,373 $3,373
Outsider Debt $19,353 $26,960 $44,839 $54,536 $50,087 $42,208Personal Bank Loan $11,453 $12,898 $12,962 $17,738 $17,416 $11,941Bank Business Loan $5,231 $9,180 $18,474 $21,160 $18,653 $13,103
Credit Line $341 $656 $2,986 $4,823 $5,061 $5,047
Total Financial Capital $44,793 $58,448 $104,755 $127,349 $113,080 $98,787Trade Credit $6,883 $5,537 $4,825 $14,640 $22,684 $16,642
Observations 2,425 2,168 1,615 2,144 3,390 773
33
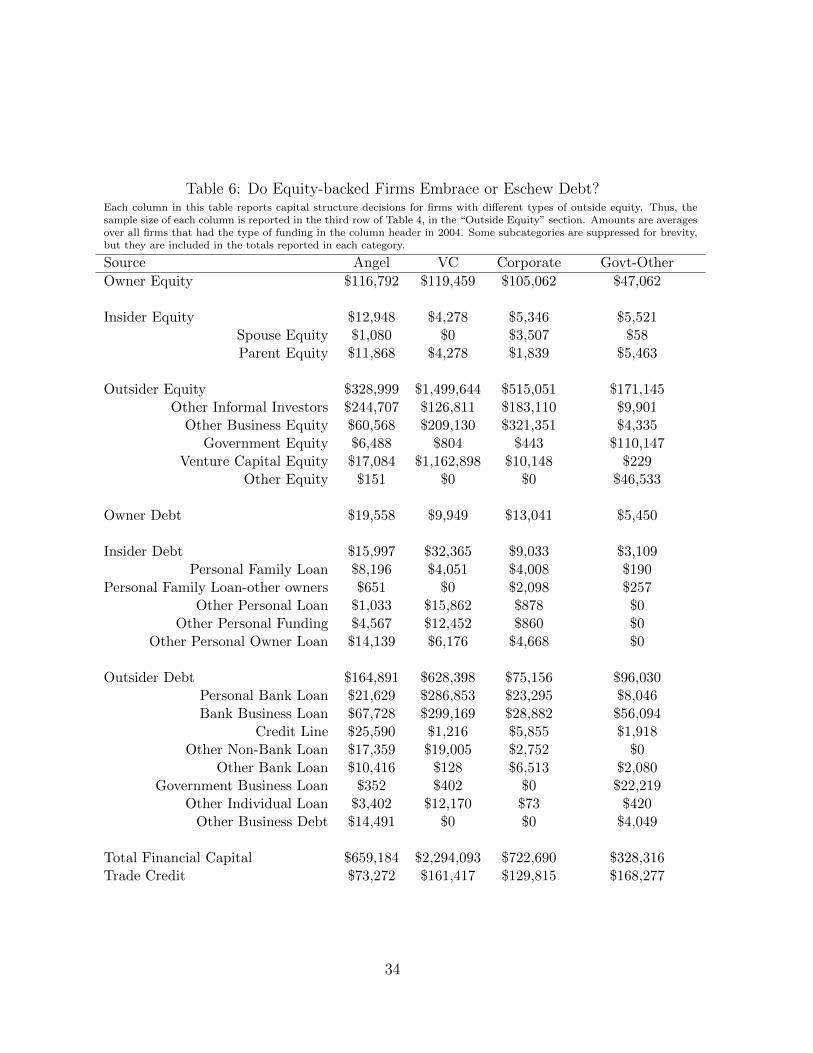
Table 6: Do Equity-backed Firms Embrace or Eschew Debt?Each column in this table reports capital structure decisions for firms with different types of outside equity. Thus, thesample size of each column is reported in the third row of Table 4, in the “Outside Equity” section. Amounts are averagesover all firms that had the type of funding in the column header in 2004. Some subcategories are suppressed for brevity,but they are included in the totals reported in each category.
Source Angel VC Corporate Govt-Other
Owner Equity $116,792 $119,459 $105,062 $47,062
Insider Equity $12,948 $4,278 $5,346 $5,521Spouse Equity $1,080 $0 $3,507 $58Parent Equity $11,868 $4,278 $1,839 $5,463
Outsider Equity $328,999 $1,499,644 $515,051 $171,145Other Informal Investors $244,707 $126,811 $183,110 $9,901
Other Business Equity $60,568 $209,130 $321,351 $4,335Government Equity $6,488 $804 $443 $110,147
Venture Capital Equity $17,084 $1,162,898 $10,148 $229Other Equity $151 $0 $0 $46,533
Owner Debt $19,558 $9,949 $13,041 $5,450
Insider Debt $15,997 $32,365 $9,033 $3,109Personal Family Loan $8,196 $4,051 $4,008 $190
Personal Family Loan-other owners $651 $0 $2,098 $257Other Personal Loan $1,033 $15,862 $878 $0
Other Personal Funding $4,567 $12,452 $860 $0Other Personal Owner Loan $14,139 $6,176 $4,668 $0
Outsider Debt $164,891 $628,398 $75,156 $96,030Personal Bank Loan $21,629 $286,853 $23,295 $8,046Bank Business Loan $67,728 $299,169 $28,882 $56,094
Credit Line $25,590 $1,216 $5,855 $1,918Other Non-Bank Loan $17,359 $19,005 $2,752 $0
Other Bank Loan $10,416 $128 $6,513 $2,080Government Business Loan $352 $402 $0 $22,219
Other Individual Loan $3,402 $12,170 $73 $420Other Business Debt $14,491 $0 $0 $4,049
Total Financial Capital $659,184 $2,294,093 $722,690 $328,316Trade Credit $73,272 $161,417 $129,815 $168,277
34
Tab
le7:
Cre
dit
qual
ity
and
capit
alst
ruct
ure
Sou
rce:
Kau
ffm
an
Fir
mS
urv
eyM
icro
data
.S
am
ple
incl
ud
eson
lysu
rviv
ing
firm
sover
the
2004-2
007
per
iod
an
dfi
rms
that
have
bee
nver
ified
as
goin
gou
tof
bu
sin
ess
over
the
sam
ep
erio
d.
Sam
ple
size
3,9
72.
Th
ista
ble
rep
ort
sm
ean
level
sof
2004
start
up
fun
din
gby
typ
eof
fun
din
g.
Th
efirs
tco
lum
nm
atc
hes
the
cate
gory
-lev
eld
ata
rep
ort
edin
the
pre
vio
us
tab
le.
Th
ere
main
ing
colu
mn
sre
port
bre
akd
ow
ns
for
vari
ou
sty
pes
of
firm
s.C
olu
mn
s2
an
d3
focu
son
firm
sw
ith
hig
han
dlo
wD
un
an
dB
rad
stre
etcr
edit
score
s.T
he
fin
al
thre
eco
lum
ns
rep
eat
the
firs
tth
ree,
bu
ton
lyex
am
ine
hig
h-t
ech
firm
s.
All
firm
s:O
nly
Hig
hT
echnol
ogy
firm
s:A
llH
igh
cred
itL
owcr
edit
All
Tec
hH
igh
cred
itL
owcr
edit
Ow
ner
Equit
y$3
1,73
4$5
3,99
4$2
1,19
9$2
7,87
5$5
7,65
5$1
7,12
2O
wner
Deb
t$5
,037
$8,9
26$3
,245
$7,0
00$2
8,76
0$3
,774
Insi
der
Equit
y$2
,102
$6,1
90$1
,316
$4,5
03$1
6,50
8$2
52In
sider
Deb
t$6
,362
$13,
738
$5,0
88$3
,412
$6,8
60$1
,963
Outs
ider
Equit
y$1
5,93
5$4
1,52
7$6
,225
$53,
736
$136
,945
$215
Outs
ider
Deb
t$4
7,84
7$1
12,8
03$2
6,49
2$2
9,47
8$1
15,5
90$6
,013
Tot
alF
inan
cial
Cap
ital
$109
,016
$237
,179
$63,
565
$126
,005
$362
,317
$29,
339
N39
7247
212
6453
285
109
35

Table 8: Capital structure differences between High Residual Credit and Low ResidualCredit firms
Panel A reports capital structure based on quintiles from the residuals of regression of credit scores on industry fixedeffects. A total of 60 industry dummies are included. Panel B reports capital structure averages according to quintilesfrom the residuals of regressions of the following form:
scoreij = α+ βj + γ1Fij + γ2Kij + εi (4)
where scoreij is the credit score of firm i in industry j, βj are industry fixed effects, and F is a vector of ownercharacteristics, and K is a vector of firm characteristics. For this specification, we include a full set of industry dummies,a set of education dummies corresponding to the breakdown presented in Table 3, and we also include factors such as race,ethnicity, industry experience, intellectual property, legal structure of the enterprise, whether the business is home-based,and whether the business sells a product or provides a service.
Panel A: Regression based on INDUSTRY CONTROLSOverall Bottom Quintile Top Quintile Difference
Mean Percent Mean Percent Mean Percent Mean PercentOwner Equity 27,365 35% 39,503 32% 18,672 35% 20,831 -4%Insider Equity 1,695 2% 3,012 2% 1,497 3% 1,515 0%Outsider Equity 6,979 9% 14,194 11% 4,117 8% 10,078 4%Owner Debt 3,506 4% 3,649 3% 3,351 6% 298 -3%Insider Debt 7,605 10% 13,023 10% 6,574 12% 6,449 -2%Outsider Debt 31,255 40% 51,621 41% 18,758 35% 32,863 6%Total Capital 78,406 100% 125,002 100% 52,969 100% 72,033 0%% Zero Capital 10% 9% 12% 3%
Panel B: Regression based on FULL MODELOverall Bottom Quintile Top Quintile Difference
Mean Percent Mean Percent Mean Percent Mean PercentOwner Equity 27,365 34.9% 33,970 32.5% 24,085 33.9% 9,885 -1%Insider Equity 1,695 2.2% 2,102 2.0% 1,660 2.3% 442 0%Outsider Equity 6,979 8.9% 8,392 8.0% 6,622 9.3% 1,770 -1%Owner Debt 3,506 4.5% 3,431 3.3% 3,848 5.4% (417) -2%Insider Debt 7,605 9.7% 11,738 11.2% 7,181 10.1% 4,558 1%Outsider Debt 31,255 39.9% 45,014 43.0% 27,648 38.9% 17,366 4%Total Capital 78,406 100.0% 104,648 100.0% 71,043 100.0% 33,604 0%Zero Capital 10% 9% 9% 0%
36
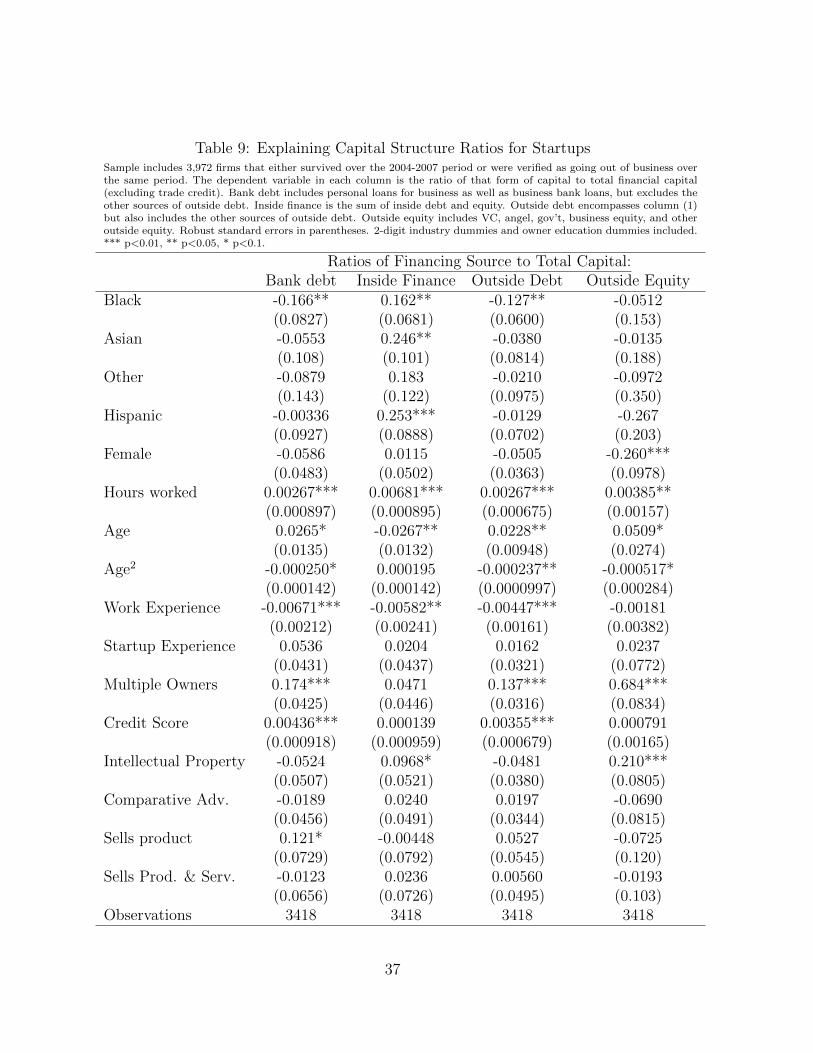
Table 9: Explaining Capital Structure Ratios for StartupsSample includes 3,972 firms that either survived over the 2004-2007 period or were verified as going out of business overthe same period. The dependent variable in each column is the ratio of that form of capital to total financial capital(excluding trade credit). Bank debt includes personal loans for business as well as business bank loans, but excludes theother sources of outside debt. Inside finance is the sum of inside debt and equity. Outside debt encompasses column (1)but also includes the other sources of outside debt. Outside equity includes VC, angel, gov’t, business equity, and otheroutside equity. Robust standard errors in parentheses. 2-digit industry dummies and owner education dummies included.*** p<0.01, ** p<0.05, * p<0.1.
Ratios of Financing Source to Total Capital:Bank debt Inside Finance Outside Debt Outside Equity
Black -0.166** 0.162** -0.127** -0.0512(0.0827) (0.0681) (0.0600) (0.153)
Asian -0.0553 0.246** -0.0380 -0.0135(0.108) (0.101) (0.0814) (0.188)
Other -0.0879 0.183 -0.0210 -0.0972(0.143) (0.122) (0.0975) (0.350)
Hispanic -0.00336 0.253*** -0.0129 -0.267(0.0927) (0.0888) (0.0702) (0.203)
Female -0.0586 0.0115 -0.0505 -0.260***(0.0483) (0.0502) (0.0363) (0.0978)
Hours worked 0.00267*** 0.00681*** 0.00267*** 0.00385**(0.000897) (0.000895) (0.000675) (0.00157)
Age 0.0265* -0.0267** 0.0228** 0.0509*(0.0135) (0.0132) (0.00948) (0.0274)
Age2 -0.000250* 0.000195 -0.000237** -0.000517*(0.000142) (0.000142) (0.0000997) (0.000284)
Work Experience -0.00671*** -0.00582** -0.00447*** -0.00181(0.00212) (0.00241) (0.00161) (0.00382)
Startup Experience 0.0536 0.0204 0.0162 0.0237(0.0431) (0.0437) (0.0321) (0.0772)
Multiple Owners 0.174*** 0.0471 0.137*** 0.684***(0.0425) (0.0446) (0.0316) (0.0834)
Credit Score 0.00436*** 0.000139 0.00355*** 0.000791(0.000918) (0.000959) (0.000679) (0.00165)
Intellectual Property -0.0524 0.0968* -0.0481 0.210***(0.0507) (0.0521) (0.0380) (0.0805)
Comparative Adv. -0.0189 0.0240 0.0197 -0.0690(0.0456) (0.0491) (0.0344) (0.0815)
Sells product 0.121* -0.00448 0.0527 -0.0725(0.0729) (0.0792) (0.0545) (0.120)
Sells Prod. & Serv. -0.0123 0.0236 0.00560 -0.0193(0.0656) (0.0726) (0.0495) (0.103)
Observations 3418 3418 3418 3418
37
Tab
le10
:E
last
icit
yof
Hou
sing
Supply
and
Rel
iance
onB
ank
Deb
tT
he
dep
end
ent
vari
ab
lein
each
colu
mn
isth
era
tio
of
ban
kd
ebt
toto
tal
fin
an
cial
cap
ital.
Th
ekey
ind
epen
den
tvari
ab
leis
the
elast
icit
yof
hou
sin
gsu
pp
ly,
taken
from
Saiz
(2010).
Th
isvari
ab
lem
easu
res
the
availab
ilit
yof
lan
din
an
MS
Aas
afu
nct
ion
of
both
exogen
ou
sgeo
gra
phic
al
barr
iers
togro
wth
,an
den
dogen
ou
sb
arr
iers
tod
evel
op
men
t.H
igh
sup
ply
elast
icit
ies
mea
nth
at
the
sup
ply
of
hou
sin
gh
as
ala
rge
resp
on
seto
ach
an
ge
inth
ep
rice
of
hou
sin
g,
wh
ich
intu
rnm
ean
sth
at
are
as
wit
hh
igh
elast
icit
ysa
wra
pid
gro
wth
inh
ou
sin
gst
ock
du
rin
gth
eh
ou
sin
gb
ub
ble
.T
he
state
exem
pti
on
vari
ab
leis
the
level
of
the
hom
este
ad
exem
pti
on
inth
est
ate
of
each
resp
on
den
t’s
resi
den
ce,
inte
ns
of
thou
san
ds
of
dollars
.E
ach
of
the
seven
alt
ern
ati
ve
spec
ifica
tion
sin
clu
des
diff
eren
tco
ntr
ol
vari
ab
les,
as
ind
icate
db
elow
.
(1)
(2)
(3)
(4)
(5)
(6)
(7)
Hom
esu
pply
elas
tici
ty0.
0163
***
0.01
56**
*0.
0153
***
0.01
49**
0.01
50**
*0.
0163
***
(0.0
058)
(0.0
058)
(0.0
059)
(0.0
058)
(0.0
058)
(0.0
058)
Sta
teban
kru
ptc
yex
empti
on-1
.92
-2.5
2*(1
.33)
(1.4
8)
Indust
ryD
um
mie
sN
oY
esN
oY
esY
esY
esY
es
Ow
ner
Char
acte
rist
ics
No
No
Yes
Yes
Yes
Yes
Yes
Cre
dit
scor
edum
mie
sN
oN
oN
oN
oN
oY
esY
es
Obse
rvat
ions
2,56
42,
564
2,46
62,
466
3,38
92,
466
2,46
6R
-squar
ed0.
004
0.02
90.
040
0.05
80.
048
0.06
10.
062
Sta
ndar
der
rors
inpar
enth
eses
***
p<
0.01
,**
p<
0.05
,*
p<
0.1
38
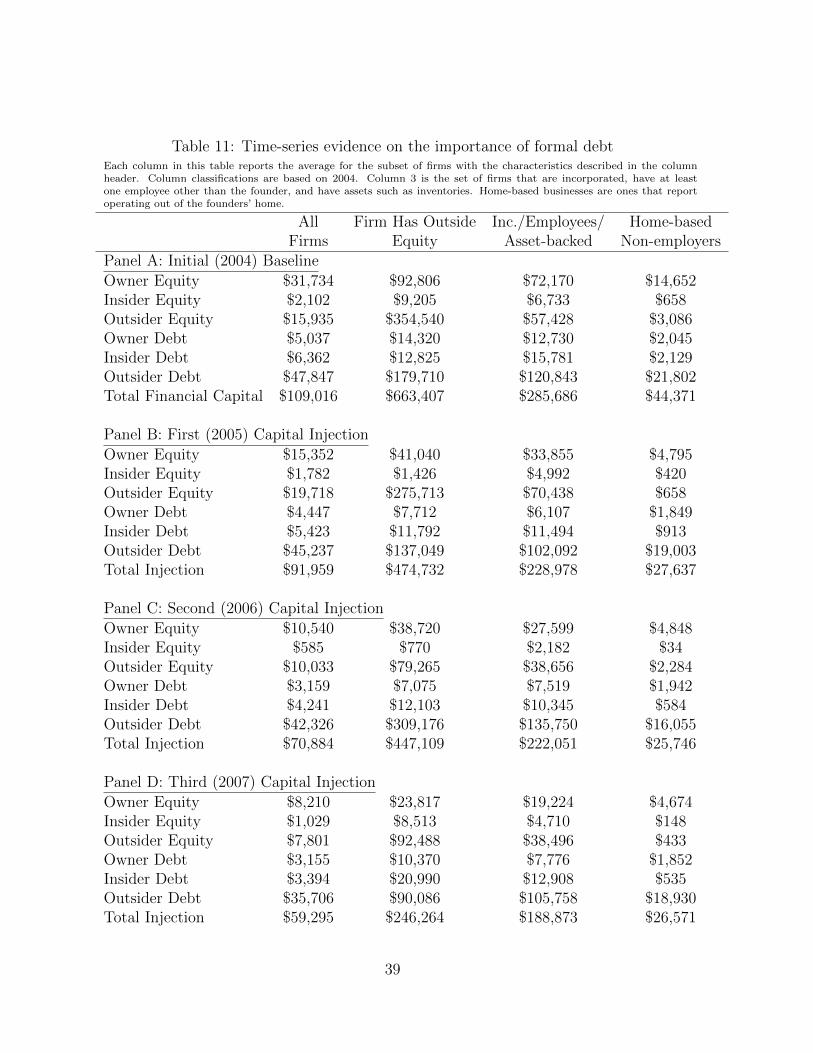
Table 11: Time-series evidence on the importance of formal debtEach column in this table reports the average for the subset of firms with the characteristics described in the columnheader. Column classifications are based on 2004. Column 3 is the set of firms that are incorporated, have at leastone employee other than the founder, and have assets such as inventories. Home-based businesses are ones that reportoperating out of the founders’ home.
All Firm Has Outside Inc./Employees/ Home-basedFirms Equity Asset-backed Non-employers
Panel A: Initial (2004) Baseline
Owner Equity $31,734 $92,806 $72,170 $14,652Insider Equity $2,102 $9,205 $6,733 $658Outsider Equity $15,935 $354,540 $57,428 $3,086Owner Debt $5,037 $14,320 $12,730 $2,045Insider Debt $6,362 $12,825 $15,781 $2,129Outsider Debt $47,847 $179,710 $120,843 $21,802Total Financial Capital $109,016 $663,407 $285,686 $44,371
Panel B: First (2005) Capital Injection
Owner Equity $15,352 $41,040 $33,855 $4,795Insider Equity $1,782 $1,426 $4,992 $420Outsider Equity $19,718 $275,713 $70,438 $658Owner Debt $4,447 $7,712 $6,107 $1,849Insider Debt $5,423 $11,792 $11,494 $913Outsider Debt $45,237 $137,049 $102,092 $19,003Total Injection $91,959 $474,732 $228,978 $27,637
Panel C: Second (2006) Capital Injection
Owner Equity $10,540 $38,720 $27,599 $4,848Insider Equity $585 $770 $2,182 $34Outsider Equity $10,033 $79,265 $38,656 $2,284Owner Debt $3,159 $7,075 $7,519 $1,942Insider Debt $4,241 $12,103 $10,345 $584Outsider Debt $42,326 $309,176 $135,750 $16,055Total Injection $70,884 $447,109 $222,051 $25,746
Panel D: Third (2007) Capital Injection
Owner Equity $8,210 $23,817 $19,224 $4,674Insider Equity $1,029 $8,513 $4,710 $148Outsider Equity $7,801 $92,488 $38,496 $433Owner Debt $3,155 $10,370 $7,776 $1,852Insider Debt $3,394 $20,990 $12,908 $535Outsider Debt $35,706 $90,086 $105,758 $18,930Total Injection $59,295 $246,264 $188,873 $26,571
39
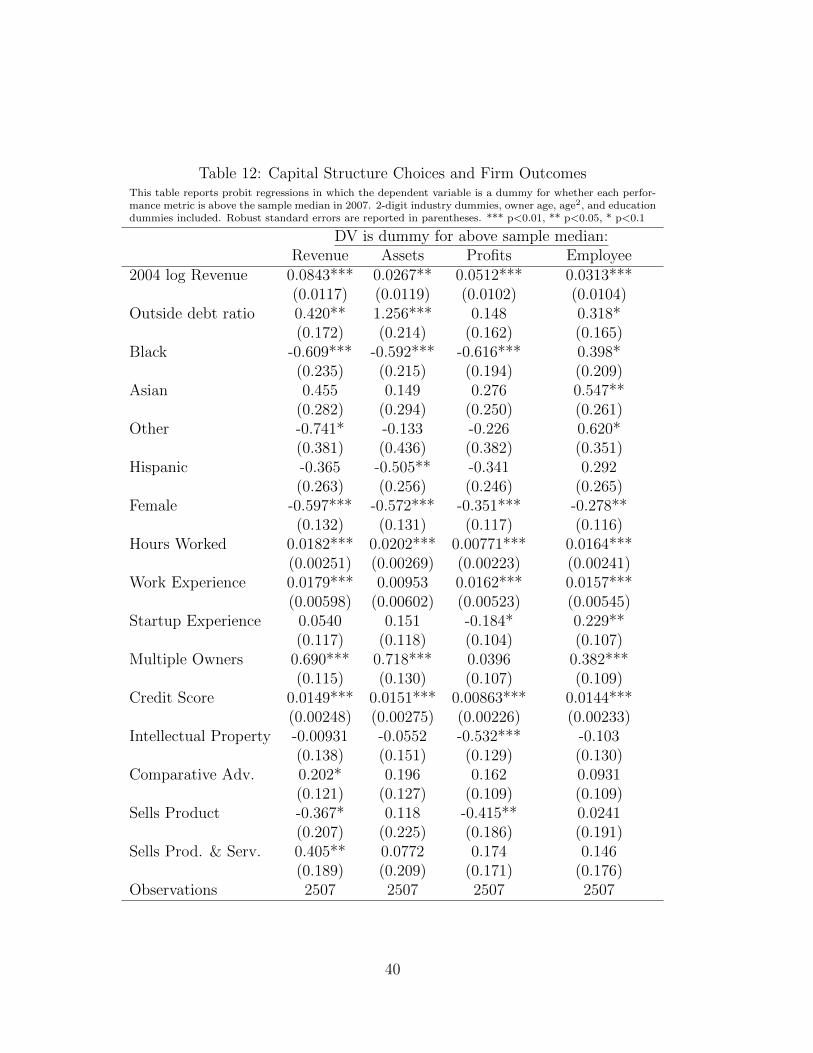
Table 12: Capital Structure Choices and Firm OutcomesThis table reports probit regressions in which the dependent variable is a dummy for whether each perfor-mance metric is above the sample median in 2007. 2-digit industry dummies, owner age, age2, and educationdummies included. Robust standard errors are reported in parentheses. *** p<0.01, ** p<0.05, * p<0.1
DV is dummy for above sample median:Revenue Assets Profits Employee
2004 log Revenue 0.0843*** 0.0267** 0.0512*** 0.0313***(0.0117) (0.0119) (0.0102) (0.0104)
Outside debt ratio 0.420** 1.256*** 0.148 0.318*(0.172) (0.214) (0.162) (0.165)
Black -0.609*** -0.592*** -0.616*** 0.398*(0.235) (0.215) (0.194) (0.209)
Asian 0.455 0.149 0.276 0.547**(0.282) (0.294) (0.250) (0.261)
Other -0.741* -0.133 -0.226 0.620*(0.381) (0.436) (0.382) (0.351)
Hispanic -0.365 -0.505** -0.341 0.292(0.263) (0.256) (0.246) (0.265)
Female -0.597*** -0.572*** -0.351*** -0.278**(0.132) (0.131) (0.117) (0.116)
Hours Worked 0.0182*** 0.0202*** 0.00771*** 0.0164***(0.00251) (0.00269) (0.00223) (0.00241)
Work Experience 0.0179*** 0.00953 0.0162*** 0.0157***(0.00598) (0.00602) (0.00523) (0.00545)
Startup Experience 0.0540 0.151 -0.184* 0.229**(0.117) (0.118) (0.104) (0.107)
Multiple Owners 0.690*** 0.718*** 0.0396 0.382***(0.115) (0.130) (0.107) (0.109)
Credit Score 0.0149*** 0.0151*** 0.00863*** 0.0144***(0.00248) (0.00275) (0.00226) (0.00233)
Intellectual Property -0.00931 -0.0552 -0.532*** -0.103(0.138) (0.151) (0.129) (0.130)
Comparative Adv. 0.202* 0.196 0.162 0.0931(0.121) (0.127) (0.109) (0.109)
Sells Product -0.367* 0.118 -0.415** 0.0241(0.207) (0.225) (0.186) (0.191)
Sells Prod. & Serv. 0.405** 0.0772 0.174 0.146(0.189) (0.209) (0.171) (0.176)
Observations 2507 2507 2507 2507
40

A Unabridged tables
This appendix contains the unabridged versions of Tables 5 and 6, and 8.
41

Table 13: Sources of Financing for 2004 Startups by Firm Type
Non- Home- Pre- Pre- Survived ClosedFunding Source Employer Based Revenue Profits thru 2006 by 2006
Owner Equity $17,269 $20,035 $31,201 $35,433 $31,784 $31,609Owner Debt $2,318 $2,624 $3,720 $5,445 $4,896 $5,392
Personal Credit Card -Owner $1,896 $2,093 $1,937 $3,499 $2,634 $3,256Personal Credit Card-Other Owners $159 $218 $133 $305 $217 $291
Insider Equity $698 $1,024 $2,271 $2,553 $1,705 $3,101Spouse Equity $270 $215 $612 $638 $468 $1,094Parent Equity $428 $809 $1,659 $1,915 $1,237 $2,007
Insider Debt $2,381 $3,074 $6,456 $7,852 $5,856 $7,635Personal Family Loan $1,051 $1,683 $2,451 $3,342 $2,437 $3,535
Personal Family Loan-other owners $194 $144 $260 $244 $220 $445Business Loan from family $350 $580 $2,114 $2,335 $1,481 $2,464Business Loan from Owner $0 $0 $3 $24 $5 $39
Other Personal Loan $475 $302 $1,233 $1,177 $1,191 $252Other Personal Funding $300 $366 $388 $598 $422 $873
Business Loan from Employee(s) $11 $0 $7 $130 $100 $27
Outsider Equity $2,774 $4,731 $16,268 $21,530 $18,753 $8,841Other Informal Investors $785 $2,489 $7,006 $9,704 $7,992 $2,218
Other Business Equity $1,529 $1,568 $4,539 $4,727 $3,840 $3,155Government Equity $10 $226 $550 $945 $1,083 $81
Venture Capital Equity $441 $443 $4,164 $5,618 $5,373 $3,373Other Equity $9 $5 $9 $537 $466 $14
Outsider Debt $19,353 $26,960 $44,839 $54,536 $50,087 $42,208Personal Bank Loan $11,453 $12,898 $12,962 $17,738 $17,416 $11,941
Business Credit Card $577 $561 $683 $1,094 $969 $1,107Other Personal Owner Loan $263 $314 $1,650 $1,641 $2,046 $1,845
Business Credit Card-other owners $25 $53 $44 $187 $100 $225Business Credit Cards $538 $460 $460 $946 $826 $776
Bank Business Loan $5,231 $9,180 $18,474 $21,160 $18,653 $13,103Credit Line $341 $656 $2,986 $4,823 $5,061 $5,047
Other Non-Bank Loan $296 $1,044 $4,970 $3,229 $2,311 $6,941Government Business Loan $58 $309 $1,925 $1,671 $1,514 $871
Other Business Loan $145 $324 $36 $232 $303 $52Other Bank Loan $369 $1,193 $1,316 $2,247 $2,045 $1,391
Other Individual Loan $146 $146 $15 $198 $236 $201Other Business Debt $176 $135 $967 $1,010 $655 $553
Total Financial Capital $44,793 $58,448 $104,755 $127,349 $113,080 $98,787Observations 2,425 2,168 1,615 2,144 3,390 773
Source: Kauffman Firm Survey Microdata. Sample includes only surviving firms over the 2004-2007 period and firms thathave been verified as going out of business over the same period. Sample size 3,972.
42
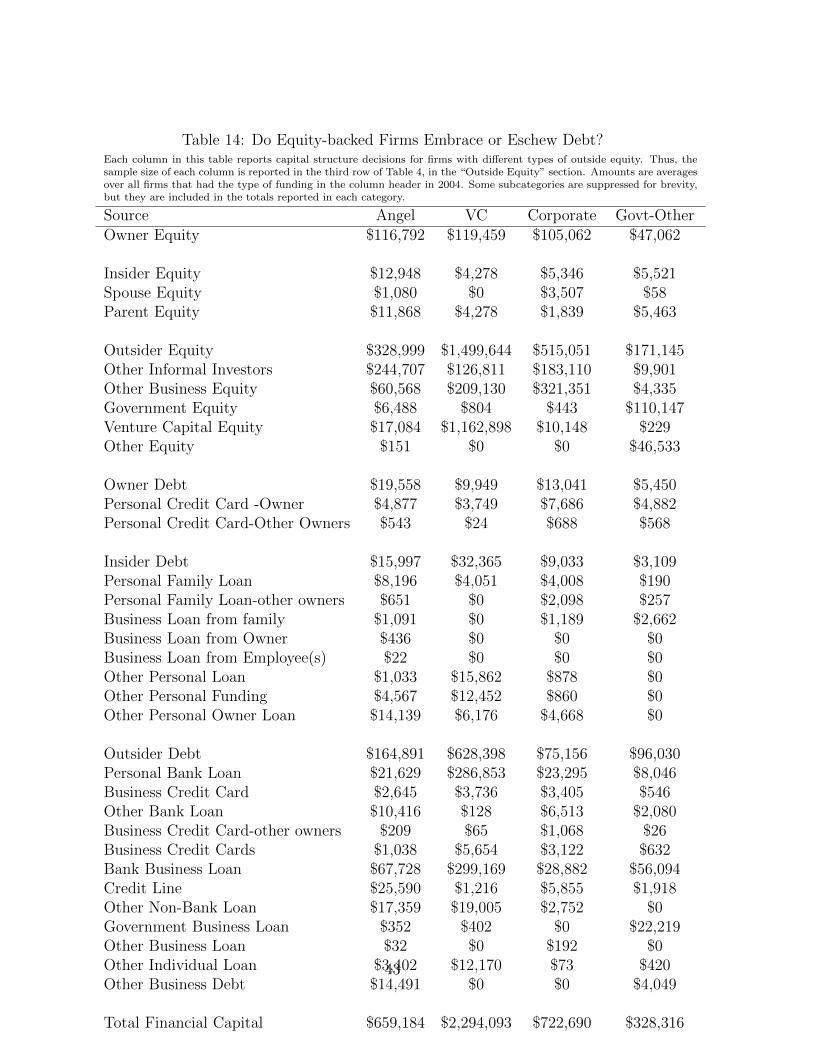
Table 14: Do Equity-backed Firms Embrace or Eschew Debt?Each column in this table reports capital structure decisions for firms with different types of outside equity. Thus, thesample size of each column is reported in the third row of Table 4, in the “Outside Equity” section. Amounts are averagesover all firms that had the type of funding in the column header in 2004. Some subcategories are suppressed for brevity,but they are included in the totals reported in each category.
Source Angel VC Corporate Govt-OtherOwner Equity $116,792 $119,459 $105,062 $47,062
Insider Equity $12,948 $4,278 $5,346 $5,521Spouse Equity $1,080 $0 $3,507 $58Parent Equity $11,868 $4,278 $1,839 $5,463
Outsider Equity $328,999 $1,499,644 $515,051 $171,145Other Informal Investors $244,707 $126,811 $183,110 $9,901Other Business Equity $60,568 $209,130 $321,351 $4,335Government Equity $6,488 $804 $443 $110,147Venture Capital Equity $17,084 $1,162,898 $10,148 $229Other Equity $151 $0 $0 $46,533
Owner Debt $19,558 $9,949 $13,041 $5,450Personal Credit Card -Owner $4,877 $3,749 $7,686 $4,882Personal Credit Card-Other Owners $543 $24 $688 $568
Insider Debt $15,997 $32,365 $9,033 $3,109Personal Family Loan $8,196 $4,051 $4,008 $190Personal Family Loan-other owners $651 $0 $2,098 $257Business Loan from family $1,091 $0 $1,189 $2,662Business Loan from Owner $436 $0 $0 $0Business Loan from Employee(s) $22 $0 $0 $0Other Personal Loan $1,033 $15,862 $878 $0Other Personal Funding $4,567 $12,452 $860 $0Other Personal Owner Loan $14,139 $6,176 $4,668 $0
Outsider Debt $164,891 $628,398 $75,156 $96,030Personal Bank Loan $21,629 $286,853 $23,295 $8,046Business Credit Card $2,645 $3,736 $3,405 $546Other Bank Loan $10,416 $128 $6,513 $2,080Business Credit Card-other owners $209 $65 $1,068 $26Business Credit Cards $1,038 $5,654 $3,122 $632Bank Business Loan $67,728 $299,169 $28,882 $56,094Credit Line $25,590 $1,216 $5,855 $1,918Other Non-Bank Loan $17,359 $19,005 $2,752 $0Government Business Loan $352 $402 $0 $22,219Other Business Loan $32 $0 $192 $0Other Individual Loan $3,402 $12,170 $73 $420Other Business Debt $14,491 $0 $0 $4,049
Total Financial Capital $659,184 $2,294,093 $722,690 $328,316
43
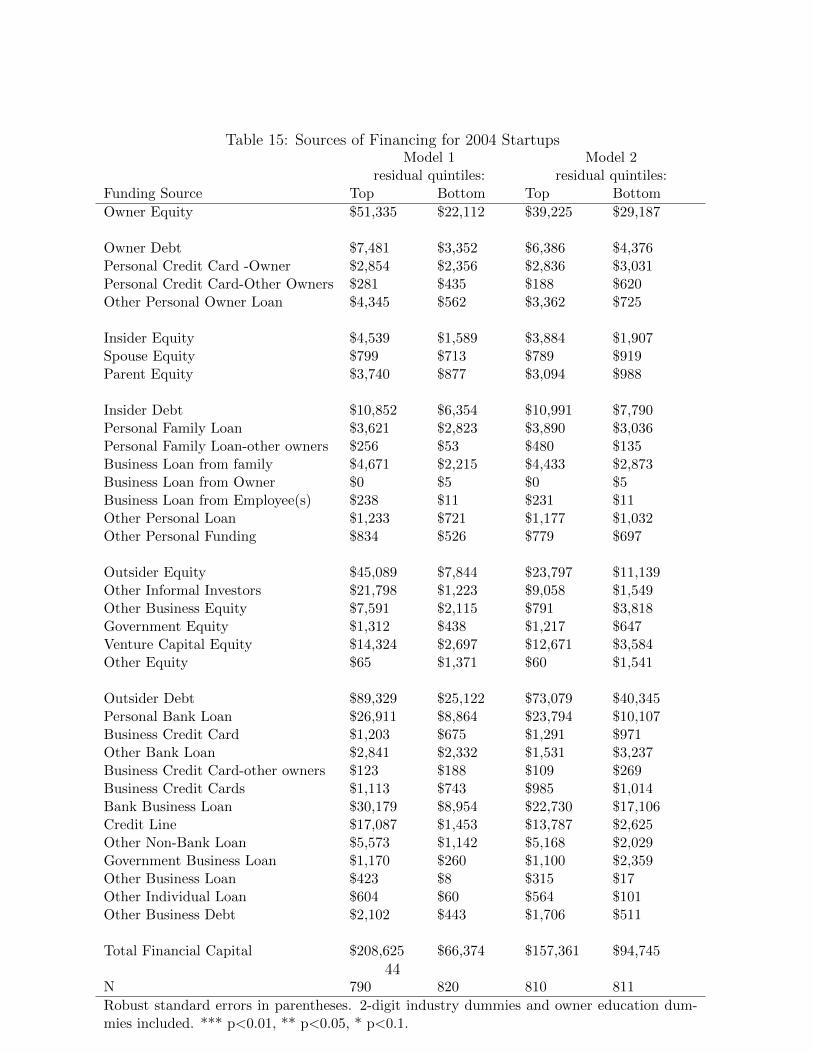
Table 15: Sources of Financing for 2004 StartupsModel 1 Model 2
residual quintiles: residual quintiles:Funding Source Top Bottom Top Bottom
Owner Equity $51,335 $22,112 $39,225 $29,187
Owner Debt $7,481 $3,352 $6,386 $4,376Personal Credit Card -Owner $2,854 $2,356 $2,836 $3,031Personal Credit Card-Other Owners $281 $435 $188 $620Other Personal Owner Loan $4,345 $562 $3,362 $725
Insider Equity $4,539 $1,589 $3,884 $1,907Spouse Equity $799 $713 $789 $919Parent Equity $3,740 $877 $3,094 $988
Insider Debt $10,852 $6,354 $10,991 $7,790Personal Family Loan $3,621 $2,823 $3,890 $3,036Personal Family Loan-other owners $256 $53 $480 $135Business Loan from family $4,671 $2,215 $4,433 $2,873Business Loan from Owner $0 $5 $0 $5Business Loan from Employee(s) $238 $11 $231 $11Other Personal Loan $1,233 $721 $1,177 $1,032Other Personal Funding $834 $526 $779 $697
Outsider Equity $45,089 $7,844 $23,797 $11,139Other Informal Investors $21,798 $1,223 $9,058 $1,549Other Business Equity $7,591 $2,115 $791 $3,818Government Equity $1,312 $438 $1,217 $647Venture Capital Equity $14,324 $2,697 $12,671 $3,584Other Equity $65 $1,371 $60 $1,541
Outsider Debt $89,329 $25,122 $73,079 $40,345Personal Bank Loan $26,911 $8,864 $23,794 $10,107Business Credit Card $1,203 $675 $1,291 $971Other Bank Loan $2,841 $2,332 $1,531 $3,237Business Credit Card-other owners $123 $188 $109 $269Business Credit Cards $1,113 $743 $985 $1,014Bank Business Loan $30,179 $8,954 $22,730 $17,106Credit Line $17,087 $1,453 $13,787 $2,625Other Non-Bank Loan $5,573 $1,142 $5,168 $2,029Government Business Loan $1,170 $260 $1,100 $2,359Other Business Loan $423 $8 $315 $17Other Individual Loan $604 $60 $564 $101Other Business Debt $2,102 $443 $1,706 $511
Total Financial Capital $208,625 $66,374 $157,361 $94,745
N 790 820 810 811
Robust standard errors in parentheses. 2-digit industry dummies and owner education dum-mies included. *** p<0.01, ** p<0.05, * p<0.1.
44

B Alternative Classification Schemes for Inside/Outside
Capital
The following tables change the classification scheme from formal vs. informal to per-
sonal vs. business to illustrate the importance of personal access to formal bank channels.
45

Table 16: Reclassifying Personal and Business Debt: Overall LevelsEquity Source Average Debt Source Average
Total Personal Equity $31,734 Total Personal Debt $21,906Personal bank loan $15,859
Owner bus. CC balance $1,009Personal CC balance, resp. $2,811
Personal CC balance, others $238Personal loan, other owners $1,989
Total Insider Equity $8,452 Total Insider Debt $8,221Spouse equity $646 Family loan $2,749Parents equity $1,456 Family loan to other owners $284
Other informal investors $6,350 Personal loan to other owners $550Other personal loans $924
Business loan by family $1,760Business loan by owner $15Business loan by emp. $79
Personal bank loan by other owners $1,859
Total Outsider Equity $9,585 Total Outsider Debt $29,120Business equity $3,645 Bus. CC balance $812
Govt. equity $798 Other Bus. CC balance $135VC equity $4,804 Bus. bank loan $17,075
other equity $337 Credit line balance $5,057Non-bank bus. loan $3,627
Govt. bus. loan $1,331Other bus. loan $231
Other individual loan $226Other debt $626
Total Equity $49,771 Total Debt $59,247
46

Table 17: Reclassifying Personal and Business Debt: Credit ScoresModel 1 Model 2
residual quintiles: residual quintiles:Funding Source Top Bottom Top Bottom
Owner Equity $51,335 $22,112 $39,225 $29,187
Owner Debt $37,062 $13,524 $32,699 $16,312Personal Credit Card -Owner $2,854 $2,356 $2,836 $3,031Personal Credit Card-Other Owners $281 $435 $188 $620Other Personal Owner Loan $4,345 $562 $3,362 $725Other Personal Loan $1,233 $721 $1,177 $1,032Other Personal Funding $834 $526 $779 $697Personal Bank Loan $26,911 $8,864 $23,794 $10,107Other Individual Loan $604 $60 $564 $101
Insider Equity $26,336 $2,813 $12,942 $3,456Spouse Equity $799 $713 $789 $919Parent Equity $3,740 $877 $3,094 $988Other Informal Investors $21,798 $1,223 $9,058 $1,549
Insider Debt $8,908 $5,295 $9,143 $6,330Personal Family Loan $3,621 $2,823 $3,890 $3,036Personal Family Loan-other owners $256 $53 $480 $135Business Loan from family $4,671 $2,215 $4,433 $2,873Business Loan from Owner $0 $5 $0 $5Business Loan from Employee(s) $238 $11 $231 $11Business Credit Card-other owners $123 $188 $109 $269
Business Equity $23,292 $6,621 $14,739 $9,591Other Business Equity $7,591 $2,115 $791 $3,818Government Equity $1,312 $438 $1,217 $647Venture Capital Equity $14,324 $2,697 $12,671 $3,584Other Equity $65 $1,371 $60 $1,541
Business Debt $61,692 $16,010 $48,613 $29,869Business Credit Card $1,203 $675 $1,291 $971Other Bank Loan $2,841 $2,332 $1,531 $3,237Business Credit Cards $1,113 $743 $985 $1,014Bank Business Loan $30,179 $8,954 $22,730 $17,106Credit Line $17,087 $1,453 $13,787 $2,625Other Non-Bank Loan $5,573 $1,142 $5,168 $2,029Government Business Loan $1,170 $260 $1,100 $2,359Other Business Loan $423 $8 $315 $17Other Business Debt $2,102 $443 $1,706 $511
Total Financial Capital $208,625 $66,374 $157,361 $94,745
47