the initial listing decisions of firms that go public
TRANSCRIPT
The Initial Listing Decisions of Firms That Go Public.
Jeffrey H. Harris [*]
We analyze the initial listing decisions of IPOs that qualify for New York Stock Exchange listing. Wefind that IPOs are more likely to list on the exchange where their industry peers are listed. Further,reverse LBOs and carveouts are more likely to choose the NYSE if the firm or their parent waspreviously NYSE-listed. Consistent with avoidance of delisting costs, we find that smaller, riskierfirms tend to list on Nasdaq. Although direct issue costs are higher on the NYSE than on Nasdaq,total issue costs do not differ across exchanges and are unlikely to affect the listing decision.
Historically, publicly held firms in the US began trading on the regional or over-the-counter marketsand, in some cases, eventually moved to the New York Stock Exchange (NYSE). However, the NYSEchanged its listing rules in 1983, making it easier for initial public offerings (IPOs) to meet minimumlisting requirements. Now that many large IPOs could list directly on the NYSE, the initial listingdecision became an important part of the IPO process. In this paper, we analyze the factors thataffect the initial listing decision.
We examine a sample of IPOs from 1991 to 1996 that either listed on the NYSE or met the NYSE'sminimum-listing requirements, but chose to list on the Nasdaq National Market (Nasdaq). Oursample allows us to examine the initial listing decisions of firms for which NYSE listing was actuallya consideration. Of the 438 IPOs that meet our sample criteria, 337 (76.9%) listed on the NYSE. Thesignificant number of NYSE listings suggests that the change in listing rules and the NYSE'sincreased marketing efforts have had an important effect on the listing decisions of IPO firms.However, the fact that many NYSE-eligible IPOs continue to list on Nasdaq suggests that theperceived costs and benefits of listing vary across firms.
We find that firms tend to list on the exchange where other firms in their industry are currentlylisted. In addition, reverse LBOs and carveouts are more likely to list on the NYSE if the firm orparent firm was listed on the NYSE prior to the LBO or carveout, respectively. These results suggestthat prior exchange relationships and exchange expertise are important considerations in the choiceof listing venue.
Smaller, riskier firms are more likely to list on Nasdaq. This finding suggests that firms avoidexpected delisting costs. The fact that small firms tend to list on Nasdaq may also suggest thatsponsorship is an important factor in the listing decision. However, we find no evidence that youngerfirms, which would also benefit from sponsorship, are more likely to list on Nasdaq than on theNYSE. Although direct issue costs are higher on the NYSE than on Nasdaq, total issue costs(including underpricing) do not differ across listing venues and are therefore unlikely to affect thelisting decision.
Our research follows earlier empirical studies that find a positive stock price reaction to exchangelisting announcements (e.g., Sanger and McConnell, 1986; Grammatikos and Papaioannou, 1986;Kadlec and McConnell, 1994). These studies generally conclude that NYSE listing increases liquidityand may convey positive information about the firm. To analyze the motivations for listing decisions,Cowan, Carter, Dark, and Singh (1992) compare the characteristics of firms that move from Nasdaqto the NYSE with those that are NYSE-eligible, but choose to stay on Nasdaq. Their results suggest

that firms list on the NYSE to obtain a more liquid market for their stocks, but that the potentialcosts and benefits of listing vary across firms. Our research contributes to this literature byanalyzing the initial listing decision. Analyzing initial listings should provide more powerful tests,since all firms must make a listing decision at the time of an IPO. The initial listing decision alsoinvolves factors, such as issue costs and parent-firm listings, that are not important in the decision toswitch exchanges. [1]
Our work also provides evidence related to the theoretical models of the listing decision in Foucaultand Parlour (1999) and Aggarwal and Angel (1999). Foucalt and Parlour develop a model in whichtwo exchanges compete for listings on the basis of listing fees and trading costs. Their modelsuggests that large IPOs will list on the exchange with lower trading costs and higher listing fees.Our findings support this prediction. Aggarwal and Angel model the tradeoff between high tradingcost, high service markets and low trading cost, low service markets. They predict that small,relatively unknown firms will list on the high-cost dealer market to obtain the benefits of market-maker sponsorship. Our results provide only limited support for this model. Although small firms aremore likely to list on Nasdaq, as Aggarwal and Angel predict, we find no evidence that younger firmsprefer Nasdaq over the NYSE.
The rest of the paper is organized as follows. Section I provides a background on IPO listings anddiscusses the change in NYSE listing rules. In Section II, we discuss potential factors in the initiallisting decision and provide empirical predictions. Section III describes the data and provides acomparison of IPO characteristics on the NYSE and Nasdaq. Results from a probit model of thelisting decision are described in Section IV. In Section V, we present tests for differences in issuecosts across exchanges. Section VI concludes.
I. Background on IPO Listings
Until 1983, the number of potential listing venues for newly public firms in the US was limited. Thislack of alternatives resulted from NYSE listing requirements on the number of publicly held sharesand round-lot shareholders. By definition, firms that issue equity for the first time find it difficult tomeet these restrictions, since they have no publicly traded shares prior to the issue. Instead, thesefirms listed initially on Nasdaq or the regional markets.
Figure I shows the proportion of US IPOs between 1981 and 1996 (excluding rights and unitofferings) that listed on various US markets. Panel A shows the proportion of listings for all IPOs.Panel B shows the proportion of listings for IPOs with offer proceeds greater than $40 million. Thegraphs illustrate the limited listing venue choices available prior to 1983. For example, during 1981and 1982, 386 of the 398 IPOs identified by SDC (97%) listed on Nasdaq.
In 1983, the NYSE changed its listing rules to make initial listing on the Big Board a viablealternative for some large IPOs. The minimum listing requirements remained the same as for otherfirms, but the NYSE allowed the underwriter to certify that the IPO would meet share ownership anddistribution standards. Panel A shows how the proportion of IPOs listed on the NYSE increased afterthe rule change. The number of IPOs listed directly on the NYSE grew from only 2.5% in 1983 toover 30% in 1989. Panel B shows that the NYSE's share of large IPOs increased substantially after1983, reaching as high as 80% in 1989. During the 16-year sample period, there were 6,679 IPOslisted in the Securities Data Company (SDC) database, of which 5,187 (77.7%) listed on Nasdaq,1,183 (17.7%) listed on the NYSE, and 309 (4.6%) listed on the American Stock Exchange (Amex) orregional exchanges.
Although the number of IPOs listing directly on the NYSE increased dramatically during the 1980s,

it was not until the early 1990s that the NYSE began to aggressively target IPO firms for listing.From 1981 to 1990, the NYSE had a net gain of only 204 listed firms. However, from 1991 through1996, the number of NYSE-listed firms increased by 1,133, including over 700 IPOs (NYSE FactBook, 1996). The sample in this paper covers the period from 1991 through 1996 and represents atime of both heavy activity in the IPO market and rapid growth on the NYSE.
II. Listing Decision Criteria
When a company goes public, managers who are acting in the best interests of shareholders willchoose the issue characteristics (i.e., contract type, underwriter, etc.) that maximize shareholderwealth. With the NYSE rule change in 1983, the choice of listing venue became an additionalconsideration for these managers. Although firm managers may have preconceived ideas about theappropriate exchange for their stock, they likely weigh the costs and benefits of each exchangebased on input from the underwriters, auditors, lawyers, and other parties involved with the issue.Potential criteria in the listing decision are discussed and summarized in Table I.
A. Listing Requirements
Both the NYSE and Nasdaq require prospective listing firms to meet a set of quantitativerequirements. Panel A of Table II lists the requirements that were in effect during our sample periodon the NYSE and the Nasdaq National Market. As the table shows, these requirements are morerestrictive on the NYSE than on Nasdaq. For example, the NYSE requires firms to have 1.1 millionpublicly held shares with a market value of at least $40 million. The corresponding requirements onNasdaq are 500,000 publicly held shares valued at $3 million. The NYSE also requires pretax incomeof $6.5 million over the previous three years. In comparison, Nasdaq requires only $750,000annually under Alternative 1 and has no income requirement under Alternative 2. Since only firmsthat meet the NYSE's listing requirements actually face a choice between NYSE and Nasdaq listing,we consider only this subset of IPOs.
Meeting the quantitative requirements discussed above does not guarantee that a firm will beapproved for NYSE listing. The NYSE weighs factors such as the company's position and stability inits industry, the composition of its board of directors and audit committee, and the voting rightsassociated with the securities (NYSE Fact Book, 1996). The NYSE also requires the underwriter tocertify that the IPO will meet share ownership and distribution standards. Due to data limitations,we do not test the relative importance of these additional factors in the listing decision. However, weexpect these factors to affect only a small number of IPOs. Private conversations with the NYSElistings department suggest that underwriter certification has rarely, if ever, been denied a firm thatmet the other quantitative listing requirements.
B. Initial and Annual Listing Fees
To list on either the NYSE or Nasdaq, firms must pay both initial and annual listing fees. These feesgenerally increase with the number of shares listed and are substantially higher on the NYSE thanon Nasdaq. For comparison, consider an issuer offering five million shares at $16 per share. If listedon the NYSE, this issuer would pay initial listing fees of $84,600 (0.1058% of offer value) and annuallisting fees of $16,170 (0.0202%). For a Nasdaq listing, this issuer would pay initial listing fees ofonly $30,000 (0.0375%) and annual listing fees of only $7,250 (0.009%). [2] All else equal, we expectthe probability of NYSE listing to be inversely related to the difference in listing fees betweenexchanges.
C. Exchange Expertise and Related-Firm Listings
Anecdotal evidence suggests that firms tend to list on the exchange that they believe has expertiseor experience in trading similar securities. For example, despite the NYSE's increased efforts toattract the largest technology companies, Nasdaq is generally considered the primary listing venuefor these firms. This may reflect a perception by listing firms that knowledge about a particular firmor industry is beneficial to market makers. Thus, we expect listing choices to be clustered byindustry. Further, if the listing firm has previously traded on one of the exchanges (a reverse LBO)or has an exchange-listed parent firm (a carveout), managers may simply choose to list on themarket with which they have a previous relationship.
D. Continued Listing Requirements and the Expected Costs of Delisting
In addition to the initial listing requirements discussed above, the NYSE requires firms to meet a setof less restrictive requirements for continued listing. Although infrequent (30 firms were delisted in1998), delistings, as a result of dropping below these requirements, can be costly for listed firms.First, a delisting reverses the listing choice of the firm and results in a loss of the initial listing feespaid to the exchange. Second, delistings are associated with negative stock price reactions. Forexample, Sanger and Peterson (1990) report average abnormal returns of -8.5% at NYSE and Amexdelisting announcements. While this negative stock price reaction might reflect a decrease inliquidity, McConnell, Dybevik, Haushalter, and Lie (1996) point out that delistings may also signalthe exchange's weakened confidence in the firm's ability to meet requirements for continued listing.To avoid the http://goo.gl/7anIuW negative effects of delisting, firm managers might delay listing onthe NYSE until they are confident that th e firm can maintain listing eligibility. Therefore, we expectfirms that are more likely to drop below the NYSE's requirements for continued listing to list onNasdaq. This includes small firms that only marginally qualify for NYSE listing, risky firms, and firmsvalued primarily from growth options.
E. Visibility and Sponsorship
Merton (1987) derives a model in which the market value of a firm increases with the level ofinvestor recognition. When applied to the listing venue choice, this model suggests that managersshould choose to list on the market that provides the greatest visibility and largest investor base.Managers do, in fact, cite visibility and improved access to investors as among the most importantfactors in the listing decision (Baker and Johnson, 1990).
An important feature of the Nasdaq market that may affect investor base is sponsorship, wherebyNasdaq market makers promote the securities they trade to investors. [3] According to the NasdaqFact Book (1996), "...Nasdaq market makers commit to your company by taking sizable positions intheir proprietary accounts, merchandising through their institutional contacts and their own oraffiliated retail networks, and maintaining continuous research coverage."
Aggarwal and Angel (1999) suggest that the incentives to provide sponsorship derive from widerbid-ask spreads and the market maker's ability to internalize order flow on Nasdaq. Their modelpredicts that sponsorship should be most valuable for firms that are relatively unknown amonginvestors. Since these are likely to be the smallest and youngest companies, we hypothesize thatsuch firms will be more likely to list on Nasdaq than on the NYSE. [4]
F. Liquidity and Future Financing
For many firms, the initial public offering is the first in a series of public offerings. For firms that usethis "seasoning strategy," liquidity could be an important consideration in the initial listing decision.For example, Amihud and Mendelson (1986) argue that firms can reduce their cost of capital

through financial policies that increase liquidity. When applied to the listing decision, thesearguments suggest that managers should choose to list on the exchange that provides the highestliquidity.
Several studies provide empirical evidence of differences in liquidity across exchanges. Althoughthey do not completely agree, these studies generally report higher levels of liquidity on the NYSEthan on Nasdaq (e.g., Huang and Stoll, 1996) and an increase in liquidity when firms move fromNasdaq to the NYSE (e.g., Christie and Huang, 1994; Barclay, 1997). Although these results suggestthat most firms could improve liquidity by listing initially on the NYSE, this benefit is likely to bemost important for firms that plan to return to the capital markets. Therefore, we expect firms thatfollow a seasoning strategy to be more likely to list on the NYSE than on Nasdaq.
III. Data and Sample Characteristics
We use the Securities Data Company's Global New Issues database (SDC) to collect the completesample of firm-commitment initial public offerings of common stock in the US from 1991 to 1996.We exclude unit and rights offers and issues by foreign firms, investment funds, and real estateinvestment trusts. Then, we collect additional data from numerous sources--data on offercharacteristics and underwriter identity from SDC; data on firm characteristics and aftermarketprices from Compustat and CRSP; and income data for the previous three years from the firms' S-1filings. Also, we identify incorporation dates using SP Stock Reports, Moody's Handbook, and SPCorporate Records. Finally, where possible, we obtain Carter-Manaster rankings for underwritersfrom Carter, Dark, and Singh (1998).
Since we are interested in the choice of listing venue, we restrict the sample to IPOs that eitherlisted on the NYSE, or met the NYSE's listing requirements, but chose to list on Nasdaq (SDCexchange codes NASDAQ or NYSE). Panel B of Table II lists the proxy variables and minimum valuesused to restrict our sample. To be included in the sample, Nasdaq IPOs must have at least 1.1 millionoffered shares, $40 million in offer proceeds, and $40 million in total assets prior to the issue. Wefurther require Nasdaq IPOs to have at least $6.5 million in pretax income during the previous threeyears, including either $4.5 million in the previous year and positive amounts in the two prior years,or $2.5 million in the previous year and $2 million in each of the two prior years. These restrictionsgive us a final sample of 438 IPOs.
Panel A of Table III lists the number of IPOs in the final sample by year and exchange. Of the 438sample IPOs, 337 (76.9%) listed on the NYSE and 101 (23.1%) listed on Nasdaq. There were at least56 IPOs in each sample year, with the proportion of NYSE-listed IPOs ranging from 71% in 1991 to82% in 1992. Panel B of Table III shows that 35% of IPOs with proceeds less than $100 million listedon Nasdaq, while over 93% of IPOs larger than $200 million, and 100% of IPOs larger than $400million listed on the NYSE.
Table IV provides summary statistics for offer characteristics (Panel A) and firm characteristics(Panel B). The table lists the results for the full sample and for the subsamples of NYSE and Nasdaqissues. For the last three variables, the table lists the proportion of sample firms in the statedcategory and the reported p-value is from a test of the restriction that proportions are equal acrossexchanges. For all other variables, the table lists the mean [median] and the reported p-value is froma test of the restriction that means [medians] are equal across exchanges.
Even after limiting the sample to NYSE-eligible IPOs, we see that significant differences existbetween the two exchanges. NYSE IPOs are significantly larger than Nasdaq issues, with mean offerproceeds of $170 million and mean offered shares of 9.3 million. The comparable numbers on

Nasdaq are $76 million and 4.9 million shares. NYSE IPOs are also underwritten by higher qualityunderwriters, as reflected by Carter-Manaster rankings (see Carter, Dark, and Singh, 1998) andunderwriter market share. Medians differ significantly across exchanges for all of the variables inPanel A. Means differ significantly in all cases except the CarterManaster rankings.
The characteristics of issuing firms (Panel B) also differ across exchanges. Firms that issue IPOs onthe NYSE have significantly higher total assets and market values than do firms listing on Nasdaq.The average time from incorporation to IPO is significantly greater on the NYSE (20.38 years) thanon Nasdaq (12.34 years). However, the median firm age of six years is the same for both exchanges.NYSE IPOs are also less risky, with a mean aftermarket standard deviation of 5.86% compared to 6.91% for Nasdaq IPOs. Finally, there is weak evidence that NYSE IPOs are brought to market by firmswith fewer growth opportunities. Although the mean market-to-book ratio is 1.69 and does not differsignificantly across exchanges, the median market-to-book ratio is significantly lower for NYSE IPOs(1.37) than Nasdaq IPOs (1.57).
The sample proportions in Panel B show that NYSE IPOs are more likely to result from equitycarveouts and reverse LBOs. [5] The NYSE sample includes 23.4% carveouts and 18.4% reverseLBOs. In comparison, the Nasdaq sample includes only 6.9% carveouts and 9.9% reverse LBOs. Bothof these proportions differ significantly across exchanges at the 5% level. The proportion of IPOsbacked by venture capitalists is 21.7%, and does not differ significantly across exchanges.
To study related-firm listings, we begin by examining the previous listing venues of the reverse LBOsand carveouts in our sample. Of the 86 carveouts, 76 had NYSE-listed parent firms and 73 (96%) ofthese listed on the NYSE. Six of the remaining ten carveouts listed on the NYSE and four listed onNasdaq. Of the 72 reverse LBOs in our sample, 54 involved firms that were previously listed on theNYSE and 51 (94%) of these listed on the NYSE. Eleven of the remaining 18 reverse LBOs listed onthe NYSE and seven listed on Nasdaq. Thus, IPOs associated with carveouts and reverse LBOs aremore likely to list on the NYSE if the related firm was listed on the NYSE.
Table V presents the frequency of initial listings on the NYSE and Nasdaq by industry. For eachindustry, the table indicates whether the proportion of NYSE-listed IPOs is equal to the overallsample proportion (76.9%). We define industries in two ways: 1) using SDC's industry definitions toidentify the technology firms in the sample and 2) using Fama and French's (1997) industrydefinitions based on four-digit SIC codes.
In Panel A, the results for technology firms provide only weak evidence that technology IPOs aremore likely than other firms to list on Nasdaq rather than on the NYSE. Of the 63 technology firmsidentified in the sample, 42 (66.7%) listed on the NYSE. Although more than half the technologyfirms in the sample list on the NYSE, this proportion is significantly lower than the overall sampleproportion of NYSE-listed firms. Within the technology categories, the highest concentrations ofNasdaq listings are in the computer equipment and communications industries, where 45.5% of IPOsare Nasdaq listed. In contrast, only 14.3% of NYSE-eligible biotechnology firms listed on Nasdaq.
Panel B of Table V presents the results based on Fama and French's (1997) industry definitions. Themost notable industry concentrations on the NYSE occur in the consumer goods, apparel, medicalequipment, steel works, electrical equipment, petroleum and natural gas, insurance, and tradingindustries. Over 90% of these firms listed on the NYSE. The most notable concentrations on theNasdaq market occur in the computer, business supplies, and transportation industries, where atleast 50% of the sample IPOs listed on Nasdaq.
To identify firms that follow seasoning strategies, we analyze follow-on offers made during the first
24 months after the IPO. We identify seasoned equity offerings (SEOs) using SDC. Table VI providessummary data for the number of SEOs, offer proceeds, and offer proceeds scaled by IPO proceeds.Of the 438 IPOs, 143 (32.6%) had at least one SEO within 24 months of the IPO. The proportion offirms involved in at least one SEO was higher on Nasdaq than the NYSE (41.6% compared to 30%).However, we find no statistically significant difference across exchanges in the mean number ofSEOs, mean offer proceeds, or mean scaled offer proceeds. These results suggest that seasoningstrategies are unlikely to be an important factor in the initial listing decision.
IV. The Listing Decision
Using a probit model for the initial listing decision, we analyze the relative importance of severalpotential listing-decision criteria and the ability of these factors to jointly explain the initial listingdecision. The probit model takes the form of:
Prob(NYSE = 1) = [phi]([gamma]'Z) (1)
where [phi](*) denotes the standard normal distribution, [gamma] is a vector of coefficients, and Z isa vector of explanatory variables. The explanatory variables are the log of Market Value,Aftermarket Standard Deviation, Market-to-Book, Scaled Seasoned Offer Proceeds, Firm Age, ListingFee Difference, NYSE Industry Market Share, and dummy variables identifying reverse LBOs,carveouts, and technology firms.
Listing Fee Difference is the difference in first-year percentage listing fees between the NYSE andNasdaq, where we define first-year percentage listing fees as the initial listing fee plus the first-yearannual listing fee divided by offer proceeds. To test the importance of related-firm listings, weinclude dummy variables related to reverse LBOs and carveouts. [LBO.sub.NYSE] equals one if thereverse LBO involves a firm previously listed on the NYSE, and zero otherwise. For all other reverseLBOs, [LBO.sub.Other] equals one. We define [Carveout.sub.NYSE] and [Carveout.sub.Other] in thesame way for carveouts with NYSE parent firms and non-NYSE parent firms, respectively. Weinclude NYSE Industry Market Share, the technology firm dummy variable, and industry dummyvariables as proxies for peer-firm listings. The technology firm dummy variable is equal to one if thefirm is in one of SDC's technology industries. We define industry dummy variables based on theFama and French (1997) four-digit SIC code clas sification. [6] We define NYSE Industry MarketShare as the number of NYSE-listed firms in the same industry as the IPO divided by the totalnumber of Nasdaq and NYSE-listed stocks in that industry as of December 31st in the year prior tothe IPO.
Table VII provides the results from alternative specifications of the probit model. For eachspecification, the table lists a pseudo [R.sup.2], which we define as one minus the ratio of thecomputed log-likelihood to the log-likelihood of a model in which all slopes equal zero. The pseudo[R.sup.2] ranges from 8.69% for the model that includes only firm size, to 31.38% for the full-variable specification.
The coefficient on market value is positive and significant in every specification, suggesting thatsmaller firms are more likely to list on Nasdaq than on the NYSE. The coefficient on AftermarketStandard Deviation is also negative and significant in Models 2 through 5. These results areconsistent with the hypothesis that firms with a higher likelihood of falling below the NYSE'sminimum listing requirements are more likely to list on Nasdaq. However, the coefficient onStandard Deviation is not significant in the model that includes industry dummy variables (Model 6).This suggests that the significance of firm risk could be related to industry clustering in the listingdecision. Although the negative coefficient on Market-to-Book is consistent with the delisting costs

hypothesis, it is not significant in any of the specifications.
Our finding that small firms are more likely to list on Nasdaq could also be interpreted as evidencethat market-maker sponsorship is an important factor in the listing decision (Aggarwal and Angel,1999). However, we find no evidence that younger firms choose Nasdaq over the NYSE. Althoughthe coefficient on Firm Age is positive, it is not significant after we control for other factors. Thus,our findings are consistent with the expected delisting costs hypothesis, but provide only weaksupport for the sponsorship hypothesis.
After controlling for other factors, seasoning strategies appear to have little effect on the initiallisting decision. The coefficient on Seasoned Offer Proceeds is insignificant in every specification.Thus, it appears that firms with high levels of seasoned equity financing are no more likely thanother firms to seek out the potential liquidity benefits of the NYSE. The coefficient on Listing-FeeDifference is also insignificant, suggesting that, after controlling for other factors, the difference infirst-year listing fees does not affect the listing decision.
The important role of related-firm listings is evident in the results for reverse LBOs and carveouts.Carveouts are more likely to list on the NYSE if the parent firm is NYSE-listed. Reverse LBOs aremore likely to list on the NYSE if the firm was listed on the NYSE prior to the LBO. There is noevidence that carveouts or reverse LBOs concentrate on either the NYSE or Nasdaq if the relatedfirm was not NYSE-listed.
Results based on industry proxies confirm the influence of peer-firm listings. The coefficient onNYSE Industry Market Share is positive and significant, which suggests that IPO firms tend to list onthe exchange where their peer firms are currently listed. In addition, the specification that includesindustry dummies suggests that IPO listings cluster by industry. A likelihood ratio test rejects therestriction that all industry-dummy coefficients are equal. We also find that technology firms aremore likely to list on Nasdaq. Combined with the results for reverse LBOs and carveouts, thesefindings suggest that prior exchange relationships and perceived exchange expertise play animportant role in the listing decision.
To determine whether model specification or sample selection affect our results, we perform severalrobustness checks. Because we measure aftermarket standard deviation and the seasoned offervariable after the IPO date, we exclude these variables and re-estimate the model. Our conclusionsabout the remaining variables are unchanged. To provide tighter restrictions on the Nasdaq sample,we re-estimate the model, including only those Nasdaq IPOs that exceeded the tenth percentile ofNYSE IPOs on each of the listing-requirement proxies. We also re-estimate the model excluding IPOslarger than $200 million and excluding reverse LBOs and carveouts. In all cases, the results arerobust. [7]
V. The Costs of Going Public
In addition to the listing criteria discussed above, firms could consider differences in issue costswhen making the listing decision. To address this issue, we test whether the costs of going publicdiffer across markets. Following Lee, Lochhead, Ritter, and Zhao (1996), we examine both directissue costs and underpricing. Direct costs consist of the underwriter spread and other directexpenses. We define the underwriter spread as the percentage difference between the offer priceand the price received by the issuer. Other direct expenses include listing and registration fees,legal and auditing fees, the costs of preparing registration statements, etc. We define underpricingas the percentage price change from the offer price to the closing price on the first day of trading.

The costs of going public may differ across exchanges for several reasons. As discussed in Section II,initial listing fees are substantially higher on the NYSE than on Nasdaq. Underwriter fees may differacross exchanges if listing on a particular exchange provides prestige or promotional activities thatattract a larger potential investor base. This exchange-related promotion could reduce theunderwriter's marketing costs and lead to reduced underwriter fees. Affleck-Graves, Hegde, Miller,and Reilly (1993) note that underpricing may differ across exchanges if listing on the NYSE providesquality certification that is not provided by a Nasdaq listing. Credible certification reduces investoruncertainty about the value of the offer and could, in turn, result in lower underpricing.
Table VIII presents univariate summary statistics for the costs of going public. Both mean andmedian direct issue costs are significantly lower on the NYSE than on Nasdaq. The difference isdriven primarily by lower underwriter spreads. The average underwriter spread is 6.23% on theNYSE, compared to 6.78% on Nasdaq. Although the mean value of direct expenses does not differacross exchanges, median direct expenses are significantly lower on the NYSE (1.11%) than onNasdaq (1.48%). Mean underpricing is also lower on the NYSE (9.33%) than on Nasdaq (12.32%).However, median underpricing does not differ significantly across exchanges. By combining directissue costs and underpricing, we find that total issue costs are significantly lower on the NYSE witha mean (median) of 17.15% (13.60%) compared to 20.70% (15.67%) on Nasdaq.
Although Table VIII suggests that both direct issue costs and total issue costs are lower on the NYSEthan on Nasdaq, these results do not control for other variables that affect issue costs. We test fordifferences in issue costs after controlling for these factors using OLS regressions. The explanatoryvariables are the log of Offer Proceeds, Underwriter Market Share, Aftermarket Standard Deviation,and dummy variables that identify venture backed issues, reverse LBOs, and carveouts. We expressissue costs as:
Issue [Cost.sub.i] = [[beta].sub.0] + [[beta].sub.1] * Ln([OfferProceeds.sub.i]) + [[beta].sub.2] *[UWMarketShare.sub.i] + [[beta].sub.3] * [StdDeviation.sub.i] + [[beta].sub.4] *[VentureBacked.sub.i] + [[beta].sub.5] * [LBO.sub.i] + [[beta].sub.6] * [Carveout.sub.i] +[[beta].sub.7] * NYSE + [[epsilon].sub.i] (2)
Offer proceeds should capture any economies of scale and also serve as a proxy for ex anteuncertainty about the value of the offer. Previous researchers have found that this variable to beinversely related to issue costs (see Beatty and Ritter, 1986; Ritter, 1987). We include aftermarketstandard deviation as an additional proxy for ex ante uncertainty. This variable should be positivelyrelated to issue costs. We include underwriter market share as a proxy for underwriter quality. Ifunderwriters can certify the quality of the offer, then higher quality underwriters should beassociated with reduced underpricing (see Carter and Manaster, 1990). We identify venture backedissues by a dummy variable that equals one if the IPO is backed by venture capital and zerootherwise. We identify reverse LBOs and carveouts in the same way. Megginson and Weiss (1991)report a negative relation between venture capital backing and underpricing. Muscarella andVetsuypens (1989) find that reverse LBOs are less underpriced than other IPOs. We also expectcarveouts to be associated with less uncertainty than other IPOs, resulting in lower issue costs.
Table IX presents the results from our OLS regressions. We estimate the model for each costcomponent, for total direct costs, and for total direct and indirect issue costs. Consistent witheconomies of scale, we find that total direct costs are negatively related to offer size. This result alsoholds for the gross spread and direct expense components of total direct costs. However, thecoefficient on offer size is not significant in the underpricing regression and is only marginallysignificant in the total issue cost regression (p-value=0.094). The lack of a significant relationbetween offer size and underpricing contrasts with previous research. It is probably explained by the

fact that our sample is limited to large IPOs.
Consistent with previous research, we find that underpricing is positively and significantly related torisk. However, direct issue costs do not appear to be related to aftermarket standard deviation. Thecoefficient on underwriter market share is positive and significant in the underpricing and total costregressions, which suggests that higher quality underwriters are associated with increased issuecosts. This result does not support the underwriter certification hypothesis, but it is consistent withBeatty and Welch (1996), who find a positive relation between underwriter quality and issue costs inthe 1990s.
Also consistent with Muscarella and Vetsuypens (1989), we find that reverse LBOs are associatedwith significantly lower issue costs than are other IPOs. This result holds for gross spreads, directexpenses, and underpricing. Although carveouts are also associated with reduced underpricing, totalissue costs for these issues do not differ from the costs incurred for other IPOs. Venture-capitalbacking does not appear to significantly affect issue costs in this sample.
To compare issue costs across exchanges, we focus on the dummy variable for NYSE listing.Although gross spreads are significantly lower for NYSE IPOs, other expenses and total direct costsare significantly higher on the NYSE than on Nasdaq. Consistent with Affleck-Graves et al. (1993),we find no evidence that underpricing differs between the NYSE and the Nasdaq National Market.Further, while the NYSE dummy-variable coefficient is negative in the total issue cost regression, itis not statistically significant (p-value=0.503). Thus, although firms may consider differences indirect issue costs, total issue costs are not likely to be a factor in the choice of listing venue. 8
VI. Conclusion
In 1983, the NYSE developed special listing procedures that made it possible for some large IPOs tolist directly on the NYSE. Since this rule change, the number of IPOs listing directly on the NYSEhas increased dramatically. For example, according to the SDC Global New Issues database, twoIPOs listed on the NYSE in 1982, but over 200 IPOs listed on the NYSE in 1993. This studydocuments the rapid growth in IPO listings on the NYSE since this rule change and analyzes thefactors that explain the initial listing decisions of IPO firms.
We examine a sample of 438 IPOs from 1991 to 1996 that either listed on the NYSE, or met theNYSE's minimum listing requirements but chose to list on Nasdaq. Of these IPOs, 337 (76.9%) listedon the NYSE. The significant number of NYSE listings suggests that the change in listing rules andthe NYSE's increased marketing efforts have had an important effect on the listing decisions of IPOfirms. However, a substantial number of NYSE-eligible IPOs continue to list on Nasdaq, a result thatsuggests that the costs and benefits of listing vary across firms.
Probit results show that smaller firms and riskier firms are more likely to list on Nasdaq than on theNYSE. These results are consistent with the avoidance of expected delisting costs and the tradeoffbetween market quality and listing fees modeled in Foucault and Parlour (1999). Small firms mightalso list on Nasdaq to capture the benefits of market-maker sponsorship. However, we find noevidence that younger firms, which would also benefit from sponsorship, are more likely to list onNasdaq than on the NYSE.
Peer-firm and related-firm listings appear to be important factors in the choice of listing venue.Firms tend to list on the exchange where their industry peers are listed, and reverse LBOs andcarveouts are more likely to list on the NYSE if the firm or parent firm was listed on the NYSE priorto the LBO or carveout, respectively. Follow-on offering strategies, listing fees, and issue costs do
not appear to be important considerations in the initial listing decision.
Our findings highlight the increase in competition for listings that has occurred during the 1990s.Several US markets have responded to this competition with proposals and policy changes designedto attract new listings. For example, the merger of Nasdaq and Amex attempted to create twomarket structure choices in one "market of markets." In an effort to attract new listings, the NYSEalso recently approved changes to its Rule 500 and its allocation policy. The changes to Rule 500,approved by the SEC in July of 1999, give NYSE firms more freedom to voluntarily delist (Wall StreetJournal, 1999). The changes to the NYSE's Allocation Policy, implemented in March of 1997, givelisting firms more input into the selection of their specialist unit (Securities and ExchangeCommission, 1998). [9] These changes are likely to play a significant role in future listing decisionsas firms trade off the costs and benefits of alternative listing venues.
This paper has benefited from numerous comments and suggestions by the Editors and twoanonymous referees. We also thank Kirsten Anderson, Jeff Bacidore, Bill Christie, Marc Lipson,Ananth Madhavan, Bill Megginson, Jeff Netter Phil Owen, Annette Poulsen, Paul Schultz, Joe SinkeySteve Smith, George Sofianos, Avanidhar Subrahmanyam, Kent Womack, seminar participants atArizona State University, Nasdaq, Syracuse University the University of Notre Dame, and theFederal Reserve Bank of Atlanta for helpful comments, Jim Hester for research assistance, andSandra Sizer Moore for editorial comments. Any remaining errors are the joint responsibility of theauthors.
(*.) Shone A. Corwin is an Assistant Professor in the Terry College of Business at the University ofGeorgia. Jeffrey H. Harris is an Assistant Professor in the Mendoza College of Business at theUniversity of Notre Dame.
(1.) Affleck-Graves, Hegde, Miller, and Reilly (1993) also examine initial listing decisions, but focuson underpricing and exchange certification. Corwin, Harris, and Lipson (2000) analyze liquidityprovision and trading activity following NYSE-listed IPOs.
(2.) We base listing fee estimates on the Nasdaq fee schedule effective 8/7/97 and the NYSE feeschedule effective 8/4/95. On Nasdaq, original listing fees range from a base fee of $5,000 to amaximum of $50,000. Annual listing fees range from $5,250 to $20,000. On the NYSE, initial listingfees range from a base fee $36,800 to a maximum of $504,600. Annual listing fees range from S16,170 to $500,000.
(3.) Managers of NYSE-listed firms often cite increased visibility as a motivation for NYSE listing.However, Baker, Powell, and Weaver (1999) find that the increases in analyst coverage andinstitutional shareholders commonly attributed to exchange listing are explained primarily bygrowth in market capitalization rather than the listing itself.
(4.) See Ellis, Michaely, and O'Hara (2000) for a detailed analysis of market making activities byunderwriters of Nasdaq-listed IPOs.
(5.) We verify SDC's reverse LBO and carveout designations using Edgar and Standard and Poor'sInternational Directory of Company Histories. We retain the carveout designation if the IPO involvesa publicly traded parent company. We retain the reverse LBO designation if the firm was previouslytraded on a US exchange.
(6.) We exclude dummy variables for industries in which only one exchange is represented and forany industry represented by fewer than five sample firms. Results based on two-digit SIC codes are

similar.
(7.) We also test whether initial listing decisions were affected by reports of implicit collusion amongNasdaq market makers (see Christie and Schultz, 1994; Christie, Harris, and Schultz, 1994). We findno evidence that listing decisions changed after these findings were publicized.
(8.) Since listing fees are deterministic, we re-estimated the direct cost regression after subtractingthese fees. The results suggest that differences in direct costs are not limited to listing fees. Tocontrol for self-selection biases, we also analyzed differences in issue costs using a two-stage self-selection model (Maddala, 1983). The coefficient on the selectivity variable (Inverse Mills Ratio) wasinsignificant in every issue cost specification, suggesting that the reported OLS coefficients areunbiased.
(9.) See Corwin (2000) for an analysis of changes to the NYSE's allocation policy.
References
Affleck-Graves, J., S. P. Hegde, R. E. Miller, and F. K. Reilly, 1993, "The Effect of the Trading Systemon the Underpricing of Initial Public Offerings," Financial Management 22, 99-108.
Aggarwal, R. and J. J. Angel, 1999, "Optimal Listing Strategy: Why Microsoft and Intel Do Not List onthe NYSE," Georgetown University Working Paper.
Amihud, Y and H. Mendelson, 1986, "Asset Pricing and the Bid-Ask Spread," Journal of FinancialEconomics 17, 223-249.
Baker, H. K. and M. Johnson, 1990, "A Survey of Management Views on Exchange Listing," QuarterlyJournal of Economics 29, 3-20.
Baker, H. K., G. E. Powell, and D. G. Weaver, 1999, "Does NYSE Listing Affect Firm Visibility?"Financial Management 28, 46-54.
Barclay, M. J., 1997, "Bid-Ask Spreads and the Avoidance of Odd-Eighth Quotes on Nasdaq: AnExamination of Exchange Listings," Journal of Financial Economics 45, 35-60.
Beatty, R. and I. Welch, 1996, "Issuer Expenses and Legal Liability in Initial Public Offerings,"Journal of Law and Economics 39, 545-602.
Beatty, R. and J. R. Ritter, 1986, "Investment Banking, Reputation, and the Underpricing of InitialPublic Offerings," Journal of Financial Economics 15, 213-232.
Carter, R. B. and S. Manaster, 1990, "Initial Public Offerings and Underwriter Reputation," Journalof Finance 45, 1045-1067.
Carter, R. B., F. H. Dark, and A. K. Singh, 1998, "Underwriter Reputation, Initial Returns, and theLong-Run Performance of IPO Stocks," Journal of Finance 53, 285-311.
Christie, W. G., J. H. Harris, and P. Schultz, 1994, "Why Did Nasdaq Market Makers Stop AvoidingOdd-Eighth Quotes?" Journal of Finance 49, 1841-1860.
Christie, W. G. and R. D. Huang, 1994, "Market Structure and Liquidity: A Transactions Data Study

of Exchange Listings," Journal of Financial Intermediation 3, 300-326.
Christie, W. G. and P. Schultz, 1994, "Why Do Nasdaq Market Makers Avoid Odd-Eighth Quotes?"Journal of Finance 49, 1813-1840.
Corwin, S. A., 2000, "Specialist Portfolios, Specialist Performance, and New Listing Allocations onthe New York Stock Exchange," University of Georgia Working Paper.
Corwin, S. A., J. H. Harris, and M. L. Lipson, 2000, "Liquidity Provision and Trading ActivityFollowing Initial Public Offerings on the NYSE," University of Georgia Working Paper.
Cowan, A., R. Carter, F. Dark, and A. Singh, 1992, "Explaining the Listing Choices of Nasdaq Firms,"Financial Management, 21, 73-86.
Ellis, K., R. Michaely, and M. O'Hara, 2000, "When the Underwriter is the Market Maker: AnExamination of Trading in the IPO Aftermarket," Journal of Finance 55, 1039-1074.
Fama, E.F. and K.R. French, 1997, "Industry Costs of Equity," Journal of Financial Economics 43,153-193.
Foucault, T. and C.A. Parlour, 1999, "Competition for Listings," Carnegie Mellon University WorkingPaper.
Grammatikos, T. and G. Papaioannou, 1986, "The Informational Value of Listing on the New YorkStock Exchange," Financial Review 21,485-499.
Huang, R. D. and H. R. Stoll, 1996, "Dealer Versus Auction Markets: A Paired Comparison ofExecution Costs on Nasdaq and the NYSE," Journal of Financial Economics 41, 313-357.
Kadlec, G. and J. McConnell, 1994, "The Effect of Market Segmentation and Illiquidity on AssetPrices: Evidence from Exchange Listings," Journal of Finance 49, 611-636.
Lee, I., S. Lochhead, J. Ritter, and Q. Zhao, 1996, "The Costs of Raising Capital," Journal of FinancialResearch 19, 59-74.
Maddala, G. S., 1983, Limited-Dependent and Qualitative Variables in Econometrics, Cambridge,UK: University Press.
McConnell, J. J., H. J. Dybevik, D. Haushalter, and E. Lie, 1996, "A Survey of Evidence on Domesticand International Stock Exchange Listings with Implications for Markets and Managers," Pacific-Basin Finance Journal 4, 347-376.
Megginson, W. L. and K. A. Weiss, 1991, "Venture Capitalist Certification in Initial Public Offerings,"Journal of Finance 46, 879-903.
Merton, R., 1987, "Presidential Address: A Simple Model of Capital Market Equilibrium withIncomplete Information," Journal of Finance 42, 483-510.
Muscarella, C. and M. Vetsuypens, 1989, "The Underpricing of 'Second' Initial Public Offerings,"Journal of Financial Research 12, 183-192.

Nasdaq Stock Market, Inc., 1996, Going Public: The Nasdaq Stock Market.
New York Stock Exchange, Inc., 1996, Fact Book.
Ritter, J., 1987, "The Costs of Going Public," Journal of Financial Economics 19, 269-281.
Sanger, G. C. and J. D. Peterson, 1990, "An Empirical Analysis of Common Stock Delistings," Journalof Financial and Quantitative Analysis 25, 261-272.
Sanger, G. C., and J. J. McConnell, 1986, "Stock Exchange Listings, Firm Value, and Security MarketEfficiency: The Impact of Nasdaq," Journal of Financial and Quantitative Analysis 21, 1-25.
Securities and Exchange Commission, 1998, Release No. 34-39564, File No. SR-NYSE-97-30,January 20.
Wall Street Journal, 1999, "SEC Approves Revised Rule Easing Big Board Departures," July 22.
[Graph omitted]
[Graph omitted]
Listing Decision Criteria and RelatedEmpirical Predictions
The table summarizes the criteria that affect the initial listing decision. For each criteria, the secondcolumn lists related research and exchange regulations and the third column lists the associatedempirical predictions.
Criteria Related Research/Regulations
Initial Annual Listing Fees * NYSE Nasdaq Regulations
* Foucault and Parlour (1999)
Exchange Expertise and * Conventional Wisdom
Related-Firm Listings
Continued Listing Requirements * NYSE continued listing requirements,
and Expected Delisting Costs Sanger and Peterson (1990)
Visibility and Sponsorship * Merton (1987), Aggarwal and Angel
(1999)
Liquidity and Future Financing * Amihud and Mendelson (1986), Christie
and Huang (1994), Huang and Stoll
(1996), and Barclay (1997)

Criteria Empirical Predictions
Initial Annual Listing Fees * Negative relation between NYSE
listing and the difference in
listing fees across exchanges
* Large firms and large IPOs list
on the NYSE
Exchange Expertise and * Technology firms list on Nasdaq
Related-Firm Listings * Listings will cluster by industry
and firms will list on the exchange
where peer firms are listed
* Reverse LBOs will list on their
previous exchange
* Carveouts will list on the same
exchange as the parent firm
Continued Listing Requirements * Small firms, risky firms, and
and Expected Delisting Costs firms valued primarily from growth
options will list on Nasdaq
Visibility and Sponsorship * Small firms and young firms
will list on Nasdaq
Liquidity and Future Financing * Firms that expect to return
to the capital markets will
list on the NYSE
II. Minimum Listing Requirements and Sample Restrictions
Panel A lists the minimum listing requirements in effect during our sample period for domestic firmson the NYSE and Nasdaq National Market (NMS). Listing requirements are from the NYSE FactBook (1996) and Going Public: The Nasdaq Stock Market (Nasdaq, 1996). Panel B lists the datarestrictions used in the analysis to identity NYSE-eligible IPOs. We obtain these variables from theSecurities Data Company's Global New Issues database and the firm's S-1 filing. Pretax income is
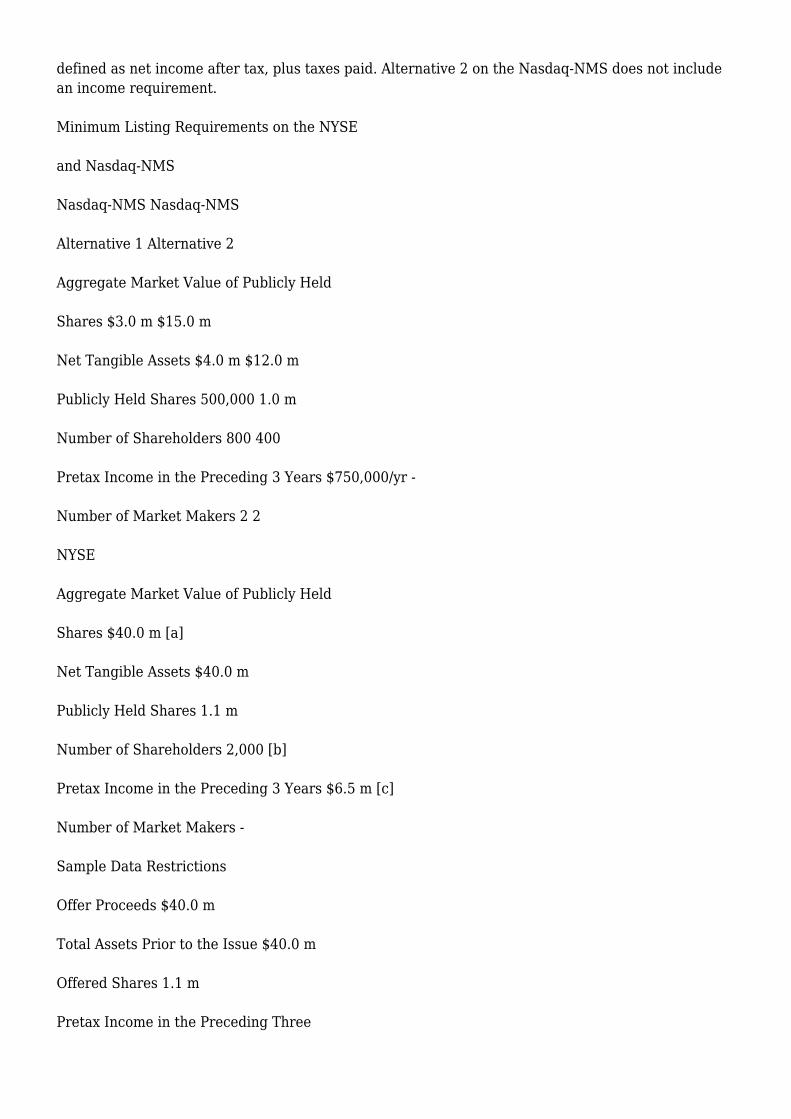
defined as net income after tax, plus taxes paid. Alternative 2 on the Nasdaq-NMS does not includean income requirement.
Minimum Listing Requirements on the NYSE
and Nasdaq-NMS
Nasdaq-NMS Nasdaq-NMS
Alternative 1 Alternative 2
Aggregate Market Value of Publicly Held
Shares $3.0 m $15.0 m
Net Tangible Assets $4.0 m $12.0 m
Publicly Held Shares 500,000 1.0 m
Number of Shareholders 800 400
Pretax Income in the Preceding 3 Years $750,000/yr -
Number of Market Makers 2 2
NYSE
Aggregate Market Value of Publicly Held
Shares $40.0 m [a]
Net Tangible Assets $40.0 m
Publicly Held Shares 1.1 m
Number of Shareholders 2,000 [b]
Pretax Income in the Preceding 3 Years $6.5 m [c]
Number of Market Makers -
Sample Data Restrictions
Offer Proceeds $40.0 m
Total Assets Prior to the Issue $40.0 m
Offered Shares 1.1 m
Pretax Income in the Preceding Three

Years $6.5 m [d]
(a.)The market value requirement was $18.0 million prior to January 2, 1996.
(b.)This requirement refers to 2,000 round-lot shareholders. Both markets have alternativeshareholder requirements for large, actively traded firms. These alternatives do not apply to IPOs.
(c.)The Nasdaq-NMS requires $750,000 in pretax income in two of the preceding three years,together with net income of $400,000 in two of the preceding three years. The NYSE restrictsconsideration to firms that have been in existence for at least three years. The $6.5 million incomerequirement must include either a) $4.5 million in preceding year and positive amounts in each ofthe two prior years, or b) $2.5 million in the preceding year and $2.0 m in each of the two prioryears. Firms with market capitalization greater than $500 million can satisfy the alternativerequirement of $200 million in revenues together with $25 million in net income.
(d.)Following the NYSE, we require either a) $4.5 million pretax income in the preceding year andpositive amounts in each of the prior two years, or b) $2.5 million in the preceding year and $2.0million in each of the two prior years.
Frequency of Initial Public Offerings by Exchange
The sample includes 438 firm-commitment IPOs between 1991 and 1996 that either listed on theNYSE, or met the NYSE's initial listing requirements, but chose to list on Nasdaq. Data are from theSecurities Data Company's Global New Issues database. Panel A lists frequencies for sample IPOs byyear. Panel B lists frequencies for sample IPOs based on offer proceeds; offer proceeds equal offerprice multiplied by offered shares (excluding overallotment options).
Frequency of IPOs by Year
Year NYSE Nasdaq Total
1991 40 16 56
(71.4%) (28.6%) (100%)
1992 65 14 79
(82.3%) (17.7%) (100%)
1993 64 19 83
(77.1%) (22.9%) (100%)
1994 46 11 57
(80.7%) (19.3%) (100%)
1995 45 13 58
(77.6%) (22.4%) (100%)
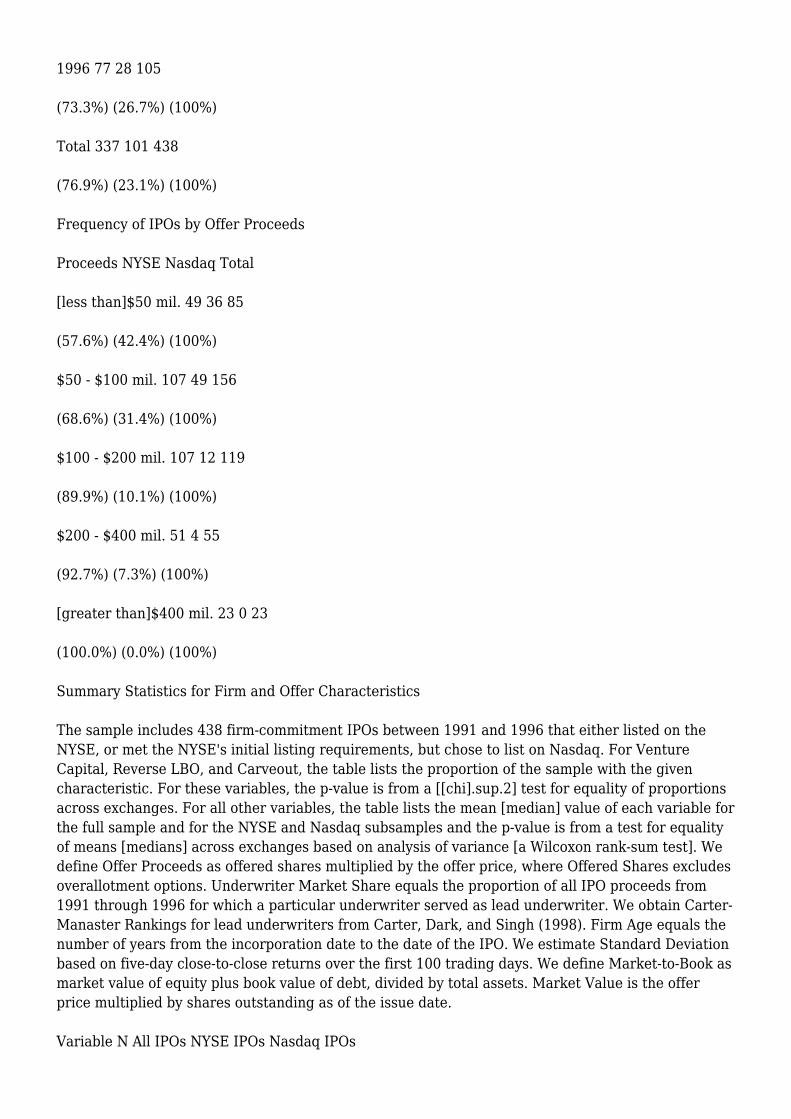
1996 77 28 105
(73.3%) (26.7%) (100%)
Total 337 101 438
(76.9%) (23.1%) (100%)
Frequency of IPOs by Offer Proceeds
Proceeds NYSE Nasdaq Total
[less than]$50 mil. 49 36 85
(57.6%) (42.4%) (100%)
$50 - $100 mil. 107 49 156
(68.6%) (31.4%) (100%)
$100 - $200 mil. 107 12 119
(89.9%) (10.1%) (100%)
$200 - $400 mil. 51 4 55
(92.7%) (7.3%) (100%)
[greater than]$400 mil. 23 0 23
(100.0%) (0.0%) (100%)
Summary Statistics for Firm and Offer Characteristics
The sample includes 438 firm-commitment IPOs between 1991 and 1996 that either listed on theNYSE, or met the NYSE's initial listing requirements, but chose to list on Nasdaq. For VentureCapital, Reverse LBO, and Carveout, the table lists the proportion of the sample with the givencharacteristic. For these variables, the p-value is from a [[chi].sup.2] test for equality of proportionsacross exchanges. For all other variables, the table lists the mean [median] value of each variable forthe full sample and for the NYSE and Nasdaq subsamples and the p-value is from a test for equalityof means [medians] across exchanges based on analysis of variance [a Wilcoxon rank-sum test]. Wedefine Offer Proceeds as offered shares multiplied by the offer price, where Offered Shares excludesoverallotment options. Underwriter Market Share equals the proportion of all IPO proceeds from1991 through 1996 for which a particular underwriter served as lead underwriter. We obtain Carter-Manaster Rankings for lead underwriters from Carter, Dark, and Singh (1998). Firm Age equals thenumber of years from the incorporation date to the date of the IPO. We estimate Standard Deviationbased on five-day close-to-close returns over the first 100 trading days. We define Market-to-Book asmarket value of equity plus book value of debt, divided by total assets. Market Value is the offerprice multiplied by shares outstanding as of the issue date.
Variable N All IPOs NYSE IPOs Nasdaq IPOs

Offer Characteristics
Offer Proceeds ($m) 438 148.21 169.96 75.64
[90.00] [186.70] [62.10]
Offered Shares (m) 438 8.26 9.27 4.89
[5.60] [6.12] [4.00]
Offer Price 438 16.86 17.31 15.36
[16.00] [17.00] [15.00]
Underwriter Market Share (%) 438 7.32 7.88 5.45
[4.81] [6.02] [3.95]
Carter-Manaster Ranking 425 8.81 8.83 8.77
[8.88] [8.88] [8.83]
Firm Characteristics
Total Assets ($m) 438 1607.45 2003.33 286.41
[365.81] [485.14] [181.80]
Market Value ($m) 438 547.00 638.34 242.23
[299.42] [349.20] [176.29]
Firm Age 433 18.55 20.38 12.34
[6.00] [6.00] [6.00]
Standard Deviation (%) 438 6.10 5.86 6.91
[5.77] [5.51] [6.71]
Market-to-Book 438 1.69 1.67 1.76
[1.41] [1.37] [1.57]
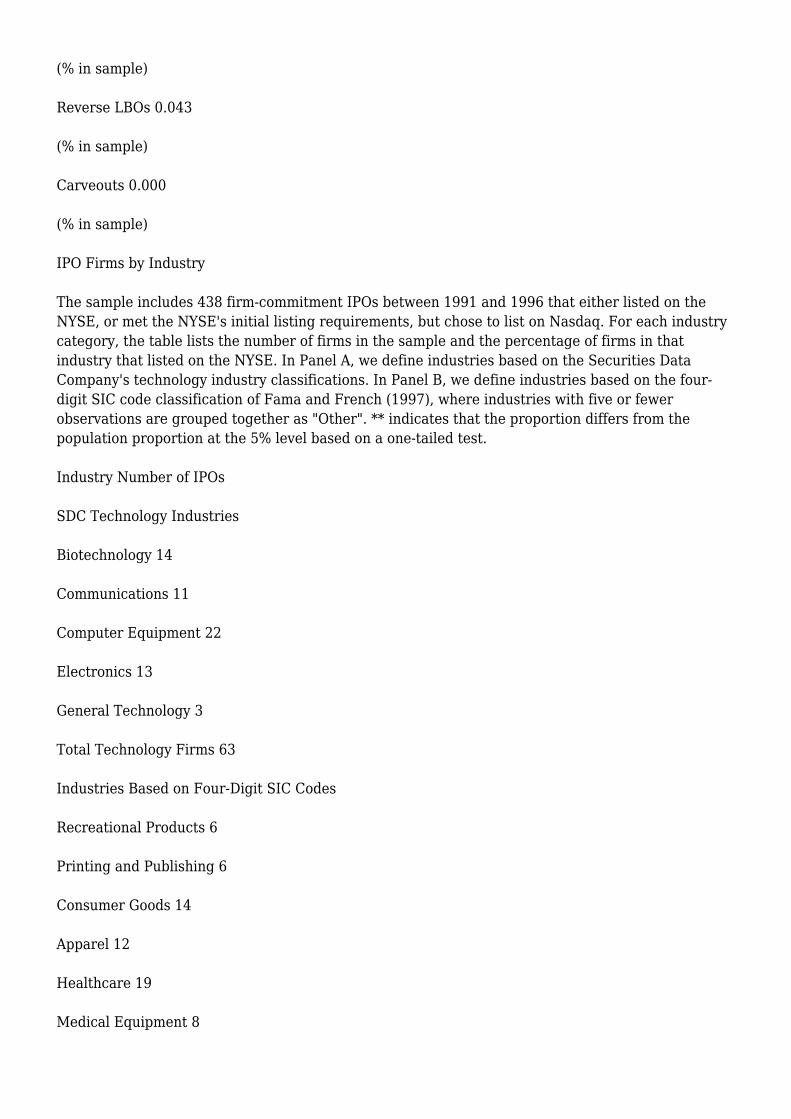
Venture Capital 438 21.69 21.96 20.79
(% in sample)
Reverse LBOs 438 16.44 18.40 9.90
(% in sample)

Carveouts 438 19.63 23.44 6.93
(% in sample)
Variable p-value
Offer Characteristics
Offer Proceeds ($m) 0.000
[0.000]
Offered Shares (m) 0.000
[0.000]
Offer Price 0.000
[0.000]
Underwriter Market Share (%) 0.000
[0.000]
Carter-Manaster Ranking 0.182
[0.002]
Firm Characteristics
Total Assets (Sm) 0.018
[0.000]
Market Value ($m) 0.000
[0.000]
Firm Age 0.014
[0.186]
Standard Deviation (%) 0.000
[0.000]
Market-to-Book 0.431
[0.005]
Venture Capital 0.803
(% in sample)
Reverse LBOs 0.043
(% in sample)
Carveouts 0.000
(% in sample)
IPO Firms by Industry
The sample includes 438 firm-commitment IPOs between 1991 and 1996 that either listed on theNYSE, or met the NYSE's initial listing requirements, but chose to list on Nasdaq. For each industrycategory, the table lists the number of firms in the sample and the percentage of firms in thatindustry that listed on the NYSE. In Panel A, we define industries based on the Securities DataCompany's technology industry classifications. In Panel B, we define industries based on the four-digit SIC code classification of Fama and French (1997), where industries with five or fewerobservations are grouped together as "Other". ** indicates that the proportion differs from thepopulation proportion at the 5% level based on a one-tailed test.
Industry Number of IPOs
SDC Technology Industries
Biotechnology 14
Communications 11
Computer Equipment 22
Electronics 13
General Technology 3
Total Technology Firms 63
Industries Based on Four-Digit SIC Codes
Recreational Products 6
Printing and Publishing 6
Consumer Goods 14
Apparel 12
Healthcare 19
Medical Equipment 8

Chemicals 9
Textiles 6
Construction 7
Steel Works, etc. 13
Machinery 13
Electrical Equipment 6
Automobiles and Trucks 12
Petroleum and Natural Gas 14
Utilities 8
Telecommunications 12
Business Services 32
Computers 7
Electronic Equipment 12
Business Supplies 10
Transportation 17
Retail 61
Restaurants, Hotel, Motel 15
Banking 17
Insurance 50
Trading 7
Other 45
Total IPOs 438
Industry % NYSE-Listed
SDC Technology Industries
Biotechnology 85.7
Communications 54.5

Computer Equipment 54.5 [**]
Electronics 76.9
General Technology 66.7
Total Technology Firms 66.7 [**]
Industries Based on Four-Digit SIC Codes
Recreational Products 83.3
Printing and Publishing 83.3
Consumer Goods 92.9
Apparel 100.0
Healthcare 63.2
Medical Equipment 100.0 [**]
Chemicals 77.8
Textiles 83.3
Construction 85.7
Steel Works, etc. 92.3
Machinery 76.9
Electrical Equipment 100.0
Automobiles and Trucks 75.0
Petroleum and Natural Gas 100.0 [**]
Utilities 87.5
Telecommunications 66.7
Business Services 71.9
Computers 42.9
Electronic Equipment 66.7
Business Supplies 50.0
Transportation 41.2 [**]
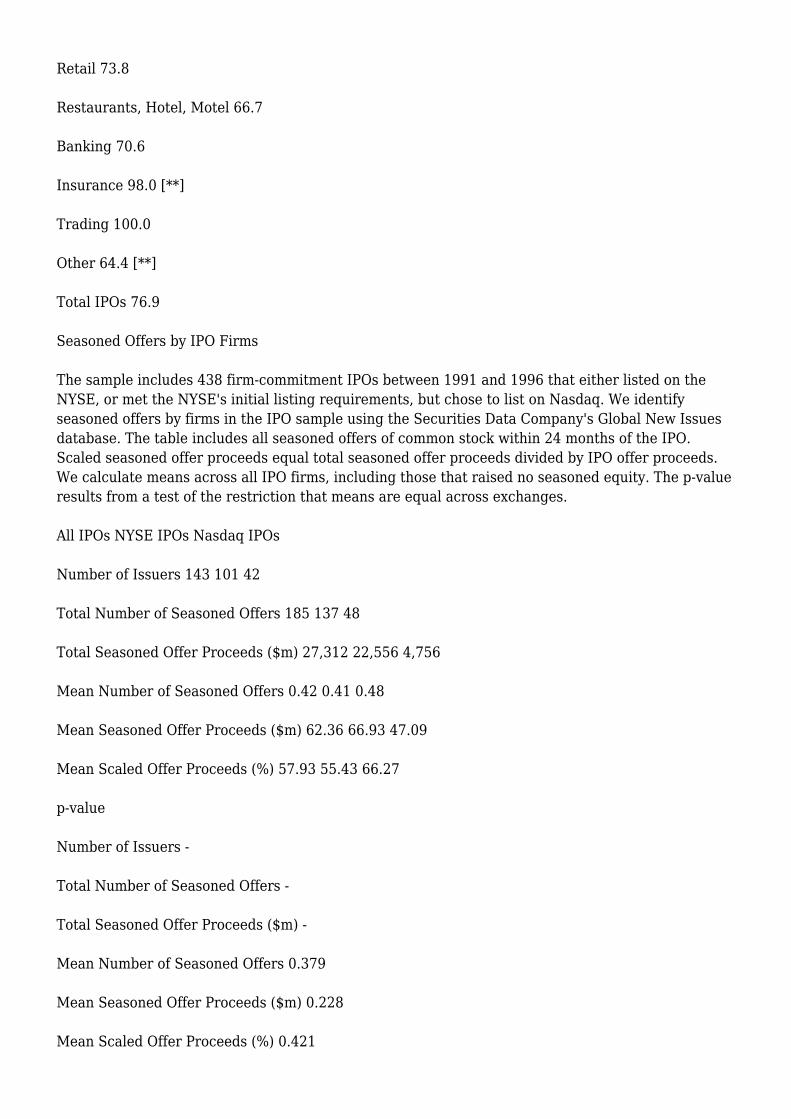
Retail 73.8
Restaurants, Hotel, Motel 66.7
Banking 70.6
Insurance 98.0 [**]
Trading 100.0
Other 64.4 [**]
Total IPOs 76.9
Seasoned Offers by IPO Firms
The sample includes 438 firm-commitment IPOs between 1991 and 1996 that either listed on theNYSE, or met the NYSE's initial listing requirements, but chose to list on Nasdaq. We identifyseasoned offers by firms in the IPO sample using the Securities Data Company's Global New Issuesdatabase. The table includes all seasoned offers of common stock within 24 months of the IPO.Scaled seasoned offer proceeds equal total seasoned offer proceeds divided by IPO offer proceeds.We calculate means across all IPO firms, including those that raised no seasoned equity. The p-valueresults from a test of the restriction that means are equal across exchanges.
All IPOs NYSE IPOs Nasdaq IPOs
Number of Issuers 143 101 42
Total Number of Seasoned Offers 185 137 48
Total Seasoned Offer Proceeds ($m) 27,312 22,556 4,756
Mean Number of Seasoned Offers 0.42 0.41 0.48
Mean Seasoned Offer Proceeds ($m) 62.36 66.93 47.09
Mean Scaled Offer Proceeds (%) 57.93 55.43 66.27
p-value
Number of Issuers -
Total Number of Seasoned Offers -
Total Seasoned Offer Proceeds ($m) -
Mean Number of Seasoned Offers 0.379
Mean Seasoned Offer Proceeds ($m) 0.228
Mean Scaled Offer Proceeds (%) 0.421

Probit Model for Exchange Listing
The table lists the coefficients (p-values) from a probit model of the initial listing decision. Thesample includes 438 firm-commitment IPOs between 1991 and 1996 that either listed on the NYSE,or met the NYSE's initial listing requirements, but chose to list on Nasdaq. The dependent variableequals one if the IPO listed on the NYSE, and zero if the IPO listed on Nasdaq. We define MarketValue as shares outstanding after the offer multiplied by the offer price. NYSE Industry MarketShare equals the number of NYSE-listed firms in the same industry as the IPO, divided by the totalnumber of Nasdaq and NYSE-listed stocks in that industry as of December 31st in the year prior tothe IPO. We define industries as in Fama and French (1997). Standard Deviation is calculated usingfive-day close-to-close returns over the first 100 trading days. Market-to-Book is market value ofequity, plus book value of debt, divided by total assets. Seasoned Offer Proceeds is the total dollaramount of seasoned offers within 24 mo nths of the IPO scaled by IPO offer proceeds. TechnologyFirm is a dummy variable equal to one if the firm is in one of the Securities Data Company'stechnology industries. We define reverse LBO and carveout dummy variables according to whetheror not the firm or parent firm was listed on the NYSE prior to the issue. Firm Age equals the numberof years from the incorporation date to the IPO. We define first-year listing fees as the sum of theinitial listing fee and the first year's annual listing fee, divided by offer proceeds. Listing FeeDifference equals the difference in first-year percentage listing fees between the NYSE and Nasdaq.The [[chi].sup.2]-statistic (p-value) results from a test of the restriction that all industry dummyvariable coefficients equal zero.
1 2 3 4
Intercept -2.129 -1.508 -1.180 -1.567
(0.000) (0.007) (0.042) (0.010)
Ln (Market Value) 0.515 0.542 0.447 0.443
(0.000) (0.000) (0.000) (0.000)
Standard Deviation - -0.102 -0.095 -0.088
(0.001) (0.005) (0.010)
Market-to-Book - -0.099 -0.065 -0.034
(0.184) (0.409) (0.675)
Firm Age - 0.005 0.004 0.004
(0.135) (0.249) (0.279)
Seasoned Offer Proceeds - -0.036 -0.032 -0.020
(0.550) (0.606) (0.756)
Listing Fee Difference - 0.062 -0.057 -0.277
(0.957) (0.962) (0.817)

LBO*[PrevExchange.sub.NonNYSE] - - -0.380 -0.359
(0.243) (0.271)
LBO*[PrevExchange.sub.NYSE] - - 0.806 0.835
(0.011) (0.008)
Carveout*[Parent.sub.NonNYSE] - - -0.275 -0.268
(0.554) (0.570)
Carveout*[Parent.sub.NYSE] - - 0.824 0.867
(0.006) (0.005)
NYSE Industry MktShr - - - 0.955
(0.040)
Technology Firm - - - -
Industry Dummy Variables No No No No
Industry [[chi].sup.2] (p-value) - - - -
N 438 433 433 433
Pseudo-[R.sup.2] 0.0869 0.1407 0.1795 0.1886
5 6
Intercept -1.295 -1.981
(0.026) (0.004)
Ln (Market Value) 0.467 0.492
(0.000) (0.000)
Standard Deviation -0.089 -0.059
(0.009) (0.143)
Market-to-Book -0.043 -0.088
(0.596) (0.379)
Firm Age 0.004 0.004
(0.265) (0.391)

Seasoned Offer Proceeds -0.019 0.016
(0.763) (0.821)
Listing Fee Difference -0.131 -0.365
(0.913) (0.784)
LBO*[PrevExchange.sub.NonNYSE] -0.378 -0.605
(0.242) (0.119)
LBO*[PrevExchange.sub.NYSE] 0.829 0.930
(0.010) (0.008)
Carveout*[Parent.sub.NonNYSE] -0.194 -0.293
(0.683) (0.584)
Carveout*[Parent.sub.NYSE] 0.813 0.985
(0.007) (0.003)
NYSE Industry MktShr - -
Technology Firm -0.459 -
(0.026)
Industry Dummy Variables No Yes
Industry [[chi].sup.2] (p-value) - 63.032
(0.000)
N 433 433
Pseudo-[R.sup.2] 0.1898 0.3138
Summary Statistics for Issue Costs
The sample includes 438 firm-commitment IPOs between 1991 and 1996 that either listed on theNYSE, or met the NYSE's initial listing requirements, but chose to list on Nasdaq. The table lists themean [median] value of each variable for the full sample and the NYSE and Nasdaq subsamples. Thep-value results from a test for equality of means [medians] across exchanges based on analysis ofvariance [a Wilcoxon rank-sum test]. We define Underpricing as (first day closing price - offerprice)/offer price. Underwriter Spread equals the difference between the offer price and the pricepaid to the issuing firm. Other Expenses include costs (excluding the underwriter spread) paid bythe issuer, such as legal and auditing expenses and listing and registration fees. SDC data for otherexpenses is missing for eight IPOs. We define Total Direct Costs as the sum of underwriter spreads

and other expenses. Total Direct and Indirect Costs equal the sum of underpricing, underwriterspreads, and other expenses. We state all ex penses as a percentage of offer proceeds.
Variable N All IPOs NYSE IPOs Nasdaq IPOs p-value
Direct Issue Costs:
Underwriter Spread (%) 438 6.36 6.23 6.78 0.000
[6.50] [6.25] [7.00] [0.000]
Other Expenses (%) 430 1.57 1.56 1.60 0.830
[1.21] [1.11] [1.48] [0.004]
Total Direct Costs (%) 430 7.94 7.80 8.38 0.003
[7.75] [7.51] [8.39] [0.000]
Underpricing (%) 438 10.02 9.33 12.32 0.047
[6.25] [5.88] [7.93] [0.212]
Total Issue Costs (%) 430 17.99 17.15 20.70 0.021
[14.00] [13.60] [15.67] [0.040]
Issue Cost Regressions
The table lists the coefficients (p-values) from OLS regressions of issue costs on firm and offercharacteristics. The sample includes 438 firm-commitment IPOs between 1991 and 1996 that eitherlisted on the NYSE, or met the NYSE's initial listing requirements, but chose to list on Nasdaq.Direct Costs include underwriter spreads and other expenses. Underwriter Spread equals thepercentage difference between the offer price and the price paid to the issuing firm. Other Expensesinclude legal and auditing expenses, listing and registration fees, and other expenses paid by theissuer. SDC data for other expenses is missing for eight IPOs. Total Costs is the sum of direct costsand underpricing. We define Underpricing as (first day closing price - offer price)/offer price. Westate all costs as a percentage of offer proceeds. We define Offer Proceeds as offered shares(excluding overallotment options) multiplied by the offer price. Aftermarket Standard Deviationequals the standard deviation of five-day close-to -close returns over the first 100 trading days.Underwriter (UW) Market Share equals the proportion of all IPO proceeds from 1991 through 1996for which a particular underwriter served as lead underwriter. Venture-Backed is a dummy variablethat equals one if the IPO was backed by venture capital and zero otherwise. Reverse LBO andCarveout are dummy variables that equal one if the IPO is associated with a reverse LBOs orcarveout, respectively. NYSE is a dummy variable that equals one if the IPO listed on the NYSE andzero otherwise. p-values appear in parentheses.
Gross Other Total Direct
Spread Expenses Costs Underpricing

Intercept 9.618 5.822 15.441 -3.445
(0.000) (0.000) (0.000) (0.439)
Ln (Offer Proceeds) -0.676 -1.016 -1.693 0.281
(0.000) (0.000) (0.000) (0.752)
UW Market Share 0.004 -0.001 0.003 0.278
(0.234) (0.929) (0.808) (0.020)
Standard Deviation 0.001 0.010 0.011 1.915
(0.938) (0.716) (0.699) (0.000)
Venture-Backed 0.027 0.061 0.091 1.105
(0.428) (0.667) (0.533) (0.462)
Reverse LBO -0.142 -0.301 -0.454 -3.980
(0.000) (0.058) (0.005) (0.017)
Carveout -0.125 -0.002 -0.126 0.000
(0.004) (0.987) (0.435) (0.999)
NYSE -0.162 0.544 0.381 -1.476
(0.000) (0.000) (0.009) (0.332)
N 438 430 430 438
Adj. [R.sup.2] 0.7743 0.2965 0.5389 0.1119
Total Direct and

Indirect Costs
Intercept 12.441
(0.006)
Ln (Offer Proceeds) -1.521
(0.094)
UW Market Share 0.294
(0.016)
Standard Deviation 1.120
(0.000)
Venture-Backed 1.218
(0.427)
Reverse LBO -4.484
(0.009)
Carveout -0.283
(0.867)
NYSE -1.031
(0.503)
N 430
Adj. [R.sup.2] 0.1270
COPYRIGHT 2001 Financial Management Association
No portion of this article can be reproduced without the express written permission from thecopyright holder.
Copyright 2001 Gale, Cengage Learning. All rights reserved.
http://www.thefreelibrary.com/The+Initial+Listing+Decisions+of+Firms+That+Go+Public.-a075481855