the bpex yearbook 2014-2015 - ahdb porkpork.ahdb.org.uk/media/73777/bpex-yearbook-2015.pdfthe bpex...
TRANSCRIPT

The BPEX Yearbook 2014-2015Key industry statistics, pig performance data and details of
knowledge transfer, research and development activity

Vision:A growing English pig production and primary processing industry.
Mission:To help English pig production and processing businesses become more competitive and profitable.
‘‘
’’
The BPEX Yearbook 2014-2015

Contents
ContentsVision and mission statements
Preface 4
BPEX board 5
Strategy and budget 6
Pork promotion 8
Meet the BPEX team 10
BPEX by numbers 2014-2015 12
Industry statistics 14
International cost of pig production 20
Cost of production 25
Technical performance data 27
Technical 40
Skills and training 41
Study tours 44
Innovation fund 45
Field trials 46
Research 48
Health 48
Welfare 55
Environment 56
Production efficiency 63
Pork safety and product quality 66
Events 68
Tools 69
The BPEX Yearbook 2014-2015 3

4 The BPEX Yearbook 2014-2015
Preface
Those forces mean competing in Europe isthe major challenge we are facing, against a background of lower prices and a weak Euro.
The main factor which resulted in the pricepressure faced by British producers is theRussian ban on imports from across the EU,firstly as the result of African Swine Fever inEastern Europe and then the embargo on imports from NATO and other countries. Thiscaused a substantial drop in EU prices.
The situation regarding Ukraine in paricularseems unlikely to be resolved quickly, leaving a lasting challenge as the analysis inthe following pages of this yearbook clearlyshows.
On a more positive note, the industry as awhole has already made great strides in productivity and the work to improve stillfurther must continue.
Overall, the industry has had tremendous support from retailers, processors and withinexport markets, which have all made an important contribution to maintaining ourpremium over the prices in mainland Europe.
That premium has, however, narrowed in recent months. At its peak in January thisyear (2015) it was at about 40p a kilo but byspring 2015 was down to less than 30p.
Despite this, we have continued to improve,which means we are now producing morepork than at any time since 2000.
We have to maintain the support of consumers within the UK market. This meansstimulating consumption among new consumers and providing them with innovative ways of cooking some of the lesspopular cuts such as shoulder, of which wehave a surplus.
We also need to continue to exploit exportmarkets, working to increase the range ofcuts and the number of firms involved, particularly in greater China, which is nowour largest market.
Exports overall are worth something in the region of £350 million, with about a quarterof that going to the Far East. The value of exports now accounts for about 30p per kiloof each pig produced, which gives an indication of just how important they are.
The industry is facing a constant challenge tofind new opportunities overseas, both opening markets and developing them. Thismeans we have to find a way of competing inthe medium and long term with a relativelystrong currency.
If we continue to improve our productivity aswe have been, we will be in a better competitive position when the exchangerates move in our favour. This and the promotion of pork consumption will be a priority for BPEX in the coming months andyears •
Preface
Mick Sloyan
Director
BPEX
Politics and pig disease have joinedforces and had ahuge impact on thepig industry overthe last year, moreso than any otheryear.
’

The BPEX Yearbook 2014-2015 5
BPEX board
BPEX board
Stewart Houston Alastair Butler Robert Shepherd Ian Smith Richard HooperChairman Blythburgh Free Range Pork Bedfordia Farms Ltd Harper Adams
Microware Pig Systems
Producers
The BPEX Board meets six times a year to determine the English pig industry strategy and to ensure that English pig levy payers’ money is efficiently deployed in line with the BPEX strategy.
The BPEX Board for the period 2014-2015 comprised the following Directors appointed by Defra.
Marcus Cheale Barry Lock Andrew Saunders William de KleinCheale Meats of Brentwood Cranswick Tulip UK KARRO Food Group
Processors
Iain Wylie
Independent
Simon Watchorn Rob Mercer Jon Easey Richard LongthorpJoined in January 2015 Packington Pork MJ & JA Easey LKL Farming

6 The BPEX Yearbook 2014-2015
Strategy and budget
In 2014, the BPEX Board agreed the ‘Goingfor Growth’ strategy. This refocused the technical work of BPEX into a single teamoperating in four strategic areas of activity.The marketing strategy has also been developed to focus more on rejuvenating theimage of pork as a means to stimulating demand and maintaining the premium forEnglish pigs.
This report reviews the first full year of delivery of the technical element within the‘Going for Growth’ strategy and the businessplan for the continued delivery of the strategy in 2015-16.
The 5-Point PlanThe 5-Point Plan was detailed in the 2013-2014 Yearbook and is available onthe BPEX website. In summary, it focuseson the following key areas of activity.
1. Close the gap
Objective: To narrow the technical performance gap between English pig producers and competitors.
• Establish a field trials programme
• Identify innovation from around the worldand disseminate to pig producers
• Develop skills under the banner ‘Recruit, Retain, Reward’, recognising professional development of staff and demonstrating a skilled and attractive career path
• Minimise the risks from endemic and exotic disease by establishing effective biosecurity tools and technologies
• Set up regional technical forums.
2. Protect the environment
Objective: Help pig producers and processorscomply with existing and emerging legislation and achieve recognition forprogress made.
• Set up a business support service to advise on reducing environmental impact,compliance with planning rules and environmental regulations
• Monitor, interpret and help to inform environmental policy and regulations in both the UK and EU
• Capture the progress made by the English pig industry and help to ensure this is communicated effectively.
3. Enhance pig welfare
Objective: Help pig producers comply withexisting and emerging legislation and achieverecognition for progress made in reducing environmental impact.
• Support the development of Real Welfare as part of farm assurance
• Develop the communication of welfare measures to producers and vets
• Develop support packages to help producers and vets enhance pig welfare
• Monitor, interpret and seek to inform developments in welfare regulations in conjunction with industry representative organisations.
Strategy and budget
Vision:
‘A growing English pig production and primary processing
industry.’
Mission:
‘To help English pig production and processing businesses become more competitive and profitable.’
Recruit, Retain,Reward.Raising the professionalism and skills of the English pig industry

Strategy and budget
The BPEX Yearbook 2014-2015 7
4. Encourage safe and traceable pork
Objective: Help producers and processors produce pork that continues to be safe andwhich consumers can have confidence is fullytraceable from farm to finished product.
• Support the pig meat supply chain in producing wholesome pork products with safety, provenance and integrity, from farm to fork
• Promote the use of isotope tracing using the SIRA (Stable Isotope Reference Analysis) tool through the supply chain
• Work with RUNA and the PVS to reduce the need to use antimicrobials
• Set up a technical processor forum on food safety and traceability.
5. Help to sell more pork
Objective: Stimulate the demand for porkthrough communication of the benefits ofchoosing pork and securing and developingexport markets.
• Rejuvenate the image of pork
• Differentiate from the competition
• Communicate the health benefits of pork
• Communicate pork as an environmentally sustainable food.
Resources
BPEX resources are almost exclusively provided from the levy on producers andprocessors, which will remain at 85p a pig for producers and 20p a pig for processors, applied to pigs slaughtered in England.
Summary budget 2015-16
Monitoring the progress of the strategy
The BPEX board assess the progress in achieving the strategy on a regular basis, concentrating on a number of target areas, including:
• Improvements in Key Performance Indicators (KPIs)
• Reducing the industry’s carbon footprint
• Monitoring the progress of Real Welfare
• Developing the use of SIRA to enhance thetraceability of pork
• Increasing the consumption, particularly among light and medium users
• Tracking levy payer feedback, particularly with regard to delivering value for money
• Continuing to expand our export markets.
Close the Gap
Environment
Welfare
Safe and Traceable
Technical and Corporate Comms
Market Intelligence
Marketing
Exports
Brussels
BPEX Support
AHDB Overheads
£470£80
£410
£690 £1,190£315
£175
£1,105
£575£651
£3,850
Budget allocation in 2015-2016 (£’000)

Pork promotion
The BPEX marketing team remains instrumental in promoting pork to consumersand informing key stakeholders – from supermarket buyers to levy payers – of theexciting activity and campaigns taking placeacross the industry.
One such high profile campaign, BritishSausage Week, continues to prove hugelysuccessful, generating widespread industry support, with promotional activity takingplace in retailers and catering outlets nationwide. In addition, some 200 retailersand butchers entered the dedicated competition, with a further 230 varietiesjudged across five categories in the foodservice sector, demonstrating industryinnovation and giving organisations a platform to boost their business.
The BPEX marketing team also produces anarray of material to drive consumer awareness to promote the benefits of variouspork cuts and products. The versatility ofgammon was a focus in 2014, with a
‘Glorious Gammon’ recipe brochure, whichincluded contributions from a host of highprofile chefs. The simple recipe ideas showcased the versatility of gammon, withthe aim of increasing sales beyond Christmasand to demonstrate how it can be enjoyedyear round.
All activity is supported online via the LovePork website, which contains hundreds ofconsumer-friendly recipes, as well as health-based facts and information about theRed Tractor scheme. Interaction is driven by astrong presence on social media sites,including Facebook and Twitter, supported bytargeted foodie blogger activity.
From May, TV advertising, supported by in-store and online activity, will kick-off the‘Pulled Pork’ campaign, which is specificallytargeting the 25-55 age group.
For the industry, as well as stimulating demand for pork shoulder and adding valueto the carcase, it will give pork a fresh imageupon which everyone can capitalise •
Pork promotion
During Sausage Week(3-9 November),BPEX joined forceswith Rugby WorldCup winner and former England international PhilVickery, to drive extensive media andconsumer awarenessfor premium and RedTractor assured varieties. As a result,during the campaignweek, sales of premium sausages increased by 6% compared to theweekly average.
8 The BPEX Yearbook 2014-2015
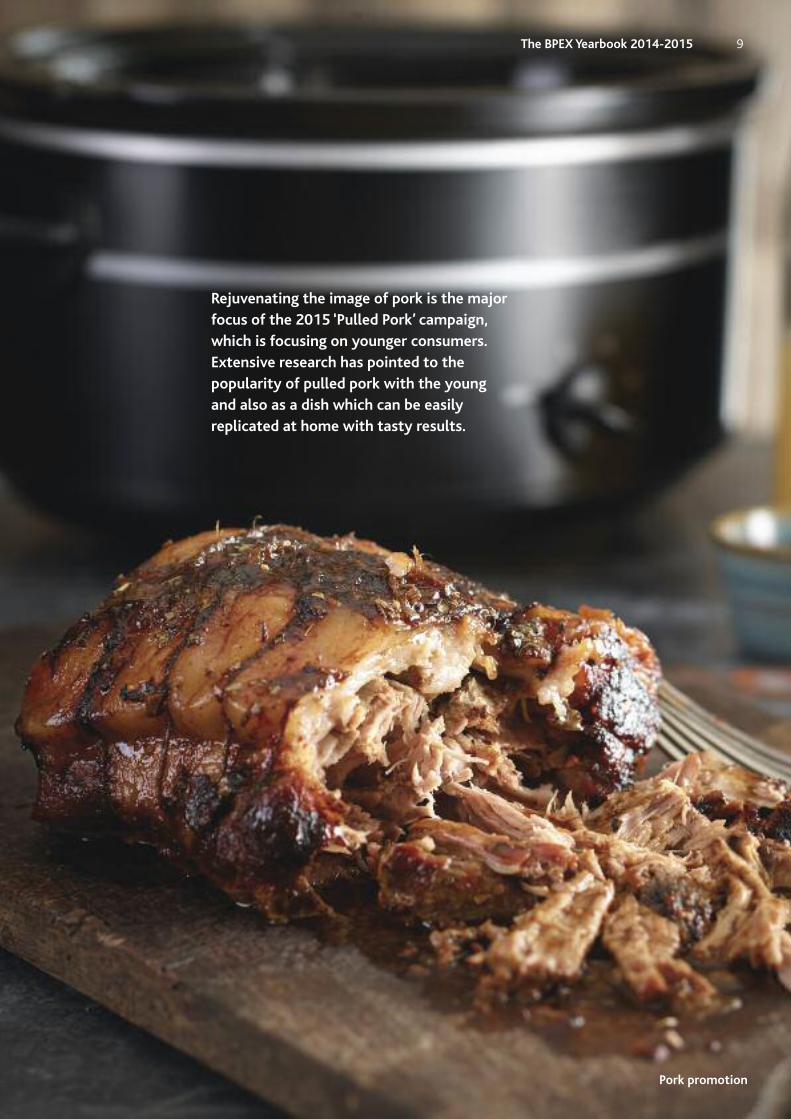
Rejuvenating the image of pork is the majorfocus of the 2015 ‘Pulled Pork’ campaign,which is focusing on younger consumers. Extensive research has pointed to the popularity of pulled pork with the youngand also as a dish which can be easily replicated at home with tasty results.
Pork promotion
The BPEX Yearbook 2014-2015 9

Meet the BPEX team
Mick SloyanDirector
024 7647 8791
Kate SaundersPA to Director024 7647 8790
Kirsty WalkerHead of Marketing
024 7647 8803
Jane ChapmanFood Chain Team Manager
07810 658 741
Maureen Strong Dietician Advisor 024 7647 8808
Keith FisherMaster Butcher07966 753 535
Stephen FarmerCommunications Team
Manager (Campaigns) 07748 110 959
Carrie McdermidBrand Manager07976 465 504
Jane CharlesworthCommunications Manager
07773 076 162
Julie DickinsonTeam Administrator
024 7647 8807
Peter Hardwick International Manager
024 7647 8857
Kathy Roussel Head of Brussels Office
0032 223 08668
Jean-Pierre Garnier Export Manager024 7647 8617
Susana MorrisExport Marketing Executive
024 7647 8618
Jonathan Eckley Export Marketing Executive
024 7647 8859
Claudine Collin Export Project
Budget Controller0032 223 08668
**
* Staff who work for EBLEX and BPEX lines of reporting lines of communicationCorrect as of April 2015
*
*
*
*
*
*
Meet the BPEX team
10 The BPEX Yearbook 2014-2015

Andrew KnowlesHead of Technical
024 7647 8810
Clancy SmithTechnical Team Senior Administrator
024 7647 8792
Steve WinfieldKnowledge Transfer
Team Lead07891 656 784
Charlotte WestTechnical Innovation
Manager07813 430 605
Nigel PenlingtonEnvironment andBuilding Manager
024 7647 8797
Helen BrothwellTechnical Communications
Manager 024 7647 8813
Martin SmithVeterinary Team
Manager024 7647 8977
Andrew PalmerKnowledge Transfer
Manager • East07976 443 454
Kate MellorKnowledge Transfer
Manager • South07973 701 202
Richard BowsKnowledge Transfer
Manager • North07816 941 223
Angela CliffKnowledge Transfer Manager • Midlands
07967 788 484
Peter DunneField Trials Coordinator
024 7647 8717
Sam BowsherSkills Development
Coordinator024 7647 8801
Sue WickhamKT and Innovation Team
Senior Administrator024 7647 8793
Thomas BurlingEnvironment and
Building Business Support
024 7647 8688
Sue RabbichEnvironment and
Building ResearchCoordinator
024 7647 8798
Jon BullockIndustry Communications
Officer024 7647 8811
Alaina ArnoldWebsite Coordinator
024 7647 8812
Miriam DrewettTechnology Coordinator
024 7647 8794
Jenny NewmanDatabase Coordinator
024 7647 8742
Katja StoddartHealth & Welfare
Projects Coordinator (PT)024 7647 8796
Lorna DawsonReal Welfare Project
Coordinator07527 778 055
Ouafa DoxonHealth Information and
Food Safety Coordinator024 7647 8802
Cheryl BakerHealth & Welfare
Project Administrator024 7647 8893
Dorothy BradyHealth & Welfare
Project Administrator024 7647 8799
Meet the BPEX team
The BPEX Yearbook 2014-2015 11

BPEX by numbers
12 The BPEX Yearbook 2014-2015
BPEX by numbers 2014-2015
193 farm visits conducted by the KT team
373 delegates attended conferences
3,212 training hours delivered
998 twitter followers
5 PhD studentships sponsored by BPEX
6 scholarship placements awarded
2,154 publications and on-farm tools requested
9% increase in volume of premiumsausages sold during British Sausage Week
Improvements in pigs weaned overthe last 12 months: 0.5
Improvement in FCR over the last 12 months: 0.11
Change in DLWG over the last 12 months: -15g

BPEX by numbers
The BPEX Yearbook 2014-2015 13

Industry statistics
14 The BPEX Yearbook 2014-2015
Industry statisticsActivities undertaken by the Market Intelligence function focus on both the supply and demand side of the industry andinclude the following:
• The collection and calculation of weekly pig, pig meat and other red meat price data and market information
• The production of accurate market forecasts of meat production and consumption
• The collection and provision of average pig production costs and performance measurement
• The publication of relevant market information and analysis from the UK, EU and beyond through regular free publications, the BPEX website and othermedia
• The collation and publication of international cost and physical performance comparisons, which are addressed through the InterPIG project
• Enabling BPEX marketing activity to be based on a sound knowledge of themarket through consumer research.
The following sections of the report aim to
summarise some of the key market statisticsand performance trends from the last year.
Costs of production
According to data from InterPIG, the cost ofpig meat production in Great Britain increased by four per cent in 2013, to£1.59/kg. The average cost of production inthe EU was £1.56/kg deadweight, a six percent increase in sterling terms. However, GBproduction costs decreased during the courseof 2013 and for most of 2014, to end theyear at their lowest point in more than fouryears. Based on provisional estimates, average costs in 2014 were significantlylower than in 2013.
GB pig prices peaked in late 2013 at over170p/kg. However, barring a brief seasonalrise in the spring, prices then fell throughout2014. The GB All Pig Price (APP), which replaced the previous price series the DAPPduring 2014, ended the year at just over145p/kg, the lowest price since early 2012.Despite this, costs remained below pricesthroughout 2014, allowing producers torecover many of their losses from the preceding years. However, by the end of the
The objective of AHDB Market Intelligence (MI) is to provide relevant, useful, accurate andtimely market information to theEnglish pig and allied industries. Thisshould support themin understanding themarket and makingdecisions that maximise their competitiveness andsustainability and also improve supplychain transparency.
Figure 1 Total cost of pig production compared with pig prices
Source: AHDB Market Intelligence
Industry statistics
The BPEX Yearbook 2014-2015 15
year, prices and costs were close together andfurther pig price falls in early 2015 will havetaken many producers back into the red.
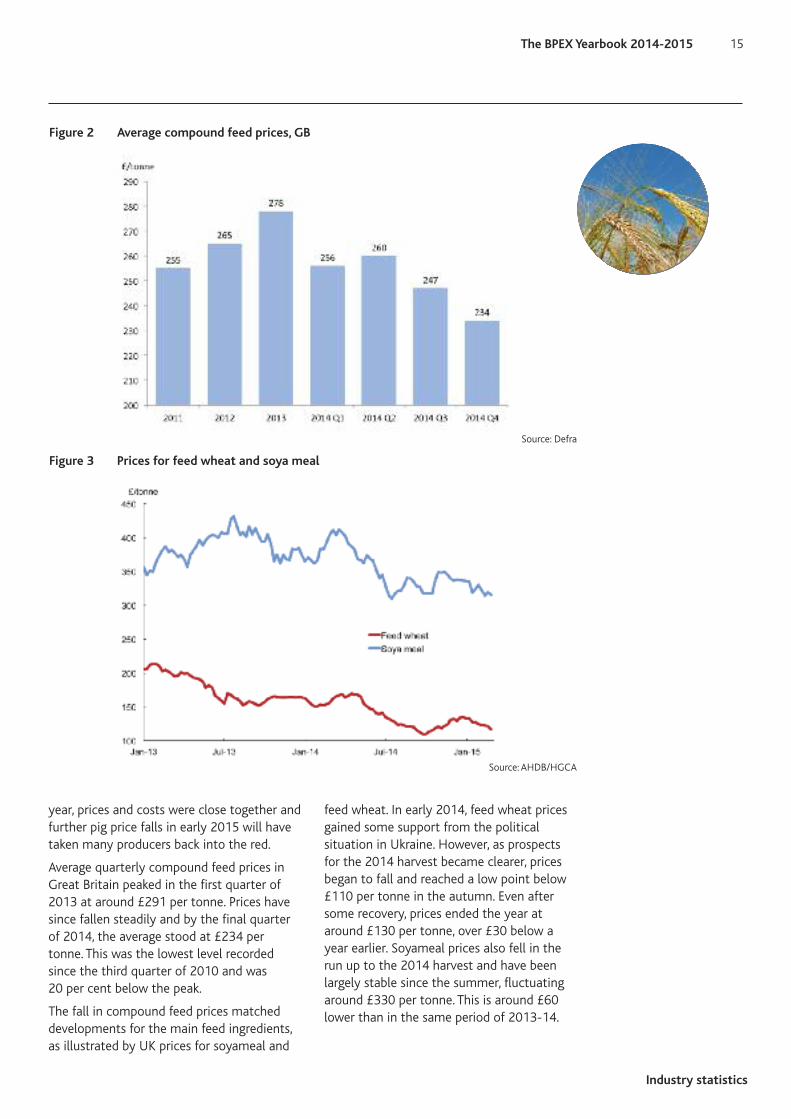
Average quarterly compound feed prices inGreat Britain peaked in the first quarter of2013 at around £291 per tonne. Prices havesince fallen steadily and by the final quarterof 2014, the average stood at £234 pertonne. This was the lowest level recordedsince the third quarter of 2010 and was 20 per cent below the peak.
The fall in compound feed prices matcheddevelopments for the main feed ingredients,as illustrated by UK prices for soyameal and
feed wheat. In early 2014, feed wheat pricesgained some support from the political situation in Ukraine. However, as prospectsfor the 2014 harvest became clearer, pricesbegan to fall and reached a low point below£110 per tonne in the autumn. Even aftersome recovery, prices ended the year ataround £130 per tonne, over £30 below ayear earlier. Soyameal prices also fell in therun up to the 2014 harvest and have beenlargely stable since the summer, fluctuatingaround £330 per tonne. This is around £60lower than in the same period of 2013-14.
Figure 2 Average compound feed prices, GB
Source: Defra
Figure 3 Prices for feed wheat and soya meal
Source: AHDB/HGCA

Industry statistics
16 The BPEX Yearbook 2014-2015
Performance trends in theBritish pig herd
Performance improved across many breedingherd indicators during 2014 but was typicallystill at or below the EU average from the previous year. As an example, the number ofpigs born alive per litter rose by 0.25 but wasstill nearly a pig below the 2013 EU average.Unlike most InterPig members, GB has a significant proportion of outdoor kept sows,where average performance is lower. Nevertheless, most figures for GB indoorbreeding herds are still below the EU average.
The feed conversion ratio for both the rearingand finishing herd improved in 2014, assistedby relatively benign weather conditions during the year. Daily liveweight gain increased in the rearing herd but fell slightlyin the finishing herd, partly due to heavierfinished weights. Overall, performance wasbetter than the EU average in the feedingherd, although this is partly because GB producers finish pigs at lighter weights andmales are not castrated.
Industry trends
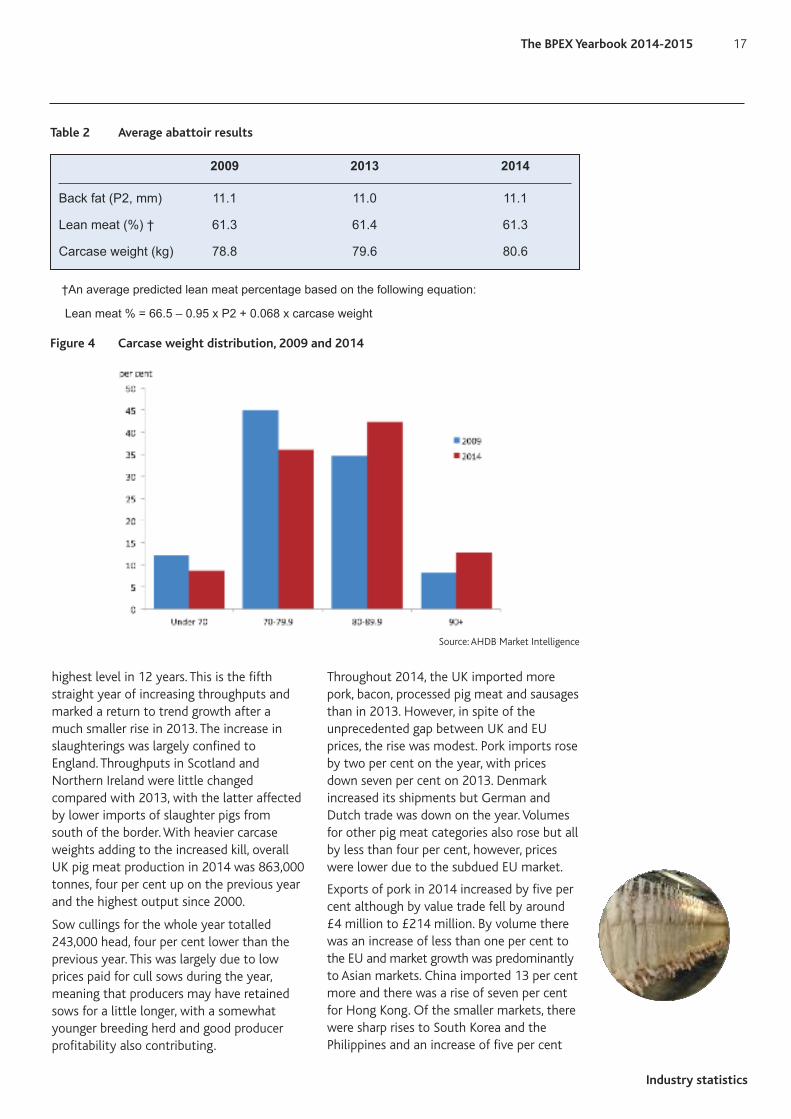
Table 2 shows changes in pig carcases between 2009 and 2014. The long-term upward trend in carcase weights continued in2014, with the average topping 80kg for thefirst time, aided by lower feed costs and goodweather conditions for pig growth. Probemeasurements also increased marginally onthe year but have not changed markedly as carcases have grown. The net result was thatthe lean meat percentage was little changed,having remained at just over 61% of the carcase over the last decade.
In 2009, 12 per cent of clean pigs slaughteredhad a dressed carcase weight of less than70kg. By 2014 that proportion had fallen tonine per cent. Over half of pigs slaughtered in2014 had carcase weights of 80kg for thefirst time, with 55 per cent in this category,up from 43 per cent in 2009. There was also arise in the proportion of pigs weighing over90kg, from eight per cent to 13 per cent.
UK clean pig slaughterings increased by twoper cent in 2014, to 10.23 million head, their
2010 2011 2012 2013 2014 2013EU average
Breeding herdSow mortality (%) 3.6 3.2 3.6 4.5 4.6 5.8Litters per sow per year 2.25 2.26 2.26 2.29 2.27 2.30Pigs born alive per litter 11.20 11.39 11.54 11.87 12.12 13.03Pre-weaning mortality (%) 12.7 12.4 12.7 13.0 12.6 12.9Pigs weaned per litter 9.78 9.98 10.07 10.33 10.59 11.35Pigs weaned per sow per year 22.0 22.6 22.8 23.6 24.1 26.1Average weaning age (days) 28 27 27 26 26 27Rearing herdWeight of pigs at start (kg) 7.2 7.6 7.3 7.2 7.1 7.4Weight of pigs produced (kg) 34.6 36.8 35.9 35.6 37.1 29.9Rearing mortality (%) 2.7 2.6 2.5 3.3 2.8 2.6Feed conversion ratio 1.75 1.71 1.77 1.75 1.71 1.85Daily live weight gain (g) 486 489 489 495 502 417Feeding herdWeight of pigs produced (kg) 103.3 102.6 102.7 104.3 105.4 117.9Finishing mortality (%) 3.0 2.9 2.5 2.8 3.2 2.5Feed conversion ratio 2.95 2.82 2.72 2.78 2.67 2.85Daily live weight gain (g) 766 784 822 816 801 787
Key annual trends inphysical performancefor the British breeding, rearing andfeeding herds from2010 to 2014 areshown in Table 1. The average of InterPig EU countries is alsodisplayed for the 2013calendar year.
Table 1 Performance trends in Great Britain
Source: Agrosoft Ltd, InterPIG
Industry statistics
The BPEX Yearbook 2014-2015 17
highest level in 12 years. This is the fifthstraight year of increasing throughputs andmarked a return to trend growth after amuch smaller rise in 2013. The increase inslaughterings was largely confined to England. Throughputs in Scotland and Northern Ireland were little changed compared with 2013, with the latter affectedby lower imports of slaughter pigs fromsouth of the border. With heavier carcaseweights adding to the increased kill, overallUK pig meat production in 2014 was 863,000tonnes, four per cent up on the previous yearand the highest output since 2000.
Sow cullings for the whole year totalled243,000 head, four per cent lower than theprevious year. This was largely due to lowprices paid for cull sows during the year,meaning that producers may have retainedsows for a little longer, with a somewhatyounger breeding herd and good producerprofitability also contributing.
Throughout 2014, the UK imported morepork, bacon, processed pig meat and sausagesthan in 2013. However, in spite of the unprecedented gap between UK and EUprices, the rise was modest. Pork imports roseby two per cent on the year, with pricesdown seven per cent on 2013. Denmark increased its shipments but German andDutch trade was down on the year. Volumesfor other pig meat categories also rose but allby less than four per cent, however, priceswere lower due to the subdued EU market.
Exports of pork in 2014 increased by five percent although by value trade fell by around£4 million to £214 million. By volume therewas an increase of less than one per cent tothe EU and market growth was predominantlyto Asian markets. China imported 13 per centmore and there was a rise of seven per centfor Hong Kong. Of the smaller markets, therewere sharp rises to South Korea and thePhilippines and an increase of five per cent
Table 2 Average abattoir results
2009 2013 2014
Back fat (P2, mm) 11.1 11.0 11.1
Lean meat (%) † 61.3 61.4 61.3
Carcase weight (kg) 78.8 79.6 80.6
†An average predicted lean meat percentage based on the following equation:
Lean meat % = 66.5 – 0.95 x P2 + 0.068 x carcase weight
Figure 4 Carcase weight distribution, 2009 and 2014
Source: AHDB Market Intelligence

Industry statistics
18 The BPEX Yearbook 2014-2015
to the US where import demand has increased because of the PEDv outbreak.Offal exports were also led by Asian markets,with China and Hong Kong now accountingfor 60 per cent of UK offal exports. Shipments to the smaller markets of Japan,South Korea and the Philippines were also up.On the other hand, a fall of 50 per cent intrade with the EU meant that total offal exports were still lower.
Retail pig meat purchases
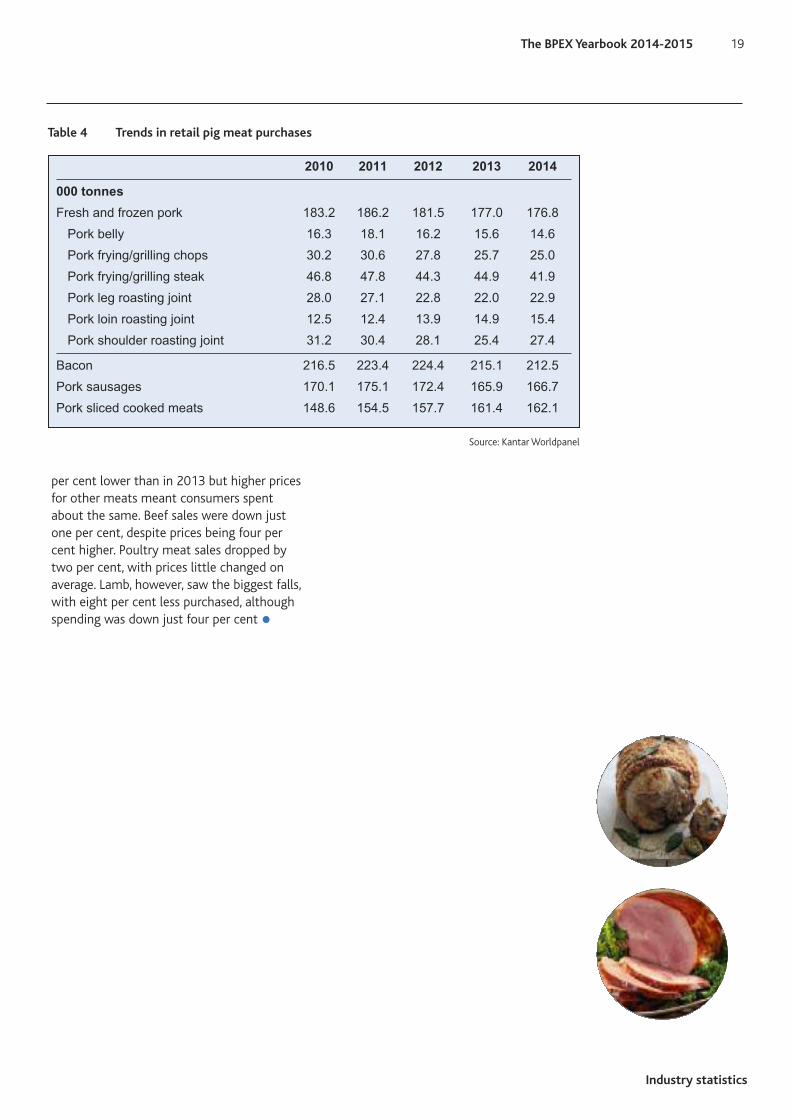
Retail data from Kantar Worldpanel showsthat in the 52 week period ended 4 January2015, purchases of fresh and frozen porkwere virtually the same as in the same perioda year earlier. Increased sales of roastingjoints, ribs and mince offset declines for bellyand frying cuts.
The stability came despite lower prices during the year, which meant that consumerspending on pork was down by four per cent.There was also relative stability in purchasesof cured and processed pig meat products.One per cent less bacon was purchased thanin 2013 but ham and sausage purchases wereslightly higher. Prices rose slightly across allof these categories, which meant that spending on sausages rose by two per cent,while it was also higher for ham and, marginally, for bacon. However, across all ofthe categories, a slightly lower proportion ofhouseholds bought products during the year,with less than three quarters of householdsbuying fresh and frozen pork.
Over the year as a whole, pork fared betterthan other meats in terms of volume sales.Overall, fresh and frozen meat sales were two
2010 2011 2012 2013 2014
UK breeding herd (000 head)
June 427 432 425 421 406December 422 409 400 398 390
UK sow productivity (a)
Pigs per sow 20.2 21.6 22.5 23.0 23.7Pig meat per sow (kg) 1,587 1,692 1,761 1,824 1,917
UK production and consumption
(000 tonnes carcase weight equivalent except where stated)Clean pig slaughter (000 head) 9,233 9,813 10,035 10,050 10,227Total pig meat production 758 806 825 833 863
Imports 941 960 942 928 948(Fresh/frozen) 402 410 387 392 396(Bacon) 366 328 302 292 300(Processed) 173 223 254 244 252
Exports total 185 206 203 229 241
Total pig meat consumption 1,513 1,559 1,564 1,532 1,570Per capita consumption (kg/head) 24.3 24.9 24.6 23.9 24.4Self-sufficiency in pig meat (b) 50% 52% 53% 54% 55%
Table 3 Industry trends
(a) Not survey results. Based on relationship between adjusted clean pig slaughter (slaughterings minus live imports plus live exports) and lagged breeding herd
(b) Production as % of consumption
Source: AHDB Market Intelligence, Defra
Industry statistics
The BPEX Yearbook 2014-2015 19
2010 2011 2012 2013 2014
000 tonnes
Fresh and frozen pork 183.2 186.2 181.5 177.0 176.8Pork belly 16.3 18.1 16.2 15.6 14.6Pork frying/grilling chops 30.2 30.6 27.8 25.7 25.0Pork frying/grilling steak 46.8 47.8 44.3 44.9 41.9Pork leg roasting joint 28.0 27.1 22.8 22.0 22.9Pork loin roasting joint 12.5 12.4 13.9 14.9 15.4Pork shoulder roasting joint 31.2 30.4 28.1 25.4 27.4
Bacon 216.5 223.4 224.4 215.1 212.5Pork sausages 170.1 175.1 172.4 165.9 166.7Pork sliced cooked meats 148.6 154.5 157.7 161.4 162.1
Table 4 Trends in retail pig meat purchases
Source: Kantar Worldpanel
per cent lower than in 2013 but higher pricesfor other meats meant consumers spentabout the same. Beef sales were down justone per cent, despite prices being four percent higher. Poultry meat sales dropped bytwo per cent, with prices little changed on average. Lamb, however, saw the biggest falls,with eight per cent less purchased, althoughspending was down just four per cent •

International cost of pig production
20 The BPEX Yearbook 2014-2015
International cost ofpig productionSummary of the key findings
• The cost of pig meat production in GreatBritain increased by four per cent in 2013, to £1.59/kg. The average cost of production in the EU was £1.56/kg deadweight, a six per cent increase in sterling terms compared to 2012
• All EU countries experienced an increasein the costs of production (in sterling terms) compared to 2012
• Average producer prices were higher in 2013 than in 2012, with five EU countries having production costs belowthe EU average reference price
• Average feed prices were higher in 2013 than in 2012, increasing by 6.8 per cent on average across the EU countries
• In 2013 as a whole, EU feed costs per kg increased by six per cent compared with a year earlier, in sterling terms. The cost increase in Great Britain was five per cent, amongst the lowest in the EU. In the EU, only Czech Rep experienced a reduction in feed costs compared to 2012, due to significant improvements in physical performance
• The overall average number of pigs weaned per sow per year in the European InterPIG countries showed a three per cent increase in 2013, up from 25.34 in 2012 to 26.06, with Denmark achieving 30.0 for the first time. There was a four per cent increase in pigs weaned per sow in Great Britain to 23.63, this was the lowest amongst the InterPIG members
• The main reason Great Britain has a below average number of pigs weaned per sow lies in the number of pigs born alive per litter. The 2013 average, at 11.87, was lower than all other EuropeanInterPIG members, although it was an increase compared to 11.54 in 2012. TheEU average was 13.0, with six EU countries achieving more than 13 pigs born alive per litter
• The average number of pigs finished per sow in Great Britain increased in 2013. At 22.23 pigs per sow, average performance was 0.54 pigs higher than in 2012
• Great Britain produced 1.77 tonnes of carcase meat per sow in 2013, four per cent higher than in 2012 due to a combination of a small increase in the number of pigs finished per sow and an increase in finishing weight.
More details
The full report is published each autumn andis free to English levy payers and can be obtained from BPEX or AHDB Market Intelligence. For non-levy payers the reporthas a cover price of £160 •
This report examines the relative costs of production in selected countries.This is a joint project currently involving fifteencountries, which areknow collectively asInterPIG.

International cost of pig production
The BPEX Yearbook 2014-2015 21
Table 5 Average costs of pig production in 2008–2013 (Euros/kg deadweight)
Year 2008 2009 2010 2011 2012 2013 2013/12% change
Austria 1.75 1.45 1.60 1.67 1.78 1.79 +1
Belgium 1.68 1.41 1.48 1.61 1.73 1.74 +0
Brazil (MT) na na 1.02 1.18 1.17 1.13 -3
Brazil (SC) 1.14 0.99 1.10 1.35 1.46 1.33 -9
Canada 1.10 1.03 1.11 1.29 1.45 1.41 -3
Czech. Rep 1.98 1.65 1.76 1.79 1.86 1.87 +0
Denmark 1.64 1.42 1.41 1.59 1.68 1.68 +0
France 1.61 1.37 1.37 1.60 1.66 1.71 +3
Germany 1.78 1.54 1.53 1.76 1.82 1.82 -0
Great Britain 1.69 1.46 1.64 1.74 1.91 1.89 -1
Ireland 1.74 1.48 1.52 1.72 1.80 1.93 +7
Italy 1.93 1.74 1.79 1.95 1.98 2.01 +2
Netherlands 1.67 1.46 1.43 1.62 1.68 1.77 +5
Spain 1.67 1.44 1.42 1.60 1.64 1.64 -0
Sweden 1.86 1.47 1.72 1.96 2.08 2.08 -0
USA 1.12 1.10 1.12 1.27 1.40 1.49 +6
EU 1.75 1.49 1.56 1.72 1.80 1.83 +1
GB EU
Feed 1.06 1.00
Other variable costs 0.21 0.22
Total variable costs 1.27 1.22
Labour 0.13 0.12
Building, finance and misc 0.18 0.20
Total fixed costs 0.32 0.32
Total costs 1.59 1.54
Table 6 Summary of financial performance 2013 (£/kg deadweight)
Source: InterPIG
Source: InterPIG

International cost of pig production
22 The BPEX Yearbook 2014-2015
Figure 5 Cost of production in selected countries, 2013
Figure 6 Feed costs
Source: InterPIG
Source: InterPIG

International cost of pig production
The BPEX Yearbook 2014-2015 23
Figure 7 Number of pigs finished per sow
Figure 8 Daily liveweight gain (finishing herds)
Source: InterPIG
Source: InterPIG

International cost of pig production
24 The BPEX Yearbook 2014-2015
Figure 9 GB carcase meat per sow per year
Source: InterPIG

Cost of production
The BPEX Yearbook 2014-2015 25
Cost of productionThe impact of changes in feed prices and key performance indicators
The physical performance figures are takenfrom Agrosoft data relating to the twelvemonths ending 31 December 2014. Costs ofproduction are estimated using the modeloperated by AHDB Market Intelligence andtake account of a range of financial cost estimations for 2014.
The Cost of Production estimations are expressed in pence per carcase kilogram andinclude variable and fixed costs. An explanation of the Cost of Production modelcan be found on the BPEX website underPrices and Stats: Costings and Herd Performance.
Change in Cost of Production(CoP) for change in feed price (£ per tonne)
The average cost of production was estimated at 149.4p per kg of carcase weight.The following table indicates how much anincrease in each of these feed prices wouldchange the cost of production estimate.
Change in Cost of Production(CoP) for change in pigs weanedper sow per year
The number of pigs weaned per sow per yearis a result of three different elements: pigsborn alive per litter, litters per sow per yearand pre-weaning mortality. The followingtable indicates the change in cost of production for different numbers of pigsweaned per sow per year. The Agrosoft average, bottom third and top third are basedon all farms included in the Agrosoft database. The model average is based onweighting the average performance of indoorand outdoor sows, using a weighting of 60%indoor and 40% outdoor.
The following tablesreport the relationship betweenphysical productionperformance, feedprices and total costs.All tables use figuresfor the period from 1 January 2014 to 31 December 2014 inclusive.
Base CoP Feed price Feed price Feed price Feed price(p/kg) +£5 +£10 +£15 +£20
Sow feed 149.4 149.8 150.2 150.6 151.0Rearing feed 149.4 149.8 150.1 150.4 150.8Finishing feed 149.4 150.6 151.7 152.9 154.0
Table 7 Change in Cost of Production (CoP) for change in feed price (£ per tonne)
Bottom Mid-point Agrosoft Model Mid-point Top Mid-pointthird marker average average marker third marker
Pigs weaned per sow per year 20.92 22.43 23.93 24.09 25.67 27.41 29.15
CoP (p/kg) 156.3 152.8 149.7 149.4 146.6 143.9 141.5
Table 8 Change in Cost of Production (CoP) for change in pigs weaned per sow per year

Cost of production
26 The BPEX Yearbook 2014-2015
Feed Conversion Ratio (FCR)and Daily Liveweight Gain(DLWG)
The relationship between FCR and the CoP isdirect and impacts on the quantity, andtherefore cost, of feed consumed in producing each carcase kilogram of pig meat.FCR relates to feed efficiency but feeding lessfeed can result in lower DLWG and a longerfeeding period. It is therefore important forfarms to optimise their FCR and DLWG according to their farm situation and system.
The following tables indicate various levels of
performance for FCR and DLWG, on the assumption that by varying one trait there isno change in the other. All farms are represented in the average, but the farms inthe top third for FCR may not be the samefarms in the top third for DLWG as these figures have been independently calculatedfor each trait.
Table 9 indicates the change in cost of production (p/kg) for a change in FCR for different feeding periods.
Table 10 indicates the change in cost of production (p/kg) for a change in DLWG fordifferent feeding periods •
Table 9 Change in Cost of Production (CoP) for change in Feed Conversion Ratio (FCR)
Bottom third Mid-point marker Average Mid-point marker Top third Mid-point marker
Rearing FCR 1.92 1.81 1.71 1.58 1.46 1.34
CoP (p/kg) 151.7 150.6 149.4 148.0 146.7 145.3
Finishing FCR 3.18 2.93 2.67 2.52 2.36 2.21
CoP (p/kg) 159.7 154.5 149.4 146.4 143.3 140.2
Combined FCR 2.74 2.60 2.45 2.34 2.22 2.11
CoP* (p/kg) 162.2 157.7 153.3 149.7 146.1 142.6
* Not all rearing and finishing units are used in the combined average performance data, resulting in a different base CoP
Table 10 Change in Cost of Production (CoP) for change in Daily Liveweight Gain (DLWG g/day)
* Not all rearing and finishing units are used in the combined average performance data, resulting in a different base CoP
Bottom third Mid-point marker Average Mid-point marker Top third Mid-point marker
Rearing DLWG (g/day) 361 432 502 543 584 625
CoP (p/kg) 150.8 150.0 149.4 149.2 148.9 148.7
Finishing DLWG (g/day) 659 730 801 884 967 1050
CoP (p/kg) 151.2 150.2 149.4 148.7 148.0 147.5
Combined FCR 530 590 650 697 744 791
CoP* (p/kg) 153.4 151.8 150.5 149.7 148.9 148.3

Technical performance data
The BPEX Yearbook 2014-2015 27
Technical performancedata The technical information in this chapter comes from a range of outdoor and
indoor breeding systems; rearing, grower and finishing units. The physical performance data is collected through the Agrosoft pig recording system. Thefeed costs have been provided by AHDB since 2014.
Table 11 Distribution of herd size in Agrosoft recorded breeding herds, 2006-2014
No sows % herds
2006 2007 2008 2009 2010 2011 2012 2013 2014
100-249 5 12 9 15 15 14 11 10 13250-499 15 12 25 32 26 26 25 26 23500-749 11 17 26 32 29 28 29 25 29750-999 27 25 24 12 15 17 18 20 101000-1500 27 21 14 8 12 11 13 17 201500-3000 15 13 2 1 2 4 4 2 5>3000 0 0 0 0 0 0 0 0 0
Total 100 100 100 100 100 100 100 100 100
Table 12 Trends in weaning age 2004-2014
Age at weaning % herds (days)
2004 2005 2006 2007 2008 2009 2010 2011 2012 2013 2014
<19 0 0 0 0 0 0 0 0 0 0 020-25 23 49 37 28 31 30 29 27 29 49 3726-32 68 45 62 70 65 66 67 69 68 48 6033-39 9 6 1 0 2 3 1 1 1 1 3>39 0 0 0 2 2 1 2 3 2 1 0
Total 100 100 100 100 100 100 100 100 100 100 100
Totals in Table 11 and 12 may not add up due to rounding

Technical perfomance data
28 The BPEX Yearbook 2014-2015
Table 13 Results for all breeding herds, year ended Dec 2014
Average * Top third * Top 10%*
Herd structure
Average number sows and gilts 714 653 527Average number unserved gilts 59 102 35Replacement rate (%) 52.10 55.18 55.93Sow sales and deaths (%) 51.55 54.08 55.69Sow mortality (%) 4.54 5.23 5.34
Sow performance
Successful services (%) 83.42 86.09 88.08Litters per sow per year ** 2.27 2.35 2.40Non-productive days per litter ## 18.96 12.69 10.49
Pigs born per litter
alive 12.05 13.10 13.42dead 0.58 0.66 0.66mummified 0.20 0.23 0.24total 12.83 13.99 14.32
Pigs born alive per sow per year 27.40 30.88 32.18Pre-weaning mortality (%) 12.73 11.10 9.32Pigs weaned per litter 10.52 11.64 12.15Pigs weaned per sow per year ** 23.93 27.41 29.13Average weight of weaned pig (kg) 7.03 7.24 7.20Average weaning age (days) 26.34 26.75 26.19
Feed usage #
Sow feed per sow per year (t) 1.401 1.358 1.258Feed per pig weaned (kg) 55.28 47.01 41.96
* Selected on the basis of pigs reared per sow per year
** Per sow data excludes unserved gilts
# Per sow data includes unserved gilts
## Non-productive days excludes gestation, lactation and a 6-day weaning-to-service interval
Totals in Table 13 may not add up due to rounding

Technical performance data
The BPEX Yearbook 2014-2015 29
Table 14 Trends in performance and feed costs in the breeding herd, 2004-2014
2004 2005 2006 2007 2008 2009 2010 2011 2012 2013 2014
Herd structure
Average number sows and gilts 474 571 662 631 583 545 605 682 580 591 714Sow sales and deaths (%) 42.3 44.7 44.6 41.6 46.5 46.0 49.2 47.6 51.5 53.5 51.6Sow mortality (%) 4.7 4.7 5.8 3.4 4.3 4.0 3.6 3.3 3.6 4.6 4.5
Sow performance
Litters per sow per year * 2.2 2.2 2.3 2.2 2.3 2.3 2.3 2.3 2.3 2.3 2.3Pigs born alive per litter 10.7 10.9 11.7 11.1 11.2 11.2 11.2 11.4 11.5 11.8 12.1Pre-weaning mortality (%) 10.4 10.9 13.3 12.6 12.6 12.5 12.7 12.6 12.7 13.1 12.7Pigs weaned per litter 9.6 9.7 9.5 9.7 9.8 9.8 9.8 10.0 10.1 10.3 10.5Pigs weaned per sow per year * 21.3 21.5 21.5 21.6 22.1 22.2 22.1 22.5 22.9 23.5 23.9Average weaning age (days) 26 26 26 27 27 27 26.7 26.4 26.7 26.4 26.3
Sow feed
Sow feed per sow per year (t) # 1.334 1.339 1.338 1.343 1.456 1.278 1.230 1.169 1.280 1.529 1.401Sow feed cost per tonne (£) ## 110.36 105.22 102.40 131.08 155.14 178.49 162.87 207.63 207.72 238.02 199.60
* Per sow data excludes unserved gilts
# Per sow data includes unserved gilts from 2013
## Per tonne compound feed cost from AHDB since 2014

Technical perfomance data
30 The BPEX Yearbook 2014-2015
Table 15 Breeding herd results by herd size, year ended Dec 2014
100-249 250-499 500-749 750-999 1K-1.5K 1.5K+
Herd structure
Average number sows and gilts 176 365 617 853 1185 2080Average number in-pig gilts 27 57 112 125 173 446Average number unserved gilts 13 28 51 38 160 72Replacement rate (%) 51.36 50.91 50.38 52.25 52.64 55.46Sow sales and deaths (%) 51.45 51.82 53.99 48.35 50.14 52.87Sow mortality (%) 4.92 4.63 4.30 5.62 3.89 5.40
Sow performance
Successful services (%) 82.38 83.08 84.68 83.01 83.51 81.89Non-productive days per litter ## 19.86 18.79 15.41 19.29 19.64 23.14Litters per sow per year * 2.25 2.26 2.32 2.27 2.26 2.22
Pigs born per litter
alive 12.29 12.31 12.39 12.09 11.73 11.90dead 0.86 0.68 0.67 0.57 0.48 0.54mummified 0.23 0.26 0.23 0.15 0.22 0.10total 13.22 13.16 13.18 12.71 12.28 12.48
Pigs born alive per sow per year 27.54 27.92 28.80 27.46 26.51 26.49Pre-weaning mortality (%) 13.81 11.23 11.81 13.36 13.74 12.54Pigs weaned per litter 10.57 10.93 10.93 10.48 10.12 10.39Pigs weaned per sow per year * 23.81 24.81 25.40 23.80 22.90 23.15Average weight of weaned pig (kg) 7.29 7.17 7.25 6.82 6.98 6.68Average weaning age (days) 27.78 27.18 26.28 26.38 26.11 25.94
Feed usage #
Sow feed per sow per year (t) 1.418 1.288 1.361 1.527 1.440 n/aFeed per pig weaned (kg) 42.47 49.29 52.50 58.61 62.35 n/a
* Per sow data excludes unserved gilts
# Per sow data includes unserved gilts
## Non-productive days excludes gestation, lactation and a 6 day weaning to service interval
Data includes indoor and outdoor herds
Totals in Table 15 may not add up due to rounding

Technical performance data
The BPEX Yearbook 2014-2015 31
Table 16 Breeding herd results by age of weaning, year ended Dec 2014
Less than 26 days 26 days+Top 10% Top third Average Top 10% Top third Average
Herd structure
Average number sows and gilts 632 718 829 435 621 646Average number in-pig gilts 108 122 131 63 125 113Average number unserved gilts 21 126 75 25 74 50Replacement rate (%) 53.34 58.89 54.73 55.26 52.63 50.29Sow sales and deaths (%) 52.04 57.62 53.45 52.16 52.12 49.87Sow mortality (%) 2.42 4.85 4.68 4.17 4.73 4.39
Sow performance
Successful services (%) 87.23 83.74 82.71 88.46 87.38 83.35Non-productive days per litter ## 10.42 13.90 20.34 10.97 12.31 18.03Litters per sow per year * 2.42 2.37 2.27 2.37 2.34 2.27
Pigs born per litter
alive 13.17 12.82 11.89 13.48 13.20 12.15dead 0.59 0.64 0.53 0.69 0.67 0.63mummified 0.28 0.24 0.21 0.23 0.22 0.19total 13.94 13.61 12.52 14.31 13.99 12.86
Pigs born alive per sow per year 31.99 30.49 27.09 31.99 30.96 27.57Pre-weaning mortality (%) 7.97 11.22 13.08 10.08 11.18 12.52Pigs weaned per litter 12.12 11.38 10.34 12.11 11.71 10.63Pigs weaned per sow per year * 29.37 26.99 23.55 28.70 27.46 24.15Average weight of weaned pig (kg) 7.24 7.07 6.88 7.24 7.28 7.12Average weaning age (days) 24.41 24.59 24.67 27.41 27.67 27.61
Feed usage #
Sow feed per sow per year (t) 1.199 1.256 1.392 1.273 1.418 1.409Feed per pig weaned (kg) 41.59 43.76 55.03 44.11 48.99 55.75
* Per sow data excludes unserved gilts
# Per sow data includes unserved gilts
## Non-productive days excludes gestation, lactation and a 6-day weaning-to-service interval
Data includes indoor and outdoor herds
Totals in Table 16 may not add up due to rounding

Technical perfomance data
32 The BPEX Yearbook 2014-2015
Table 17 Comparison of results for outdoor and indoor breeding herds, year ended Dec 2014
Outdoor herds Indoor herds
Herd structure
Average number sows and gilts 928 598Average number in-pig gilts 133 100Average number unserved gilts 55 36Replacement rate (%) 50.96 52.89Sow sales and deaths (%) 48.51 53.98Sow mortality (%) 3.84 5.15
Sow performance
Successful services (%) 82.98 83.78Non-productive days per litter ## 21.47 16.85Litters per sow per year * 2.24 2.30
Pigs born per litter
alive 11.36 12.63dead 0.47 0.68mummified 0.11 0.23total 11.85 13.46
Pigs born alive per sow per year 25.4 29.08Pre-weaning mortality (%) 14.18 11.53Pigs weaned per litter 9.75 11.16Pigs weaned per sow per year * 21.82 25.71Average weight of weaned pig (kg) 7.02 7.13Average weaning age (days) 26.08 26.56
Feed usage #
Sow feed per sow per year (t) 1.547 1.345Feed per pig weaned (kg) 72.46 47.27
Feed costs #
Sow feed cost per tonne (£) 196.10 201.94
* Per sow data excludes unserved gilts
# Per sow data includes unserved gilts
## Non-productive days excludes gestation, lactation and a 6-day weaning-to-service interval
Totals in Table 17 may not add up due to rounding

Technical performance data
The BPEX Yearbook 2014-2015 33Table 18
Comparative results for indoor breeding herds, 2004-2014
* Selected on basis of pigs weaned per sow per year
**Excludes unserved gilts
***
Includes mummified pigs born
#Per sow data includes unserved gilts
##
Non-productive days excludes gestation, lactation anda 6-day weaning-to-service interval
###
Per tonne compound feed cost from AHDB since 2014
Totals in Table 18 may not add up due to rounding
2004
2005
2006
2007
2008
2009
2010
2011
2012
2013
2013
2014
2014
Top third*
Top third*
Herd structure
Average number sows and gilts
362
406
482
501
548
440
492
586
481
549
570
598
644
Average number unserved gilts
3038
n/a
2254
3695
3737
8570
3635
Sow replacements (%)
47.2
47.1
49.5
47.7
45.5
49.2
47.6
49.2
51.8
53.0
53.4
52.9
54.7
Sow sales and deaths (%)
44.7
43.8
49.2
46.7
47.2
47.5
41.5
47.9
52.9
55.4
55.7
54.0
54.2
Sow mortality (%)
5.9
4.9
6.1
3.9
3.9
3.9
1.4
2.9
3.2
5.2
4.4
5.2
5.6
Sow performance
Non-productive days per litter ##
35.0
32.0
21.0
21.0
44.0
20.2
19.9
20.8
18.9
16.2
11.9
16.9
11.5
Litters per sow per year **
2.2
2.3
2.3
2.3
2.3
2.3
2.3
2.3
2.3
2.3
2.4
2.3
2.38
Pigs born per litter
alive
10.9
11.1
11.2
11.4
11.5
11.5
11.6
11.9
12.1
12.4
13.0
12.6
13.3
dead ***
1.1
1.2
1.1
0.9
1.0
1.1
1.0
1.1
1.1
0.9
0.9
0.9
0.9
total
11.9
12.1
12.0
12.4
13.1
12.5
12.6
12.9
13.1
13.2
13.7
13.5
14.0
Pre-weaning mortality (%)
11.8
11.8
12.9
13.0
12.3
12.3
12.2
12.8
12.4
12.3
10.7
11.5
10.8
Pigs weaned per litter
9.6
9.8
9.7
10.0
10.1
10.1
10.2
10.4
10.6
10.8
11.6
11.2
11.8
Pigs weaned per sow per year **
21.4
22.1
22.0
22.4
22.9
22.8
23.0
23.4
24.1
24.9
27.5
25.7
28.1
Average weight of weaned pig (kg)
7.4
7.2
7.2
7.4
7.2
7.5
7.4
7.5
7.4
7.3
7.2
7.1
7.2
Average weaning age (days)
27.0
27.0
26.1
27.1
27.0
26.9
27.0
27.0
26.9
26.9
26.1
26.6
26.6
Feed usage #
Sow feed per sow per year (t)
1.240
1.265
1.367
1.362
1.334
1.256
1.168
1.059
1.217
1.476
1.442
1.345
1.353
Feed per pig weaned (kg)
63.0
61.0
63.3
66.0
62.3
60.2
51.2
46.1
49.8
50.2
47.2
47.3
43.7
Feed costs ###
Sow feed cost per tonne (£)
112.81
102.96
102.22
127.73
164.99
180.59
164.32
215.23
210.28
212.31
217.75
201.94
n/a

Technical perfomance data
34 The BPEX Yearbook 2014-2015Table 19
Comparative results for outdoor breeding herds, 2004-2014
* Selected on basis of pigs weaned per sow per year
**Excludes unserved gilts
***
Includes mummified pigs born
#Per sow data includes unserved gilts
##
Non-productive days excludes gestation, lactation anda 6-day weaning-to-service interval
###
Per tonne compound feed cost from AHDB since 2014
Totals in Table 19 may not add up due to rounding
2004
2005
2006
2007
2008
2009
2010
2011
2012
2013
2013
2014
2014
Top third*
Top third*
Herd structure
Average number sows and gilts
676
820
806
783
777
645
735
771
676
932
791
928
774
Average number unserved gilts
6066
n/a
2180
5745
8470
6688
5563
Sow replacements (%)
23.1
45.9
57.6
45.8
46.4
46.0
39.2
52.4
51.3
52.9
54.9
51.0
52.5
Sow sales and deaths (%)
31.2
45.2
42.6
36.9
45.6
43.8
38.6
47.0
49.1
46.7
48.2
48.5
47.3
Sow mortality (%)
1.6
5.6
5.4
3.1
4.6
3.8
1.1
3.5
4.0
3.4
2.2
3.8
3.6
Sow performance
Non-productive days per litter ##
48.0
41.0
19.0
25.0
45.6
20.4
19.2
21.0
19.9
19.4
14.3
21.5
15.8
Litters per sow per year **
2.1
2.2
2.3
2.2
2.2
2.3
2.2
2.2
2.3
2.3
2.3
2.2
2.3
Pigs born per litter
alive
10.6
10.7
10.8
10.9
10.9
10.9
10.7
10.8
11.0
11.1
11.7
11.4
12.0
dead ***
0.7
0.6
0.6
0.5
0.5
0.5
0.5
0.5
0.5
0.4
0.6
0.5
0.5
total
11.3
11.4
11.4
11.4
11.7
11.5
11.3
11.4
11.6
11.6
12.3
11.9
12.5
Pre-weaning mortality (%)
9.1
10.5
13.6
12.3
12.9
12.6
13.1
12.4
13.0
14.0
12.6
14.2
13.6
Pigs weaned per litter
9.6
9.6
9.3
9.5
9.5
9.6
9.3
9.5
9.6
9.6
10.1
9.8
10.3
Pigs weaned per sow per year **
20.1
21.2
21.1
20.9
21.3
21.6
21.0
21.3
21.7
21.7
23.8
21.8
24.0
Average weight of weaned pig (kg)
7.8
7.3
8.1
7.6
7.6
7.7
7.0
7.9
7.7
7.0
7.1
7.0
7.3
Average weaning age (days)
30.0
27.0
26.0
26.5
27.0
26.5
26.0
27.0
26.5
25.8
26.0
26.1
26.1
Feed usage #
Sow feed per sow per year (t)
1.446
1.402
1,298
1.296
1.584
1.300
1.330
1.345
1.365
1.601
1.515
1.547
1.589
Feed per pig weaned (kg)
72.0
73.0
68.0
70.2
79.0
72.9
64.5
63.0
64.3
76.1
64.6
72.5
68.9
Feed costs ###
Sow feed cost per tonne (£)
107.22
110.03
102.63
133.36
180.72
153.53
160.34
194.44
204.31
226.82
230.24
196.10
n/a

Technical performance data
The BPEX Yearbook 2014-2015 35
Table 20 Overall rearing herd results, year ended Dec 2014
Top 10%* Top third * Average
Herd structure
Average number of pigs 1061 2017 2523
Pig performance
Average weight of pigs at start (kg) 7.6 7.3 7.5Average weight of pigs produced (kg) 21.3 32.4 37.1Rearing mortality (%) 2.5 2.5 2.8Feed conversion ratio 1.17 1.46 1.71Daily gain (g) 394 481 502Days in herd 34 51 58
* Selected on feed conversion ratio
Table 21 Trends in performance and feed costs in the rearing herd, 2004-2014
2004 2005 2006 2007 2008 2009 2010 2011 2012 2013 2014
Herd structure
Average number of pigs 1,449 1,782 1,377 1,192 1,994 2,083 3,345 1,984 2,237 2,607 2,523
Pig performance
Average weight of pigs at start (kg) 7.4 7.3 7.2 7.4 7.7 7.3 7.4 7.4 7.4 7.2 7.5
Average weight of pigs produced (kg) 36.4 36.3 35.1 35.3 38.5 36.6 34.6 36.8 35.9 31.45 37.1
Rearing mortality (%) 5.0 3.4 2.5 2.7 2.4 2.5 2.7 2.6 2.5 4.0 2.8
Feed conversion ratio 1.84 1.70 1.71 1.82 1.73 1.80 1.75 1.71 1.77 1.84 1.71
Daily gain (g) 449 509 493 453 478 492 486 489 489 479 502
Feed usage and costs *
Feed cost per tonne (£) 197.35 183.22 192.04 213.63 272.83 277.4 297.11 261.95 346.89 352.17 282.15
* Per tonne compound feed cost from AHDB since 2014

Technical perfomance data
36 The BPEX Yearbook 2014-2015Table 22
Overall herd results ranked on Daily Livew
eight Gain, year ended Dec 2014
Rearing
Feeding
Combined Rearing/Feeding *
Top 10%
Top third
Average
Top 10%
Top third
Average
Top 10% Top third
Average
Herd structure
Average number of pigs
2,861
3,421
2,523
1,120
1,360
1,733
3,700
5,041
4,577
Pig performance
Average weight of pigs at start (kg)
8.0
7.9
7.5
44.0
41.2
35.0
8.4
7.6
7.6
Average weight of pigs produced (kg)
44.3
44.2
37.1
115.8
110.5
106.1
109.1
111.3
104.6
Mortality (%)
2.2
2.2
2.8
3.3
2.8
3.2
3.4
4.7
4.7
Feed conversion ratio
1.75
1.77
1.71
2.71
2.56
2.67
2.35
2.32
2.45
Daily gain (g)
641
584
502
1,088
967
801
796
744
650
Days in herd
5762
5866
7292
127
140
153
*Rearing, feeding and combined rearing/feeding do not necessarily directly correspond

Technical performance data
The BPEX Yearbook 2014-2015 37
Table 23 Overall finishing herd results, year ended Dec 2014
Top 10%* Top third * Average
Herd structure
Average number of pigs 1,932 2,298 1,733
Pig performance
Average weight of pigs at start (kg) 24.6 31.4 35.0Average weight of pigs produced (kg) 97.2 106.1 106.1Finishing mortality (%) 3.0 3.2 3.2Feed conversion ratio 2.00 2.36 2.67Daily gain (g) 749 819 801Days in herd 83 90 92
* Selected on feed conversion ratio
Table 24 Trends in performance and feed costs in the finishing herd, 2004-2014
2004 2005 2006 2007 2008 2009 2010 2011 2012 2013 2014
Herd structure
Average number of pigs 1,725 1,841 1,992 2,016 1,811 1,881 1,788 2,066 1,764 1,660 1,733
Pig performance
Average weight of pigs at start (kg) 27.7 25.9 27.2 26.6 35.9 38.8 38.0 39.8 38.4 38.9 35.0
Average weight of pigs produced (kg) 97.9 96.9 98.2 98.8 101.6 103.3 103.9 103.0 102.7 99.4 106.1
Finishing mortality (%) 6.7 6.5 5.6 4.8 3.3 2.8 3.0 2.9 2.5 3.1 3.2
Feed conversion ratio 2.77 2.74 2.75 2.73 2.87 2.77 2.95 2.82 2.72 2.80 2.67
Daily gain (g) 630 639 655 673 757 819 766 784 822 786 801
Feed usage and costs *
Feed cost per tonne (£) 129.29 119.69 119.87 132.75 184.12 183.99 177.46 261.83 241.52 248.06 231.70
* Per tonne compound feed cost from AHDB since 2014

Technical perfomance data
38 The BPEX Yearbook 2014-2015Table 25
Analysis of pigs born, w
eaned and weaning to first service interval by parity and Indoor/Outdoor sows, year ended Dec 2014
All
IndoorOutdoor
All
IndoorOutdoor
All
IndoorOutdoor
All
IndoorOutdoor
AllIndoorOutdoor
All
IndoorOutdoor
Gilt
23.8
24.7
22.6
11.4
12.0
10.7
0.5
0.6
0.4
12.0
12.7
11.1
10.5
11.3
9.5
219.5
19.5
19.6
11.9
12.4
11.3
0.5
0.5
0.4
12.4
13.0
11.7
10.8
11.4
10.0
6.6
6.9
6.2
316.6
16.6
16.5
12.5
13.1
11.8
0.6
0.6
0.5
13.2
13.9
12.3
10.7
11.3
9.9
5.6
5.5
5.7
414.1
14.3
13.9
12.6
13.3
11.8
0.7
0.8
0.5
13.4
14.2
12.4
10.5
11.1
9.8
5.4
5.3
5.6
511.0
11.3
10.8
12.4
13.1
11.6
0.7
0.8
0.6
13.3
14.1
12.2
10.3
10.9
9.6
5.4
5.2
5.6
67.7
7.6
7.9
12.0
12.6
11.3
0.8
1.0
0.6
12.9
13.8
11.9
10.1
10.8
9.3
5.4
5.2
5.5
74.3
3.7
5.0
11.5
12.1
11.0
0.8
1.1
0.5
12.4
13.4
11.5
9.7
10.5
9.1
5.5
5.3
5.6
81.9
1.5
2.4
11.1
11.6
10.7
0.8
1.0
0.6
11.9
12.8
11.2
9.5
10.1
8.9
5.5
5.5
5.4
90.7
0.5
0.9
10.8
11.3
10.4
0.8
1.1
0.5
11.6
12.5
11.0
9.2
9.9
8.7
5.5
5.5
5.4
100.2
0.2
0.3
10.5
11.1
10.0
0.8
1.0
0.7
11.4
12.3
10.7
8.7
8.9
8.6
5.5
6.1
5.1
11< 15
0.1
0.1
0.1
10.2
9.8
10.5
1.0
1.1
0.9
11.2
11.0
13.3
9.3
9.4
9.1
5.8
6.2
5.6
Parity
% of total
Born alive
Born dead
Total born per litter
Weaned per litter
Weaning to first service
per litter
per litter
incl mummified
interval (days)

Technical performance data
The BPEX Yearbook 2014-2015 39
All Indoor Outdoor All Indoor Outdoor
Gilt 23.8 77.2 78.5 75.6 9.3 8.5 10.4
2 19.5 76.5 77.2 76.0 10 10.1 10.2
3 16.6 77.8 78.8 76.8 8.8 8.5 9.2
4 14.1 79.0 80.5 77.2 8 7.8 8.2
5 11.0 79.6 80.6 78.3 7.6 7.5 7.7
6 7.7 78.5 79.8 77.1 7.2 7.2 7.1
7 4.3 79.6 80.2 79.0 7.2 7.1 7.3
8 1.9 76.6 78.8 74.9 7.1 7.3 7.0
9 0.7 75.3 76.9 74.2 6.6 5.9 7.1
10 0.2 71.3 67.0 74.6 7.4 10.0 5.3
11< 15 0.1 64.8 57.6 72.9 12.6 15.6 9.5
Parity % of total Farrowing rate % returns
Table 26 Analysis of total services and returns by parity, year ended Dec 2014

Technical
40 The BPEX Yearbook 2014-2015
Technical
The BPEX 5-Point Planhas been developed to help deliver a morecompetitive and profitable pig production and processing industry. This includes working to narrow the technical performancegap between English pig producers and competitors through a number of workstreams.
Work stream include:
• Establishing a field trials programme
• Identifying innovation from around the world and disseminating it to pig producers
• Developing skills under the banner ‘Recruit, Retain, Reward’ recognising professional development of staff and demonstrating a skilled and attractive career path
• Setting up regional technical forums.
This chapter outlines some of the key activitywhich the BPEX technical department hasbeen involved with over the past year andtouches on some of the plans for the forthcoming coming months •

Technical
The BPEX Yearbook 2014-2015 41
Skills development and training continue to play a key role in BPEX’s overallstrategy. The activity is helping ensure all pig staff are equipped with husbandry, data interpretation and decision-making skills, which contributeto improved herd productivity, while also providing people managementtraining and support for managers and business owners.
Skills and training
The facts• Skilled, enthusiastic people are the most
important part of a successful pig business
• A survey of pig businesses achieving ‘2TS’ highlighted a common factor – they all had structured training in place for staff
• A pig business is a great place to pursue a rewarding career in farming.
The pig industry skills strategy Recruit, Retain, Reward outlines steps needed to ensure the industryremains sustainable and profitable.
The aims of the strategy are:
• Recruit: Provide and promote an attractive environment for a progressive career within allied industries
• Retain: Promote skills developmentas vital to business improvement
• Reward: Promote recognition of achievement to motivate staff •
Sam Bowsher
Skills Development
Coordinator
Current BPEX training offer
Training decision tree

Technical
42 The BPEX Yearbook 2014-2015
Key Figures
Training hours: training hours
Health and Welfare RDPE Spec allocation:
training hours
Scholarship companies:
Scholarship applications:
across companies
Scholarships secured:
Skills and training
What people have said
Sophie Hope, Alexander & Angell Farms Ltd ’I attended a great Vet Medsession run by BPEX, covering responsible use,food safety and health and welfare, demonstrating theprofessional approach ofour industry to the use ofmedicines on farm.
Harper Adams student, Scholarship Fair 2014 ’I wasn’t interested in thePig Industry, but thereseems to be so much goingon, I felt I needed to findout more.
Tony Wright, Shedden Farms, BPEX Skills Sector Champion ’Why is staff training so important to our business? It increases staff retention, increases their self-worth, their knowledge and under-standing of production is improved and I believe thisleads to increased herd performance and profitability.

Technical
The BPEX Yearbook 2014-2015 43
Technical Managers Scheme
New to the BPEX training offer this year, theTechnical Managers Scheme was developedafter a gap in the training offer was identifiedfor supervisors and managers. The previousoffer covered practical production and problem solving skills for stockman, as well as people management and business training.The Technical Managers Scheme covers the issues facing those who are responsible for aunit on a daily basis. It can also contribute towards the Level 3 Certificate of Competencein the supervision and operation of a pig unit.The scheme consists of six full day sessionscovering welfare, interpreting records, management of farm waste and pollution, organising pig sales and purchases, feed millingand mixing and staff supervision. In its firstyear the scheme has been run in York, Bury StEdmunds and Kidderminster •
Pig Industry Scholarship
After the success in its inaugural year, thescheme has continued to grow, with 10 companies offering scholarships in its secondyear. The scholarship has also allowed us todemonstrate to students the diverse nature ofthe industry and the wide range of opportunities being offered. The companiesinvolved in the first and second years have included production businesses, feed and breeding companies, technology and engineering firms and a pig veterinary partnership. The interest from students hasalso grown, with the number of applicationsacross the scheme rising from 35 in its firstyear to 47 in its second year •Certificates of Competence
The Certificate of Competence in Pig Husbandry Skills was updated during thecourse of the year, with a more practically focused assessment criteria and a revamp ofthe learner manuals, including additional information on outdoor production systems.The revised learner manuals were launched inautumn 2014. Other changes include:
• The assessment criteria have been altered to allow those taking the qualification to demonstrate their knowledge and skills through their own unit’s practices
• Assessment questions now include asking candidates to demonstrate their usual everyday tasks
• The online written test has been removed to ensure the assessment is practical throughout
• The learner manuals are set out with training information as well as progress check questions to test the learner’s knowledge
• There is a practical skills checklist to ensure the individual is ready for assessment
• Further reading references have been included, directing the reader to additional information
• The learner manuals are now available in one folder, which contains all the necessary manuals to complete the full certificate, although each unit is still able to be taken as an individual award •
Scholarship scholars
For full details on the BPEX skills and training offer, including the training calendar, visit: http://www.bpex.org.uk/2TS/Training/
Technical
44 The BPEX Yearbook 2014-2015
Flanders, Belgium
Activity: Two farm visits looking at slurryflushing systems and bio-scrubbers
Who: A small group comprised of producers,BPEX and AIG
Sponsored by: ABN
Ireland
Activity: Two farm visits looking at ventilationsystems (automatically controlled ACNV)
Who: Nine producers along with BPEX andAIG
Sponsored by: Boehringer Ingelheim
France
Activity: SPACE Pig Show
Who: Six producers along with BPEX and AIG
Sponsored by: Zoetis
Denmark
Activity: Agromek and a visit to a brand newstate-of-the-art multiplier unit for SPF/Danbred to see the latest technology inaction
Who: Eight producers along with BPEX andAIG
Sponsored by: Suffolk Pig Club
The Netherlands
Activity: To see how producers in the Netherlands achieve an average of 30 pigsweaned/sow/year while routinely keepingsows to eight parities and to look at feedingand managing sows for longevity and reducedreplacement rate
Who: A small group comprised of producers,BPEX and AIG
Sponsored by: Zarkos-Smith Associates Ltdand SwiNco
For more information on study tours, including how to get involved, visit:http://www.bpex.org.uk/research-innovation/study-tours/
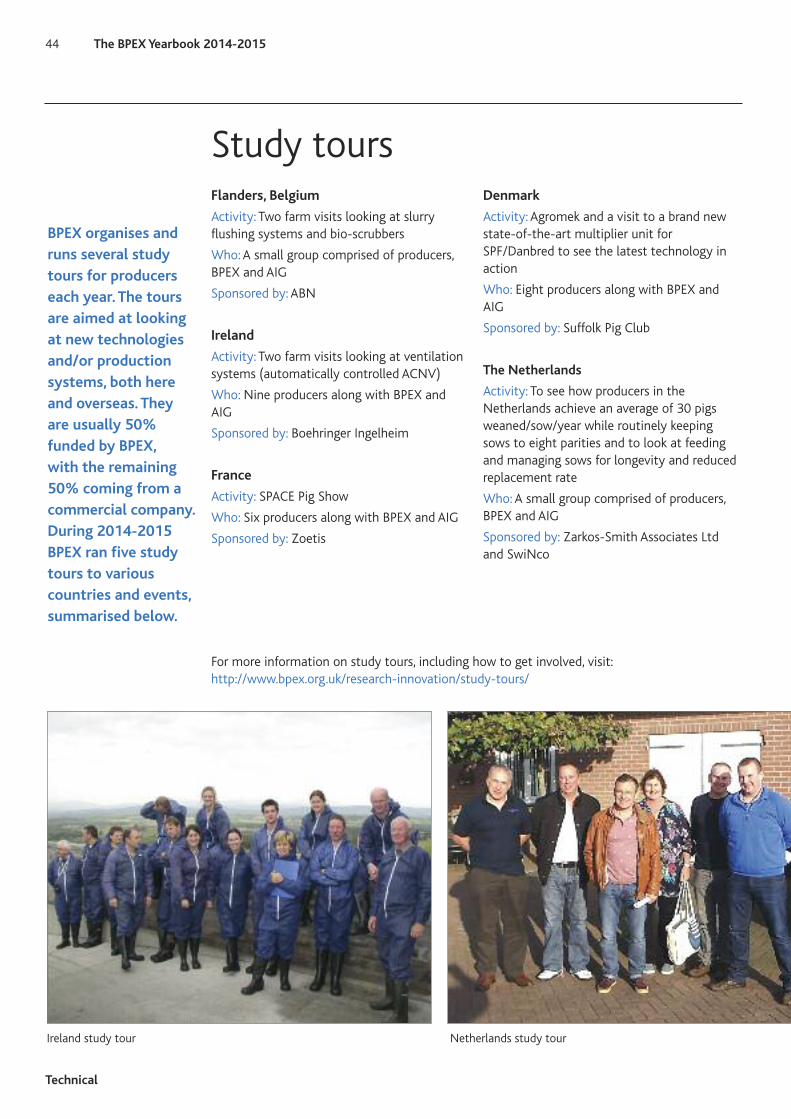
Ireland study tour Netherlands study tour
BPEX organises andruns several studytours for producerseach year. The tours are aimed at looking at new technologiesand/or production systems, both here and overseas. They are usually 50%funded by BPEX, with the remaining50% coming from a commercial company.During 2014-2015BPEX ran five studytours to various countries and events,summarised below.
Study tours
Technical
The BPEX Yearbook 2014-2015 45
The BPEX Innovation Fund awards grants of50-100% to pig producers or businesses whohave a good idea but not enough money orsupport to try it out or develop it. The grant isthere to help evaluate new systems and technologies. It is about encouraging investment, improving technical competenceand boosting cost competitiveness in the English pig industry.
Current and recently completed projects include:
• The use of a laser torch to see how it impacts on bird prevalence
• The use of false flooring to impact on farrowing mortality and reduce straw usage
• The use of plastic matting around feeders to reduce soil erosion
• The benefits of creep feeding outdoors
• Feeder review: A range of feeders from different manufacturers were installed on a single pig unit to compare performance
• Outdoor CCTV trial to measure predation levels
• The effects on performance of effective feed delivery in dry sows
• LED lighting in dry sow arcs.
Innovation Fund

Technical
Field trials
The BPEX field trialsprogramme is a seriesof on-farm experimentsaimed at solving herdperformance problems.They are protocol-based, scientifically robust and are drivenby adaptation of globalknowledge.
Field trials are run onseveral farms for eachproblem area identifiedand are funded 100%by BPEX. Topics for fieldtrials are largely proposed by the regional forums, whoserole it is to inform BPEXof current and future production issues onfarm.
The effect of different metabolic status indicators of sows during gestation and lactation on subsequent performance of sows and piglets
Duration: May 2015-2016
Aims and objectives: To address variableweights and body condition at farrowingand to improve sow longevity and lifetime performance
Expected benefits: A 10% increase in sowefficiency •
Supplementation with omega-3polyunsaturated fatty acids and effects on reproductive performanceof sows
Duration: April 2015-March 2016
Aims and objectives: To address seasonal infertility and increase piglet viability
Expected benefits: An extra pig born perlitter and 2% increase in piglet survival •
Optimising the potential of the smallpig through the implementation ofbest practice in the farrowing house
Duration: May 2015-2016
Aims and objectives: To address variableweaning weights and post-weaning performance
Expected benefits: Four days fewer toslaughter and 2% reduced pre-weaningmortality •
Investigation of the effects of varying space allowance (stockingdensity) on the performance ofgrowing-finishing pigs
Duration: April 2015-September 2015
Aims and objectives: To investigate the effect of increased space allowance forgrowth
Expected benefits: An increase of 20g/daygrowth from 30-110kg liveweight •
Establishing soil water movement andnitrate leaching in soils used by outdoor pigs
Duration: Two years
Aims and objectives: To develop a betterunderstanding of the interaction betweenurine and faeces with the soil and consequential leaching losses
Expected benefits: A better understandingof potential leaching will help inform policy makers and allow farmers to comply with legislation with more confidence •
46 The BPEX Yearbook 2014-2015
Investigation of the effect ofallocating 50% and 100% morefeeder space on the performance ofgrowing-finishing pigs
Duration: April 2015-2016
Aims and objectives: To investigate the effect of doubling feeding space forgrowth
Expected benefits: An increase of 40g/dayfrom 30-110kg liveweight •
Charlotte West
Technical Innovation
Manager

Technical
The BPEX Yearbook 2014-2015 47
Evaluation of ultra-high frequency(uhf) electronic ear tags to optimisemarketing strategies on farm
Duration: January 2015-February 2016
Aims and objectives: To undertake a feasibility analysis to test the practicalities of using ultra-high frequency technology on farm, integrating this data into existing management systems (on farm and atthe abattoir) and using this data to inform better management decisions
Expected benefits: An improvement inFCR of 0.1 (wean-finish) and an increasein average daily gain of 50g •
Establishing ammonia emission factors for straw-based finishing pigbuildings and evaluating improvedventilation systems
Duration: 14 months
Aims and objectives: To collect and evaluate data for ammonia emission levels within pig sheds
Expected benefits: Evidence of the impactof ammonia on the local environmentwill help to develop better emission factors •
Evaluation of a carcase cooling container
Duration: March 2015-March 2016
Aims and objectives: To evaluate the operation and performance of coolingcontainers for the on-farm storage ofdead pigs (fallen stock) in England
Expected benefits: Potentially improvedbiosecurity and carcase quality for enhanced marketable yield of productsderived from rendered material followingstorage •

Research
Research
48 The BPEX Yearbook 2014-2015
The aim of research is to generate new knowledge about pig production and demonstrate this new knowledge in commercial environments to remove some financial risks when investing on-farm. Work is aimed at optimising pig production efficiency, enhancing pig health and welfare, protecting the environment and maintaining safe and traceable pork that is ultimately appetising to the end consumer.
High standards of pig health and welfarethroughout production help to protect foodsafety and public health at the abattoir. Maintaining these standards, along withtraceability, help to build trust in pig meatproducts with the consumer.
Public health and food safety within the pigsector is of high importance. The current approach to maintaining public health ismainly through a risk management approach.Risk reduction strategies for the control ofzoonoses (animal diseases that can be transmitted to humans) are applied throughout the pig meat production chain.
The Pig Health and Welfare Council Surveillance Subgroup Exotic and EmergingDiseases Roundtable in April 2014 developeda series of recommendations to strengthenthe UK pig industry’s defences against the introduction of new and notifiable diseasesand to improve preparedness to identifyquickly, contain and eliminate new diseaseagents.
Part of the BPEX 5-Point Plan includes minimising the risks from endemic and exoticdisease by establishing effective biosecuritytools and technologies •Pig Health and Welfare Council
2014 saw changes to the structure of the established Pig Health and Welfare Council(PHWC) from the 20:20 strategy with eightobjectives to a more streamlined four keystrategic priorities. The reduction has allowedthe council to focus on four key areas whichare of significant importance to the industry,while capable of adapting to any unforeseenchanges that may appear on the horizon.
The PHWC subgroups now cover the following areas:
• Welfare Subgroup – Enhancing pig welfare
• Pig Meat Food Safety Subgroup – Enhancing pig meat food safety
• Disease Surveillance Subgroup – Improvingpreparedness for exotic and emerging diseases
• Antimicrobials Subgroup – Reducing antimicrobial use in pig production
The proposed reorientation of the PHWCstrategy into these four themes did not inferthat other strategic themes, such as minimising the impact on the environment,were no longer of key importance to the industry and wider stakeholders. It is acknowledged that the PHWC may not be themost appropriate forum to affect change inthese areas and that a more precisely definedset of strategic themes could culminate inmore tangible delivery and success.
The new subgroups, as well as the PHWC,have established key milestones for eachgroup for 2015. Further detail can be foundon the BPEX website:http://www.bpex.org.uk/health-welfare/pig-health-welfare-council
PED contingency planning
The Disease Surveillance Subgroup of thePHWC has been actively involved in the development of an industry-wide contingencyplan against the highly pathogenic strains ofPorcine Epidemic Diarrhoea virus (PEDv). Thecontingency plan has been a collaborative effort between the pig sector, Defra, APHA,PVS, NPA, BPA, BMPA and other allied industry groups.
The contingency plan outlines what will happen in the event of an outbreak in England, which would include intensive cleaning and disinfection of the first five siteson which the disease is detected. Followingthe first five cases, any subsequent caseswould be monitored and supported as laidout in the plans. A considerable amount ofwork has been carried out to fulfil the requirements of the plan, which includes:
• Developing Standard Operating Procedures (SOPs) for controlling the disease
• Implementing testing on ALL porcine diarrhoea samples through APHA for suspect PED
Health
Research
The BPEX Yearbook 2014-2015 49
Martin Smith
Veterinary Team
Manager

Research
50 The BPEX Yearbook 2014-2015
• Creation of PED sample packs to go out to farms in advance of an outbreak
• Creating a PEDv disease questionnaire and database for epidemiological purposes in the event of an outbreak
• Delivery of a ‘Significant Diseases Charter’ to the industry to provide data sharing and rapid alerts of outbreaks to subscribers in the event of the disease
• Maintaining open global communication channels to promote exchange of knowledge and to ensure the latest understanding of the disease situation.
Work continues on further development andrefinement of the contingency plan in the absence of the disease, with the aim of testing the measures already set in place autumn of 2015. The contingency plan remains a living document and will continueto develop as more information becomesavailable •Antimicrobial strategy
The topic of ‘One Health’ and the prudent useof antimicrobials across the veterinary andhuman medical fields have been of increasedpublic interest over the past few years. The
European Union is now introducing measures which will require each memberstate to be able to quantify antimicrobialusage within each sector. This process is aconsiderable task, to which the PHWC Antimicrobials Subgroup are taking a lead.BPEX is actively involved in three main areasof delivering this strategy:
• Creating a data platform: To facilitate collection and reporting levels of antimicrobial usage
• Running study tours: To develop a better understanding of existing approaches in reducing antimicrobial usage
• Research and field trials: Bringing the latest technology and concepts in medication and pen-side diagnostics to the producer to help to reduce reliance upon antimicrobials.
BPEX aims to deliver tools and resources tothe producer and wider industry which assistin the wider aim of reducing antimicrobials inthe pig sector. These resources need to bepractical and not burdensome to the producerand BPEX will continue to work with key producer groups and consult wider industrythroughout the process •
Health

The use of oral fluid from pig populations for the diagnosis andmonitoring of infectious disease
Research partner: Newcastle University
Sponsor: BPEX-funded studentship (Lorna Dawson)
Duration: 2011-2014
Aims and objectives:
• To develop diagnostic testing for the detection of European strains of PRRSv and Salmonella infection in UK pig herds, using oral fluid (OF)
• To find out how to get good quality oral fluid samples that truly represent the total population for large group sizes of pigs.
Findings to date:
• Provision of multiple cotton ropes may improve representation of pen-based OF samples in weaned but not finishing, pigs in straw-based systems
• A single cotton rope can result in a pen sample representative of 40% of the total population, approximately four times more than current blood testing recommendations
• FTA cards* may provide a simple and safe means of storing/shipping porcine OF for PRRSv testing without the need for chilling
• Porcine OF shows good but not total, agreement with blood serum for anti-PRRS antibody testing
• The next stage of the project is serial OF collection following weaned pens through growth for anti-PRRSv antibody detection and real time PCR testing of dry stored field OF to validate FTA card* method for PRRSv monitoring.
* Flinders Technology Associates (FTA)cards: bind and store nucleic acids at ambient temperatures
Further information
Research into Action factsheet 13: Measurement of Acute Phase proteins • Research
The BPEX Yearbook 2014-2015 51
Mycotoxin contamination: Assessment of risk in livestock systems
Research partners: Food and EnvironmentResearch Agency (Fera), The Queen’s University of Belfast, Harper Adams University, Raft Solutions Ltd.
Sponsor: AHDB
Duration: 2014
Aims and objectives:
• To determine the severity of the mycotoxin problem in the UK
• Highlight research gaps
• Formulate mitigation advice for farmers
• Collate evidence for regulatory processes •
Validation of automated screening for pathologies at abattoir
Research partner: Tulip Ltd
Sponsor: BPEX
Duration: 2014-2017
Aims and objectives:
To validate and develop effective knowledge exchange for the outputs froma parallel project which will:
• Develop and deploy multi-camera recording infrastructure that enables capture of images of carcases
• Acquire image data sets and have experts annotate pathologies in these images
• Develop and refine algorithms/softwarethat can automatically recognise pathologies
• Validate these algorithms on large scale datasets and disseminate results to relevant users •
Research projects • Health

Research
52 The BPEX Yearbook 2014-2015
Research projects •Health
Antimicrobial use in the pig industry
Research partner: Octagon Services Ltd
Sponsor: BPEX
Duration: 2012-2014
Aims and objectives:
• To identify areas of difficulty around collecting antimicrobial usage data for the English pig herd and trial different methods of collection
• To determine what volume of antimicrobials are used in the English pig herd, providing a benchmark to inform the industry of our current standing in comparison to other EU countries
• To inform the current debate on antimicrobial usage.
Findings to date:
• Data was collected from vet practices, integrated production companies and feed mills, to gain a full view of how antimicrobials are prescribed, dispensed and recorded
• A benchmarking tool has been created to help producers and their vets measure antimicrobial usage specific to that farm and therefore be able to set targets for reduction where appropriate
• The industry can now start to address data gaps and improve data provision throughout the supply chain •
Enhancing the impact of regionalhealth improvement programmes
Research partner: Warwick University
Sponsor: BPEX-funded studentship (Daniel Franklin)
Duration: 2010-2014
Aims and objectives:
• To help the pig industry understand how porcine reproductive and respiratory syndrome (PRRS) and swinedysentery (SD) persist in the national herd
• To develop mathematical simulation models to help understand the role of the metaherd in the spread of PRRS
• To use these models to test control and intervention strategies across the metaherd.
Findings to date:
• The use of vaccinations in the metaherd was simulated
• The metaherd level gives an indication of what extent PRRSV reduces productivity from a regional perspective
• Results suggest that fadeout within themetaherd does not occur once infection has spread to herds >150 sows
• Results suggest that a loose threshold herd size exists, between 100-150 sows, below which infection does not persist in a herd •

Research
The BPEX Yearbook 2014-2015 53
Towards an eradication strategy for Mycoplasma hyopneumoniae from the UK pig herd
Research partner: The Royal Veterinary College, Veterinary Laboratories Agency,BBSRC
Sponsor: BPEX-funded studentship (Veronica Brewster)
Duration: 2009-2014
Aims and objectives:
• To develop and validate immunohistochemistry (IHC) as a diagnostic tool for Mycoplasma hyopneumoniae
• To determine the impact of enzootic pneumonia-like (EP-like) lesions on post trimming carcase weight
• To undertake a feasibility assessment onthe eradication of M. hyopneumoniae.
Findings to date:
• A significant association was identified between increasing severity of EP-like lesions and a decrease in post-trimming slaughter weight
• On an individual level, each 5-point increase in EP-like lesions equates to around -53p/pig
• On a batch level, each increase of 1-point score equates to -50p/pig
• An increase in EP-like lesion severity was significantly associated with an increase in slaughter age •
New approaches to diagnostics ofHaemophilus parasuis related disease
Research partner: University of Cambridge
Sponsor: BPEX-funded studentship (Kate Howell)
Duration: 2011-2014
Aims and objectives:
• To bring the UK to the forefront of H.parasuis (HPS) diagnosis
• To develop sensitive and specific tools for the detection of the organism in field material
• To assess the value of vaccine in the control of disease outbreaks.
Findings to date:
• Statistically significant markers for serotype and for different disease categories for H. parasuis have been found
• The next stage is to determine which combination of markers gives the best probability of disease causation and to design the molecular diagnostics
• Markers could be able to predict:
• Disease
• Serotype
• Antibiotic Resistance •

Reduction of pathogen load in the environment of pigs (Mycoplasma hyopneumoniae)
Research partner: Royal Veterinary College
Sponsor: BPEX-funded studentship(Christopher Browne)
Duration: 2012-2015
Aims and objectives:
• To identify novel and alternative methods to reduce pathogen load in the environment of pigs and reduce the use of antibiotics
• To determine the efficiency of
i) UVA activated photo-catalytic paints
ii) Silver ion solutions
iii) UV-based air purification system against Mycoplasma hyopneumoniae (M. hyo) in the environment of pigs.
Findings to date:
• The minimum effective dose of silver ions to successfully inhibit the growth of M. hyopneumoniae was determined; studies were carried out to assess the duration of the inhibitory effects
• Four photocatalytic paints were tested under a range of UVA intensities, the results of the inhibitory effects of the paints, alongside the integrity, were considered when selecting the paint to use in vivo
• The in vitro analysis has shown that both UVC and photocatalytic paints are effective at inhibiting growth of M. hyopneumoniae
• Further analysis is needed from the in vivo work to establish whether these methods may be of benefit to the pig industry •
Research
54 The BPEX Yearbook 2014-2015
Research projects •Health
M. hyopneumoniae exposed to silver ions after 20 minutes
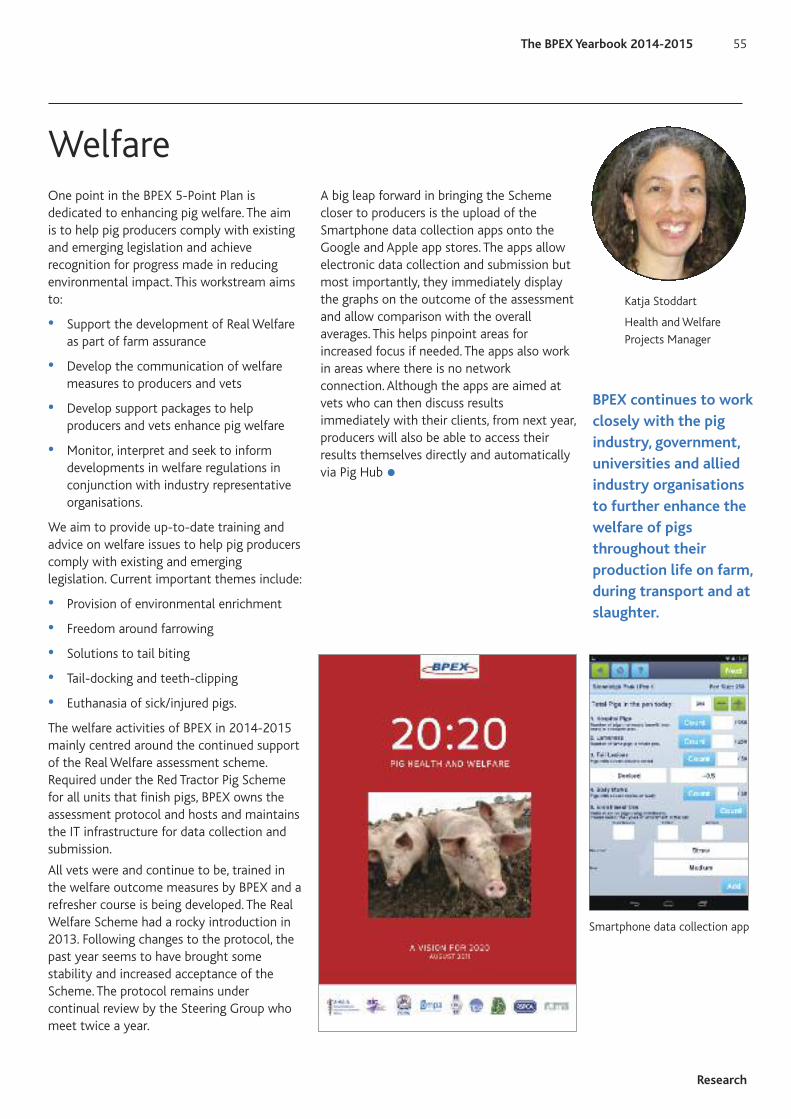
Research
The BPEX Yearbook 2014-2015 55
Katja Stoddart
Health and Welfare
Projects Manager
One point in the BPEX 5-Point Plan is dedicated to enhancing pig welfare. The aim is to help pig producers comply with existingand emerging legislation and achieve recognition for progress made in reducing environmental impact. This workstream aimsto:
• Support the development of Real Welfare as part of farm assurance
• Develop the communication of welfare measures to producers and vets
• Develop support packages to help producers and vets enhance pig welfare
• Monitor, interpret and seek to inform developments in welfare regulations in conjunction with industry representative organisations.
We aim to provide up-to-date training and advice on welfare issues to help pig producerscomply with existing and emerging legislation. Current important themes include:
• Provision of environmental enrichment
• Freedom around farrowing
• Solutions to tail biting
• Tail-docking and teeth-clipping
• Euthanasia of sick/injured pigs.
The welfare activities of BPEX in 2014-2015mainly centred around the continued supportof the Real Welfare assessment scheme. Required under the Red Tractor Pig Schemefor all units that finish pigs, BPEX owns the assessment protocol and hosts and maintainsthe IT infrastructure for data collection andsubmission.
All vets were and continue to be, trained inthe welfare outcome measures by BPEX and arefresher course is being developed. The RealWelfare Scheme had a rocky introduction in2013. Following changes to the protocol, thepast year seems to have brought some stability and increased acceptance of theScheme. The protocol remains under continual review by the Steering Group whomeet twice a year.
A big leap forward in bringing the Schemecloser to producers is the upload of theSmartphone data collection apps onto theGoogle and Apple app stores. The apps allowelectronic data collection and submission butmost importantly, they immediately displaythe graphs on the outcome of the assessmentand allow comparison with the overall averages. This helps pinpoint areas for increased focus if needed. The apps also workin areas where there is no network connection. Although the apps are aimed atvets who can then discuss results immediately with their clients, from next year,producers will also be able to access their results themselves directly and automaticallyvia Pig Hub •
Welfare
BPEX continues to workclosely with the pig industry, government,universities and alliedindustry organisationsto further enhance thewelfare of pigs throughout their production life on farm,during transport and atslaughter.
Smartphone data collection app

Research
56 The BPEX Yearbook 2014-2015
Environment
The environment and the effect pig production can haveon it is becoming increasingly important. It formspart of the BPEX 5-Point Plan under thebanner of protectingthe environment, with BPEX aiming tohelp pig producers and processors comply with existingand emerging legislation and achieve recognition forprogress made.
Nigel Penlington
Environment and
Building Manager
Activity includes:
• Setting up a business support service to advise on reducing environmental impact, compliance with planning rules and environmental regulations
• Monitoring, interpreting and helpingto inform environmental policy and regulations in both the UK and EU
• Capturing the progress made by the English pig industry and helping to ensure this is communicated effectively.
AHDB Environmental and Agricultural Resource EfficiencyTool (EAgRET)
Aims and objectives
• To develop a calculator to build awarenessand understanding of how physical performance and farm management decisions on the use of resources (including land) determine environmental impacts and associated economic impacts
• To show how a user-friendly, computer-based calculator can be used in AHDB’s interactions with UK farming and supply chain businesses to investigate the outcomes from possible changes that might be made to farming systems
• To commission the development of the tool to better understand and thereby inform discussions with government departments and other important stakeholders.
The tool
• Based on a library of default data and user-modifications, it will allow users to explore the effect on resource use efficiency of changes in farming practice that might arise from government strategy or technical innovation
• Will enable comparisons of scenarios by a trained user
• Will provide outputs in a form that can be easily used to explain the effects of the scenarios to non-technical audiences
• It is not expected that the tool will enable individual farm businesses to make management decisions but does provide an indication
• Is in the process of being tested across theAHDB sectors.
Expected users of the tool
• Specifically trained AHDB staff

Research
The BPEX Yearbook 2014-2015 57
Outputs – Exported(eg, milk, meat)
Outputs – Exported(eg, grain, straw)
Outputs – Exported
(eg, beans)
Farm Activity 2(Dairy milking)
Farm Activity 1(Dairy Rearing)
Farm Activity 1(Grassland)
Farm Activity 4(Wheat)
Farm Activity 5(Beans)
Transfer of manure(FA1 & FA2 to FA3)
Transfer of silage(FA3 & FA1 to FA2)
Transfer of beans(Farm Enterprise 2 to 1)
[FA5 to FA2]
Transfer of straw(Farm Enterprise 2 to 1)
[FA4 to FA2]
Slurry transfer(Farm Enterprise 1 to 2)
[FA1 & FA2 to FA3]
Purchased inputs(eg, fuel, electricity
water, fertiliser)
Purchased inputs(eg, feed, vet meds,
live animals, electricity,water)
Assumed movement oflive animals between
livestock Farm Activities
Farm Business – Mixed Farm
Farm Enterprise 1 – LivestockFarm Enterprise 2 – Arable
Expected audiences for the outputs of the tool
• Government policy makers
• Strategic decision makers in businesses throughout the agri-food chain
• Farmers, through interpretation by a knowledge transfer agent (eg AHDB regional teams).
Environmental Permitting(EPR/IPPC)
The Environmental Permitting Regulations(EPR) [formally the Integrated Pollution Prevention and Control (IPPC) Directive] aimto reduce pollution from industrial activity bycontrolling emissions. Permitted sites are required to adopt minimum standards ofmanagement practice and Best AvailableTechniques (BAT) for their productionprocesses.
Aims and objectives
• To update all the BPEX model templates and associated documents to match the new application forms from the Environment Agency (EA).
Achievements to date
• Guidance for completing a full application with model templates, including all the necessary supporting documentation, havebeen completed and are on the BPEX website
• The Environment and Building Team is providing training and telephone support in their use
• The team is helping producers understand the EA’s ammonia screening tool outputs and how application of Best Available Techniques (BAT) and/or altering how air is exhausted from buildings can alter the results, which can help sometimes, to change a fail to a pass
• BPEX has been heavily involved in representing the UK in reviewing the EU’s Best Available Techniques Reference Document (BREF) draft document. This hasincluded determining which aspects or products will be deemed as BAT and the emission levels ascribed to them. Emissionlevels are of particular importance becausethere will become limits below which farms will have to operate.
EAgRET
For further information and copies of the templates, visit the Environment and Buildings area of the BPEX website: http://www.bpex.org.uk/environment-buildings/permitted-agriculture-eprippc/

Research
Thermal management for efficient production
The Environment and Building team is nowusing thermal imaging to help assess the condition of pig housing as part of its ‘closingthe gap’ strategy. This includes pinpointingwhere heat is leaking out of buildings, areaswith poor/no insulation, cold/damp areas andstructural issues such as cold bridging. Themain aim of the work is to improve pig production efficiencies and the health andwelfare of the livestock on a unit. The team iscombining the use of the camera with airmovement indicator tools to assess ventilation in buildings. It is also possible topinpoint areas of high ammonia concentration within pens.
Defra’s fertiliser manual: RB209
RB209 is used by agricultural consultants,farmers and individuals and organisationsconcerned with developing and maintaining a sustainable agricultural industry. AHDB hastaken responsibility for updating and modernising this document, which will alsoinclude the values of slurries and manures.The updated manual is due to be published in 2017.
Sector specific soil managementinformation for outdoor pigs
Aims and Objectives
• To provide information and guidance on soil management for outdoor pigs.
Achievements
• A best practice guide on good soil management for outdoor pigs has been produced
• Four new video clips on soil management for outdoor pig units have been added to the BPEX Practical Pig App and website.
Further information
Practical pig app: http://practicalpig.bpex.org.uk/
Good Soil Management Practice A Guide For Outdoor Pig Keeping:http://www.bpex.org.uk/media/72701/good-soil-management-practice-report.pdf
58 The BPEX Yearbook 2014-2015

Research projects • Environment
Feasibility study on the desirability ofthe UK pig industry adopting carcasecooling as an on-farm method for thestorage of fallen pigs prior to disposal
Research partners: FABRA, Harper AdamsUniversity
Project duration: April to August 2014
Aims and objectives:
• To conduct a detailed evaluation on-farm carcase cooling systems in Denmark and the Netherlands
• To assess the feasibility of implementation of on-farm carcase cooling for the UK pig industry.
Potential benefits
On-farm cooling of fallen stock prior to collection and rendering may provide significant economic, environmental andbiosecurity benefits to the UK pig industry.Potential benefits include:
Economic
• An increase in the storage time and collection interval and potentially reduced costs associated with carcase disposal
• Maintaining the quality of carcasematerial sent to renderers may increase the yield and quality of the rendered products and their economic value
• The introduction of some carcase cooling systems may be cost effective with relatively short payback periods
• Pillar 2 common agricultural policy funding may be available to encourage the development and uptake of on-farm carcase cooling.
Environmental
• Secure on-farm storage and containment of fallen stock
• A reduction in odour emissions produced during storage, transportation and rendering and a reduction in the costs associated with odour control
• Increased compliance to legislation regarding the treatment and disposal of fallen stock (both on-farm and by processing plants)
• Enhanced public perception of the animal by-product industry.
Biosecurity
• Secure on-farm storage and containment may prevent access by wildlife, rodents and flies
• Appropriate siting of on-farm storage facilities could reduce the possibility of disease transmission and improve biosecurity
• A reduction in the frequency of collection visits and vehicle movements between farms may reduce the possibility of disease transmission and improve biosecurity
• Increased farmer awareness of biosecurity and disease prevention, including retention of resulting juices.
Further information: http://www.bpex.org.uk/research-innovation/research/environment/
Research
The BPEX Yearbook 2014-2015 59
Carcaase coolers
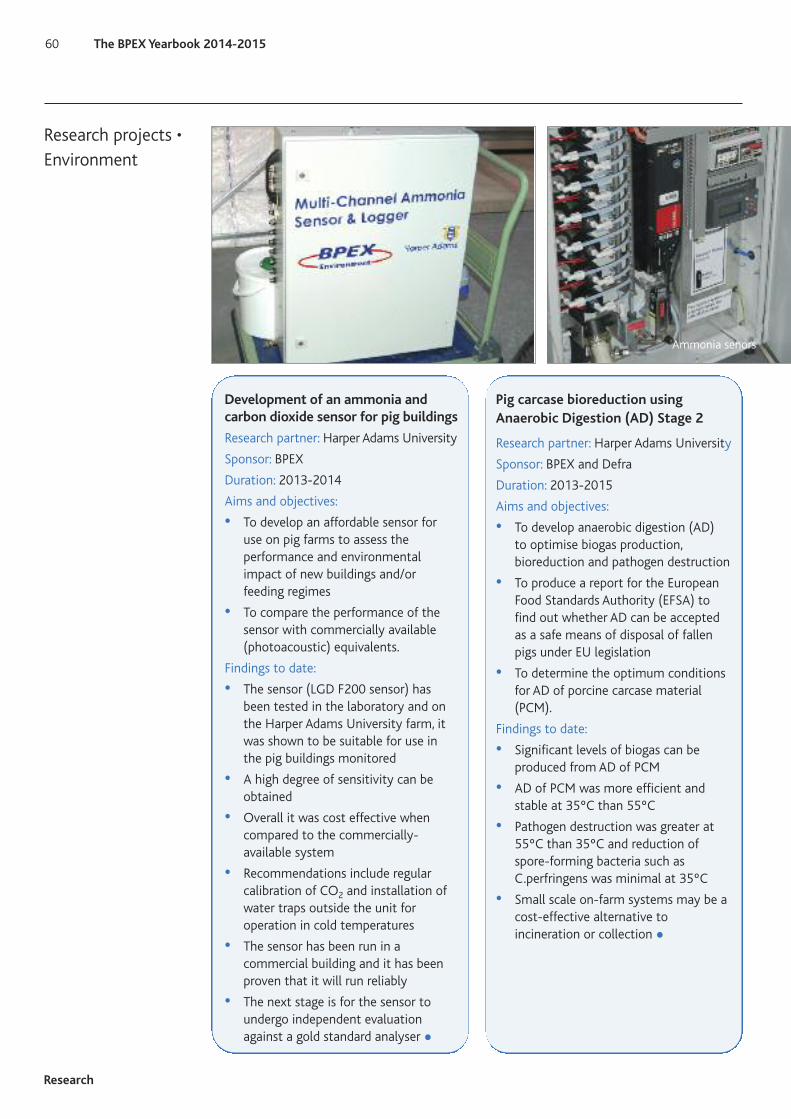
Research
60 The BPEX Yearbook 2014-2015
Research projects •Environment
Development of an ammonia andcarbon dioxide sensor for pig buildings
Research partner: Harper Adams University
Sponsor: BPEX
Duration: 2013-2014
Aims and objectives:
• To develop an affordable sensor for use on pig farms to assess the performance and environmental impact of new buildings and/or feeding regimes
• To compare the performance of the sensor with commercially available (photoacoustic) equivalents.
Findings to date:
• The sensor (LGD F200 sensor) has been tested in the laboratory and on the Harper Adams University farm, it was shown to be suitable for use in the pig buildings monitored
• A high degree of sensitivity can be obtained
• Overall it was cost effective when compared to the commercially-available system
• Recommendations include regular calibration of CO2 and installation of water traps outside the unit for operation in cold temperatures
• The sensor has been run in a commercial building and it has been proven that it will run reliably
• The next stage is for the sensor to undergo independent evaluation against a gold standard analyser •
Pig carcase bioreduction using Anaerobic Digestion (AD) Stage 2
Research partner: Harper Adams University
Sponsor: BPEX and Defra
Duration: 2013-2015
Aims and objectives:
• To develop anaerobic digestion (AD) to optimise biogas production, bioreduction and pathogen destruction
• To produce a report for the European Food Standards Authority (EFSA) to find out whether AD can be accepted as a safe means of disposal of fallen pigs under EU legislation
• To determine the optimum conditions for AD of porcine carcase material (PCM).
Findings to date:
• Significant levels of biogas can be produced from AD of PCM
• AD of PCM was more efficient and stable at 35ºC than 55ºC
• Pathogen destruction was greater at 55ºC than 35ºC and reduction of spore-forming bacteria such as C.perfringens was minimal at 35ºC
• Small scale on-farm systems may be a cost-effective alternative to incineration or collection •
Ammonia senors

Research
The BPEX Yearbook 2014-2015 61
Reducing the excretion of phosphorus (P) from growing and finishing pigs – development of a decision support tool
Research partner: Newcastle University
Sponsor: BPEX funded studentship (Vasilis Seymou)
Duration: 2010-2014
Aims and objectives:
• To extend an existing pig growth modelin order to predict P excretion in the environment under different feeding scenarios for different pig genotypes
• To enable the formulation of pig diets thatmaximise P utilisation while minimising P excretion to the environment.
Findings to date:
• One recommendation is that the feed industry should provide a clear indicationof the phytase activity in terms of phytase units (FTU)
• There could be enormous value in this work and other if nutrition and breeding companies could share information and collaborate to provide relevant information regarding standard growth rates and feed intake
• The model showed that leaner genotypes excrete less P but gross efficiency of P utilisation is lower when both lean and fatter genotypes are givenaccess to the same food. This is because they need to eat less food to put on a kilogram of weight
• Some ingredients have a more positive consequence in terms of P excretion than others and the model allows this tobe assessed
• Phase feeding follows the law of diminishing returns, ie less benefits are expected in terms of P excretion if one moves from 3 to 4 phases
• Sorting by weight as a feeding strategy does not produce returns from an environmental perspective compared to other feeding strategies, but can producereturns from a pig growth point of view
• The model suggests that variability in feed composition will have substantial effects on P excreted from groups of pigs
• The model will consider different growthcharacteristics based on genotype •
Example output from the decision support tool

Research projects •Environment
Research
62 The BPEX Yearbook 2014-2015
Environmental and nutritional benefits of bioethanol co-products(ENBBIO)
The ENBBIO LINK project was a collaboration involving 25 industry and academic partners, sponsored by Defrathrough the Sustainable Livestock Production LINK programme.
Project duration: 2010-2014
Aims and objectives:
• To quantify the chemical composition of UK wheat Dried Distillers Grains with Solubles (W-DDGS) and other co-products
• To identify the limitations associated with feeding W-DDGS
• To identify routes to improving nutritional value of W-DDGS
• To test the modified and improved W-DDGS products using ruminant and non-ruminant species
• To quantify the overall benefits of W-DDGS production on reducing diffuse pollutants and enhancing home-grown protein production.
Findings to date:
• The project has established the ideal digestibility of W-DDGS
• W-DDGS from a modern bioethanol plant is very consistent in quality and the protein content of it is less variable than the original wheat used at intake
• W-DDGS has been used to successfully replace a significant proportion of the soya protein in poultry and dairy diets; analysis to understand animal responses and commercial value is ongoing
• Small scale farm feeding trials have been completed, monitoring growth through to carcase composition and quality
• Results will be published in summer 2015 •

Research
The BPEX Yearbook 2014-2015 63
The English pig industry has a large variety of productionsystems including indoor units, outdoor units, straw basedand slatted accommodation. This mixture makes the industry very different from our global counterparts andBPEX aims to narrow the technical performance gap between English pig producers and our competitors.
Steve Winfield
KT Lead and Corporate
Account Manager
Production efficiency

Research
64 The BPEX Yearbook 2014-2015
Sorting pigs at weaning in order to reduce variability and improve the efficiency of pig production systems
Research partners: Newcastle University
Sponsors: BPEX-funded studentship (Anne Huting)
Duration: 2014-2018
Aims and objectives:
• To reduce variability within pig groups through management and by doing so improve the efficiency of production systems
• To investigate the consequences of different management strategies on lifetime performance of light, normal and heavy pigs
• To develop cost-effective feeding regimes •
Strategies for the optimisation of finishing places
Research partners: Harper Adams University
Sponsors: BPEX
Duration: 2014-2015
Aims and objectives:
• To improve the efficiency of pig production in the final finisher phase, by having clear strategies for pen emptying
• To determine daily live weight gain, food conversion ratio and daily feed intake for groups of finisher pigs from 70-100kg live weight
• To investigate the effects of drawing pigs for slaughter from a pen on the performance of the remaining pigs
• To devise a spreadsheet for an optimal management system •
Research projects • Production efficiency
The contribution of oocytes and follicular fluid to pig fertility
Research partners: The Roslin Institute,University of Edinburgh
Sponsors: BPEX-funded studentship (Selene Jarrett)
Duration: 2014-2018
Aims and objectives:
• To identify differences in the molecularcomposition of follicular fluid as a result of a high fibre diet
• To identify nutrition dependent molecular mechanisms involved in blastocyst development
• To optimise oocyte maturation environment in vivo and in vitro •

Research
The BPEX Yearbook 2014-2015 65
Improving udder quality traits in sowsto aid survival, health and lifetime performance of piglets
Research partners: Newcastle University
Sponsors: BPEX-funded studentship (Agnese Balzani)
Duration: 2012-2015
Aims and objectives:
• Develop a methodology to describe a sow udder (eg conformation, ease of colostrum extraction)
• Determine the causes of udder conformation variation and define how measures change over the reproductive cycle and lifetime of the sow
• Investigate the relationship between udder conformation and piglet suckling behaviour and litter performance
• Evaluate an on-farm method to estimate colostrum quality and study the relationship between udder morphology and colostrum quality
• Estimate the heritability of key udder traits and colostrum quality and their genetic correlations with other important maternal selection criteria.
Findings to date:
An ideal udder:
• At least 12 functional teats
• Teats situated equal distance from one another
• Small teat length and diameter
• Close to the abdominal mid-line •

Research
66 The BPEX Yearbook 2014-2015
Pork safety and product quality
Food hygiene is vitally important and there are many regulations covering abattoirs. These regulations govern general food hygiene but there arefurther rules and regulations for meat.Food business operators of pig abattoirs must also comply with regulationsthat govern animal welfare and animalhealth.
Emma Bailey-Beech
Health Information
and Food Safety
Coordinator
The fourth point of the BPEX 5-Point Plan addresses the area of safe and traceable pork. BPEX aims to help producers andprocessors produce pork that continues to besafe and which consumers can have confidence is fully traceable from farm to finished product.
BPEX aims to:
• Support the pig meat supply chain in producing wholesome pork products with safety, provenance and integrity from farmto fork
• Promote the use of isotope tracing using SIRA (Stable Isotope Reference Analysis) tool through the supply chain
• Work with RUMA and PVS to reduce the need to use antimicrobials
• Set up a technical processor forum on food safety and traceability •
Ouafa Doxon
Health Information
and Food Safety
Coordinator
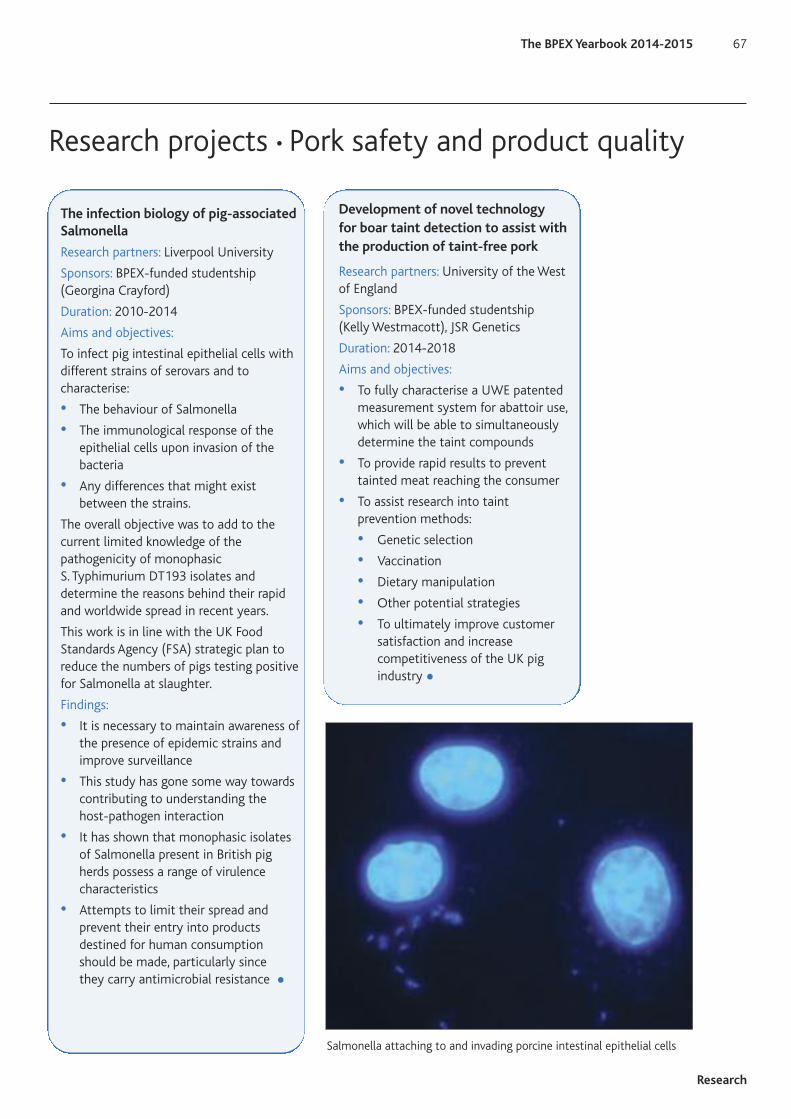
Research
The BPEX Yearbook 2014-2015 67
The infection biology of pig-associatedSalmonella
Research partners: Liverpool University
Sponsors: BPEX-funded studentship(Georgina Crayford)
Duration: 2010-2014
Aims and objectives:
To infect pig intestinal epithelial cells withdifferent strains of serovars and to characterise:
• The behaviour of Salmonella
• The immunological response of the epithelial cells upon invasion of the bacteria
• Any differences that might exist between the strains.
The overall objective was to add to the current limited knowledge of the pathogenicity of monophasic S. Typhimurium DT193 isolates and determine the reasons behind their rapidand worldwide spread in recent years.
This work is in line with the UK Food Standards Agency (FSA) strategic plan to reduce the numbers of pigs testing positivefor Salmonella at slaughter.
Findings:
• It is necessary to maintain awareness of the presence of epidemic strains and improve surveillance
• This study has gone some way towards contributing to understanding the host-pathogen interaction
• It has shown that monophasic isolates of Salmonella present in British pig herds possess a range of virulence characteristics
• Attempts to limit their spread and prevent their entry into products destined for human consumption should be made, particularly since they carry antimicrobial resistance •
Research projects • Pork safety and product quality
Development of novel technology for boar taint detection to assist withthe production of taint-free pork
Research partners: University of the Westof England
Sponsors: BPEX-funded studentship (Kelly Westmacott), JSR Genetics
Duration: 2014-2018
Aims and objectives:
• To fully characterise a UWE patented measurement system for abattoir use, which will be able to simultaneously determine the taint compounds
• To provide rapid results to prevent tainted meat reaching the consumer
• To assist research into taint prevention methods:
• Genetic selection
• Vaccination
• Dietary manipulation
• Other potential strategies
• To ultimately improve customer satisfaction and increase competitiveness of the UK pig industry •
Salmonella attaching to and invading porcine intestinal epithelial cells

Events
68 The BPEX Yearbook 2014-2015
EventsDuring the year the BPEX Technical team held a one-day technical conference at Stoneleigh Park, showcasing the latest innovation in feeding and a series of half-day events around the country looking at how to optimise kilograms sold per square metre. These were in addition to the pig clubs and workshops run by the regional KT managers. These national events attracted over 370 delegates in total, both producers and allied industry.
Innvovation Conference
Aimed at forward thinking owners and farmmanagers, vets and allied industry.
Topics covered included:
• Future pig feeding
• Feed blending
• Gestal wireless lactating sow
• Outdoor ESF
• Precision feeding
• What might we be feeding pigs in 2020?
• What answers might plant breeding provide to pig nutrition?
• Innovations in recording and management systems
• How I use data to drive my business
• How data can be used in the pig sector (PIVIT)
• How we might use data to make better
• Precision pig farming in 2020.
Regional producer events
Aimed at farm managers and stock people.
Topics covered:
• Optimising weaned pig quality
• Managing the small pig at weaning
• The growth challenge
• Winning the Numbers Game.
Presentations, podcasts and videos can be accessed online at: http://www.bpex.org.uk/events/conferences/2014/

Tools
The BPEX Yearbook 2014-2015 69
Tools
As well as a wide range of publications BPEXalso provides an array of online and on-farmtools for the benefit of producers and alliedindustry. Some of these tools are listed belowand all can be accessed or requested via theBPEX website: http://www.bpex.org.uk/publications-tools/
Online
CalculatorsRanging from cost of production, PMWSseverity estimation and PMWS economics toantimicrobial benchmarking.
Practical pig appShort video clips that demonstrate practicalmanagement techniques on farm.
HR ToolkitIncludes resources such as a new staff induction template, skills matrix and appraisalform template.
QuizzesInteractive quizzes to test your knowledgeand learn as you go along.
Recording toolkitA toolkit of resources to help businesses understand trends and patterns in herd performance data as well as establishing whatinformation is most useful to observe on aweekly, monthly and quarterly basis.
Antimicrobials toolA tool to help producers comply with RedTractor Assurance Pig Scheme requirements,effective from 1 October 2014.
On-farm
• Farrowing discs
• Biosecurity fence/gate signs
• Clipboards
• Magnets (medicated feed notice for feed bins and vet med information for fridges)
• Hand sanitisers.
12
1
2
3
4
5
6
7
8
9
10
11 TIME
1 23
4
5
6
7
8
9
1011
12131415
16
17
18
19
20
21
2223
24
BORN ALIVE
01
2
3
45
6
7
8
9BORN DEAD
Farrowing Disc
For more information and advice contact: BPEX, Stoneleigh Park, Kenilworth, Warwickshire CV8 2TLtelephone: 0247 647 8793 • email: [email protected] • website: www.bpex.org.uk© 2010 Agriculture and Horticulture Development Board (AHDB). All rights reserved.
Tools

70 The BPEX Yearbook 2014-2015

The BPEX Yearbook 2014-2015
While the Agriculture and Horticulture Development Board, operating through its BPEX division,seeks to ensure that the information contained within this document is accurate at the time ofprinting, no warranty is given in respect thereof and, to the maximum extent permitted by law, the Agriculture and Horticulture Development Board accepts no liability for loss, damage or injury howsoever caused (including that caused by negligence) or suffered directly or indirectly in relationto information and opinions contained in or omitted from this document.
© Agriculture and Horticulture Development Board 2015.
No part of this publication may be reproduced in any material form (including by photocopying orstorage in any medium by electronic means) or any copy or adaptation stored, published or distributed (by physical, electronic or other means) without the prior permission in writing of Agriculture and Horticulture Development Board, other than by reproduction in an unmodified formfor the sole purpose of use as an information resource when the Agriculture and Horticulture Development Board is clearly acknowledged as the source or in accordance with the provisions ofthe Copyright, Designs and Patents Act 1988. All rights reserved.
ISBN: 978-1-904437-87-7

AHDB PorkAgriculture and Horticulture Development BoardStoneleigh ParkKenilworthWarwickshireCV8 2TL
tel: 024 7647 8793
fax: 024 7647 8903
www.pork.ahdb.org.uk
AHDB Pork is a division of the Agriculture and Horticulture Development Board