the bpex yearbook 2013-2014 - ahdb pork · 2017-07-14 · contents 1 the bpex yearbook 2013-2014...
TRANSCRIPT

The BPEX Yearbook 2013-2014Key industry statistics, pig performance data and details of knowledge transfer, research and development activity
CONTENTS
1
The BPEX Yearbook 2013-2014
page
Preface 3
BPEX Board 4
STRATEGY AND BUDGET 5
The 5-Point Plan 5
Resources 8
Summary Budget 8
INDUSTRY STATISTICS 9
Cost of Production 9
Performance Trends in the British Pig Herd 11
Industry Trends 12
Retail Pig Meat Purchases 14
INTERNATIONAL COSTS OF PIG PRODUCTION 15
Summary of Key Findings 15
ECONOMIC AND FINANCIAL PERFORMANCE DATA 20
Cost of Production Tables 20
TECHNICAL PERFORMANCE DATA 34
Introduction 34
KNOWLEDGE TRANSFER 47
Two-Tonne Sow Campaign 47
Services and Opportunities 47
On-Farm Reviews 47
On-Farm Investigations and Field Trials 48
Innovation Fund 52
Staff Development and Training 57
Business Insight Trips 61
Regional Producer Events 62
Pig Health Improvement Projects 62
Lorry Wash Trial 64
Ventilation Project 65
Thermal Management for Efficient Pig Production 66
Notifiable and Emerging Disease Threats 67
Introduction of Real Welfare into the Red Tractor Pig Scheme 68
BPEX Pig Health Scheme (BPHS) 71
Media and Publications 73
continued

CONTENTS
2
The BPEX Yearbook 2013-2014
page
RESEARCH, DEVELOPMENT AND INNOVATION 75
Climate Change and the Environment 75
Health and Welfare Projects 82
Meat Quality and Safety 92
Production Efficiency 94
PREFACE
Closing the gap with our European counterparts is still the main aim for our industry and British producers havemade significant progress.
Over the last few years, the improvement in daily liveweight gain in the British herd has been well ahead of ourmajor competitors. It is also interesting to note that the GB indoor herd has made steady year-on-year improvementsin terms of born alive and pigs weaned per sow. This would indicate, if this trend is continued, a closing of the breedingperformance gap is beginning to emerge for the GB indoor herd.
BPEX has an important role to play here in improving productivity and the Innovation Fund is proving its worth. Lastyear, two schemes were highlighted and one of them, using scales linked to a computer to monitor weight gain, hasproduced positive results. At the farm concerned, the performance of weaners increased from 459g/day to 515g/day;growers from 842g/day to 915g/day and finishers from 880g/day to 950g/day. More innovation projects are nowunderway including an evaluation of electronic sow feeding outdoors which is looking positive.
Anything that helps reduce the cost of production is welcome and this Yearbook contains a wealth of informationcovering every aspect of production along with post-farmgate facts and figures.
Whatever the cost of production, the price a producer is paid is paramount and, after a long period where the DAPPwas below the cost of production, that position has now been reversed.
However, the result of the lean years is a cumulative loss across the industry of some £165 million which has to becovered if the industry is to be sustainable.
Improving margins should lead to increasing confidence among producers which means the industry as a whole willcontinue to invest in new buildings which in turn will mean better productivity.
This is being targeted by BPEX in the Two Tonne Sow campaign – aimed at producing 2,000kg of pig meat per sowper year. It has been refocused on the breeding herd. With the Breed +3 initiative, BPEX aims to help every producermove towards an extra three pigs per sow per year weaned, whether they’re currently averaging at 23 pigs weanedor if they’re already at 27 and want to get to 30.
The ultimate aim of BPEX remains unchanged. It is to support producers with the knowledge that will help savemoney and give them the ability to compete on a sustainable basis.
Mick Sloyan DirectorBPEX
3
The BPEX Yearbook 2013-2014

BPEX BOARD
The BPEX Board meets six times a year to determine the English pig industry strategy and to ensure that English piglevy payers’ money is efficiently deployed in line with the BPEX strategy.
BPEX Board for the period 2013-2014 comprised the following Directors appointed by Defra.
4
The BPEX Yearbook 2013-2014
Stewart Houston Alastair Butler Jon Easey Richard LongthorpBPEX Chairman Blythburgh Free Range Pork MJ & JA Easey LKL Farming
Microware Pig Systems
Ian Smith Richard Hooper Rob MercerBedfordia Farms Ltd Harper Adams University Packington Pork
Marcus Cheale Barry Lock Andrew Saunders William de KleinCheale Meats of Brentwood Cranswick Tulip UK KARRO Food Group
Clive Francis Iain Wylieuntil May 2013 from October 2013
Independent
Processors
Producers

STRATEGY AND BUDGET
In January 2014, the BPEX Board agreed the new strategy for 2014-2018: “Going for Growth” and a correspondingfive-point plan to deliver the BPEX mission:
“To help English pig production and processing businesses become more competitive and profitable”
This mission will be delivered by helping English pig production businesses to reduce the performance gap againstour competitors by identifying incremental gains and accumulating these over time. In addition, we will help theindustry maximise the price premium in the British market, derived from both domestic and overseas demand.
THE 5-POINT PLAN
The delivery of the business plan will be focused on the five key points in the Going for Growth strategy:
1. Close the gap
2. Protect the environment
3. Enhance pig welfare
4. Encourage safe and traceable pork
5. Help sell more pork.
These activities will be integrated and reinforcing of each other. For example, helping the industry reduce its impacton the environment through the more efficient use of resources should also help to close the productivity gap againstour competitors. Equally, taking action to reduce the risk of foodborne disease will also improve pig health, welfareand productivity.
1. Close the Gap
Objective: Narrow the technical performance gap between English pig producers and our competitors.
Analysis of GB and EU technical performance indicates that there has been a closing of the average performancegap in the GB finishing herd and limited progress in GB indoor breeding herds. Outdoor breeding herd performanceremains relatively static.
The 2014-15 financial year will cover a transitional period during which a more focused agenda to deliver improvements in pig technical performance will be established. The overall objective will be to help the industry improve average breeding herd performance by 1.0 pig/sow/year, increase finishing DLWG by 50g and enhance FCRby 0.1.
To achieve this, we will:
• Establish a single regional field team with increased focus on delivering technical support to businesses
• Introduce four new Regional Technical Forums to assist in identifying and prioritising knowledge gaps, emerging technical issues and establishing robust field trials to be established in commercial settings
• Consider fundamental and applied research if it can be demonstrated to contribute to knowledge gaps which are relevant and a priority for English production and processing businesses
• Support skills development for all levels of pig production staff
• Develop online pig health resources, including herd health mapping tools and a herd health cost calculator which can be used by producers and other industry partners to deliver health improvement programmes within individual businesses
• Work in partnership with the wider AHDB group to assist individual businesses and supply chains to identify and access external research and knowledge transfer platforms and funding opportunities such as AgriTech and Horizon 2020
• Deliver a range of market intelligence services and data to support business decision-making by levy. EU legislation, policy, production and price data will be provided via the AHDB Brussels’ office.
Strategy and Budget 5
The BPEX Yearbook 2013-2014

2. Protect the Environment
Objective: Help pig producers and processors comply with existing and emerging legislation and achieve recognitionfor progress made.
To achieve this, we will:
• Provide technical support to businesses seeking to become more efficient through investment in and management of production facilities and technology which will also help to “Close the Gap”
• Provide continued technical support to producers on the practical implementation of regulations, helping to reduce regulatory burdens and address public concerns through better understanding of environmental impacts including odour and ammonia
• Offer technical support to producers seeking permits and planning permission for new buildings, providing general guidance and tools to ease completion of common information requested and facilitating access to information on advances in building design and technologies
• Engage with UK and EU policy makers and regulators
• Manage industry input to strategic activity including the Greenhouse Gas Action Plan and associated activity on climate change adaptation with Defra
• Continue to develop methods and tools to quantify the benefits of improved practice contributing to “Closing the Gap”, eg Life Cycle Assessment that can be used at industry level to demonstrate progress in improving sustainability
• Capture global best practice and scientific outputs, provide information and technical support on buildings and related technologies, such as precision farming, that help producers find practical solutionson air and water quality, energy use and compliance with legislation
• Commission field trials or research to address knowledge gaps
• Work in partnership with other divisions of AHDB to streamline and improve advice to maximise the benefits from straw, slurry and manure.
3. Enhance Pig Welfare
Objective: Help pig producers comply with existing and emerging legislation and achieve recognition for progressmade.
Maintaining consumer confidence in the reputation of English pork will be underpinned by a commitment tocontinuous improvement in pig welfare that is economically sustainable. We will also help the industry to guardagainst unnecessary regulation through the monitoring of emerging legislation and provision of scientific data whererequired.
To achieve this, we will:
• Deliver the implementation of Real Welfare in conjunction with AFS, NPA and PVS
• Continue to review and refine Real Welfare measures in collaboration with the industry, promote the benefits of the system to our customers and build a base of firm support among producers and vets
• Further develop the BPEX Real Welfare website with targeted advice on achieving high welfare in any husbandry system, capturing global and local research and best practice focused on the five iceberg indicators assessed in Real Welfare
• Provide technical support on the practical implementation of regulations, such as ‘Welfare of Animals at the Time of Killing’, and engage with Government, EU, industry and NGOs on technical evaluation and impact assessment of emerging welfare regulations.
Strategy and Budget6
The BPEX Yearbook 2013-2014

4. Encourage Safe and Traceable Pork
Objective: Help producers and processors produce pork that continues to be safe and which consumers can haveconfidence is fully traceable from farm to finished product.
To achieve this, we will:
• Support individual processors and their trade associations through the monitoring assessment and, where necessary, engagement with UK and EU policy makers on the implementation of new regulations
• Work with FSA and industry partners to streamline Food Chain Information to permit effective risk profiling that will minimise red tape
• Implement a three-year roadmap for the provision of reliable Collection and Communication of Inspection Results (CCIR) information on post-mortem slaughter lesions back to producers. We will ensure that the flow of quality information is maintained while this roadmap is being implemented
• Co-operate with AHVLA and co-ordinate producer and processor involvement with the Defra-funded field-based study of control measures for Salmonella on pig farms and their effect on endemic disease and productivity
• Demonstrate cost-efficient benefits from interventions for health, food safety and production efficiency,which will lead to reduction in expenditure on therapeutics while maintaining or enhancing production efficiency and reducing food safety risks
• Support the RUMA (Responsible Use of Medicines in Agriculture) Alliance on industry strategy for responsible antimicrobial use and on replacement, reduction and refinement of usage through health planning and tools to monitor and benchmark usage
• Engage with AHVLA on the development of an integrated surveillance plan to monitor new and emerging high impact diseases that present a risk to pig and/or public health and to long-term business sustainability
• Operate a programme of Stable Isotope Reference Analysis (SIRA) testing of pork, bacon and ham that will enhance the existing paper-based traceability and auditing process used in the BMPA schemes that underpin the Red Tractor.
5. Help sell more pork
Objective: Stimulate the demand for pork through communication of the benefits of choosing pork and securingand developing export markets.
To achieve this, we will focus on five areas:
• Rejuvenate the image of pork over the next 3-5 years and create a desire for particular cuts of pork. This will be done through campaigns on cuts of fresh pork where there is clear opportunity to add value
• Differentiation from the competition using the “Choose Red Tractor Assured pork” message will remain important, focusing on the values of the Red Tractor Scheme, such as trust and traceability
• Promote the health benefits of pork, including its nutritional and relative fat content to other proteins. We will also aim to create positive and credible scientific news about the nutritional profile of pork and to put the industry in a position where we have a stronger evidence base from which to communicate the benefits of pork
• Promote pork as an environmentally sustainable food to consumers and to the media
• Continue to develop export markets for pork and pig meat products in China; consolidate other Third Country markets where access has been obtained; work with Defra to gain access to priority markets of commercial interest, as decided by the industry, and provide an appropriate scale of support for the promotion and development of pig genetic exports.
Strategy and Budget 7
The BPEX Yearbook 2013-2014
Resources
BPEX resources are almost exclusively provided from the levy on producers and processors which will remain at 85pa pig for producers and 20p a pig for processors applied to pigs slaughtered in England.
It is forecast that pig slaughter in England in 2014/15 will increase, resulting in net levy income increasing by £172kcompared to the current financial year.
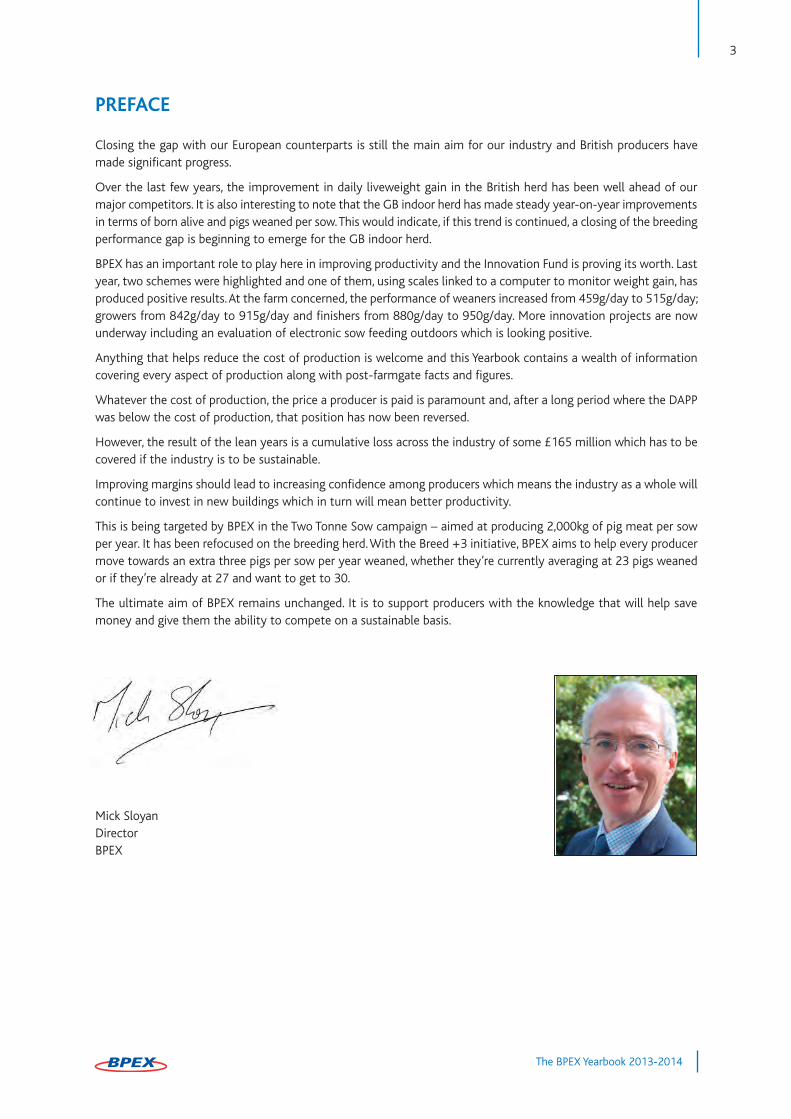
Summary Budget
Budget allocation in 2014-2015 (£’000)
Strategy and Budget8
The BPEX Yearbook 2013-2014
Closing the Gap
Environment
Welfare
Safe and Traceable Pork
Communications
Market Intelligence
Marketing
Exports
BPEX Support
AHDB Overheads
£1,901£310
£175
£562
£383
£648
£3,580
£428
£413
£670

Industry Statistics 9
The BPEX Yearbook 2013-2014
INDUSTRY STATISTICS
The objective of BPEX Market Intelligence (MI) is to provide relevant, useful, accurate and timely market informationto the English pig and allied industries. This should support them in understanding the market and making decisionsthat maximise their competitiveness and sustainability and also improve supply chain transparency. Activitiesundertaken by the Market Intelligence function focus on both the supply and demand side of the industry and includethe following:
• The collection and calculation of weekly pig, pig meat and other red meat price data and market information
• The production of accurate market forecasts of meat production and consumption
• The collection and provision of average pig production costs and performance measurement
• The publication of relevant market information and analysis from the UK, EU and beyond, through regular free publications, the BPEX website and other media
• The collation and publication of international cost and physical performance comparisons, which are addressedthrough the InterPIG project
• Enabling BPEX marketing activity to be based on a sound knowledge and understanding of the market and consumers from research provided by the Market Intelligence function.
The following sections of the report aim to summarise some of these key market statistics and performance trends.
COST OF PRODUCTION
According to data from InterPIG, the cost of pig meat production in Great Britain increased by two per cent in 2012,to £1.53/kg. The average cost of production in the EU was £1.46/kg deadweight, a two per cent reduction in sterlingterms. GB production costs increased during the course of 2012, peaking around the start of 2013 before falling backagain to end the year close to their level at the start of 2012. Based on provisional estimates, average costs in 2013were slightly lower than in 2012.
The GB Deadweight Average Pig Price (DAPP) rose steadily during most of 2012 and 2013, reaching a record level ofjust over 172p/kg in October 2013. Nevertheless, throughout 2012 and the first half of 2013, pig prices were belowproduction costs, meaning producers were losing money. Since June 2013, costs have fallen below prices, allowingproducers to start paying back losses from earlier years. Nevertheless, pig prices remain below the peak of productioncosts in early 2013, meaning producer margins remain vulnerable to any future increase in input costs (or decreasein pig prices).
Figure 1 Total cost of pig production compared with the DAPP
Source: AHDB Market Intelligence
Jan-12 Apr-12 Jul-12 Oct-12 Jan-13 Apr-13 Jul-13 Oct-13 Jan-14
180
170
160
150
140
130
120
110
p per kgAverage COP DAPP

Industry Statistics10
The BPEX Yearbook 2013-2014
COST OF PRODUCTION
Figure 2 Average compound feed prices, GB
Figure 3 Prices for feed wheat and soya meal
Average quarterly compound feed prices in Great Britain peaked in the first quarter of 2013 at around £291 pertonne, up 14 per cent on the 2011 figure and 34 per cent on 2010. Although prices have subsequently fallen back,they remain well above their level in 2010 (and earlier years).
UK prices for soya meal and feed wheat also increased sharply from the summer 2012 reaching peaks of £450 and£225 per tonne, respectively. Feed wheat prices fell back steadily during the first half of 2013 and have been broadly
Source: Defra
Source: AHDB/HGCA
2010 2011 2012 2013 Q1 2013 Q2 2013 Q3 2013 Q4
310
290
270
250
230
210
190
170
150
£/tonne
217
£/tonne500
450
400
350
300
250
200
150
100
Jan-12 Jul-12 Jan-13 Jul-13 Jan-14
Feed wheat
Soya meal
255
265
291 288
274
260

Industry Statistics 11
The BPEX Yearbook 2013-2014
COST OF PRODUCTION
stable since last summer’s harvest at around £160 per tonne. However, soyameal prices have remained firm asdemand growth continues to keep pace with higher production and have remained above £350 per tonne for mostof the last two years.
PERFORMANCE TRENDS IN THE BRITISH PIG HERD
Key annual trends in physical performance for the British breeding, rearing and feeding herds from 2009 to 2013 areshown in Table 1. The average of InterPig EU countries is also displayed for the 2012 calendar year.
Performance improved across many breeding herd indicators during 2013 but was typically still at or below the EUaverage from the previous year. As an example, the number of pigs born alive per litter rose by 0.33 but was still0.84 pigs below the 2012 EU average. Unlike most InterPig members, GB has a significant proportion of outdoorkept sows, where average performance is lower. Nevertheless, most figures for GB indoor breeding herds are stillbelow the EU average.
The feed conversion ratio and daily weight gain for the feeding herd worsened slightly in 2013, perhaps influencedby the hot weather over the summer. However, they were still close to or better than the EU average, although thisis partly because GB producers finish pigs at lighter weights and males are not castrated.
Table 1 Performance trends in Great Britain
2009 2010 2011 2012 2013 2012
Breeding herd EU average
Sow mortality (%) 4.7 3.6 3.3 3.6 4.5 5.7
Litters per sow per year 2.25 2.25 2.25 2.26 2.29 2.29
Pigs born alive per litter 11.22 11.20 11.37 11.54 11.87 12.71
Pre-weaning mortality (%) 12.4 12.7 12.6 12.7 13.0 12.7
Pigs weaned per litter 9.82 9.79 9.96 10.08 10.33 11.08
Pigs reared per sow per year 22.2 22.1 22.5 22.9 23.6 25.4
Average weaning age (days) 27 27 26 27 26 27
Rearing herd
Weight of pigs at start (kg) 8.0 7.4 7.4 7.4 7.2 7.5
Weight of pigs produced (kg) 34.9 34.6 36.8 35.9 31.5 30.1
Mortality (%) 2.6 2.7 2.6 2.5 4.0 2.7
Feed conversion ratio 1.80 1.75 1.71 1.77 1.84 1.85
Daily liveweight gain (g) 450 486 489 489 479 418
Feeding herd
Weight of pigs at start (kg) 38.8 38.0 39.8 38.4 38.9 30.1
Weight of pigs produced (kg) 103.3 103.9 103.0 102.7 99.9 117.1
Mortality (%) 2.8 3.0 2.9 2.5 3.1 2.6
Feed conversion ratio 2.77 2.95 2.82 2.72 2.83 2.91
Daily liveweight gain (g) 819 766 784 822 787 780
Source: Agrosoft Ltd, InterPIG

Industry Statistics12
The BPEX Yearbook 2013-2014
INDUSTRY TRENDS
Table 2 shows changes in pig carcases between 2008 and 2013. The upward trend in carcase weights, which hadstalled somewhat in the previous two years, resumed in 2013, with the average reaching a record of 79.5kg. Lowerfeed costs and some changes to processor specifications to mitigate tight supplies contributed to the increase in2013. Probe measurements also increased marginally. The net result was a very small drop in the lean meatpercentage, which was just over 61 per cent.
In 2008, 24 per cent of clean pigs slaughtered had a dressed carcase weight of less than 70kg. By 2013, that proportionhad fallen to 11 per cent. Over the period, pigs with carcase weights of 80kg and over rose from just over a third tonearly half and there was also a rise in the proportion of pigs weighing over 90kg, from six per cent to nine per cent.
Table 2 Average abattoir results
Figure 4 Carcase weight distribution in 2008 and 2013
UK clean pig slaughterings during 2013 were virtually unchanged from the previous year; total throughputs were upjust 12,000 head. This is in marked contrast to the steady growth of recent years, as the decline in the breeding herdduring 2012 offset any productivity gains. Any increase in slaughterings was limited to England, where numbers wereup four per cent on the year. The Scottish kill was down by almost half following the closure of its largest abattoirin late 2012. Throughputs in Northern Ireland were down by two per cent and Welsh slaughterings by nine per cent.Despite stable numbers, heavier carcase weights meant that overall UK pig meat production in 2013 was 833,000tonnes, one per cent up on the previous year.
2008 2012 2013
Back fat (P2, mm) 10.8 10.9 11.0
Lean meat (%)† 61.6 61.5 61.4
Carcase weight (kg) 75.8 78.7 79.5
† An average predicted lean meat percentage based on the following equation:Lean meat % = 66.5 – 0.95 x P2 + 0.068 x carcase weight
Source: AHDB Market Intelligence
Under 60 60–69.9 70–79.9 80–89.9 90+
2008
2013
45
40
35
30
25
20
15
10
5
0
Weight range (kg)
per cent

Industry Statistics 13
The BPEX Yearbook 2013-2014
INDUSTRY TRENDS
Sow cullings for the whole year totalled 252,000 head, five per cent lower than the previous year, as lower feedprices meant that cullings returned to more normal levels from the inflated throughputs in the second half of 2012.
Latest data confirm that UK imports of fresh and frozen pork were little changed in 2013. Lower shipments fromDenmark, the leading supplier, were offset by more Dutch, German and Belgian pork entering the UK. However,imports of cured and processed pig meat were lower than in 2012. Bacon and ham volumes fell by three per cent,with lower supplies from the two main providers, Denmark and Netherlands, only partly offset by increased shipmentsfrom elsewhere. Sausage imports were also down by three per cent, while other processed supplies dropped by fiveper cent.
UK pork exports during 2013 reached their highest level since before the Foot and Mouth Disease outbreak in 2001.Fresh and frozen pork shipments were up 16 per cent, with China the third largest market as volumes more thandoubled in the first full year of access. Shipments to the rest of the EU also increased, however, being up 12 per centon 2012. Some of this may have been destined for re-export. The rise in pork exports was partly offset by a fall inshipments of offal, which fell by 15%, despite growth in trade with Greater China. Offal exports to the rest of theEU were considerably lower than in 2012, particularly in the second half of the year.
Table 3 Industry trends
2009 2010 2011 2012 2013
UK breeding herd (000 head)
June 426 427 432 425 421
December 418 422 409 400 398
UK sow productivity (a)
Pigs per sow 19.5 20.2 21.7 22.5 23.0
Pig meat per sow (kg) 1,525 1,587 1,694 1,761 1,824
UK production and consumption
Clean pig slaughter (000 head) 8,824 9,233 9,813 10,035 10,047
Total pig meat production (000 tonnes) 720 758 806 825 833
Imports 951 941 960 943 926
(Fresh/frozen) 402 402 410 387 391
(Bacon (cwe)) 378 366 328 302 292
(Processed) 171 173 223 254 242
Exports total 155 186 207 203 227
Total pig meat consumption (000 tonnes) 1,516 1,515 1,559 1,564 1,532
Per capita consumption (kg/head) 24.5 24.3 24.9 24.8 24.1
Self-sufficiency in pig meat (b) 48% 50% 52% 53% 54%
cwe=carcase weight equivalent
(a) Not survey results. Based on relationship between adjusted clean pig slaughter (slaughterings minus live imports plus live exports) and lagged breeding herd
(b) Production as % of consumption
Source: AHDB Market Intelligence, Defra
Industry Statistics14
The BPEX Yearbook 2013-2014
RETAIL PIG MEAT PURCHASES
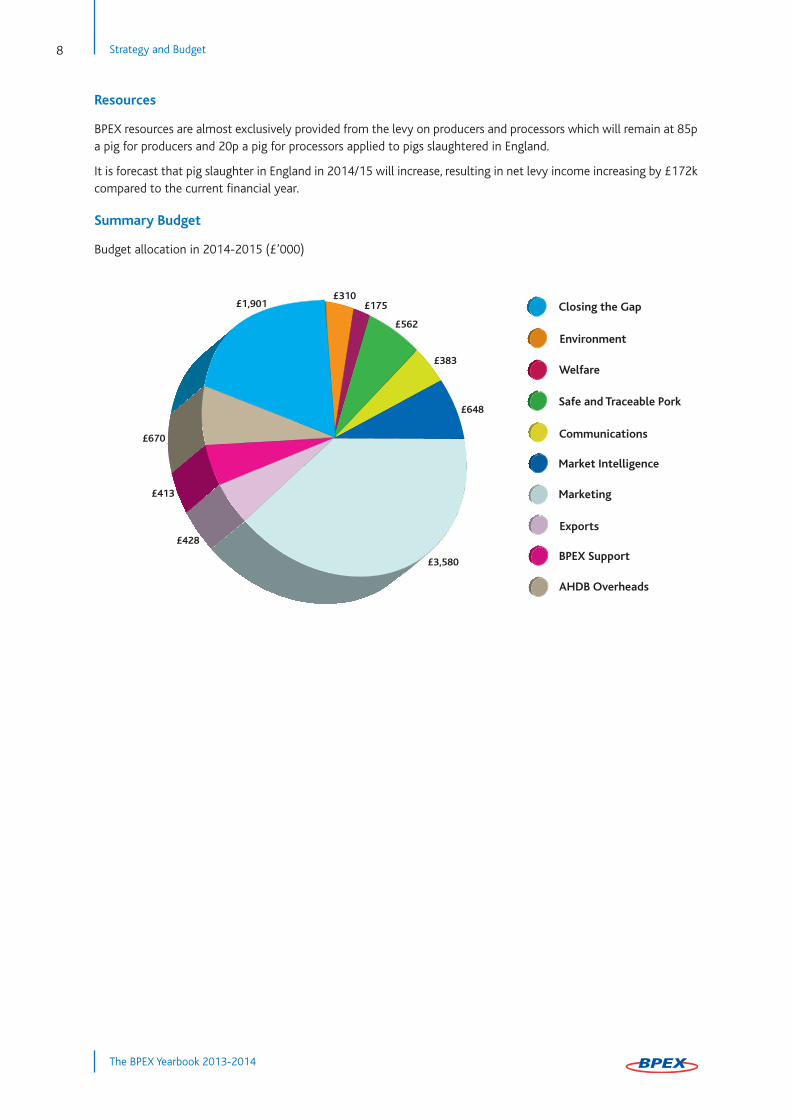
Retail data from Kantar Worldwide shows that in the 52-week period ended 5 January 2014, purchases of fresh andfrozen pork were three per cent lower than in the same period a year earlier. Only steaks, loin roasting joints andmarinades bucked this trend, with the latter two categories continuing their recent growth trend. Some of the declinein volume sales was driven by higher prices, which meant that consumer spending on pork was up by one per cent.
Bacon and sausage purchases were also hit by higher prices. The amount of bacon sold was four per cent lower thanin 2012 but expenditure on products in this category was down less than one per cent. Sausage purchases also fellby four per cent but spending rose by nine per cent. As well as price rises, this was partly due to consumers ‘tradingup’ from standard to premium sausages. The upward trend in sales of sliced cooked meats, mainly ham, continued.Volumes sold rose by two per cent on the year, with spending up three per cent.
Rising prices and reduced purchases weren’t limited to pork. Overall fresh and frozen meat sales were two per centlower than in 2012 but consumers spent three per cent more. Similar trends were apparent for both beef and poultrymeat, as well as pork. However, lamb bucked the trend, as increased supplies (driven by higher imports) meant priceswere lower. This led to an 11 per cent rise in lamb sales, with spending up eight per cent.
Table 4 Trends in retail pig meat values
2009 2010 2011 2012 2013
000 tonnes
Fresh and frozen pork 179.8 183.2 186.2 179.9 174.2
Pork belly 15.7 16.3 18.1 20.2 18.4
Pork frying/grilling chops 31.4 30.2 30.6 27.8 25.7
Pork frying/grilling steak 45.0 46.8 47.8 44.1 44.3
Pork leg roasting joint 31.9 28.0 27.1 22.7 21.1
Pork loin roasting joint 11.8 12.5 12.4 14.9 15.5
Pork shoulder roasting joint 26.2 31.2 30.4 28.8 26.0
Bacon 204.1 216.5 223.4 224.3 214.4
Pork sausages 169.1 170.1 175.1 172.5 166.0
Fresh pre-packed pork pies 32.6 34.0 34.7 34.0 30.4
Fresh pre-packed sausage rolls 33.5 36.0 35.0 31.7 29.8
Pork chilled ready meals 18.6 25.9 31.8 31.5 32.0
Pork sliced cooked meats 145.3 148.6 154.5 157.8 161.4
Source: Kantar Worldwide

International Costs of Production 15
The BPEX Yearbook 2013-2014
INTERNATIONAL COSTS OF PIG PRODUCTION
This report examines the relative costs of production in selected countries. This is a joint project currently involving15 countries, which are known collectively as InterPIG.
SUMMARY OF KEY FINDINGS:
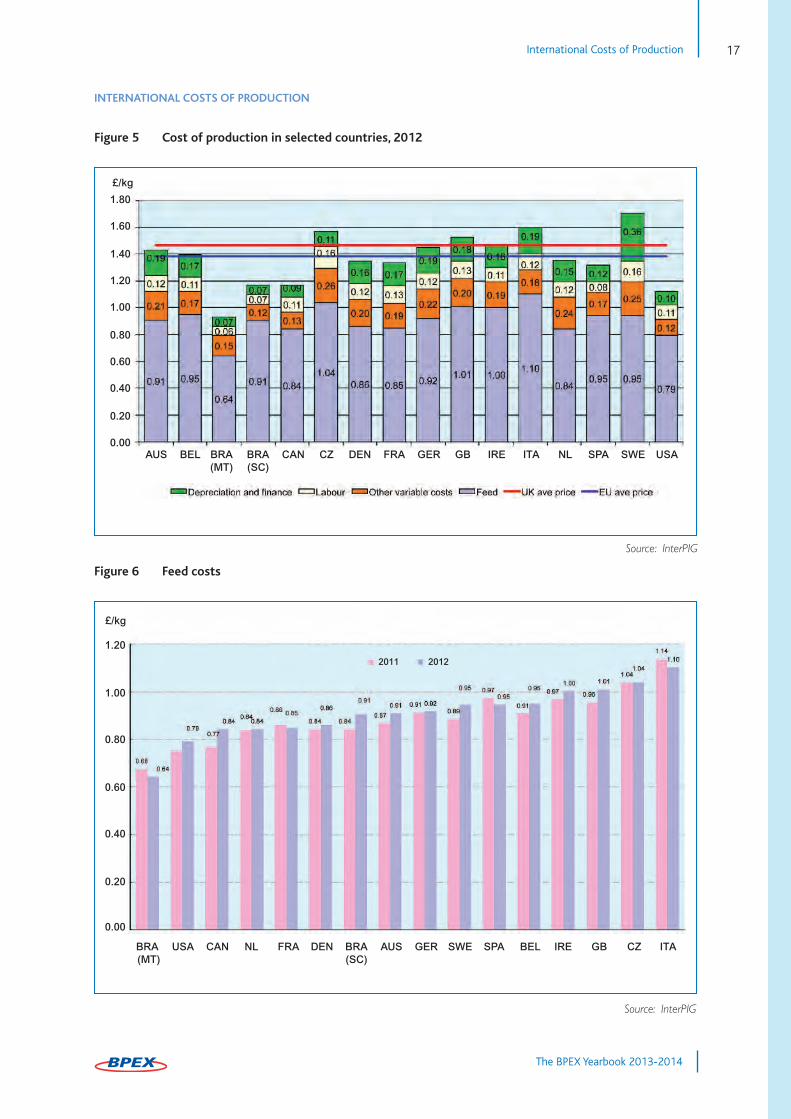
• The cost of pig meat production in Great Britain increased by two per cent in 2012, to £1.53/kg. The average cost of production in the EU was £1.46/kg deadweight, a two per cent reduction in sterling terms compared to 2011
• The majority of EU countries, except Belgium, Great Britain and Sweden, experienced a reduction in the costs of production (in sterling terms) compared to 2011
• Average producer prices were higher in 2012 than in 2011, with four EU countries (Denmark, France, Spain and the Netherlands) having production costs below the EU average reference price
• Average feed prices were higher in 2012 than in 2011, increasing by 3.5 per cent on average cross the EUcountries
• In 2012 as a whole, EU feed costs increased by two per cent compared with a year earlier, in sterling terms. The cost increase in Great Britain was six per cent, the second highest in the EU. Four EU countries experienced a reduction in feed costs compared with 2011
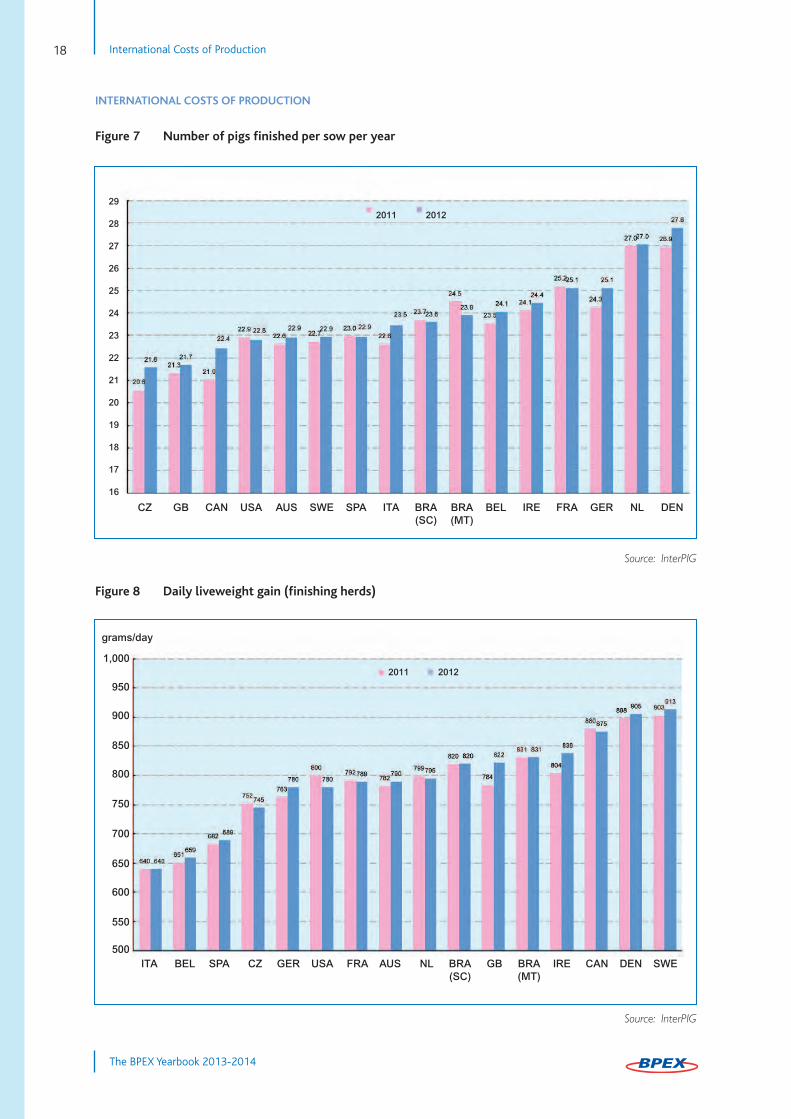
• The overall average number of pigs weaned per sow per year in the European InterPIG countries showed a two per cent increase in 2012, up from 24.99 in 2011 to 25.41. There was a one per cent increase in pigs weaned per sow in Great Britain to 22.80, this was the lowest among the InterPIG members
• The main reason Great Britain has a below average number of pigs weaned per sow lies in the number ofpigs born alive per litter. The 2012 average, at 11.54, was lower than all but one of the European InterPIG members, although it was an increase compared to 11.39 in 2011. The EU average was 12.71, with five EU countries achieving more than 13 pigs born alive per litter
• The average number of pigs finished per sow in Great Britain increased in 2012. At 21.69 pigs per sow, average performance was 0.36 pigs higher than in 2011
• Great Britain produced 1.71 tonnes of carcase meat per sow in 2012, one per cent higher than in 2011 because of the small increase in the number of pigs finished per sow.
MORE DETAILS
The full report is published each autumn and is free to English levy payers and can be obtained from BPEX or AHDBMarket Intelligence. For non-levy payers the report has a cover price of £160.

International Costs of Production16
The BPEX Yearbook 2013-2014
INTERNATIONAL COSTS OF PRODUCTION
Table 5 Average costs of production in 2007–2012 (Euros/kg deadweight)
Table 6 Summary of financial performance 2012 (£/kg deadweight)
Year 2007 2008 2009 2010 2011 2012 2012/11
% change
Austria 1.59 1.75 1.45 1.60 1.67 1.78 +6
Belgium 1.53 1.68 1.41 1.48 1.61 1.73 +7
Brazil (MT) na na na 1.02 1.18 1.17 -1
Brazil (SC) 0.94 1.14 0.99 1.10 1.35 1.46 +8
Canada 1.35 1.10 1.03 1.11 1.29 1.45 +12
Czech. Rep na 1.98 1.65 1.76 1.83 1.91 +4
Denmark 1.41 1.64 1.42 1.41 1.59 1.68 +6
France 1.44 1.60 1.37 1.37 1.60 1.66 +4
Germany 1.60 1.78 1.54 1.53 1.76 1.82 +3
Great Britain 1.73 1.69 1.46 1.64 1.74 1.91 +10
Ireland 1.61 1.74 1.48 1.52 1.72 1.84 +7
Italy 1.84 1.93 1.74 1.79 1.95 1.98 +2
Netherlands 1.48 1.67 1.46 1.43 1.62 1.68 +4
Spain 1.56 1.67 1.44 1.42 1.60 1.64 +2
Sweden 1.70 1.86 1.47 1.72 1.96 2.14 +9
USA 1.01 1.12 1.10 1.12 1.27 1.40 +10
EU 1.59 1.75 1.49 1.55 1.72 1.81 +5
GB EU
Feed 1.01 0.95
Other variable costs 0.20 0.21
Total variable costs 1.21 1.15
Labour 0.13 0.12
Building, finance and misc 0.18 0.18
Total fixed costs 0.31 0.30
Total costs 1.53 1.46
Source: InterPIG
Source: InterPIG
International Costs of Production 17
The BPEX Yearbook 2013-2014
INTERNATIONAL COSTS OF PRODUCTION
Figure 5 Cost of production in selected countries, 2012
Figure 6 Feed costs
Source: InterPIG
Source: InterPIG
1.80
1.60
1.40
1.20
1.00
0.80
0.60
0.40
0.20
0.00
£/kg
£/kg
1.20
1.00
0.80
0.60
0.40
0.20
0.00
BRA USA CAN NL FRA DEN BRA AUS GER SWE SPA BEL IRE GB CZ ITA(MT) (SC)
AUS BEL BRA BRA CAN CZ DEN FRA GER GB IRE ITA NL SPA SWE USA(MT) (SC)
2011 2012
International Costs of Production18
The BPEX Yearbook 2013-2014
INTERNATIONAL COSTS OF PRODUCTION
Figure 7 Number of pigs finished per sow per year
Figure 8 Daily liveweight gain (finishing herds)
Source: InterPIG
Source: InterPIG
29
28
27
26
25
24
23
22
21
20
19
18
17
16
1,000
950
900
850
800
750
700
650
600
550
500
grams/day
2011 2012
CZ GB CAN USA AUS SWE SPA ITA BRA BRA BEL IRE FRA GER NL DEN(SC) (MT)
2011 2012
ITA BEL SPA CZ GER USA FRA AUS NL BRA GB BRA IRE CAN DEN SWE(SC) (MT)

International Costs of Production 19
The BPEX Yearbook 2013-2014
INTERNATIONAL COSTS OF PRODUCTION
Figure 9 UK average pig meat production per sow per annum
Source: Defra
2000 2005 2008 2009 2010 2011 2012 2013
2,000
1,800
1,600
1,400
1,200
1,000
800
600
400
200
0
kg

Economic and Financial Performance Data20
The BPEX Yearbook 2013-2014
ECONOMIC AND FINANCIAL PERFORMANCE DATA
This year is the fourth year of reporting the economic and financial data in this format. The previously publishedintroductions to this chapter do contain an explanation of the format.
Consistent with previous years, the tables report the relationship between physical production performance and feedand total costs. The purpose of this is to offer reporting that has a basic relevance to all producers. All tables usefigures for the period from 1 January 2013 to 31 December 2013 inclusive.
COST OF PRODUCTION TABLES
The tables have been calculated in three categories. ‘All farms’ is a consolidation of the total breeding herd productiondata sample. The indoor and outdoor categories are the separation and calculation of the original all farms datasample. The Cost of Production (CoP) tables calculate the CoP in pence per carcase kilogram. The figures are calculatedfrom formulae that include the average annual performance and costs of the named sample. The raw costing datais supplied by the Market Intelligence department of AHDB and includes detailed fixed and variable costs. Eachaspect of the current herd performance is reported with an alpha prefix from A to P. For example, A is Breeding HerdFeed and K is Pigs Born Alive/Litter. These are grouped under the headings Key Performance Indicators 1 and 2. Thecurrent feed cost is reported and is then recalculated incrementally. The CoP base value is calculated against thecurrent herd performance and recalculated against the feed cost increase. The ‘Key Performance Indicators 2’ sectionof the report calculates the effect of improved performance for each indicator on the CoP. The cumulative value ofthese improvements and the revised CoP is also calculated. The breakeven performance for Pigs Born Alive/Litter andPigs Sold/Litter is calculated using the Price/Carcase Kg (DAPP). The ‘Margin/Carcase Kg (Pence)’ is calculated usingthe DAPP. The ‘Feed as a % of Total Cost’ is reported using a percentage calculation that includes the cost of feedand the total cost including feed. The table 7 report structure for the UK average of all farms is then reproduced inthe CoP tables for the indoor and outdoor tables that report the top third, average and bottom third physicalperformance against the standard costs.
There are further tables that report on specific elements of the relationship between physical performance and cost.It is hoped these are of some interest to the reader, helping to inform management strategy for improving andmaintaining business performance. These tables look at the effect on the CoP of the farrowing rate, feed conversionratio, post weaning mortality % and the average liveweight of the dead pigs. The tables also look at output, in termsof kilograms of pig meat sold, per £100.00 of the three main costs of feed, labour and ‘vet and med’ reported andsome of the financial implications of the BPEX 2TS and Wean+3 industry strategies. There is a 2TS result section ineach of the tables in which the influence of the breeding herd KPIs that affect output can be clearly demonstrated.
Stephen HallAgrosoft Limited
Economic and Financial Performance Data 21
The BPEX Yearbook 2013-2014
COST OF PRODUCTION TABLES
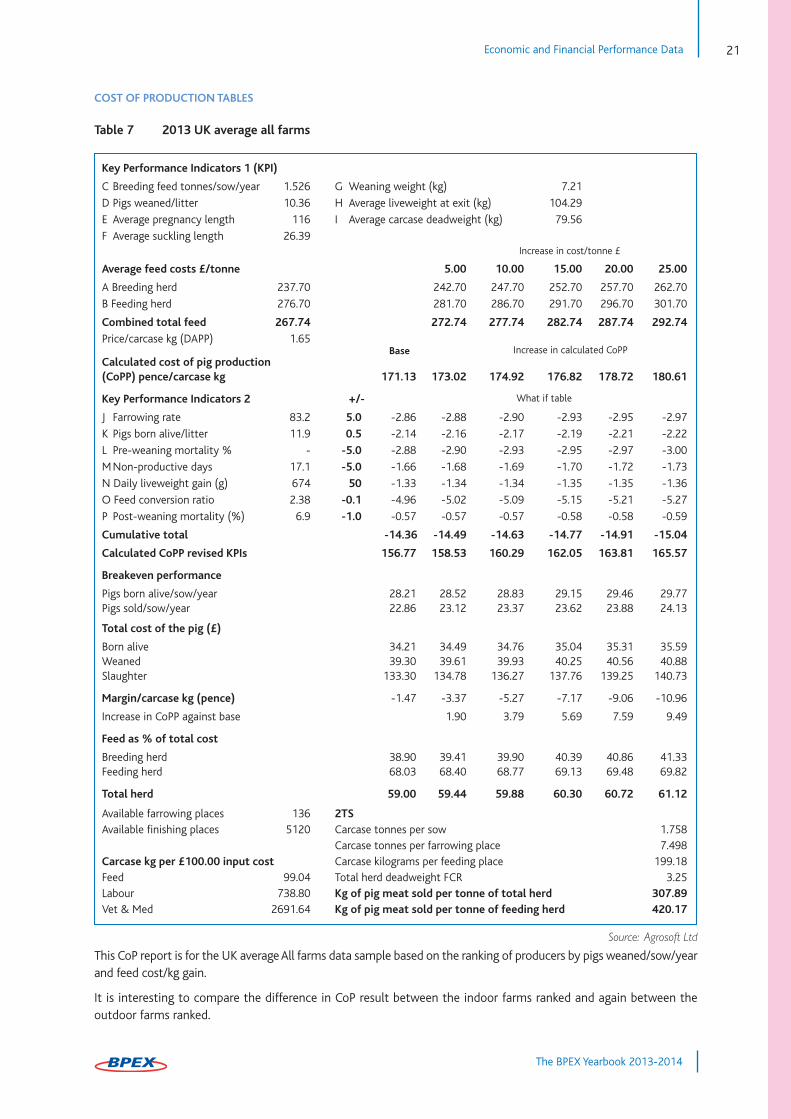
Table 7 2013 UK average all farms
This CoP report is for the UK average All farms data sample based on the ranking of producers by pigs weaned/sow/yearand feed cost/kg gain.
It is interesting to compare the difference in CoP result between the indoor farms ranked and again between theoutdoor farms ranked.
Key Performance Indicators 1 (KPI)
C Breeding feed tonnes/sow/year 1.526 G Weaning weight (kg) 7.21
D Pigs weaned/litter 10.36 H Average liveweight at exit (kg) 104.29
E Average pregnancy length 116 I Average carcase deadweight (kg) 79.56
F Average suckling length 26.39
Average feed costs £/tonne 5.00 10.00 15.00 20.00 25.00
A Breeding herd 237.70 242.70 247.70 252.70 257.70 262.70
B Feeding herd 276.70 281.70 286.70 291.70 296.70 301.70
Combined total feed 267.74 272.74 277.74 282.74 287.74 292.74
Price/carcase kg (DAPP) 1.65
Calculated cost of pig production(CoPP) pence/carcase kg 171.13 173.02 174.92 176.82 178.72 180.61
Key Performance Indicators 2 +/-
J Farrowing rate 83.2 5.0 -2.86 -2.88 -2.90 -2.93 -2.95 -2.97
K Pigs born alive/litter 11.9 0.5 -2.14 -2.16 -2.17 -2.19 -2.21 -2.22
L Pre-weaning mortality % - -5.0 -2.88 -2.90 -2.93 -2.95 -2.97 -3.00
MNon-productive days 17.1 -5.0 -1.66 -1.68 -1.69 -1.70 -1.72 -1.73
N Daily liveweight gain (g) 674 50 -1.33 -1.34 -1.34 -1.35 -1.35 -1.36
O Feed conversion ratio 2.38 -0.1 -4.96 -5.02 -5.09 -5.15 -5.21 -5.27
P Post-weaning mortality (%) 6.9 -1.0 -0.57 -0.57 -0.57 -0.58 -0.58 -0.59
Cumulative total -14.36 -14.49 -14.63 -14.77 -14.91 -15.04
Calculated CoPP revised KPIs 156.77 158.53 160.29 162.05 163.81 165.57
Increase in calculated CoPP
What if table
Increase in cost/tonne £
Total cost of the pig (£)
Born alive 34.21 34.49 34.76 35.04 35.31 35.59Weaned 39.30 39.61 39.93 40.25 40.56 40.88Slaughter 133.30 134.78 136.27 137.76 139.25 140.73
Margin/carcase kg (pence) -1.47 -3.37 -5.27 -7.17 -9.06 -10.96
Increase in CoPP against base 1.90 3.79 5.69 7.59 9.49
Feed as % of total cost
Breeding herd 38.90 39.41 39.90 40.39 40.86 41.33Feeding herd 68.03 68.40 68.77 69.13 69.48 69.82
Total herd 59.00 59.44 59.88 60.30 60.72 61.12
Available farrowing places 136 2TSAvailable finishing places 5120 Carcase tonnes per sow 1.758
Carcase tonnes per farrowing place 7.498Carcase kg per £100.00 input cost Carcase kilograms per feeding place 199.18Feed 99.04 Total herd deadweight FCR 3.25Labour 738.80 Kg of pig meat sold per tonne of total herd 307.89Vet & Med 2691.64 Kg of pig meat sold per tonne of feeding herd 420.17
Base
Source: Agrosoft Ltd
Breakeven performance
Pigs born alive/sow/year 28.21 28.52 28.83 29.15 29.46 29.77Pigs sold/sow/year 22.86 23.12 23.37 23.62 23.88 24.13

Economic and Financial Performance Data22
The BPEX Yearbook 2013-2014
COST OF PRODUCTION TABLES
Table 8 2013 top third indoor farms
Key Performance Indicators 1 (KPI)
C Breeding feed tonnes/sow/year 1.442 G Weaning weight (kg) 7.16
D Pigs weaned/litter 11.55 H Average liveweight at exit (kg) 104.29
E Average pregnancy length 116 I Average carcase deadweight (kg) 79.57
F Average suckling length 26.12
Average feed costs £/tonne 5.00 10.00 15.00 20.00 25.00
A Breeding herd 239.36 244.36 249.36 254.36 259.36 264.36
B Feeding herd 276.67 281.67 286.67 291.67 296.67 301.67
Combined total feed 269.34 274.74 279.34 284.34 289.34 294.34
Price/carcase kg (DAPP) 1.65
Calculated cost of pig production(CoPP) pence/carcase kg 163.91 165.72 167.54 169.36 171.17 172.99
Key Performance Indicators 2 +/-
J Farrowing rate 87.96 5.0 -2.39 -2.41 -2.42 -2.44 -2.46 -2.48
K Pigs born alive/litter 12.96 0.5 -1.73 -1.74 -1.75 -1.76 -1.78 -1.79
L Pre-weaning mortality % - -5.0 -2.47 -2.49 -2.51 -2.52 -2.54 -2.56
MNon-productive days 11.9 -5.0 -1.51 -1.52 -1.53 -1.54 -1.55 -1.56
N Daily liveweight gain (g) 674 50 -1.31 -1.31 -1.32 -1.32 -1.33 -1.33
O Feed conversion ratio 2.37 -0.1 -4.95 -5.02 -5.08 -5.14 -5.20 -5.27
P Post-weaning mortality (%) 6.9 -1.0 -0.50 -0.50 -0.50 -0.51 -0.51 -0.52
Cumulative total -15.25 -13.08 -13.20 -13.32 -13.44 -13.57
Calculated CoPP revised KPIs 148.65 152.64 154.34 156.03 157.73 159.43
Increase in calculated CoPP
What if table
Increase in cost/tonne £
Total cost of the pig (£)
Born alive 30.69 30.91 31.14 31.36 31.59 31.82Weaned 34.43 34.68 34.94 35.19 35.45 35.70Slaughter 127.86 129.29 130.71 132.14 133.57 135.00
Margin/carcase kg (pence) 5.12 3.30 1.49 -0.33 -2.15 -3.97
Increase in CoPP against base 1.82 3.63 5.45 7.27 9.09
Feed as % of total cost
Breeding herd 36.59 37.08 37.57 38.04 38.51 38.97Feeding herd 68.18 68.55 68.91 69.26 69.61 69.94
Total herd 59.22 59.66 60.09 60.51 60.92 61.32
Available farrowing places 114 2TSAvailable finishing places 4550 Carcase tonnes per sow 2.030
Carcase tonnes per farrowing place 8.635Carcase kg per £100.00 input cost Carcase kilograms per feeding place 216.34Feed 103.02 Total herd deadweight FCR 3.08Labour 806.71 Kg of pig meat sold per tonne of total herd 324.62Vet & Med 2913.40 Kg of pig meat sold per tonne of feeding herd 421.94
Base
Source: Agrosoft Ltd
Breakeven performance
Pigs born alive/sow/year 30.48 30.82 31.15 31.49 31.83 32.17Pigs sold/sow/year 25.29 25.57 25.85 26.13 26.41 26.69

Economic and Financial Performance Data 23
The BPEX Yearbook 2013-2014
COST OF PRODUCTION TABLES
Table 9 2013 UK average indoor farms
Key Performance Indicators 1 (KPI)
C Breeding feed tonnes/sow/year 1.476 G Weaning weight (kg) 7.30
D Pigs weaned/litter 10.85 H Average liveweight at exit (kg) 104.29
E Average pregnancy length 116 I Average carcase deadweight (kg) 79.57
F Average suckling length 26.88
Average feed costs £/tonne 5.00 10.00 15.00 20.00 25.00
A Breeding herd 239.36 244.36 249.36 254.36 259.36 264.36
B Feeding herd 276.67 281.67 286.67 291.67 296.67 301.67
Combined total feed 268.59 273.59 278.59 283.59 288.59 293.59
Price/carcase kg (DAPP) 1.65
Calculated cost of pig production(CoPP) pence/carcase kg 169.79 171.65 173.51 175.37 177.22 179.09
Key Performance Indicators 2 +/-
J Farrowing rate 84.43 5.0 -2.70 -2.74 -2.76 -2.78 -2.80 -2.82
K Pigs born alive/litter 12.37 0.5 -2.00 -2.01 -2.03 -2.04 -2.06 -2.07
L Pre-weaning mortality % - -5.0 -2.77 -2.79 -2.81 -2.83 -2.85 -2.88
MNon-productive days 15.9 -5.0 -1.62 -1.63 -1.64 -1.65 -1.67 -1.68
N Daily liveweight gain (gms) 674 50 -1.33 -1.34 -1.34 -1.35 -1.36 -1.36
O Feed conversion ratio 2.37 -0.1 -5.00 -5.06 -5.12 -5.18 -5.24 -5.31
P Post-weaning mortality (%) 6.9 -1.0 -0.55 -0.55 -0.55 -0.56 -0.56 -0.57
Cumulative total -16.56 -14.11 -14.24 -14.37 -14.50 -14.63
Calculated CoPP revised KPI's 153.23 157.54 159.27 161.00 162.73 164.46
Increase in calculated CoPP
What if table
Increase in cost/tonne £
Total cost of the pig (£)
Born alive 33.39 33.64 33.89 34.14 34.39 34.64Weaned 38.06 33.35 38.63 38.92 39.21 39.49Slaughter 132.28 133.74 135.20 136.65 138.11 139.57
Margin/carcase kg (pence) -0.40 -2.26 -4.12 -5.98 -7.84 -9.70
Increase in CoPP against base 1.86 3.71 5.57 7.43 9.29
Feed as % of total cost
Breeding herd 37.19 37.69 38.17 38.65 39.13 39.59Feeding herd 67.50 67.88 68.24 68.60 68.95 69.29
Total herd 58.33 58.77 59.20 59.63 60.04 60.45
Available farrowing places 114 2TSAvailable finishing places 4550 Carcase tonnes per sow 1.849
Carcase tonnes per farrowing place 7.865Carcase kg per £100.00 input cost Carcase kilograms per feeding place 197.06Feed 100.97 Total herd deadweight FCR 3.17Labour 762.22 Kg of pig meat sold per tonne of total herd 315.62Vet & Med 2768.49 Kg of pig meat sold per tonne of feeding herd 421.94
Base
Source: Agrosoft Ltd
Breakeven performance
Pigs born alive/sow/year 29.22 29.54 29.86 30.18 30.50 30.82Pigs sold/sow/year 23.86 24.12 24.38 24.65 24.91 25.17

Economic and Financial Performance Data24
The BPEX Yearbook 2013-2014
COST OF PRODUCTION TABLES
Table 10 2013 UK bottom third indoor farms
Average feed costs £/tonne 5.00 10.00 15.00 20.00 25.00
A Breeding herd 239.36 244.36 249.36 254.36 259.36 264.36
B Feeding herd 276.67 281.67 286.67 291.67 296.67 301.67
Combined total feed 267.70 272.70 277.70 282.70 287.70 292.70
Price/carcase kg (DAPP) 1.65
Calculated cost of pig production(CoPP) pence/carcase kg 177.58 179.50 181.41 183.33 185.25 187.16
Key Performance Indicators 2 +/-
J Farrowing rate 81.22 5.0 -3.17 -3.19 -3.22 -3.24 -3.26 -3.29K Pigs born alive/litter 11.84 0.5 -2.34 -2.36 -2.38 -2.39 -2.41 -2.43
L Pre-weaning mortality % - -5.0 -3.20 -3.23 -3.25 -3.28 -3.30 -3.33
MNon-productive days 20.4 -5.0 -1.76 -1.77 -1.78 -1.80 -1.81 -1.82
N Daily liveweight gain (g) 674 50 -1.37 -1.38 -1.38 -1.39 -1.39 -1.40
O Feed conversion ratio 2.37 -0.1 -5.06 -5.12 -5.18 -5.24 -5.31 -5.37
P Post-weaning mortality (%) 6.9 -1.0 -0.61 -0.62 -0.62 -0.63 -0.63 -0.64
Cumulative total -18.33 -15.50 -15.64 -15.78 -15.92 -16.06
Calculated CoPP revised KPIs 159.25 164.00 165.78 167.55 169.33 171.10
Increase in calculated CoPP
Increase in cost/tonne £
Total cost of the pig (£)
Born alive 36.41 36.69 36.97 37.25 37.53 37.81Weaned 42.77 43.10 43.42 43.75 44.08 44.41Slaughter 138.13 139.63 141.13 142.63 144.13 145.63
Margin/carcase kg (pence) -7.73 -9.65 -11.56 -13.48 -15.39 -17.31
Increase in CoPP against base 1.91 3.83 5.74 7.66 9.58
Feed as % of total cost
Breeding herd 37.93 38.43 38.92 39.40 39.88 40.34Feeding herd 66.70 67.09 67.46 67.82 68.18 68.52
Total herd 57.35 57.80 58.24 58.67 59.09 59.50
Available farrowing places 114 2TSAvailable finishing places 4550 Carcase tonnes per sow 1.660
Carcase tonnes per farrowing place 7.064Carcase kg per £100.00 input cost Carcase kilograms per feeding place 176.98Feed 98.19 Total herd deadweight FCR 3.28Labour 712.21 Kg of pig meat sold per tonne of total herd 304.42Vet & Med 2603.61 Kg of pig meat sold per tonne of feeding herd 421.94
Base
Key Performance Indicators 1 (KPI)
C Breeding feed tonnes/sow/year 1.519 G Weaning weight (kg) 7.28
D Pigs weaned/litter 10.08 H Average liveweight at exit (kg) 104.29
E Average pregnancy length 116 I Average carcase deadweight (kg) 79.57
F Average suckling length 27.9
What if table
Source: Agrosoft Ltd
Breakeven performance
Pigs born alive/sow/year 28.28 28.58 28.89 29.19 29.50 29.80Pigs sold/sow/year 22.41 22.66 22.90 23.14 23.38 23.62

Economic and Financial Performance Data 25
The BPEX Yearbook 2013-2014
COST OF PRODUCTION TABLES
Table 11 2013 UK top third outdoor farms
Source: Agrosoft Ltd
Key Performance Indicators 1 (KPI)
C Breeding feed tonnes/sow/year 1.515 G Weaning weight (kg) 7.14
D Pigs weaned/litter 10.14 H Average liveweight at exit (kg) 104.29
E Average pregnancy length 116 I Average carcase deadweight (kg) 79.57
F Average suckling length 25.96
Average feed costs £/tonne 5.00 10.00 15.00 20.00 25.00
A Breeding herd 235.30 240.30 245.30 250.30 255.30 260.30
B Feeding herd 276.73 281.73 286.73 291.73 296.73 301.73
Combined total feed 267.27 272.27 277.27 282.27 287.27 292.28
Price/carcase kg (DAPP) 1.65
Calculated cost of pig production(CoPP) pence/carcase kg 166.42 168.31 170.20 172.10 173.99 175.88
Key Performance Indicators 2 +/-
J Farrowing rate 85.42 5.0 -2.69 -2.71 -2.73 -2.76 -2.78 -2.80
K Pigs born alive/litter 11.67 0.5 -2.09 -2.11 -2.13 -2.15 -2.16 -2.18
L Pre-weaning mortality % - -5.0 -2.77 -2.80 -2.82 -2.84 -2.87 -2.89
MNon-productive days 14.3 -5.0 -1.63 -1.64 -1.66 -1.67 -1.69 -1.70
N Daily liveweight gain (g) 673 50 -1.26 -1.27 -1.27 -1.27 -1.28 -1.28
O Feed conversion ratio 2.38 -0.1 -4.85 -4.91 -4.97 -5.04 -5.10 -5.16
P Post-weaning mortality (%) 6.9 -1.0 -0.55 -0.55 -0.55 -0.56 -0.56 -0.57
Cumulative total -13.90 -14.04 -14.17 -14.31 -14.45 -14.59
Calculated CoPP revised KPIs 152.52 154.28 156.03 157.79 159.54 161.30
Increase in calculated CoPP
What if table
Increase in cost/tonne £
Total cost of the pig (£)
Born alive 32.80 33.08 33.35 33.63 33.90 34.18Weaned 37.75 38.07 38.39 38.70 39.02 39.34Slaughter 129.61 131.10 132.58 134.06 135.54 137.03
Margin/carcase kg (pence) 3.34 1.44 -0.45 -2.34 -4.23 -6.13
Increase in CoPP against base 1.89 3.78 5.68 7.57 9.46
Feed as % of total cost
Breeding herd 39.82 40.33 40.83 41.33 41.81 42.28Feeding herd 69.66 70.03 70.39 70.75 71.09 71.42
Total herd 60.53 60.97 61.40 61.82 62.23 62.63
Available farrowing places 155 2TSAvailable finishing places 5800 Carcase tonnes per sow 1.756
Carcase tonnes per farrowing place 7.660Carcase kg per £100.00 input cost Carcase kilograms per feeding place 204.71Feed 99.28 Total herd deadweight FCR 3.24Labour 738.21 Kg of pig meat sold per tonne of total herd 308.40Vet & Med 2689.58 Kg of pig meat sold per tonne of feeding herd 420.17
Base
Breakeven performance
Pigs born alive/sow/year 27.47 27.78 28.09 28.41 28.72 29.03Pigs sold/sow/year 22.22 22.47 22.73 22.98 23.23 23.48
Economic and Financial Performance Data26
The BPEX Yearbook 2013-2014
COST OF PRODUCTION TABLES
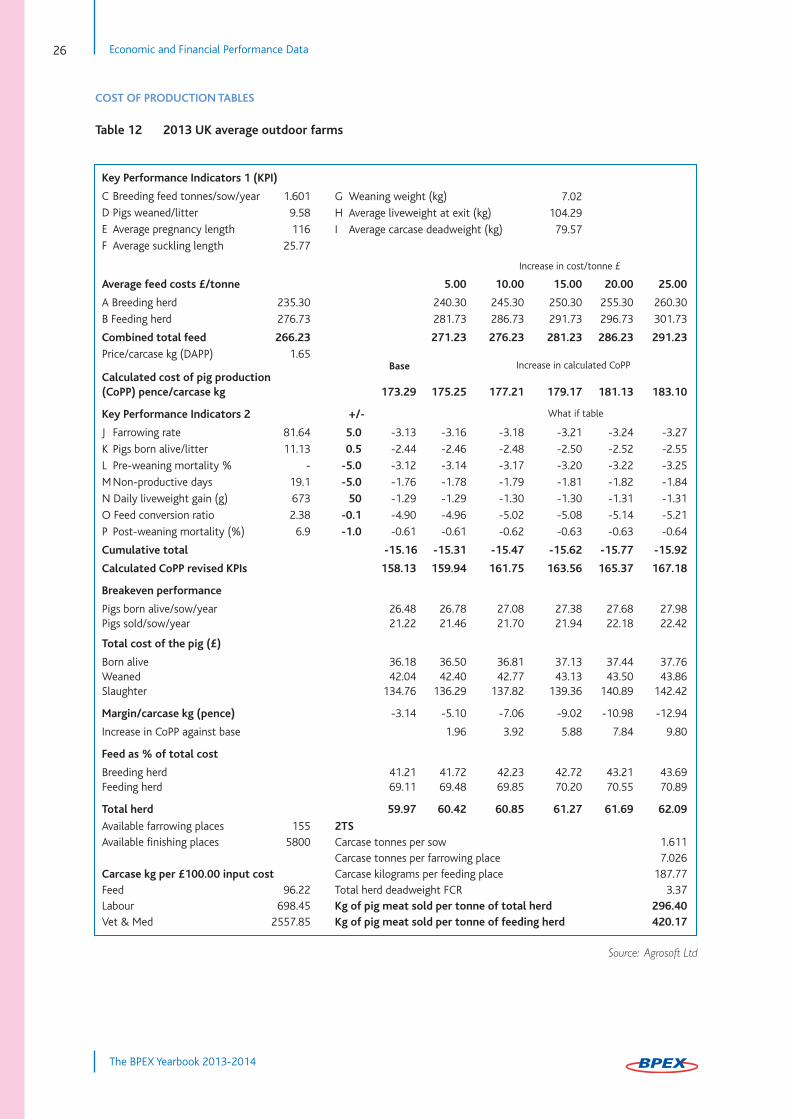
Table 12 2013 UK average outdoor farms
Source: Agrosoft Ltd
Key Performance Indicators 1 (KPI)
C Breeding feed tonnes/sow/year 1.601 G Weaning weight (kg) 7.02D Pigs weaned/litter 9.58 H Average liveweight at exit (kg) 104.29E Average pregnancy length 116 I Average carcase deadweight (kg) 79.57F Average suckling length 25.77
Average feed costs £/tonne 5.00 10.00 15.00 20.00 25.00
A Breeding herd 235.30 240.30 245.30 250.30 255.30 260.30
B Feeding herd 276.73 281.73 286.73 291.73 296.73 301.73
Combined total feed 266.23 271.23 276.23 281.23 286.23 291.23
Price/carcase kg (DAPP) 1.65
Calculated cost of pig production(CoPP) pence/carcase kg 173.29 175.25 177.21 179.17 181.13 183.10
Key Performance Indicators 2 +/-
J Farrowing rate 81.64 5.0 -3.13 -3.16 -3.18 -3.21 -3.24 -3.27
K Pigs born alive/litter 11.13 0.5 -2.44 -2.46 -2.48 -2.50 -2.52 -2.55
L Pre-weaning mortality % - -5.0 -3.12 -3.14 -3.17 -3.20 -3.22 -3.25
MNon-productive days 19.1 -5.0 -1.76 -1.78 -1.79 -1.81 -1.82 -1.84
N Daily liveweight gain (g) 673 50 -1.29 -1.29 -1.30 -1.30 -1.31 -1.31
O Feed conversion ratio 2.38 -0.1 -4.90 -4.96 -5.02 -5.08 -5.14 -5.21
P Post-weaning mortality (%) 6.9 -1.0 -0.61 -0.61 -0.62 -0.63 -0.63 -0.64
Cumulative total -15.16 -15.31 -15.47 -15.62 -15.77 -15.92
Calculated CoPP revised KPIs 158.13 159.94 161.75 163.56 165.37 167.18
Increase in calculated CoPP
What if table
Increase in cost/tonne £
Total cost of the pig (£)
Born alive 36.18 36.50 36.81 37.13 37.44 37.76Weaned 42.04 42.40 42.77 43.13 43.50 43.86Slaughter 134.76 136.29 137.82 139.36 140.89 142.42
Margin/carcase kg (pence) -3.14 -5.10 -7.06 -9.02 -10.98 -12.94
Increase in CoPP against base 1.96 3.92 5.88 7.84 9.80
Feed as % of total cost
Breeding herd 41.21 41.72 42.23 42.72 43.21 43.69Feeding herd 69.11 69.48 69.85 70.20 70.55 70.89
Total herd 59.97 60.42 60.85 61.27 61.69 62.09
Available farrowing places 155 2TSAvailable finishing places 5800 Carcase tonnes per sow 1.611
Carcase tonnes per farrowing place 7.026Carcase kg per £100.00 input cost Carcase kilograms per feeding place 187.77Feed 96.22 Total herd deadweight FCR 3.37Labour 698.45 Kg of pig meat sold per tonne of total herd 296.40Vet & Med 2557.85 Kg of pig meat sold per tonne of feeding herd 420.17
Base
Breakeven performance
Pigs born alive/sow/year 26.48 26.78 27.08 27.38 27.68 27.98Pigs sold/sow/year 21.22 21.46 21.70 21.94 22.18 22.42

Economic and Financial Performance Data 27
The BPEX Yearbook 2013-2014
COST OF PRODUCTION TABLES
Table 13 2013 UK bottom third outdoor farms
Source: Agrosoft Ltd
Key Performance Indicators 1 (KPI)
C Breeding feed tonnes/sow/year 1.716 G Weaning weight (kg) 7.00
D Pigs weaned/litter 8.89 H Average liveweight at exit (kg) 104.29
E Average pregnancy length 116 I Average carcase deadweight (kg) 79.57
F Average suckling length 25.18
Average feed costs £/tonne 5.00 10.00 15.00 20.00 25.00
A Breeding herd 235.30 240.30 245.30 250.30 255.30 260.30
B Feeding herd 276.73 281.73 286.73 291.73 296.73 301.73
Combined total feed 264.87 269.87 274.87 279.87 284.87 289.87
Price/carcase kg (DAPP) 1.65
Calculated cost of pig production(CoPP) pence/carcase kg 182.08 184.13 186.18 188.23 190.28 192.33
Key Performance Indicators 2 +/-
J Farrowing rate 78.99 5.0 -3.65 -3.68 -3.72 -3.75 -3.78 -3.82
K Pigs born alive/litter 10.64 0.5 -2.89 -2.91 -2.94 -296 -2.99 -3.02
L Pre-weaning mortality % - -5.0 -3.63 -3.66 -3.70 -3.73 -3.76 -3.80
MNon-productive days 23.4 -5.0 -1.95 -1.97 -1.99 -2.01 -2.03 -2.04
N Daily liveweight gain (g) 673 50 -1.32 -1.33 -1.33 -1.34 -1.34 -1.35
O Feed conversion ratio 2.38 -0.1 -4.95 -5.01 -5.07 -5.13 -5.20 -5.26
P Post-weaning mortality (%) 6.9 -1.0 -0.69 -0.70 -0.70 -0.71 -0.72 -0.72
Cumulative total -16.83 -17.00 -17.17 -17.33 -17.50 -17.67
Calculated CoPP revised KPIs 165.25 167.13 169.01 170.89 172.78 174.66
Increase in calculated CoPP
What if table
Increase in cost/tonne £
Total cost of the pig (£)
Born alive 36.80 40.16 40.52 40.89 41.25 41.61Weaned 47.64 48.07 48.50 48.93 49.37 49.80Slaughter 141.33 142.93 144.53 146.13 147.73 149.33
Margin/carcase kg (pence) -11.43 -13.48 -15.53 -17.58 -19.63 -21.68
Increase in CoPP against base 2.05 4.10 6.15 8.20 10.26
Feed as % of total cost
Breeding herd 42.95 43.47 43.98 44.48 44.97 45.45Feeding herd 68.40 68.78 69.15 69.51 69.87 70.21
Total herd 59.42 59.87 60.30 60.73 61.15 61.56
Available farrowing places 155 2TSAvailable finishing places 5800 Carcase tonnes per sow 1.462
Carcase tonnes per farrowing place 6.376Carcase kg per £100.00 input cost Carcase kilograms per feeding place 170.39Feed 92.43 Total herd deadweight FCR 3.55Labour 654.98 Kg of pig meat sold per tonne of total herd 281.39Vet & Med 2412.26 Kg of pig meat sold per tonne of feeding herd 420.17
Base
Breakeven performance
Pigs born alive/sow/year 26.01 26.31 26.60 26.89 27.19 27.48Pigs sold/sow/year 20.23 20.46 20.69 20.92 21.15 21.37
Economic and Financial Performance Data28
The BPEX Yearbook 2013-2014
COST OF PRODUCTION TABLES
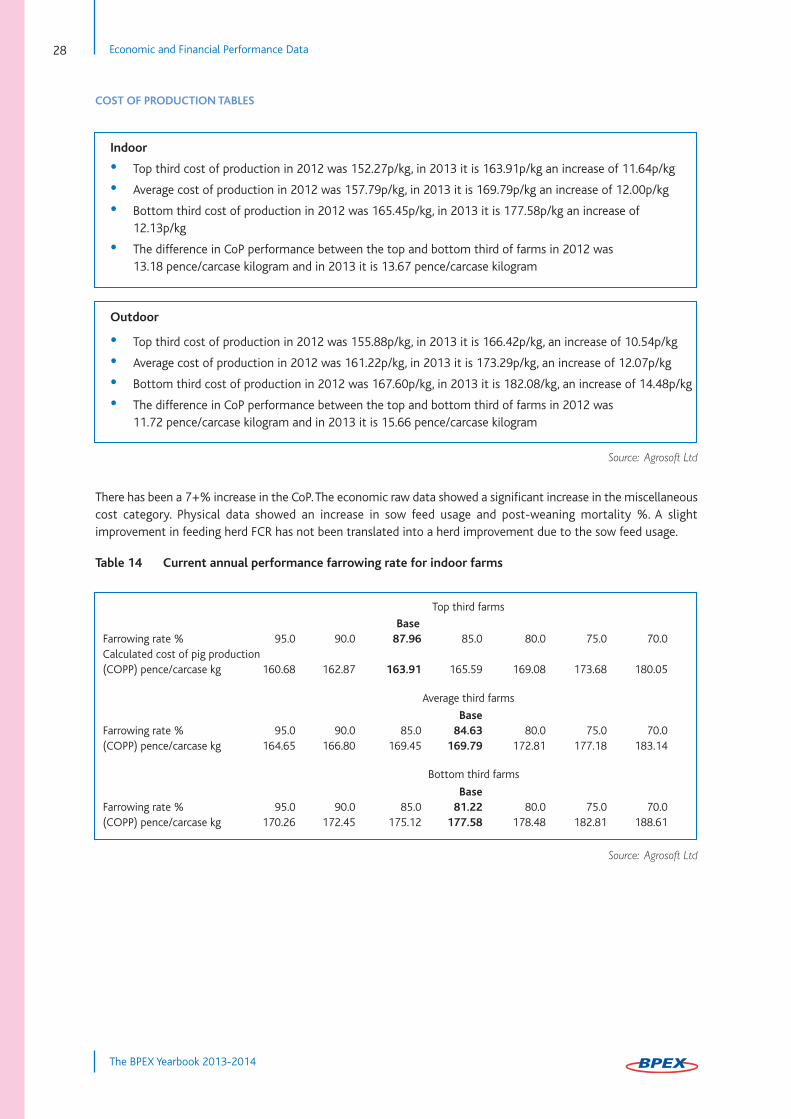
There has been a 7+% increase in the CoP. The economic raw data showed a significant increase in the miscellaneouscost category. Physical data showed an increase in sow feed usage and post-weaning mortality %. A slightimprovement in feeding herd FCR has not been translated into a herd improvement due to the sow feed usage.
Table 14 Current annual performance farrowing rate for indoor farms
Indoor
• Top third cost of production in 2012 was 152.27p/kg, in 2013 it is 163.91p/kg an increase of 11.64p/kg
• Average cost of production in 2012 was 157.79p/kg, in 2013 it is 169.79p/kg an increase of 12.00p/kg
• Bottom third cost of production in 2012 was 165.45p/kg, in 2013 it is 177.58p/kg an increase of12.13p/kg
• The difference in CoP performance between the top and bottom third of farms in 2012 was 13.18 pence/carcase kilogram and in 2013 it is 13.67 pence/carcase kilogram
Outdoor
• Top third cost of production in 2012 was 155.88p/kg, in 2013 it is 166.42p/kg, an increase of 10.54p/kg
• Average cost of production in 2012 was 161.22p/kg, in 2013 it is 173.29p/kg, an increase of 12.07p/kg
• Bottom third cost of production in 2012 was 167.60p/kg, in 2013 it is 182.08/kg, an increase of 14.48p/kg
• The difference in CoP performance between the top and bottom third of farms in 2012 was 11.72 pence/carcase kilogram and in 2013 it is 15.66 pence/carcase kilogram
BaseFarrowing rate % 95.0 90.0 87.96 85.0 80.0 75.0 70.0Calculated cost of pig production(COPP) pence/carcase kg 160.68 162.87 163.91 165.59 169.08 173.68 180.05
BaseFarrowing rate % 95.0 90.0 85.0 84.63 80.0 75.0 70.0(COPP) pence/carcase kg 164.65 166.80 169.45 169.79 172.81 177.18 183.14
BaseFarrowing rate % 95.0 90.0 85.0 81.22 80.0 75.0 70.0(COPP) pence/carcase kg 170.26 172.45 175.12 177.58 178.48 182.81 188.61
Top third farms
Average third farms
Bottom third farms
Source: Agrosoft Ltd
Source: Agrosoft Ltd

Economic and Financial Performance Data 29
The BPEX Yearbook 2013-2014
COST OF PRODUCTION TABLES
Table 15 Current annual performance farrowing rate for outdoor farms
Tables 14 and 15
The relationship between the Farrowing Rate % and the CoP is based on the effect of producing more/less pigs perherd. FR% is the percentage of animals recorded as served that complete a resulting pregnancy. The higher the FR%the more pigs are born per productive female in a measured period because the production turnover is increased.The result is that the output per fixed cost is greater in that period.
Attention to detail is essential with the FR% and the detail is the reported number or percentage of animals beingre-served. A management strategy that includes a calculated target based on FR% for the number of serves perservice group required to produce a fixed number of pigs sold per service group can lead to an increasing breedingherd size against a reducing output through repeatedly recycling breeding failures to maintain the FR%.
Table 16 Current annual performance feed conversion ratio for indoor farms
BaseFarrowing rate % 95.0 90.0 85.42 85.0 80.0 75.0 70.0Calculated cost of pig production(CoPP) pence/carcase kg 161.72 163.94 166.42 166.67 170.15 174.70 180.92
BaseFarrowing rate % 95.0 90.0 85.0 81.47 80.0 75.0 70.0(CoPP) pence/carcase kg 166.22 168.42 171.11 173.29 174.49 178.86 184.73
BaseFarrowing rate % 95.0 90.0 85.0 80.0 78.99 75.0 70.0(CoPP) pence/carcase kg 172.71 175.00 177.79 181.27 182.08 185.73 191.65
Top third farms
Average third farms
Bottom third farms
BaseFeed conversion ratio 2.20 2.30 2.37 2.40 2.50 2.60 2.70Calculated cost of pig production(CoPP) pence/carcase kg 155.48 160.44 163.91 165.39 170.35 175.30 180.26
Base(CoPP) pence/carcase kg 161.30 166.30 169.79 171.29 176.29 181.29 186.28
Base(CoPP) pence/carcase kg 168.99 174.04 177.58 179.10 184.16 189.21 194.27
Top third farms
Average third farms
Bottom third farms
Source: Agrosoft Ltd
Source: Agrosoft Ltd
Economic and Financial Performance Data30
The BPEX Yearbook 2013-2014
COST OF PRODUCTION TABLES
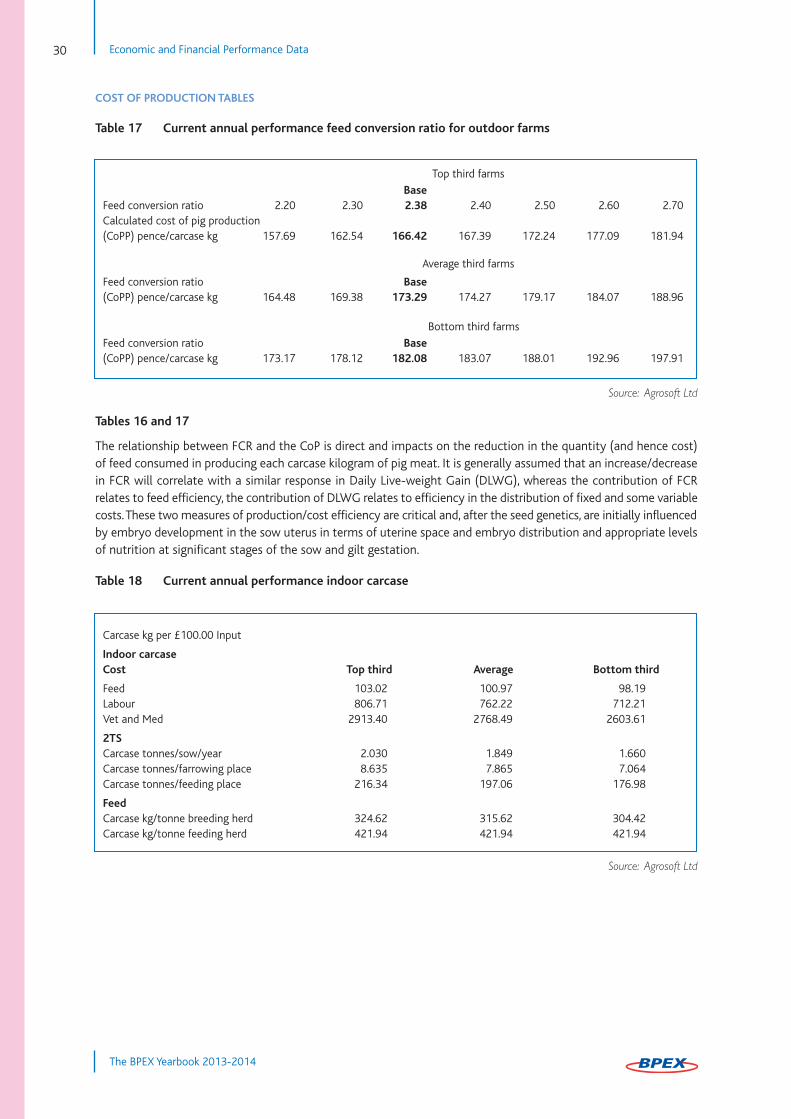
Table 17 Current annual performance feed conversion ratio for outdoor farms
Tables 16 and 17
The relationship between FCR and the CoP is direct and impacts on the reduction in the quantity (and hence cost)of feed consumed in producing each carcase kilogram of pig meat. It is generally assumed that an increase/decreasein FCR will correlate with a similar response in Daily Live-weight Gain (DLWG), whereas the contribution of FCRrelates to feed efficiency, the contribution of DLWG relates to efficiency in the distribution of fixed and some variablecosts. These two measures of production/cost efficiency are critical and, after the seed genetics, are initially influencedby embryo development in the sow uterus in terms of uterine space and embryo distribution and appropriate levelsof nutrition at significant stages of the sow and gilt gestation.
Table 18 Current annual performance indoor carcase
Carcase kg per £100.00 Input
Indoor carcaseCost Top third Average Bottom third
Feed 103.02 100.97 98.19Labour 806.71 762.22 712.21Vet and Med 2913.40 2768.49 2603.61
2TSCarcase tonnes/sow/year 2.030 1.849 1.660Carcase tonnes/farrowing place 8.635 7.865 7.064Carcase tonnes/feeding place 216.34 197.06 176.98
FeedCarcase kg/tonne breeding herd 324.62 315.62 304.42Carcase kg/tonne feeding herd 421.94 421.94 421.94
BaseFeed conversion ratio 2.20 2.30 2.38 2.40 2.50 2.60 2.70Calculated cost of pig production(CoPP) pence/carcase kg 157.69 162.54 166.42 167.39 172.24 177.09 181.94
Feed conversion ratio Base(CoPP) pence/carcase kg 164.48 169.38 173.29 174.27 179.17 184.07 188.96
Feed conversion ratio Base(CoPP) pence/carcase kg 173.17 178.12 182.08 183.07 188.01 192.96 197.91
Top third farms
Average third farms
Bottom third farms
Source: Agrosoft Ltd
Source: Agrosoft Ltd

Economic and Financial Performance Data 31
The BPEX Yearbook 2013-2014
COST OF PRODUCTION TABLES
Table 19 Current annual performance outdoor carcase
Tables 18 and 19
These tables report the carcase kilograms per £100.00 input cost for Feed, Labour, and Vet and Med as recorded inthe three ranked categories for indoor and outdoor production. The comparison of these two tables highlights thedifference in efficiency between indoor and outdoor production in terms of output over key costs.
Table 20 Value of improved performance for outdoor farms/Wean+3
Table 20 reports the requirements for achieving the BPEX Wean+3, measured in the improvements in the averagenational performance parameters for All farms production (table 1). These are the Non-Productive days per Litter,Pigs Born Alive per Litter and Pre-Weaning Mortality %. The potential is clear.
OutdoorWean+3 Base
Non-productive days/litter 17.10 -1 -2 -4 -6 -8 -10Pigs weaned/sow/year 23.73 23.88 24.03 24.34 24.65 24.98 25.31
Pigs born alive/litter 11.90 +0.25 +0.50 +0.75 +1.00 +1.25 +1.50Pigs weaned/sow/year 23.73 24.23 24.69 25.19 25.70 26.20 26.68
Pre-weaning mortality % 13.00 -0.5 -1.0 -1.5 -2.0 -2.5 -3.0Pigs weaned/sow/year 23.73 23.84 23.98 24.11 24.25 24.39 24.53
Cumulative total (+5.74)(COPP) pence/carcase kg 171.13 169.10 167.12 164.87 162.68 160.59 158.61Tonnes/sow/year 23.73 24.50 25.30 26.29 27.32 28.38 29.47
Value of improved performance (What If)
Carcase kg per £100.00 Input
Outdoor carcaseCost Top third Average Bottom third
Feed 99.28 96.22 92.43Labour 738.21 698.45 654.98Vet and Med 2689.58 2557.85 2412.26
2TSCarcase tonnes/sow/year 1.756 1.611 1.462Carcase tonnes/farrowing place 7.660 7.026 6.376Carcase tonnes/feeding place 204.71 187.77 170.39
FeedCarcase kg/tonne breeding herd 308.40 296.40 281.39Carcase kg/tonne feeding herd 420.17 420.17 40.17
Source: Agrosoft Ltd
<+3>
Source: Agrosoft Ltd

Economic and Financial Performance Data32
The BPEX Yearbook 2013-2014
COST OF PRODUCTION TABLES
Table 21
Table 22
Tables 21 and 22 report the relationship between Total Herd Deadweight Feed Conversion Ratio (FCR) and CoP.
There is no basis to suggest that the variation in performance used in tables 21 and 22 would be a relative occurrencein a pig production business. The sow feed weight values of the reported variations that are incrementally increasedare for the purpose of highlighting the relationship between the combined feed efficiency of the breeding and feedingherd (reported as a business primary key figure of Total Herd Deadweight FCR) and CoP.
Table 23
Table 24
Tables 23 and 24 report the impact of post-weaning mortality on the cost of production.
Indoor averageBase
Sow feed tonnes/sow/year 1.476 1.000 1.200 1.400 1.600 1.800 2.000
Feeding herd FCR 2.37 2.3 2.4 2.5 2.6 2.7 2.8
Total herd deadweight FCR 3.17 2.84 3.05 3.26 3.47 3.68 3.89
Calculated cost of pig production(CoPP) pence/carcase kg 169.79 161.66 167.44 173.32 179.25 185.22 191.22
Outdoor averageBase
Sow feed tonnes/sow/year 1.601 1.000 1.200 1.400 1.600 1.800 2.000
Feeding herd FCR 2.37 2.3 2.4 2.5 2.6 2.7 2.8
Total herd deadweight FCR 3.37 2.90 3.12 3.34 3.56 3.78 4.00
Calculated cost of pig production(CoPP) pence/carcase kg 173.29 161.98 168.21 174.49 180.79 187.10 193.42
Indoor averageBase
Post-weaning mortality % 6.90 2.0 3.0 4.0 5.0 6.0 7.0
Calculated cost of pig production(CoPP) pence/carcase kg 169.79 166.63 167.25 167.88 168.53 169.19 169.86
Outdoor averageBase
Post-weaning mortality % 6.90 2.0 3.0 4.0 5.0 6.0 7.0
Calculated cost of pig production(CoPP) pence/carcase kg 173.29 169.88 170.55 171.23 171.93 172.64 173.37
Source: Agrosoft Ltd
Source: Agrosoft Ltd
Source: Agrosoft Ltd
Source: Agrosoft Ltd
Economic and Financial Performance Data 33
The BPEX Yearbook 2013-2014
COST OF PRODUCTION TABLES
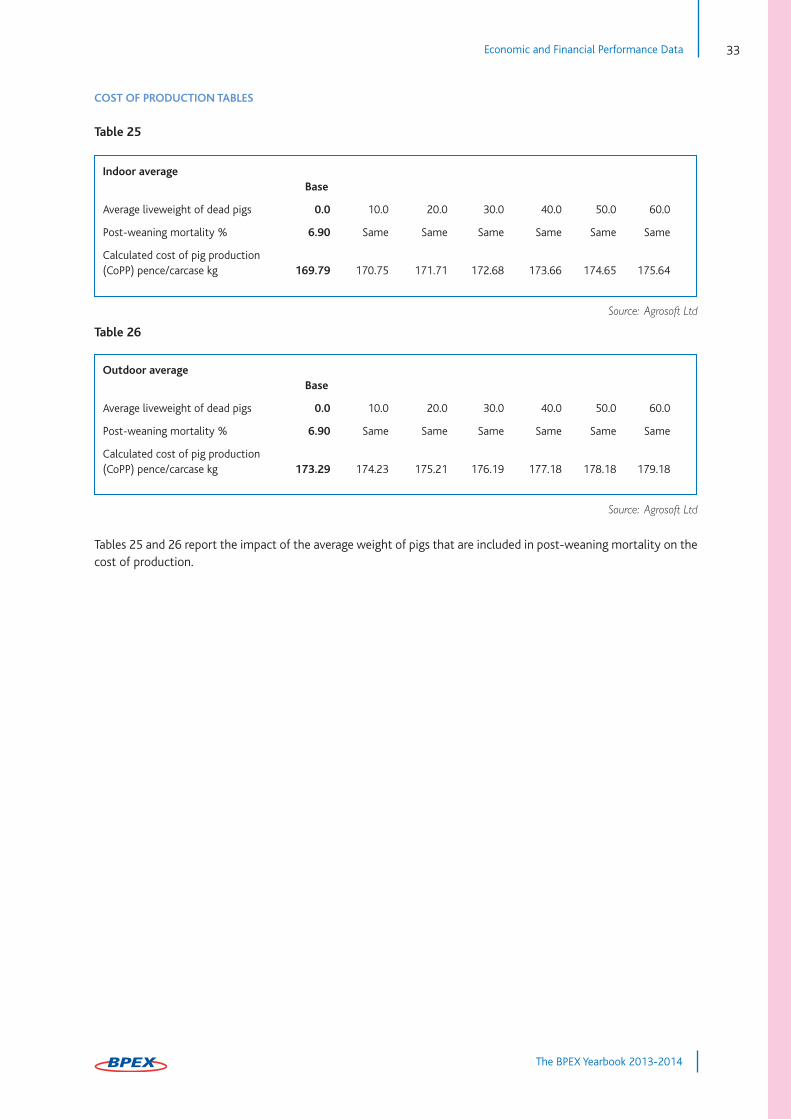
Table 25
Table 26
Tables 25 and 26 report the impact of the average weight of pigs that are included in post-weaning mortality on thecost of production.
Indoor averageBase
Average liveweight of dead pigs 0.0 10.0 20.0 30.0 40.0 50.0 60.0
Post-weaning mortality % 6.90 Same Same Same Same Same Same
Calculated cost of pig production(CoPP) pence/carcase kg 169.79 170.75 171.71 172.68 173.66 174.65 175.64
Outdoor averageBase
Average liveweight of dead pigs 0.0 10.0 20.0 30.0 40.0 50.0 60.0
Post-weaning mortality % 6.90 Same Same Same Same Same Same
Calculated cost of pig production(CoPP) pence/carcase kg 173.29 174.23 175.21 176.19 177.18 178.18 179.18
Source: Agrosoft Ltd
Source: Agrosoft Ltd

Technical Performance Data34
The BPEX Yearbook 2013-2014
TECHNICAL PERFORMANCE DATA
INTRODUCTION
The technical information presented in this chapter comes from a range of indoor and outdoor breeding systems,rearing, grower and finishing units. The feeding information and physical performance data is collected through theAgrosoft pig recording system.
Table 27 Distribution of herd size in Agrosoft recorded breeding herds 2007-2013
Table 28 Trends in weaning age 2004-2013
No sows % herds 2007 2008 2009 2010 2011 2012 2013
100-249 12 9 15 15 14 11 10
250-499 12 25 32 26 26 25 26
500-749 17 26 32 29 28 29 25
750-999 25 24 12 15 17 18 20
1000-1500 21 14 8 12 11 13 17
1500-3000 13 2 1 2 4 4 2
>3000 0 0 0 0 0 0 0
Total 100 100 100 100 100 100 100
Age at weaning (days) % herds 2004 2005 2006 2007 2008 2009 2010 2011 2012 2013
≤<20 0 0 0 0 0 0 0 1 0 0
20-25 23 49 37 28 31 30 29 27 29 49.2
26-32 68 45 62 70 65 66 67 69 68 47.8
33-39 9 6 1 0 2 3 1 1 1 1.5
>39 0 0 0 2 2 1 2 3 2 1.5
Total 100 100 100 100 100 100 100 100 100 100
Source: Agrosoft Ltd
Source: Agrosoft Ltd

Technical Performance Data 35
The BPEX Yearbook 2013-2014
TECHNICAL PERFORMANCE DATA
Table 29 Results for all breeding herds, year ended Dec 2013
Average * Top third * Top 10%*
Herd structure
Av. no. sows and gilts 591 507 475
Av. no. unserved gilts 97 99 56
Replacement rate (%) 53.30 54.29 57.43
Sow sales and deaths (%) 52.38 55.73 58.97
Sow mortality (%) 4.59 4.10 5.44
Sow performance
Successful services (%) 83.20 87.01 90.07
Litters/sow/year ** 2.29 2.35 2.40
Non-productive days ## 17.61 13.28 10.00
Pigs born/litter:
Alive 11.82 12.67 13.21
Dead 0.60 0.71 0.62
Mummified 0.16 0.19 0.21
Total 12.46 13.43 13.89
Pigs born/sow/year 27.07 29.81 31.70
Mortality of pigs born alive (%) 13.07 11.18 9.55
Pigs reared/litter 10.26 11.24 11.92
Pigs reared/sow/year ** 23.49 26.43 28.61
Weight of pigs produced (kg) 7.18 7.33 7.20
Av. weaning age (days) 26.39 26.40 26.31
Feed usage #
Sow feed/sow/year (t) 1.529 1.419 1.481
Feed/pig reared (kg) 65.78 54.15 52.96
Feed costs #
Sow feed cost/tonne (£) 238.02 243.37 244.67
Sow feed cost/sow/year (£) 356.28 352.16 359.49
Feed cost/pig reared (£) 15.44 13.15 12.74
* Selected on the basis of pigs reared per sow per year
** Per sow data excludes unserved gilts
# Per sow data includes unserved gilts. New methodology for year ending December 2013
## Non-productive days exclude gestation, lactation and a 6-day weaning to service interval
Source: Agrosoft Ltd
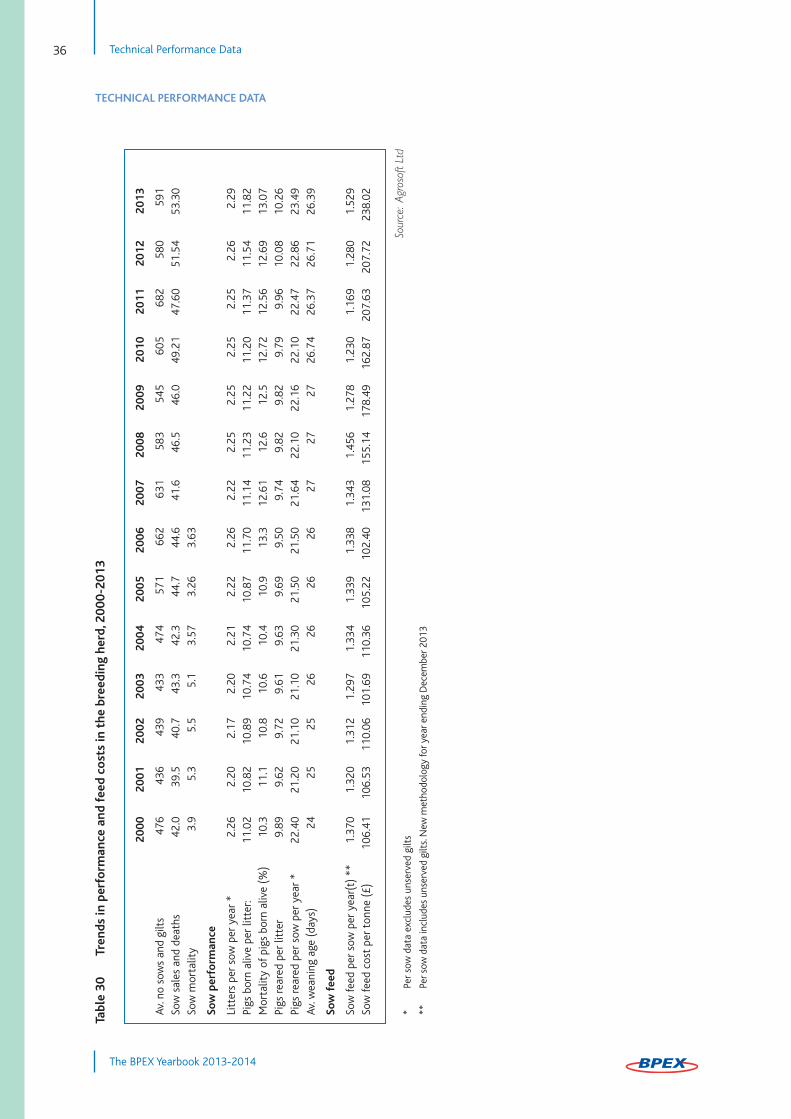
Technical Performance Data36
The BPEX Yearbook 2013-2014
TECHNICAL PERFORMANCE DATA
2000
200
120
0220
0320
0420
0520
0620
0720
0820
0920
1020
1120
1220
13
Av. no sows and gilts
476
436
439
433
474
571
662
631
583
545
605
682
580
591
Sow sales and deaths
42.0
39.5
40.7
43.3
42.3
44.7
44.6
41.6
46.5
46.0
49.21
47.60
51.54
53.30
Sow mortality
3.9
5.3
5.5
5.1
3.57
3.26
3.63
Sow
per
form
ance
Litters per sow per year *
2.26
2.20
2.17
2.20
2.21
2.22
2.26
2.22
2.25
2.25
2.25
2.25
2.26
2.29
Pigs born alive per litter:
11.02
10.82
10.89
10.74
10.74
10.87
11.70
11.14
11.23
11.22
11.20
11.37
11.54
11.82
Mortality of pigs born alive (%)
10.3
11.1
10.8
10.6
10.4
10.9
13.3
12.61
12.6
12.5
12.72
12.56
12.69
13.07
Pigs reared per litter
9.89
9.62
9.72
9.61
9.63
9.69
9.50
9.74
9.82
9.82
9.79
9.96
10.08
10.26
Pigs reared per sow per year *
22.40
21.20
21.10
21.10
21.30
21.50
21.50
21.64
22.10
22.16
22.10
22.47
22.86
23.49
Av. weaning age (days)
2425
2526
2626
2627
2727
26.74
26.37
26.71
26.39
Sow
fee
d
Sow feed per sow per year(t) **
1.370
1.320
1.312
1.297
1.334
1.339
1.338
1.343
1.456
1.278
1.230
1.169
1.280
1.529
Sow feed cost per tonne (£)
106.41
106.53
110.06
101.69
110.36
105.22
102.40
131.08
155.14
178.49
162.87
207.63
207.72
238.02
Source
: Agros
oft L
td
Tabl
e 30
Tr
ends
in p
erfo
rman
ce a
nd f
eed
cost
s in
the
bre
edin
g he
rd, 2
000-
2013
*
Per sow data excludes unserved gilts
**Per sow data includes unserved gilts. New methodology for year ending December 2013
Technical Performance Data 37
The BPEX Yearbook 2013-2014
TECHNICAL PERFORMANCE DATA
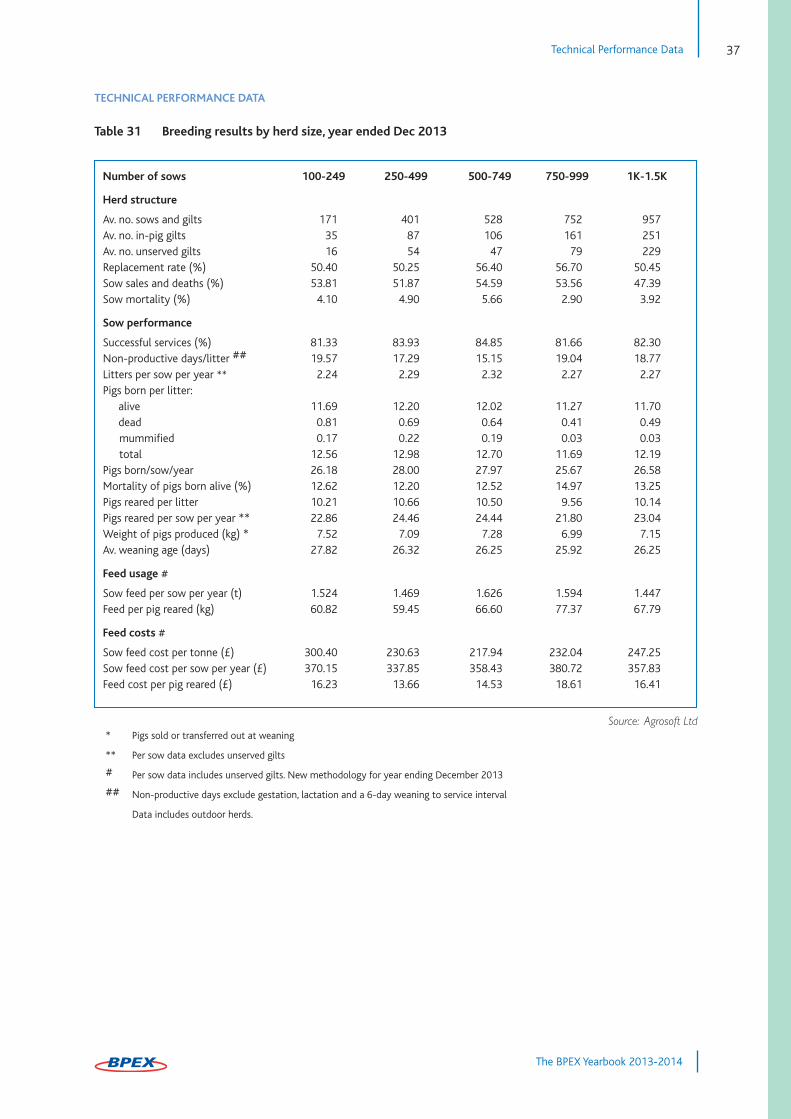
Table 31 Breeding results by herd size, year ended Dec 2013
* Pigs sold or transferred out at weaning
** Per sow data excludes unserved gilts
# Per sow data includes unserved gilts. New methodology for year ending December 2013
## Non-productive days exclude gestation, lactation and a 6-day weaning to service interval
Data includes outdoor herds.
Number of sows 100-249 250-499 500-749 750-999 1K-1.5K
Herd structure
Av. no. sows and gilts 171 401 528 752 957Av. no. in-pig gilts 35 87 106 161 251Av. no. unserved gilts 16 54 47 79 229Replacement rate (%) 50.40 50.25 56.40 56.70 50.45Sow sales and deaths (%) 53.81 51.87 54.59 53.56 47.39Sow mortality (%) 4.10 4.90 5.66 2.90 3.92
Sow performance
Successful services (%) 81.33 83.93 84.85 81.66 82.30Non-productive days/litter ## 19.57 17.29 15.15 19.04 18.77Litters per sow per year ** 2.24 2.29 2.32 2.27 2.27Pigs born per litter:alive 11.69 12.20 12.02 11.27 11.70dead 0.81 0.69 0.64 0.41 0.49mummified 0.17 0.22 0.19 0.03 0.03total 12.56 12.98 12.70 11.69 12.19
Pigs born/sow/year 26.18 28.00 27.97 25.67 26.58Mortality of pigs born alive (%) 12.62 12.20 12.52 14.97 13.25Pigs reared per litter 10.21 10.66 10.50 9.56 10.14Pigs reared per sow per year ** 22.86 24.46 24.44 21.80 23.04Weight of pigs produced (kg) * 7.52 7.09 7.28 6.99 7.15Av. weaning age (days) 27.82 26.32 26.25 25.92 26.25
Feed usage #
Sow feed per sow per year (t) 1.524 1.469 1.626 1.594 1.447Feed per pig reared (kg) 60.82 59.45 66.60 77.37 67.79
Feed costs #
Sow feed cost per tonne (£) 300.40 230.63 217.94 232.04 247.25Sow feed cost per sow per year (£) 370.15 337.85 358.43 380.72 357.83Feed cost per pig reared (£) 16.23 13.66 14.53 18.61 16.41
Source: Agrosoft Ltd

Technical Performance Data38
The BPEX Yearbook 2013-2014
TECHNICAL PERFORMANCE DATA
Table 32 Breeding herd results by age at weaning, year ended Dec 2013
Age at weaning Less than 26 days 26 days+Top 10% Top third Average Top 10% Top third Average
Herd structure
Av. no. sows and gilts 438 433 644 495 556 538Av. no. in-pig gilts 104 103 144 120 126 102Av. no. unserved gilts 71 89 90 34 115 106Replacement rate (%) 58.40 55.84 55.19 56.89 53.40 51.78Sow sales and deaths (%) 59.99 57.44 53.46 58.40 54.76 51.52Sow mortality (%) 6.27 4.41 4.15 4.61 3.67 5.27
Sow performance
Successful services (%) 87.81 86.56 82.62 91.33 87.29 83.76Non-productive day/litter ## 10.90 13.29 19.60 9.50 13.28 15.67Litters per sow per year ** 2.41 2.38 2.28 2.39 2.33 2.29Pigs born per litter:
alive 13.06 12.56 11.58 13.29 12.75 12.05dead 0.54 0.67 0.53 0.66 0.73 0.66mummified 0.13 0.15 0.13 0.28 0.23 0.20total 13.65 13.29 12.15 14.02 13.52 0.16
Pigs born/sow/year 31.54 29.91 26.46 31.80 29.74 27.66Mortality of pigs born alive (%) 9.45 11.86 13.33 9.61 10.74 12.81Pigs reared per litter 11.80 11.06 10.03 11.98 11.36 10.47Pigs reared per sow per year ** 28.52 26.34 22.93 28.66 26.49 24.04Weight of pigs produced (kg) * 7.17 7.05 7.03 7.21 7.50 7.32Av. weaning age (days) 24.18 24.21 24.75 27.50 27.80 27.99
Feed usage #
Sow feed per sow per year (t) 1.360 1.484 1.607 1.578 1.365 1.443Feed per pig reared (kg) 49.39 57.91 71.89 55.82 51.01 59.30
Feed costs ##
Sow feed cost per tonne (£) 243.82 241.30 228.42 245.35 245.25 249.38Sow feed cost per sow per year (£) 330.82 358.24 365.50 382.42 346.64 345.86Feed cost per pig reared (£) 11.97 13.55 16.19 13.36 12.79 14.59
* Pigs sold or transferred out at weaning
** Per sow data excludes unserved gilts
# Per sow data includes unserved gilts. New methodology for year ending December 2013
## Non-productive days exclude gestation, lactation and a 6-day weaning to service interval
Source: Agrosoft Ltd
Technical Performance Data 39
The BPEX Yearbook 2013-2014
TECHNICAL PERFORMANCE DATA
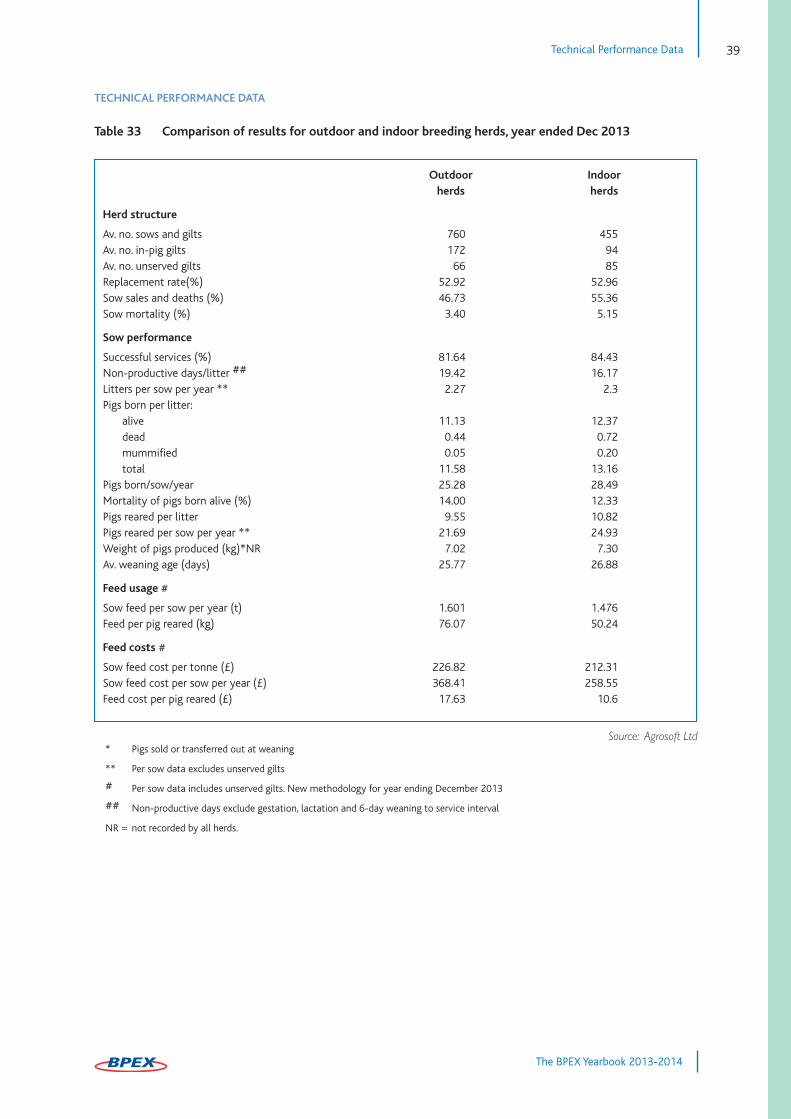
Table 33 Comparison of results for outdoor and indoor breeding herds, year ended Dec 2013
Outdoor Indoor herds herds
Herd structure
Av. no. sows and gilts 760 455Av. no. in-pig gilts 172 94Av. no. unserved gilts 66 85Replacement rate(%) 52.92 52.96Sow sales and deaths (%) 46.73 55.36Sow mortality (%) 3.40 5.15
Sow performance
Successful services (%) 81.64 84.43Non-productive days/litter ## 19.42 16.17Litters per sow per year ** 2.27 2.3Pigs born per litter:
alive 11.13 12.37dead 0.44 0.72mummified 0.05 0.20total 11.58 13.16
Pigs born/sow/year 25.28 28.49Mortality of pigs born alive (%) 14.00 12.33Pigs reared per litter 9.55 10.82Pigs reared per sow per year ** 21.69 24.93Weight of pigs produced (kg)*NR 7.02 7.30Av. weaning age (days) 25.77 26.88
Feed usage #
Sow feed per sow per year (t) 1.601 1.476Feed per pig reared (kg) 76.07 50.24
Feed costs #
Sow feed cost per tonne (£) 226.82 212.31Sow feed cost per sow per year (£) 368.41 258.55Feed cost per pig reared (£) 17.63 10.6
* Pigs sold or transferred out at weaning
** Per sow data excludes unserved gilts
# Per sow data includes unserved gilts. New methodology for year ending December 2013
## Non-productive days exclude gestation, lactation and 6-day weaning to service interval
NR = not recorded by all herds.
Source: Agrosoft Ltd

Technical Performance Data40
The BPEX Yearbook 2013-2014
TECHNICAL PERFORMANCE DATA
Table 34 Comparative results for indoor breeding herds, 2002–2013
2002 2004 2006 2008 2010 2011 2012 2012 2013 2013Top third * Top third *
Herd structureAv. no. sows and gilts 709 676 806 777 492 586 481 510 549 570Av. no. unserved gilts 61 60 - 80 95 37 37 46 85 70Sow replacements (%) 39.5 23.1 57.6 46.4 47.6 49.2 51.8 54.8 52.96 53.43Sow sales and deaths (%) 40.9 31.2 42.6 45.6 41.5 47.9 52.9 54.5 55.36 55.67Sow mortality (%) 3.6 1.6 5.4 4.6 1.4 2.9 3.2 3.0 5.15 4.35
Sow performance
Non-productive days ## 52 48 43 46 20 21 19 12.73 16.17 11.86Litters per sow per year ** 2.13 2.10 2.27 2.23 2.25 2.25 2.27 2.36 2.30 2.37Pigs born per litter:
alive 10.97 10.57 10.80 10.93 11.61 11.87 12.08 12.84 12.37 12.96dead *** 0.75 0.66 0.60 0.51 0.75 0.77 0.77 0.73 0.72 0.65total 11.72 11.23 11.40 11.70 12.59 12.85 13.13 13.96 13.16 13.67
Mortality of pigs born alive (%) 9.40 11.26 13.60 12.85 12.24 12.79 12.42 11.53 12.33 10.70Pigs reared per litter 9.95 9.61 9.30 9.52 10.20 10.36 10.59 11.41 10.82 11.55Pigs reared per sow per year ** 21.2 20.2 21.1 21.3 23.0 23.36 24.09 26.95 24.93 27.45Weight of pigs produced (kg) 7.3 7.8 8.1 7.6 7.4 7.49 7.4 7.4 7.30 7.16Av. weaning age (days) 26 30 26 27 27 27 27 26 26.88 26.12
Feed usage #
Sow feed per sow per year (t) 1.451 1.446 1.298 1.584 1.168 1.059 1.217 1.276 1.476 1.442Feed per pig reared (kg) 74.0 72.0 68.1 79.0 51.2 46.13 49.8 47.44 50.24 47.24
Feed costs #
Sow feed cost per tonne (£) 120.37 107.22 102.63 180.72 164.32 215.23 210.28 217.75 212.31 217.75Sow feed cost per sow per year (£) 174.70 155.04 124.22 242.11 172.39 230.92 253.18 274.58 258.55 274.58Feed cost per pig reared (£) 9.03 7.68 7.07 11.53 7.69 9.99 10.24 9.85 10.6 10.16
* Selected on basis of pigs reared per sow per year
** Excludes unserved gilts
*** Includes mummified pigs born
# Per sow data includes unserved gilts. New methodology for year ending December 2013
## Non-productive days exclude gestation, lactation and 6-day weaning to service interval
Source: Agrosoft Ltd

Technical Performance Data 41
The BPEX Yearbook 2013-2014
TECHNICAL PERFORMANCE DATA
* Selected on basis of pigs reared per sow per year
** Excludes unserved gilts
*** Includes mummified pigs born
#
Per sow data includes unserved gilts. New methodology for year ending December 2013
# # Non-productive days exclude gestation, lactation and 6-day weaning to service interval
Tabl
e 35
C
om
para
tive
res
ults
fo
r o
utdo
or
bre
edin
g he
rds,
200
2-20
13
Source
: Agros
oft L
td
2002
2004
2006
2008
2010
2011
2012
2012
2013
2013
Top
thir
d *
Top
thir
d *
Her
d st
ruct
ure
Av. no. sows and gilts
709
676
806
777
735
771
676
606
932
791
Av. no. unserved gilts
6160
-80
4584
7064
6688
Sow replacements (%)
39.5
23.1
57.6
46.4
39.2
52.4
51.3
49.5
52.9
54.9
Sow sales and deaths (%)
40.9
31.2
42.6
45.6
38.6
47.0
49.1
41.7
46.7
48.2
Sow mortality (%)
3.6
1.6
5.4
4.6
1.1
3.5
4.0
3.4
3.4
2.2
Sow
per
form
ance
Non-productive days ##
5248
4346
1921
2013
19.42
14.25
Litters per sow per year **
2.13
2.10
2.27
2.23
2.24
2.24
2.26
2.35
2.27
2.34
Pigs born per litter:
alive
10.97
10.57
10.80
10.93
10.74
10.83
11.03
11.52
11.13
11.67
dead ***
0.75
0.66
0.60
0.51
0.49
0.51
0.52
0.57
0.44
0.61
total
11.72
11.23
11.40
11.70
11.25
11.37
11.59
12.23
11.58
12.30
Mortality of pigs born alive (%)
9.40
11.26
13.60
12.85
13.14
12.39
12.95
11.62
14.00
12.58
Pigs reared per litter
9.95
9.61
9.30
9.52
9.32
9.91
9.51
10.17
9.55
10.14
Pigs reared per sow per year **
21.2
20.2
21.1
21.3
21.0
21.3
21.68
23.87
21.69
23.75
Weight of pigs produced (kg)
7.3
7.8
8.1
7.6
7.0
7.9
7.7
7.3
7.02
7.14
Av. weaning age (days)
2630
2627
2627
2727
25.77
25.96
Feed
usa
ge#
Sow feed per sow per year (t)
1.451
1.446
1.298
1.584
1.330
1.345
1.365
1.367
1.601
1.515
Feed per pig reared (kg)
7472
6879
6563
6457
76.07
64.56
Feed
co
sts #
Sow feed cost per tonne (£)
120.37
107.22
102.63
180.72
160.34
194.44
204.31
195.73
226.82
230.24
Sow feed cost per sow per year (£)
174.70
155.04
124.22
242.11
175.45
284.35
279.24
265.70
368.41
368.57
Feed cost per pig reared (£)
9.03
7.68
7.07
11.53
8.85
12.88
13.14
10.77
17.63
15.88

Technical Performance Data42
The BPEX Yearbook 2013-2014
TECHNICAL PERFORMANCE DATA
Table 36 Overall rearing herd results, year ended Dec 2013
Top 10% * Top third * Average
Herd structure
Av. no. of pigs 3141 3242 2607
Pig performance
Weight of pigs at start (kg) 7.4 7.3 7.2Weight of pigs produced (kg) 28.34 29.78 31.45Mortality (%) 3.03 3.78 4.00Feed conversion ratio 1.45 1.63 1.84Daily gain (g) 486 515 479Days in herd 55.0 62.4 67.2
Feed usage and costs **
Feed cost per tonne (£) 307.81 323.76 352.17Feed cost per kg gain (p) 44.52 52.34 65.18Feed cost per pig reared (£) 7.80 11.32 14.13
Sales
Av. sale value (£) 56.69 56.07 53.66Sale weight (kg) 26.9 30.0 30.2Liveweight price (£ per kg) 28.34 29.87 31.45
* Selected on feed cost per kg liveweight gain
** Home mixed feed prices do not include milling and mixing charges
Note: Data above based on a limited dataset
Source: Agrosoft Ltd
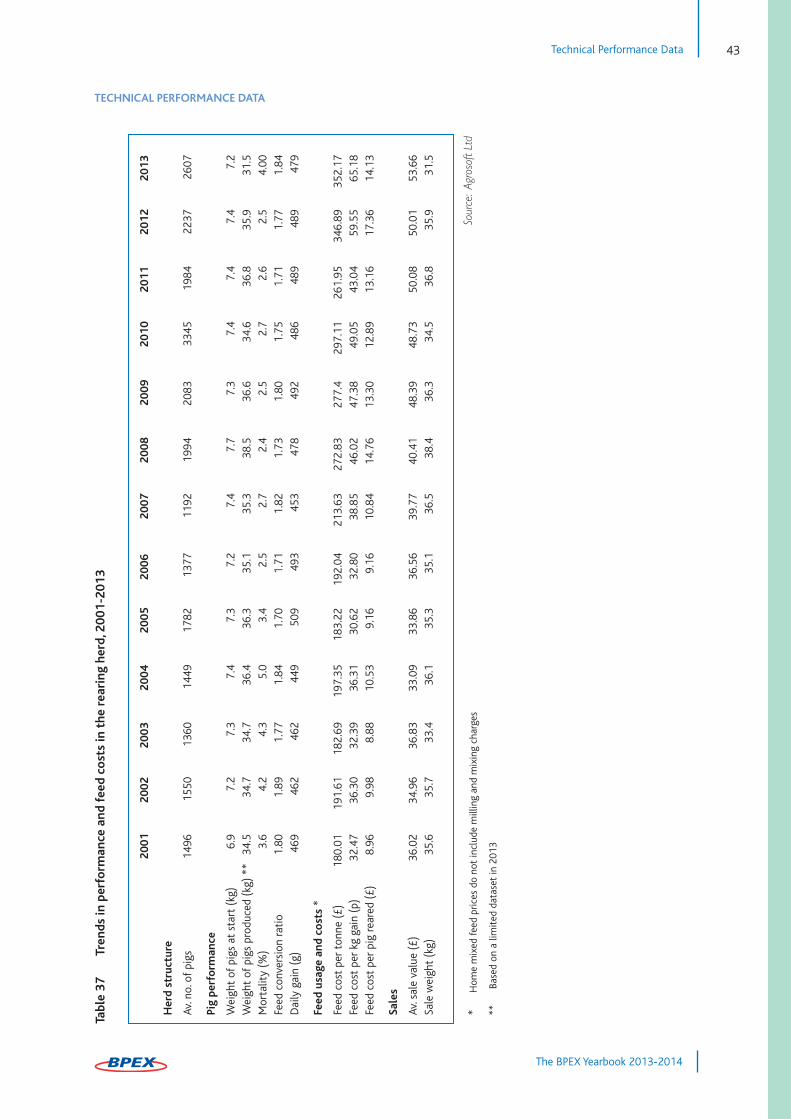
Technical Performance Data 43
The BPEX Yearbook 2013-2014
TECHNICAL PERFORMANCE DATA
* Home mixed feed prices do not include milling and mixing charges
** Based on a limited dataset in 2013
Tabl
e 37
Tren
ds in
per
form
ance
and
fee
d co
sts
in t
he r
eari
ng h
erd,
200
1-20
13
Source
: Agros
oft L
td
200
120
0220
0320
0420
0520
0620
0720
0820
0920
1020
1120
1220
13
Her
d st
ruct
ure
Av. no. of pigs
1496
1550
1360
1449
1782
1377
1192
1994
2083
3345
1984
2237
2607
Pig
perf
orm
ance
Weight of pigs at start (kg)
6.9
7.2
7.3
7.4
7.3
7.2
7.4
7.7
7.3
7.4
7.4
7.4
7.2
Weight of pigs produced (kg) **
34.5
34.7
34.7
36.4
36.3
35.1
35.3
38.5
36.6
34.6
36.8
35.9
31.5
Mortality (%)
3.6
4.2
4.3
5.0
3.4
2.5
2.7
2.4
2.5
2.7
2.6
2.5
4.00
Feed conversion ratio
1.80
1.89
1.77
1.84
1.70
1.71
1.82
1.73
1.80
1.75
1.71
1.77
1.84
Daily gain (g)
469
462
462
449
509
493
453
478
492
486
489
489
479
Feed
usa
ge a
nd c
ost
s*
Feed cost per tonne (£)
180.01
191.61
182.69
197.35
183.22
192.04
213.63
272.83
277.4
297.11
261.95
346.89
352.17
Feed cost per kg gain (p)
32.47
36.30
32.39
36.31
30.62
32.80
38.85
46.02
47.38
49.05
43.04
59.55
65.18
Feed cost per pig reared (£)
8.96
9.98
8.88
10.53
9.16
9.16
10.84
14.76
13.30
12.89
13.16
17.36
14.13
Sale
s
Av. sale value (£)
36.02
34.96
36.83
33.09
33.86
36.56
39.77
40.41
48.39
48.73
50.08
50.01
53.66
Sale weight (kg)
35.6
35.7
33.4
36.1
35.3
35.1
36.5
38.4
36.3
34.5
36.8
35.9
31.5
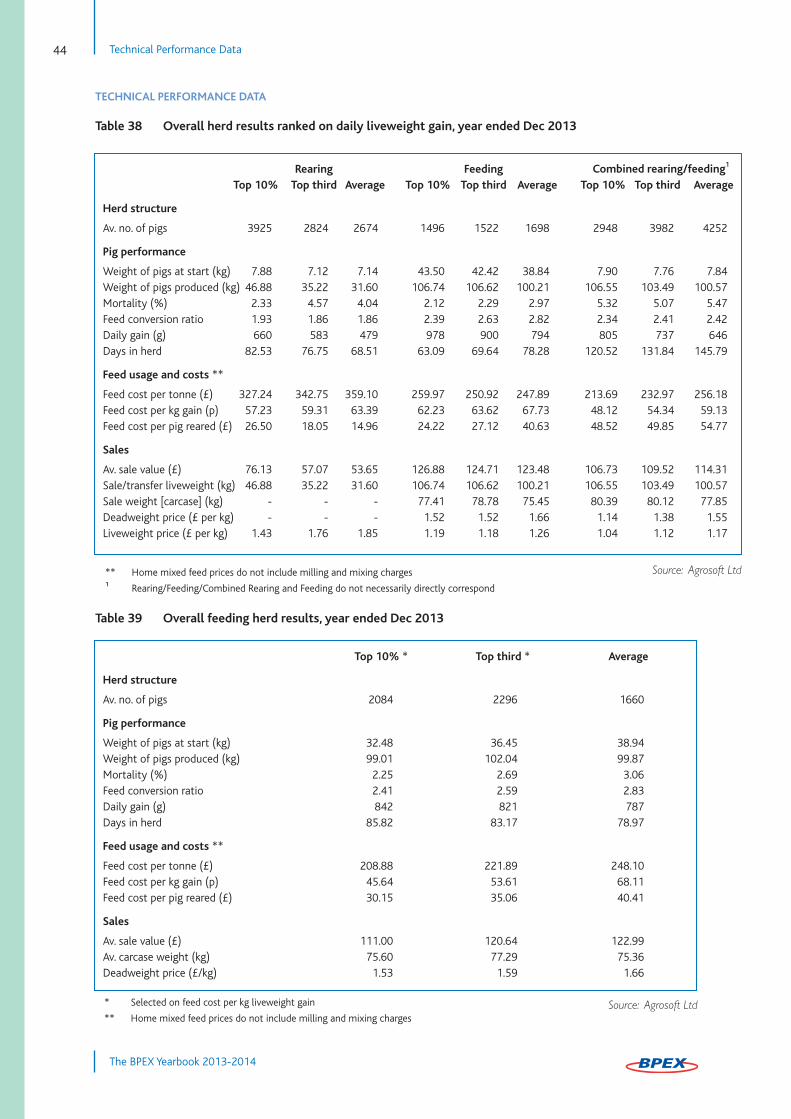
Technical Performance Data44
The BPEX Yearbook 2013-2014
TECHNICAL PERFORMANCE DATA
Table 38 Overall herd results ranked on daily liveweight gain, year ended Dec 2013
Table 39 Overall feeding herd results, year ended Dec 2013
Rearing FeedingTop 10% Top third Average Top 10% Top third Average Top 10% Top third Average
Herd structure
Av. no. of pigs 3925 2824 2674 1496 1522 1698 2948 3982 4252
Pig performance
Weight of pigs at start (kg) 7.88 7.12 7.14 43.50 42.42 38.84 7.90 7.76 7.84Weight of pigs produced (kg) 46.88 35.22 31.60 106.74 106.62 100.21 106.55 103.49 100.57Mortality (%) 2.33 4.57 4.04 2.12 2.29 2.97 5.32 5.07 5.47Feed conversion ratio 1.93 1.86 1.86 2.39 2.63 2.82 2.34 2.41 2.42Daily gain (g) 660 583 479 978 900 794 805 737 646Days in herd 82.53 76.75 68.51 63.09 69.64 78.28 120.52 131.84 145.79
Feed usage and costs **
Feed cost per tonne (£) 327.24 342.75 359.10 259.97 250.92 247.89 213.69 232.97 256.18Feed cost per kg gain (p) 57.23 59.31 63.39 62.23 63.62 67.73 48.12 54.34 59.13Feed cost per pig reared (£) 26.50 18.05 14.96 24.22 27.12 40.63 48.52 49.85 54.77
Sales
Av. sale value (£) 76.13 57.07 53.65 126.88 124.71 123.48 106.73 109.52 114.31Sale/transfer liveweight (kg) 46.88 35.22 31.60 106.74 106.62 100.21 106.55 103.49 100.57Sale weight [carcase] (kg) - - - 77.41 78.78 75.45 80.39 80.12 77.85Deadweight price (£ per kg) - - - 1.52 1.52 1.66 1.14 1.38 1.55Liveweight price (£ per kg) 1.43 1.76 1.85 1.19 1.18 1.26 1.04 1.12 1.17
Combined rearing/feeding¹
** Home mixed feed prices do not include milling and mixing charges¹ Rearing/Feeding/Combined Rearing and Feeding do not necessarily directly correspond
Source: Agrosoft Ltd
Top 10% * Top third * Average
Herd structure
Av. no. of pigs 2084 2296 1660
Pig performance
Weight of pigs at start (kg) 32.48 36.45 38.94Weight of pigs produced (kg) 99.01 102.04 99.87Mortality (%) 2.25 2.69 3.06Feed conversion ratio 2.41 2.59 2.83Daily gain (g) 842 821 787Days in herd 85.82 83.17 78.97
Feed usage and costs **
Feed cost per tonne (£) 208.88 221.89 248.10Feed cost per kg gain (p) 45.64 53.61 68.11Feed cost per pig reared (£) 30.15 35.06 40.41
Sales
Av. sale value (£) 111.00 120.64 122.99Av. carcase weight (kg) 75.60 77.29 75.36Deadweight price (£/kg) 1.53 1.59 1.66
* Selected on feed cost per kg liveweight gain
** Home mixed feed prices do not include milling and mixing chargesSource: Agrosoft Ltd
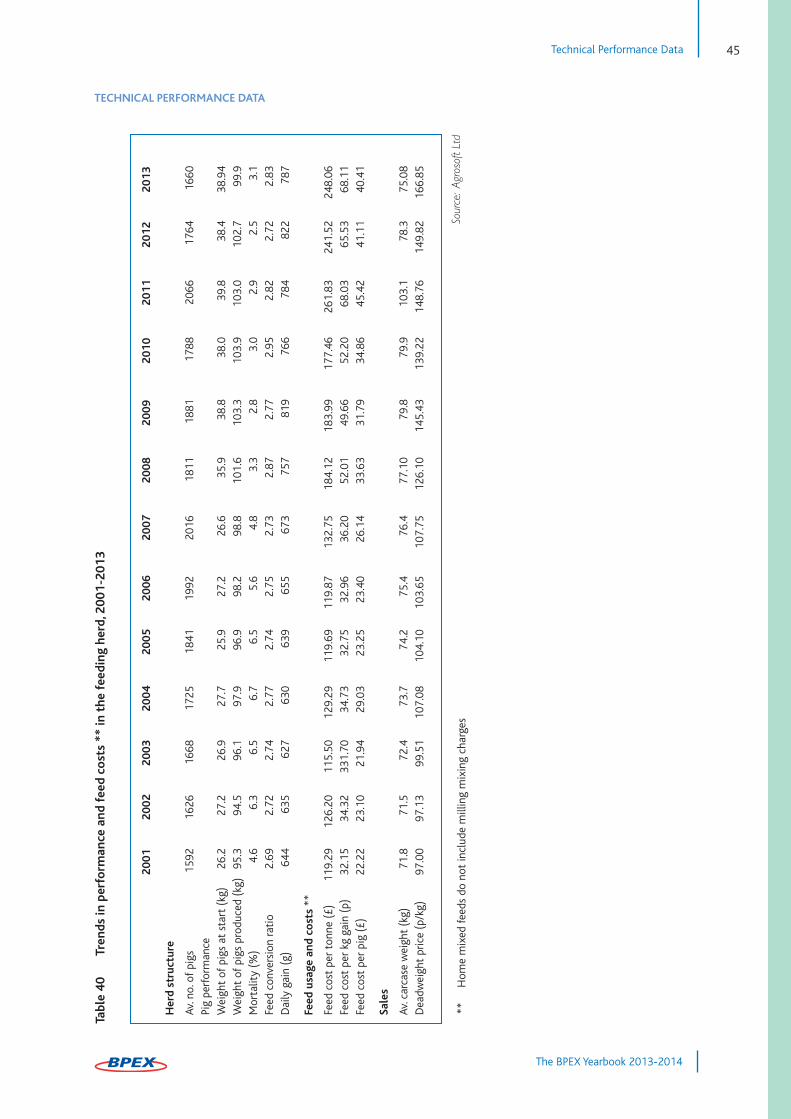
Technical Performance Data 45
The BPEX Yearbook 2013-2014
TECHNICAL PERFORMANCE DATATa
ble
40Tr
ends
in p
erfo
rman
ce a
nd f
eed
cost
s **
in t
he f
eedi
ng h
erd,
200
1-20
13
** Home mixed feeds do not include milling mixing charges
Source
: Agros
oft L
td
200
12
002
2003
2004
2005
2006
2007
2008
2009
2010
2011
2012
2013
Her
d st
ruct
ure
Av. no. of pigs
1592
1626
1668
1725
1841
1992
2016
1811
1881
1788
2066
1764
1660
Pig performance
Weight of pigs at start (kg)
26.2
27.2
26.9
27.7
25.9
27.2
26.6
35.9
38.8
38.0
39.8
38.4
38.94
Weight of pigs produced (kg)95.3
94.5
96.1
97.9
96.9
98.2
98.8
101.6
103.3
103.9
103.0
102.7
99.9
Mortality (%)
4.6
6.3
6.5
6.7
6.5
5.6
4.8
3.3
2.8
3.0
2.9
2.5
3.1
Feed conversion ratio
2.69
2.72
2.74
2.77
2.74
2.75
2.73
2.87
2.77
2.95
2.82
2.72
2.83
Daily gain (g)
644
635
627
630
639
655
673
757
819
766
784
822
787
Feed
usa
ge a
nd c
ost
s **
Feed cost per tonne (£)
119.29
126.20
115.50
129.29
119.69
119.87
132.75
184.12
183.99
177.46
261.83
241.52
248.06
Feed cost per kg gain (p)
32.15
34.32
331.70
34.73
32.75
32.96
36.20
52.01
49.66
52.20
68.03
65.53
68.11
Feed cost per pig (£)
22.22
23.10
21.94
29.03
23.25
23.40
26.14
33.63
31.79
34.86
45.42
41.11
40.41
Sale
s
Av. carcase weight (kg)
71.8
71.5
72.4
73.7
74.2
75.4
76.4
77.10
79.8
79.9
103.1
78.3
75.08
Deadweight price (p/kg)
97.00
97.13
99.51
107.08
104.10
103.65
107.75
126.10
145.43
139.22
148.76
149.82
166.85
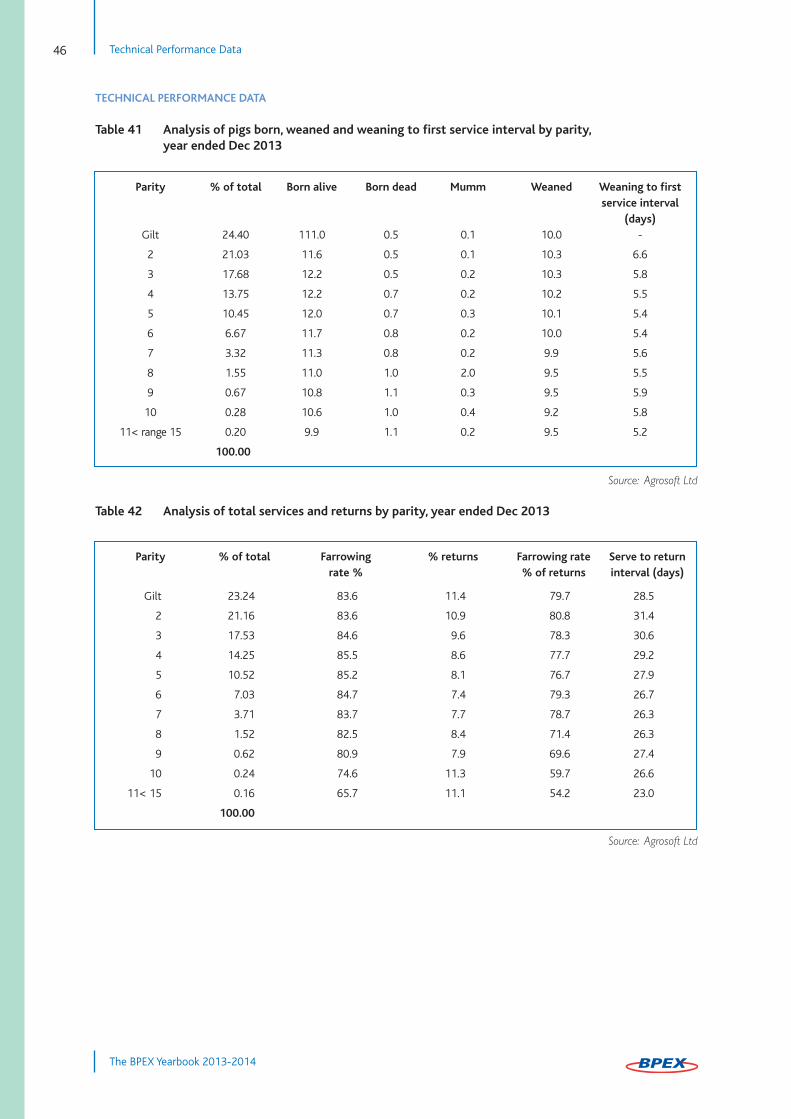
Technical Performance Data46
The BPEX Yearbook 2013-2014
TECHNICAL PERFORMANCE DATA
Table 41 Analysis of pigs born, weaned and weaning to first service interval by parity, year ended Dec 2013
Table 42 Analysis of total services and returns by parity, year ended Dec 2013
Parity % of total Born alive Born dead Mumm Weaned Weaning to first service interval
(days)Gilt 24.40 111.0 0.5 0.1 10.0 -
2 21.03 11.6 0.5 0.1 10.3 6.6
3 17.68 12.2 0.5 0.2 10.3 5.8
4 13.75 12.2 0.7 0.2 10.2 5.5
5 10.45 12.0 0.7 0.3 10.1 5.4
6 6.67 11.7 0.8 0.2 10.0 5.4
7 3.32 11.3 0.8 0.2 9.9 5.6
8 1.55 11.0 1.0 2.0 9.5 5.5
9 0.67 10.8 1.1 0.3 9.5 5.9
10 0.28 10.6 1.0 0.4 9.2 5.8
11< range 15 0.20 9.9 1.1 0.2 9.5 5.2
100.00
Source: Agrosoft Ltd
Parity % of total Farrowing % returns Farrowing rate Serve to return rate % % of returns interval (days)
Gilt 23.24 83.6 11.4 79.7 28.5
2 21.16 83.6 10.9 80.8 31.4
3 17.53 84.6 9.6 78.3 30.6
4 14.25 85.5 8.6 77.7 29.2
5 10.52 85.2 8.1 76.7 27.9
6 7.03 84.7 7.4 79.3 26.7
7 3.71 83.7 7.7 78.7 26.3
8 1.52 82.5 8.4 71.4 26.3
9 0.62 80.9 7.9 69.6 27.4
10 0.24 74.6 11.3 59.7 26.6
11< 15 0.16 65.7 11.1 54.2 23.0
100.00
Source: Agrosoft Ltd

Knowledge Transfer 47
The BPEX Yearbook 2013-2014
KNOWLEDGE TRANSFER
TWO-TONNE SOW CAMPAIGN
The BPEX Research and Development (R&D) and Knowledge Transfer (KT) teams have been focused on helpingindividual businesses improve herd performance as part of delivering the Two-Tonne Sow Campaign (2TS). Thecampaign was launched in 2010 with the aim of helping the English pig industry achieve an overall average of 2000kgof pig meat per sow per year. It provides a single target for the industry to work towards collectively, to secure long-term competitiveness for the English pig industry.
The teams re-focused their efforts on the breeding herd during 2013 with a ‘Breed +3’ initiative to help each herdwean an extra three pigs per sow per year – that’s whether they’re currently averaging at 23 pigs weaned or if they’realready at 27 and want to get to 30. This was the main focus for the autumn regional events, which attracted over250 delegates across the country. International experts, breeding companies and producers all shared their knowledgeand experience on how others could improve their breeding herd performance.
SERVICES AND OPPORTUNITIES
All English pig businesses can access the following services from BPEX to help them move towards achieving andsurpassing the 2TS target:
• On-farm reviews
• On-farm investigations and field trials
• Innovation grants
• Staff development and training
• Business insight trips/study tours
• Regional producer events
• Pig Health Improvement Project
• Environment and building services
• Media and publications.
During the course of the next 12 months, a new structure will be rolled out across BPEX. This will increase accessibilityto each of the services above by levy payers and create better links between all parts of the chain.
ON-FARM REVIEWS
These are independent reviews of the technical performance of your business and/or can address a particular issueyou may have.
• Typically, half-day or one-day visit by a member of the field team
• One-page report, including recommended actions to take
• Follow-up visit, if required or requested
• Recommendations shared with vet or allied industry business, if appropriate and requested by the customer.

Knowledge Transfer48
The BPEX Yearbook 2013-2014
ON-FARM INVESTIGATIONS AND FIELD TRIALS
If a number of pig businesses have a common problem with herd performance, BPEX may be able to help investigateit or fund field trials to look at possible solutions. Results from the trials will be shared with all BPEX customers aspart of the 2TS campaign.
Field trials in progress include:
• Development of a Standard AI Area for Outdoor Production
• Monitoring outdoor farrowing paddocks to identify causes of piglet mortality
• Maximising the value of data collected from recording systems commonly used on pig farms in England
• Development of an outdoor farrowing tent
• Feeder review.
Development of a Standard AI Area for Outdoor Production – The ‘AI Pod’
Easey Pigs and Rattlerow Farms
Aims and objectives • To design a new AI area which will provide the correct environment for the sow during heat detection
and insemination, while conferring a high degree of labour efficiency and resultant reduction in time required per insemination period
• To place the first AI Pod with a producer identified by Paul Dack, as one requiring input in its operation in the form of a well-designed AI area
• To place the second AI Pod onto a unit from the Rattlerow pyramid that achieves above average results; this is to evaluate the true potential of the AI Pod and develop the daily operational protocols
• To promote the AI Pod by training producers on how to use the system correctly and demonstrating theadvantages of a bespoke AI area.
Project achievements during 2013-2014• Sows are calmer in the new AI area
• Gilts readily adapt to the system
• The system makes it much easier to differentiate whether sows/gilts are showing standing heat or not, so it should mean that heat detection and timing of service is more accurate
• During the wet winter period, the sows did not come onto heat as well as the rest of the year and have been more difficult to handle in the AI Pod as a result; we are waiting to see what litter sizes from this period are
• A video of the system can be viewed on the BPEX website.
Application to industry• Improved reproductive performance is a major component of Breed +3 and the sustainability of the pig
industry
• When visiting outdoor units, it is apparent that many AI areas have not been designed to provide a goodinsemination area for either sows or AI operators. One common error is the provision of only one AI pen,which means that it is impossible to utilise labour efficiently or provide a good environment for the sowduring and post AI
• Hopefully, this field trial will demonstrate the advantages of a bespoke AI area and show how it is possible to provide the correct environment for the sow during heat detection and insemination, while conferring a high degree of labour efficiency.

Knowledge Transfer 49
The BPEX Yearbook 2013-2014
ON-FARM INVESTIGATONS AND FIELD TRIALS
Monitoring of outdoor farrowing paddocks to identify causes of piglet mortality
Easey Pigs
Aims and objectives• To identify the causes of piglet predation, eg foxes, badgers, dogs
• To quantify the scale of predation
• To monitor the effect predation has on sow and piglet behaviour
• To identify an appropriate and efficient control strategy.
Project achievements during 2013-2014• It has been difficult to establish a workable balance between the high tech equipment needed for accurate video footage with the unfavourable environmental conditions and set-up on farm
• Filming has been restricted to a limited area of the farrowing paddocks due to the restrictions of getting power to the extensive site
• Halfway through the trial the project was reviewed and the cameras were re-positioned to try and improve the chances of capturing fox activity on video
• The next stage of the trial will be to move the equipment to another unit where accessibility to resources, eg power is better
• Lessons learned to date before purchasing any equipment: conduct a site visit with an expert/technicianto ensure that resources, environmental conditions and equipment will be compatible
• The trial is currently inconclusive but more data should be available during 2014.
Application to industry• Over 40% of the national herd is outside but as an industry we have no verifiable data about predation• What is known is that having a 'fox problem’ can increase mortality anywhere between 2-10% in a batch but we have never done any proper trials to assess the true cause
• By observing predation behaviour and making pictures and data freely available to the industry, it will, hopefully, lead to the development of effective ways of preventing the problem from occurring.
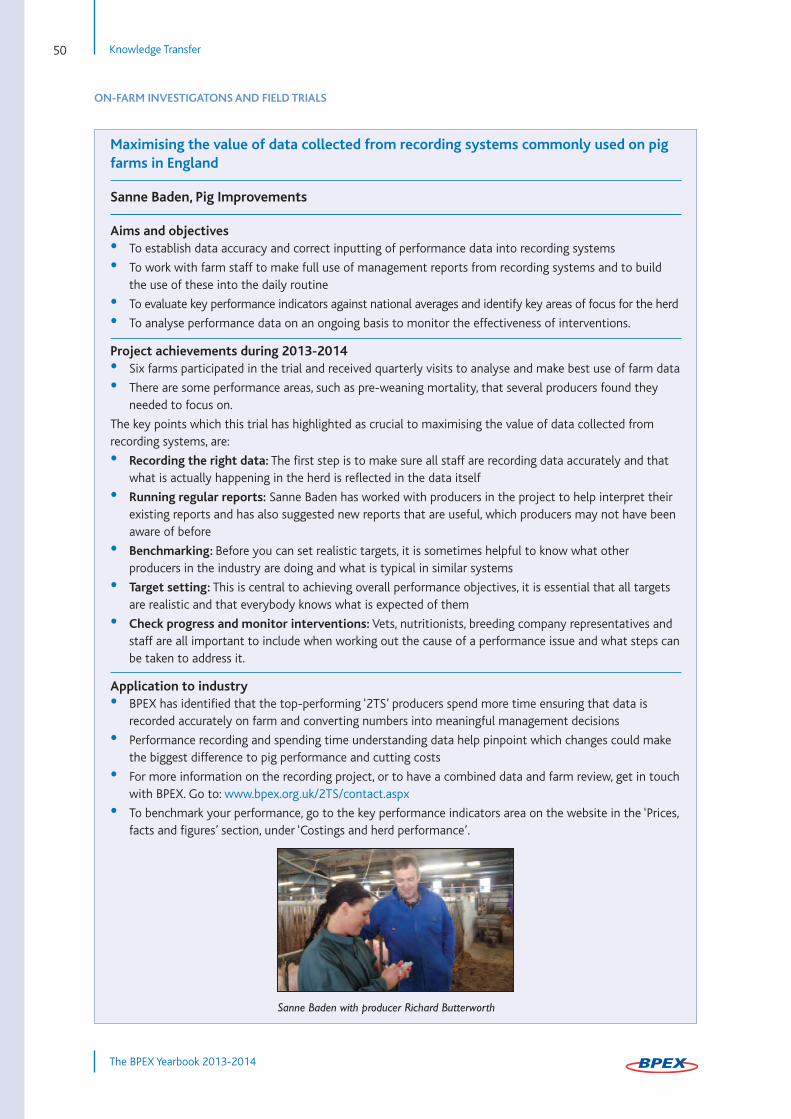
ON-FARM INVESTIGATONS AND FIELD TRIALS
Knowledge Transfer50
The BPEX Yearbook 2013-2014
Maximising the value of data collected from recording systems commonly used on pigfarms in England
Sanne Baden, Pig Improvements
Aims and objectives• To establish data accuracy and correct inputting of performance data into recording systems
• To work with farm staff to make full use of management reports from recording systems and to build the use of these into the daily routine
• To evaluate key performance indicators against national averages and identify key areas of focus for the herd
• To analyse performance data on an ongoing basis to monitor the effectiveness of interventions.
Project achievements during 2013-2014• Six farms participated in the trial and received quarterly visits to analyse and make best use of farm data
• There are some performance areas, such as pre-weaning mortality, that several producers found they needed to focus on.
The key points which this trial has highlighted as crucial to maximising the value of data collected fromrecording systems, are:
• Recording the right data: The first step is to make sure all staff are recording data accurately and that what is actually happening in the herd is reflected in the data itself
• Running regular reports: Sanne Baden has worked with producers in the project to help interpret their existing reports and has also suggested new reports that are useful, which producers may not have been aware of before
• Benchmarking: Before you can set realistic targets, it is sometimes helpful to know what other producers in the industry are doing and what is typical in similar systems
• Target setting: This is central to achieving overall performance objectives, it is essential that all targets are realistic and that everybody knows what is expected of them
• Check progress and monitor interventions: Vets, nutritionists, breeding company representatives and staff are all important to include when working out the cause of a performance issue and what steps canbe taken to address it.
Application to industry• BPEX has identified that the top-performing ‘2TS’ producers spend more time ensuring that data is recorded accurately on farm and converting numbers into meaningful management decisions
• Performance recording and spending time understanding data help pinpoint which changes could make the biggest difference to pig performance and cutting costs
• For more information on the recording project, or to have a combined data and farm review, get in touchwith BPEX. Go to: www.bpex.org.uk/2TS/contact.aspx
• To benchmark your performance, go to the key performance indicators area on the website in the ‘Prices,facts and figures’ section, under ‘Costings and herd performance’.
Sanne Baden with producer Richard Butterworth
ON-FARM INVESTIGATONS AND FIELD TRIALS
Knowledge Transfer 51
The BPEX Yearbook 2013-2014
Development of an outdoor farrowing tent
Kings Fene Farm
Aims and objectives• To increase the production potential of outdoor farrowing by providing more control at farrowing time
• To reduce pre-weaning mortality
• To provide a better environment for the staff to work in at farrowing.
Project achievements during 2013-2014
• This trial has been extended and is therefore ongoing
• The producer has reported that he is saving up to 50% in terms of straw usage compared with his traditional arcs; this is due to the tent being sited on better ground and not in very wet areas as is sometimes the case with the row of arcs, as there is usually a wetter spot in most fields
• The farrowing tent is currently situated on the perimeter of a paddock for ease of access for the stockmen and time saving on bedding up
• The producer is weighing the piglets coming out of both the farrowing tent and the arcs to see what, if any, difference there is between weaning weights.
Application to industry
With over 40% of the English breeding herd being outdoors, increasing the production potential and reducingpre-weaning mortality from this sector could make a significant improvement to the national breeding herdperformance. By providing a better environment for the staff to work in at farrowing it could also help toattract more people to work on outdoor units.
Feeder Review
Rattlerow Farms Ltd
Aims and objectivesTo review commercially available feeders on a working pig unit against the following criteria:
• Feed wastage
• Ease of adjustment
• Robustness.
Project achievements during 2013-2014
• Seven manufacturers are taking part in the review
• Feeders were installed on the unit during January 2014
• There are 17 feeders in total, all situated in the finisher house; feeders include wet, wet/dry, dry, pelleted, and meal
• The flat deck review will commence in April 2014.
Application to industry
It has been brought to the attention of BPEX that when a producer wishes to purchase feeders, the informationavailable to inform this decision is limited. The recent ‘feed crisis’ highlighted the need for producers to bebetter informed to enable them to make appropriate decisions when purchasing feeders for both rearing andfinishing pigs.
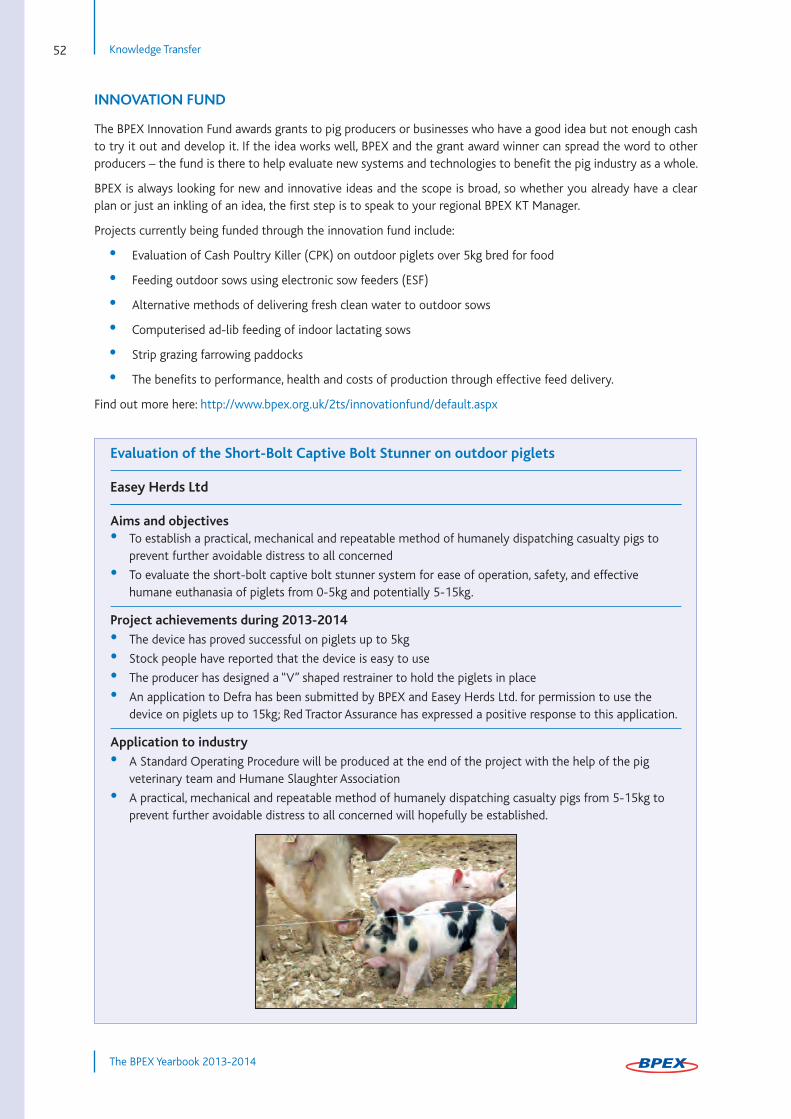
Knowledge Transfer52
The BPEX Yearbook 2013-2014
INNOVATION FUND
The BPEX Innovation Fund awards grants to pig producers or businesses who have a good idea but not enough cashto try it out and develop it. If the idea works well, BPEX and the grant award winner can spread the word to otherproducers – the fund is there to help evaluate new systems and technologies to benefit the pig industry as a whole.
BPEX is always looking for new and innovative ideas and the scope is broad, so whether you already have a clearplan or just an inkling of an idea, the first step is to speak to your regional BPEX KT Manager.
Projects currently being funded through the innovation fund include:
• Evaluation of Cash Poultry Killer (CPK) on outdoor piglets over 5kg bred for food
• Feeding outdoor sows using electronic sow feeders (ESF)
• Alternative methods of delivering fresh clean water to outdoor sows
• Computerised ad-lib feeding of indoor lactating sows
• Strip grazing farrowing paddocks
• The benefits to performance, health and costs of production through effective feed delivery.
Find out more here: http://www.bpex.org.uk/2ts/innovationfund/default.aspx
Evaluation of the Short-Bolt Captive Bolt Stunner on outdoor piglets
Easey Herds Ltd
Aims and objectives• To establish a practical, mechanical and repeatable method of humanely dispatching casualty pigs to prevent further avoidable distress to all concerned
• To evaluate the short-bolt captive bolt stunner system for ease of operation, safety, and effective humane euthanasia of piglets from 0-5kg and potentially 5-15kg.
Project achievements during 2013-2014
• The device has proved successful on piglets up to 5kg
• Stock people have reported that the device is easy to use
• The producer has designed a “V” shaped restrainer to hold the piglets in place
• An application to Defra has been submitted by BPEX and Easey Herds Ltd. for permission to use the device on piglets up to 15kg; Red Tractor Assurance has expressed a positive response to this application.
Application to industry
• A Standard Operating Procedure will be produced at the end of the project with the help of the pig veterinary team and Humane Slaughter Association
• A practical, mechanical and repeatable method of humanely dispatching casualty pigs from 5-15kg to prevent further avoidable distress to all concerned will hopefully be established.

INNOVATION FUND
Knowledge Transfer 53
The BPEX Yearbook 2013-2014
Feeding outdoor sows using electronic sow feeders (ESF)
Anna’s Happy Trotters
Aims and objectives• To demonstrate that the technology of electronic sow feeders (ESFs), long proven in feeding indoorsows, can be successfully adapted and deployed onto outdoor systems.
Project achievements during 2013-2014
• The mature herd was trained over a period of six weeks
• There were some initial problems with the wireless transmission but these were rectified
• Mechanically, the feeders functioned perfectly throughout the winter and ground quality was sustained due to reduced tractor use for feeding sows
• The unit manager likes the system and would have ESFs as standard if starting with a gilt herd
• Exceptional heat during summer caused the cone to warp as the whole weight of feed rests on this point. To overcome this problem, feed hoppers are now supplied with a supporting frame around the cone which takes the weight of the hopper and feed.
Cost-effectiveness is yet to be fully evaluated:
• Initial average feed usage data shows an improvement of between 200g-300g feed saved per day during gestation; at current feed prices, of £192/tonne, this represents a saving of between £10-£10.50/sow
• There are potential savings on feed due to pellet size; the ESF uses a pellet whereas in very poorconditions the trays need to use nuts and spin feeding requires nuts all year round. This saves £5-£7/tonne, which equates to £5-£6/sow
• Time is also saved due to not needing to manually feed sows on a daily basis (eg weekend overtime), although sows do still need to be checked everyday
• The replacement rate should be reduced with introducing the ESFs, as prior to this too many sows were being culled prematurely due to size and not performance
• Production Manager Malcolm Knowles says: “I see individual feeding of sows offers one of the best ways of improving performance on a well-managed herd.”
Application to industry
• More efficient feed usage and feed delivery to the sows
• Reduced replacement rate as sow growth and body condition is controlled
• Reduced feed manufacturing/ration costs
• Reduced soil compaction
• Reduced vermin activity and potential disease spread.

INNOVATION FUND
Knowledge Transfer54
The BPEX Yearbook 2013-2014
To find alternative methods of delivering fresh clean water to outdoor sows
BQP
Aims and objectives• To find another method of offering water to outdoor sows (via a tank) with the additional benefit of it being clean and fresh, rather than a wallow trough, which can become contaminated.
Project achievements during 2013-2014• The project has been extended due to sows being moved to a new field as part of the rotation
• As troughs were thoroughly cleaned during the move, the results will be initially unrepresentative of a ‘typical’ trough which has been in situ for some time, hence the extension to the project
• Production data from both the system on trial and typical wallow troughs is being recorded, including weaner weights
• Early results suggest an improvement in pig performance from the system on trial but final results are being awaited before any firm conclusions can be made.
Application to industryHopefully, this project will demonstrate how an alternative method of delivering water to outdoor sows canimprove conception rates, born alive numbers and weaning weights in outdoor sows.

INNOVATION FUND
Knowledge Transfer 55
The BPEX Yearbook 2013-2014
Computerised ad-lib feeding of indoor lactating sows
Ermine Farms Ltd
Aims and objectives• To demonstrate whether controlled ad lib feeding (toward ad-lib feeding week 1 post farrowing) of
lactating sows in a conventional farrowing system can increase feed intakes, piglet weaning weights and subsequent sow performance
• To compare sow feed intakes achieved in the conventional farrowing system to feed intakes in 8 Pig Safefreedom farrowing pen, both fed via the controlled ad lib feeding system and effect on piglet weaning weights and subsequent sow performance.
Unique points of the Gestal Feed system• The sow is fed to a pre-set lactation curve at a number of ‘feeding periods’ during the day (which can be adjusted)
• Feed is dispensed accurately on demand from the sow who chooses whether to activate the feed dispenser• In addition, the sow can choose to access up to 20% more feed that is allocated on the curve.
Project achievements during 2013-2014• The original trough design in the conventional farrowing pens with crates was not compatible with the
feed tube from the controlled ad lib system; in addition, piglets jumped into the trough and played with the magnet causing too much feed to be delivered. All troughs were, therefore, replaced and the position of the magnets changed to rectify the above problems
• The average sow feed intake through the Gestal was lower than the average calculated through current hand-feeding system and this was attributed both to eliminating wastage through spillage out of the troughs in a fully slatted system and through positive action from the sows to dispense the food, avoiding the dispensing of feed that they do not require
• It was found that sows are not consistent in their daily intake, this system overcomes the issue and the feeding curve reflects sows’ actual appetite
• The system demonstrated the ability of the sows to eat more in the first 10 days of lactation than had previously been provided under a modified Stotfold feed chart. It also showed differences in the potential intake depending on sow parity although these weren’t deemed sufficient to warrant different curves for each parity.
The project has demonstrated the following benefits of using a computerised ad-lib feeder:• Reduced time to feed compared to conventional flask feed delivery systems as the computerised curve is
automatically changed as lactation progresses• Reduced feed wastage
• Reduces the amount of feed present at any one time and so reduces losses down the slats from the trough and feed is only fed to the level that sows request
• Sows that are unwell are easily recognised on the system and can be treated as a priority • Ability to understand and modify the sow feeding curve at a herd, parity and individual level.
The project does not currently have enough data to verify whether any of the following benefits are achieved:• Reduction in wean to serve interval • Piglet mortality • The impact on subsequent sow performance and litter characteristics• Weaning weight.
Application to industry • To highlight the benefits of correct farrowing house feeding• To understand the total quantities that a lactating sow is capable of consuming and to maximise the intake• To show the day to day variation in daily intakes and differences between sows • To demonstrate whether there are benefits to the litter weaning weight and subsequent sow performance
if a sow is fed to her appetite.
INNOVATION FUND
Knowledge Transfer56
The BPEX Yearbook 2013-2014
Strip grazing farrowing paddocks
A Hayward & Son
Aims and objectives• To demonstrate that strip grazing farrowing paddocks through moving individual farrowing pens onto fresh ground for each litter will contribute to improved litter performance
• To assess how quickly land can be reused and, therefore, what the opportunities are to reduce overall land usage.
Project achievements during 2013-2014• The project has been delayed due to the unfavourable weather conditions, however, the equipment has been made and is due to be installed during spring 2014.
Application to industry • Improved performance from retention of production boost from clean land
• Easier day-to-day management
• Improved land management, better uptake of nutrients through rested/regenerated grassland
• By rotating pens on the same land, whole site movement may extend to one in six years rather than every two to three years.
The benefits to performance, health and costs of production through effective feed delivery
Compton Pigs
Aims and objectives• To trial easy access ‘feed windows’ within the back of modified dry sow arcs
• To determine whether performance, health and COP can be improved through effective feed delivery.
Project achievements during 2013-2014
• The project commenced in March 2014, updates will be made available on the BPEX website during the course of the year.
Application to industry By supplying modified dry sow arcs with easy access feed windows, it is hoped that the following positiveoutcomes will be seen:
• Reduced aggression, as sows are not having to seek out the feed in mud
• A significant reduction in feed wastage, as it should save around 20kg per pen per day (140kg per pen per week)
• A large reduction in bird activity, as the birds won't be able to get to the food
• A potential pig health benefit, as the beds will be cleaner
• A reduction in straw usage
• With sows/gilts consuming the right levels of feed, there is potential for improved born alive and litter size.
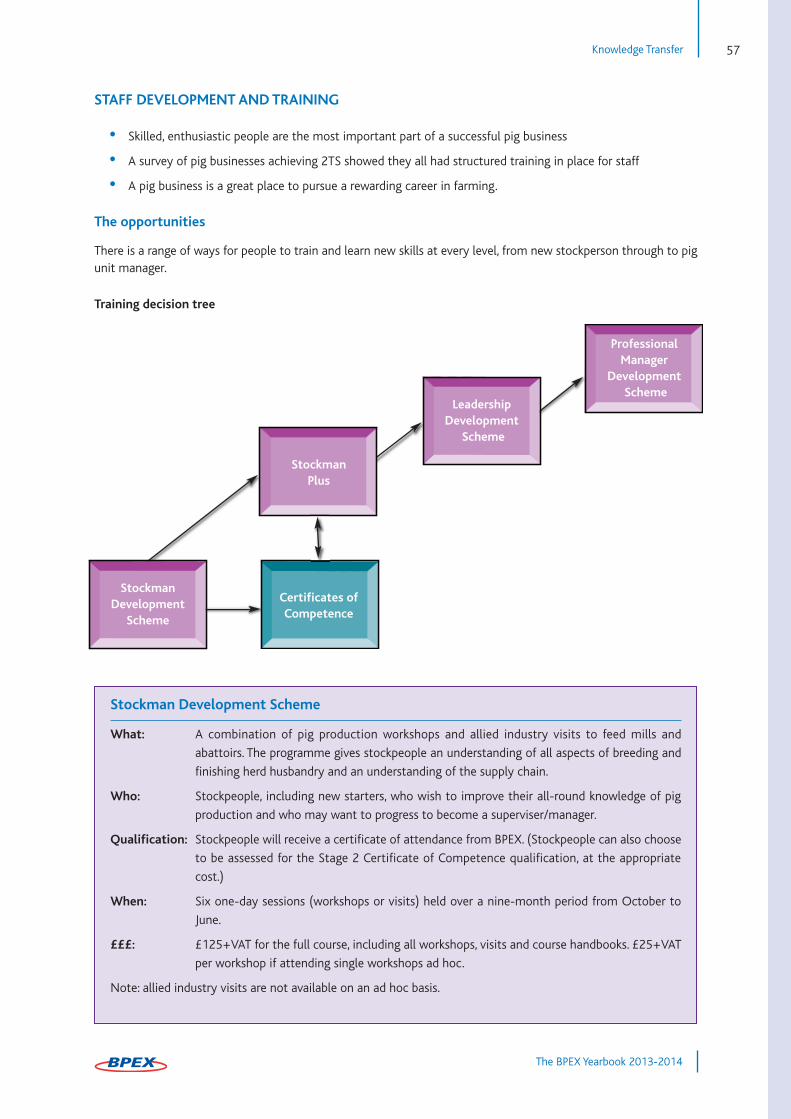
STAFF DEVELOPMENT AND TRAINING
• Skilled, enthusiastic people are the most important part of a successful pig business
• A survey of pig businesses achieving 2TS showed they all had structured training in place for staff
• A pig business is a great place to pursue a rewarding career in farming.
The opportunities
There is a range of ways for people to train and learn new skills at every level, from new stockperson through to pigunit manager.
Training decision tree
Knowledge Transfer 57
The BPEX Yearbook 2013-2014
StockmanDevelopment
Scheme
Certificates ofCompetence
StockmanPlus
Leadership Development
Scheme
Professional Manager
Development Scheme
Stockman Development Scheme
What: A combination of pig production workshops and allied industry visits to feed mills and
abattoirs. The programme gives stockpeople an understanding of all aspects of breeding and
finishing herd husbandry and an understanding of the supply chain.
Who: Stockpeople, including new starters, who wish to improve their all-round knowledge of pig
production and who may want to progress to become a superviser/manager.
Qualification: Stockpeople will receive a certificate of attendance from BPEX. (Stockpeople can also choose
to be assessed for the Stage 2 Certificate of Competence qualification, at the appropriate
cost.)
When: Six one-day sessions (workshops or visits) held over a nine-month period from October to
June.
£££: £125+VAT for the full course, including all workshops, visits and course handbooks. £25+VAT
per workshop if attending single workshops ad hoc.
Note: allied industry visits are not available on an ad hoc basis.

Knowledge Transfer58
The BPEX Yearbook 2013-2014
STAFF DEVELOPMENT AND TRAINING
Stockman Plus
What: A programme of problem-solving workshops, led by pig technical experts, designed to build
on existing pig husbandry skills. The problem-solving exercises are applied to ‘virtual’ farm
scenarios so stockpeople also review the outcome of decisions they make.
Who: Stockpeople who have significant previous experience or have completed the Stockman
Development Programme or hold the Stage 2 Certificate of Competence. They may want to
progress to become a supervisor/manager.
Qualification: Stockpeople will receive a certificate of attendance from BPEX. (Stockpeople can also choose
to be assessed for the Stage 2 or Stage 3 Certificate of Competence qualification, at the
appropriate cost.)
When: Six one-day workshops held over a nine-month period from October to June
£££: £125+VAT for the full course, including all workshops and course handbooks. £25+VAT per
workshop if attending single workshops ad hoc.
Leadership Development Scheme
What: A programme of workshops to develop planning, communication and people management
skills, in the context of pig production businesses. Participants also complete work-based
projects in the periods between workshops. The programme is led by management training
specialists from Cedar Associates.
Who: Unit supervisors or assistant managers or stockpeople who will take on the role of managing
people in the near future.
Qualification: The Certificate in First Line Management (Level 3) from the Institute of Leadership and
Management (ILM) is awarded on successful completion of the course.
When: Six one-day workshops held over a nine-month period from October to June.
£££: £500 including all workshops and assignment assessments.
One-day Leadership Courses
What: One-day leadership training courses, led by management training specialists from Cedar
Associates. Each training day focuses on a specific leadership topic, for example: supervision,
time management or decision-making.
Each day can be booked individually and participants can attend as many or as few as they
choose, depending on their training needs.
Who: Unit supervisors or assistant managers or stockpeople who will take on the role of managing
people in the near future.
When: During autumn and spring – go to www.bpex.org.uk/news/events
£££: £25 +VAT per one-day course.

Knowledge Transfer 59
The BPEX Yearbook 2013-2014
STAFF DEVELOPMENT AND TRAINING
Professional Manager Development Scheme
What: A combination of management training sessions, work-based projects and networkingopportunities with the allied industry. Training sessions include management of people, projectsand change and the scheme supports managers in implementing positive change in theirbusinesses. Participants also complete work-based projects in the periods between workshops.The programme is led by management training specialists from Cedar Associates.
Who: Managers, from all agricultural sectors, who want to develop their skills and are in a positionto make changes to improve the business.
Qualification: The Certificate in First Line Management (Level 5) from the Institute of Leadership andManagement (ILM) is awarded on successful completion of the course.
When: Ten one-day training sessions held over an 18-month period from January to April thefollowing year. Each training session includes a networking evening the night before, with apresentation from an agricultural business leader.
£££: Contact Samantha Bowsher for details: 07976 980753.
Certificates of Competence
What: What: Practical, relevant qualifications, with candidates assessed on farm. There are three levelsof qualification:
Stage 1 – Basic Stockmanship and Welfare
Stage 2 – Pig Husbandry Skills
Stage 3 – Pig Unit Supervision and Operation
There are course handbooks to support learning and candidates can decide with their managerswhen they are ready to be assessed. Attending a BPEX training course such as the StockmanDevelopment Programme or Leadership Programme is also a good way to help prepare for assessment.
Who: Stage 1 – Stockpeople who have worked with pigs for at least six months
Stage 2 – Skilled stockpeople who work unsupervised
Stage 3 – Advanced stockpeople and supervisors who exercise responsibility
When: Preparation and assessment can be arranged at any time to suit the candidate. One effectiveway to prepare is to complete the Stockman Development Scheme.
£££:Stage 1 Stage 2 Stage 3
BPEX levy payers £24 £48 £43
Non levy payers £48 £96 £86

Knowledge Transfer60
The BPEX Yearbook 2013-2014
STAFF DEVELOPMENT AND TRAINING
Local Workshops
BPEX organises topical training workshops and meetings across the country during autumn and spring.
• They cover a wide range of topics • Depending on the event, they last for a whole day, an afternoon or an evening • They provide an opportunity to meet with other producers.
The local workshop programme offers options for every level, from stockpeople to unit owners.
Go to www.bpex.org.uk/news/events
Human Resources (HR) Tool Kit
What: A resource available from the BPEX website to support businesses. It currently includes atemplate induction manual, skills matrix and appraisal form. These templates are available todownload and can be edited to make them specific to a business.
Induction Manual: This template helps to thoroughly induct new starters into the business, by outlining important contacts, emergency procedures, HR policy and a farm map.
Skills Matrix: The skills matrix is a chart which can be displayed in the farm office or cloakroom. Each matrix lists tasks for each department, with columns where the level of skillsand experience for each staff member are recorded.
Appraisal Form: This template is available for managers wanting to introduce work-basedappraisals but who are unsure on how to do it. The template includes standard performanceappraisal questions and can be tailored to suit the business or individual.
The HR Toolkit is available online at: www.bpex.org.uk/2TS/training
Who: Managers and owners
£££: Free of charge
Pig Industry Scholarship
Established in 2013, the pig industry scholarship offers a new route into the dynamic forward-looking pigsector, helping to recruit highly qualified and committed young entrants to the pig industry. The scholarshipprogramme is open to second year BSc Agriculture and first year FdSc students who are interested in a careerin the pig industry.
The first year of the scholarship programme saw six companies signed up to offer scholarships to students atHarper Adams University. After great interest shown by students at the university’s scholarship fair in October,35 students applied for scholarships across all six companies. After interviewing, four of the six companiessecured scholars for the 2014/15 placement year. Following this success, the programme will continue to run,with interest already being shown by companies and students wanting to be involved in the programme’ssecond year.

Knowledge Transfer 61
The BPEX Yearbook 2013-2014
BUSINESS INSIGHT TRIPS
During the year, BPEX was involved with a number of international trips, linked up with allied industry organisations.The trips gave producers an insight into how producers in other countries are running their businesses and providedan opportunity to look outside of the UK for ideas and inspiration to improve production and building design. Furthertrips are planned for 2014-15, including visits to Ireland and France; if you are interested in participating in a tripyourself, or have suggestions of places which we should organise a trip to, get in touch with one of the team.
Brittany, France
Who: Eight producers and BOCM Pauls Ltd.
Activity: The trip comprised a visit to iTEK, three pig farms and a wet feeding system. iTEK producespig equipment but its main strengths are in ventilation systems and buildings for pigs wean-finish. Brittany makes up 4% of the total area of France and has 50% of the pigs (approx.500,000 sows).
Key topics: Long-term investment in quality accommodation, ventilation systems, building design andlayout, and quality of buildings; colostrum management and sow nutrition; all-in, all-outproduction in the grower/finisher buildings.
The Netherlands
Who: Twelve producers and Zoetis.
Activity: The trip comprised a visit to the Sterksel Research Centre, a presentation on nutrition and visit to a Dutch pig farm.
Key topics: Biosecurity and hygiene; sow diets; service and general accommodation.
USA
Who: Seven producers and Elanco Animal Health.
Activity: The trip was focused on the World Pork Expo, Iowa, the world's largest pork-specific trade show, and a visit to a 5,500-sow breeding unit with ESF, producing 22-day-old weaners.
Key topics: Standard Operating Procedures and staff training; biosecurity and disinfection; service andculling policies; innovation.
Producers on the USA trip Producers on the Brittany trip

Knowledge Transfer62
The BPEX Yearbook 2013-2014
REGIONAL PRODUCER EVENTS
PIG HEALTH IMPROVEMENT PROJECTS
Breed +3 regional events
In autumn 2013, BPEX held a series of half-day conferences in four locations around the country focused onthe breeding herd and the Breed +3 campaign. The topics covered by international experts, breeding companiesand producers were:
• Unlocking the untapped potential of your sows and gilts
• New feeding systems for sows – based around BPEX Innovation Fund projects
• Wean more
• What are the numbers telling you?
• My breeding unit.
Presentations and videos can be downloaded from: http://www.bpex.org.uk/2TS/events
BPEX’s national Pig Health Improvement Project (PHIP) ran throughout2013 with the goal of improving the overall health status of England’spig herd. PHIP has run since 2011 and has focused on collaborationbetween producers, vets and the allied industry and the collective use of:
• BPHS abattoir reports
• Access to local health mapping
• Bespoke biosecurity action plans
• Disease testing
• BPEX regional support.
In addition to these base services, in 2013 PHIP concentrated on three key areas as a means to improve healthon farms across the country.
1. Rodent control through training of stockmen and monitoring levels of activity on farms
Control of rodents has an impact on the management of health and profitability on the farm, due to their rolein disease transmission, their destructive impact on buildings and consumption of pig feed. The pig farmenvironment is a complex setting in which to achieve effective rodent control and, as such, bespoke LANTRAaccredited training has been designed by FarmTrain with BPEX. To date, over 100 producers have been trained.In conjunction with this, the AHVLA wildlife unit has been visiting farms to measure rodent activity to informwhether levels are what farmers perceive them to be, where key activity areas are and to assess whether controlstrategies have any impact.
The training has been constructed following in-depth farm reviews, which have helped inform the practicalitiesof day-to-day control. There will be considerable pressure in the future from the Health and Safety Executive(HSE) to use rodenticides responsibly in order to reduce the risks of resistance and contamination of wildlife(see www.thinkwildlife.org). This means that new, responsible and alternative holistic methods of control areneeded, which don’t always include baiting. FarmTrain will continue supporting producers and vets in 2014 tomeet these standards.

PIG HEALTH IMPROVEMENT
Knowledge Transfer 63
The BPEX Yearbook 2013-2014
2. Improvement of cleaning and disinfection routines to lower health challenge throughoutthe supply chain
During the year, the PHIP field team conducted a large number of farm visits to collect samples from arange of production systems. The purpose was to look for salmonella and other enterobacteriaceae and identify common areas where cleaning and disinfection was failing to be effective.
Results from the farm visits showed that cracked concrete is an area where bacteria can thrive. Findingsalso demonstrated that the underside of farrowing crate bars and feeders and drinkers are often overlookedand that the cleaning of arcs and fenders where straw is used was rarely occurring but appeared to be ahaven for salmonella.
By swabbing after the farm’s usual routine, making recommendations and swabbing again, easy-to-implement changes that made a difference were identified. The majority of farms BPEX worked with onthis project now regularly use detergents, use the BPEX Cleaning and Disinfection DVD to train staff andpay greater attention to problem areas.
This process also took place in several abattoirs, focusing on key contamination areas such as knife storageareas and scabbards. While abattoirs are extremely clean, the swabbing helped to identify where systematicworking needed to be improved, such as following cleaning processes in the correct order.
Cleaning and disinfection is also vital during the transport stage of the supply chain. BPEX conductedresearch in 2013 to establish what exactly makes a ‘clean’ lorry and what resources are needed to achievethis. The work was undertaken by Leaning Forward, and consisted of reviewing the cleaning process requiredfor the threemajor haulage vehicle types used in the UK. By auditing the cleanliness of the vehicles, it waspossible to ascertain precisely what water, disinfectant use and time is required to achieve an acceptablelevel of clean. The research will now help industry to address lorry wash standards, with a scientific basisfor change.
3. A focus on swine dysentery diagnostics and regional support groups to combat the disease
Swine dysentery became a particular issue to UK producers again in 2011. Since then, the PHIP team hasbeen working with a group of producers in Yorkshire, where several outbreaks have occurred, to try andcontrol and work towards eradication of the disease. In 2013, a new focus on diagnostics was established,working with the AHVLA in evaluating the new technique, Multi-Locus Sequence Typing (MLST). Thetechnique enables positive samples of swine dysentery to be strain typed, so that when outbreaks appearon several farms, it can be ascertained whether there are any epidemiological links between them. Theresulting database now consists of over 300 samples and shows at least six distinct strains of dysentery.
Producers in affected areas have used this information to focus on what biosecurity measures are the mostimportant; having originally assumed that local spread was key, the diagnostics have shown several strainswithin a small geographical area, this is suggestive of other routes of spread. The next steps will be to collectclinical data about each of the cases to build up a picture of how each strain behaves, what medicationsare effective against it and whether others have been successful in eradication. This will be accessible byvets and producers.
For further information
www.pighealth.org.uk
Email: [email protected]
Tel: 02476 478 877
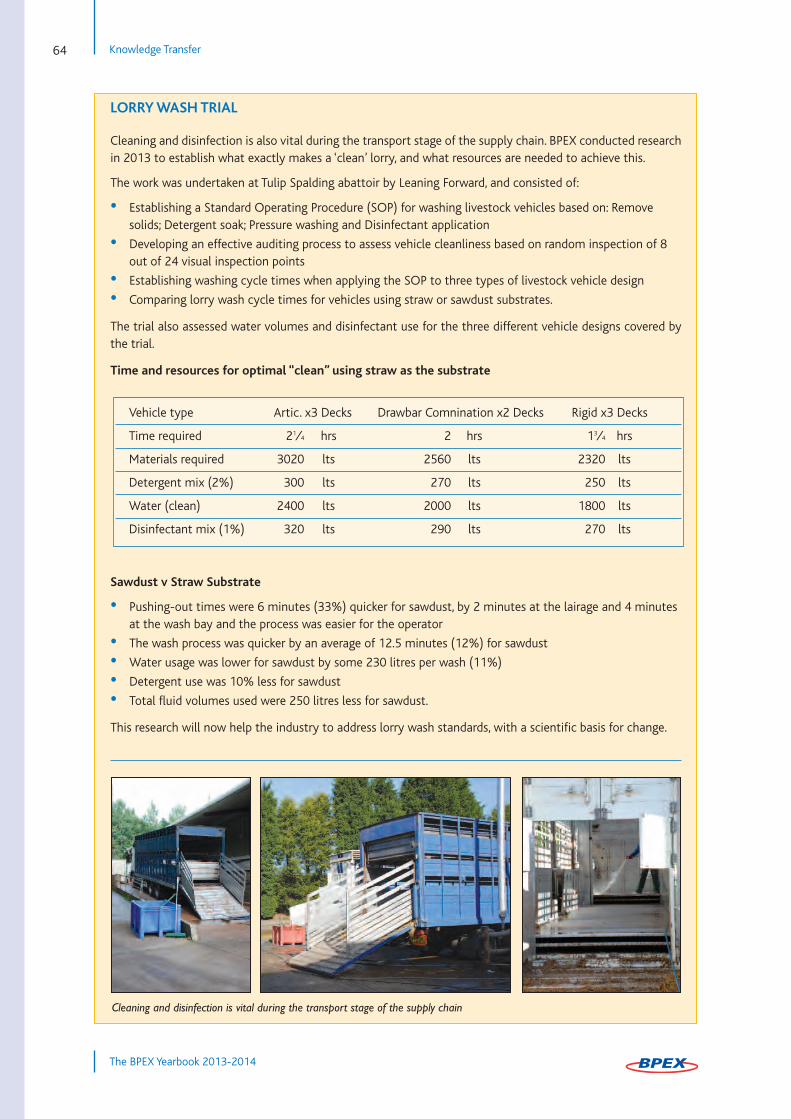
Knowledge Transfer64
The BPEX Yearbook 2013-2014
LORRY WASH TRIAL
Cleaning and disinfection is also vital during the transport stage of the supply chain. BPEX conducted researchin 2013 to establish what exactly makes a ‘clean’ lorry, and what resources are needed to achieve this.
The work was undertaken at Tulip Spalding abattoir by Leaning Forward, and consisted of:
• Establishing a Standard Operating Procedure (SOP) for washing livestock vehicles based on: Remove solids; Detergent soak; Pressure washing and Disinfectant application
• Developing an effective auditing process to assess vehicle cleanliness based on random inspection of 8 out of 24 visual inspection points
• Establishing washing cycle times when applying the SOP to three types of livestock vehicle design
• Comparing lorry wash cycle times for vehicles using straw or sawdust substrates.
The trial also assessed water volumes and disinfectant use for the three different vehicle designs covered bythe trial.
Time and resources for optimal “clean” using straw as the substrate
Sawdust v Straw Substrate
• Pushing-out times were 6 minutes (33%) quicker for sawdust, by 2 minutes at the lairage and 4 minutes at the wash bay and the process was easier for the operator
• The wash process was quicker by an average of 12.5 minutes (12%) for sawdust
• Water usage was lower for sawdust by some 230 litres per wash (11%)
• Detergent use was 10% less for sawdust
• Total fluid volumes used were 250 litres less for sawdust.
This research will now help the industry to address lorry wash standards, with a scientific basis for change.
Vehicle type Artic. x3 Decks Drawbar Comnination x2 Decks Rigid x3 Decks
Time required 21⁄4 hrs 2 hrs 13⁄4 hrs
Materials required 3020 lts 2560 lts 2320 lts
Detergent mix (2%) 300 lts 270 lts 250 lts
Water (clean) 2400 lts 2000 lts 1800 lts
Disinfectant mix (1%) 320 lts 290 lts 270 lts
Cleaning and disinfection is vital during the transport stage of the supply chain
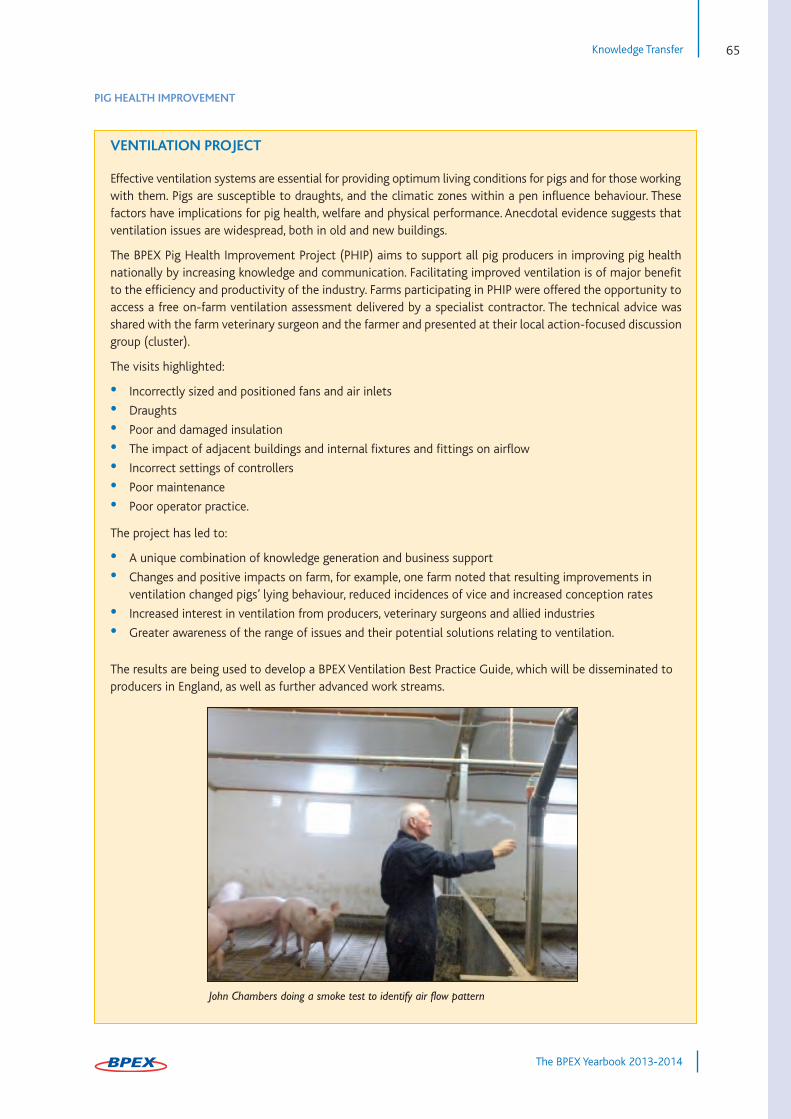
Knowledge Transfer 65
The BPEX Yearbook 2013-2014
PIG HEALTH IMPROVEMENT
VENTILATION PROJECT
Effective ventilation systems are essential for providing optimum living conditions for pigs and for those workingwith them. Pigs are susceptible to draughts, and the climatic zones within a pen influence behaviour. Thesefactors have implications for pig health, welfare and physical performance. Anecdotal evidence suggests thatventilation issues are widespread, both in old and new buildings.
The BPEX Pig Health Improvement Project (PHIP) aims to support all pig producers in improving pig healthnationally by increasing knowledge and communication. Facilitating improved ventilation is of major benefitto the efficiency and productivity of the industry. Farms participating in PHIP were offered the opportunity toaccess a free on-farm ventilation assessment delivered by a specialist contractor. The technical advice wasshared with the farm veterinary surgeon and the farmer and presented at their local action-focused discussiongroup (cluster).
The visits highlighted:
• Incorrectly sized and positioned fans and air inlets
• Draughts
• Poor and damaged insulation
• The impact of adjacent buildings and internal fixtures and fittings on airflow
• Incorrect settings of controllers
• Poor maintenance
• Poor operator practice.
The project has led to:
• A unique combination of knowledge generation and business support
• Changes and positive impacts on farm, for example, one farm noted that resulting improvements in ventilation changed pigs’ lying behaviour, reduced incidences of vice and increased conception rates
• Increased interest in ventilation from producers, veterinary surgeons and allied industries
• Greater awareness of the range of issues and their potential solutions relating to ventilation.
The results are being used to develop a BPEX Ventilation Best Practice Guide, which will be disseminated toproducers in England, as well as further advanced work streams.
John Chambers doing a smoke test to identify air flow pattern
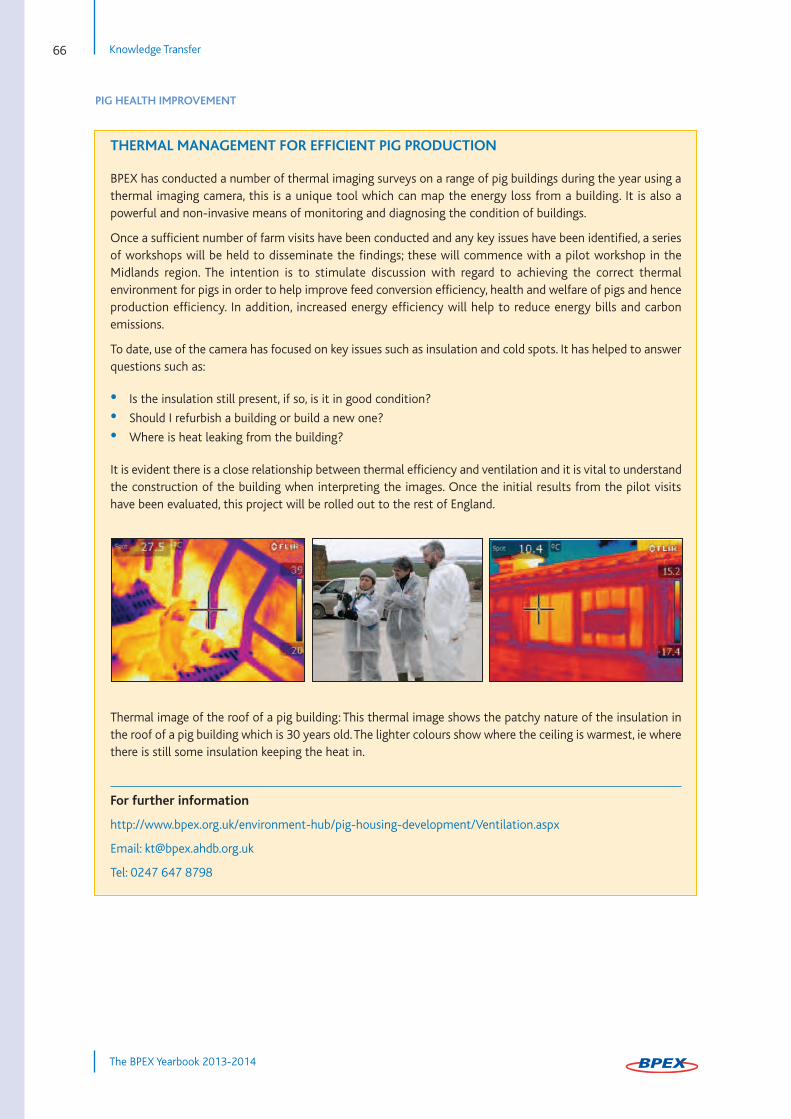
Knowledge Transfer66
The BPEX Yearbook 2013-2014
PIG HEALTH IMPROVEMENT
THERMAL MANAGEMENT FOR EFFICIENT PIG PRODUCTION
BPEX has conducted a number of thermal imaging surveys on a range of pig buildings during the year using athermal imaging camera, this is a unique tool which can map the energy loss from a building. It is also apowerful and non-invasive means of monitoring and diagnosing the condition of buildings.
Once a sufficient number of farm visits have been conducted and any key issues have been identified, a seriesof workshops will be held to disseminate the findings; these will commence with a pilot workshop in theMidlands region. The intention is to stimulate discussion with regard to achieving the correct thermalenvironment for pigs in order to help improve feed conversion efficiency, health and welfare of pigs and henceproduction efficiency. In addition, increased energy efficiency will help to reduce energy bills and carbonemissions.
To date, use of the camera has focused on key issues such as insulation and cold spots. It has helped to answerquestions such as:
• Is the insulation still present, if so, is it in good condition?
• Should I refurbish a building or build a new one?
• Where is heat leaking from the building?
It is evident there is a close relationship between thermal efficiency and ventilation and it is vital to understandthe construction of the building when interpreting the images. Once the initial results from the pilot visitshave been evaluated, this project will be rolled out to the rest of England.
Thermal image of the roof of a pig building: This thermal image shows the patchy nature of the insulation inthe roof of a pig building which is 30 years old. The lighter colours show where the ceiling is warmest, ie wherethere is still some insulation keeping the heat in.
For further information
http://www.bpex.org.uk/environment-hub/pig-housing-development/Ventilation.aspx
Email: [email protected]
Tel: 0247 647 8798
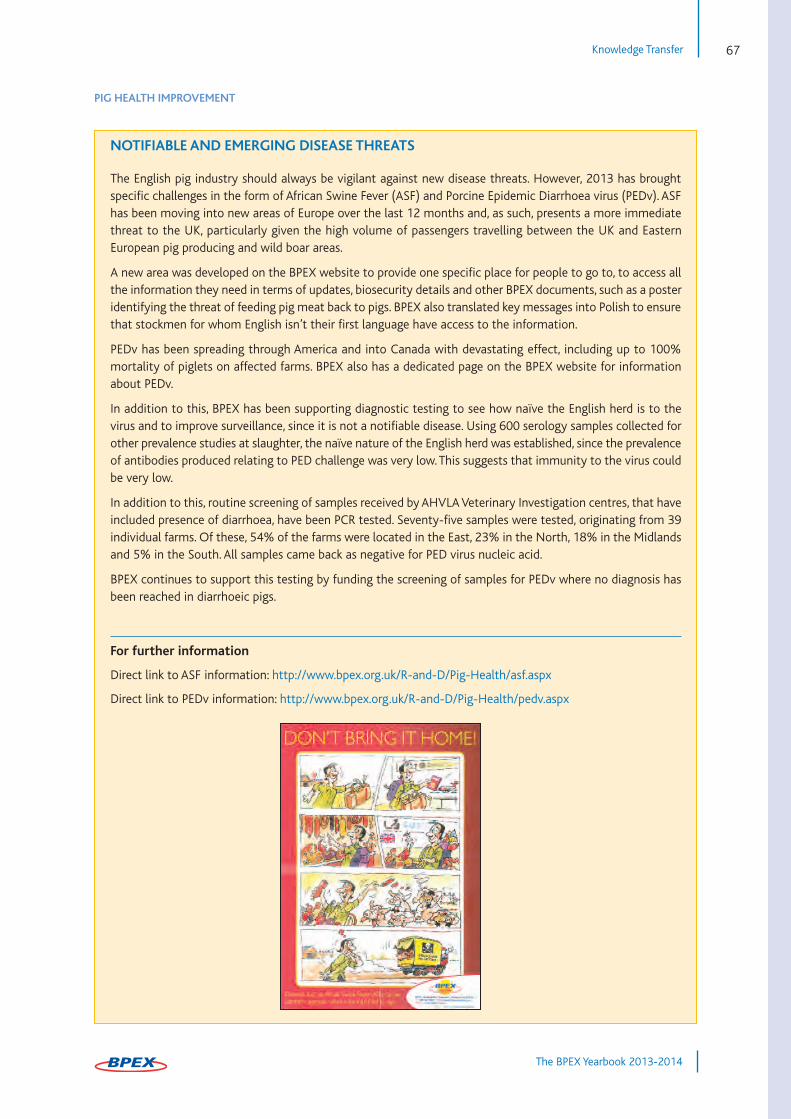
Knowledge Transfer 67
The BPEX Yearbook 2013-2014
PIG HEALTH IMPROVEMENT
NOTIFIABLE AND EMERGING DISEASE THREATS
The English pig industry should always be vigilant against new disease threats. However, 2013 has broughtspecific challenges in the form of African Swine Fever (ASF) and Porcine Epidemic Diarrhoea virus (PEDv). ASFhas been moving into new areas of Europe over the last 12 months and, as such, presents a more immediatethreat to the UK, particularly given the high volume of passengers travelling between the UK and EasternEuropean pig producing and wild boar areas.
A new area was developed on the BPEX website to provide one specific place for people to go to, to access allthe information they need in terms of updates, biosecurity details and other BPEX documents, such as a posteridentifying the threat of feeding pig meat back to pigs. BPEX also translated key messages into Polish to ensurethat stockmen for whom English isn’t their first language have access to the information.
PEDv has been spreading through America and into Canada with devastating effect, including up to 100%mortality of piglets on affected farms. BPEX also has a dedicated page on the BPEX website for informationabout PEDv.
In addition to this, BPEX has been supporting diagnostic testing to see how naïve the English herd is to thevirus and to improve surveillance, since it is not a notifiable disease. Using 600 serology samples collected forother prevalence studies at slaughter, the naïve nature of the English herd was established, since the prevalenceof antibodies produced relating to PED challenge was very low. This suggests that immunity to the virus couldbe very low.
In addition to this, routine screening of samples received by AHVLA Veterinary Investigation centres, that haveincluded presence of diarrhoea, have been PCR tested. Seventy-five samples were tested, originating from 39individual farms. Of these, 54% of the farms were located in the East, 23% in the North, 18% in the Midlandsand 5% in the South. All samples came back as negative for PED virus nucleic acid.
BPEX continues to support this testing by funding the screening of samples for PEDv where no diagnosis hasbeen reached in diarrhoeic pigs.
For further information
Direct link to ASF information: http://www.bpex.org.uk/R-and-D/Pig-Health/asf.aspx
Direct link to PEDv information: http://www.bpex.org.uk/R-and-D/Pig-Health/pedv.aspx

Knowledge Transfer68
The BPEX Yearbook 2013-2014
PIG HEALTH IMPROVEMENT
INTRODUCTION OF REAL WELFARE INTO THE RED TRACTOR PIG SCHEME
The past year saw the introduction of the requirement for Real Welfare assessments into the Red Tractor PigScheme standards. The Real Welfare programme is the name given to a set of standardised protocols that lookat pig-based indicators to measure pig welfare, rather than measurements of its environment. Its inclusioninto the Red Tractor Standards is a new way of benchmarking welfare in the scheme and applies to pigs onfinisher and grow-out units. The assessments are carried out by a veterinarian on a sample of up to 900 pigsper year, divided over two to four assessments. Having the vet do the assessment provides an immediateopportunity for expert and tailored feedback and a total of 150 vets have now been trained to carry out welfareoutcome assessments in a standardised manner. They assess the following five key measures across a sampleof pigs in mainstream pens:
• Pigs that would benefit from being in the hospital pen
• Lame pigs
• Pigs with severe tail lesions
• Pigs with severe body marks
• Type of environmental enrichment.
Welfare assessment results are entered on a national database, administered by BPEX, which turns the datainto individual unit scores for returning to vet and producer and also adds them to an overall, anonymousnational score. This means that each participating unit can now demonstrate their commitment to welfare viaan on-farm succinct, science-based assessment, as well as tracking changes over time. On an industry level, itprovides the evidence for the welfare commitment the industry has made.
Although the programme had been trialled on a number of commercial farms, the introduction of theprogramme was not without its challenges. IT issues impacted on the roll-out and although vets are now ableto enter and view data themselves, a bureau service continues to be in place until at least December 2014 totranscribe assessments onto the database.
A series of review meetings were held throughout the year to address feedback from key stakeholders and inresponse a number of changes have been made. These have made the assessments quicker and easier. Thereview process continues into 2014 and further changes are likely. Other priorities for the year ahead includefinishing the development of the smartphone data collection app and increasing opportunities for producersto engage with their results.
For further information
Contact Katja Stoddart: [email protected]
www.bpex.org.uk/R-and-D/Welfare/realWelfareredTractor.aspx
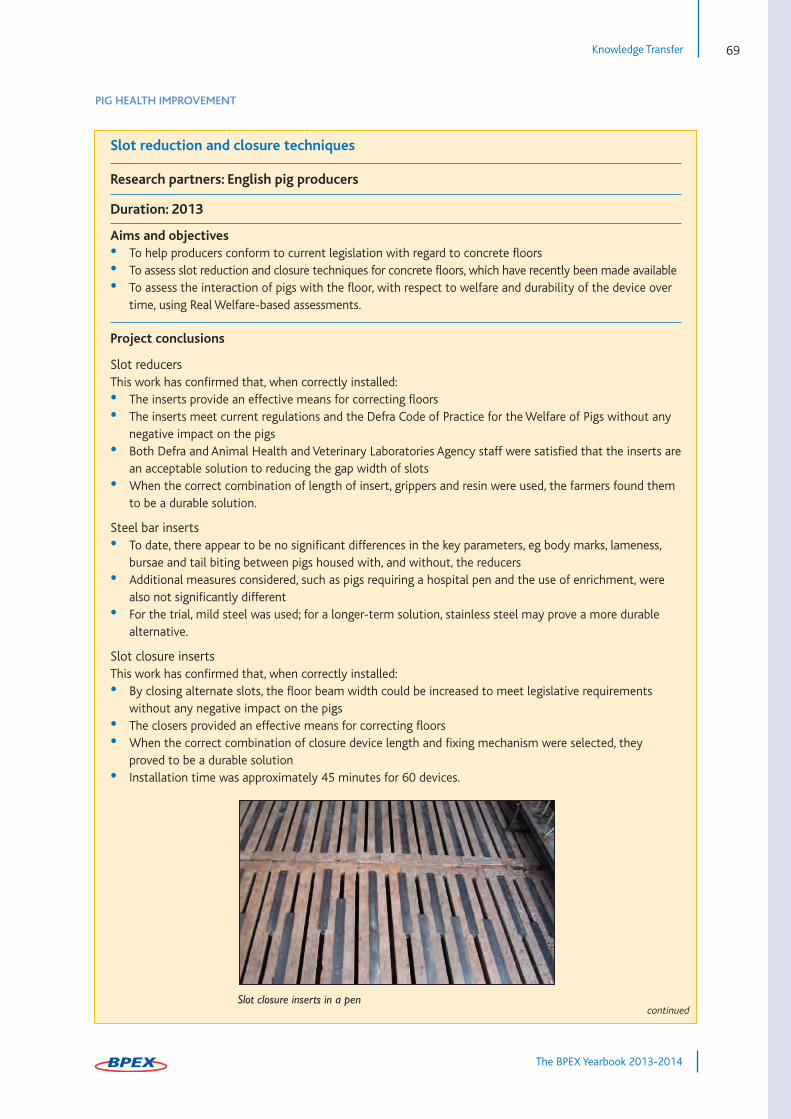
PIG HEALTH IMPROVEMENT
Knowledge Transfer 69
The BPEX Yearbook 2013-2014
Slot reduction and closure techniques
Research partners: English pig producers
Duration: 2013
Aims and objectives• To help producers conform to current legislation with regard to concrete floors• To assess slot reduction and closure techniques for concrete floors, which have recently been made available• To assess the interaction of pigs with the floor, with respect to welfare and durability of the device over time, using Real Welfare-based assessments.
Project conclusions
Slot reducersThis work has confirmed that, when correctly installed:• The inserts provide an effective means for correcting floors• The inserts meet current regulations and the Defra Code of Practice for the Welfare of Pigs without any negative impact on the pigs
• Both Defra and Animal Health and Veterinary Laboratories Agency staff were satisfied that the inserts arean acceptable solution to reducing the gap width of slots
• When the correct combination of length of insert, grippers and resin were used, the farmers found them to be a durable solution.
Steel bar inserts• To date, there appear to be no significant differences in the key parameters, eg body marks, lameness, bursae and tail biting between pigs housed with, and without, the reducers
• Additional measures considered, such as pigs requiring a hospital pen and the use of enrichment, were also not significantly different
• For the trial, mild steel was used; for a longer-term solution, stainless steel may prove a more durable alternative.
Slot closure insertsThis work has confirmed that, when correctly installed:• By closing alternate slots, the floor beam width could be increased to meet legislative requirements without any negative impact on the pigs
• The closers provided an effective means for correcting floors • When the correct combination of closure device length and fixing mechanism were selected, they proved to be a durable solution
• Installation time was approximately 45 minutes for 60 devices.
continuedSlot closure inserts in a pen

PIG HEALTH IMPROVEMENT
Knowledge Transfer70
The BPEX Yearbook 2013-2014
Slot reduction and closure techniques
Slot closure inserts (continued)The slot closure inserts were generally perceived to be a good start but the following limitations with the trial
batch were highlighted:
• The pigs’ ability to remove the closure devices if they are not correctly installed
• Strong, commercial multipurpose adhesive has been found to be more successful than rubberised flexible
sealants to keep them in place
• The closure devices used in the trial were not suitable for fitting to extremely wide gaps, eg greater than
25mm
• It is critical to ensure that pigs cannot get their snouts under the edges of the closure devices, for
example, if the short ends of the reducers are exposed
• Where the slat is badly corroded, creating a difference in level, this could result in the closure devices
becoming loose
• The profile of some slot sides meant that the fixing device initially used had limited success.
The manufacturer has now addressed these issues with an expanded range of products to match customers’needs. BPEX is continuing its monitoring over a longer term.
For further information
Research into Action 17: Slot reducers
Research into Action 18: Steel bar inserts
Research into Action 19: Slot closure inserts
http://www.bpex.org.uk/environment-hub/default.aspx
Slot reducers in a pen Steel bar inserts installed

PIG HEALTH IMPROVEMENT
Knowledge Transfer 71
The BPEX Yearbook 2013-2014
BPEX Pig Health Scheme (BPHS)
Sponsors 2013: Zoetis, Huvepharma, Boehringer, MSD, Elanco
Background• With eight years of consistent monitoring in English abattoirs, BPHS continues to offer a unique opportunity to explore the trends in the occurrence of different lesions seen at the abattoir
• Reports provide members with disease information specific to their batch of pigs• Trained veterinary assessors inspect 50 pigs from each consignment for lung, heart, liver and skin lesions,indicative of conditions such as pleurisy, enzootic pneumonia, tail biting, worms and dermatitis
• Producers and vets receive reports 48 hours after inspection, detailing how many pigs are affected. A report that benchmarks farm performance against national performance is also sent out quarterly
• Over 400 batches of pigs from farms nationwide are inspected every year.
Trends observed during 2013-2014• Analysis of BPHS data shows that during 2013 the prevalence of enzootic pneumonia-like (EP-like)lesions appears to have stabilised although there is a seasonal variation. At batch level, most of the batches (around 90%) had at least one positive animal and seven of every 10 batches had at least 15% of animals affected
• Since the first quarter of 2013, the prevalence of pleurisy has shown a decreasing trend • The proportion of pigs affected by tail damage has fluctuated over the last few years but, with a general decreasing tendency; this decline has been more pronounced since the beginning of 2013.
Application to industry • BPHS reports provide producers and their vets with current, indicative disease scoring data for their pigs; allowing benchmarking and measurement of any disease management changes
• BPHS reports provide a national surveillance tool, measuring trends in common endemic diseases, highlighting emerging subclinical conditions
• BPEX has worked closely with industry, BPHS assessors, and the FSA to make improvements to the quality of the post-mortem data meat inspectors’ record (Collection and Communication of Inspection Results (CCIR)); this work will continue throughout 2014 as part of the larger changes to meat inspection.
For further information
[email protected] • 0247 647 8877
Monthly prevalence and fitted trend for EP-like lesions
0.5
0.4
0.3
0.2
0.1
0.0
2006 2007 2008 2009 2010 2011 2012 2013
Monthly prevalence and fitted trend for pleurisy
Pro
port
ion
of
pigs
aff
ecte
d
Time (Year)
0.20
0.15
0.10
0.05
0.0
2006 2007 2008 2009 2010 2011 2012 2013
Pro
port
ion
of
pigs
aff
ecte
d
Time (Year)
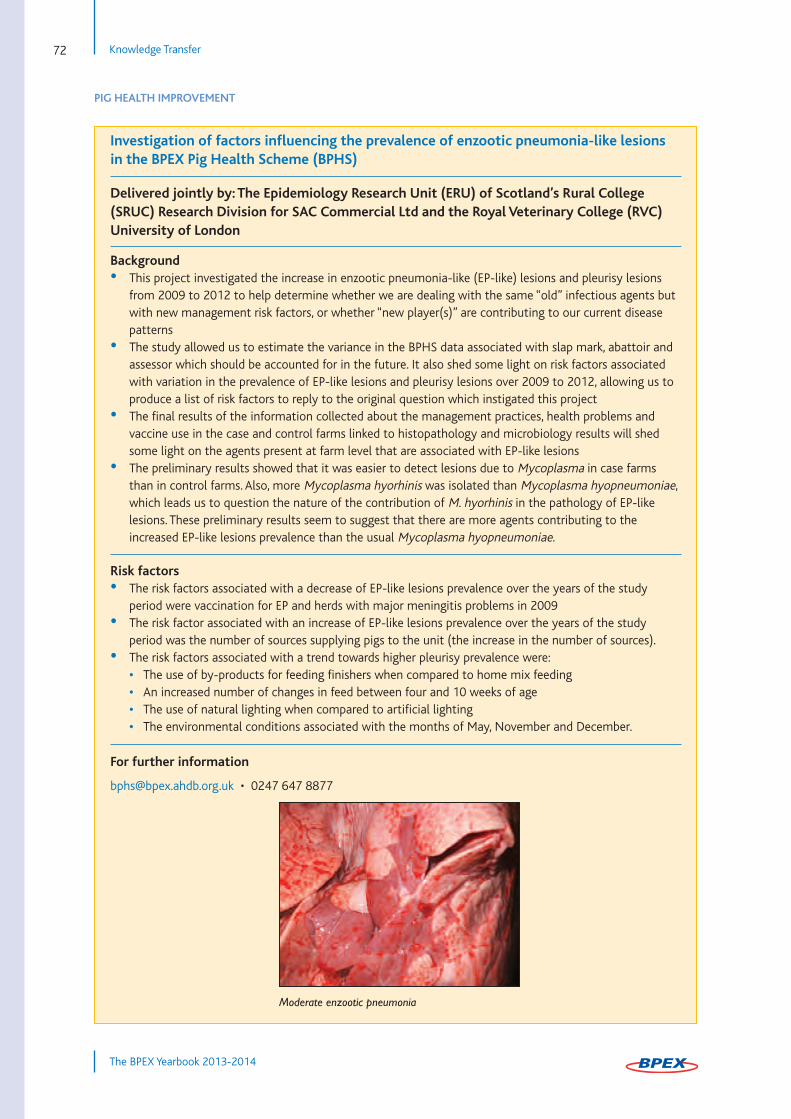
PIG HEALTH IMPROVEMENT
Knowledge Transfer72
The BPEX Yearbook 2013-2014
Investigation of factors influencing the prevalence of enzootic pneumonia-like lesionsin the BPEX Pig Health Scheme (BPHS)
Delivered jointly by: The Epidemiology Research Unit (ERU) of Scotland’s Rural College(SRUC) Research Division for SAC Commercial Ltd and the Royal Veterinary College (RVC) University of London
Background• This project investigated the increase in enzootic pneumonia-like (EP-like) lesions and pleurisy lesions from 2009 to 2012 to help determine whether we are dealing with the same “old” infectious agents but with new management risk factors, or whether “new player(s)” are contributing to our current disease patterns
• The study allowed us to estimate the variance in the BPHS data associated with slap mark, abattoir and assessor which should be accounted for in the future. It also shed some light on risk factors associated with variation in the prevalence of EP-like lesions and pleurisy lesions over 2009 to 2012, allowing us to produce a list of risk factors to reply to the original question which instigated this project
• The final results of the information collected about the management practices, health problems and vaccine use in the case and control farms linked to histopathology and microbiology results will shed some light on the agents present at farm level that are associated with EP-like lesions
• The preliminary results showed that it was easier to detect lesions due to Mycoplasma in case farms than in control farms. Also, more Mycoplasma hyorhinis was isolated than Mycoplasma hyopneumoniae, which leads us to question the nature of the contribution of M. hyorhinis in the pathology of EP-like lesions. These preliminary results seem to suggest that there are more agents contributing to the increased EP-like lesions prevalence than the usual Mycoplasma hyopneumoniae.
Risk factors• The risk factors associated with a decrease of EP-like lesions prevalence over the years of the study period were vaccination for EP and herds with major meningitis problems in 2009
• The risk factor associated with an increase of EP-like lesions prevalence over the years of the study period was the number of sources supplying pigs to the unit (the increase in the number of sources).
• The risk factors associated with a trend towards higher pleurisy prevalence were:• The use of by-products for feeding finishers when compared to home mix feeding • An increased number of changes in feed between four and 10 weeks of age • The use of natural lighting when compared to artificial lighting • The environmental conditions associated with the months of May, November and December.
For further information
[email protected] • 0247 647 8877
Moderate enzootic pneumonia
Knowledge Transfer 73
The BPEX Yearbook 2013-2014
MEDIA AND PUBLICATIONS
PRACTICAL PIG APP
During the year, BPEX launched a new ‘app’ aimed at producers and allied industry. The app features a wide range ofshort video clips that demonstrate practical management techniques on farm to help you glean the most fromBPEX’s Breed +3 initiative. Initially, the app focuses on the breeding herd, with a new library of finishing related clipsdue to be launched during 2014. View the videos online at www.practicalpig.org.uk or download the app fromplay.google.com or apple.com.
BPEX LIVE: WEBINARS
These interactive, online workshops enable participants to join in from their home or office computer without theneed to travel to a specific venue. The webinars offer the opportunity to listen to advice from industry experts, askquestions and join in the discussion or just listen and pick up some practical information. The webinars are held ona bimonthly basis, a full programme of topics for the coming months, along with presentations from previous webinars, can be found online.
Topics covered during 2013-14 include the following, presentations from which can still be viewed online:
• Swabbing for squeaky clean pens
• Where next with training
• Breed +3 – route map to the next level
• New sow feeding systems on trial.
BPEX Live programme: http://www.bpex.org.uk/news/events/webinars
BPEX has a number of Twitter profiles which highlight the latest news, activities and eventsfrom BPEX. Follow BPEX by searching for the following on Twitter:
@AHDB_BPEX
@2TSPigs_Cwest
@BPEXPigHealth
The purpose of the BPEX Stockman Facebook group is to help improve members’ knowledgeand share ideas with others around the country, linked directly to the BPEX Stockman Development and Stockman Plus courses. The group page highlights workshops, relevant videosand course content, as well as hosting photo stories and discussions. The group can be foundon Facebook by searching for ‘BPEX Stockman Development’.
BLOG
The BPEX Blog features regular reports, news and photos from the regional KT Managers,covering events and training updates, top tips and interesting case studies. The Blog isinteractive, allowing readers to leave comments and share interesting stories. Find the Bloghere: http://blog.bpex.org.uk/

Knowledge Transfer74
The BPEX Yearbook 2013-2014
MEDIA AND PUBLICATIONS
PHOTO STORIES
The photo story library features short reports of BPEX events in the form of photos and captions. Stories range fromfarm visits to stockman workshops, to bacon sampling and farm open days.
TEXT ALERTS
By registering to receive text alerts, producers and members of the industry can be kept up to date with the latestnews and events from BPEX. Text alerts are free to receive and are region specific, and they are becoming a popularway to receive reminders from BPEX.
PUBLICATIONS
A wide range of publications is available from BPEX, ranging from practical factsheets to training newsletters andindustry statistics. The full range can be accessed from the BPEX website or can be requested in hard copy.
View the range of publications available here: http://www.bpex.org.uk/publications
The new practical pig app features a wide range of short video clips
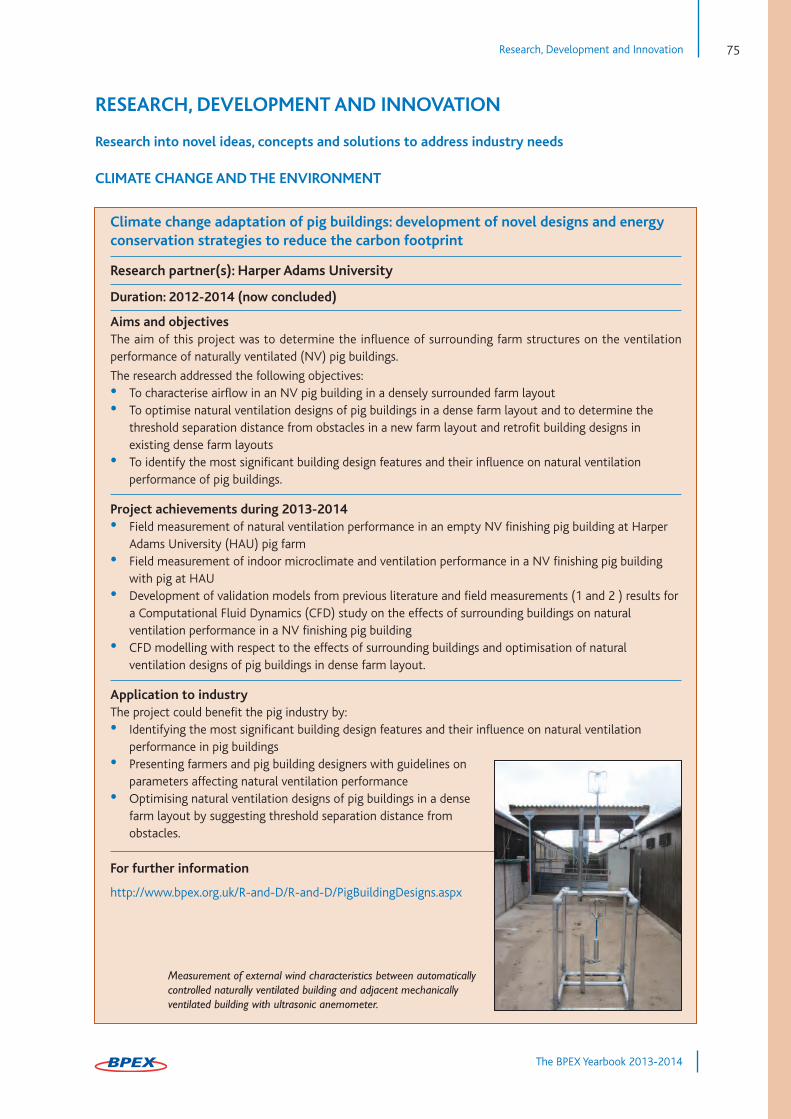
Research, Development and Innovation 75
The BPEX Yearbook 2013-2014
RESEARCH, DEVELOPMENT AND INNOVATION
Research into novel ideas, concepts and solutions to address industry needs
CLIMATE CHANGE AND THE ENVIRONMENT
Climate change adaptation of pig buildings: development of novel designs and energyconservation strategies to reduce the carbon footprint
Research partner(s): Harper Adams University
Duration: 2012-2014 (now concluded)
Aims and objectivesThe aim of this project was to determine the influence of surrounding farm structures on the ventilationperformance of naturally ventilated (NV) pig buildings.
The research addressed the following objectives:• To characterise airflow in an NV pig building in a densely surrounded farm layout• To optimise natural ventilation designs of pig buildings in a dense farm layout and to determine the threshold separation distance from obstacles in a new farm layout and retrofit building designs in existing dense farm layouts
• To identify the most significant building design features and their influence on natural ventilation performance of pig buildings.
Project achievements during 2013-2014• Field measurement of natural ventilation performance in an empty NV finishing pig building at Harper Adams University (HAU) pig farm
• Field measurement of indoor microclimate and ventilation performance in a NV finishing pig building with pig at HAU
• Development of validation models from previous literature and field measurements (1 and 2 ) results fora Computational Fluid Dynamics (CFD) study on the effects of surrounding buildings on natural ventilation performance in a NV finishing pig building
• CFD modelling with respect to the effects of surrounding buildings and optimisation of natural ventilation designs of pig buildings in dense farm layout.
Application to industryThe project could benefit the pig industry by:• Identifying the most significant building design features and their influence on natural ventilation performance in pig buildings
• Presenting farmers and pig building designers with guidelines on parameters affecting natural ventilation performance
• Optimising natural ventilation designs of pig buildings in a dense farm layout by suggesting threshold separation distance from obstacles.
For further information
http://www.bpex.org.uk/R-and-D/R-and-D/PigBuildingDesigns.aspx
Measurement of external wind characteristics between automatically controlled naturally ventilated building and adjacent mechanically ventilated building with ultrasonic anemometer.
Research, Development and Innovation76
The BPEX Yearbook 2013-2014
CLIMATE CHANGE AND ENVIRONMENT
Project: A desktop study to summarise the strengths and limitations of information currently available on emissions factors for ammonia and odour from current pig production systems found in England, and on the leaching of nutrients in outdoor production systems
Research partner(s): AEA Ltd
Duration: 2013
Aims and objectives • To provide a critical assessment of existing methodologies and an analysis of whether sufficient data is available to pursue a project(s) to accurately establish the current baseline emissions factors and nitrogen leaching factors for outdoor pig production
• To compare with current data from European Union member states with similar climatic conditions to England
• To identify any knowledge and data gaps as they relate to emission factors in use in England• To develop recommendations on the feasibility of developing a new or improved methodology to allow on-farm monitoring and measurement.
Project achievements during 2013-2014• The study highlighted that, although existing methodologies can provide robust measurements and estimates of ammonia (NH3) emissions, much of the work on which UK emission estimates from buildings and stores are based has not reported data from enough explanatory variables to fully account for variation among reported NH3 emissions
• The European Committee for Standardization (CEN) standard 13725 “Air Quality – Determination of Odour Concentration Using Dynamic Dilution Olfactometry” is the most reliable independent method of measuring odour strength
• Hydrologically isolated field-scale plots can be used to collect drainage water from experiments which study farm-scale management activities. Although such experimental facilities provide the potential for studying nutrient loss from outdoor pigs, no such studies have been undertaken
• Existing studies used in the preparation of the UK NH3 inventory provide a reasonably robust estimate of NH3 emissions from buildings housing pigs. However, the reports and papers provide little supporting data, particularly with respect to factors such as the diet fed to the pigs, nitrogen (N) and total available N (TAN) excretion and the floor area allowed per animal. It is therefore difficult to use current measurements to estimate emissions from individual farm buildings to take account of differences in variables such as diet, floor area, ventilation rate and temperature
• Ammonia emissions following the application of manure to land are well characterised and there is a good understanding of the reductions in NH3 emissions that can be obtained from the use of abatement techniques
• A paper was published in Science of the Total Environment, November 2013, entitled ‘Ammonia and odour emissions from UK pig farms and nitrogen leaching from outdoor pig production – a review’.
Application to industry• Emissions factors are increasingly being used to estimate environmental impacts of pig production, both nationally and at local level, especially in relation to new developments
• There is a need for emissions factors which are both up to date and applicable to current and future production systems. This study has shown that emission factors currently being used are suitable for national emissions reporting, but not individual farm impact assessments as are becoming a requirementof planning and permitting
• Outdoor pig producers need to have robust data on which to base their nitrate deposition calculators forregulatory compliance and for subsequent land users to achieve maximum opportunity value for residualmanorial nutrients.
For further information
http://www.bpex.org.uk/environment-hub/

Research, Development and Innovation 77
The BPEX Yearbook 2013-2014
CLIMATE CHANGE AND ENVIRONMENT
Project: Demonstrating the environmental and economic implications for reducingphosphorus excretion in pigs
Research partner(s): Defra, Newcastle University, BQP (Dalehead Foods), BOCM Pauls Ltd, BPEX
Duration: 2010-2013
Aims and objectives • To develop and deliver a knowledge transfer (KT) plan in association with BPEX KT team to disseminate knowledge to the pig sector beyond the demonstration activities performed as part of the project, and to facilitate uptake
• To establish the levels of reduction in phosphorus (P) uptake that could be achieved in pig diets without compromising animal performance, health and welfare
• To carry out demonstration trials that will establish the scope for reducing P levels in finisher pig and outdoor sow diets without compromising performance, health and welfare
• To establish how reductions in P intake relate to levels of P excretion under commercial practice by monitoring, or estimating, P levels in excreta, manures and/or soils in finisher pig and sow systems
• To estimate the potential reduction in risks of diffuse P pollution to the environment from a range of pig production systems through modelling.
Project achievements during 2013-2014• Results showed that for the growing/finishing pigs there were no effects of dietary treatment on the performance, suggesting that dietary P levels can be safely reduced
• The data collected were unable to show significant change in the risk of P loss to the environment (mobile and/or labile P pools in faeces, manure or surface soil) resulting from a reduction in total and digestible P in the diet of outdoor sows or of grower-finisher pigs. This can be attributed to interactions between management practices and site factors (which were not controlled in these demonstration trials) influencing the P load on the environment separately to impacts of changes in diet
• Trials showed that there were no adverse effects on the performance of sows in the first or second farrowing cycle when fed on a lower level of P throughout gestation
• The absence of an interaction between parity and diet demonstrates that even younger sows are able to cope with lower levels of P in the diet without performance being affected under outdoor conditions.
Application to industry • In this project both the low P dry sow diet and the low P finisher diet had no additional inorganic P added, without adverse effects on pig performance. This indicates that in most situations there is no need for additional inorganic P in the diet, which can be costly given the decreased availability of inorganic P sources
• Further research will be needed to look at possible long-term effects on sow performance, especially when levels are reduced below the recommended standard, as well as the translation of the findings from outdoor to indoor sow systems, and from pigs on straw-based systems to those on slats.
For further information
Research into Action 16: Reducing phosphorus levels in gestating sow diets.
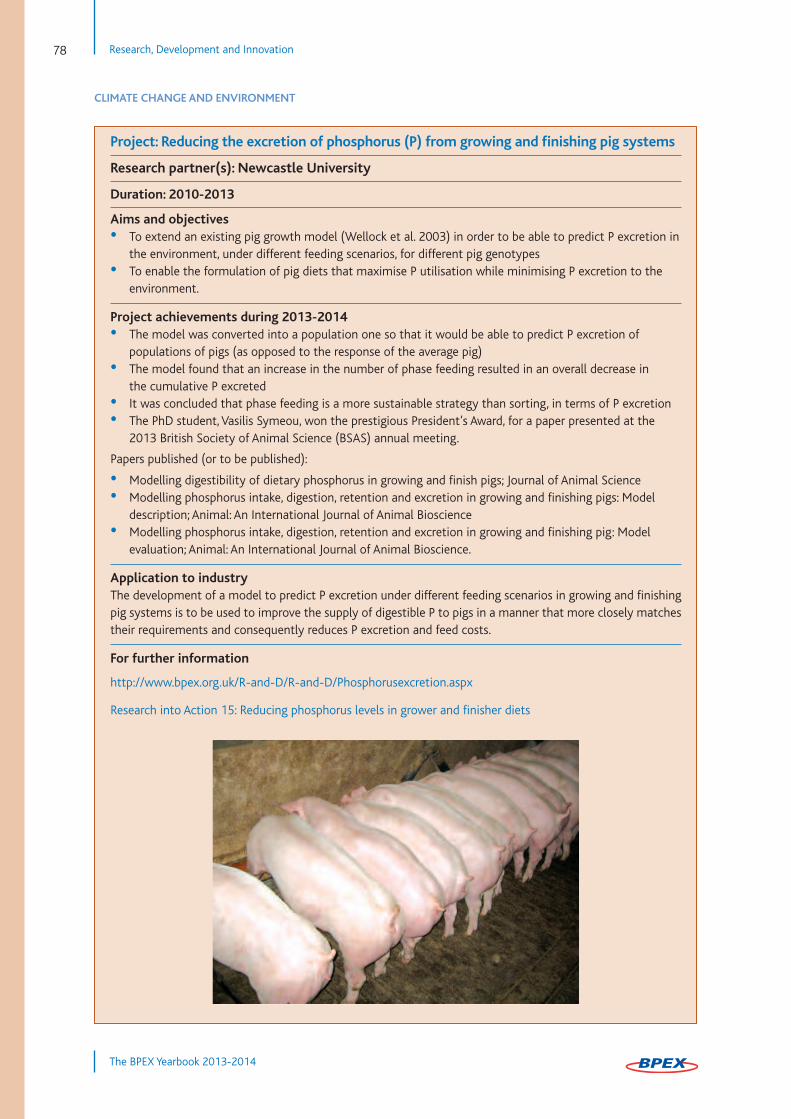
Research, Development and Innovation78
The BPEX Yearbook 2013-2014
CLIMATE CHANGE AND ENVIRONMENT
Project: Reducing the excretion of phosphorus (P) from growing and finishing pig systems
Research partner(s): Newcastle University
Duration: 2010-2013
Aims and objectives • To extend an existing pig growth model (Wellock et al. 2003) in order to be able to predict P excretion inthe environment, under different feeding scenarios, for different pig genotypes
• To enable the formulation of pig diets that maximise P utilisation while minimising P excretion to the environment.
Project achievements during 2013-2014• The model was converted into a population one so that it would be able to predict P excretion of populations of pigs (as opposed to the response of the average pig)
• The model found that an increase in the number of phase feeding resulted in an overall decrease in the cumulative P excreted
• It was concluded that phase feeding is a more sustainable strategy than sorting, in terms of P excretion• The PhD student, Vasilis Symeou, won the prestigious President’s Award, for a paper presented at the 2013 British Society of Animal Science (BSAS) annual meeting.
Papers published (or to be published):
• Modelling digestibility of dietary phosphorus in growing and finish pigs; Journal of Animal Science• Modelling phosphorus intake, digestion, retention and excretion in growing and finishing pigs: Model description; Animal: An International Journal of Animal Bioscience
• Modelling phosphorus intake, digestion, retention and excretion in growing and finishing pig: Model evaluation; Animal: An International Journal of Animal Bioscience.
Application to industry The development of a model to predict P excretion under different feeding scenarios in growing and finishingpig systems is to be used to improve the supply of digestible P to pigs in a manner that more closely matchestheir requirements and consequently reduces P excretion and feed costs.
For further information
http://www.bpex.org.uk/R-and-D/R-and-D/Phosphorusexcretion.aspx
Research into Action 15: Reducing phosphorus levels in grower and finisher diets
Research, Development and Innovation 79
The BPEX Yearbook 2013-2014
CLIMATE CHANGE AND ENVIRONMENT
Project: Environmental and Nutritional Benefits of Bioethanol co-products (ENBBIO)
Research partner(s): University of Manchester, University of Nottingham, Scottish Agricultural College, ABAgri Ltd, AB Vista Feed Ingredients, Aunir, AHDB-BPEX, AHDB-EBLEX,AHDB-DairyCo, AHDB-HGCA, Noble Foods, Ensus PLC, Evonik Degussa, Glencore Grain UKLtd, Hook2Sisters, Marks & Spencer PLC, NEPIC, Premier Nutrition Products Ltd, Sciantec Analytical Services Ltd, Syngenta Seeds UK, The Scotch Whisky Research Institute, Tulip Ltd.
Duration: 2010-2014
Aims and objectives• To quantify the chemical composition of UK sources of wheat distillers dried grains with solubles (W-DDGS) and other co-products including development of appropriate methodologies
• To identify the limitations associated with feeding UK sources of W-DDGS in both ruminant and non-ruminant species
• To identify routes to improving nutritional value of DDGS through production of consistent products from modern biorefineries, making use of process modifications in the biorefinery and the use of enzymes to improve animal performance
• To test the modified and improved DDGS products• To quantify the overall benefits of DDGS production on reducing diffuse pollutants (methane, N and P) and enhancing home-grown protein production.
Project achievements during 2013-2014• Pig digestibility trials will conclude at the Universities of Nottingham and Harper Adams this year• The University of Manchester group has explored four approaches for enhancing the nutritional value of DDGS; for further information see ENNBIO website
• An experiment at the University of Illinois determined the apparent ileal digestibility and the standardised ileal digestibility of amino acids by growing pigs, of five different sources of DDGS from Europe
• These data are now being used to formulate diets for pig studies at the University of Nottingham and Harper Adams University, the latter being a commercial study sponsored by Tulip Ltd.
Project conclusions to date• DDGS has been shown to be a valuable source of protein for the livestock industry• W-DDGS from a modern bioethanol plant is very consistent in quality from day to day• The large amount of mixing of raw materials at intake and in the fermenters means the quality of the DDGS is less variable in protein content than the original wheat used at intake
• W-DDGS has been used to successfully replace a significant proportion of the soya protein in poultry and dairy diets; analysis to understand animal responses and commercial value is ongoing
• Inclusion of DDGS in livestock rations can displace other feed ingredients, particularly soya and other cereal products, which reduces the net land required for biofuels.
Application to industry• W-DDGS is a new product to the UK feed market; by fully understanding the nutritional values andconstraints, the industry will be able to fully exploit its potential
• W-DDGS inclusion within pig diets can reduce the cost of production• By using W-DDGS, the pig industry can improve its sustainability and become less dependent on imported protein crops such as soya bean meal.
For further information
http://www.bpex.org.uk/R-and-D/R-and-D/ENBBIO.aspx
http://www.adas.co.uk/Home/Projects/ENBBIO/tabid/338/Default.aspx
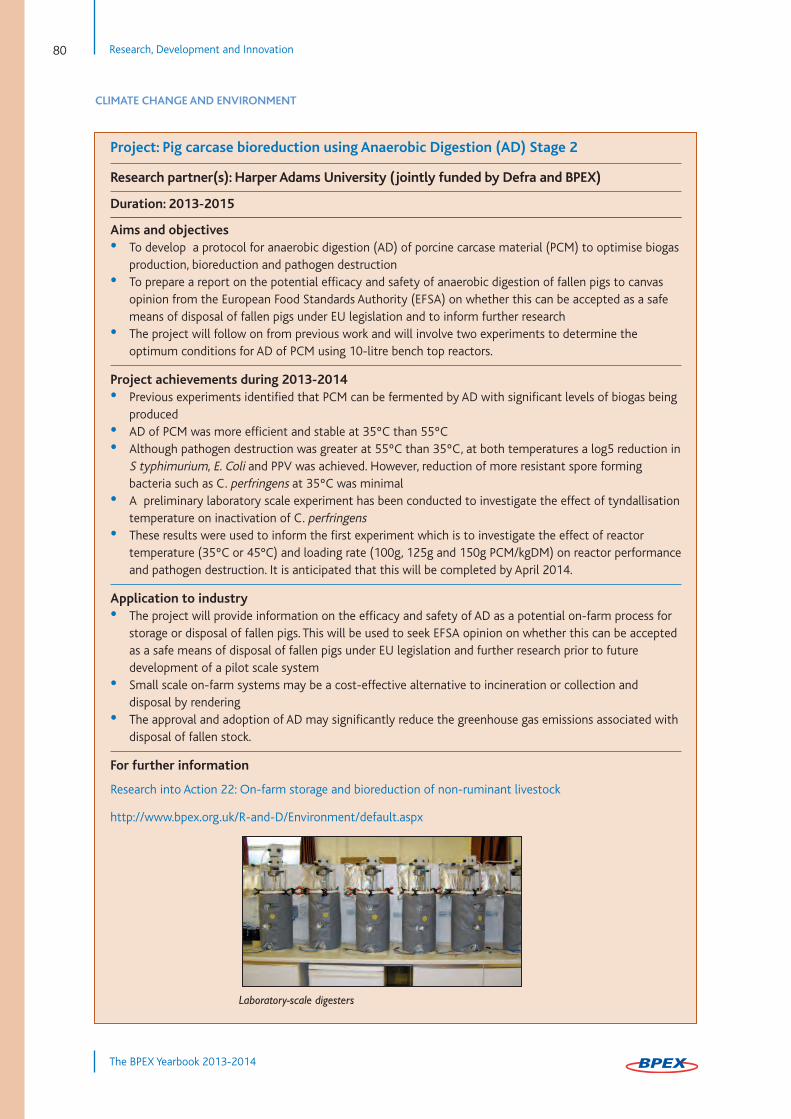
Research, Development and Innovation80
The BPEX Yearbook 2013-2014
CLIMATE CHANGE AND ENVIRONMENT
Project: Pig carcase bioreduction using Anaerobic Digestion (AD) Stage 2
Research partner(s): Harper Adams University (jointly funded by Defra and BPEX)
Duration: 2013-2015
Aims and objectives• To develop a protocol for anaerobic digestion (AD) of porcine carcase material (PCM) to optimise biogasproduction, bioreduction and pathogen destruction
• To prepare a report on the potential efficacy and safety of anaerobic digestion of fallen pigs to canvas opinion from the European Food Standards Authority (EFSA) on whether this can be accepted as a safe means of disposal of fallen pigs under EU legislation and to inform further research
• The project will follow on from previous work and will involve two experiments to determine the optimum conditions for AD of PCM using 10-litre bench top reactors.
Project achievements during 2013-2014• Previous experiments identified that PCM can be fermented by AD with significant levels of biogas being produced
• AD of PCM was more efficient and stable at 35ºC than 55ºC• Although pathogen destruction was greater at 55ºC than 35ºC, at both temperatures a log5 reduction inS typhimurium, E. Coli and PPV was achieved. However, reduction of more resistant spore forming bacteria such as C. perfringens at 35ºC was minimal
• A preliminary laboratory scale experiment has been conducted to investigate the effect of tyndallisationtemperature on inactivation of C. perfringens
• These results were used to inform the first experiment which is to investigate the effect of reactor temperature (35ºC or 45°C) and loading rate (100g, 125g and 150g PCM/kgDM) on reactor performanceand pathogen destruction. It is anticipated that this will be completed by April 2014.
Application to industry • The project will provide information on the efficacy and safety of AD as a potential on-farm process for storage or disposal of fallen pigs. This will be used to seek EFSA opinion on whether this can be accepted as a safe means of disposal of fallen pigs under EU legislation and further research prior to future development of a pilot scale system
• Small scale on-farm systems may be a cost-effective alternative to incineration or collection and disposal by rendering
• The approval and adoption of AD may significantly reduce the greenhouse gas emissions associated withdisposal of fallen stock.
For further information
Research into Action 22: On-farm storage and bioreduction of non-ruminant livestock
http://www.bpex.org.uk/R-and-D/Environment/default.aspx
Laboratory-scale digesters
Research, Development and Innovation 81
The BPEX Yearbook 2013-2014
CLIMATE CHANGE AND ENVIRONMENT
Project: Development of an Ammonia and Carbon Dioxide Sensor for Pig Buildings
Research partner(s): Harper Adams University
Duration: 2013
Aims and objectives• To develop an affordable and universal, high precision, ammonia and carbon dioxide sensor with multipoint sampling capability for use in pig housing, and which is able to interface with IT systems found on UK pig farms
• To compare the performance of the sensor with the commercial equivalent (photoacoustic) standard accepted equipment, used by leading EU and US researchers
• To develop a 12-point, multipoint sampler, using Tunable Diode Laser Spectrometry (TDLS), confirm its accuracy in laboratory conditions and in the field.
Project achievements during 2013-2014• The sensor has been tested in the laboratory and on the university farm• Overall, the TDLS analyser proved suitable for measuring NH3 concentration within a range that is expected in the field
• The largest deviations from the dilution standards were seen when flow rates through the sensor were less than those used by the vendor during calibration
• It is advised that the temperature is kept stable around the sensor, and the start-up time should be at least 1.5 hours
• A high degree of sensitivity, comparable to a commercial Photo Acoustic Analyser, can be obtained using the sensor
• On-farm trials will be conducted in the near future to further test the model.
Advantages and limitations of the sensor for ammonia treatmentAdvantages
• The sensor will be used to help understand NH3 and CO2 fluxes within the building and ammonia emission factors; expected accuracy is 0.3ppm or better
• Because a source with a narrow bandwidth is used in the instrument, there is reduced possibility of interference from other gases
• Cell volume is very small, reducing the amount of sample and calibration gas needed• No consumables are required, keeping operational costs low• The instrument will function in temperatures ranging from -30°C to 65°C. Limitations
• The system is based on a multipass measurement cell, which may present difficulties in maintaining optical alignment during the measurement process
• Absorbance is measured indirectly as opposed to in the case of the photoacoustic instrument where it is measured directly.
Application to industry• The sensor will be capable of being used at production sites to evaluate the performance and environmental impact of new buildings and/or feeding regimes
• It is anticipated that the sensor will be designed to a better level of accuracy than is possible with gas analyser tubes or flux monitor, and will be cheaper to buy than models on the market at present.
For further information
http://www.bpex.org.uk/R-and-D/Environment/default.aspx
Research, Development and Innovation82
The BPEX Yearbook 2013-2014
HEALTH AND WELFARE
Project: Development of an effective methodology for monitoring health and welfarestatus in the pig industry and to establish the current baseline health and welfare status of pigs in England
Research partner(s): SRUC and AHVLA
Duration: 2012-2014
Aims and objectivesThe overall purpose of this project is to develop a comprehensive, health and welfare monitoring system forthe English pig industry. The primary context of this work is the 20:20 Pig Health and Welfare Strategy (2020Vision) whereby it is necessary to establish baseline measures and develop an integrated system that willenable the assessment and monitoring of the health and welfare of English pigs.
Key aims are:
• To establish a methodology and indicators by which to determine a baseline measure of the national English pig health and welfare status
• To provide estimates of the baseline prevalence of key endemic diseases, to include PRRS, swine dysentery, mange and Mycoplasma Hyopneumoniae, and a baseline measure of antimicrobial resistance
• To enable ongoing monitoring of both the overall and individual parameters outlined above and to detect and/or measure change in them.
Project achievements during 2013-2014• Information was collated from more than 40 current available data sources on health, disease and welfare measurements from the English pig industry. Thirteen of these data sources were fully evaluated using a standardised framework for the evaluation of animal health surveillance systems: SERVAL http://www.rvc.ac.uk/VEPH/SERVAL.cfm
• A framework (IGOR-P) was developed that could provide the industry with an information and knowledge-sharing platform that, if implemented for the English pig industry, would form the core reference point, or “backbone”, of any comprehensive health and welfare monitoring system.
Application to industry• The improvement of pig health and welfare is fundamental to securing the sustainability of the British pig industry
• Disease causes significant cost to pig farmers, limits productivity and is inextricably linked to welfare• The industry needs to know what the current status of animal health and welfare is in order to:
• Monitor any changes that may occur and allow assessments of change over time• Measure the effectiveness of any initiatives to improve pig health and welfare• Recognise emerging challenges • Help secure the reputation that the English pig industry has of one with a high welfare status
• A robust, cost-effective system needs to be developed to provide this, and this project has set the foundation for this to be achieved.
For further information
http://www.bpex.org.uk/R-and-D/pig-Health/projects.aspx

Research, Development and Innovation 83
The BPEX Yearbook 2013-2014
HEALTH AND WELFARE
Project: Antimicrobial use in the pig industry
Research partner(s): Octagon Services Ltd
Duration: 2012-2014
Aims and objectivesAccurate data on the usage of antimicrobials in any species of animal is generally not available for manycountries, including the UK. Each year, the Veterinary Medicines Directorate (VMD) publishes data on the totalvolumes of veterinary antimicrobials sold for use in the UK and these are broken down, as far as possible intoestimated use for some species. However, there is considerable appetite across the EU to address data gapsand fully address usage in each species, with a drive to lower usage where possible.
This project aims to:
• Identify areas of complexity around collecting this data for the English pig herd and trial different methods of collection
• Determine what volume of antimicrobials are used in the English pig herd, to provide a benchmark to inform the industry of our current standing in comparison to other EU countries
• Inform the current debate on antimicrobial usage.
Project achievements during 2013-2014• Data was collected from vet practices, integrated production companies and feed mills in an attempt to gain a holistic view of how antimicrobials are prescribed, dispensed and recorded
• A benchmarking tool has been created to help producers and their vets measure antimicrobial usage specific to that farm and therefore be able to set targets for reduction where appropriate.
Application to industry• The data forms a sound basis on which to help explain antimicrobial usage in the English pig industry• The English pig industry now has a tool to help drive responsible use of antimicrobials • The industry can start to address data gaps and improve data provision throughout the supply chain.
For further information
http://www.bpex.org.uk/R-and-D/pig-Health/projects.aspx

Research, Development and Innovation84
The BPEX Yearbook 2013-2014
HEALTH AND WELFARE
Project: Wild Boar surveillance for non-statutory pathogens
Research partner(s): AHVLA
Duration: 2013-2014
Aims and objectives• To establish whether wild boar are a significant vector in the dynamics of domestic swine disease transmission
• To use samples collected from a cull in the Forest of Dean to test for a variety of pathogens relevant to English commercial pig production. This will help establish whether wild boar populations need to be factored in when approaching regional elimination programmes for key production diseases.
Project achievements during 2013-2014• The samples have been collected from the wild boar, including 92 faecal and 90 serum samples. This should give a suitable detection level to find at least one positive sample if it exists, since the populationsize was approximately 600 wild boar
• The pathogens/conditions being sampled for include salmonella, enzootic pneumonia, PRRS, swine flu, porcine epidemic diarrhoea, swine dysentery and leptospirosis.
Application to industryIt is important that we ascertain the risk of wild boar to domestic pig production, so that effective controlprogrammes can be established to help combat common diseases. It will also become relevant in the event ofa notifiable disease outbreak, as we will be able to predict what spillover of disease is likely between the twopopulations.
For further information
http://www.bpex.org.uk/R-and-D/pig-Health/projects.aspx

Research, Development and Innovation 85
The BPEX Yearbook 2013-2014
HEALTH AND WELFARE
Project: Development of a Herd Health Score and Cost Calculator
Research partner(s): SRUC
Duration: 2012-2014
Aims and objectives• To investigate the feasibility of independently developing an integrated herd health score (HHS), coupledto a herd cost calculator (HCC), for pig breeding and finishing herds, to enable farmers to easily measure the level of disease and its impact on their farms
• To develop three models for breeding herds, finishing herds and breeding-to-finishing herds, whereby scoring of health can be measured in an easy and practical way and can be used by producers, or their vets or advisers, as a way of monitoring the farm in terms of health
• To promote the use of the Herd Health Score as a benchmarking tool.
Project achievements during 2013-2014• By consulting with vets, it was established that the key points to measure for breeding herds were:
• Number of pigs per sow per litter weaned• Number of returns per sow • Number of pigs per sow per litter born alive • Presence or absence of specific diseases• Medication used per litter• Sow reproductive health.
• Parameters identified to be included in a finishing herd HHS were: • Mortality at fattening• Presence of diseases• Average liveweight gains• Antibiotic usage• Respiratory diseases• Vices.
• Indicators related to pathological lesions identified for the HSS were: • Percentage of pneumonia• Percentage of other pathology• Tail bites• Arthritis• Skin lesions• Pericarditis.
• The calculator was able to predict that the annual gross margin of a healthy sow was £143.40, whereas the annual gross margin of an infected sow with PRRSV was estimated to be -£17.32 (difference of £160.73/sow between a healthy and a diseased sow, which is equivalent to the cost of the disease)
• The annual gross margin of a healthy finishing pig was estimated by the model to be £18.54 whereas thegross margin of a severely infected finishing pig was estimated at £9.73 (ie £8.80/pig was the cost of thedisease)
• The models were reviewed and commented on by pig vets in three teleconference sessions. The models were then revised and finalised based on these comments
• The results of these cost calculators will be used to illustrate the financial risk of poor preventive control and management of the modelled diseases
• The next step is for the health score and cost calculator to be available as online tools.
continued

Research, Development and Innovation86
The BPEX Yearbook 2013-2014
HEALTH AND WELFARE
Project: Development of a Herd Health Score and Cost Calculator
Application to industryFarmers need easy and repeatable ways to measure health in their herds so that they can apply interventionstrategies, and measure the outcomes, as a way of predicting the return on investment. These tools will alsohelp apply financial figures to this process and aid in decision-making.
For further information
http://www.bpex.org.uk/R-and-D/pig-Health/projects.aspx
Project: Towards eradication of Mycoplasma hyopneumoniae from the UK pig herd
Research partner(s): Royal Veterinary College
Duration: 2009-2014
Aims and objectives• To develop and validate immunohistochemistry as a diagnostic tool for M. hyopneumoniae• To produce a monoclonal antibody for M. hyopneumoniae• To assess the economic impact of enzootic pneumonia• To conduct an overall feasibility assessment of M. hyo eradication from the UK.
Project achievements during 2013-2014• The impact of EP-like and pleuritis lesions on defined production parameters was determined• Data collected on the presence/absence and severity of these lesions and post-trimming slaughter weight were used as inputs in a linear regression model
• A significant association was identified between increasing severity of EP-like lesions and a decrease in post-trimming slaughter weight
• Findings to date suggest that, on an individual level, each 5-point increase in EP-like lesions equates to around -53p/pig
• Findings also suggest that, on a batch level, each increase of 1 point score equates to -50p/pig • An increase in EP-like lesion severity was also significantly associated with an increase in slaughter age.
Application to industryDiagnosis of EP relies on the availability of a sensitive and specific diagnostic test. Currently, such a test is notavailable and diagnosis of EP is based upon the results of a combination of tests. Immunohistochemistry wouldprovide a stand-alone diagnostic test and, by creating an ‘in house’ antibody, the longevity of the test can beassured.
For further information
http://www.bpex.org.uk/R-and-D/R-and-D/Mycoplasmahyopneumoniae.aspx
Microscopic section of a pig lung. Figure A. Lungs without EP-like lesions Figure B. Lungs with EP like lesions. Brown IHC staining indicates lung positive for M. hyopneumoniae.
A B

Research, Development and Innovation 87
The BPEX Yearbook 2013-2014
HEALTH AND WELFARE
Project: Enhancing the Impact of Regional Health Improvement Programmes
Research partner(s): University of Warwick
Duration: 2010-2013
Aims and objectives• To develop mathematical simulation models of disease spread in metapopulations of British pig herds• To use these models to understand how the structure of the metapopulation affects the spread of disease• To test intervention and control strategies feeding back results to the industry.
Project achievements during 2013-2014• Testing of the metaherd method was completed• The use of vaccinations in the metaherd was simulated, drawing conclusions on optimal strategies• Results suggest that fadeout within the metaherd does not occur once infection has spread to herds >150 sows
• Results suggest that a loose threshold herd size exists, between 100-150 sows, below which infection does not persist in a herd
• Full results, and details on the vaccination strategy work, will be available during 2014.
Application to industry• Alongside the more obvious problems in the structure of networks of pig farms, the model will allow us to report on other characteristics that may have an effect on the spread of disease. These results could be of use if the results showed that particular network structures are most efficient at slowing or interrupting transmission
• The predictions on the optimal intervention and control strategies may lead to implementation of such strategies, or the consideration of strategies, with this research as background information
• This could improve regional and national herd health and result in increased productivity.
For further information
http://www.bpex.org.uk/R-and-D/R-and-D/RegionalHealthImprovement.aspx
PhD student, Daniel Franklin, working on his research to enhance the impact of regional health improvement programmes
Research, Development and Innovation88
The BPEX Yearbook 2013-2014
HEALTH AND WELFARE
Project: New approaches to diagnosis of Haemophilus parasuis-related disease in pigs
Research partner(s): University of Cambridge
Duration: 2011-2014
Aims and objectives• To bring the UK to the forefront of H.parasuis (HPS) diagnosis• To develop sensitive and specific tools for detection of the organism in field material, for typing and determining the importance of any detected isolates for disease
• To assess the value of vaccine in the control of disease outbreaks.
Project achievements during 2013-2014• An analysis of the capsule sequences of H. parasuis and a list of further markers of serotype have been produced
• Work thus far has found statistically significant markers for serotype and for different disease categories for H. parasuis
• The next stage is to determine which combination of markers gives the best probability of disease causation and to design the molecular diagnostics
• Markers could be able to predict:• Disease• Serotype• Antibiotic Resistance.
Application to industry• The outcomes from this project will hopefully lead to improved diagnosis of HPS-related disease in pigs• The proposed diagnostic would fill a hole in the market by offering molecular serotyping in the UK, and information on the chance of a strain-causing disease
• It would be a cheap and fast diagnostic to allow fast turnaround of results• Improved surveillance and herd monitoring prior to trade; the new molecular tools could be applied to nasal swabs collected from herds prior to mixing or trade (eg two breeding herds supplying a single weaner-finisher unit)
• The molecular tests could allow the herd vet to identify potentially virulent strains of HPS in the source herds, with potential to cause disease after mixing with naïve pigs at the recipient herd; the benefit is prevention of disease by characterisation of HPS status for separate source herds prior to mixing.
For further information
http://www.bpex.org.uk/R-and-D/R-and-D/DiagnosticsofHParasuisrelateddisease.aspx

Research, Development and Innovation 89
The BPEX Yearbook 2013-2014
HEALTH AND WELFARE
Project: The use of oral fluids from pig populations for the diagnosis and monitoring ofinfectious disease
Research partner(s): Newcastle University
Duration: 2011-2014
Aims and objectivesThe overall aim is to develop validated protocols for using porcine oral fluid (OF) for the diagnosis and monitoring of infectious disease, specifically:• To further develop laboratory diagnostics for reliable detection of key UK endemic disease agents in oral fluid
• To determine factors affecting the composition of porcine oral fluid and how this influences recovery of markers of specific infectious diseases
• To develop and test field sampling strategies for pigs housed under the range of UK conditions, including large group, straw-based housing systems in which the methodology has not currently been validated.
Project achievements during 2013-2014Results to date suggest that:• Provision of multiple cotton ropes may improve representation of pen-based OF samples in weaned, but not finishing, pigs in straw-based systems
• Provision of a single cotton rope can result in a pen sample representative of 40% of the total population (typical bleed: <10%)
• FTA cards* may provide a simple and safe means of storing/shipping porcine OF for PRRSv testing without the need for chilling
• Single rope sample represents approximately four times more of the population than current blood testing recommendations
• Porcine OF shows good, but not total, agreement with blood serum for anti-PRRS antibody testing• The next stage of the project is serial OF collection following weaned pens through growth for anti-PRRSv antibody detection and RT-PCR testing of dry stored field OF to validate FTA card* method for PRRSv monitoring.* Flinders Technology Associates (FTA) cards: bind and store nucleic acids at ambient temperatures.
Application to industry• By removing the requirement for veterinary attendance and subsequent sample chilling/freezing, the labour cost to the farmer for collecting diagnostic samples for routine disease surveillance is greatly reduced
• There may be potential to store OF samples over longer time periods, ie weeks; this could allow farmers to build up diagnostic archives over time, for investigation of the dynamics of specific pathogens within their herd using OF.
For further information
http://www.bpex.org.uk/R-and-D/Pig-Health/projects.aspx
Research into Action factsheet 13: Measurement of Acute Phase proteins

Research, Development and Innovation90
The BPEX Yearbook 2013-2014
HEALTH AND WELFARE
Project: Predicting leg soundness through biomechanical assessment of gait in pigs
Research partner(s): Newcastle University
Duration: 2010-2013
Aims and objectives• To parameterise normal gait in pigs through the use of motion capture technology• To ascertain how gait changes with increasing age/weight of the pig• To determine the effect of floor surface on the gait of pigs at different ages• To ascertain the predictive power of early gait score measures to identify later predisposition to lameness• To further develop quick, simple locomotion assessment methods for commercial application.
Project achievements during 2013-2014• Results from a subgroup of the ‘Longitudinal predictive gait study’ investigating gait changes (displacement) in lame female pigs compared to normal matching controls were reported at the BSAS annual conference in Nottingham
• A pilot test of the Windows Kinect motion sensing input device was conducted to investigate the ability of Kinect to track changes in the head and trunk vertical movement of lame pigs in comparison to the high-tech Vicon Motion capture data collected in the experimental population of pigs; the Kinect systemhas the potential to be a simple on-farm movement tracking device when mounted above pigs
• Two abstracts were presented at the International Society of Biomechanics (ISB) congress in Brazil:funding to attend the conference was provided by awards from the Sir Kenneth Blaxter award and the Douglas Bomford trust award for research in Agricultural Engineering
• Analysis of the floor treatment study was completed and a paper was submitted to the journal Animal• A paper on the association between subjective clinical scoring (including known joint disease) with quantitative gait measures provided by the Vicon system has been written
• Data processing and analysis of the long-term study is underway• Results to date suggest that the step-to-stride length relationship remains the same in clinically normal pigs, regardless of size, age or walking speed, and was repeatedly useful in differentiating pigs with subclinical and clinical problems
• Development of a practical on-farm version will continue in a follow-on pilot study.
Application to industryThis study will increase our understanding of locomotion of pigs on different floor types and at different stagesof development. The industry may benefit from the application of this knowledge as follows:
• “Screening” replacement gilts for leg soundness with automated and objective methods of biomechanical gait assessment: this could provide reassurance of the structural quality and longevity of the future breeding sow, leading to reduced replacement rates and fewer sows being culled for leg problems
• The same strategy could also allow breeding companies to apply selection criteria to improve leg soundness of slaughter generation pigs; fewer leg problems and reduced culls in the finishing herd would lead to improved growth rates and greater annual meat output per sow.
For further information
http://www.bpex.org.uk/R-and-D/R-and-D/Legsoundness.aspx

Research, Development and Innovation 91
The BPEX Yearbook 2013-2014
HEALTH AND WELFARE
Project: Pathogen reduction using three novel methods – mycoplasma hyopneumoniae
Research partner(s): Royal Veterinary College
Duration: 2011-2014
Aims and objectives• The overall aim of the project is to reduce Mycoplasma hyopneumoniae in the environment of pigs without the use of antibiotics
• More specifically, the objective is to determine the efficiency of the following novel methods against Mycoplasma hyopneumoniae (M. hyo) in the environment of pigs:
• UVA activated photocatalytic paints• Silver ion solutions• UV-based air purification system.
Project achievements during 2013-2014• Minimum inhibitory concentrations (MICs) were performed on the silver ions to determine the minimumeffective dose to successfully inhibit the growth of M. hyopneumoniae; efficacy studies were carried out to assess the duration of inhibitory effects and presented at the European Symposium of Porcine Health Management (ESPHM) 2013
• Four photocatalytic paints were tested under a range of UVA intensities (0.14 to 0.30mW/cm2). The integrity of the paints was also an important consideration as paints that flaked are not suitable for pig accommodation
• The results of the inhibitory effects of the paints, alongside the integrity, were considered when selectingthe paint to use in vivo
• The in vitro UVC air filtration research involved serially diluting M. hyopneumoniae in Friis medium and plating onto Friis plates. The plates were exposed to 1.26W/cm2 of UVC for 0, 5, 10, 15, 20 and 25 seconds, plates were incubated in CO2 for 14 days before counting
• The in vitro analysis has shown that both UVC and photocatalytic paints are efficacious in inhibiting growth of Mycoplasma hyopneumoniae; further analysis is needed from the in vivo work to establish whether these methods may be of benefit to the pig industry
• The in vivo study is underway.
Application to industry• Research aims to identify novel and alternative methods to reduce pathogen load in the environment of pigs with particular emphasis towards the respiratory pathogen Mycoplasma hyopneumoniae
• There have been substantial concerns towards the use of antibiotics in agriculture; this is largely due to antibiotic resistance. Therefore, this research is two-fold: developing novel and alternative methods thus reducing/replacing antibiotics and, secondly, reducing disease on farm.
For further information
http://www.bpex.org.uk/R-and-D/R-and-D/ReductionofPathogenLoad.aspx
Research, Development and Innovation92
The BPEX Yearbook 2013-2014
MEAT QUALITY AND SAFETY
Project: Zoonosis National Control Programme (Salmonella control in pigs)
Research partner(s): Defra, AHVLA, Food Standards Agency, Health Protection Agency, Veterinary Medicines Directorate
Duration:
Aims and objectives• To work with partners and industry to reduce the risk to consumers from salmonella and other zoonosis in pig meat products
• To increase the understanding of zoonosis risks and controls throughout the pork chain• To develop tools to improve the salmonella status of the national pig herd• To inform EU negotiations regarding a salmonella testing proposal• To increase awareness and uptake of the online BPEX Farm Tool and the AHVLA R8 project.
Project achievements during 2013-2014• The pork safety programme was integrated in 2013 to fulfil a One Health concept, whereby actions to improve animal health also benefit pork safety
• BPEX has been heavily involved with the £1.7 million salmonella programme, funded by Defra and led byAHVLA, looking at levels of salmonella along the whole chain and the impact of various interventions
• The programme firstly looked at the practices of farms that consistently had a low salmonella seroprevalence (platinum farm status) based on the ex-ZNCP scheme
• Additionally, 41 further farms have been recruited to take part in the first phase of the project, these are similar enterprises to the platinum farms and will act as controls
• The comparison of the farms will determine the key characteristics that may have contributed towards the consistent low Salmonella status of the Platinum farms
• In conjunction with this, the PHIP team has been taking samples from the target farms in the abattoir, toestablish whether there is a correlation of farm prevalence and what is seen at slaughter
• The next phase of the work will be to recruit 30 farms that will try one of three interventions to reduce salmonella on farm, including vaccination, intensive cleaning and rodent control or movement of outdoor sites onto new ground.
Other activity:• A £500k baseline pig monitoring study took place and provided prevalence data for key pig zoonotic diseases within the pig herd: Salmonella, Campylobacter, Hepatitis E, Yersinia and Toxoplasma and PRRS. Results were presented in March 2014
• BPEX continued to influence the Commission and the FSA’s proposal regarding an increased level of testing for salmonella on pig carcases, to ensure resulting domestic legislation is not overly burdensome for industry
• The ZNCP steering group welcomed a new Chair into post and updated the Terms of Reference to focus on wider food safety priorities as they arise
• BPEX invested in two incubators to allow assessments of the standard of cleansing and disinfecting on farm and in abattoirs to be made; outstanding results from one specialist pig abattoir were published on the Pigsite in January 2014
• A new bi-monthly BPEX Abattoir Newsletter was launched; the first edition was published in December 2013. It is aimed at technical managers and has been very well received by industry
• A series of workshops took place, which included the dissemination of information on biosecurity, rodent control and how the EU landscape is changing; the workshops were attended by nearly 100 producers and vets
• Other work packages include improving the BPEX Farm Tool, which helps producers to create action plans to improve salmonella control, looking at what cleaning and disinfection procedures are best against salmonella and communicating results to industry
• BPEX has also been working with international experts on salmonella, particularly focusing on what can be done in outdoor production.
continued
Research, Development and Innovation 93
The BPEX Yearbook 2013-2014
MEAT QUALITY AND SAFETY
Project: Zoonosis National Control Programme (Salmonella control in pigs)
Application to industry• Development of the online farm tool will continue to ensure a risk-based, practical and cost-effective method of controlling salmonella on farm
• Working closely with abattoirs to assess their cleaning and disinfection practices has encouraged improvements in the overall hygiene of the plants, such as knife control and lairage practices
• BPEX’s involvement in the AHVLA R8 project will ensure any outcomes are cost-effective for industry; outcomes from this four-year project will inform and provide guidance to industry on using tools to reduce salmonella prevalence.
For further information
http://www.bpex-zncp.org.uk/zncp11/home.eb
Project: The infection biology of pig-associated Salmonella
Research partner(s): University of Liverpool
Duration: 2010-2014
Aims and objectives• To characterise the behaviour of Salmonella• To characterise the immunological response of the epithelial cells upon invasion of the bacteria• To characterise any differences that might exist between the strains.
Project achievements during 2013-2014• Focus turned to determination of the phenotype of monophasic isolates of Salmonella enterica phage type DT193 and comparison of their pathogenicity during early gut colonisation to that of classical biphasic DT193 Salmonella Typhimurium isolates
• A range of mutant Salmonella with gene knockouts were created to assess the importance of these genes during invasion of porcine intestinal epithelial cells (IPEC-1 cell line)
• Comparative levels of adhesion to and invasion of, IPEC-1 cells were determined by infecting the cells for short time periods after which intra- and extracellular bacteria were fluorescently labelled with antibodies; this labelling enabled specific counts of individual bacteria to be done using a fluorescence microscope, providing a much more accurate assessment of invasive ability of the strains than with previous assays
• Use of real-time, quantitative, PCR facilitated evaluation of the physiological response of IPEC-1 cells to invading bacteria, specifically the regulation of genes encoding receptors and cytokines
• Flow cytometry was used to analyse the effect of Salmonella invasion on initiation of IPEC-1 cell death, this will provide an idea of the gut pathology that could be expected following infection with these strains in vivo
• Findings from the research were presented at the prestigious American Society of Microbiology Salmonella conference
• Results and conclusions from this research will be available during 2014.
Application to industry• Better knowledge of how monophasic and other strains of Salmonella interact with their host shouldhelp towards designing effective control measures
• With a better understanding of the host-pathogen interaction and the immune responses of pig epithelial cells to Salmonella challenge, it should be possible to create a multivalent vaccine that will better protect pigs.
For further information
http://www.bpex.org.uk/R-and-D/R-and-D/ReductionofPathogenLoad.aspx

Research, Development and Innovation94
The BPEX Yearbook 2013-2014
PRODUCTION EFFICIENCY
Project: Light Pig Syndrome: what causes it and how can it be overcome?
Research partner(s): Newcastle University
Duration: 2010-2013
Aims and objectives• To identify reasons that might contribute to delayed pig growth• To develop treatments for light pigs that will decrease the deficit in their growth.
Project achievements during 2013-2014• Data analysis showed that growth performance to slaughter was not solely reliant on birth weight (BW), with weaning weight also playing a critical role
• It was found that piglets with low birth weight (LBiW) are capable of some degree of compensatory growth, but interventions must be early in production to achieve this
• The study showed that birth to weaning average daily gain (ADG) can be increased by cross fostering LBiW piglets into litters with similar weight littermates
• Provision of supplementary milk does not benefit LBiW piglet performance but it does reduce the BW variation in mixed litters
• Feeding LBiW pigs a starter regime, which is tailored to their reduced body weight at weaning, improves performance to day 70 (with or without additional feed)
• The work suggests that feeding LBiW pigs an improved regime is more cost-effective than feeding them a standard commercial regime
• Final results and conclusions will be available during 2014.
Application to industryAppropriate treatments of light pigs that accrue benefits on their growth will have a higher chance of adoptionby the pig industry and will lead to economic, animal welfare and environmental benefits.
To date, this research has demonstrated that in practical terms:
• Early intervention is critical. Nutritional treatments at different stages of production (lactation, weaner, grower) can affect the outcomes
• Selective cross fostering of LBiW pigs can improve pre-weaning performance• Specialised diets fed at weaning can improve performance to the end of the nursery phase• Any additional weight gained as a result of treatments is likely to be retained at slaughter.
For further information
http://www.bpex.org.uk/R-and-D/R-and-D/LightPigSyndrome.aspx
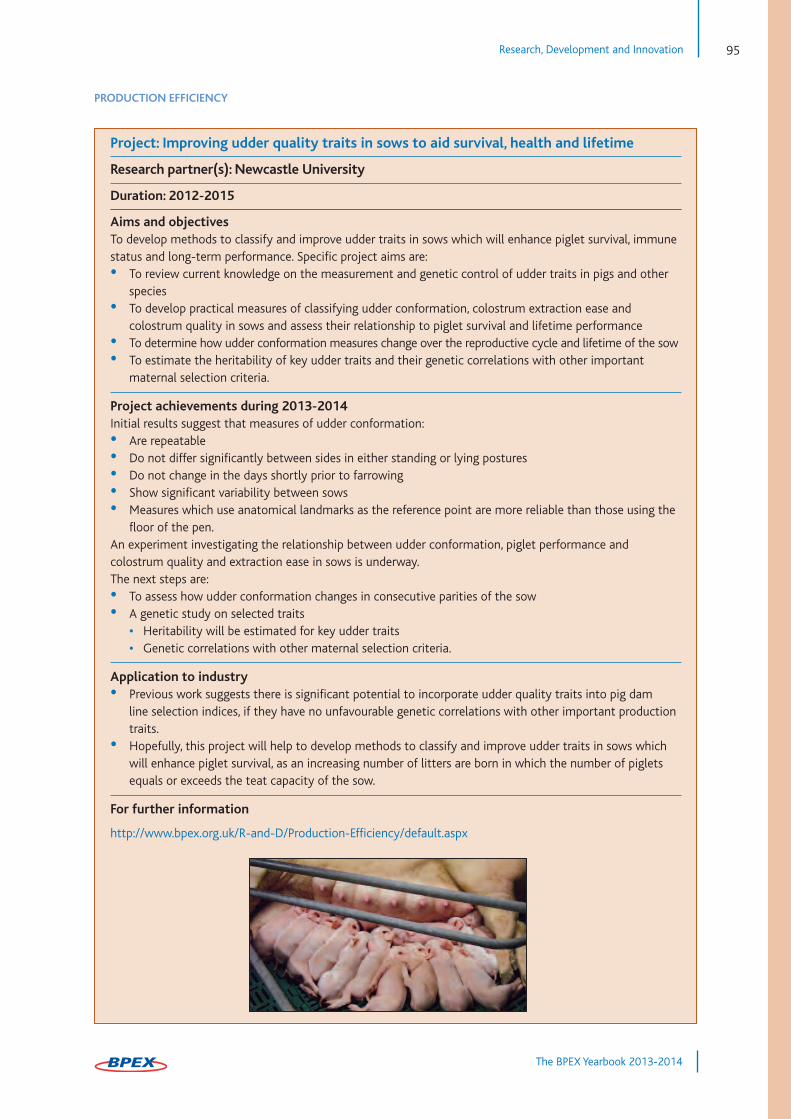
Research, Development and Innovation 95
The BPEX Yearbook 2013-2014
PRODUCTION EFFICIENCY
Project: Improving udder quality traits in sows to aid survival, health and lifetime
Research partner(s): Newcastle University
Duration: 2012-2015
Aims and objectivesTo develop methods to classify and improve udder traits in sows which will enhance piglet survival, immunestatus and long-term performance. Specific project aims are:• To review current knowledge on the measurement and genetic control of udder traits in pigs and other species
• To develop practical measures of classifying udder conformation, colostrum extraction ease and colostrum quality in sows and assess their relationship to piglet survival and lifetime performance
• To determine how udder conformation measures change over the reproductive cycle and lifetime of the sow• To estimate the heritability of key udder traits and their genetic correlations with other important maternal selection criteria.
Project achievements during 2013-2014Initial results suggest that measures of udder conformation:• Are repeatable • Do not differ significantly between sides in either standing or lying postures• Do not change in the days shortly prior to farrowing• Show significant variability between sows• Measures which use anatomical landmarks as the reference point are more reliable than those using the floor of the pen.
An experiment investigating the relationship between udder conformation, piglet performance andcolostrum quality and extraction ease in sows is underway.The next steps are:• To assess how udder conformation changes in consecutive parities of the sow• A genetic study on selected traits
• Heritability will be estimated for key udder traits • Genetic correlations with other maternal selection criteria.
Application to industry• Previous work suggests there is significant potential to incorporate udder quality traits into pig dam line selection indices, if they have no unfavourable genetic correlations with other important production traits.
• Hopefully, this project will help to develop methods to classify and improve udder traits in sows which will enhance piglet survival, as an increasing number of litters are born in which the number of piglets equals or exceeds the teat capacity of the sow.
For further information
http://www.bpex.org.uk/R-and-D/Production-Efficiency/default.aspx
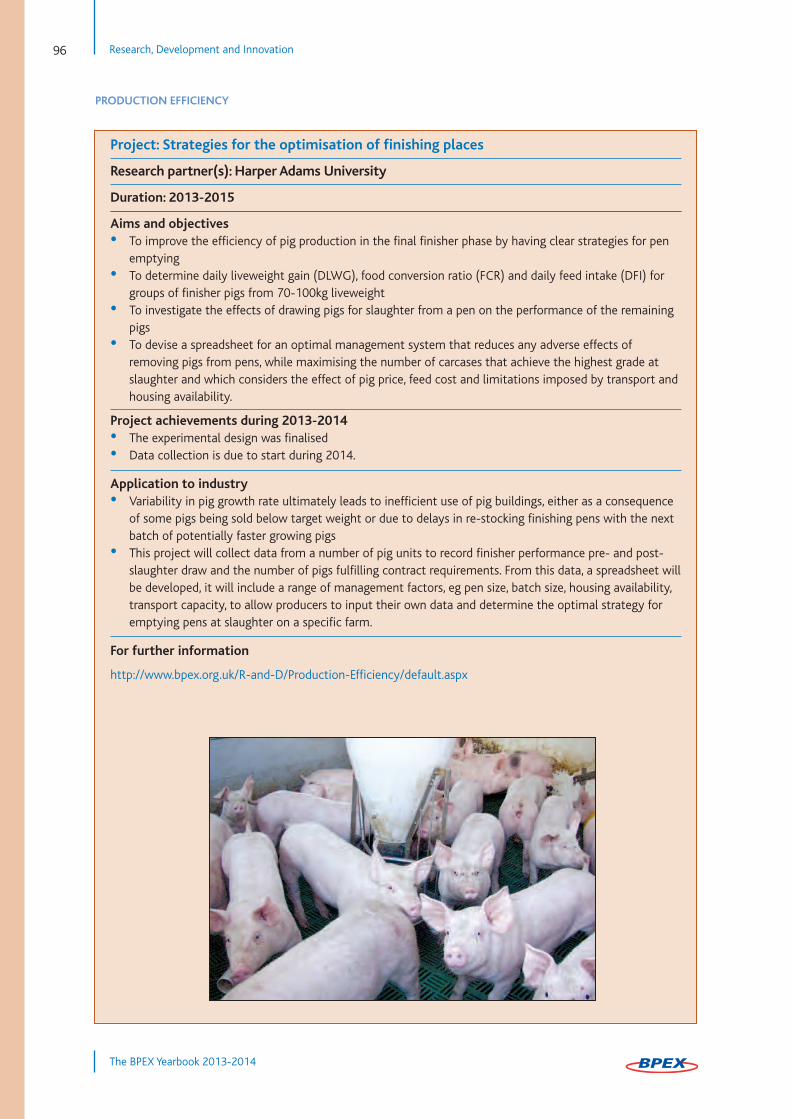
Research, Development and Innovation96
The BPEX Yearbook 2013-2014
PRODUCTION EFFICIENCY
Project: Strategies for the optimisation of finishing places
Research partner(s): Harper Adams University
Duration: 2013-2015
Aims and objectives• To improve the efficiency of pig production in the final finisher phase by having clear strategies for pen emptying
• To determine daily liveweight gain (DLWG), food conversion ratio (FCR) and daily feed intake (DFI) for groups of finisher pigs from 70-100kg liveweight
• To investigate the effects of drawing pigs for slaughter from a pen on the performance of the remaining pigs
• To devise a spreadsheet for an optimal management system that reduces any adverse effects of removing pigs from pens, while maximising the number of carcases that achieve the highest grade at slaughter and which considers the effect of pig price, feed cost and limitations imposed by transport and housing availability.
Project achievements during 2013-2014• The experimental design was finalised• Data collection is due to start during 2014.
Application to industry• Variability in pig growth rate ultimately leads to inefficient use of pig buildings, either as a consequence of some pigs being sold below target weight or due to delays in re-stocking finishing pens with the next batch of potentially faster growing pigs
• This project will collect data from a number of pig units to record finisher performance pre- and post-slaughter draw and the number of pigs fulfilling contract requirements. From this data, a spreadsheet willbe developed, it will include a range of management factors, eg pen size, batch size, housing availability, transport capacity, to allow producers to input their own data and determine the optimal strategy for emptying pens at slaughter on a specific farm.
For further information
http://www.bpex.org.uk/R-and-D/Production-Efficiency/default.aspx
97
The BPEX Yearbook 2013-2014
While the Agriculture and Horticulture Development Board, operating through its BPEX division,seeks to ensure that the information contained within this document is accurate at the time ofprinting, no warranty is given in respect thereof and, to the maximum extent permitted by law, the Agriculture and Horticulture Development Board accepts no liability for loss, damage or injury howsoever caused (including that caused by negligence) or suffered directly or indirectly in relationto information and opinions contained in or omitted from this document.
© Agriculture and Horticulture Development Board 2014.
No part of this publication may be reproduced in any material form (including by photocopying orstorage in any medium by electronic means) or any copy or adaptation stored, published or distributed (by physical, electronic or other means) without the prior permission in writing of Agriculture and Horticulture Development Board, other than by reproduction in an unmodified formfor the sole purpose of use as an information resource when the Agriculture and Horticulture Development Board is clearly acknowledged as the source or in accordance with the provisions ofthe Copyright, Designs and Patents Act 1988. All rights reserved.
978-1-904437-70-2

BPEX Agriculture and Horticulture Development BoardStoneleigh ParkKenilworthWarwickshireCV8 2TL
tel: 0247 647 8793
fax: 0247 647 8903
www.bpex.org.uk
BPEX is a division of the Agriculture and Horticulture Development Board