the blind men and the soft drinks industry in the united
TRANSCRIPT

Carrie Amani Annabi, Fatima Hassan, Islam Amer / International Journal of Industrial Distribution & Business 9-10 (2018) 21-37 21
Print ISSN: 2233-4165 / Online ISSN: 2233-5382 doi:http://dx.doi.org/10.13106/ijidb.2018.vol9.no10.21.
The Blind Men and the Soft Drinks Industry in the United Arab Emirates
Carrie Amani Annabi*, Fatima Hassan**, Islam Amer***
Received: May 22, 2018. Revised: October 01, 2018. Accepted: October 15, 2018.
Abstract
Purpose – This paper explores the contribution lean makes to service levels by addressing lean thinking application in logistics process improvement within a MNC soft drinks manufacturer situated in the United Arab Emirates, and identifies the most significant sources of wastes and their interdependence and highlights key attributes of successful lean implementation. Research design, data, and methodology - This case study examines key logistics employees’ perceptions on lean methodology. Results - The results highlight the most significant types of wastes in logistical processes and illustrates ways to eliminate wastes and streamline process flow. The importance of the human role within lean methodology is also identified. Findings suggest that managers should follow both a micro and macro approach when implementing lean practices, as focusing on one waste often leads to ignoring the significance of other wastes. Conclusions - This study highlights the importance of implementing lean at both micro and macro levels and shows how staff involvement increases the efficacy of lean thinking. It offers guidance towards the efficiency of creating value stream mapping processes in situ, which considers different wastes and their interdependence. Managers with limited resources are encouraged to implement lean methodology taking cognizance of these factors.
Keywords: Lean, United Arab Emirates (UAE), Soft Drinks Manufacturer, Human, Value Stream Mapping (VSM).
JEL Classifications: C10, M1, N15, N65.
1. Introduction
This research identified the most significant types of wastes embedded within the logistics processes of a leading soft drinks manufacturer in the United Arab Emirates (UAE) and subsequently recommended a route to eliminate these wastes. The organization, which will be referred to as ABC Drinks Company (ABCDC) for confidentiality purposes, holds a significant market share (over 70%) of the UAE’s soft drinks market and manufactures top global brands within its extensive portfolio. The organization operates from four of the UAE’s seven federal states, has eight warehouses in country and its main plant has four production lines, which yield more than 50 Million cases annually.
ABCDC implemented some lean initiatives within its operations. The most important lean application in “order to
* Faculty of Logistics and Supply Chain Management, SoSS.
Heriot-Watt University. Dubai, UAE. E-mail: [email protected]
** Associate Faculty of Logistics and Supply Chain Management,
SoSS. Heriot-Watt University. Dubai, UAE.
*** Department of Logistics and Supply Chain Management, SoSS.
Heriot-Watt University. Dubai, UAE
load” process has been discussed in detail in this case study. Through this initiative, ABCDC reduced Customer Representative (CR) throughput time by 52% after tracking the process using Value Stream Mapping (VSM). However since this VSM only looked at “waiting time” as a potential waste, it is advocated that further value-added activities should be considered in parallel, thereby optimizing waste reduction through considering the inter-relational connectivity of waste processes.
Andersson, Eriksson, and Torstensson (2006) presented an impressive analogy of the different perspectives of quality management and alluded to John Godfrey Saxe’s 19th Century poem “The Blind Men and the Elephant” where six blind men were placed beside an elephant and asked to describe by touch alone. Each man gave a different description of the elephant, depending upon the part he touched. For instance, the first blind man stated that elephant looked like a wall, while another said the elephant resembled a snake. Certainly those were not the real descriptions of the elephant, but each one created his own vision based upon the part he touched. In parallel to the message from Anderson et al. (2006), many researchers

Carrie Amani Annabi, Fatima Hassan, Islam Amer / International Journal of Industrial Distribution & Business 9-10 (2018) 21-3722
have described quality management in similar ways, with each variation and description only encompassing the components which they encountered. These components included lean, six sigma and Total Quality Management (TQM). As a result, there are few studies which have developed a comprehensive review of the multidimensional elements which authors have disaggregated into QM themes. Findings from this study also identified the fact that interviewees held fairly disparate views of what lean processes were, how they should be applied, and to what affect.
2. Theoretical Background:
2.1. Quality Management Approaches
Manufacturing companies are facing increasing challenges due to the intense global competition and market saturation (Resta, Powell, Gaiardelli, & Dotti, 2015). Customer needs and expectations become more complicated where “value” no longer lies in the product itself, but how the product is presented to the customer, or what the product additionally unleashes for the customer (Mont, 2002). Brown and Bessant (2003) viewed the manufacturing landscape as one that was typified by increasing competition, which demands flexibility, delivery, speed and innovation. Therefore, producing high quality products within a reasonable cost frame does not guarantee competitive advantage (Christopher, 2011).
Manufacturing organizations tend to adopt strategies that divert from product orientation to product services domain. This phenomenon is what Oliva and Kallenberg (2003) termed the servitization of manufacturing. However often adding value results in increased costs and reduced profit (Folinas, Aidonis, Triantafillou, & Malindretosb, 2013). In order to resolve the dilemma of adding value to product- service outputs with decreasing internal cost, companies tend to implement quality management approaches.
Lean, six sigma and TQM are the most common quality management concepts used in logistics processes improvement. Lean procedures came to light in the 1950’s from the Toyota Production System (TPS) and was introduced in literature by Womack, Jones, and Roos (1990) in their famous book “The Machine That Changed the World”.
Six sigma is seen as a data driven practice used for providing continuous improvement, focusing on reducing process variation or defects from either products or services (Breyfogle, 2003; Dahlgaard & Park, 2006; Antony, 2006; Kumar, 2014).
TQM emerged around 1980 as another quality management technique (Dean & Bowen, 1994). TQM as a philosophy ensures an integrated, reliable, comprehensive
and continuous improvement within an organization, involving everyone (Ho, 1997; Hellsten & Klefsjo, 2000). The different phases of lean evolution are depicted in Table 1.
<Table 1> The four stages of lean concept
PhaseTime
horizonDescription
The
“pre-concept”
awareness stage
1980 -
1989
Piecemeal representation of empirical
studies of some lean tools used in
automotive industry
The conceptual
development
1990 -
1994
Introducing lean production system
(waste elimination) with small focus
on factory floor micro level
concept of a
“lean enterprise"
After
1994
Presents wider spectrum of
implementation (macro-level),
emerging of lean logistics, lean
supply
“lean
consumption”
concept
After
2005
Provide a holistic view focuses on
customer needs
2.2. Lean Management
Lean management has evolved from a manufacturing process into a dominant managerial methodology, broadly recognized as optimizing overall company performance through eliminating process wastes and focuses on adding value (Sánchez & Pérez, 2001; Hoss & Caten, 2013; Jylha & Junnila, 2013). The seven forms of wastes are: overproduction, inventory, waiting, over-processing, transport, motion and defect (Womack et al., 1990; Slack, Chamber, & Johnston, 2010; Abdul Wahab, Mukhtar, & Sulaiman, 2013; Andrea, 2013; Folinas et al., 2013; Liu, Leat, Moizer, Megicks, & Kasturiratne, 2013; De Souza & Carpinetti, 2014).
The key objective of lean philosophy is to optimize productivity through elimination of process wastes and focus on value-added activities (Slack et al., 2010). Waste in lean philosophy is defined as any activity that absorbs resources and does not add value to the internal or external customer (Mehrsai, Thoben, & Scholz-Reiter, 2013; Womack & Jones, 1996).
Emiliani (1998) referred to other wastes, called “behavioural wastes” or “fat behaviours”. Lean behaviour is identical to lean production which can be defined as the behaviours of employees that add value. Fat behaviours, i.e. those bahaviour which do not add value, should be eliminated. This was seen as one of the most significant barriers to efficient lean implementation.
Lean manufacturing is not an isolated shop-floor approach within an organization, rather it is a holistic attitude that combines several functions and potentially several organizations, (suppliers and dealers), in one supply network (Jones, Hines, & Rich, 1997).
Lean logistics can be considered as the other side of the coin to lean philosophy and Womack et al. (1990)

Carrie Amani Annabi, Fatima Hassan, Islam Amer / International Journal of Industrial Distribution & Business 9-10 (2018) 21-37 23
Overproduction
Produce more than needed at the moment. Womack et al. (1990); Sánchez and Pérez
(2001); Kilpatrick (2003); Goldsby and
Martichenko (2005); Laureani and Antony
(2010); Slack et al. (2010); Abdul Wahab
et al. (2013); Liu et al. (2013);
De Souza and Carpinetti (2014).
Build first, wait for orders later.
Exploit economy of scale.
Large warehouses of finished goods.
Bulk packages of services.
Waiting
Process interruption.
Womack et al. (1990); Sánchez and Pérez
(2001); Kilpatrick (2003); Goldsby and
Martichenko (2005); Laureani and Antony
(2010); Slack et al. (2010); Abdul Wahab
et al. (2013); Liu et al. (2013);
De Souza and Carpinetti (2014).
Unpredicted events.
Waiting for supervisor’s approval, Waiting for client’s approval, Waiting for
information from the previous processes, Waiting for equipment
maintenance, Waiting for report preparation.
Bad management of bottlenecks, people being interrupted while doing value
adding activities.
Waiting for trucks loading or offloading.
Lack of material, tools or information at production processes.
Transportation
Inadequate layouts. Womack et al. (1990); Sánchez and Pérez
(2001); Kilpatrick (2003); Goldsby and
Martichenko (2005); Laureani and Antony
(2010); Slack, et al. (2010), Abdul Wahab
et al. (2013); Liu et al. (2013),
De Souza and Carpinetti (2014).
Producing large quantity of parts.
Transportation of documents Transportation of information via email Report
distribution Paper transportation to get people signature.
Out-of-route stops, excessive backhaul.
Double handling.
recognized that the effective management of inbound and outbound supplies was crucial to lean production. Hines, Holweg, and Rich (2004) defined the lean supply chain as both an operational and strategic practice that promoted continuous improvement throughout the supply network partners. There is a broad convergence between lean production and logistics management and examples of lean methodology are found in the supply chain (Holweg, 2005; Piercy & Rich, 2009). The benefits of lean revolve around several themes including the reduction of raw materials (RM), work in progress (WIP) and finished goods (FG) inventories, value creation in products and processes, enhanced customer service, streamlined internal processes through elimination of non-value added activities (e.g. Abdi, Shavarini, & Hoseini, 2006; Ehrich, 2006; Agus & Hajinoor, 2012; Shamah, 2013; Atkinson, 2004) .
Goldsby and Martichenko (2005) embraced the TPS waste model in logistics and included other types of wastes such as “space and facility”. They argued that space utilization was an insufficient indicator for measuring efficiency and therefore other metrics should be considered, such as the duration of stored items and number of touches (handling). They further proposed “packaging” as potential logistics waste and exampled where packaging materials were over-used or alternatively failed to protect the products.
Rawabdeh (2005) provided a waste relationship matrix that indicated the inter-relationships within the seven types of wastes. For example, each type of waste has an impact on the other types and in “over-production” where an organization produces more than it needs results in inventory accumulation, increased transportation and
elongated waiting times between each product batch. The wastes relationship matrix showed that the most commonly affected waste was “inventory”, while “over-production” and “defect” wastes had the highest impact on the other waste types.
De Souza and Carpinetti (2014) also produced a conceptual model of waste identification and prioritization which employed a failure mood and effect analysis (FMEA) technique. The three most common types of FMEAs are: System FMEAs, Design FMEAs and Process FMEA. Within System FMEA the functions and relationships are unique to the higher-level system, which is seen as an over-arching entity. Often human interactions and service provision are treated separately (Carlson, 2012).
Researchers have suggested that the identification of the seven types of wastes should be done from dual perspectives; at the micro-level which indicates the wastes elimination within a company and at the macro-level which indicates the wastes elimination along the supply chain network (e.g. Liu et al., 2013; Rawabdeh, 2005; Goldsby & Martichenko, 2005).
Despite the proliferation of lean deployment in logistics compared with other management approaches, there are still limited academic papers that describe the implementation of the lean thinking in process improvement in logistics processes. This research aims to address that area through inspecting lean application in logistics process improvement at ABCDC.
Different types of logistics wastes introduced in the literature are summarized in Table 2.
<Table 2> Types of Wastes

Carrie Amani Annabi, Fatima Hassan, Islam Amer / International Journal of Industrial Distribution & Business 9-10 (2018) 21-3724
Motion
Lack of standard procedures can lead to excessive motion of people.
Womack et al. (1990); Sánchez and Pérez
(2001); Kilpatrick (2003); Laureani and
Antony (2010); Slack et al. (2010); Abdul
Wahab et al. (2013); Liu et al. (2013);
De Souza and Carpinetti (2014).
Excess of movements to reach objects, supplies and tools
Motion between offices, motion inside offices, motion between two
subsequent activities.
Displacement to unnecessary meetings in other places.
Motion in order to print documents, motion in order to use fax machine.
Bad workstation organization.
Search for lost objects, supplies and tools.
Inventory
Excess of in-process inventory. Womack et al. (1990); Sánchez and Pérez
(2001); Kilpatrick (2003); Goldsby and
Martichenko (2005); Laureani and Antony
(2010); Slack et al. (2010); Abdul Wahab
et al. (2013); Liu et al. (2013); De Souza
and Carpinetti (2014).
Difficulty and inefficiency in dealing with demand fluctuation.
Boxes full of documents and paper. Email inboxes full of unread emails.
Resources wasted to control information stuck between processes.
Transportation only when large lot sizes are complete.
Space and
Facilities
Inefficient storage layout.
Goldsby and Martichenko (2005);
De Souza and Carpinetti (2014).
Using inadequate handling equipment.
Stock aging.
Un-organized workplace and warehouses.
Having unutilized facilities due to seasonality.
Less than truck load.
Hidden cost of owned facilities.
Defect
Lack of training. Information missing.
Womack et al. (1990); Sánchez and Pérez
(2001); Kilpatrick (2003); Laureani and
Antony (2010); Slack et al. (2010); Abdul
Wahab et al. (2013); Liu et al. (2013);
De Souza and Carpinetti (2014).
Defective raw material Inadequate production processes.
Processing information with defects.
Mistakes in designs, products or services.
Wrong receipt of shipment at distribution center.
Inventory discrepancies, wrong picking, wrong billing.
Talent
Lack of time for improvement actions.
Goldsby and Martichenko (2005);
Piercy and Rich (2009); Abdul Wahab et
al. (2013); De Souza and Carpinetti (2014).
Limited autonomy for people when dealing with basic issues.
Underestimated potential of people.
Ineffective knowledge sharing.
Lack of supplier involvement or client involvement when necessary.
Bad resource and people management.
Packaging
Disposable containers and pallets.
Goldsby and Martichenko (2005). Inappropriate packaging.
Packaging abuse.
Behavioral
wastes
Self-imposed barriers, Interpretations.
Emiliani (1998).Unnecessary commentary, Irrelevant observations.
Sarcasm, Gossip, Criticism.
Over-
processing
Production of parts with quality level above specification. Womack et al. (1990); Sánchez and Pérez
(2001); Kilpatrick (2003); Laureani and
Antony (2010); Slack et al. (2010); Abdul
Wahab et al. (2013); Liu et al. (2013);
De Souza and Carpinetti (2014).
Use of more resources than the necessary.
Use of inadequate tools.
Bad use of resources while conducting routine activities Lack of
standardization of routine activities.
Communication
Lack or difficulty of communication among people involved in process flow.
Goldsby and Martichenko (2005);
De Souza and Carpinetti (2014).
Generating extra copies of documents.
Generalization of flows, treating all kinds of information in the same way.
Excess of departmentalization, lack of organizational structure oriented by
processes flows.
Excess of
installed
capacity
Installed capacity to absorb peak demand, which become unused in normal
demand periods.
Goldsby and Martichenko (2005);
De Souza and Carpinetti (2014).
Carrie Amani Annabi, Fatima Hassan, Islam Amer / International Journal of Industrial Distribution & Business 9-10 (2018) 21-37 25
2.3. Lean practices and tools.
2.3.1. Lean practices.
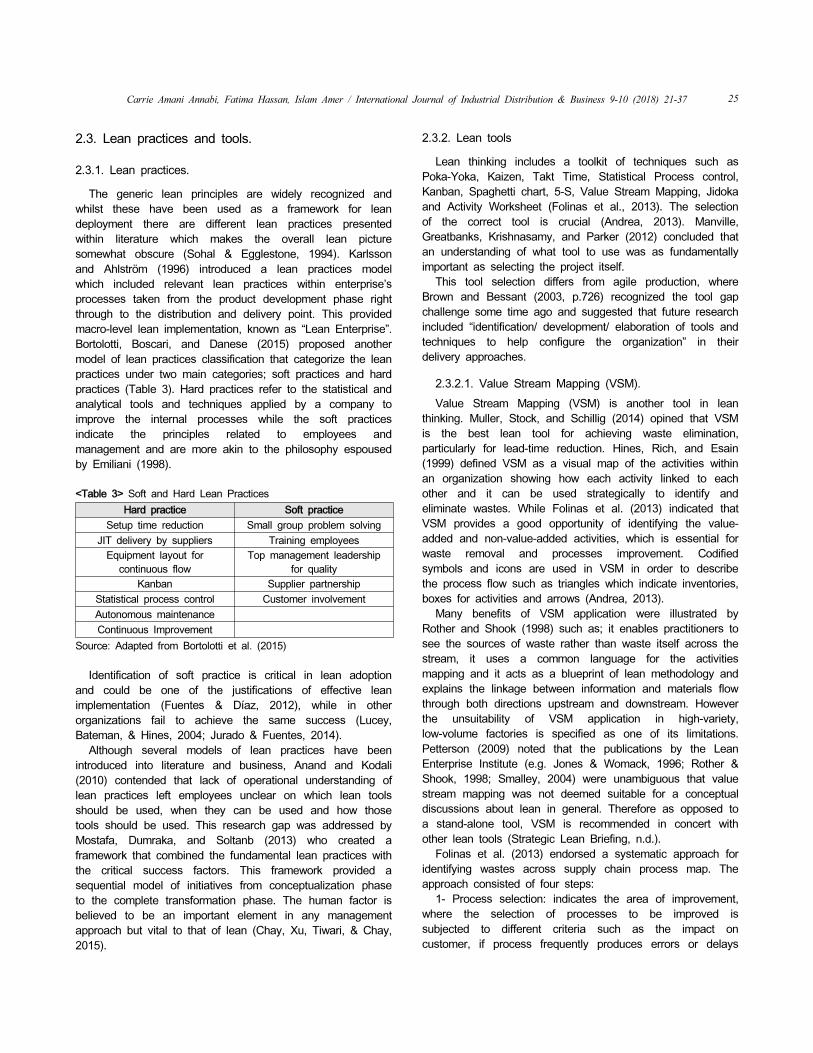
The generic lean principles are widely recognized and whilst these have been used as a framework for lean deployment there are different lean practices presented within literature which makes the overall lean picture somewhat obscure (Sohal & Egglestone, 1994). Karlsson and Ahlström (1996) introduced a lean practices model which included relevant lean practices within enterprise’s processes taken from the product development phase right through to the distribution and delivery point. This provided macro-level lean implementation, known as “Lean Enterprise”. Bortolotti, Boscari, and Danese (2015) proposed another model of lean practices classification that categorize the lean practices under two main categories; soft practices and hard practices (Table 3). Hard practices refer to the statistical and analytical tools and techniques applied by a company to improve the internal processes while the soft practices indicate the principles related to employees and management and are more akin to the philosophy espoused by Emiliani (1998).
<Table 3> Soft and Hard Lean Practices
Hard practice Soft practice
Setup time reduction Small group problem solving
JIT delivery by suppliers Training employees
Equipment layout for
continuous flow
Top management leadership
for quality
Kanban Supplier partnership
Statistical process control Customer involvement
Autonomous maintenance
Continuous Improvement
Source: Adapted from Bortolotti et al. (2015)
Identification of soft practice is critical in lean adoption and could be one of the justifications of effective lean implementation (Fuentes & Díaz, 2012), while in other organizations fail to achieve the same success (Lucey, Bateman, & Hines, 2004; Jurado & Fuentes, 2014).
Although several models of lean practices have been introduced into literature and business, Anand and Kodali (2010) contended that lack of operational understanding of lean practices left employees unclear on which lean tools should be used, when they can be used and how those tools should be used. This research gap was addressed by Mostafa, Dumraka, and Soltanb (2013) who created a framework that combined the fundamental lean practices with the critical success factors. This framework provided a sequential model of initiatives from conceptualization phase to the complete transformation phase. The human factor is believed to be an important element in any management approach but vital to that of lean (Chay, Xu, Tiwari, & Chay, 2015).
2.3.2. Lean tools
Lean thinking includes a toolkit of techniques such as Poka-Yoka, Kaizen, Takt Time, Statistical Process control, Kanban, Spaghetti chart, 5-S, Value Stream Mapping, Jidoka and Activity Worksheet (Folinas et al., 2013). The selection of the correct tool is crucial (Andrea, 2013). Manville, Greatbanks, Krishnasamy, and Parker (2012) concluded that an understanding of what tool to use was as fundamentally important as selecting the project itself.
This tool selection differs from agile production, where Brown and Bessant (2003, p.726) recognized the tool gap challenge some time ago and suggested that future research included “identification/ development/ elaboration of tools and techniques to help configure the organization” in their delivery approaches.
2.3.2.1. Value Stream Mapping (VSM).
Value Stream Mapping (VSM) is another tool in lean thinking. Muller, Stock, and Schillig (2014) opined that VSM is the best lean tool for achieving waste elimination, particularly for lead-time reduction. Hines, Rich, and Esain (1999) defined VSM as a visual map of the activities within an organization showing how each activity linked to each other and it can be used strategically to identify and eliminate wastes. While Folinas et al. (2013) indicated that VSM provides a good opportunity of identifying the value- added and non-value-added activities, which is essential for waste removal and processes improvement. Codified symbols and icons are used in VSM in order to describe the process flow such as triangles which indicate inventories, boxes for activities and arrows (Andrea, 2013).
Many benefits of VSM application were illustrated by Rother and Shook (1998) such as; it enables practitioners to see the sources of waste rather than waste itself across the stream, it uses a common language for the activities mapping and it acts as a blueprint of lean methodology and explains the linkage between information and materials flow through both directions upstream and downstream. However the unsuitability of VSM application in high-variety, low-volume factories is specified as one of its limitations. Petterson (2009) noted that the publications by the Lean Enterprise Institute (e.g. Jones & Womack, 1996; Rother & Shook, 1998; Smalley, 2004) were unambiguous that value stream mapping was not deemed suitable for a conceptual discussions about lean in general. Therefore as opposed to a stand-alone tool, VSM is recommended in concert with other lean tools (Strategic Lean Briefing, n.d.).
Folinas et al. (2013) endorsed a systematic approach for identifying wastes across supply chain process map. The approach consisted of four steps:
1- Process selection: indicates the area of improvement, where the selection of processes to be improved is subjected to different criteria such as the impact on customer, if process frequently produces errors or delays

Carrie Amani Annabi, Fatima Hassan, Islam Amer / International Journal of Industrial Distribution & Business 9-10 (2018) 21-3726
and/or existence of bottlenecks. 2- Developing the current state map: In this step data,
such as activities, material and information flow and directions, cycle time, process time, change over time should be inserted (Sundar, Balaji, & SatheeshKumar, 2014). Braglia (2009) noted that sometimes there is a difference between what is recorded in the map and the actual variability of the process: Variability must be observed and analyzed carefully.
3- Development of the future state map: The future state map is considered as the starting point in the improvement plan. Rother and Shook (1998) suggested writing the improvement ideas on the current state map which may include; the desired time, existing bottlenecks, existing types of wastes, process re-engineering ideas and the resources required for improvement, then draw the future state map. Abdulmalek and Rajgopal (2007) reasoned that a simulation model can be used to contrast “before” and “after” (or current and future state) scenarios to show managers the key benefits of VSM.
4- Development of the value stream plan: This calls for designing the suggested improvement actions aimed for within the future state map by formulating an action plan or an improvement project which may include project description, project manager, objectives, and timeframes, such actions are mainly for eliminating non-value-added activities (muda) (Folinas et al., 2013).
VSM has a proven efficiency in waste elimination particularly throughput time reduction and productivity enhancement in different industries (Andrea, 2013). Gurumurthy and Kodali (2011) inspected the applications of VSM which have been included in literature and attested its success within a diversity of industries in both manufacturing and service sectors. Moreover it has been used in pure services processes improvement such as leadership and behaviours identification and enhancing flow of patients in a hospital. Equally mapping processes are advocated within mass-customization to increase plant-specific production strategies (Brown & Bessant, 2003).
2.4. Criticism.
The lack of clear perspective on quality management is a significant drawback (Boaden, 1997). Jones et al. (1997) indicated that the quality management approaches adopted by organizations to improve their supply chain processes during last 15 years included tools such as TQM, Material Requirement Planning (MRP), strategic purchasing and Business Process Re-engineering (BPR). However the authors believed that these were only partial solutions. Waters (2003) articulated the view that system complexity and inflexibility are shortfalls of MRP whereas Jones et al. (1997) highlighted that BRP is synonymous with headcount reduction as opposed to process improvement. Organizations endeavor to go beyond limited approaches in search of comprehensive management concepts and often the drive for
cost cutting calls for radical manpower downsizing alongside the implementation of other tools.
There have been several issues raised in literature on the adoption of lean methodology (e.g. Lawson, 2001; Smart, Transfield, Deasley, Levene, Rowe, & Corley, 2003; Hines et al., 2004; Holweg, 2005; Gibbons, Burgess, Godfrey, & Kennedy, 2012). Smart et al. (2003) and Holweg (2005) highlighted some concerns regarding the applicability of lean thinking in volatile markets characterized by unpredicted demand and unstable markets. This concurs with Lawson (2001) who presented an example of General Motors (GM) problem when it lost 2.2 Billion dollars (loss of sales) because 29 of its assembly plants stopped production due to their full dependence on North-America operations which experienced a workforce strike. Another criticism was raised by Hines et al. (2004) who indicated the negligence of human factor and the narrow spectrum of shop-floor lean production. Whilst Gibbons et al. (2012) commented on the knock-on effect that lean approaches had within Japan where the JIT deliveries had increased road traffic exponentially. Further to this, several multinational corporations (MNCs) have faced challenges over transferring lean knowledge across manufacturing units in recent years (Boscari, Danese, & Romano, 2016).
3. Research Methodology.
3.1. The use of the case study method
This study employed a focused qualitative case study as this is recommended where research is exploratory (Voss, Tsikriksis, & Frohlich, 2002). This approach is considered appropriate when theory is being developed (Meredith & Samson, 2001; Butler, Sweeney, & Crundwell, 2009) and is deemed useful for deciphering meaning from how and why questions (Yin, 1994). To optimize theory building, research should have a scaffold consisting of a conceptual framework (Rudestam & Newton, 1992; Miles & Huberman, 1994). Herein, the conceptual framework designed hinged upon three enquiries into the interdependent lean or waste activities within the ABCDC organization:
(1) What were the most significant sources of wastes that were embedded within the logistics processes at ABCDC?
(2) How could lean help in eliminate those logistics process wastes?
(3) What was deemed to be the key attributes of successful lean implementation?
This research adopts semi-structured interview with twelve interviewees in ABCDC from managerial and supervisory level in logistics department from three locations across the UAE (Dubai, Sharjah and Dibba warehouses). These questions were crafted having taken cognizance of the

Carrie Amani Annabi, Fatima Hassan, Islam Amer / International Journal of Industrial Distribution & Business 9-10 (2018) 21-37 27
Research objectives Interview sections Research themes Research key questions
1. To identify the
different types of
wastes embedded
in logistics
operations within
ABCDC.
1- Logistics wastes
1.1. The most significant types of
wastes in logistics operation.
1. Indicate the significance of each type of waste using
Likert scale.
1.2. Wastes interrelationships.
2. What are the top three types of wastes have the
highest impact on the other types?
3. What are the top three types of wastes most
commonly affected by other types?
relevant findings of previous research detailed in the literature review. For example, the wastes were elaborated from the traditional seven to 12 wastes to include things like talent waste, communication waste and behavioural waste. These 12 categories of waste were listed and offered suitable descriptions generated to provide an in-context example. Also Rawabdeh (2005) had noted the waste relationship matrix where each type of waste had an effect on other types of waste. This generated the question asking interviewees to indicate the top three wastes and the affect these were perceived to have on the other wastes.
3.2. Case selection
An in-depth case study of ABCDC was considered to be of research interest because it is an example of one of the market leaders within the international soft drinks industry who also has market dominance within the UAE with over 70% of the market share. This case study offers an evaluation of lean practices within its facilities in the UAE with data were gathered through interviews. A single case study was recommended focusing on ABCDC as it allowed a close observation and in-depth understanding of lean thinking in logistics processes improvement for a leading soft drinks manufacturer operating in the UAE. Case study is deemed appropriate (Butler et al., 2009) and can even provide competitive advantage (Paiva, Roth, & Fensterseifer, 2008). For example exploiting knowledge on waste minimization could possibly lead to further muda elimination.
3.3. Research protocol and data collection
The main sources of qualitative data were the semi-structured interviews held with 12 relevant employees of ABCDC from managerial and the supervisory level in the logistics department from three main locations (Dubai, Sharjah and Dibba warehouses). The sample was purposively selected by the researchers as is a common technique in qualitative research based on case study. This research adopts semi-structured interview.
The research protocol also included the collection of the some of ABCDC’s performance data and a review of relevant archived company documentation. The archived data that was analyzed included the Current State Map taken during a recent VSM exercise. Some numerical data was presented to interviewees in order to help them find
evidence to support their answers. However that data was interpreted qualitatively.
3.4. Data type
Interview is one of the most powerful data collection technique used in qualitative researches as it allows researcher to gather reliable and valid data and provides in-depth understanding of the context being researched (Stokes & Bergin, 2006; Fontana & Frey, 1994). The primary data was gathered through face-to-face semi-structured interviews, designed to construct detailed information and perceptions on different types of wastes in logistics operation, and the role of lean thinking in eliminating such wastes. The questionnaire pro-forma integrated key themes from the literature review on the wastes and lean management approaches. The secondary data used in this research were collected from two main sources:
A) Academic literature: which includes scientific articles, books, conference papers, white papers and websites.
B) Company information: includes the general overview of ABCDC accessed through company website and the company documents, such as reports, layouts and process maps.
Integration between literature review, research themes and interview’s questions enhances research integrity and validity (Myers & Newman, 2007).
3.5. Interview pro-forma design
Interview questions were linked with three research themes. The first section targeted the identification of logistics wastes from ABCDC’s personnel perspective using a five point Likert scale, thus providing scope for neutral or undecided options. LaMarca (2011) defined Likert scale as an ordinal psychometric measurement of people’s perception or attitude towards multiple statements, in which respondent indicates the degree of agreement or disagreement through multiple choices or options. The second section focused on lean application in logistics processes within ABCDC either as a structured project or as individual initiatives. While the third section covered the key attributes of the successful implementation of lean. These are depicted in Table 4.
<Table 4> Interview sections and questions

Carrie Amani Annabi, Fatima Hassan, Islam Amer / International Journal of Industrial Distribution & Business 9-10 (2018) 21-3728
2. To assess the
application of
lean thinking for
improvement of
logistics
processes within
ABCDC.
2- Lean initiatives.
2.1. Quality management
approaches and lean
awareness.
4. Which quality management approach is most
commonly used in logistics processes improvement?
5. Which area in logistics where lean is most commonly
used?
2.2. Lean Initiatives
6. Would you indicate your experience of lean
implementation either as a structured project or as
an individual initiative?
3- Key attributes of
successful lean
implementation
3.1. Critical to success.
8. What are the main barriers to the successful
implementation of lean in a company?
9. What are the main successful factors of lean
implementation in a company?
3.2. Lean practices and
behaviors.
10. Which behavior/s you perceive need to be acquired
by employee, and which behavior/s need to be
avoided?
11. Did you notice any changes in employee’s behavior
before and after lean implementation? Can you give
examples?
3.6. Data analysis
The data (including company information such as reports, layouts and process maps) was analyzed using different qualitative analysis techniques such as summarizing, which means condensation of meaning, grouping or categorization of meaning and structuring of meaning using narrative way (Saunders, Lewis, & Thornhill, 2009). Some numerical data provided by interviewees were analyzed using Microsoft Excel. Furthermore, a simple frequency analysis was included to analyze and present interviewees’ perception on the significance of different types of waste in logistics. The weighted average of interviewees’ votes was calculated to rank the most significant types of wastes. Charts and graphs describe and summarize the research findings.
3.7. Research ethics
All ethical aspects were considered during the research. The researchers received authorization from ABCDC management before conducting the interviews and collecting data.
4. Research findings
4.1. Logistics wastes.
4.1.1. The most significant types of wastes in logistics.
The interviewees were asked to indicate the significance of logistics wastes which listed in the table created by the researchers based on literature in term of the impact on customer satisfaction and overall business using a Likert scale. The results are shown in Table 5.
Overall, the interviewees’ perception of types of wastes indicated that 48 votes, (33% of the total votes), tended to believe that these were “extremely significant”, while 69 votes, (48% of the total votes), tended towards “very significant”, 23 votes, (16% of the total votes) noted they were “quite significant” and only 4 votes (3% of the total votes) thought them to be “somewhat significant”.
By considering extremely significant and very significant as “significant” and also considering somewhat significant and not significant as “not significant”, it is evident that most of interviewees perceived logistics waste as “significant” with 81% votes, while only 3% of the votes tended towards “not significant”.
<Table 5> Interviewees Perception about the Significance of
Logistics Wastes
Types of wastesExtremely
significant
Very
significant
Quite
significant
Somewhat
significant
Not
significant
Overproduction 5 5 0 2 0
Waiting 2 8 2 0 0
Inventory 1 10 1 0 0
Transportation 4 8 0 0 0
Motion 0 4 8 0 0
Talent 7 5 0 0 0
Defect 5 7 0 0 0
Packaging 0 5 5 2 0
Over-processing 5 5 2 0 0
Communication 8 4 0 0 0
Behavioral wastes 6 3 3 0 0
Space & Facilities 5 5 2 0 0
Total 48 69 23 4 0

Carrie Amani Annabi, Fatima Hassan, Islam Amer / International Journal of Industrial Distribution & Business 9-10 (2018) 21-37 29
<Table 6> Weighted Average of Logistics Wastes
Types of wastesExtremely
significantVery significant Quite significant
Somewhat
significantNot significant
Weighted
average
Overproduction 5 5 0 2 0 4.1
Waiting 2 8 2 0 0 4.0
Inventory 1 10 1 0 0 4.0
Transportation 4 8 0 0 0 4.3
Motion 0 4 8 0 0 3.3
Talent 7 5 0 0 0 4.6
Defect 5 7 0 0 0 4.4
Packaging 0 5 5 2 0 3.3
Over-processing 5 5 2 0 0 4.3
Communication 8 4 0 0 0 4.7
Behavioural wastes 6 3 3 0 0 4.3
Space and Facilities 5 5 2 0 0 4.3
In order to investigate the significance of each type of logistics wastes individually and rank them based on the overall significance according to interviewees’ perception, the researchers calculated the weighted average of each type considering the weight of each answer as following:
Extremely significant (first choice) was given score 5 (W1), very significant was given score 4 (W2), quite significant was given score 3 (W3), somewhat significant was given score 2 (W4), while not significant was given score 1 (W5).
Accordingly the weighted average of a particular type can be calculated according to this equation:
V1W1 + V2W2 + V3W3 + V4W4 + V5W5 Total number of votes
(V = number of votes)
Consequently, Table 6 shows the number of votes given to each type of wastes as well as the overall weighted average according to the equation.
Inept Communication and misuse of the talent of employees were indicated as the most significant type of wastes. Interviewees were asked to add any other type of wastes embedded in logistics operation but the interviewees did not add anything further to this list.
4.1.2. Wastes interrelationship.
Another theme explored was “waste interrelationship”. Firstly, ABCDC staff were asked to identify the top three types of wastes from their own perspectives, which had the highest impact on the other types. The results are shown in Table 7. These were seen to be over-production, waiting and over-processing.
<Table 7> The types of wastes that have the most impact on
other types of wastes
Types of wastes Voters
Overproduction 14
Waiting 4
Over-processing 4
Inventory 2
Transportation 2
Talent 2
Defect 2
Communication 2
Behavioural wastes 2
Space and Facilities 2
Another question asked to rate the top three types of wastes which are most likely affected by other types. The results shown in Table 8.
<Table 8> Types of wastes mostly likely to be effected by other
types of wastes
Types of wastes Voters
Inventory 9
Space and Facilities 9
Waiting 4
Transportation 4
Motion 2
Talent 2
Defect 2
Packaging 2
Over-processing 2
Overproduction 0
Communication 0
Behavioural wastes 0

Carrie Amani Annabi, Fatima Hassan, Islam Amer / International Journal of Industrial Distribution & Business 9-10 (2018) 21-3730
As illustrated in Table 8 Inventory, Space and facilities, waiting and transportation were indicated as the most prevalent types of waste which are mostly affected by other types.
4.2. Lean application in logistics
The second section of the interview covered two research themes; awareness of lean, and lean initiatives in logistics within ABCDC. To understand the quality management approaches awareness, interviewees were asked to name any quality management approach they believed would optimize logistics processes. To further explore the awareness of the quality management approaches, interviewees were asked to identify the areas in logistics where lean is used.
4.2.1. Quality management awareness
The interviewees failed to express a view on quality management approaches. This uncertainty had been highlighted previously by Andersson et al. (2006). However, all interviewees indicated lean was the most common approach used in logistics processes improvement, while three interviewees referred to both six sigma and 5Ss. One interviewee considered efficient supply chain management as an improvement approach. The results are represented by a frequency chart in Figure 1.
<Figure 1> Logistics areas where lean is commonly used
4.2.2. Lean initiatives
One of the research objectives was to identify the application of lean in logistics within ABCDC, whether this lean process had come about through a structured project or as individual initiatives based on interviewees’ experience. A summary of different lean initiatives reported by interviewees is presented in Table 9.
An important application of lean principals was to the company’s “order-to-load” process which took place in 2015. ABCDC’s warehouses operated two shifts for almost 20 hours in order to meet the demand of all sales channels. All loading orders are picked and loaded at night to enable CRs to start sale and delivery early morning. Of these journeys, some trucks return during the day to fulfil additional orders, this process is called second trip “order-to-load” (Figure 2).
<Figure 2> The description of Order to Load Process

Carrie Amani Annabi, Fatima Hassan, Islam Amer / International Journal of Industrial Distribution & Business 9-10 (2018) 21-37 31
As part of the continuous improvement program adopted by the logistics department via regular performance review, a cross functional team was formulated to identify the sources of wastes in this process and propose a VSM lean thinking improvement plan. The team includes inter-departmental members from sales, fleet and finance.
Identified challenges included a noticeable delay in the loading process, which affects the overall delivery lead time. Moreover, most of CRs come between 12 and 3pm and this creates bottlenecks at warehouse gate, which leads to more delays with warehouse workers experiencing work overload during rush hours. To reduce waiting time, CRs and their helpers used to assist warehouse workers in picking which exhausts CRs and their helpers too and also affect their own work quality.
4.2.2.1. Process improvement and results
The team calculated the waiting time between activities (non-value-added time). Waiting was identified as the most significant type of waste in this process. As a result, the team proposed re-engineering of the process to allow the CR to submit the order before reaching the warehouse; therefore all activities of order receiving, inventory checking, pick list creation and order picking could be executed before
the CR arrival. Close monitoring of the new process with the aid of operation’s metrics and KPIs were followed by the warehouse manager, particularly during the first two months of the process implementation, and the results were shared and discussed with the team during weekly meetings.
The results exceeded expectations and after three months of implementation there were further beneficial effects that were not conceived of in the original scope (e.g. a reduction in warehouse breakages). The main results can be summarized as follows:
1. A reduction in CR throughput time (waiting time) at the warehouse gate by 52%.
2. Warehouse helpers no longer required CRs help in orders’ picking since all orders were picked solely by the warehouse team before the CRs arrived at the gate.
3. The team noticed a significant reduction in warehouse breakages, (number of cases get damaged due to mishandling), which was explained as being due to non-interference of sales helpers in the products handling process.
4.2.2.2. Assessment and recommendation.
Figure 3 shows current state map of order to load process.
<Figure 3> Current State Map of “Order to Load Process”

Carrie Amani Annabi, Fatima Hassan, Islam Amer / International Journal of Industrial Distribution & Business 9-10 (2018) 21-3732
Although ABCDC eliminated CR unnecessary waiting time, the Current State Map (Figure 3) fails to realise the full benefits of lean philosophy. The absence of quality management principals are not explicit within the visible processes as mapped within the VSM. Value creation should be focused on all sources of existing waste; the very existence of these waste types has been identified by the findings of this research. For example, the waste of inventory and over processing.
The Current State Map only considered the waste of waiting, where the process cycle time was tracked. Whilst this included the waiting time between activities and some value-added time and non-value added time was highlighted, these value-add activities were not measured for its value-adding based on the customer perspective. Over-processing of some non-value-added activities appear to be repetitive activities and these are highlighted in the Current State Map.
Some activities cannot be eliminated, e.g. gate pass creation and outbound delivery order creation, while some activities can be disregarded, such as removing one of the two checking points either from the warehouse or the gate, thereby relying on only one checking station. Moreover using technology can lead to the elimination of over-processing. To achieve this ABCDC can apply a live integration of CR’s Hand Held Terminals (HHT) and use the ERP system. This will allow CRs to have live access to inventory where the
availability of stocks can be checked, and this creates direct outbound delivery potential. This would minimize the over-production of unnecessary paper work as well as enhance the communication between sales and the warehouse team, additionally reducing loading errors resulting from miscommunication.
The inventory type of waste was also observed in this process and refers to the bottlenecks that prevail from the warehouse gate due to the long queues of the accumulated sales trucks during arrival or departure (as shown in Figure 4). Trucks take an average of 20 minutes in such queues. This can be reduced by modifying CRs duty timing in batches (different intervals) rather than having one shift. This can help in reducing the bottlenecks at the gate and distributes the workload. The future state map of “order-to-load” process can be drawn based direct recommendations from this research, as shown in Figure 4. Accordingly it is anticipated that CR throughput time can be further reduced by 40%, and the total process’s cycle time can be reduced by 33%.
The research finding provides practical evidence on lean thinking validity in waste elimination, particularly on process lead time reduction. Moreover, this project delivers an example of lean validity in micro-level processes optimization in the logistics sector for future roll-out application by other organizations or within other processes for the same organization.
<Figure 4> Future State Map of “Order to Load Process”

Carrie Amani Annabi, Fatima Hassan, Islam Amer / International Journal of Industrial Distribution & Business 9-10 (2018) 21-37 33
4.3. Key attributes of successful lean implementation.
The last section of the pro-forma questionnaire reviewed the key attributes of the successful lean implementation from the interviewees’ perspective. Table 10 depicts the key attributes of successful lean implementation.
4.3.1. Critical to success.
The interviewees were asked about both barriers and success factors experienced during lean implementation. Accordingly these factors can be combined and further
grouped into four based on the interviewees’ inputs:1- Management support: All interviewees referred to
management support as the most critical factor of lean success. Management support includes things like professionalism of management, with an expectation that management should have sufficient knowledge of lean concept and tools and be able to share this expertise with the team. Leadership skills, exhibiting control in the face of resistance to change and providing necessary support in term of resources, budget and technical training were also mentioned.
<Table 10> Key attributes of Successful Lean Implementation
Critical to
success
What are the main
barriers to the
successful
implementation of lean
in a company?
1, 9 and 12Participants stated that "Poor management or old fashion and unprofessional
managers" - lack of awareness - lack of training of shop floor staff
2, 3, 5 and 6Individual negative competition (selfishness) - lack of motivation - change
resistance without management support to face it
4Mentality of people - change resistance - lack of qualified and well-trained
staff
7, 8, 10 and 11
Unofficial implementation leads to lack of commitment from team as well as
supportive departments - lack of cooperation between departments
(Macro-level implementation) - lack of awareness and understanding of lean
concepts - lack of support from management (technical and financial )
What are the main
successful factors of
lean implementation in
a company?
1, 9 and 12Professional management - motivation to staff - management support
(technical and financial)
2, 3, 5 and 6Proper communication - good attitude of staff (cooperation and team working)
- qualified staff - management support
4 management support - professional leadership - standardization of processes
7, 8, 10 and 11
Resources availability and budget - professional leadership. Leadership -
engagement of shop floor staff in all implementation stages including decision
making - sharing benefits and motivation
Lean
practices
and
behaviors
Which behaviors you
perceive need to be
acquired by employee
to promote successful
implementation of
lean?
1, 9 and 12Self-motivation - ability to learn - flexibility to adapt with different situation -
positive attitude
2, 3, 5 and 6 Positive attitude - cooperation
4Transparency - active listening - manager need to be supportive to team -
employee who take initiative and give ideas - innovation
7, 8, 10 and 11Trust - discipline - positive attitude - confidence in work delegation to staff -
Ability to learn - respect - ability to change (flexibility) - high commitment
Which behaviors you
perceive need to be
avoided by employee
to promote successful
implementation of
lean?
1, 9 and 12 Suspicion - racism - gossip - problem making - rigidity
2, 3, 5 and 6 Lack of respect - negativity
4 laziness - selfishness - lack of transparency
7, 8,10 and 11Lack of trust – carelessness- selfishness - bias to certain people - lack of
team engagement - lack of transparency - lack of respect
Did you notice any
changes in employee’s
behavior before and
after lean
implementation? Can
you give examples?
1,9 and 12
Affect positively - team become more cooperative - more motivated - has
Self-censorship. Has positive effect - conflicts between staff reduced -
cooperation enhanced - most of the team become motivated due to
participation in achieving good results (feeling of success)
2, 3, 5 and 6
Has both positive and negative effects - standardization of processes solve
many conflicts between staff - team become more careful to avoid errors or
delay the operation - while some of them are disappointed as they feel they
are under microscope (their performance is measured and tracked)
4 It should has a positive effect but interviewee did not provide any examples
7, 8, 10 and 11There is no noticeable effect, operation becomes more efficient but it is
difficult to notice or measure staff behaviors.

Carrie Amani Annabi, Fatima Hassan, Islam Amer / International Journal of Industrial Distribution & Business 9-10 (2018) 21-3734
2- Lean awareness and training: Good awareness of lean concept and tools, team engagement as well as staff motivation were all discussed.
3- Process optimization: Process standardization was indicated as an important factor, in which every employee has clear responsibilities to reduce misunderstanding and/or conflicts. While communication, the importance of sharing benefits via adopting incentive or reward systems to keep employees motivated and cooperation between departments were all noted, these were most likely enabled through the macro-level implementation of lean.
4- Shop floor employees’ behaviour: Interviewees referred to the importance of human factor and behaviour of the staff and were aware that selfishness and the negative competition between staff, resistance to change and employee’s willingness to learn and change were seen as critical factors.
4.3.2. Lean behaviour and practices
With regard to how the application of lean affected staff behaviour, most interviewees agreed that lean had a positive impact on staff behaviours and noted that the team become more cooperative and motivated, employees were more careful and used self-censorship. However, some interviewees indicated that lean had both positive and negative impacts on employees and they mentioned that some employees felt dissatisfied by the strict control mechanisms required to successfully implement lean philosophy.
5. Discussion and Implications
The findings proved the validity of lean thinking in elimination of different types of logistics wastes. The application of lean as an improvement tool in the logistics industry is still nascent and therefore requires further research, particularly in Gulf countries where the behavioural muda aspects could be reviewed both in isolation and in conjunction with lean philosophy. This research can serve as guidance to logistics practitioners in how lean thinking can be used to identify wastes.
ABCDC succeeded in reducing CR waiting time by 52% using VSM tools through parallel activity scheduling for the “order-to-load” process. It is believed that it is still possible to achieve better results if a structured framework of lean was adopted that incorporated a holistic approach. The VSM and Future State Map only considered waiting waste time. The inter-relationships that several wastes have on each other was not mapped.
The findings highlighted the significance of new wastes: For example “talent” and “communication” were ranked as the most significant types of wastes in logistics processes, while “packaging” was indicated as the least significant type
of waste. The mutual relationship between types of wastes is another important element in determining the significance of the types of waste, where one type can affect the other types. In this context, the findings highlighted that the interviews perceived “overproduction”, “waiting” and “over-processing” to be the top three types of waste in logistics and that these have an impact on other types of waste. Moreover, “inventory”, “space and facilities” were indicated as the top two types of waste in logistics which were most commonly affected by other types of waste.
In general, a lack of quality management was observed. It was laudable that lean initiatives were employed by ABCDC despite an admission by the interviewees that they were generally unaware of lean methodology and its tools. There interviewees’ unfamiliarity of process approaches and how lean components are best described bear testimony to the analogy from Andersson et al. (2006) of “The Blind Men and the Elephant” with the various descriptions of the elephant. However, despite this, it appeared that lean approaches were the most common approach used in logistics processes improvement.
The findings confirmed that lean is not just a set of tools or hard practices, but rather should be viewed as a comprehensive management approach. Interviewees pointed out multiple factors which are critical to successful implementation of lean such as management support, more thorough awareness of lean, training of shop floor staff and process optimization. The findings highlighted the importance of staff behaviours on the effective implementation of lean. Most of the interviews agreed that lean thinking had a positive impact on shop-floor staff’s behaviour.
6. Conclusion
Despite doubling the six blind men from Andersson et al. (2006) to 12 respondents, it was apparent that there was a still divergence in perceptions with regard to lean methodology and the inter-relationships within wastes. It was also apparent that there was no outright agreement of what QM was to each and all of the respondents. The crucial difference between traditional manufacturing systems and lean systems falls firmly on the importance of human behaviour. Therefore, key shop-floor employees should be encouraged to be proactive and participate in regular wastes identification activities which would help mature understanding of the customer value within the manufacturing process. There are no prescriptive ways in which this engagement should be supported, although the most typically used schemes include generic TQM methodologies, underpinned by continuous improvement approaches, as well as targeted problem-solving. Lean should be implemented through prudent tool selection, and it might be more appropriate to implement methods that engage staff incrementally, as a first

Carrie Amani Annabi, Fatima Hassan, Islam Amer / International Journal of Industrial Distribution & Business 9-10 (2018) 21-37 35
step towards quality management. Employees need to feel engaged and although some lean tools may hold higher promises of returns, staff engagement seems to steer success.
VSM and Future State Mapping both offered leverage in lean processes. While the VSM identified and attempted to minimize waste in a process, the Future State Map helped both the customer and the provider organization.
7. Limitations and Direction for Future Research
The research studied an MNC soft drink manufacturer in the UAE regarding the application of lean principals. This study employed data collected from 12 staff working in logistics processes and, as a result of the sample, cannot establish generalizability. Further research is recommended to improve knowledge on both micro and macro lean application, and the steps to identify human impacts on lean implementation and interdependence within wastes. Finally, this study focused on the direct impact of lean service practices on logistics and assessed efficacy of VSM processes. Insight can be obtained by adopting different methodologies to understand the possible interdependencies from both a service and a customer perspective and by looking at an array of lean tools to provide a wider range of assessment criteria.
References
Abdi, F., Shavarini, S., & Hoseini, S. (2006). Glean Lean: How to Use Lean Approach in Service Industries? Journal of Services Research, 6(1), 190-206.
Abdulmalek, F., & Rajgopal, J. (2007). Analyzing the benefits of lean manufacturing and value stream mapping via simulation: A process sector case study. International Journal of Production Economics, 107(1), 223-236.
Abdul Wahab, A., Mukhtar, M., & Sulaiman, R. (2013). A Conceptual Model of Lean Manufacturing Dimensions. Procedia Technology, 11(1), 1292-1298.
Agus, A., & Hajinoor, M. (2012). Lean production supply chain management as driver towards enhancing product quality and business performance: Case study of manufacturing companies in Malaysia. International
Journal of Quality & Reliability Management, 29(1), 92121.
Anand, G., & Kodali, R. (2010). Analysis of lean manufacturing frameworks. Journal of Advanced
Manufacturing Systems, 9(1), 1-29. Andersson, R., Eriksson, H., & Torstensson, H. (2006).
Similarities and differences between TQM, six sigma and lean. The TQM Magazine, 18(3), 282-296.
Andrea, C. (2013). Waste savings in patient transportation inside large hospitals using lean thinking tools and logistic solutions. Leadership in Health Services, 26(4), 356-367.
Antony, J. (2006). Six sigma for service processes. Business Process Management Journal, 12(2), 234-248.
Atkinson, P. (2004). Creating and Implementing Lean Strategies. Management Services, 48(2), 18-33.
Boaden, R. (1997). What is total quality management …
and does it matter? Total Quality management, 8(4), 153-171.
Bortolotti, T., Boscari, S., & Danese, P. (2015). Successful lean implementation: Organizational culture and soft lean practices. Int. J. Production Economics, 160(1), 182-201.
Boscari, S., Danese, P., & Romano, P. (2016). Implementation of lean production in multinational corporations: A case study of the transfer process from headquarters to subsidiaries. International Journal of
Production Economics, 176, 53-68.Braglia, M. (2009). Uncertainty in value stream mapping
analysis. International Journal of Logistics, 12(1), 435-453.
Breyfogle, F. (2003). Implementing of six sigma: Smarter
Solutions Using Statistical Methods. Hoboken, NJ: John Wiley and Sons.
Brown, S., & Bessant, J. (2003). The manufacturing strategy-capabilities links in mass customisation and agile manufacturing - an exploratory study. International
Journal of Operations & Production Management, 23(7), 707-730.
Butler, M. J., Sweeney, M., & Crundwell, D. (2009). Facility closure management: The case of Vauxhall Motors Luton. International Journal of Operations &
Production Management, 29(7), 670-691.Carlson, C. (2012). Effective FMEAs: Achieving safe,
reliable, and economical products and processes using
failure mode and effects analysis (Vol. 1). Hoboken, NJ: John Wiley & Sons.
Chay, T., Xu, Y., Tiwari, A., & Chay, F. (2015). Towards lean transformation: The analysis of lean implementation frameworks. Journal of Manufacturing Technology
Management, 6(7), 1031-1052. Christopher, M. (2011). Logistics and Supply Chain
Management. Pearson Education, United Kingdom. Dahlgaard, J., & Park, S. (2006). Lean production, six
sigma quality, TQM and company culture. The TQM
Magazine, 18(3), 263-281. Dean, J., & Bowen, D. (1994). Management Theory and
Total Quality: Improving Research and Practice through Theory Development. The Academy of Management
Review, 19(3), 392-418. De Souza, R., & Carpinetti, L. (2014). A FMEA-based
approach to prioritize waste reduction in lean implementation. International Journal of Quality &

Carrie Amani Annabi, Fatima Hassan, Islam Amer / International Journal of Industrial Distribution & Business 9-10 (2018) 21-3736
Reliability Management, 31(4), 346-366. Ehrlich, B. (2006). Service with a smile: lean solutions
extend beyond the factory floor.(antagonistic relationship between management and employees). Industrial
Engineer, 38(8), 40-44. Emiliani, M. (1998). Lean behaviors. Management Decision,
36(9), 615-631. Folinas, D., Aidonis, D., Triantafillou, D., & Malindretosb,
G. (2013). Exploring the greening of the food supply chain with lean thinking techniques. Procedia
Technology, 8(1), 416-424. Fontana, A., & Frey, J. (1994). Interviewing: The Art of
Science. Thousand Oaks, CA: Sage Publications.Fuentes, J., & Díaz, M. (2012). Learning on lean: A
review of thinking and research. International Journal of
Operations & Production Management, 32(5), 551-582. Gibbons, P., Burgess, S., Godfrey, P., & Kennedy, C.
(2012). The development of a lean resource mapping framework: Introducing an 8th waste. International
Journal of Lean Six Sigma, 3(1), 4-27. Goldsby, T., & Martichenko, R. (2005). Lean Six Sigma
Logistics: Strategic Development to Operational
Success. Richmond, VA: Ross Publishing.Gurumurthy, A., & Kodali, R. (2011). Design of lean
manufacturing systems using value stream mapping with simulation: A case study. Journal of Manufacturing
Technology Management, 22(4), 444-473. Hellsten, U., & Klefsjö, B. (2000). TQM as a management
system consisting of values, techniques and tools. The
TQM Magazine, 12(4), 238-244. Hines, P., Holweg, M., & Rich, N. (2004). Learning to
evolve: A review of contemporary lean thinking. International Journal of Operations & Production
Management, 24(10), 994-1011. Hines, P., Rich, N., & Esain, A. (1999). Value stream
mapping: A distribution industry application. Benchmarking: An International Journal, 6(1), 60-77.
Ho, S. (1997). Are ISO 9000 and TQM routes for logistics excellence? Logistics Information Management,
10(6), 275-283. Holweg, M. (2005). The three dimensions of
responsiveness. International Journal of Operations &
Production Management, 25(7), 603-622. Hoss, M., & Caten, C. (2013). Lean schools of thought.
International Journal of Production Research, 51(11), 3270-3282.
Jones, D., Hines, P., & Rich, N. (1997). Lean logistics. International Journal of Physical Distribution & Logistics
Management, 27(3/4), 153-173. Jurado, P., & Fuentes, J. (2014) Lean Management,
Supply Chain Management and Sustainability: A Literature Review. Journal of Cleaner Production, 85(1), 134-150.
Jylha, T., & Junnila, S. (2013). Learning from lean management – going beyond input-output thinking.
Facilities, 31(11/12), 454-467. Karlsson, C., & Åhlström, P. (1996). Assessing changes
towards lean production. International Journal of
Operations & Production Management, 16(2), 24-41. Kilpatrick, J. (2003). Lean Principles. Utah Manufacturing
Extension Partnership.Kumar, S. (2014). Impact of Six-Sigma DMAIC approach
on Manufacturing Industries. International Journal of
Innovative Research in Science, Engineering and
Technology, 3(5), 12652-12657. LaMarca, N. (2011). The Likert Scale: Advantages and
Disadvantages. Retrieved from https://psyc450.wordpress.com/2011/12/05/the-likert-scale-advantages-and-disadvantages/(accessed 31st October 2016)
Laureani, A., & Antony, J. (2010). Lean six sigma in a call centre: A case study. International Journal of
Productivity and Performance Management, 59(8), 757-768.
Lawson, B. (2001). In praise of slack: Time is of the essence. Academy of Management Executive, 15(3), 125-135.
Liu, S., Leat, M., Moizer, J., Megicks, P., & Kasturiratne, D. (2013). A decision-focused knowledge management framework to support collaborative decision making for lean supply chain management. International Journal of
Production Research, 51(7), 2123-2137. Lucey, J., Bateman, N., & Hines, P. (2004). Achieving
pace and sustainability in a major lean transition. Management services, 48(9), 8.
Manville, G., Greatbanks, R., Krishnasamy, R., & Parker, D. (2012). Critical success factors for Lean Six Sigma programmes: A view from middle management. International Journal of Quality & Reliability Management, 29(1), 7-20.
Mehrsai, A., Thoben, K., & Scholz-Reiter, B. (2013). Bridging lean to agile production logistics using autonomous carriers in pull flow. International Journal
of Production Research, 52(16), 471 Meredith, J., & Samson, D. (2001). Call for papers:
Special issue of Journal of Operations Management on case study and field research. Journal of Operations
Management, 19(1), 117-118.Miles, M. B., & Huberman, M. (1994). Qualitative Data
Analysis (2nd ed.). United Kingdom: Sage.Mont, O. (2002). Clarifying the concept of product–service
system. Journal of Cleaner Production, 10(3), 237-245. Mostafa, S., Dumraka, J., & Soltanb, H. (2013). A
framework for lean manufacturing implementation. Production & Manufacturing Research, 1(1), 44-64.
Muller, E., Stock, T., & Schillig, R. (2014). A method to generate energy value-streams in production and logistics in respect of time- and energy-consumption. Production Engineering Research and Development, 8(1), 243-251.

Carrie Amani Annabi, Fatima Hassan, Islam Amer / International Journal of Industrial Distribution & Business 9-10 (2018) 21-37 37
Myers, M., & Newman, M. (2007). The qualitative interview in IS research: Examining the craft. Information and Organization, 17(1), 2-26.
Oliva, R., & Kallenberg, R. (2003). Managing the transition from products to services. International Journal of
Service Industry Management, 14(2), 160-172. Paiva, E. L., Roth, A.V., & Fensterseifer, J.E. (2008).
Organizational knowledge and the manufacturing strategy process: A resource-based view analysis. Journal of Operations Management, 28(6), 562-83.
Pettersen, J. (2009). Defining lean production: Some conceptual and practical issues. The TQM Journal, 21(2), 127-142.
Piercy, N., & Rich, N. (2009). Lean transformation in the pure service environment: The case of the call service centre. International Journal of Operations & Production
Management, 29(1), 54-76. Rawabdeh, I. (2005). A model for the assessment of
waste in job shop environments. International Journal
of Operations & Production Management, 25(8), 800-822. Resta, B., Powell, D., Gaiardelli, P., & Dotti, S. (2015)
Towards a framework for lean operations in product-oriented product service systems. CIRP Journal
of Manufacturing Science and Technology, 9, 12-22. Rother, M., & Shook, J. (1998). Learning to See; value
stream mapping to create value and eliminate muda. Lean Enterprise Institute, USA.
Rudestam, K. E., & Newton, R. R. (1992). Surviving your
dissertation. United Kingdom: Sage.Sánchez, A., & Pérez, M. (2001). Lean indicators and
manufacturing strategies. International Journal of Operations
& Production Management, 21(11), 1433-1452. Saunders, M., Lewis, P., & Thornhill, A. (2009). Research
Methods for Business Students. United Kingdom: Pearson Education Limited.
Shamah, R. (2013). Measuring and building lean thinking for value creation in supply chains. International Journal
of Lean Six Sigma, 4(1), 17-35.
Slack, N., Chamber, S., & Johnston, R. (2010). Operations
Management. United Kingdom: Pearson Education Limited.
Smalley, A. (2004). Creating Level Pull. Brookline, MA: Lean Enterprise Institute.
Smart, K., Transfield, D., Deasley, P., Levene, R., Rowe, A., & Corley, J. (2003). Integrating ‘lean’ and ‘high reliability’ thinking. Journal of Engineering, Manufacturing, 217(B), 733-742.
Sohal, A., & Egglestone, A. (1994). Lean Production: Experience among Australian Organizations. International
Journal of Operations & Production Management,
14(11), 35-51. Stokes, D., & Bergin, R. (2006). Methodology or
methodolatry? An evaluation of focus groups and depth interviews. Qualitative Market Research: An
International Journal, 9(1), 26-37. Strategic Lean Briefing. (n.d.). The Limitations of Value
Stream Mapping: When to Use VSM and When To
Use Other Methods. Retrieved from http://www.strategosinc.com/value-stream-mapping-4.htm. (accessed 19th December 2016)
Sundar, R., Balaji, A., & Satheesh Kumar, R. (2014). A Review on Lean Manufacturing Implementation Techniques. Procedia Engineering, 97(1), 1875-1885.
Waters, D. (2003). Inventory Control and Management. United Kingdom: John Wiley & Sons Ltd.
Womack, J., Jones, D., & Roos, D. (1990). The Machine
That Changed The World. USA: Free Press.Womack, J., & Jones, D. (1996). Lean Thinking: Banish
Waste and Create Wealth in Your Corporation. USA: Free Press.
Voss, C., Tsikriksis, N., & Frohlich, M. (2002). Case research in operations management. International
Journal of Operations & Production Management, 22(2), 195-219.
Yin, R.K. (1994). Case Study Research Design and
Methods (pp. 5). Thousand Oaks, CA: Sage.