the biomass mission: quantifying biomass for carbon assessment
TRANSCRIPT

Thuy Le Toan CESBIO, Toulouse, France
The BIOMASS mission: Quantifying biomass for carbon assessment

Anthropogenic perturbation of the global carbon cycle
Perturbation of the global carbon cycle caused by anthropogenic activities, averaged globally for the decade 2007–2016 (GtCO2/yr)
The budget imbalance is the difference between the estimated emissions and sinks. Source: CDIAC; NOAA-ESRL; Le Quéré et al 2017; Global Carbon Budget 2017
The science question: role of forests in the global carbon cycle

Science Objective: to reduce uncertainties on the spatial distribution, the quantity and dynamics of forest carbon stocks, sources and sinks
Large uncertainties in terrestrial carbon sources and sinks
2007–2016 (GtCO2/yr)

The science question

Forest biomass
Above-ground biomass (tons / hectare)
Upper canopy height (meter)
Areas of forest clearing
(hectare)
• 4 hectare resolution
• 1 map every 6 months for
4 years
• global coverage of forested
areas
• accuracy of 20%, or 10 t ha–1
for biomass < 50 t ha–1
• 0.25 hectare resolution
• 1 map every 6 months for
4 years
• global coverage of
forested areas
• 90% classification
accuracy
Biomass product requirements
• 4 hectare resolution
• 1 map every 6 months for
4 years
• global coverage of
forested areas
• accuracy of 20-30%
Forest height
Disturbances
BIOMASS will provide forest biomass, forest height and disturbances
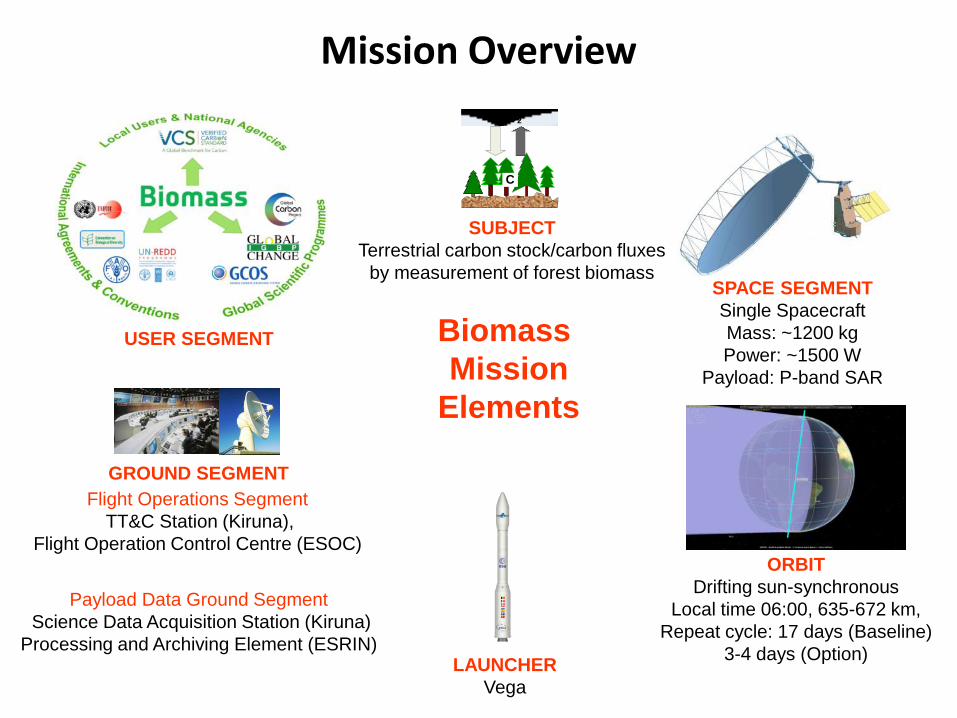
Mission Overview
GROUND SEGMENT
Flight Operations Segment
TT&C Station (Kiruna),
Flight Operation Control Centre (ESOC)
Payload Data Ground Segment
Science Data Acquisition Station (Kiruna)
Processing and Archiving Element (ESRIN)
ORBIT
Drifting sun-synchronous
Local time 06:00, 635-672 km,
Repeat cycle: 17 days (Baseline)
3-4 days (Option)
Biomass
Mission
Elements
SUBJECT
Terrestrial carbon stock/carbon fluxes
by measurement of forest biomass
CO2
C
LAUNCHER
Vega
SPACE SEGMENT
Single Spacecraft
Mass: ~1200 kg
Power: ~1500 W
Payload: P-band SAR
USER SEGMENT

Biomass Mission Concept
o Single satellite, operated in a polar sun-synchronous orbit
o Full polarimetric P-band (435 MHz) Synthetic Aperture Radar with 6 MHz bandwidth
o Two mission phases: Tomography (year 1), Interferometry (year 2-5)
o Multi-repeat pass interferometry (3 passes in nominal operations) with a 3 days repeat cycle
o Global coverage in ~7 months (228 days) on asc. and des. passes
o 5 years lifetime

Biomass Mission Performance
Key Parameters
Sensitivity (NESZ) ≤ -27 dB
Total Ambiguity Ratio ≤ -18 dB
SLC resolution ≤ 60m x 8m
Dynamic Range 35 dB
Radiometric Stability ≤ 0.5 dB
Radiometric Bias ≤ 0.3 dB
Crosstalk ≤ -30 dB
Channel Imbalance ≤ -34 dB

Global Coverage Strategy
Major cycle Satellite drift maneuver
Satellite drift maneuver
Satellite drift maneuver
Sat. drift maneuver
Across-track distance [km] 0 680 0
43
86
129
172
Tim
e [d
ays]
160

In situ observations
Biomass in the Global Carbon Data Assimilation System
Geo-referenced
emission
inventories
Atmospheric
Observations
Remote sensing
of atmospheric
CO2
Atmospheric
Transport
Model
Terrestrial
Carbon
Model
Ocean
Carbon
Model
Ocean
Observations
Eddy-covariance
flux towers
Biomass & soil
carbon inventories
Ecological
Information
Data assimilation
link
Remote Sensing
of land
Vegetation
dynamics
Biomass
Land Cover
Burnt biomass
Sentinel-3
e.g. Orbital Carbon Observatory-2 Gosat Microcarb
Biomass
Landsat Sentinel-2
e.g. Sentinel-1 Sentinel-3 Flex
MTG
ALOS-2, NISAR, SAOCOM, GEDI

Forests are one of the Earth’s most precious resources to sustain
Pressing need for forest Information in policy

La Selva, Costa Rica
Maine
Colombia
Landes Alaska
Campaigns used to develop observation concept
Paracou F.Guiana
Remningstorp
Krycklan
Kalimantan
Major recent campaigns:
1. F. Guiana 2009 (TropiSAR), 2011-13 (TropiScat)
2. Gabon (AfriSAR) 2015, 2016
3. Ghana (AfriScat), 2016-2017
Yellowstone
Gabon
Ghana

Biomass: a single P-band satellite can deliver 3 independent types of information
PolSAR (SAR Polarimetry)
x
y
z
o
PolInSAR (Polarimetric SAR Interferometry)
x
y
z
o
TomoSAR (SAR Tomography)
x
y
z
o

Azimuth [pixel]
Gro
und r
ange [
pix
el]
Biomass map obtained by inversion power layer 30m (t.ha-1)
1000 2000 3000 4000 5000 6000 7000 8000
2000
2500
3000
3500
4000
4500
5000
5500
6000
6500
7000
50
100
150
200
250
300
350
400
450
500
550
600
BIOMASS map at 50 m, by tomography
SAR Tomography provides high accuracy biomass maps
P-band SAR image

1. Testing, comparing algorithms on 4
tropical forest sites
2. P- and L-band PolInSAR and TomoSAR
3. Flights in July 2015 and February 2016
to test seasonal variations
1. NASA collaboration on 2016 flights with
the LVIS and UAVSAR systems
2. Other data:
• Airborne small footprint lidar
• Plot data
• Soil moisture
• TanDEM-X
Sethi-ONERA P-band (F: 430 Mhz, B: 50 Mhz)
FSAR-DLR P-band (F: 435 Mhz, B: 50 Mhz)
NASA
The recent AfriSAR campaign in Gabon, Africa

Lopè
Mabounie Rabi
Mondah
HH+VV HV HH-VV
AfriSAR campaign data in Gabon (2016)
FSAR-DLR

D. Ho Tong Minh, Y.-N. Ngo, I. Moussawi, L. Villard, L. Ferro-Famill, M. Mariotti d’Alessandro, S. Tebaldini, C. Albinet, K. Scipal , T. Le Toan
Work in progress: TomoSAR AGB retrieval at various tropical forest sites
+New AGB indicator: TomoSAR Phase Center
Retrieval using HH, VV, HV at 30 m and HV Phase Center

Tower based experiments to test long term variation of the SAR measurements
o Experimentna in Ghana
o 2 x 3 hours per day: 4:30-7:30 am/pm
o Started on 20/07/2015, end 4/05/2017
1. Static tower-based radar observing a forest 2. Automatic and systematic acquisitions of fully
polarimetric data (HH, HV, VH and VV) 3. Tomographic capability (to have a vertical discrimination of backscattering mechanisms) 4. Associated with in situ measurements
o Experiment in French Guiana
o Measurements every 15 mn
o Started in 2011 , end 2013 (with interruptions)
Tropiscat
Afriscat

TropiScat experiment in French Guiana
Tour Guyaflux Equipe Guyafor
Hamadi et al., 2013
Diurnal cycle of Backscatter Intensity over Paracou forest

AfriScat (Ghana) TropiScat (French Guiana)
Measure of long term coherence for Biomass repeat pass interferometry

Modelling works using forest description from TLS
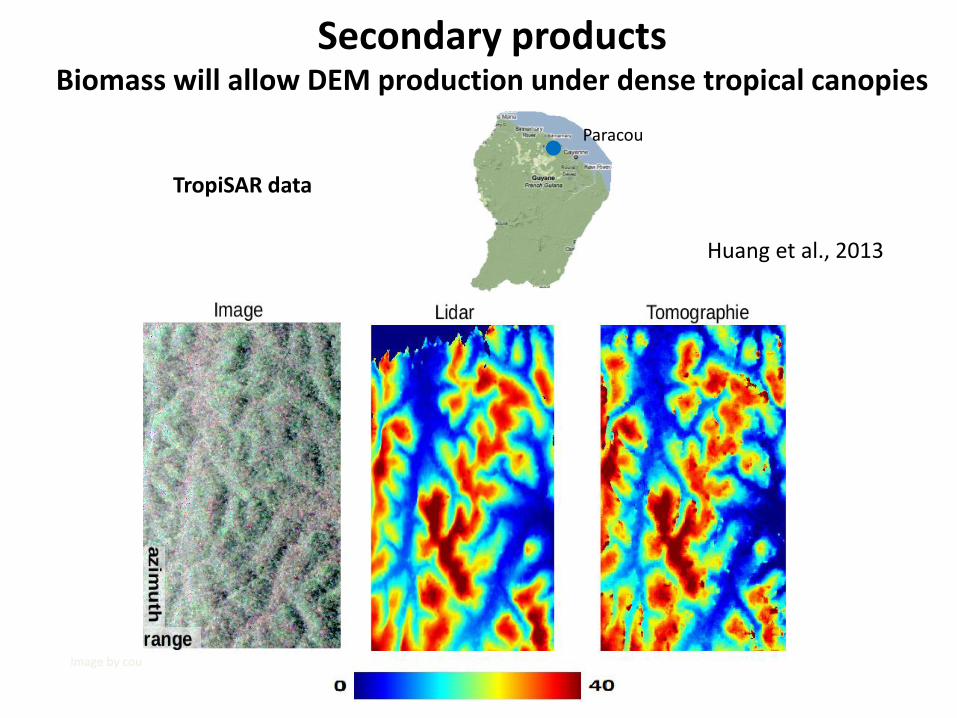
Secondary products Biomass will allow DEM production under dense tropical canopies
TropiSAR data
Image by courtesy of P. Dubois-Fernandez
Paracou
Huang et al., 2013

Pr
in ci
p ai
s Pr
o d ut
os
M o d e l o D i g i t a l d e S u p e r f í c i e ( M D S )
www.bradar.com.br
Secondary products Biomass will allow mapping of inundated forest
X-band

Pr
in ci
p ai
s Pr
o d ut
os
M o d e l o D i g i t a l d e S u p e r f í c i e ( M D S )
BANDA P
www.bradar.com.br
P-band
Secondary products Biomass will allow mapping of inundated forest

Pr
in ci
p ai
s Pr
o d ut
os
M o d e l o D i g i t a l d e S u p e r f í c i e ( M D S )
MANCHA DE INUNDAÇÃO ABAIXO DA FLORESTA
www.bradar.com.br

Secondary products P-band extends the range of measurable glacier and ice sheet
velocities 1. P-band is likely to provide better velocity
measurements than higher frequencies in areas where
the ice does not have crevasses and other features, e.g.
above the equilibrium line.
2. It is still unknown if ionospheric scintillations can be
corrected with sufficient accuracy.
P-band InSAR at S10 (airborne data degraded to Biomass resolution)

Secondary products P-band enhances subsurface imaging in arid zones
Oasis Ksar Ghilane (Tunisia)
SPOT ALOS-2 SETHI (P-band)
Philippe Paillou

Summary – Biomass a true Earth Explorer
The Biomass implementation started in Nov. 2013. We are currently in Phase-C . We will launch in mid 2021.
1. Biomass will reduce uncertainties on the spatial distribution, the quantity and dynamics of forest carbon stocks, sources and sinks
2. Biomass is the first P-band SAR and first radar tomographic space mission; it is a true Earth Explorer with unknowns and exciting sciences .e.g measurements of ice, sub-surface geomorphology in deserts, topography, the ionosphere, ocean.

Biomass
TerraSAR-L
ALOS-4
Within the next 5 years, spaceborne missions to monitor the Earth’s forests

The selection of these missions brings together the ecological, modelling, policy and EO communities
NASA-ESA Smithsonian Biomass workshop May 31-June 3, 2016
Bern, Switzerland

The Biomass Science Team
Thuy Le Toan Centre d'Etudes Spatiales de la Biosphère
Shaun Quegan University of Sheffield
Stefano Tebaldini Politecnico di Milano
Lars Ulander Chalmers University
Kostas
Papathanassiou German Aerospace Centre
Markus Reichstein Max Plank Institute for Biogeochemistry
Jerome Chave CNRS – Evolution et Diversite Biologique
Philippe Paillou University of Bordeaux
Jorgen Dall Technical University of Denmark
Sassan Saatchi Jet Propulsion Laboratory
Hank Shugart University of Virginia