the beginning of the end - ieefaieefa.org/wp-content/uploads/2016/09/the-beginning-of-the-end... ·...
TRANSCRIPT
Figures 2
Executive Summary 3
A. Introduction: Seven Plants That Are Representative of the Key Risks
Facing Coal-Fired Generators in ERCOT 6
B. Natural Gas Prices Have Declined Precipitously Since Late 2008 7
C. Coal-Fired Generators Face Increasing Competition from Renewable
Wind and Solar Resources 8
D. Generation at Coal-Fired Plants in Texas Has Declined Steeply as a
Result of Low Natural Gas Prices and the Addition of More Renewable
Wind and Solar Capacity 15
E. Energy Market Prices Have Declined Substantially 19
F. Plant Aging Will Adversely Affect Coal-Fired Generator Operating
Performance and Costs 22
G. Plant Owners Must Decide Whether to Make Significant Expenditures
to Comply with Environmental Regulations 25
H. Market Forces Have Led to Significant Losses in the Financial Value
of Coal-Fired Generators in Texas 27
I. Case Study: Seven Texas Coal-Fired Generators Are at Risk of Retirement 29
J. ERCOT Has Found That Between 8,000 MW and 18,000 MW of
Coal-Fired Generating Capacity Is at Risk for Retirement 34
K. Independent Financial Community Analysts Have Concluded that
Many Coal-Fired Generators in ERCOT are at Risk for Retirement 37
Conclusion 40
End Notes 41
1. Profitability of Coal-Fired Generators with IEEFA Base
Case Generation and Market Price Assumptions 4
2. Coal-Fired Generators Examined in this Report 6
3. Natural Gas Prices 7
4. Cumulative Wind Capacity in ERCOT 9
5. Annual Wind Generation in ERCOT 10
6. Annual Wind Generation as Percentage of Total Generation in ERCOT 11
7. Cumulative Solar Photovoltaic Capacity in ERCOT 11
8. Generation in ERCOT by Fuel Type in the First 7 Months of 2016 vs.
the Same Period in 2015 14
9. Coal’s Share of the Total Energy Generated in ERCOT 15
10. Declines in Generation at Texas Coal-Fired Plants Between 2008 and 2015 16
11. Declines in Generation at Texas Coal-Fired Plants Between
January-May 2015 and the Same Months in 2016 17
12. Declines in Capacity Factors at Texas Coal-Fired Plants Since 2008 18
13. ERCOT Average Annual Energy Market Prices 2005-2015 20
14. ERCOT Forward Peak and Off-Peak Market Prices as of August 5, 2016 21
15. Ages of Texas Coal-Fired Generators in 2016 23
16. Luminant Estimates of the Cost to Install and Operate New Scrubbers
at Big Brown and Monticello 26
17. Declining Tax Values of EFH’s Coal-Fired Generators 28
18. Profitability of Coal-Fired Generators in IEEFA Base-Case Scenario 31
19. Profitability of Coal-Fired Generators in IEEFA Low-Generation Sensitivity 32
20. Profitability of Coal-Fired Generators in IEEFA Low-Market Price Sensitivity 32
21. Projected Coal Retirements and Solar and Wind Additions in ERCOT’s
2016 LTSA Update Scenarios 35
22. Rising Expectations for Future ERCOT System Reserve Margins 36
23. Moody’s Assessment of Coal Plants that Could Be Retired Due to Poor Economics 38
Fundamental changes in the Texas electricity market are putting coal-fired power plants
under increasing economic and financial stress and the industry today is under siege from a
number of challenges:
The collapse of natural gas prices and subsequent declines in the cost of generating
power and increases in the generation at natural gas-fired power plants.
Increased competition from thousands of megawatts (MW) of new wind and,
increasingly, solar photovoltaic (“solar PV”) resources due to steep declines in installation
prices, improved operating efficiencies and transmission upgrades.
Low energy market prices in the ERCOT (Electric Reliability Council of Texas) deregulated
wholesale markets, driven by lower natural gas prices and increased generation from
renewable resources.
Sharp reductions in generation from coal-fired plants as their output is displaced by
renewable and natural gas-fired capacity. Although coal-fired plants generated 39
percent of the electricity in ERCOT in 2015, they provided only 24.8 percent of the power
by May 2016.
New public health and environmental regulations that give owners of coal-fired plants
pause on whether to make expensive investments in their aging coal plant(s).
These circumstances have combined to undermine the profitability of the companies and
public power utilities and power agencies that own coal-fired power plants.
The Institute for Energy Economics and Financial Analysis in this report examines the financial
viability of seven such plants in Texas. Four are merchant generators—the Big Brown, Martin
Lake and Monticello plants owned by EFH’s Luminant subsidiary and the Coleto Creek plant
owned by Dynegy. The other three are public power utilities or power agencies—the Fayette
Power Project, Gibbons Creek, and J.K. Spruce Unit 1. The 8,100 MW of capacity from these
seven plants represents a little more than 40 percent of the total coal-fired capacity in
ERCOT.
As shown in the figure below, IEEFA has found that none of the units is financially viable, as
none can be expected to produce substantial pre-tax earnings for their owners or be
economic for ratepayers in coming years. Indeed, all but one of the plants can be expected
to produce pre-tax losses for their owners in coming years.
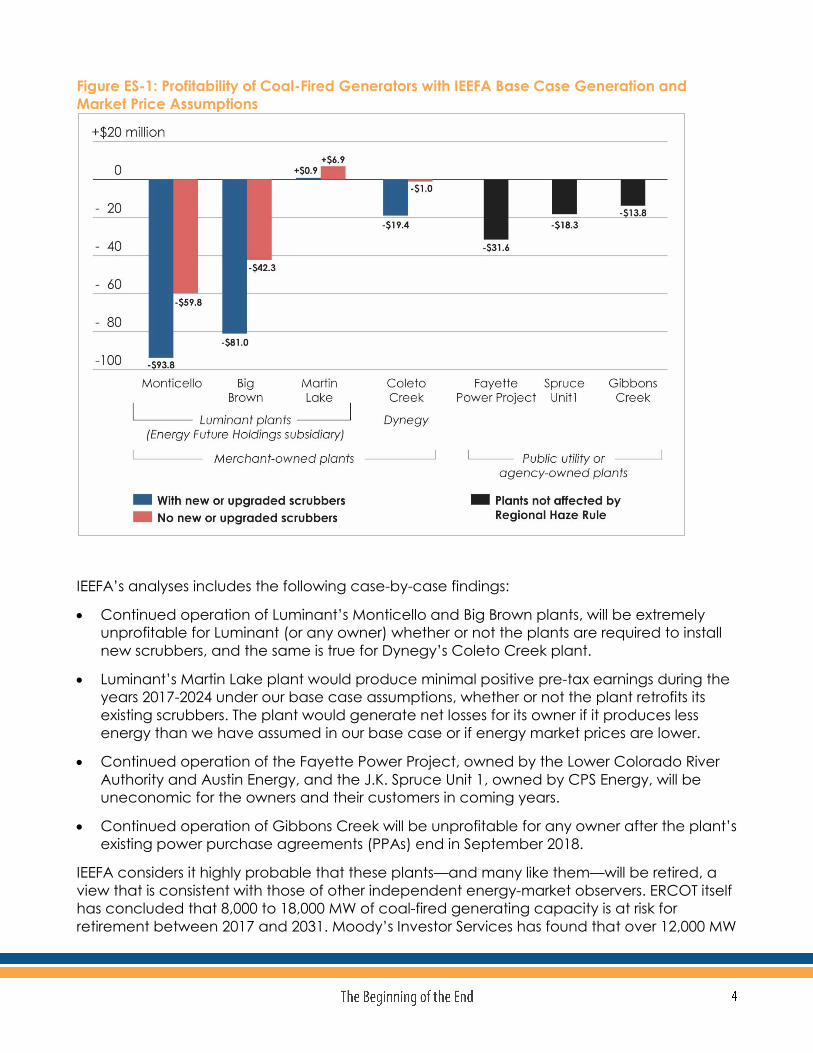
Figure ES-1: Profitability of Coal-Fired Generators with IEEFA Base Case Generation and
Market Price Assumptions
IEEFA’s analyses includes the following case-by-case findings:
Continued operation of Luminant’s Monticello and Big Brown plants, will be extremely
unprofitable for Luminant (or any owner) whether or not the plants are required to install
new scrubbers, and the same is true for Dynegy’s Coleto Creek plant.
Luminant’s Martin Lake plant would produce minimal positive pre-tax earnings during the
years 2017-2024 under our base case assumptions, whether or not the plant retrofits its
existing scrubbers. The plant would generate net losses for its owner if it produces less
energy than we have assumed in our base case or if energy market prices are lower.
Continued operation of the Fayette Power Project, owned by the Lower Colorado River
Authority and Austin Energy, and the J.K. Spruce Unit 1, owned by CPS Energy, will be
uneconomic for the owners and their customers in coming years.
Continued operation of Gibbons Creek will be unprofitable for any owner after the plant’s
existing power purchase agreements (PPAs) end in September 2018.
IEEFA considers it highly probable that these plants—and many like them—will be retired, a
view that is consistent with those of other independent energy-market observers. ERCOT itself
has concluded that 8,000 to 18,000 MW of coal-fired generating capacity is at risk for
retirement between 2017 and 2031. Moody’s Investor Services has found that over 12,000 MW

of coal-fired capacity in ERCOT is either losing money or has, at best, minor positive cash
flows. UBS Financial has similarly concluded that it is “inevitable” that several of the largest
coal generators in Texas will be retired because they are facing significant environmental
compliance costs.
The coal-fired generator owners themselves have reported that market forces have led to
significant losses. For example, Energy Future Holdings, a utility struggling to emerge from
bankruptcy, took an impairment of $2.541 billion for five of its coal-fired generators in 2015
due to the “continued decline in forecasted wholesale electricity prices in ERCOT.” This loss
followed the company’s $4.640 billion write-off of the value of three coal-fired generators in
2014.
IEEFA recommends that the policy discussion in Texas shift now to how best to phase out
these plants, what to replace them with and how to retrain employees who stand to lose
their jobs.

Table 1: Coal-Fired Generators Examined in this Report
It is important to emphasize, however, that the list here does not include all of the coal-fired
generators that are at risk of retirement in ERCOT. As will be explained below, other coal-fired
plants—some of them relatively young—are at risk too due to low energy market prices and
increasing competition from wind and solar capacity.
In a sign of the times, Moody’s this past March downgraded the senior secured debt for the
Sandy Creek coal plant because of its weak financial performance in the face of low natural
gas and energy market prices.1 Sandy Creek only went into service in May 2013.
1 Moody’s downgrades Sandy Creek to B2 from Ba3: rating outlook remains negative, Moody’s Investors Service, 17 March
2016.
Plant OwnerOperating Capacity
(MW)
Big Brown Luminant Generation 1208
Martin Lake Luminant Generation 1635
Monticello Luminant Generation 1955
Coleto Creek Dynegy 635
Fayette Lower Colorado River Authority and Austin Energy 1662
Gibbons Creek Texas Municipal Power Agency 470
J.S. Spruce Unit 1 CPS Energy 555
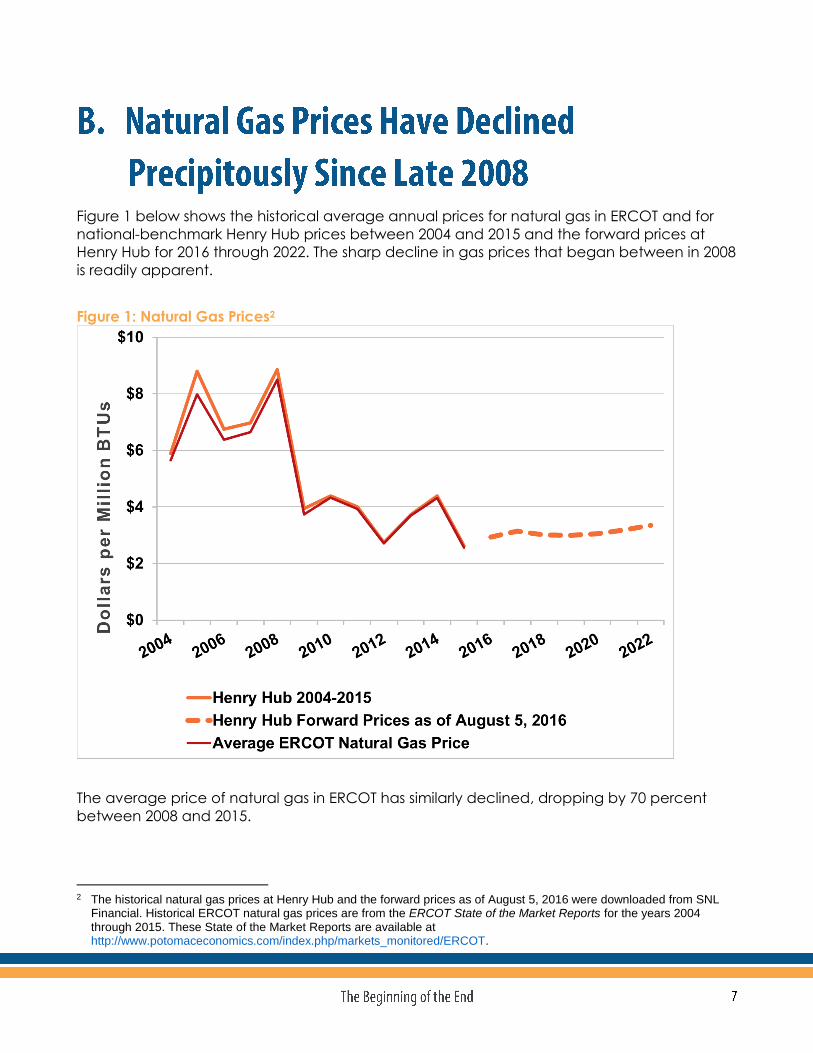
Figure 1 below shows the historical average annual prices for natural gas in ERCOT and for
national-benchmark Henry Hub prices between 2004 and 2015 and the forward prices at
Henry Hub for 2016 through 2022. The sharp decline in gas prices that began between in 2008
is readily apparent.
Figure 1: Natural Gas Prices2
The average price of natural gas in ERCOT has similarly declined, dropping by 70 percent
between 2008 and 2015.
2 The historical natural gas prices at Henry Hub and the forward prices as of August 5, 2016 were downloaded from SNL
Financial. Historical ERCOT natural gas prices are from the ERCOT State of the Market Reports for the years 2004 through 2015. These State of the Market Reports are available at http://www.potomaceconomics.com/index.php/markets_monitored/ERCOT.

This steep drop has led to significant declines in operating costs at gas-fired power plants, a
trend that has made such plants much more competitive against coal-fired generators.
More important, natural gas prices are not expected to rebound significantly in the
foreseeable future, as evidenced in the natural gas forward prices shown in Figure 1 above
(the forward price represents what the market currently expects for future natural gas prices).
Low natural gas prices have meant significantly lower energy market prices already in
ERCOT, as the price of natural gas is the primary driver of electricity prices in ERCOT.3
Continued low prices will maintain natural gas’s competitive advantage over coal for
generating electricity, which in turn will continue to undermine the viability of the continued
operation of existing coal-fired generators in ERCOT.
Dramatic increases in wind and solar PV capacity on the ERCOT grid are changing the
market. These increases are due in large part to steep declines in solar and wind installation
costs, improved operational efficiencies, transmission upgrades and increased interest in
carbon-free resources.
These trends are likely to persist, which means energy market prices are likely to remain low
and to “compound the pain” for coal-fired electric generators, according to Moody’s
Investors Service.4
The declines in the prices of power from wind and solar resources in Texas have been
impressive in recent years. For example, wind power purchase agreement (“PPA”) prices in
ERCOT and the Southwest Power Pool (SPP) declined from an average of $54 per megawatt-
hour (MWh) in 2009 to $22.42 in 2014, and have remained inexpensive even since. Solar PPA
prices in Texas also are low: Austin Energy recently finalized PPAs for solar in 2015 for around
$40 per MWh.5
As wind PPA prices have dropped, installed wind capacity in ERCOT has increased, going
from 1,854 MW to 15,764 MW, from 2005 to 2015.
3 2015 State of the Market Report for the ERCOT Wholesale Electricity Markets, Potomac Economics Ltd., June 2016,
http://www.potomaceconomics.com/uploads/ercot_documents/2015_ERCOT_State_of_the_Market_Report_-_FINAL_update_6.21_.16_.pdf, at page 2.
4 Moody’s says coal retirements the ‘x-factor’ as renewables pressure ERCOT prices, SNL Financial, March 28, 2016. 5 Cheapest Solar Ever: Austin Energy Gets 1.2 Gigawatts of Solar Bids for Less Than 4 Cents, Greentech Media.com (Jun.
30, 2015) http://www.greentechmedia.com/articles/read/cheapest-solar-ever-austin-energy-gets-1.2-gigawatts-of-solar-bids-for-less.

Figure 2: Cumulative Wind Capacity in ERCOT6
At the same time, existing wind facilities in Texas are being used more on average. (The term
“capacity factor” is an industry metric that compares how much power an electric
generating unit actually generates with how much energy the plant would have produced
had it operated at full capacity for all of the hours during a given time period. The higher the
capacity factor, the more energy the facility generates.)
Before 2011, annual wind capacity factors in ERCOT averaged less than 30 percent, which
reflected significant curtailments in wind generation due to transmission limitations. However,
beginning in 2005, Texas began to fund a series of Competitive Renewable Energy Zone
(CREZ) transmission lines and network upgrades, allowing more wind power to reach the
markets. According to the 2015 ERCOT State of the Market Report, as new CREZ projects
have been completed, wind curtailments due to transmission line limitations have been
6 ERCOT 2015 State of the Grid Report, http://ercot.com/content/news/presentations/2016/2015_StateoftheGridReport.pdf,
at page 21.

significantly reduced.7 As a result, wind capacity factors were 34, 36 and 32 percent in 2013,
2014 and 2015.
As a result of the growth in installed wind capacity and the higher production from installed
facilities, the total energy generated from wind in ERCOT steadily increased from 2005
through 2015.
Figure 3: Annual Wind Generation in ERCOT8
As a result of this growth, wind energy’s share of ERCOT’s total generation grew from 1.4
percent in 2005 to 11.7 percent in 2015. Wind’s share of the generation in ERCOT has been
even higher this year, averaging more than 16 percent of the total energy produced in
ERCOT in the first seven months of 2016.
7 ERCOT 2015 State of the Market Report, Potomac Economics Ltd., June 2016,
http://www.potomaceconomics.com/uploads/ercot_documents/2015_ERCOT_State_of_the_Market_Report_-_FINAL_update_6.21_.16_.pdf, at page 77.
8 ERCOT’s Energy by Fuel Type, 2002-2015, available at http://ercot.com/news/presentations.
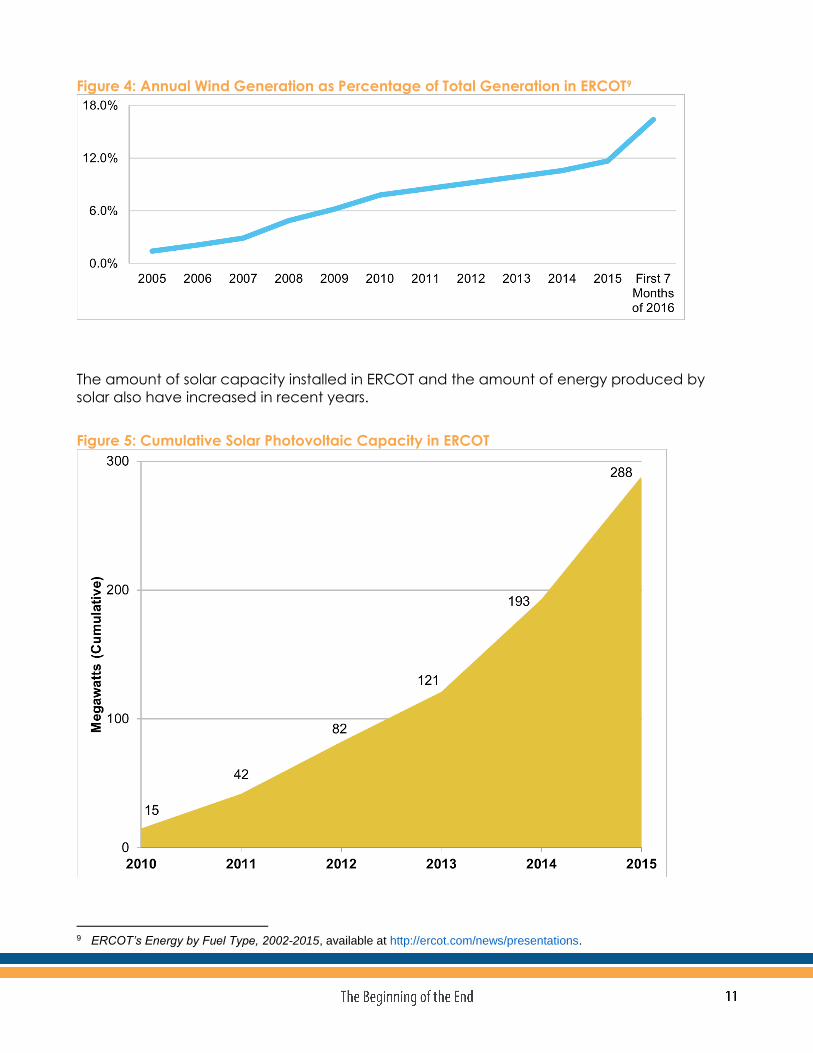
Figure 4: Annual Wind Generation as Percentage of Total Generation in ERCOT9
The amount of solar capacity installed in ERCOT and the amount of energy produced by
solar also have increased in recent years.
Figure 5: Cumulative Solar Photovoltaic Capacity in ERCOT
9 ERCOT’s Energy by Fuel Type, 2002-2015, available at http://ercot.com/news/presentations.

An additional 7,863 MW of wind capacity and 2,124 MW of solar capacity are expected to
be added to the ERCOT grid in 2016.10 ERCOT itself has recently estimated that from 14,500
MW to 27,200 MW of new solar will be added by 203111 (SNL Financial reported these
projections in an article titled “In Texas, it’s solar as far as the eye can see.”12)
The addition of more wind and solar capacity in ERCOT in coming years will increase the
economic and financial stress on coal-fired generators. Under
ERCOT’s competitive market structure, the lowest-priced
generating resources, like wind and solar (which have no fuel
costs) are dispatched on the grid ahead of fossil-fired
resources, like natural gas and coal, which do have fuel costs
and also have higher variable non-fuel operating &
maintenance (O&M) costs. Wind- and solar-generated
power, because of these cost advantages, will continue to
displace electricity from existing coal-fired generators,
reducing peak demand while keeping market prices low.
Wind resources in West Texas produce the most power during
non-summer months, mainly in off-peak hours, and their lowest
output generally occurs during summer afternoon peak
hours.1314 However, the output from wind generators in the
coastal area of ERCOT South is much more highly correlated
with peak electricity demand.15 In total, so much new wind
generation has been added in ERCOT that the wind output during summer peak periods
exceeded 5,000 MW in August 2016.16 Consequently, the existing and projected wind
capacity in ERCOT has and will continue to compete with (and likely displace) generation
from coal-fired generators while also creating pressure to keep energy market prices low
during both peak and off-peak periods.17
Solar resources produce their maximum power during peak demand periods and are
especially highly correlated with peak summer loads. Moody’s, for example (in a report titled
ERCOT: Renewables to Hold Down Power Prices in the Lone Star State), notes the following:
Additional renewable generation capacity in an abundantly supplied ERCOT
market will hold down already low prices…
10 Wind, solar to make up nearly two-thirds of ERCOT’s 2016 capacity additions, SNL Financial, March 8, 2016. 11 ERCOT 2016 Long-Term System Assessment Update Presentation, June 21, 2016,
www.ercot.com/content/wcm/key_documents_lists/77730/2016_LTSA_Update_6_21_2016.pptx. 12 SNL Financial, June 6, 2016. 13 “Peak” hours in ERCOT are defined as 7 am through 10 pm, Monday through Friday. The remaining hours of the week
are “off peak.” 14 2015 ERCOT State of the Market Report,
http://www.potomaceconomics.com/uploads/ercot_documents/2015_ERCOT_State_of_the_Market_Report_-_FINAL_update_6.21_.16_.pdf, at page 74.
15 Id., at page 76. 16 Record demand brings ERCOT generators little relief from weak power market, SNL Financial, August 12, 2016. 17 Early in July 2016, wind set a new record for mid-summer dispatch in ERCOT, producing approximately 23 percent of the
total market share during a hot peak day. Why the Latest EFH Disclosures Matter for Texas Power Recovery, UBS Securities, July 14, 2016, https://neo.ubs.com/shared/d1GXn81fwtdl/, at page 8.

The resulting impact of additional renewable generation will be the
continuation of low power prices in line with prices experienced in 2015, as
ERCOT already has an ample supply of existing power generation…
The prospect of substantial new wind generation bodes ill for the merchant
generators [emphasis added] for several reasons….
While solar installations are growing from a very small base, the impact of solar-
derived electricity generally impacts peak, day-time usage more than wind…
The combination of substantial new wind farms and solar build-out, however
modest, would lower night-time and mid-day peaks, and further reduce
wholesale prices as well as the on-peak/off-peak disparity…18
What Moody’s is saying, in essence, is that even relatively small amounts of additional solar
capacity will put additional pressure on peak hour energy market prices to remain low while
existing and new wind capacity will continue to put pressure on energy market prices during
both peak- and off-peak hours.
UBS Investment Research reports similarly that both wind and solar pose a potential risk to
existing coal generators in ERCOT, with “the declining cost of utility-scale solar as among the
greatest risks to the timeline in the recovery in [the ERCOT] market…”19 By recovery, UBS
meant the potential for higher energy market prices.
The threat to coal from renewable resources can be seen in the data on generation by fuel
in ERCOT the first seven months of 2016 versus the same period in 2015. As shown in Figure 6,
below, the total generation from coal in ERCOT was approximately 6 million MWh lower in the
seven months of 2016 versus the same months in 2015. At the same time, generation from
wind was up by 7.4 million MWh during those same months in 2016.
18 ERCOT: Renewables to Hold Down Power Prices in the Lone Star State, Moody’s Investors Service, 23 March 2016, at
pages 1 through 4. 19 US Electric Utilities & IPPs: The Texas Tidal Wave of Air Regs, UBS 17 March 2016,
https://neo.ubs.com/shared/d1oQ9S2aT0D0g/, at pages 7 and 8.

Figure 6: Generation in ERCOT by Fuel Type in the First 7 Months of 2016 vs. the Same Period in
2015.20
Clearly, the additional 7.4 Million MWh generated by wind so far in 2016 has displaced both
coal-fired and natural gas-fired electricity given that total ERCOT generation was down by
only 460,000 MWh and nuclear generation was up only slightly. Gas, coal, wind and nuclear
are by far the most significant sources of electric generation in ERCOT. This displacement of
coal (and natural gas) by renewable resources can be expected to grow over time as
additional wind and solar resources are added to the ERCOT grid.
20 Data from ERCOT’s 2015 and 2016 Demand and Energy Reports, Tabs for Energy by Fuel Type,
http://ercot.com/news/presentations.
The substantial drop in natural gas prices beginning in late 2008, reinforced more recently by
the surge of new renewable resources, has made it difficult, if not impossible, for coal-fired
generators in Texas to compete. As a result, the amount of power generated by coal-fired
generators, including the seven plants evaluated in this report, has declined significantly. This
trend is readily apparent in looking at individual plant and ERCOT-wide generation data.
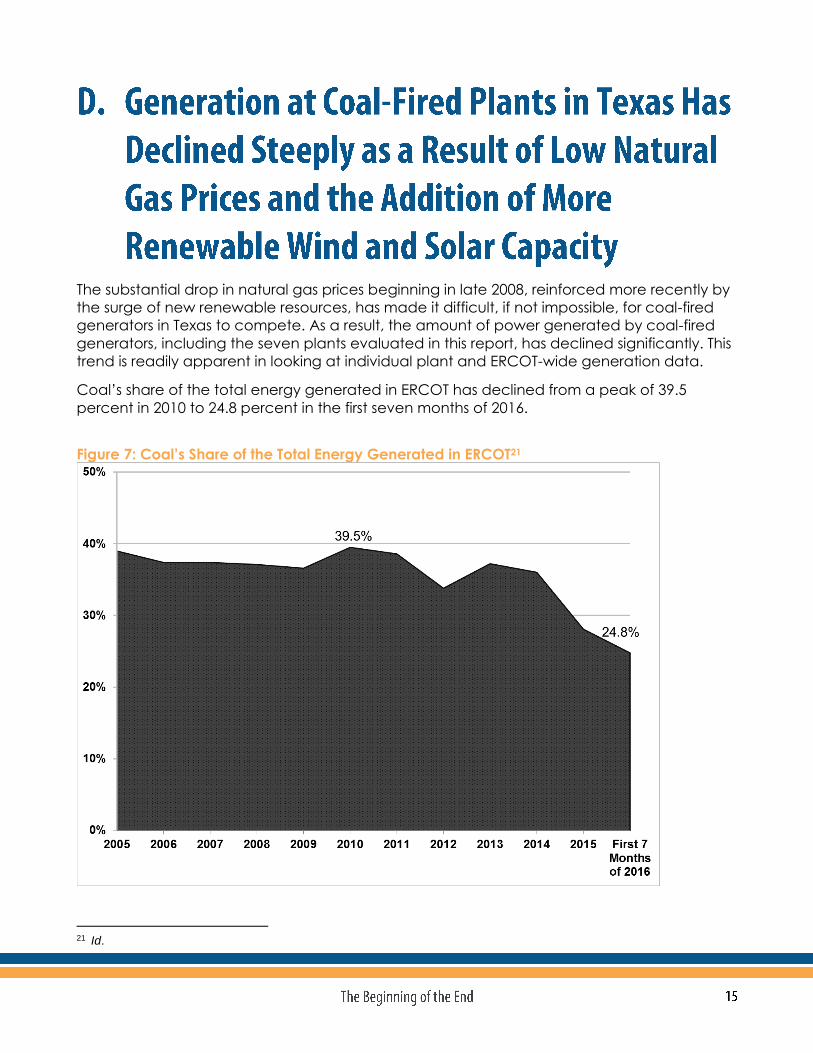
Coal’s share of the total energy generated in ERCOT has declined from a peak of 39.5
percent in 2010 to 24.8 percent in the first seven months of 2016.
Figure 7: Coal’s Share of the Total Energy Generated in ERCOT21
21 Id.

The decline in ERCOT-wide coal-fired generation, shown in Figure 7, is reflected in declines in
the generation at individual coal-fired generators from 2008 through 2015.
Figure 8: Declines in Generation at Texas Coal-Fired Plants Between 2008 and 201522
Moreover, generation at these coal-fired plants generally has continued to decline, as can
be seen by comparing their output in the first five months of 2015 with the same months in
2016, as shown in Figure 9, below.
22 Data from EIA Form 923 filings downloaded from SNL Financial.
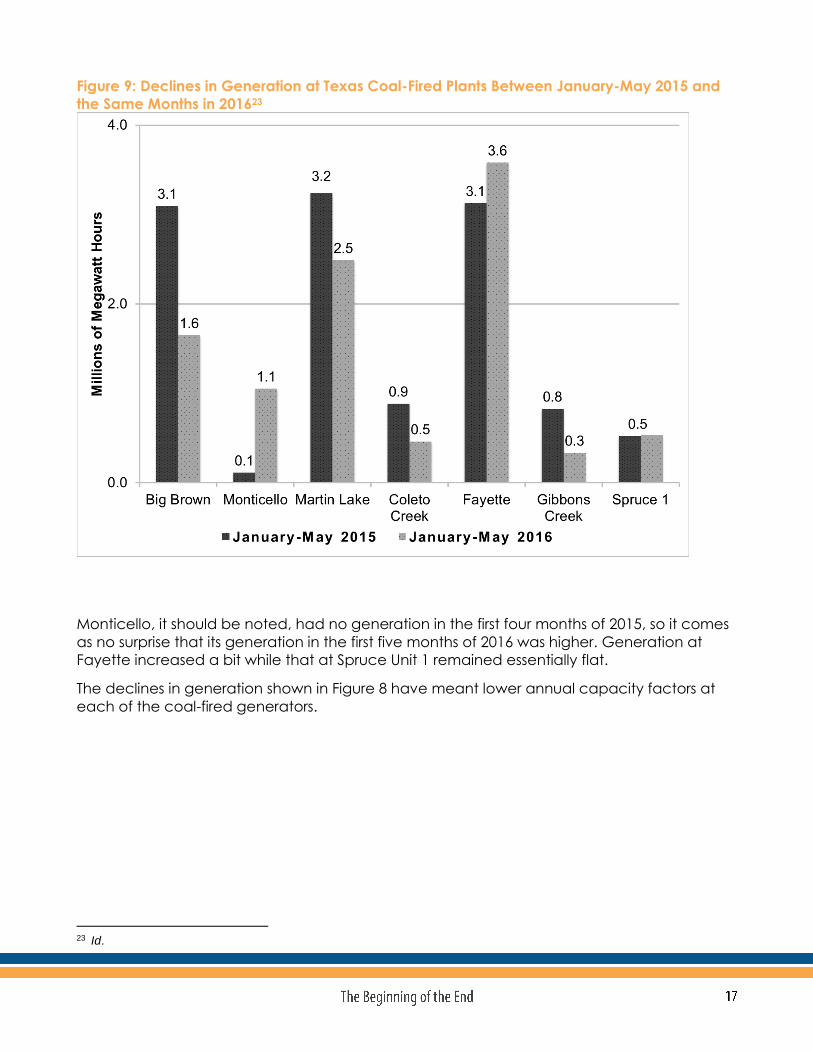
Figure 9: Declines in Generation at Texas Coal-Fired Plants Between January-May 2015 and
the Same Months in 201623
Monticello, it should be noted, had no generation in the first four months of 2015, so it comes
as no surprise that its generation in the first five months of 2016 was higher. Generation at
Fayette increased a bit while that at Spruce Unit 1 remained essentially flat.
The declines in generation shown in Figure 8 have meant lower annual capacity factors at
each of the coal-fired generators.
23 Id.
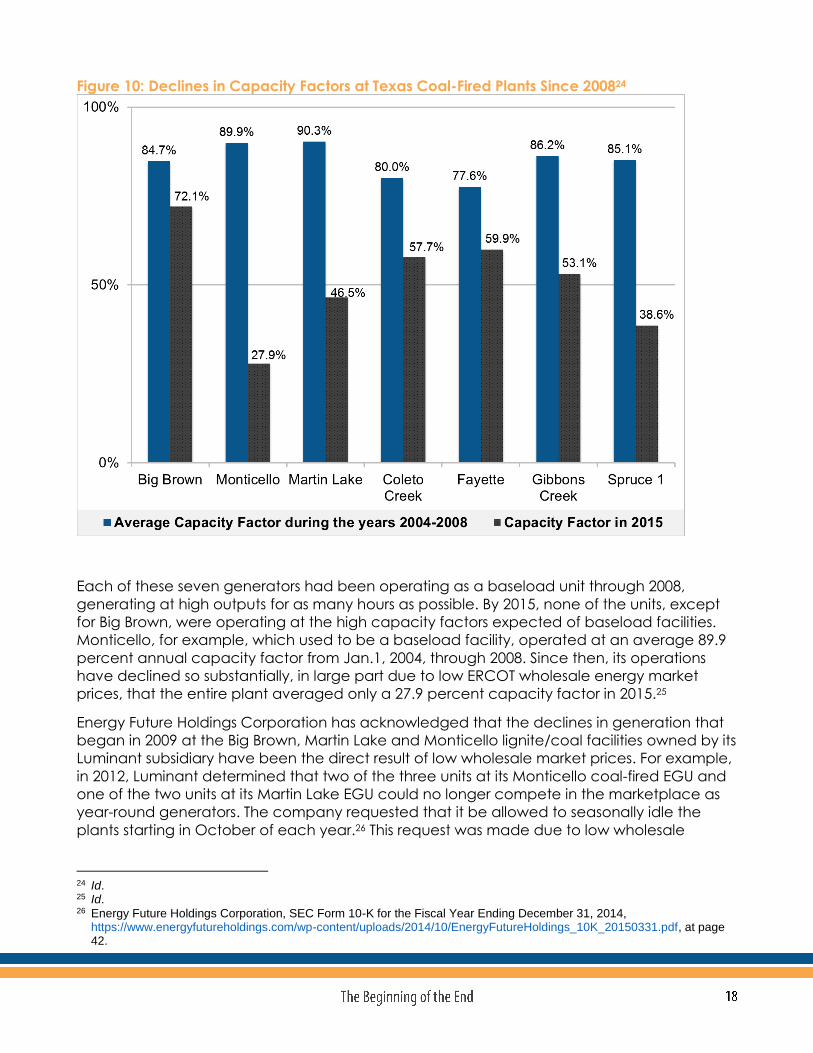
Figure 10: Declines in Capacity Factors at Texas Coal-Fired Plants Since 200824
Each of these seven generators had been operating as a baseload unit through 2008,
generating at high outputs for as many hours as possible. By 2015, none of the units, except
for Big Brown, were operating at the high capacity factors expected of baseload facilities.
Monticello, for example, which used to be a baseload facility, operated at an average 89.9
percent annual capacity factor from Jan.1, 2004, through 2008. Since then, its operations
have declined so substantially, in large part due to low ERCOT wholesale energy market
prices, that the entire plant averaged only a 27.9 percent capacity factor in 2015.25
Energy Future Holdings Corporation has acknowledged that the declines in generation that
began in 2009 at the Big Brown, Martin Lake and Monticello lignite/coal facilities owned by its
Luminant subsidiary have been the direct result of low wholesale market prices. For example,
in 2012, Luminant determined that two of the three units at its Monticello coal-fired EGU and
one of the two units at its Martin Lake EGU could no longer compete in the marketplace as
year-round generators. The company requested that it be allowed to seasonally idle the
plants starting in October of each year.26 This request was made due to low wholesale
24 Id. 25 Id. 26 Energy Future Holdings Corporation, SEC Form 10-K for the Fiscal Year Ending December 31, 2014,
https://www.energyfutureholdings.com/wp-content/uploads/2014/10/EnergyFutureHoldings_10K_20150331.pdf, at page 42.
electricity prices.27 A Luminant spokesperson explained that “[w]ith power prices very low,
those two units are not economical to run during these low demand seasons.”28 In other
words, the company wanted to limit generation to periods when market prices are higher
than plant variable operating costs.
There is no reason to expect that the generation at any of these coal-fired generators will
rebound significantly. Although retirement of some coal-fired capacity will provide some
benefit to units that are not retired, natural gas prices are not expected to increase
substantially (as shown in Figure 1, above). Moreover, the low-cost output from the thousands
of MW of new wind and solar capacity that will be installed in coming years will displace the
electricity that would have been produced at these coal-fired generators and will keep
energy market prices low.
In fact, EFH has announced that as part of its plan to emerge from Chapter 11 bankruptcy,
Martin Lake and Monticello will be dispatched only seasonally after 2016.2930 According to
EFH’s July 12, 2016, presentation to lenders, this should reduce the total annual generation at
both plants by more than 7.6 million MWh.
The shift from coal-fired generation has not subjected customers to increased costs.
In fact, Texas’ increased reliance on natural gas and renewables for power
generation has been accompanied by a dramatic decrease in average electricity
prices, with average annual real-time market prices within ERCOT declining from
approximately $70 per MWh in 2005 to less than $27 per MWh in 2015.
This means that as coal-fired generators are under pressure due to declining generation, they
are under additional pressure for producing less revenue per megawatt hour of power sold
into the market. This is true for both peak and off-peak periods,31 as shown in Figures 11 and
12, below:
27 Id. 28 Id. 29 Texas Competitive Electric Holdings Company Lender Presentation, July 12, 2016, at page 28. 30 The presentation is unclear about whether Big Brown also will be dispatched seasonally beginning in 2017 and
subsequent years. 31 The peak hours in ERCOT are 7 am to 10 pm, Monday through Friday. The remaining hours of the week are off-peak.
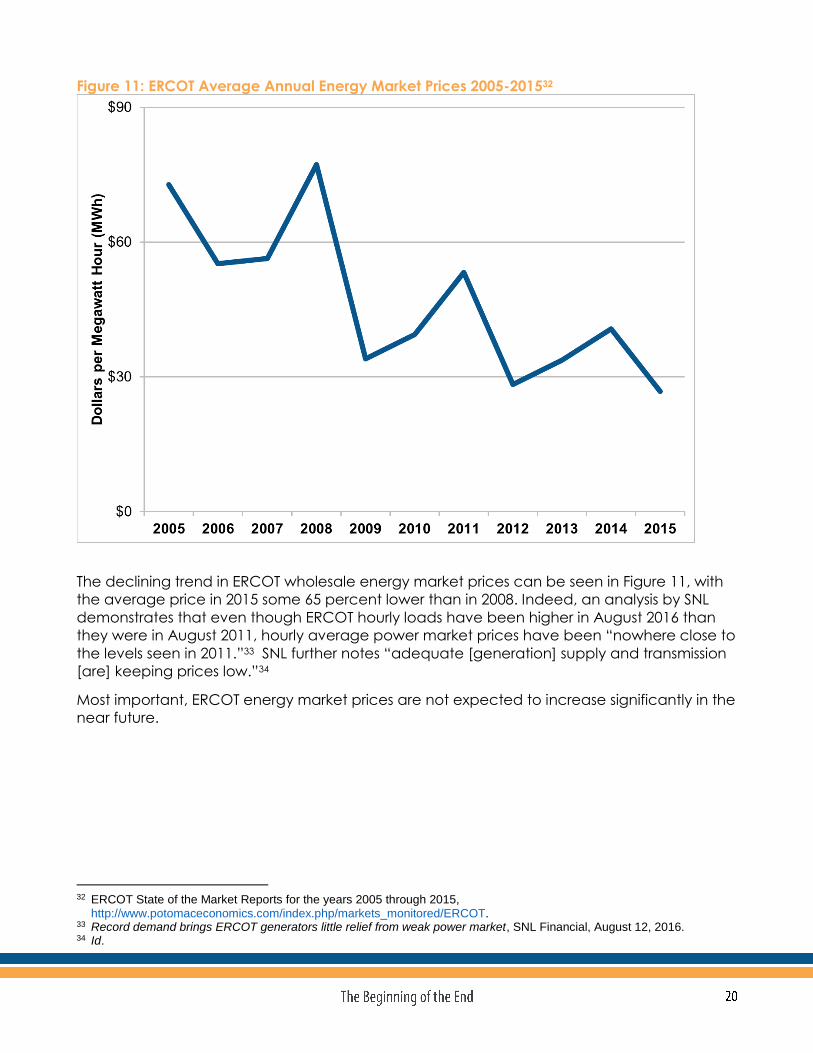
Figure 11: ERCOT Average Annual Energy Market Prices 2005-201532
The declining trend in ERCOT wholesale energy market prices can be seen in Figure 11, with
the average price in 2015 some 65 percent lower than in 2008. Indeed, an analysis by SNL
demonstrates that even though ERCOT hourly loads have been higher in August 2016 than
they were in August 2011, hourly average power market prices have been “nowhere close to
the levels seen in 2011.”33 SNL further notes “adequate [generation] supply and transmission
[are] keeping prices low.”34
Most important, ERCOT energy market prices are not expected to increase significantly in the
near future.
32 ERCOT State of the Market Reports for the years 2005 through 2015,
http://www.potomaceconomics.com/index.php/markets_monitored/ERCOT. 33 Record demand brings ERCOT generators little relief from weak power market, SNL Financial, August 12, 2016. 34 Id.
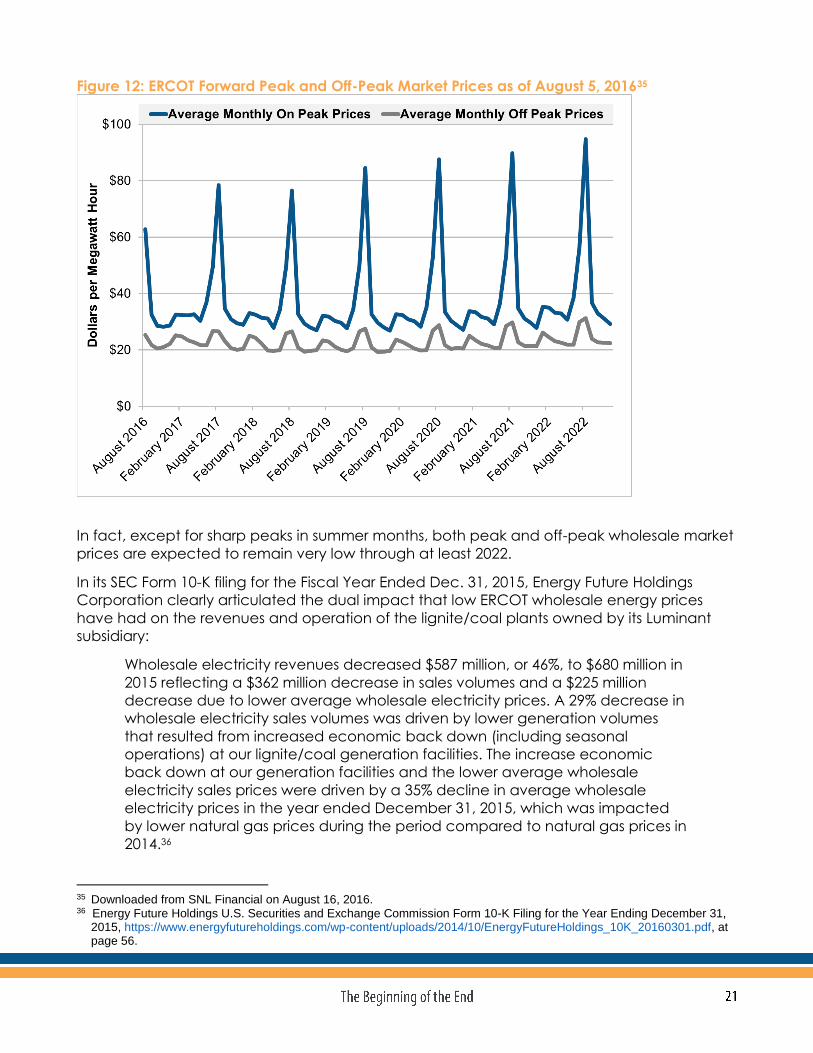
Figure 12: ERCOT Forward Peak and Off-Peak Market Prices as of August 5, 201635
In fact, except for sharp peaks in summer months, both peak and off-peak wholesale market
prices are expected to remain very low through at least 2022.
In its SEC Form 10-K filing for the Fiscal Year Ended Dec. 31, 2015, Energy Future Holdings
Corporation clearly articulated the dual impact that low ERCOT wholesale energy prices
have had on the revenues and operation of the lignite/coal plants owned by its Luminant
subsidiary:
Wholesale electricity revenues decreased $587 million, or 46%, to $680 million in
2015 reflecting a $362 million decrease in sales volumes and a $225 million
decrease due to lower average wholesale electricity prices. A 29% decrease in
wholesale electricity sales volumes was driven by lower generation volumes
that resulted from increased economic back down (including seasonal
operations) at our lignite/coal generation facilities. The increase economic
back down at our generation facilities and the lower average wholesale
electricity sales prices were driven by a 35% decline in average wholesale
electricity prices in the year ended December 31, 2015, which was impacted
by lower natural gas prices during the period compared to natural gas prices in
2014.36
35 Downloaded from SNL Financial on August 16, 2016. 36 Energy Future Holdings U.S. Securities and Exchange Commission Form 10-K Filing for the Year Ending December 31,
2015, https://www.energyfutureholdings.com/wp-content/uploads/2014/10/EnergyFutureHoldings_10K_20160301.pdf, at page 56.

This $587 million reduction in wholesale electricity revenues was offset to only a relatively
minor extent by a $48 million reduction in the cost of fuel for the lignite/coal facilities
(reflecting the lower generation volumes partially offset by higher lignite mining costs and the
use of more Western coal in the fuel blend) plus some unspecified, but probably minor, non-
fuel operating cost savings.37
ERCOT’s own reports similarly reflect how low energy market prices have led to the seasonal
mothballing of coal-fired EGU capacity.
Specifically, in its own analysis of the impacts of environmental regulations, which included
EPA’s regional haze plan for Texas and Oklahoma, ERCOT noted that since 2011, it has
observed “the seasonal mothballing of almost 2,000 MW of coal capacity... due primarily to
lower wholesale power prices, and not environmental regulations.”38
It is reasonable to expect that aging coal plants will have substantial operating and
maintenance costs, significant annual capital expenditures, and, perhaps, degrading
operating performance. As shown in Figure 13, below, the average age of the units at
Luminant’s Big Brown, Martin Lake and Monticello plants is 40 years old. Other than Fayette 3,
none of the units at these seven plants is younger than 33.
37 Id. 38 ERCOT, Impacts of Environmental Regulations in the ERCOT Region, December 6, 2014,
http://ercot.com/content/news/presentations/2016/Impacts%20of%20Environmental%20Regulations%20in%20the%20ERCOT%20Region.pdf.
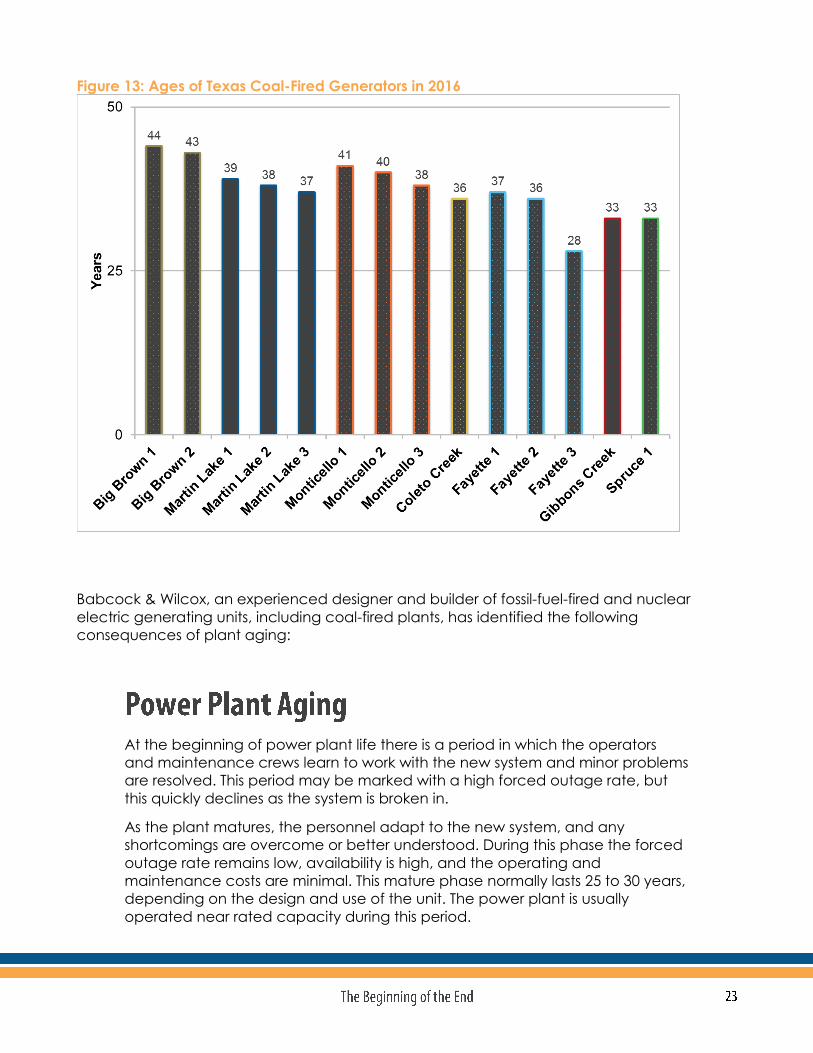
Figure 13: Ages of Texas Coal-Fired Generators in 2016
Babcock & Wilcox, an experienced designer and builder of fossil-fuel-fired and nuclear
electric generating units, including coal-fired plants, has identified the following
consequences of plant aging:
At the beginning of power plant life there is a period in which the operators
and maintenance crews learn to work with the new system and minor problems
are resolved. This period may be marked with a high forced outage rate, but
this quickly declines as the system is broken in.
As the plant matures, the personnel adapt to the new system, and any
shortcomings are overcome or better understood. During this phase the forced
outage rate remains low, availability is high, and the operating and
maintenance costs are minimal. This mature phase normally lasts 25 to 30 years,
depending on the design and use of the unit. The power plant is usually
operated near rated capacity during this period.
Following this phase, the aging process becomes noticeable. Forced outages
and maintenance costs increase and availability declines. Component end of
life usually causes the higher forced outage rate. Occasional operational error
and the degradation of boiler components due to erosion, corrosion, creep
and fatigue lead to localized failures. The forced outage rate steadily increases
during this phase unless major overhauls or component replacements are
instituted.39
As the aging plant becomes less reliable, its role is often changed. Newer, more
reliable plants are less costly to maintain and are generally more efficient to
handle the base power load. The older plants become auxiliary units or are
designated for peaking service. Older plants with higher heat rates, i.e., lower
efficiencies, or with low capacity may be retired. Prior to the 1980s, it was
assumed that older plants would be torn down to make room for the newer,
larger, more efficient units. It was common to retire a plant after 35 to 40 years
of service.
This planned obsolescence began to change in the early 1980s. The cost of
newer, more efficient plants became more than most boiler operators could
readily finance. As a result, new construction was delayed and plans to retire
the older plants were put on hold. The need to keep the older units running
brought about a new strategy of life extension. This is a strategy that delays the
plant retirement while maintaining acceptable availability. The strategy
requires the replacement of some components to keep the plant running with
acceptable forced outage rates and maintenance costs. These replacements
or repairs expand upon those traditionally incorporated in a plant maintenance
program. Significant capital expenditures are normally required to affect the
availability rate.”40
It is reasonable to expect that additional coal-fired generators will be retired in coming years
due to unfavorable economics resulting from (a) higher annual operating and maintenance
costs as they age; (b) the need for additional capital investments as they age; and (c)
degradation in their operating performance as they age, in terms of lower net generation
and higher planned and forced outage rates.
In conjunction with the availability and cost of lower cost natural gas and renewable wind
and solar resources, these factors will undermine the future viability of existing coal-fired
generators and will affect when individual coal-fired units will be retired.
39 Babcock & Wilcox, Steam, Its Generation and Use, 40th Edition, (1992), Chapter 46, at pages 46-1 et seq. 40 Id. at pages 46-1 and 46-2.

A significant number of coal-fired generators in ERCOT are at risk of having to make
substantial investments in new environmental controls to address pending U.S. Environmental
Protection Agency rules and regulations:
Part 1 of EPA’s Regional Haze rule finalized in January 2016 mandates controls required to
make “Reasonable Progress” toward natural visibility in national parks. This rule would
require new FGD scrubbers at seven coal-fired generators including Big Brown Units 1&2,
Monticello Units 1&2 and Coleto Creek.41 Scrubber upgrades also would be required at
Martin Lake Units 1-3, and Monticello Unit 3.
Part 2 of the Regional Haze Rule would require Best Available Retrofit Technology (BART)
for units that were in operation or under construction in 1977. This rule would likely require
comparable emissions-reductions technologies to the Reasonable Progress rules
published in Part 1, including new scrubbers or scrubber retrofits at Big Brown, Martin Lake
and Monticello, even if the Part 1 rule ultimately is vacated by the federal courts.42 The
BART could also require reductions in nitrogen oxide (NOx) emissions from eligible sources.
There is an EPA deadline for the BART rule to be proposed by December of this year, with
finalization by September 2017.
EPA also has proposed to designate the counties in Texas surrounding the Big Brown,
Martin Lake and Monticello plants as being in nonattainment for the SO2 National
Ambient Air Quality Standard (NAAQS standard). Sources in nonattainment areas are
generally required to install “reasonably available control technology” plus whatever
additional controls might be needed to bring an area into attainment, which could be
expected to include new scrubbers or scrubber upgrades at least the Big Brown, Martin
Lake and Monticello plants.
The ozone nonattainment status of the Dallas/Fort Worth Metro area for the 2008 ozone
NAAQS, as well as the proposed nonattainment designation under the 2015 standard,
could impact numerous plants including Big Brown, Martin Lake and Monticello, as well as
NRG’s Limestone plant and the AEP plants in East Texas. Compliance with the ozone
NAAQS could potentially require SCR (selective catalytic control) retrofits or SNCR
(selective non-catalytic control equipment) to control NOx emissions from coal plants.
Luminant has said that adding or retrofitting scrubbers in order to comply with EPA
rules “will impose massive costs.”43 More specifically, Luminant has said that it would
41 Under the EPA Part 1 Regional Haze Rule new scrubbers also would be required at Tolk Units 171B&172B, W.A. Parish
Units 5-7, and Welsh Units 1-3. Scrubber retrofits also would be required at Limestone Units 1&2, W.A. Parish 8, and Sandow Unit 4.
42 Other plants subject to the Part 2 BART file would include Parish, Harrington and Welsh. 43 Declaration of Robert Frenzel, Sr., Vice President and Chief Financial Officer, Luminant Generation Company LLC,
Regional Haze Litigation, Case 16-60118, at Paragraph 19.
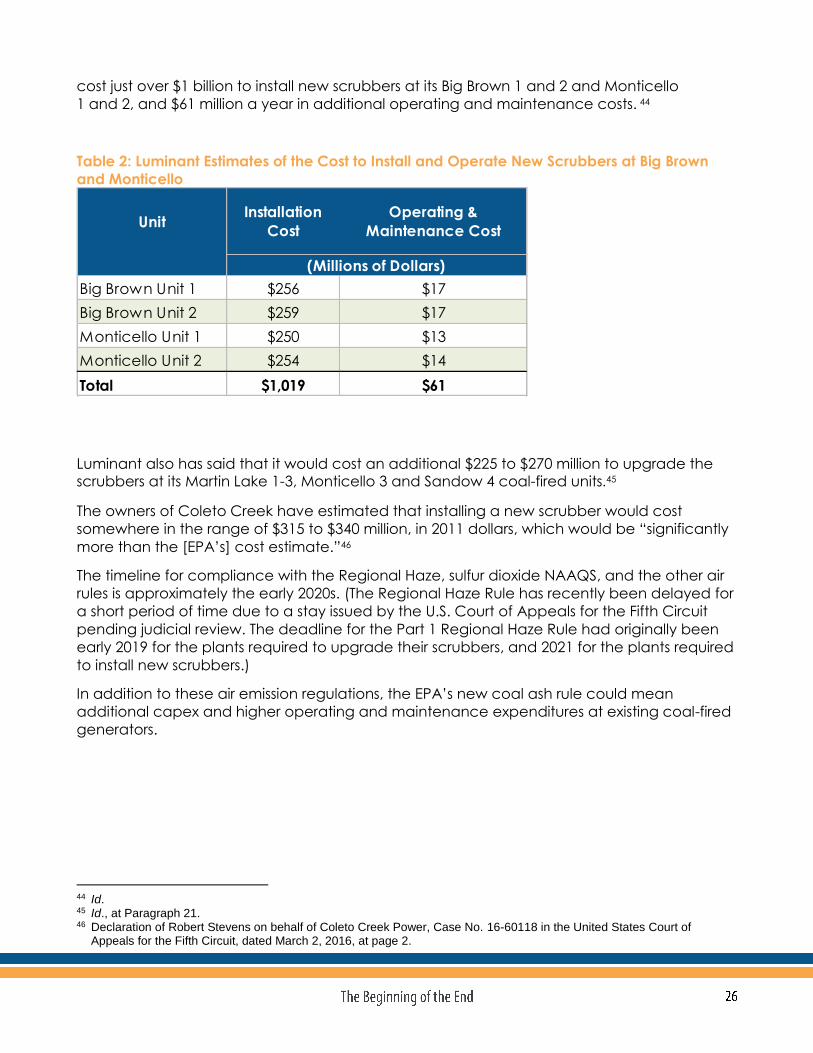
cost just over $1 billion to install new scrubbers at its Big Brown 1 and 2 and Monticello
1 and 2, and $61 million a year in additional operating and maintenance costs. 44
Table 2: Luminant Estimates of the Cost to Install and Operate New Scrubbers at Big Brown
and Monticello
Luminant also has said that it would cost an additional $225 to $270 million to upgrade the scrubbers at its Martin Lake 1-3, Monticello 3 and Sandow 4 coal-fired units.45
The owners of Coleto Creek have estimated that installing a new scrubber would cost
somewhere in the range of $315 to $340 million, in 2011 dollars, which would be “significantly
more than the [EPA’s] cost estimate.”46
The timeline for compliance with the Regional Haze, sulfur dioxide NAAQS, and the other air
rules is approximately the early 2020s. (The Regional Haze Rule has recently been delayed for
a short period of time due to a stay issued by the U.S. Court of Appeals for the Fifth Circuit
pending judicial review. The deadline for the Part 1 Regional Haze Rule had originally been
early 2019 for the plants required to upgrade their scrubbers, and 2021 for the plants required
to install new scrubbers.)
In addition to these air emission regulations, the EPA’s new coal ash rule could mean
additional capex and higher operating and maintenance expenditures at existing coal-fired
generators.
44 Id. 45 Id., at Paragraph 21. 46 Declaration of Robert Stevens on behalf of Coleto Creek Power, Case No. 16-60118 in the United States Court of
Appeals for the Fifth Circuit, dated March 2, 2016, at page 2.
UnitInstallation
Cost
Operating &
Maintenance Cost
Big Brown Unit 1 $256 $17
Big Brown Unit 2 $259 $17
Monticello Unit 1 $250 $13
Monticello Unit 2 $254 $14
Total $1,019 $61
(Millions of Dollars)
The fundamental market forces and factors discussed above have led to dramatic declines
in the values of the U.S. coal fleet in general, and the Texas coal fleet in particular.
In 2015, Energy Future Holdings took an impairment of $2.541 billion for the Big Brown, Martin
Lake, Monticello, Sandow 4 and Sandow 5 lignite/coal plants and related mining facilities,
owned by its subsidiary, Luminant. According to EFH, this write-off was the “result of
impairment factors related to the continued decline in forecasted wholesale electricity
prices in ERCOT.”47 This loss in value followed EFH’s 2014 write-off of $4.640 billion of the value
of the Martin Lake, Monticello and Sandow 5 and related mining facilities.48
In fact, Luminant has been heavily dependent on coal-fired generation for many years,
having bet extensively on high gas and clean energy price when it made its strategic
investment decisions to rely on coal.49 When EFH filed for bankruptcy on April 29, 2014, it
conceded it had lost that bet and that lower power prices had made its coal fleet
uneconomic to operate. This is one of the largest bankruptcies in U.S. history.50
Luminant has recently aggressively sought to have the appraised values of its coal-fired
generators reduced in order to lower its property tax bills.
47 Energy Future Holdings Corporation SEC Form 10-K filing for the Year Ended December 31, 2015,
https://www.energyfutureholdings.com/wp-content/uploads/2014/10/EnergyFutureHoldings_10K_20160301.pdf, at page 103.
48 Id. 49 Ken Silverstein, Big gamble felled Energy Future Holdings. Safe bet could resuscitate it, The Christian Science Monitor
(May 2, 2014) (“‘It teaches a lesson, which is using debt to make a bet on gas prices is unwise,’ says Bob Bellemare, chief operating officer of consulting firm Mykrobel in New Mexico, in an interview. ‘They bet and they lost and this is the aftermath.’”), http://www.csmonitor.com/Environment/Energy-Voices/2014/0502/Big-gamble-felled-Energy-Future-Holdings.-Safe-bet-could-resuscitate-it.
50 Jim Malewitz, Massive Bankruptcy Tests Texas Utility Regulators, The Texas Tribune, August 28, 2015, https://www.texastribune.org/2015/08/28/mammoth-bankruptcy-deal-looms-texas-utility-regula/.

Figure 14: Declining Tax Values of EFH’s Coal-Fired Generators
When the Titus County Appraisal Review Board recently appraised the entire Monticello plant
at $341 million for tax purposes, Luminant argued for an appraisal of only $50 million.51
It’s not only the owners of older coal plants who have argued that low natural gas prices and
competition from renewable resources have reduced the value of their assets. The owners of
the three-year old Sandy Creek plant recently challenged the appraised values of $900
million for 2014 and $850 million for 2015, arguing that no willing buyer would have paid more
than $380 million for the plant in 2014 or $395 million in 2015.52 A jury agreed, cutting the tax
appraisal by more 50 percent, close to what the owners had wanted.
51 Board stands ground on plant appraisal, Marcia Davis, The Daily Tribune, July 1, 2015,
http://www.dailytribune.net/news/board-stands-ground-on-plant-appraisal/article_4808f3fa-2041-11e5-9ec6-fbbde6d434de.html.
52 Jury cuts Riesel coal plant’s tax appraisal by more than half, Waco Tribune, August 28, 2016, http://www.wacotrib.com/news/business/jury-cuts-riesel-coal-plant-s-tax-appraisal-by-more/article_c787fb74-8b22-5856-b473-8a1ee64a2528.html.
IEEFA has analyzed the financial viability of seven individual coal-fired generating plants—the
Big Brown, Martin Lake and Monticello plants owned by EFH’s Luminant subsidiary and the
Coleto Creek plant owned by Dynegy; and three plants owned by municipal utilities or
power agencies—the Fayette Power Project, Gibbons Creek, and J.K. Spruce Unit 1.
– Except for Monticello and Martin Lake, IEEFA has assumed that each plant’s
monthly generation beginning in 2017 will be the same as the plant produced during the 12-
month period from June 2015 through May 2016—the most recent 12-month period for which
generation data is publicly available. We have conservatively assumed that these seven
plants will not experience any further declines in generation beyond those presented in
Figures 8 through 10, above. Following EFH’s guidance to investors, we also have assumed
that Martin Lake and Monticello will operate as seasonal generators beginning in 2017.53
– We have used the monthly peak and off-peak forward prices for the
ERCOT energy market as of August 5, 2016. These forward prices reflect the market’s low
expectation for future energy prices.
– Almost no public
available information is available on the annual fuel and non-fuel O&M costs and capex
expenditures at any of the seven coal-fired generators that are the subject of this report.
Therefore, IEEFA has based its analyses on a blending of (1) SNL Financials modeled fuel &
non-fuel O&M costs from a regression analysis based on the costs at comparable plants of
similar size, age and location and (2) the reported costs for the regulated Harrington,
Oklaunion, Pirkey, Tolk and Welsh coal plants in Texas that are required to publicly report their
annual fuel and non-fuel O&M costs and the plant investment data from which their annual
capex expenditures can be derived.
We have used the following input assumptions in our analyses:
Fuel costs are based on SNL Financials modeled fuel costs for each plant for 2015,
escalated at an annual rate of 2 percent. The analyses also reflect the transition at Big
Brown and Monticello to only burning coal from the Powder River Basin.
Non-fuel variable O&M costs are assumed to be $5 per MWh in 2017 and then escalated
at a 2 percent annual rate in subsequent years.
53 Texas Competitive Electric Holdings Company Lender Presentation, July 12, 2016, at page 28.
Fixed non-fuel O&M costs are assumed to be $30 per kW-year beginning in 2017 and
escalated at a 2 percent annual rate in subsequent years.
Annual capex is assumed to be $7 per kW-year in each year. These are assumed to
reflected non-environmental capex.
The only new environmental costs included in this analysis would be the costs of adding new
scrubbers or retrofitting the existing scrubbers at the Big Brown, Martin Lake, Monticello, and
Coleto Creek plants. These costs are presented in Section G, above. Based on the recent
stay of the Regional Haze Rule by the U.S. Court of Appeals, we have assumed that the new
or retrofit scrubbers will not be installed until the end of 2021. This represents roughly a delay
of a year.
IEEFA has examined the viability of each of the plants under three cost and generation
scenarios. The base-case scenario uses the projected levels of generation discussed above
and forward market prices as of August 5.
We have also investigated two sensitivity scenarios. In the lower-generation scenario we
have assumed generation at each plant is 10 percent lower in each of the years 2017-2024
than we assumed in the base case. Energy market prices are the same in this sensitivity as in
the base-case scenario.
The second sensitivity scenario reflects lower market prices. In this scenario we have assumed
that energy market prices will be 5 percent lower than the August 5 forward prices used in
the base case. Coal plant generation in this scenario is the same as in the base-case
scenario.
It is important to emphasize that neither the low generation sensitivity nor the low energy
market price sensitivity are worst-case analyses. In fact, it is quite possible, even likely, that
actual generation at the coal-fired generators we’re evaluating will be more than 10
percent lower than assumed in our base case. Similarly, it is possible that actual energy
market prices will be more than 5 percent, on average, lower than current forward prices.
In addition, all of the generators face the risk, even in our base case, that their future
operating and maintenance (O&M) expenditures (fixed or variable) and capex investments
will be larger than we have assumed in all of the scenarios. If this were to happen, any
positive pre-tax earnings shown in our analyses likely would disappear, and any losses would
become even more substantial.
For the Big Brown, Martin Lake, Monticello and Coleto Creek plants we have assumed two
cases: one in which, as appropriate, each plant either installs new scrubbers or retrofits
existing scrubbers to comply with the environmental regulations discussed in Section G of this
report, and one in which they do not.

The results of our financial viability analyses are presented in Figures 15, 16 and 17, as the
average annual net pre-tax earnings or losses for each plant for the years 2017-2024, except
for Gibbons Creek, whose results are presented for the years 2019-2024 because the four
power purchase agreements (PPA) for the power from that plant terminate in September
2018.
Figure 15: Profitability of Coal-Fired Generators in IEEFA Base-Case Scenario
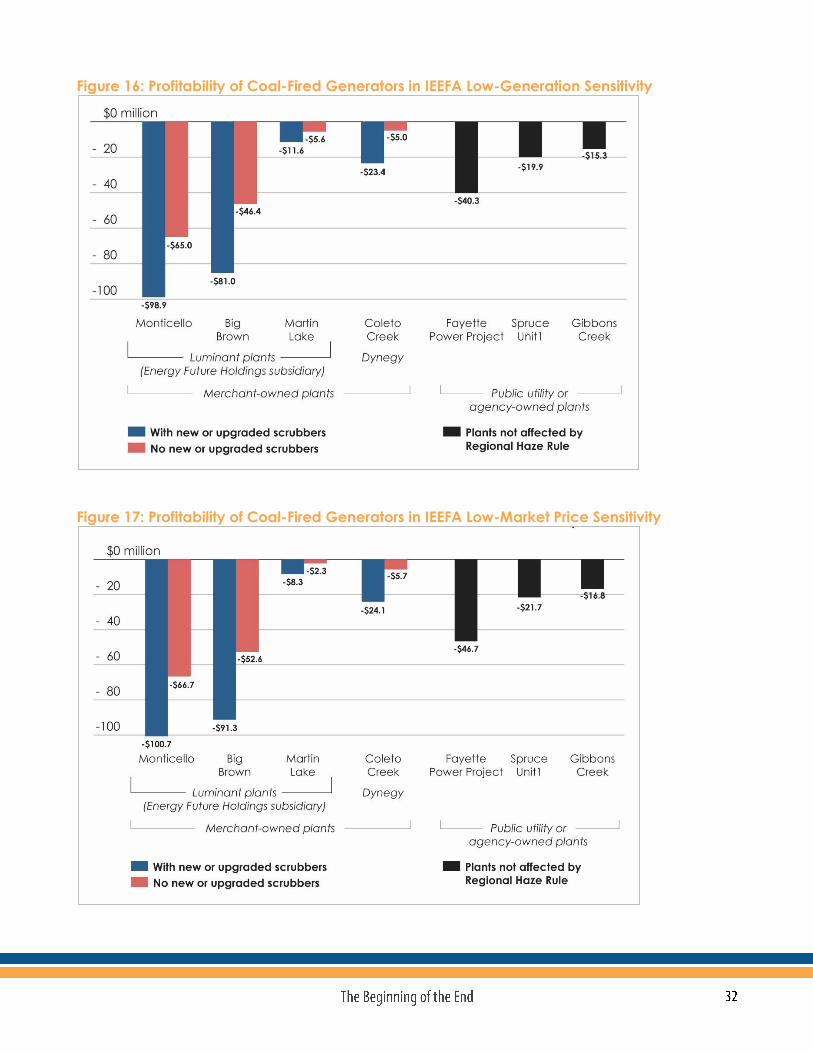
Figure 16: Profitability of Coal-Fired Generators in IEEFA Low-Generation Sensitivity
Figure 17: Profitability of Coal-Fired Generators in IEEFA Low-Market Price Sensitivity

These figures show the following:
Continued operation of Luminant’s Monticello plant will be extremely unprofitable,
whether or not the plant is required to install new scrubbers or to retrofit the existing
scrubber on Unit 3.
Like Monticello, continued operation of Luminant’s Big Brown plant will be extremely
unprofitable, whether or not the plant is required to install new scrubbers.
Luminant’s Martin Lake plant would produce very minimal positive pre-tax earnings during
the years 2017-2024 under our base-case assumptions for generation and energy market
prices even if it does not have to retrofit its existing scrubbers. As can be seen from Figures
16 and 17, the plant would produce net losses if it generates less energy than we have
assumed in our base case or if energy market prices are lower.
Continued operation of Dynegy’s Coleto Creek plant will be unprofitable whether or not
the owner has to install a new scrubber.
Continued operation of the Fayette Power Project, owned by the Lower Colorado River
Authority and Austin Energy, will be uneconomic.54
Continued operation of J.K. Spruce Unit 1 will be uneconomic for CPS Energy and its
ratepayers.
Continued operation of Gibbons Creek will be unprofitable for any owner after the
existing PPAs end in September 2018.55
This finding is consistent with the conclusion of the Review of the Renewable Denton Plan,
prepared by The Brattle Group for the City Manager of the City of Denton.56 This review
examined the relative economics of a Renewable Denton Plan (“RDP”) that would increase
the renewable generation in the city’s portfolio from the current 40 percent of energy served
to 70 percent while adding the Denton Energy Center with six gas-fired reciprocating
engines. The review by the Brattle Group concluded that the RDP would be significantly less
expensive for ratepayers than a plan that included a renewal of the city’s PPA for power
from the Gibbons Creek plant.57
54 Austin Energy recently has agreed to develop a plan by 2017 for retiring its 50 percent share of Fayette. Environmental
groups sign on to Austin Energy rate compromise, Austin American-Statesman, August 26, 2016. Available at http://www.mystatesman.com/news/news/local/environmental-groups-sign-onto-austin-energy-rate-/nsMDc/
55 The four cities that own Gibbons Creek through the Teas Municipal Power Agency have apparently found a buyer for the plant who has not yet been publicly identified. Denton Record-Chronicle, August 23, 2016. Available at http://www.dentonrc.com/local-news/local-news-headlines/20160823-denton-paves-way-for-sale-of-coal-plant.ece
56 Review of the Renewable Denton Plan Final Report, The Brattle Group, June 10, 2016. 57 Id., at page 47.
The ERCOT 2015 State of the Market Report has found that many coal-fired generators were
likely not profitable in in 2015:
Given the very low energy prices during 2015 in non-shortage hours, the
economic viability of existing coal and nuclear units was evaluated. The prices
in these hours, which have been substantially affected by the prevailing natural
gas prices, determine the vast majority of net revenues received by these
baseload units….
… As with nuclear units, it appears that coal units were likely not profitable in
ERCOT during 2015. This is significant because the retirement or suspended
operation of some of these units could cause ERCOT’s capacity margin to fall
below the minimum target more quickly than anticipated.58
At the same time, ERCOT’s recently released 2016 Long-Term System Assessment Update
(LTSA) concluded that between 8,000 MW and 18,000 MW of Texas’s existing coal-fired
generators will be retired between 2017 and 2031. In all eight of the scenarios modeled by
ERCOT59, these retirements will include: Monticello 3, and Martin Lake 1, 2 and 3 (a total of
3,260 MW) by February 2019 and Big Brown Units 1 and 2, Monticello Units 1 and 2, and
Coleto Creek (3,018 MW) by February 2021.60 The main drivers of these results will be future
natural gas prices, wind and solar capital costs. 61
As shown in Figure 18, below, ERCOT also projected that large amounts of new solar
capacity would be added in all scenarios—from a low of 14,500 MW in the Low Natural Gas
Price scenario to a high of 28,100 MW in the Environmental Mandate scenario.62
58 ERCOT 2015 State of the Market Report,
http://www.potomaceconomics.com/uploads/ercot_documents/2015_ERCOT_State_of_the_Market_Report_-_FINAL_update_6.21_.16_.pdf, at page 94.
59 ERCOT 2016 LTSA Update Presentation, dated 6/21/2016, at pages 14-22. Available at http://www.ercot.com/calendar/2016/6/21/77729-RPG.
60 Id., at page 4. 61 Id., at page 6. 62 Id., at pages 6 and 8.
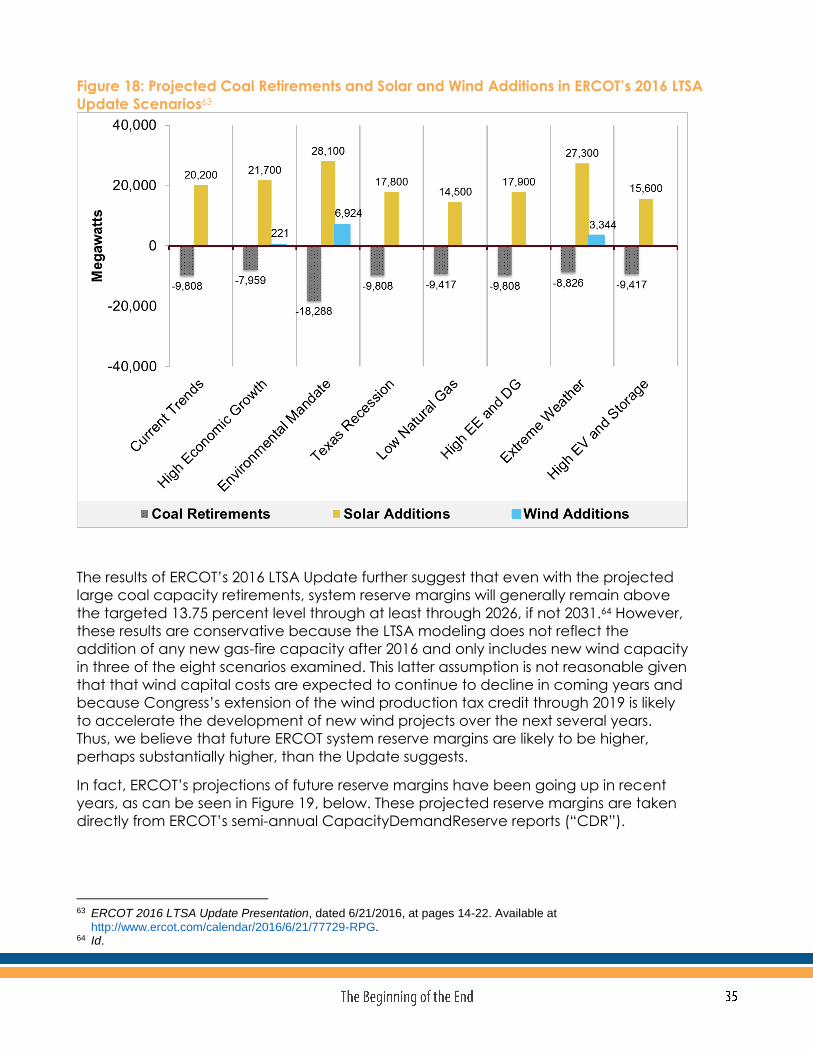
Figure 18: Projected Coal Retirements and Solar and Wind Additions in ERCOT’s 2016 LTSA
Update Scenarios63
The results of ERCOT’s 2016 LTSA Update further suggest that even with the projected
large coal capacity retirements, system reserve margins will generally remain above
the targeted 13.75 percent level through at least through 2026, if not 2031.64 However,
these results are conservative because the LTSA modeling does not reflect the
addition of any new gas-fire capacity after 2016 and only includes new wind capacity
in three of the eight scenarios examined. This latter assumption is not reasonable given
that that wind capital costs are expected to continue to decline in coming years and
because Congress’s extension of the wind production tax credit through 2019 is likely
to accelerate the development of new wind projects over the next several years.
Thus, we believe that future ERCOT system reserve margins are likely to be higher,
perhaps substantially higher, than the Update suggests.
In fact, ERCOT’s projections of future reserve margins have been going up in recent
years, as can be seen in Figure 19, below. These projected reserve margins are taken
directly from ERCOT’s semi-annual CapacityDemandReserve reports (“CDR”).
63 ERCOT 2016 LTSA Update Presentation, dated 6/21/2016, at pages 14-22. Available at
http://www.ercot.com/calendar/2016/6/21/77729-RPG. 64 Id.

Figure 19: Rising Expectations for Future ERCOT System Reserve Margins
These rising expectations for future reserve margins are the result of both the increasingly
large amounts of new wind and solar capacity that ERCOT anticipates will be added and
the fact that GDP growth in Texas has outpaced electricity demand growth in recent years.
As explained by Moody’s:
GDP growth in Texas has outpaced electricity consumption in recent years,
most notably since 2011. Strategies adopted by industrials and large utilities to
better manage their power use and load, together with better integration and
changing residential consumption habits continues to reduce demand. These
factors extend the time frame that excess supply will exist, which keeps power
prices down.65
This reduces the risk that large-scale retirements of existing coal-fired generating
capacity will adversely impact grid reliability.
65 ERCOT: Renewables to Hold Down Power Prices in the Lone Star State, Moody’s Investors Service, 23 March 2016, at
page 2.

In its March 2016 report, Moody’s Investors Service identified a number of coal-fired
generators in Texas that could retire (“come off line” in Moody’s terminology) due to poor
economics if power prices remain at current low levels:
Coal retirements remain the x-factor in ERCOT and an unexpected level of
base-load coal retirements would boost power prices, notwithstanding
expectations for increasing levels of renewable generation and sustained low
natural gas prices. In Exhibit 13 below we devised a list of plants “on the fence”
owing to their cash-flow profile on a merchant, unhedged basis. Our analysis is
based on variable cost and forward price for the next 12 months and a roughly
estimated cash-fixed cost of $70/kW-year. We utilized a blended power price
calculation based on on-peak prices up to a 50% capacity factor and off-peak
prices for capacity factors above 50%. We caution that this data is preliminary
and some plants, while cash-flow negative now, are not planning to be retired,
especially as some benefit from the presence of hedges or contracts for a
sizable portion of the plant capacity, such as Sandy Creek. Nevertheless, we
find this instructive in highlighting the number of plants that could come off line
due to poor economics if power prices persist at their current low levels, which
would benefit merchant gas-fired generators.66
The results of Moody’s analysis are shown in Figure 20, below.
66 Id., at page 8.
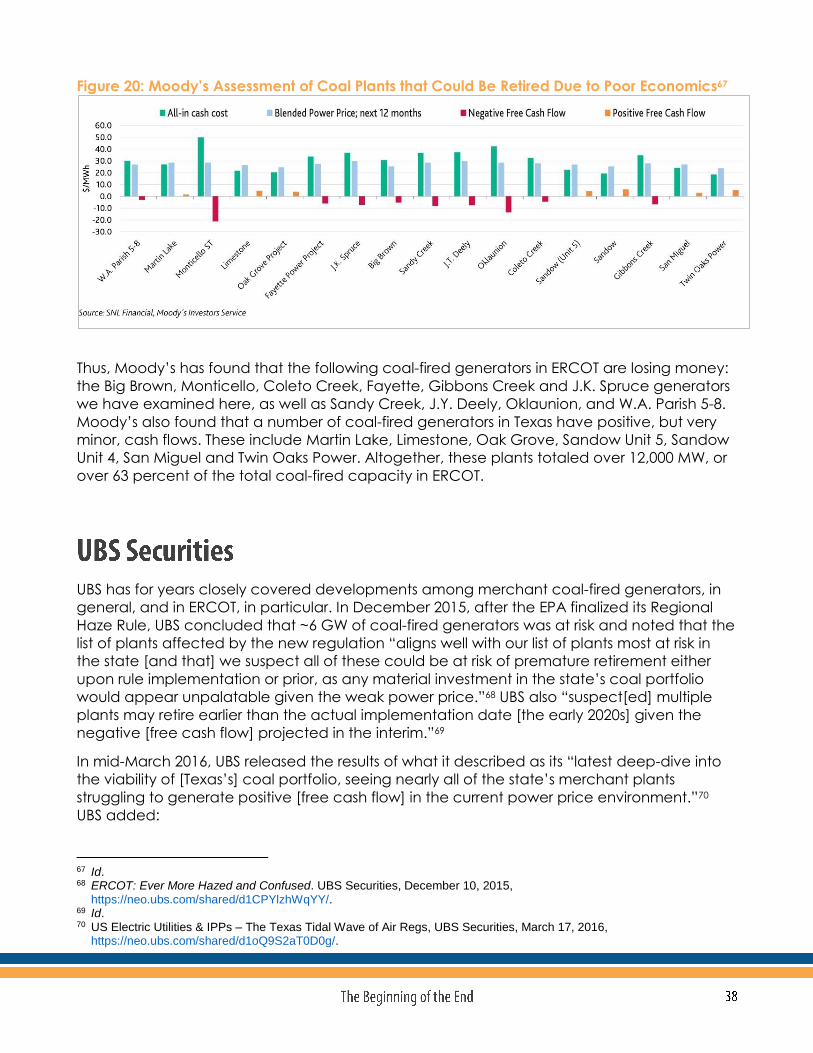
Figure 20: Moody’s Assessment of Coal Plants that Could Be Retired Due to Poor Economics67
Thus, Moody’s has found that the following coal-fired generators in ERCOT are losing money:
the Big Brown, Monticello, Coleto Creek, Fayette, Gibbons Creek and J.K. Spruce generators
we have examined here, as well as Sandy Creek, J.Y. Deely, Oklaunion, and W.A. Parish 5-8.
Moody’s also found that a number of coal-fired generators in Texas have positive, but very
minor, cash flows. These include Martin Lake, Limestone, Oak Grove, Sandow Unit 5, Sandow
Unit 4, San Miguel and Twin Oaks Power. Altogether, these plants totaled over 12,000 MW, or
over 63 percent of the total coal-fired capacity in ERCOT.
UBS has for years closely covered developments among merchant coal-fired generators, in
general, and in ERCOT, in particular. In December 2015, after the EPA finalized its Regional
Haze Rule, UBS concluded that ~6 GW of coal-fired generators was at risk and noted that the
list of plants affected by the new regulation “aligns well with our list of plants most at risk in
the state [and that] we suspect all of these could be at risk of premature retirement either
upon rule implementation or prior, as any material investment in the state’s coal portfolio
would appear unpalatable given the weak power price.”68 UBS also “suspect[ed] multiple
plants may retire earlier than the actual implementation date [the early 2020s] given the
negative [free cash flow] projected in the interim.”69
In mid-March 2016, UBS released the results of what it described as its “latest deep-dive into
the viability of [Texas’s] coal portfolio, seeing nearly all of the state’s merchant plants
struggling to generate positive [free cash flow] in the current power price environment.”70
UBS added:
67 Id. 68 ERCOT: Ever More Hazed and Confused. UBS Securities, December 10, 2015,
https://neo.ubs.com/shared/d1CPYlzhWqYY/. 69 Id. 70 US Electric Utilities & IPPs – The Texas Tidal Wave of Air Regs, UBS Securities, March 17, 2016,
https://neo.ubs.com/shared/d1oQ9S2aT0D0g/.

1. With at least three waves of environmental regulations potentially affecting the state’s
portfolio (even prior to the Clean Power Plan), there is limited viability for the bulk of the
~18 GW of TX coal (near a quarter of the state’s 2014A generation portfolio). Of this ~10
Gigawatts (“GW”) need to reduce emissions by ~80%+ to comply with the EPA’s Regional
Haze regulations.
2. It is inevitable that several of the state’s largest coal assets could opt to retire with
unscrubbed coal plants facing significant compliance costs (potentially hundreds of
millions).
3. Big Brown is likely the first coal unit to retire although UBS doubts that investments will be
made to retrofit existing scrubbers at plants including Martin Lake and Monticello 3.71
4. The key question remains when owners will make the decision to retire their generators:
With coal largely uneconomic today, UBS expects more retirements but
generators are ascribing to game theory and are looking to be the ‘last
man standing.’ For instance, DYN expressed little willingness to maintain
the Coleto Creek coal plant given its smaller size (635 MW) and potential
exposure to future environmental regulations. Facing losses at this coal
plant we see DYN as incentivized to shut the asset given its 4GW of other
newly acquired ERCOT assets.72
Finally, in a mid-July 2016 assessment, released after EFH disclosed its plan for re-emerging
from bankruptcy, UBS noted that it continues to expect retirement of at least two of
Luminant’s coal-fired generators, for reasons tied to environmental capex, and that four of its
coal plants remain “at particular risk.”73 In particular, UBS continues to believe that the
retirement of Big Brown is “really a question of when rather than if.”
Guggenheim Securities recently concluded that at least two of Luminant’s coal-fired
generators, Big Brown and Monticello, are “no longer economic to run and are the two
assets in the company’s fleet “with the greatest probability of being shut down.”74
An analyst at Guggenheim describes this as a “prisoners’ dilemma” in which several coal
plants, in addition to Big Brown and Monticello, are no longer economic to run. However, the
plant owners are waiting and hoping that when other plants are retired, market prices
increase enough to make the remaining unretired plants profitable again.
These plants have been on borrowed time… And [the coal plant owners’]
viewpoint is that Texas is purely an energy market. That we don’t want to be the
first one to bail, because we don’t know what the impact could be from power
price volatility and scarcity pricing. So we’re going to keep trying to buy time, 71 Id. 72 Id. 73 Why the Latest EFH Disclosures Matter for Texas Power Recovery, UBS Securities, July 14, 2016,
https://neo.ubs.com/shared/d1GXn81fwtdl/. 74 ERCOT generators betting market will tighten when EFH exits Chapter 11, SNL Financial, July 8, 2016.

because we know that one entity is going to come out of bankruptcy and shut
down some assets. So we’re going to keep hanging in there.75
Guggenheim ultimately projects that 7,800 MW (or a little less than 50 percent) of coal-fired
capacity will retire in Texas over the next couple of years “based on current forward power
and commodity price curves in ERCOT and the investments needed at certain plants to
comply with the EPA’s regional haze rule.76
Other coal-fired generators, in addition to Big Brown and Monticello, which Guggenheim
projects are on their way to retirement, include J.T. Deeley (which is already scheduled for
retirement), Fayette, Gibbons Creek, San Miguel, Oklaunion, and Coleto Creek. According to
Guggenheim, “[Coleto Creek has] no value to it…. it does run but likely could get shut
down.”77
All seven of the coal-fired generators examined by IEEFA here are either marginally or
significantly uneconomic and are at risk for retirement in as a result of the following changes
in the ERCOT market affecting the viability of coal-fired generators:
The collapse of natural gas prices and subsequent declines in the cost of generating
power and the increases in generation at natural gas-fired power plants.
Increased competition from thousands of megawatts (MW) of new wind and solar
resources due to steep declines in installation prices, improved operating efficiencies and
transmission upgrades.
Low energy market prices in ERCOT’s deregulated wholesale markets driven by lower
natural gas prices and increased generation from renewable resources. (Unlike in some
regions of the country, ERCOT does not have a “capacity” market, which often serves to
subsidize older plants and keep them on-line when they are no longer cost competitive.)
Sharp reductions in generation from coal-fired plants as their output has been displaced
by increased output from renewable and natural gas-fired capacity. Many coal-fired
power plants in Texas no longer act as “baseload plants,” and are instead limited to
operations during the peak load seasons. Although coal-fired plants generated 39
percent of the electricity in ERCOT in 2015, by May of 2016 they provided only 24.8
percent.
Implementation of public health and environmental regulations, including the EPA’s
regional haze rule, which are forcing coal-fired power plant owners to decide whether to
make expensive investments in their aging coal fleet.
The discussion should shift now to how to phase out these plants, what to replace them with,
and how to retrain their workers.
75 Id. 76 Id. 77 Id.
The Institute for Energy Economics and Financial Analysis (IEEFA) conducts research and
analyses on financial and economic issues related to energy and the environment. The
Institute’s mission is to accelerate the transition to a diverse, sustainable and profitable
energy economy and to reduce dependence on coal and other non-renewable energy
resources. More can be found at www.ieefa.org.
David Schlissel, director of resource planning analysis for IEEFA, has been a regulatory
attorney and a consultant on electric utility rate and resource planning issues since 1974. He
has testified as an expert witness before regulatory commissions in more than 35 states and
before the U.S. Federal Energy Regulatory Commission and Nuclear Regulatory Commission.
He also has testified as an expert witness in state and federal court proceedings concerning
electric utilities. His clients have included state regulatory commissions in Arkansas, Kansas,
Arizona, New Mexico and California. He has also consulted for publicly owned utilities, state
governments and attorneys general, state consumer advocates, city governments, and
national and local environmental organizations.
Schlissel has undergraduate and graduate engineering degrees from the Massachusetts
Institute of Technology and Stanford University. He has a Juris Doctor degree from Stanford
University School of Law.