the basics - analytics, business intelligence and data ... · the basics . chapter 1 ... 1.2.3 rfm...
TRANSCRIPT

P a r t 1 The Basics Chapter 1 Introduction ...................................................................................... 3 Chapter 2 Why Segment? The Motivation for Segment-Based Descriptive Models ........................................................................... 15 Chapter 3 Distance: The Basic Measures of Similarity and Association....................................................................................... 39
Collica, Randy. Customer Segmentation and Clustering Using SAS® Enterprise Miner™, Second Edition. Copyright © 2011, SAS Institute Inc., Cary, North Carolina, USA. ALL RIGHTS RESERVED. For additional SAS resources, visit support.sas.com/publishing.

2 Customer Segmentation and Clustering Using SAS Enterprise Miner, Second Edition
Collica, Randy. Customer Segmentation and Clustering Using SAS® Enterprise Miner™, Second Edition. Copyright © 2011, SAS Institute Inc., Cary, North Carolina, USA. ALL RIGHTS RESERVED. For additional SAS resources, visit support.sas.com/publishing.

Introduction 1.1 What Is Segmentation in the Context of CRM? .............................................. 3 1.2 Types of Segmentation and Methods ............................................................ 5
1.2.1 Customer Profiling .................................................................................... 5 1.2.2 Customer Likeness Clustering.................................................................. 8 1.2.3 RFM Cell Classification Grouping ............................................................. 8 1.2.4 Purchase Affinity Clustering ..................................................................... 9
1.3 Typical Uses of Segmentation in Industry ..................................................... 9 1.4 Segmentation as a CRM Tool ...................................................................... 11 1.5 References ................................................................................................. 14
1.1 What Is Segmentation in the Context of CRM? Segmentation is in essence the process by which items or subjects are categorized or classified into groups that share similar characteristics. That characteristic could be one or more attributes. Segmentation also can be defined as subdividing the population according to already known good discriminators. Hand, Mannila, and Smyth distinguish between segmentation and clustering based on differing objectives (Hand, Mannila, and Smith 2001, p. 293). The terminologies used in clustering algorithms arose from various multiple disciplines such as computer science, biology, social science, statistics, and astronomy. Therefore, it is sometimes difficult to grasp the concepts in clustering with such widely varying terminology and syntax. In segmentation, the aim is simply to partition the data in a way that is convenient. Convenient may refer to something that is useful, as in marketing, for example. In clustering, the objective is to see if a sample of data is composed of natural subclasses or groups. This may be the objective in customer profiling. The analytical techniques involved in both of these objectives could very well be the same. There are a great number of methods and algorithms used in cluster analysis. The important thing is to match the method with your business objective as close as possible. This book’s aim is to help you choose the method depending on your objective and to avoid mishaps in the analysis and interpretation. It is also to help you understand how to apply and implement these techniques using SAS Enterprise Miner. In Customer Relationship Management (CRM), segmentation is
1
Collica, Randy. Customer Segmentation and Clustering Using SAS® Enterprise Miner™, Second Edition. Copyright © 2011, SAS Institute Inc., Cary, North Carolina, USA. ALL RIGHTS RESERVED. For additional SAS resources, visit support.sas.com/publishing.
4 Customer Segmentation and Clustering Using SAS Enterprise Miner, Second Edition
used to classify customers according to some similarity, such as industry, for example. This book describes the methods used to segment records in a database of customers; it is the how-to of segmentation analysis.
If you can remember back in elementary school when selecting teams for softball or kickball, the team captains would always choose the tallest or strongest players first to be on the team, leaving the shortest to be last. The elementary school teacher would instead have everyone line up and call out numbers from one to four and then repeat so that each number that was the same would then be members of the same team. This was a form of undirected segmentation until the children caught on and tried to line up their friends to circumvent their teacher’s method. The measure of similarity of the members was nothing more than the matching numbers assigned during the lineup. If the similarity were the height of the members, then after measuring the height of each individual, each would be sorted into teams according to each other’s height, thus giving segments of members that have similar height. The characteristic of the segments then is strongly dependent on the measure of similarity used for each subject.
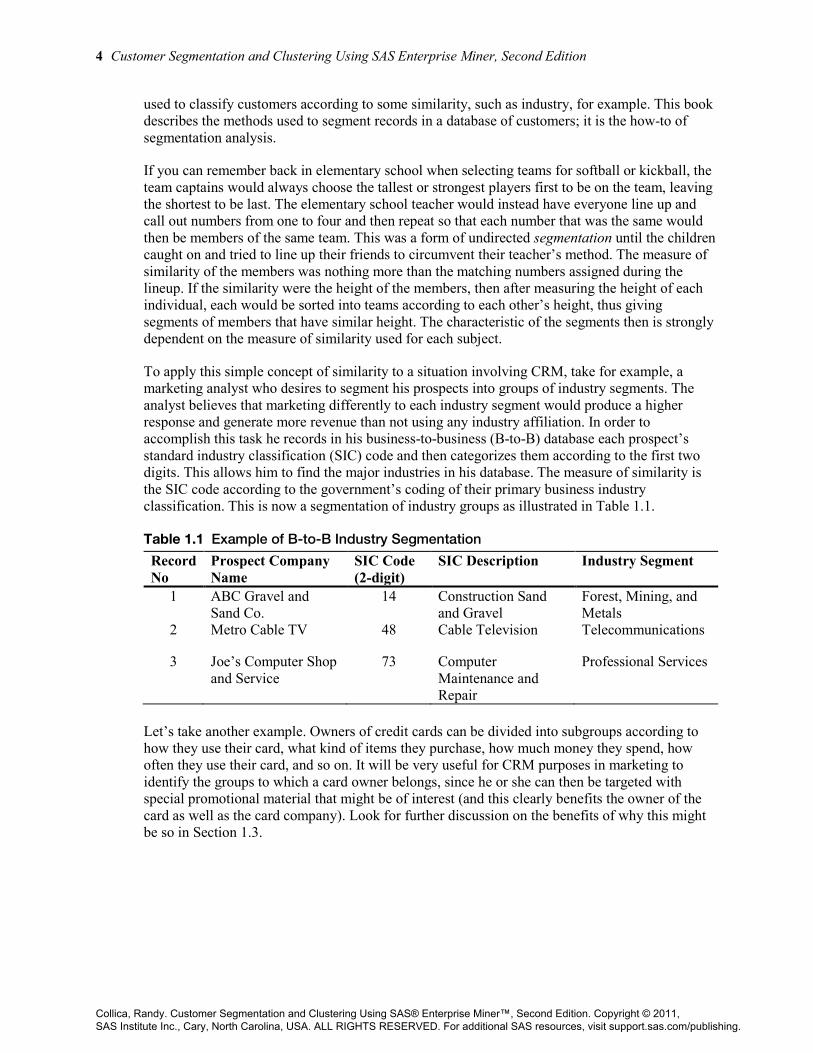
To apply this simple concept of similarity to a situation involving CRM, take for example, a marketing analyst who desires to segment his prospects into groups of industry segments. The analyst believes that marketing differently to each industry segment would produce a higher response and generate more revenue than not using any industry affiliation. In order to accomplish this task he records in his business-to-business (B-to-B) database each prospect’s standard industry classification (SIC) code and then categorizes them according to the first two digits. This allows him to find the major industries in his database. The measure of similarity is the SIC code according to the government’s coding of their primary business industry classification. This is now a segmentation of industry groups as illustrated in Table 1.1.
Table 1.1 Example of B-to-B Industry Segmentation
Record No
Prospect Company Name
SIC Code (2-digit)
SIC Description Industry Segment
1 ABC Gravel and Sand Co.
14 Construction Sand and Gravel
Forest, Mining, and Metals
2 Metro Cable TV 48 Cable Television Telecommunications
3 Joe’s Computer Shop and Service
73 Computer Maintenance and Repair
Professional Services
Let’s take another example. Owners of credit cards can be divided into subgroups according to how they use their card, what kind of items they purchase, how much money they spend, how often they use their card, and so on. It will be very useful for CRM purposes in marketing to identify the groups to which a card owner belongs, since he or she can then be targeted with special promotional material that might be of interest (and this clearly benefits the owner of the card as well as the card company). Look for further discussion on the benefits of why this might be so in Section 1.3.
Collica, Randy. Customer Segmentation and Clustering Using SAS® Enterprise Miner™, Second Edition. Copyright © 2011, SAS Institute Inc., Cary, North Carolina, USA. ALL RIGHTS RESERVED. For additional SAS resources, visit support.sas.com/publishing.

Chapter 1: Introduction 5
In addition to spending patterns, purchase frequency, and so on, one can segment by any attribute recorded in a database. When multiple attributes are chosen, several problems arise in the computations that may be used to create the segments or clusters. For example, how does one choose a measurement scheme so that all characteristics are being measured on a similar scale? How can you determine the importance of the effect of each variable on the segment clusters? Issues like these will be discussed in later chapters, especially Chapters 3 through 6.
1.2 Types of Segmentation and Methods There are many techniques for classifying records or rows in a database. For the purpose of this book, I will interchange the term segmentation with the phrase record classification, because in the context of CRM these can be used synonymously. In the world of computer science, there is a definite distinction between classification of records in a database and grouping or clustering records according to some criteria of similarity or likeness. Classification is typically referred to as assigning a record to one of a number of predetermined classes. Clustering is a set of algorithms used to partition records in a database according to a measure of similarity, and the number of cluster segments is not predetermined before the algorithm is applied to the database. This distinction becomes less important in business applications; however, it is useful to keep these definitions in mind. In order to discuss the types and uses of segmentation one needs to review the various capabilities that each type has to offer. What follows is only a partial list of the many types of segmentations that exist, but this should be useful for determining which set of techniques you may need to perform for solving the business problems at hand.
1.2.1 Customer Profiling In profiling a set of customers, the typical reason for performing this analysis is to gain insight or an understanding of the four Ws—the who, what, where, and when of your customer base. A fifth W of why can also be added; however, the why is always a much more difficult customer attribute to collect. A typical business problem might involve a question from your field sales force like the following: I need to understand my customer base in the northwest area so I can deploy my field sales force accordingly. This kind of business question would require one to know how many customers exist in the northwest area as well as their recent purchases, what industries they mainly come from, and so on. A customer profile by geographic region will then help the business manager requesting the analysis to align the sales force with customers to achieve greater sales coverage and effectiveness in their customer base. The techniques used in this kind of profiling may include counting the number of customers by region or zip code range for each industry group or perhaps counting the number of customers who have made purchases within the last year and ones who have not. This can be a simple query to the customer database, but if the number of attributes desired is large, it may be an impossible database query and you will need to resort to a clustering algorithm. An example of a customer profile might look like the following two query results.
Collica, Randy. Customer Segmentation and Clustering Using SAS® Enterprise Miner™, Second Edition. Copyright © 2011, SAS Institute Inc., Cary, North Carolina, USA. ALL RIGHTS RESERVED. For additional SAS resources, visit support.sas.com/publishing.

6 Customer Segmentation and Clustering Using SAS Enterprise Miner, Second Edition
Table 1.2 Example of Customer Profiling in NW U.S. Region (Profile by State)
Northwest Customer Sales by State
State Total Sales No of Customers
ID $2,799,607 135
MO $16,570,851 305
OR $8,746,203 326
WA $38,885,342 466
Table 1.3 Example of Customer Profiling in NW U.S. Region (Profile by Major Metro/3-digit Postal Code – Only Top 8 Rows Shown)
Northwest Customer Sales by Major Metro or 3digit Zip
Major Metro/Zip Code
Total Sales
No of Customers
SEA $25,578,204 283
PDX $3,971,539 172
STL $3,562,242 91
974 $2,029,223 55
MKC $1,412,478 55
982 $3,019,754 31
977 $841,117 31
834 $438,883 28
Collica, Randy. Customer Segmentation and Clustering Using SAS® Enterprise Miner™, Second Edition. Copyright © 2011, SAS Institute Inc., Cary, North Carolina, USA. ALL RIGHTS RESERVED. For additional SAS resources, visit support.sas.com/publishing.

Chapter 1: Introduction 7
In essence, these reports from Tables 1.2 and 1.3 are results of segmentation. (E.g., the segments include the state as one segment, and the 3-digit postal abbreviation/major metro area code combined as another segment.) In this case, when there is no major metro code, the code abbreviation is used in its place. Then the sales and number of customers are aggregated (summed in this case) by each of these segments. This type of segmentation profiling will be discussed in further detail in Chapters 5 and 6. The output in Tables 1.2 and 1.3 was performed using HTML output settings on PC SAS with the output selected to create HTML with default settings. If this code were run in SAS Enterprise Miner, the output would be within the SAS Code output window. There will be more on the discussion of using SAS Code nodes in the examples in Chapter 2, “Why Segment? The Motivation for Segment-Based Descriptive Models,” and later chapters.
SAS Code to Generate Output in Tables 1.2 and 1.3 libname chapt1 ‘c:\chapter 1’; /* where C: is referring to your HD drive on your computer. */
data work.northwest; set chapt1.northwest; if majmet=' ' then majmet=substr(zip,1,3);
run;
proc summary data=work.northwest nway sum; class majmet state branch_code; var sales ; output out=work.nw_sum sum= ;
run;
title 'Northwest Customer Sales by State'; proc sql; select state label='State',
sum(sales) as sum_sales label='Total Sales' format=dollar12., sum(_freq_) as count label='No of Customers'
from work.nw_sum as q1 group by state ;
quit; title;
title 'Northwest Customer Sales by Major Metro or 3digit Zip'; proc sql; select majmet label='Major Metro/Zip Code',
sum(sales) as sum_sales label='Total Sales' format=dollar12., sum(_freq_) as count label='No of Customers'
from work.nw_sum as q1 group by majmet order by count descending;
quit; title;
Collica, Randy. Customer Segmentation and Clustering Using SAS® Enterprise Miner™, Second Edition. Copyright © 2011, SAS Institute Inc., Cary, North Carolina, USA. ALL RIGHTS RESERVED. For additional SAS resources, visit support.sas.com/publishing.

8 Customer Segmentation and Clustering Using SAS Enterprise Miner, Second Edition
1.2.2 Customer Likeness Clustering A chain store or franchise might want to study whether its outlets are similar in terms of social neighborhood, size, staff numbers, vicinity to other shops, and so on. Their objective is to see if they have similar turnovers and yield similar revenues or profits. A beginning point might be to cluster the outlets in terms of these variables and to examine the distributions of turnovers and profits within each group. Another method would be to cluster just the turnovers and revenue/profit variables and then profile other variables of interest like geography, social neighborhood, etc. We will discuss methods of clustering in Chapters 5 and 6 and review some practical techniques of how and when to update those models for continued maintenance. A simple example using two varieties of orange sales (ORANGES sample data set from SAS Institute) produces the analysis of sales comparisons between six stores. Figure 1.1 shows the normalized distances of the six clusters from sales of two varieties of orange sales on six days of sales from six stores. The normalized distances are the results from clustering two types of orange sales data using the clustering node in SAS Enterprise Miner; the distance plot is the result of the MDS procedure. We will review this type of analysis in greater detail in Chapter 5, “Segmentation of Several Attributes with Clustering.”
Figure 1.1 Orange Sales Clusters – Distance Plot from SAS Enterprise Miner
1.2.3 RFM Cell Classification Grouping RFM stands for recency, frequency, and monetary value. Recency (a term typically used in direct marketing industry) is a measure of the time lag since your customer has either communicated or purchased last from your business. Recency can be measured in weeks, months, quarters, fiscal years, etc. Frequency is the quantity or volume of items or services purchased and can be single units or perhaps aggregated in deciles or whatever meaningful grouping. Monetary value is just that, a numeric currency figure representing the value of each of the frequency units or aggregated units that were purchased. RFM cells can be easily thought of in three dimensions as shown in Figure 1.2. Each customer will be classified into only one of the cells as the classification is applied to the customer database. We will be discussing this type of segmentation method and its uses in Chapter 4, “Segmentation Using a Cell-Based Approach.”
Collica, Randy. Customer Segmentation and Clustering Using SAS® Enterprise Miner™, Second Edition. Copyright © 2011, SAS Institute Inc., Cary, North Carolina, USA. ALL RIGHTS RESERVED. For additional SAS resources, visit support.sas.com/publishing.

Chapter 1: Introduction 9
Figure 1.2 RFM Cell Pictorial Description
1.2.4 Purchase Affinity Clustering A product manager may want to understand his customers based on their affinity for certain groups of products they have purchased within a certain time frame. To see this more clearly the manager computes an affinity score for the products of interest or perhaps all product categories, and then clusters those scores for similar groups. Another method of doing this is to cluster customers based on revenue and other demographics of interest and then score the product affinity for the cluster groups to observe whether there are any product tendencies for the customer segments. These kinds of clustering methods will be discussed in Chapters 9 and 10.
1.3 Typical Uses of Segmentation in Industry In industry, segmentation or some sort of classification scheme has a wide variety of uses. A biologist might take field measurement samples and cluster them to find a useful taxonomy (Fisher 1936, pp. 179–188). In the medical field, clustering has been used to classify image data from Magnetic Resonance Imaging (MRI) scans for the purpose of detecting breast cancer (Getz, et al. 2003, p. 1079, 1089). In bioinformatics, a computer scientist working with a molecular biologist or a geneticist may seek to understand the function of genes. They may use genetic expression profile data and perform a hierarchical clustering in order to explore the structure of normal versus melanoma genes for the purpose of finding which genes may be responsible for the melanoma (Seo and Shneiderman 2002, pp. 80–86). In astronomy, measurements of star temperature and luminosity and X-ray or gamma ray emissions and other stellar sources are clustered to find similar star groups to aid in the understanding of the life cycle of stars; see Figures 1.3 and 1.4 (Berry and Linoff 1997, pp. 188–189).
When this clustering is performed on the star data, apparent distinct groups shown in Figure 1.3 appear that have specific attributes. White dwarf stars are late-stage stars that have shed off their outer layers. Red giants are stars that are middle- to late-stage stars that have swelled in size, and some can even migrate into supernova explosions. These clusters were profiled after much observation to ascertain these facts, and now a star classification system exists based on temperature and luminosity. A simplified cluster map of Figure 1.3 is shown in Figure 1.4 indicating three major star clusters.
Frequency
Monetary Value
Recency
1
2
3
1 2
3
A B C
A customer labeled in this cell would be 3C1.
Collica, Randy. Customer Segmentation and Clustering Using SAS® Enterprise Miner™, Second Edition. Copyright © 2011, SAS Institute Inc., Cary, North Carolina, USA. ALL RIGHTS RESERVED. For additional SAS resources, visit support.sas.com/publishing.

10 Customer Segmentation and Clustering Using SAS Enterprise Miner, Second Edition
Figure 1.3 Hertzsprung-Russell Diagram: Star Clusters by Temperature and Luminosity
Figure 1.4 A Simplified Hertzsprung-Russell Diagram
Star Temperature (Degrees Kelvin)
10-4
10-2
102
40,000 20,000 10,000 5,000
Red Giants
Main sequence stars
White Dwarfs
Luminosity
Collica, Randy. Customer Segmentation and Clustering Using SAS® Enterprise Miner™, Second Edition. Copyright © 2011, SAS Institute Inc., Cary, North Carolina, USA. ALL RIGHTS RESERVED. For additional SAS resources, visit support.sas.com/publishing.

Chapter 1: Introduction 11
In marketing, an analyst may desire to classify customers according to similar customer groups for the purpose of understanding how to market to each customer segment. An analyst may want to classify research findings gathered from Web sites and other electronic means. To do so will cluster documents into themes without the analyst having to read each document and manually classify the documents into an organizational taxonomy. We will review this segmentation technique in Chapter 12, “Segmentation of Textual Data.” In manufacturing, an engineer may want to better understand the mechanism or the root origin of a defect, so to aid this understanding the engineer clusters and sorts the defected items into similar defective categories. Cluster segmentation can be used to associate factor X with factor A, and a series of interconnected ideas may suggest models for the underlying mechanisms generating the observed data. In other words, cluster analysis may be used to reveal the structure and relations contained in the data (Anderberg 1973, p. 4). As you can see, there are many uses in industry where one can perform a classification according to predefined rules or a set of attributes, or segmentation of data into similar groups.
1.4 Segmentation as a CRM Tool Segmentation is a set of techniques that can be beneficial in classifying customer groups. Typical direct marketing activities seek to improve the relationships with current customers. The better you know about your customer’s needs, desires, and their purchasing behaviors, the better you can construct marketing programs designed to fit those needs, desires, and behaviors. Let’s consider an example of a country variety store. In a southern New Hampshire town where I live, we have a country variety store that is an independent family business (not part of a franchise or chain). This store has a small delicatessen that offers sausage or meatball subs among other things. One of the unique aspects of these subs is the tomato sauce, which is homemade. They offered these subs only on Wednesdays. In my opinion, they are one of the best sausage or meatball subs I’ve ever enjoyed. Therefore, when my family or I want a sausage or meatball sub, we would choose this small deli over any franchise stores available in town. The demand for these homemade subs caused the deli to offer their famous subs on each day rather than just one day of the week. How did the owners determine to move from offering these great subs on just Wednesdays to all days of the week? The answer is very straightforward in that they observed the demand of the subs and the requests made from various customers to offer these special subs on other days of the week. The owners, in fact, performed a mental segmentation as opposed to one with customer data in a database to reflect two apparent facts: 1) that the demand of these subs was higher than other products offered and 2) that the customers requested this service. So, the two facts put together made up the business decision to offer the subs more days of the week and thus better fulfill their customers’ needs and desires; the simple supply-and-demand business curve. This simple example is what most direct marketers would like to achieve as well; however, one cannot segment a set of customers in a large database mentally as this country store owner did. However, with data mining algorithms such as clustering, decision trees, and other analytic tools, even when a business contains millions of customers the capability exists to group and segment these customers so that the segments are distinct groups of customers.
In the catalog industry, this kind of segmentation can be rather demanding. Take, for example, an Asian large catalog mail-order company that has approximately 19 million customers. Their product offering is so large that they cannot offer all of their product offerings to all 19 million customers, especially in a single catalog. To do so would be cost prohibitive and the customer would have to search a huge catalog to find the items they desire. Therefore, the cataloger takes all of their customer data, attributes of these customers, and clusters them into differing segments containing various numbers of customers in each segment. Then, after profiling each of these customer segments, they offer a catalog designed specifically for each segment. A catalog for a teen segment would be very different from the one designed for middle-aged adults. This is not
Collica, Randy. Customer Segmentation and Clustering Using SAS® Enterprise Miner™, Second Edition. Copyright © 2011, SAS Institute Inc., Cary, North Carolina, USA. ALL RIGHTS RESERVED. For additional SAS resources, visit support.sas.com/publishing.
12 Customer Segmentation and Clustering Using SAS Enterprise Miner, Second Edition
quite a one-to-one customer touch approach but a one-to-many approach, which is manageable and increases their customers’ responsiveness to the catalogs offered in each segment (SAS Institute Inc. 2000, pp. 22–23).
In another example, a retail bank desires to improve their revenues and thus their profitability by segmenting their customer data according to the portfolio of products and services they have purchased. By clustering the customer data certain distinct patterns in one of the clusters appear—middle-aged customers who have a checking and savings account with fairly healthy balances, young customers who take advantage of more recent technological innovations, and older customers who could use some retirement plans, etc. This type of analysis and the set of business marketing ideas when brought together can make up the direct marketing activities and programs to leverage the cross-selling and up-selling of the bank’s customer base and thus improve the revenue stream and also address customer loyalty.
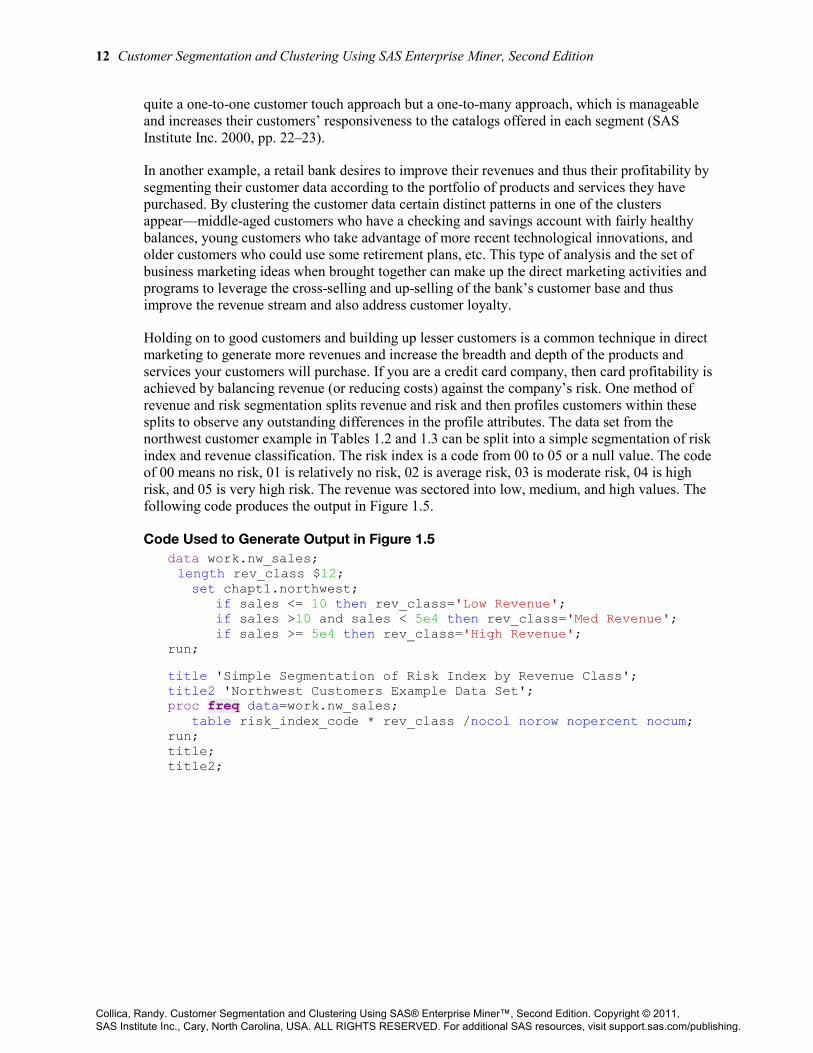
Holding on to good customers and building up lesser customers is a common technique in direct marketing to generate more revenues and increase the breadth and depth of the products and services your customers will purchase. If you are a credit card company, then card profitability is achieved by balancing revenue (or reducing costs) against the company’s risk. One method of revenue and risk segmentation splits revenue and risk and then profiles customers within these splits to observe any outstanding differences in the profile attributes. The data set from the northwest customer example in Tables 1.2 and 1.3 can be split into a simple segmentation of risk index and revenue classification. The risk index is a code from 00 to 05 or a null value. The code of 00 means no risk, 01 is relatively no risk, 02 is average risk, 03 is moderate risk, 04 is high risk, and 05 is very high risk. The revenue was sectored into low, medium, and high values. The following code produces the output in Figure 1.5.
Code Used to Generate Output in Figure 1.5 data work.nw_sales; length rev_class $12; set chapt1.northwest;
if sales <= 10 then rev_class='Low Revenue'; if sales >10 and sales < 5e4 then rev_class='Med Revenue'; if sales >= 5e4 then rev_class='High Revenue';
run;
title 'Simple Segmentation of Risk Index by Revenue Class'; title2 'Northwest Customers Example Data Set'; proc freq data=work.nw_sales;
table risk_index_code * rev_class /nocol norow nopercent nocum; run; title; title2;
Collica, Randy. Customer Segmentation and Clustering Using SAS® Enterprise Miner™, Second Edition. Copyright © 2011, SAS Institute Inc., Cary, North Carolina, USA. ALL RIGHTS RESERVED. For additional SAS resources, visit support.sas.com/publishing.

Chapter 1: Introduction 13
Figure 1.5 Simple Segmentation of Risk Index by Revenue Class
Simple Segmentation of Risk Index by Revenue Class Northwest Customers Example Data Set
The FREQ Procedure
Frequency
Table of Risk_index_code by rev_class
Risk_index_code
rev_class
Total High Revenue Low Revenue Med Revenue
00 122 110 692 924
01 14 75 13 102
02 3 20 5 28
03 0 4 2 6
04 0 3 2 5
05 0 1 0 1
Total 139 213 714 1066
Frequency Missing = 166
As one might expect, the higher risk scores are mostly with low and medium revenues and little risk for high revenue customers. Perhaps in marketing to customers of low and medium revenue with high risk, an offer could be designed for them, and if leasing or credit is needed, a higher credit rate would be required for these customers than for customers with much lower risk. This is a simple segmentation using only two attributes, revenue and risk. We’ll discuss type of segmentation in greater detail in Chapter 4.
Common sense would tell us that one of the first steps in successful CRM is to understand your customer. Just like the example with the country deli, the owners understood their customers’ needs, desires, and spending habits. This information in turn led the owners to change their product offerings and frequency to better satisfy the customer. This simple fact of common sense does not always exist in many corporations. Many companies still do not see the value of their customers and the fact that their corporation exists because of their customers. The ones that do see this are hopefully trying to understand their customers and thus the techniques described in
Collica, Randy. Customer Segmentation and Clustering Using SAS® Enterprise Miner™, Second Edition. Copyright © 2011, SAS Institute Inc., Cary, North Carolina, USA. ALL RIGHTS RESERVED. For additional SAS resources, visit support.sas.com/publishing.

14 Customer Segmentation and Clustering Using SAS Enterprise Miner, Second Edition
this book should aid the data miner, business analyst, marketer, etc., to know how to approach segmenting their customer base so that effective marketing can be administered to create an improved revenue stream and greater customer retention. In Chapter 2, a review of the underlying motivations for segmentation and descriptive-based models for your customers or prospects will be presented.
1.5 References Anderberg, Michael R. 1973. Cluster Analysis for Applications. New York and London:
Academic Press. Berry, Michael J. A., and Gordon S. Linoff. 1997. Data Mining Techniques: for Marketing, Sales,
and Customer Support. New York: John Wiley & Sons. Fisher, Ronald Aylmer. 1936. “The Use of Multiple Measurements in Taxonomic Problems.”
Annals of Eugenics 7:179–188. Getz, Gad, Hilah Gal, Itai Kela, Daniel A. Notterman, and Eytan Domany. 2003. “Coupled Two-
Way Clustering Analysis of Breast Cancer and Colon Cancer Gene Expression Data.” Bioinformatics 19.9:1079, 1089.
Hand, David J., Heikki Mannila, and Padhraic Smyth. 2001. Principles of Data Mining. Cambridge, MA: MIT Press.
SAS Enterprise Miner, Release 6.2. Cary, NC: SAS Institute Inc. SAS Institute Inc. 2000. “Segmenting Customer Needs with Enterprise Miner.” SAS
Communications Q3: 22–23. Seo, Jinwook, and Ben Shneiderman. 2002. “Interactively Exploring Hierarchical Clustering
Results.” IEEE Computer, Special Issue on Bioinformatics 35.7:80–86.
Collica, Randy. Customer Segmentation and Clustering Using SAS® Enterprise Miner™, Second Edition. Copyright © 2011, SAS Institute Inc., Cary, North Carolina, USA. ALL RIGHTS RESERVED. For additional SAS resources, visit support.sas.com/publishing.