the auditory cortex of the bat phyllostomus discolor: localization
TRANSCRIPT
BioMed Central
Page 1 of 17(page number not for citation purposes)
BMC Neuroscience
Open AccessResearch articleThe auditory cortex of the bat Phyllostomus discolor: Localization and organization of basic response propertiesSusanne Hoffmann*1, Uwe Firzlaff1, Susanne Radtke-Schuller2, Britta Schwellnus1 and Gerd Schuller1
Address: 1Department Biology II, Ludwig-Maximilians-University Munich, Großhaderner Strasse 2, 82152 Planegg-Martinsried, Germany and 2Institute of Anatomy, Ludwig-Maximilians-University Munich, Pettenkoferstrasse 11, 80336 Munich, Germany
Email: Susanne Hoffmann* - [email protected]; Uwe Firzlaff - [email protected]; Susanne Radtke-Schuller - [email protected]; Britta Schwellnus - [email protected]; Gerd Schuller - [email protected]
* Corresponding author
AbstractBackground: The mammalian auditory cortex can be subdivided into various fields characterized byneurophysiological and neuroarchitectural properties and by connections with different nuclei of the thalamus.Besides the primary auditory cortex, echolocating bats have cortical fields for the processing of temporal andspectral features of the echolocation pulses. This paper reports on location, neuroarchitecture and basicfunctional organization of the auditory cortex of the microchiropteran bat Phyllostomus discolor (family:Phyllostomidae).
Results: The auditory cortical area of P. discolor is located at parieto-temporal portions of the neocortex. Itcovers a rostro-caudal range of about 4800 m and a medio-lateral distance of about 7000 m on the flattenedcortical surface.
The auditory cortices of ten adult P. discolor were electrophysiologically mapped in detail. Responses of 849 units(single neurons and neuronal clusters up to three neurons) to pure tone stimulation were recordedextracellularly. Cortical units were characterized and classified depending on their response properties such asbest frequency, auditory threshold, first spike latency, response duration, width and shape of the frequencyresponse area and binaural interactions.
Based on neurophysiological and neuroanatomical criteria, the auditory cortex of P. discolor could be subdividedinto anterior and posterior ventral fields and anterior and posterior dorsal fields. The representation of responseproperties within the different auditory cortical fields was analyzed in detail. The two ventral fields weredistinguished by their tonotopic organization with opposing frequency gradients. The dorsal cortical fields werenot tonotopically organized but contained neurons that were responsive to high frequencies only.
Conclusion: The auditory cortex of P. discolor resembles the auditory cortex of other phyllostomid bats in sizeand basic functional organization. The tonotopically organized posterior ventral field might represent the primaryauditory cortex and the tonotopically organized anterior ventral field seems to be similar to the anterior auditoryfield of other mammals. As most energy of the echolocation pulse of P. discolor is contained in the high-frequencyrange, the non-tonotopically organized high-frequency dorsal region seems to be particularly important forecholocation.
Published: 14 July 2008
BMC Neuroscience 2008, 9:65 doi:10.1186/1471-2202-9-65
Received: 25 January 2008Accepted: 14 July 2008
This article is available from: http://www.biomedcentral.com/1471-2202/9/65
© 2008 Hoffmann et al; licensee BioMed Central Ltd. This is an Open Access article distributed under the terms of the Creative Commons Attribution License (http://creativecommons.org/licenses/by/2.0), which permits unrestricted use, distribution, and reproduction in any medium, provided the original work is properly cited.
BMC Neuroscience 2008, 9:65 http://www.biomedcentral.com/1471-2202/9/65
Page 2 of 17(page number not for citation purposes)
BackgroundDuring the last decade, the bat P. discolor has been usedincreasingly for psychophysical and neurophysiologicalstudies of echolocation [1-4]. P. discolor is medium-sizedand forages for fruit, nectar, pollen and insects in a neo-tropical forest habitat. Its vocal emissions are brief (<three milliseconds), broadband multi-harmonic, down-ward frequency modulated (FM) echolocation pulses witha frequency range of about 40 to 90 kHz. In contrast, therich repertoire of communication calls used for species-specific social interaction covers the lower frequencyrange from 11 to 54 kHz [5,6]. The responses of corticalneurons to complex stimuli relevant for echolocation in P.discolor have been compared to the behavioral perform-ance of the bat [7,8]. Therefore, it is important to gainknowledge of the detailed organization of the AC withrespect to basic response properties.
The auditory cortex (AC) of mammals is composed of dis-tinct fields, which can be characterized by physiologicaland cytoarchitectural features and their specific thalamo-cortical connections (for review see [9,10]). The func-tional organization of the AC in bats has been extensivelystudied physiologically in several species (e.g. Pteronotusparnellii [11,12], Rhinolophus spec. [13,14], Eptesicus fuscus[15,16], for review see [17]). Among the best studied ACsso far are those of the mustached bat P. parnellii and thehorseshoe bat, Rhinolophus rouxi, both belonging to thegroup of the so-called CF/FM bats whose echolocationpulses consist of a constant frequency (CF) and a fre-quency modulated (FM) component. As common to allmammals studied so far, their ACs contain a tonotopicallyorganized primary auditory field (AI) with the frequencygradient running from caudal to rostral. However, in bothCF/FM bats frequencies of the CF component of the callsare largely overrepresented in AI while frequencies of theFM component are only weakly represented [18]. The AIis surrounded by cortical regions with neurons that showfacilitated responses to specific spectral and temporalcombinations of the CF and FM parts of the different har-monics of the echolocation pulses.
CF/FM bats are rather specialized echolocators in that theyhunt almost exclusively insects on the wings, whereasother bat species display more varied feeding ecology(insects, vertebrates, nectar, fruits) and very commonlyuse short downward FM echolocation pulses often withseveral harmonic components. In these bats the func-tional specialization of the AC is often not so clearlyapparent, but still cortical fields can be segregated basedon neurophysiological criteria like best frequency (BF; fre-quency at which threshold is lowest) representation andresponse threshold [15,19]. In the phyllostomid FM batCarollia perspicillata for example, two dorsal fields contain-ing mainly neurons with BFs in the high-frequency range
have been reported in addition to the tonotopicallyorganized fields AI and AAF (anterior auditory field) [20].In these high-frequency fields some neurons exhibitedpulse-echo delay sensitivity as in CF/FM bats [6], but with-out topographical organization.
Except for a short autoradiographic labeling study [21] thetopography of the AC of P. discolor has not been studied.In general, the AC of only one other phyllostomid FM bat,C. perspicillata, has been investigated, so far [20]. There-fore, the aim of the present study was to investigate neu-roanatomical and neurophysiological properties of theAC of P. discolor in order to delineate its subdivisions.
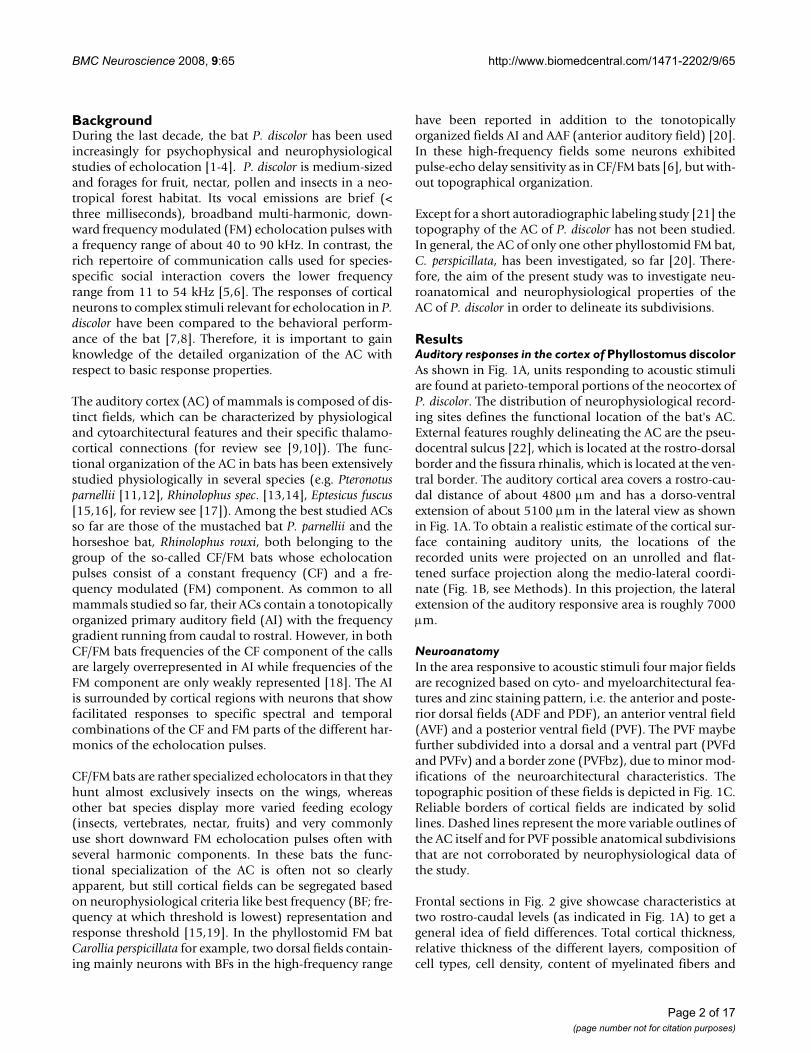
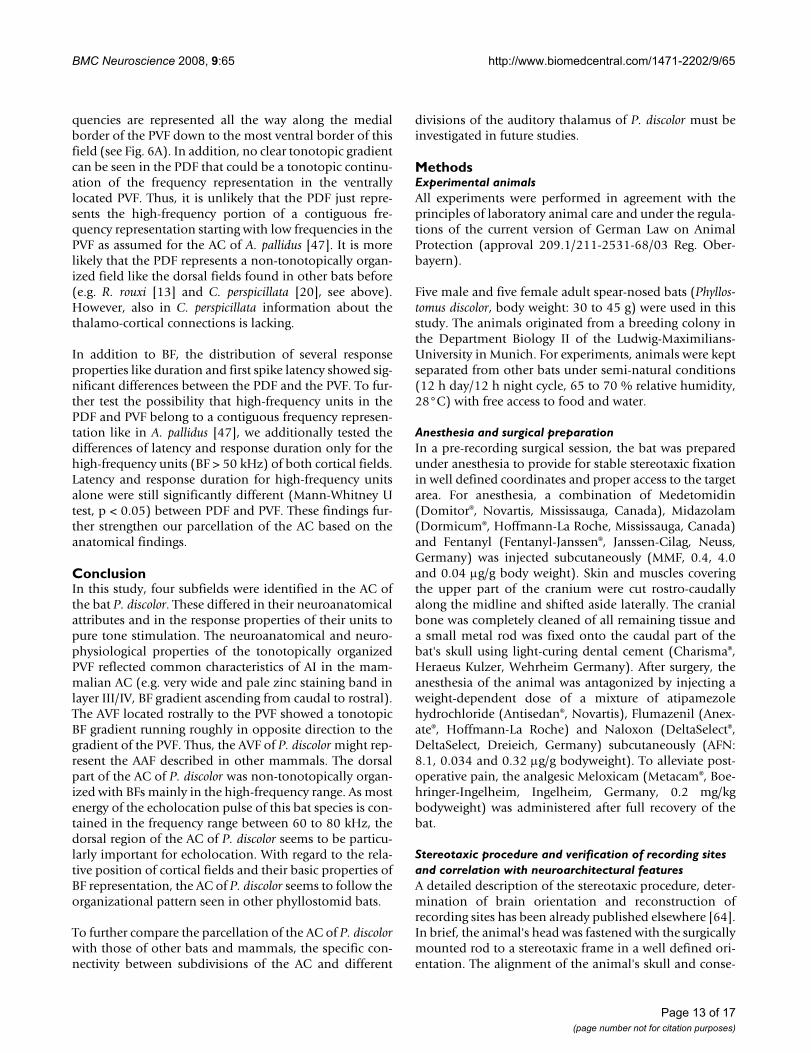
ResultsAuditory responses in the cortex of Phyllostomus discolorAs shown in Fig. 1A, units responding to acoustic stimuliare found at parieto-temporal portions of the neocortex ofP. discolor. The distribution of neurophysiological record-ing sites defines the functional location of the bat's AC.External features roughly delineating the AC are the pseu-docentral sulcus [22], which is located at the rostro-dorsalborder and the fissura rhinalis, which is located at the ven-tral border. The auditory cortical area covers a rostro-cau-dal distance of about 4800 m and has a dorso-ventralextension of about 5100 m in the lateral view as shownin Fig. 1A. To obtain a realistic estimate of the cortical sur-face containing auditory units, the locations of therecorded units were projected on an unrolled and flat-tened surface projection along the medio-lateral coordi-nate (Fig. 1B, see Methods). In this projection, the lateralextension of the auditory responsive area is roughly 7000
m.
NeuroanatomyIn the area responsive to acoustic stimuli four major fieldsare recognized based on cyto- and myeloarchitectural fea-tures and zinc staining pattern, i.e. the anterior and poste-rior dorsal fields (ADF and PDF), an anterior ventral field(AVF) and a posterior ventral field (PVF). The PVF maybefurther subdivided into a dorsal and a ventral part (PVFdand PVFv) and a border zone (PVFbz), due to minor mod-ifications of the neuroarchitectural characteristics. Thetopographic position of these fields is depicted in Fig. 1C.Reliable borders of cortical fields are indicated by solidlines. Dashed lines represent the more variable outlines ofthe AC itself and for PVF possible anatomical subdivisionsthat are not corroborated by neurophysiological data ofthe study.
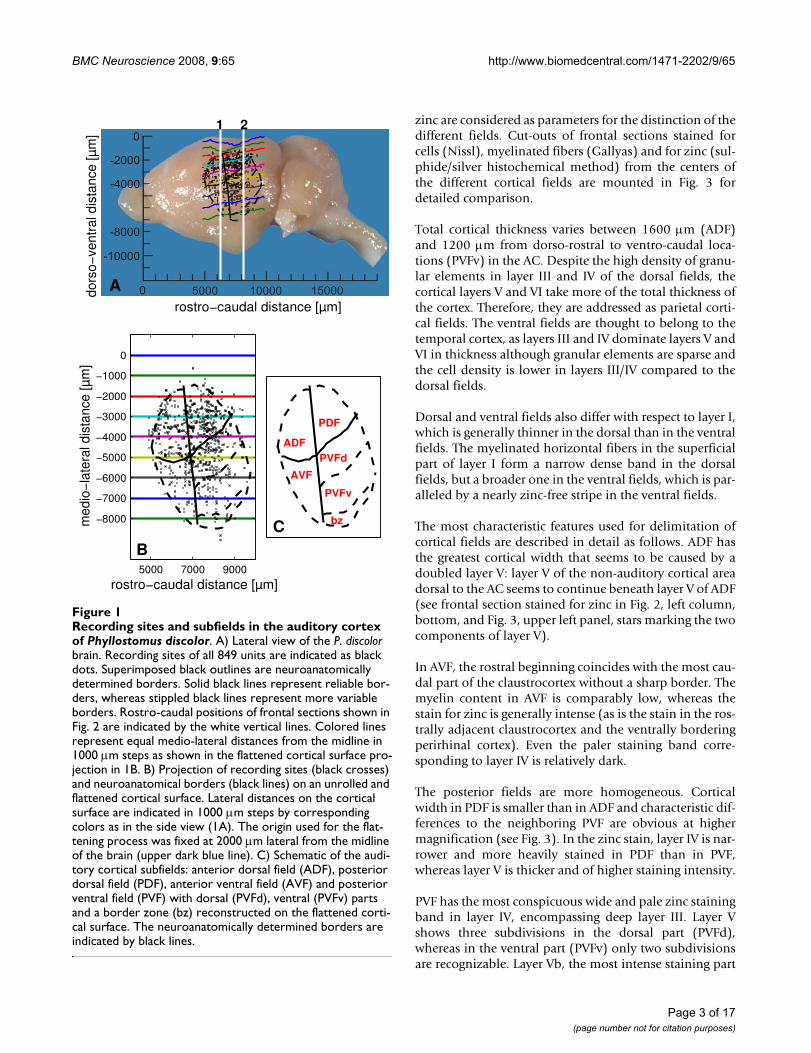
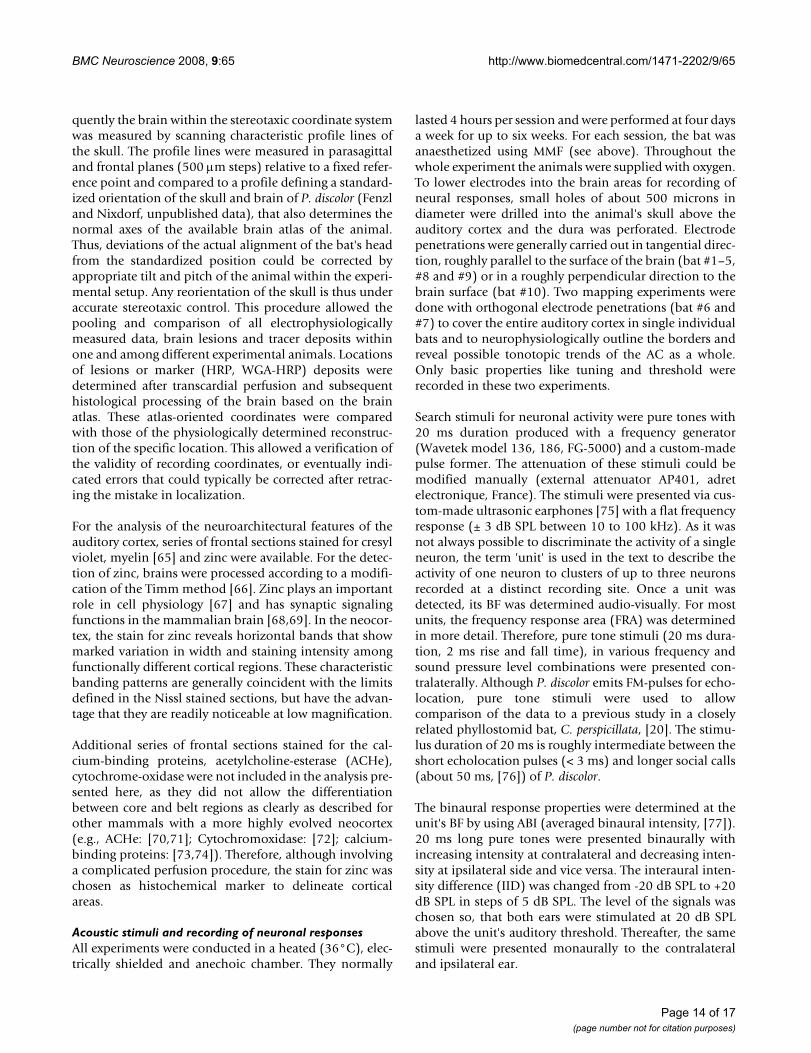
Frontal sections in Fig. 2 give showcase characteristics attwo rostro-caudal levels (as indicated in Fig. 1A) to get ageneral idea of field differences. Total cortical thickness,relative thickness of the different layers, composition ofcell types, cell density, content of myelinated fibers and
BMC Neuroscience 2008, 9:65 http://www.biomedcentral.com/1471-2202/9/65
Page 3 of 17(page number not for citation purposes)
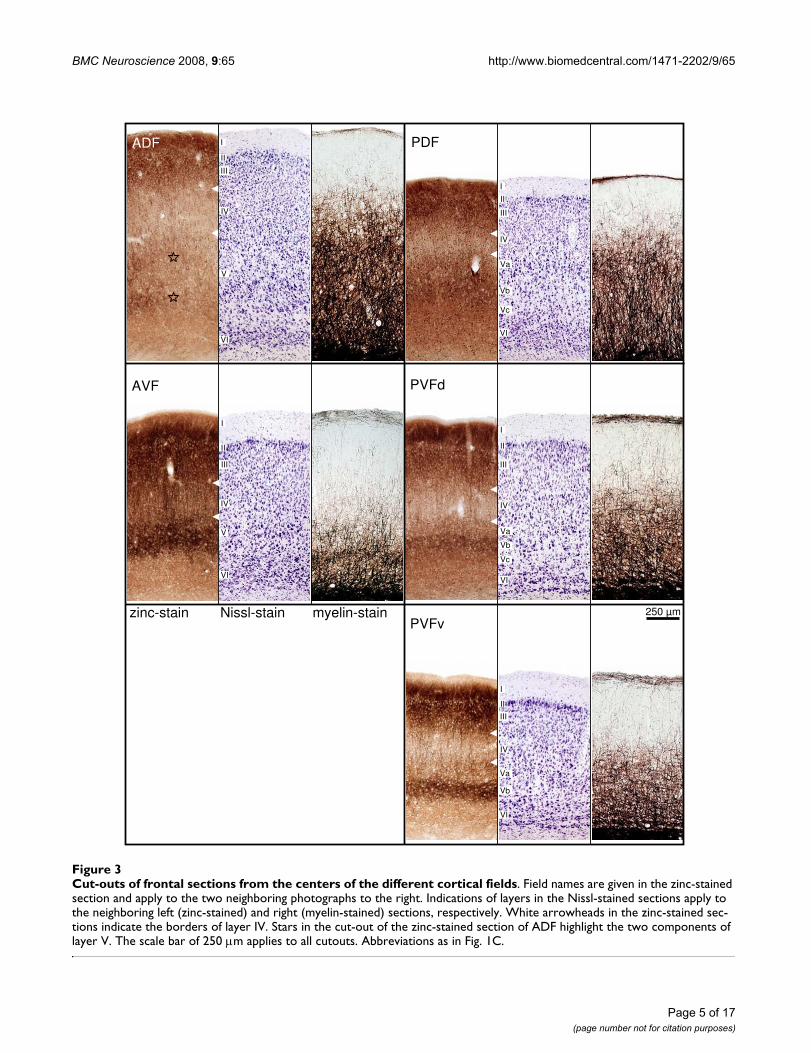
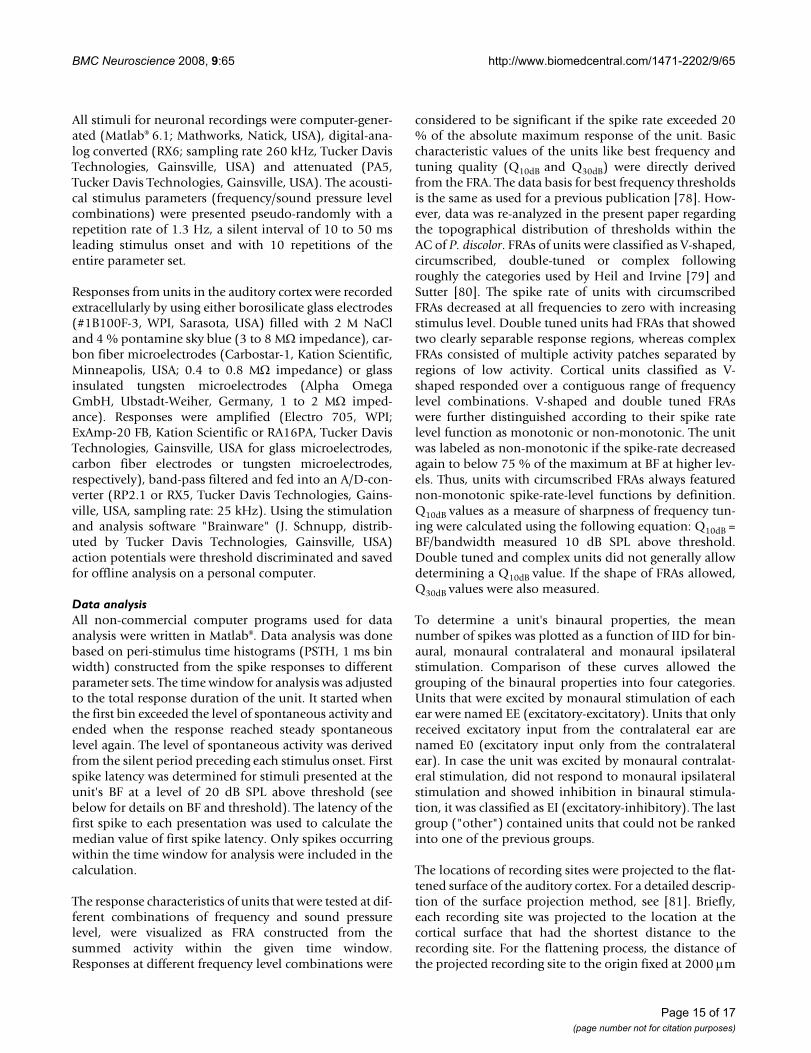
zinc are considered as parameters for the distinction of thedifferent fields. Cut-outs of frontal sections stained forcells (Nissl), myelinated fibers (Gallyas) and for zinc (sul-phide/silver histochemical method) from the centers ofthe different cortical fields are mounted in Fig. 3 fordetailed comparison.
Total cortical thickness varies between 1600 m (ADF)and 1200 m from dorso-rostral to ventro-caudal loca-tions (PVFv) in the AC. Despite the high density of granu-lar elements in layer III and IV of the dorsal fields, thecortical layers V and VI take more of the total thickness ofthe cortex. Therefore, they are addressed as parietal corti-cal fields. The ventral fields are thought to belong to thetemporal cortex, as layers III and IV dominate layers V andVI in thickness although granular elements are sparse andthe cell density is lower in layers III/IV compared to thedorsal fields.
Dorsal and ventral fields also differ with respect to layer I,which is generally thinner in the dorsal than in the ventralfields. The myelinated horizontal fibers in the superficialpart of layer I form a narrow dense band in the dorsalfields, but a broader one in the ventral fields, which is par-alleled by a nearly zinc-free stripe in the ventral fields.
The most characteristic features used for delimitation ofcortical fields are described in detail as follows. ADF hasthe greatest cortical width that seems to be caused by adoubled layer V: layer V of the non-auditory cortical areadorsal to the AC seems to continue beneath layer V of ADF(see frontal section stained for zinc in Fig. 2, left column,bottom, and Fig. 3, upper left panel, stars marking the twocomponents of layer V).
In AVF, the rostral beginning coincides with the most cau-dal part of the claustrocortex without a sharp border. Themyelin content in AVF is comparably low, whereas thestain for zinc is generally intense (as is the stain in the ros-trally adjacent claustrocortex and the ventrally borderingperirhinal cortex). Even the paler staining band corre-sponding to layer IV is relatively dark.
The posterior fields are more homogeneous. Corticalwidth in PDF is smaller than in ADF and characteristic dif-ferences to the neighboring PVF are obvious at highermagnification (see Fig. 3). In the zinc stain, layer IV is nar-rower and more heavily stained in PDF than in PVF,whereas layer V is thicker and of higher staining intensity.
PVF has the most conspicuous wide and pale zinc stainingband in layer IV, encompassing deep layer III. Layer Vshows three subdivisions in the dorsal part (PVFd),whereas in the ventral part (PVFv) only two subdivisionsare recognizable. Layer Vb, the most intense staining part
Recording sites and subfields in the auditory cortex of Phyllos-tomus discolorFigure 1Recording sites and subfields in the auditory cortex of Phyllostomus discolor. A) Lateral view of the P. discolor brain. Recording sites of all 849 units are indicated as black dots. Superimposed black outlines are neuroanatomically determined borders. Solid black lines represent reliable bor-ders, whereas stippled black lines represent more variable borders. Rostro-caudal positions of frontal sections shown in Fig. 2 are indicated by the white vertical lines. Colored lines represent equal medio-lateral distances from the midline in 1000 m steps as shown in the flattened cortical surface pro-jection in 1B. B) Projection of recording sites (black crosses) and neuroanatomical borders (black lines) on an unrolled and flattened cortical surface. Lateral distances on the cortical surface are indicated in 1000 m steps by corresponding colors as in the side view (1A). The origin used for the flat-tening process was fixed at 2000 m lateral from the midline of the brain (upper dark blue line). C) Schematic of the audi-tory cortical subfields: anterior dorsal field (ADF), posterior dorsal field (PDF), anterior ventral field (AVF) and posterior ventral field (PVF) with dorsal (PVFd), ventral (PVFv) parts and a border zone (bz) reconstructed on the flattened corti-cal surface. The neuroanatomically determined borders are indicated by black lines.
Arostro−caudal distance [μm]
dors
o−ve
ntra
l dis
tanc
e [μ
m]
1 2
rostro−caudal distance [μm]
med
io−l
ater
al d
ista
nce
[μm
]
B5000 7000 9000
−8000
−7000
−6000
−5000
−4000
−3000
−2000
−1000
0
C
ADF
AVF
PVFd
PVFv
bz
BMC Neuroscience 2008, 9:65 http://www.biomedcentral.com/1471-2202/9/65
Page 4 of 17(page number not for citation purposes)
Frontal sections at two rostro-caudal levelsFigure 2Frontal sections at two rostro-caudal levels. The frontal sections are shown for position indicated by the vertical lines in Fig. 1A. Top row: sections (40 m thick) stained for cells (Nissl); middle row: neighboring sections stained for myelin; bottom row: sections stained for zinc at comparable rostro-caudal level from another series. Scalebar: 2000 m. Abbreviations as in Fig. 1C.
ADF
AVF
PVFd
PVFv
PVFv
PVF
ADF
AVF
ADF
AVF
1 2
PVFbz
PVFd
PVFbz
PVFv
bz
PVFd
Nissl-stain
myelin-stain
zinc-stain
2000 μm
BMC Neuroscience 2008, 9:65 http://www.biomedcentral.com/1471-2202/9/65
Page 5 of 17(page number not for citation purposes)
Cut-outs of frontal sections from the centers of the different cortical fieldsFigure 3Cut-outs of frontal sections from the centers of the different cortical fields. Field names are given in the zinc-stained section and apply to the two neighboring photographs to the right. Indications of layers in the Nissl-stained sections apply to the neighboring left (zinc-stained) and right (myelin-stained) sections, respectively. White arrowheads in the zinc-stained sec-tions indicate the borders of layer IV. Stars in the cut-out of the zinc-stained section of ADF highlight the two components of layer V. The scale bar of 250 m applies to all cutouts. Abbreviations as in Fig. 1C.
III
II
I
IV
Vb
VI
Va
III
II
I
IV
Vb
VI
Va
III
II
I
IV
Vb
VI
Va
III
II
I
IV
V
VI
III
II
I
IV
Vb
VI
Va
III
II
I
IV
Vb
VI
Va
III
II
I
IV
VI
V
Vc
Vc
ADF PDF
AVF PVFd
PVFvzinc-stain Nissl-stain myelin-stain 250 μm
BMC Neuroscience 2008, 9:65 http://www.biomedcentral.com/1471-2202/9/65
Page 6 of 17(page number not for citation purposes)
of layer V is strikingly darker in PVFv. In PVFbz a gradualchange of the characteristic features from PVF toward theventrally adjacent perirhinal cortex takes place, e.g. thelayered organization fades as well in the cell stain as in thezinc stain, and so do the myelinated fibers.
Layer IV appears as a pale band with the lowest stainingintensity in the zinc stain and the staining intensity oflayer IV varies characteristically between the fields. It isfaint in layer IV of PDF, comparably lighter in ADF, rela-tively dark in AVF and faintest in PVF. Layer IV (and deeplayer III) contains a high number of granular elements inthe dorsal fields, whereas the neuronal somata in the ven-tral fields are larger and the cell density is lower. Layer IVis heavily myelinated in all fields except in the sparselymyelinated AVF.
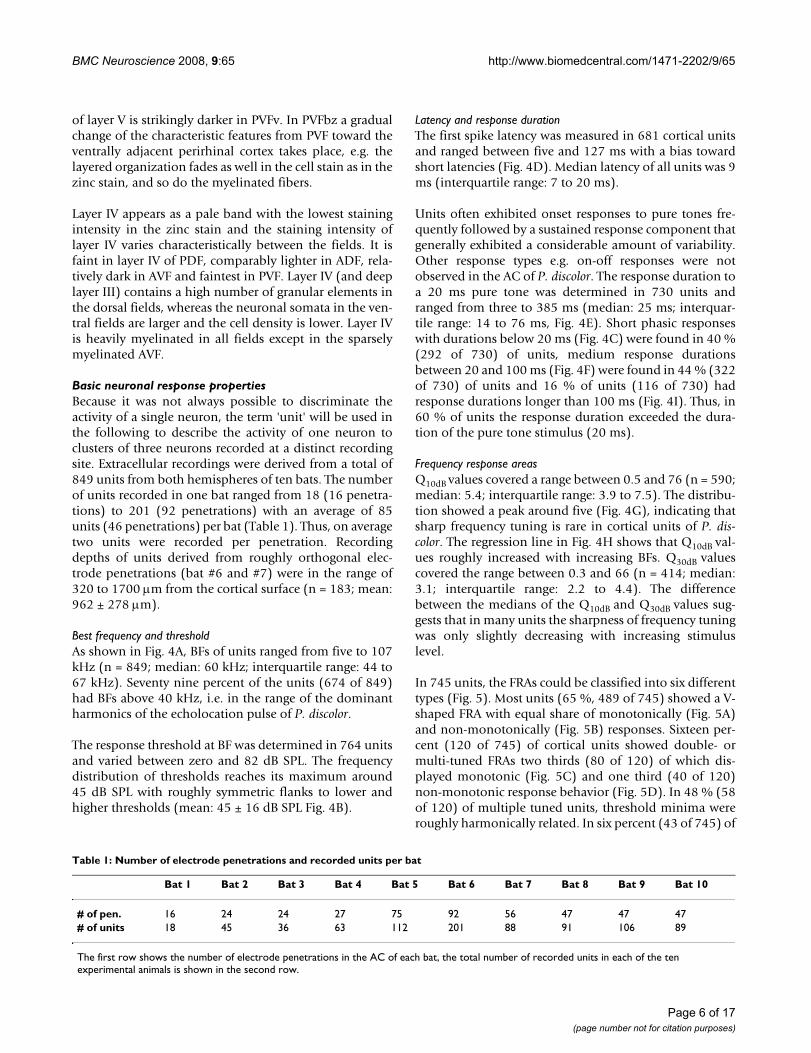
Basic neuronal response propertiesBecause it was not always possible to discriminate theactivity of a single neuron, the term 'unit' will be used inthe following to describe the activity of one neuron toclusters of three neurons recorded at a distinct recordingsite. Extracellular recordings were derived from a total of849 units from both hemispheres of ten bats. The numberof units recorded in one bat ranged from 18 (16 penetra-tions) to 201 (92 penetrations) with an average of 85units (46 penetrations) per bat (Table 1). Thus, on averagetwo units were recorded per penetration. Recordingdepths of units derived from roughly orthogonal elec-trode penetrations (bat #6 and #7) were in the range of320 to 1700 m from the cortical surface (n = 183; mean:962 ± 278 m).
Best frequency and thresholdAs shown in Fig. 4A, BFs of units ranged from five to 107kHz (n = 849; median: 60 kHz; interquartile range: 44 to67 kHz). Seventy nine percent of the units (674 of 849)had BFs above 40 kHz, i.e. in the range of the dominantharmonics of the echolocation pulse of P. discolor.
The response threshold at BF was determined in 764 unitsand varied between zero and 82 dB SPL. The frequencydistribution of thresholds reaches its maximum around45 dB SPL with roughly symmetric flanks to lower andhigher thresholds (mean: 45 ± 16 dB SPL Fig. 4B).
Latency and response durationThe first spike latency was measured in 681 cortical unitsand ranged between five and 127 ms with a bias towardshort latencies (Fig. 4D). Median latency of all units was 9ms (interquartile range: 7 to 20 ms).
Units often exhibited onset responses to pure tones fre-quently followed by a sustained response component thatgenerally exhibited a considerable amount of variability.Other response types e.g. on-off responses were notobserved in the AC of P. discolor. The response duration toa 20 ms pure tone was determined in 730 units andranged from three to 385 ms (median: 25 ms; interquar-tile range: 14 to 76 ms, Fig. 4E). Short phasic responseswith durations below 20 ms (Fig. 4C) were found in 40 %(292 of 730) of units, medium response durationsbetween 20 and 100 ms (Fig. 4F) were found in 44 % (322of 730) of units and 16 % of units (116 of 730) hadresponse durations longer than 100 ms (Fig. 4I). Thus, in60 % of units the response duration exceeded the dura-tion of the pure tone stimulus (20 ms).
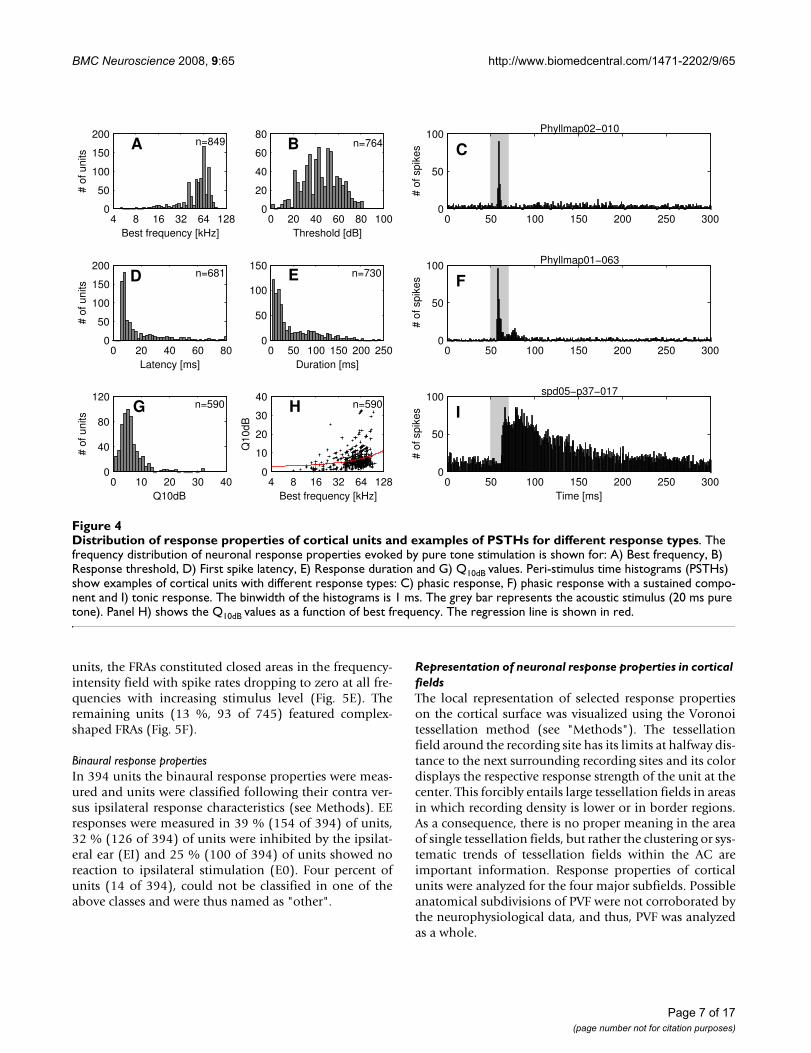
Frequency response areasQ10dB values covered a range between 0.5 and 76 (n = 590;median: 5.4; interquartile range: 3.9 to 7.5). The distribu-tion showed a peak around five (Fig. 4G), indicating thatsharp frequency tuning is rare in cortical units of P. dis-color. The regression line in Fig. 4H shows that Q10dB val-ues roughly increased with increasing BFs. Q30dB valuescovered the range between 0.3 and 66 (n = 414; median:3.1; interquartile range: 2.2 to 4.4). The differencebetween the medians of the Q10dB and Q30dB values sug-gests that in many units the sharpness of frequency tuningwas only slightly decreasing with increasing stimuluslevel.
In 745 units, the FRAs could be classified into six differenttypes (Fig. 5). Most units (65 %, 489 of 745) showed a V-shaped FRA with equal share of monotonically (Fig. 5A)and non-monotonically (Fig. 5B) responses. Sixteen per-cent (120 of 745) of cortical units showed double- ormulti-tuned FRAs two thirds (80 of 120) of which dis-played monotonic (Fig. 5C) and one third (40 of 120)non-monotonic response behavior (Fig. 5D). In 48 % (58of 120) of multiple tuned units, threshold minima wereroughly harmonically related. In six percent (43 of 745) of
Table 1: Number of electrode penetrations and recorded units per bat
Bat 1 Bat 2 Bat 3 Bat 4 Bat 5 Bat 6 Bat 7 Bat 8 Bat 9 Bat 10
# of pen. 16 24 24 27 75 92 56 47 47 47# of units 18 45 36 63 112 201 88 91 106 89
The first row shows the number of electrode penetrations in the AC of each bat, the total number of recorded units in each of the ten experimental animals is shown in the second row.
BMC Neuroscience 2008, 9:65 http://www.biomedcentral.com/1471-2202/9/65
Page 7 of 17(page number not for citation purposes)
units, the FRAs constituted closed areas in the frequency-intensity field with spike rates dropping to zero at all fre-quencies with increasing stimulus level (Fig. 5E). Theremaining units (13 %, 93 of 745) featured complex-shaped FRAs (Fig. 5F).
Binaural response propertiesIn 394 units the binaural response properties were meas-ured and units were classified following their contra ver-sus ipsilateral response characteristics (see Methods). EEresponses were measured in 39 % (154 of 394) of units,32 % (126 of 394) of units were inhibited by the ipsilat-eral ear (EI) and 25 % (100 of 394) of units showed noreaction to ipsilateral stimulation (E0). Four percent ofunits (14 of 394), could not be classified in one of theabove classes and were thus named as "other".
Representation of neuronal response properties in cortical fieldsThe local representation of selected response propertieson the cortical surface was visualized using the Voronoitessellation method (see "Methods"). The tessellationfield around the recording site has its limits at halfway dis-tance to the next surrounding recording sites and its colordisplays the respective response strength of the unit at thecenter. This forcibly entails large tessellation fields in areasin which recording density is lower or in border regions.As a consequence, there is no proper meaning in the areaof single tessellation fields, but rather the clustering or sys-tematic trends of tessellation fields within the AC areimportant information. Response properties of corticalunits were analyzed for the four major subfields. Possibleanatomical subdivisions of PVF were not corroborated bythe neurophysiological data, and thus, PVF was analyzedas a whole.
Distribution of response properties of cortical units and examples of PSTHs for different response typesFigure 4Distribution of response properties of cortical units and examples of PSTHs for different response types. The frequency distribution of neuronal response properties evoked by pure tone stimulation is shown for: A) Best frequency, B) Response threshold, D) First spike latency, E) Response duration and G) Q10dB values. Peri-stimulus time histograms (PSTHs) show examples of cortical units with different response types: C) phasic response, F) phasic response with a sustained compo-nent and I) tonic response. The binwidth of the histograms is 1 ms. The grey bar represents the acoustic stimulus (20 ms pure tone). Panel H) shows the Q10dB values as a function of best frequency. The regression line is shown in red.
# of
uni
ts
Best frequency [kHz]
n=849A
4 8 16 32 64 1280
50
100
150
200
Threshold [dB]
n=764B
0 20 40 60 80 1000
20
40
60
80
# of
uni
ts
Latency [ms]
n=681D
0 20 40 60 800
50
100
150
200
Duration [ms]
n=730E
0 50 100 150 200 2500
50
100
150
# of
uni
ts
Q10dB
n=590G
0 10 20 30 400
40
80
120
Best frequency [kHz]
Q10
dB
n=590H
4 8 16 32 64 1280
10
20
30
40
# of
spi
kes
Phyllmap02−010
C
0 50 100 150 200 250 3000
50
100
# of
spi
kes
Phyllmap01−063
F
0 50 100 150 200 250 3000
50
100
Time [ms]
# of
spi
kes
spd05−p37−017
I
0 50 100 150 200 250 3000
50
100
BMC Neuroscience 2008, 9:65 http://www.biomedcentral.com/1471-2202/9/65
Page 8 of 17(page number not for citation purposes)
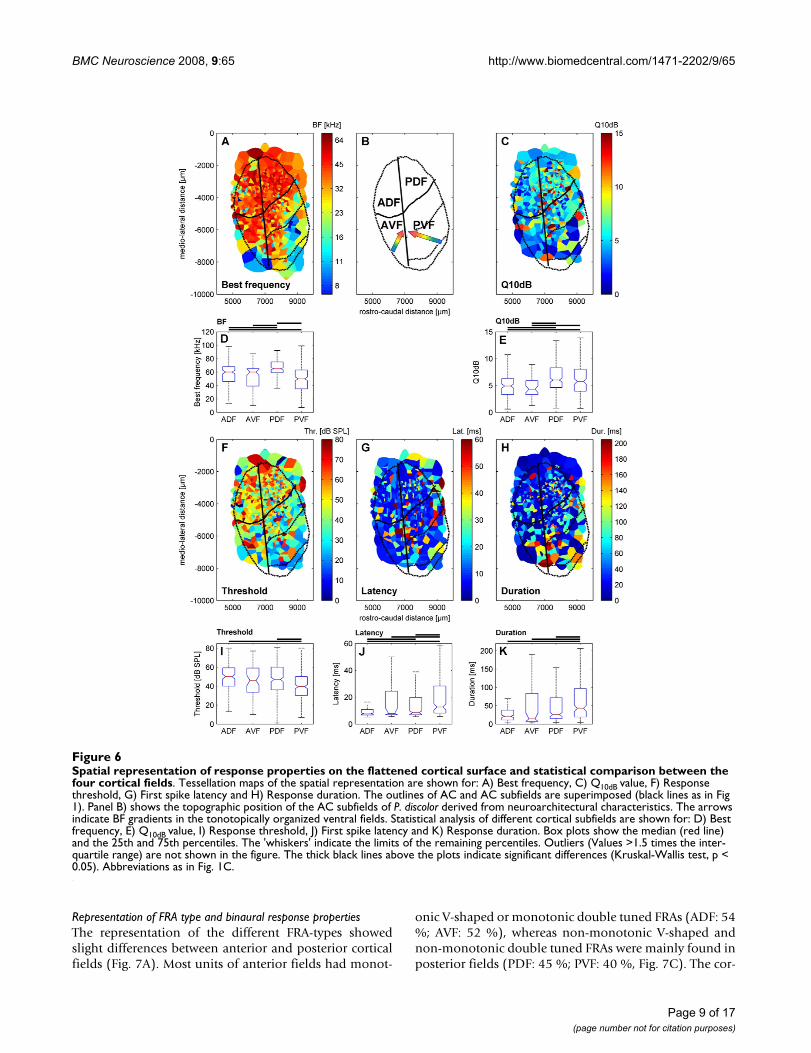
Representation of best frequency and Q10dB
The organization of BFs within the AC of P. discolor isshown in Fig. 6A. Units in the dorsal fields had a relativelyrestricted range of mainly high BFs, which covered fre-quencies in the range of the dominant harmonics of theecholocation pulse of this species. Most units in the ADFhad BFs above 45 kHz, whereas units in the PDF hadmainly BFs above 60 kHz. Only at the most rostral posi-tions of the ADF units with low BFs were found. Notonotopic arrangement of BFs was found in the dorsalfields. In contrast, fields in the ventral part of the ACshowed a tonotopic organization of BFs. The frequencygradient in AVF developed along the rostro-lateral tocaudo-medial axis with low BFs at rostro-lateral positions,whereas in PVF the BFs decreased from rostral to caudalcortical positions. Thus, PVF and AVF shared a common
high-frequency border. The rough direction of BF gradi-ents in the ventral fields is schematically shown in Fig. 6B.As shown in Fig. 6D, the median BF (65 kHz) in PDF wassignificantly higher than the median BFs of the other cor-tical fields (Kruskal-Wallis test, p < 0.05). The lowestmedian BF (50 kHz) was found in PVF.
Q10dB values of units were also not uniformly distributedon the cortical surface but showed a tendency to increasefrom anterior to posterior locations (Fig. 6C). In bothanterior fields, units showed broader frequency tuningwith significantly lower Q10dB values (Kruskal-Wallis test,p < 0.05) than found in units in the posterior fields (Fig.6E).
Representation of threshold, latency and response durationFigure 6F shows the cortical representation of responsethresholds at BF within the different fields. Thresholds ofunits in the dorsal fields were significantly higher thanthresholds of units in PVF (Kruskal-Wallis test, p < 0.05)but only slightly higher than those of units in AVF (Fig.6I). Units in the ADF had highest median response thresh-old (50 dB SPL), whereas the lowest median responsethreshold was found in units in the PVF (40 dB SPL).
The distribution of first spike latencies in the AC of P. dis-color is shown in Fig. 6G. As a general trend, short firstspike latencies were preferentially represented in units inthe two anterior fields, whereas in units in the posteriorfields also long latencies were found. The median latencyof PVF (13 ms; interquartile range: 8 to 28 ms) was signif-icantly longer (Kruskal-Wallis test, p < 0.05) than themedian latencies of ADF (median: 8 ms; interquartilerange: 7 to 11 ms), AVF (median: 8 ms; interquartilerange: 7 to 24 ms) and PDF (median: 9 ms; interquartilerange: 7 to 20 ms, Fig. 6J).
The representation of response durations within the AC(Fig. 6H) showed the same trend as the representation offirst spike latencies: short durations were characteristic forunits in the anterior fields, whereas in the posterior fieldsunits with long response durations were found, too. Themedian response duration of units in ADF (21 ms; inter-quartile range: 11 to 38 ms) and AVF (14 ms; interquartilerange: 7 to 84 ms) were significantly shorter (Kruskal-Wal-lis test, p < 0.05) than the median response duration ofunits in PVF (43 ms; interquartile range: 19 to 97 ms) butonly slightly shorter than the median response durationof units in PDF (26 ms; interquartile range: 15 to 72 ms).In addition, the median response duration in PDF was sig-nificantly shorter (median: 24 ms; interquartile range: 15to 65 ms, Fig. 6K) compared to PVF.
Examples of the six different FRA types of cortical unitsFigure 5Examples of the six different FRA types of cortical units. Examples of the different classes of FRA types are shown for: A) monotonically V-shaped, B) non-monotonically V-shaped, C) monotonically double tuned, D) non-monoton-ically double tuned, E) circumscribed and F) complex FRAs.
Spike−Rate [Hz]
60
80
100
Spike−Rate [Hz
20
30
40
50
60
Spike−Rate [Hz]
40
50
60
70
Spike−Rate [Hz
40
60
80
100
Spike−Rate [Hz]
40
50
60
70
80
ALeve
l [dB
SP
L]
30 50 7040
50
60
70
80
90
Spike−Rate [Hz
30
40
50
60
70
B40 60 80
20
40
60
80
CLeve
l [dB
SP
L]
20 40 6060
70
80
90
D20 40 80
40
60
80
E
Frequency [kHz]
Leve
l [dB
SP
L]
60 65 7050
60
70
80
90
F
Frequency [kHz]20 25 30
20
40
60
80
BMC Neuroscience 2008, 9:65 http://www.biomedcentral.com/1471-2202/9/65
Page 9 of 17(page number not for citation purposes)
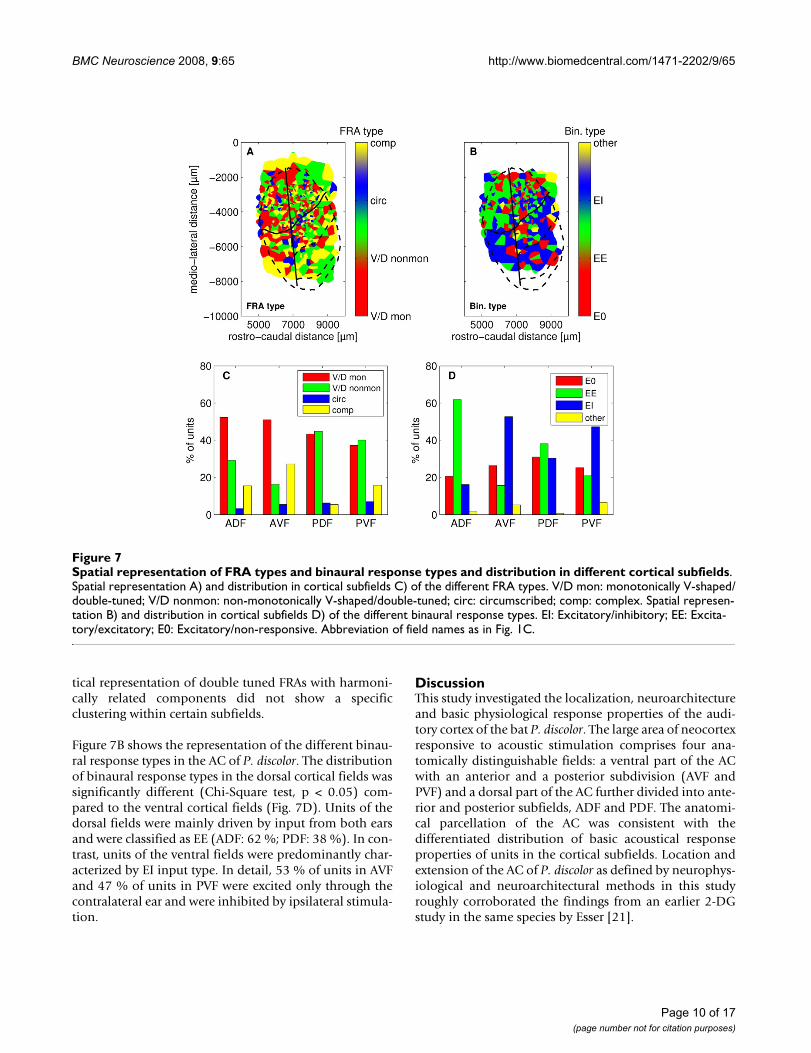
Representation of FRA type and binaural response propertiesThe representation of the different FRA-types showedslight differences between anterior and posterior corticalfields (Fig. 7A). Most units of anterior fields had monot-
onic V-shaped or monotonic double tuned FRAs (ADF: 54%; AVF: 52 %), whereas non-monotonic V-shaped andnon-monotonic double tuned FRAs were mainly found inposterior fields (PDF: 45 %; PVF: 40 %, Fig. 7C). The cor-
-tical fieldsFigure 6Spatial representation of response properties on the flattened cortical surface and statistical comparison between the four cortical fields. Tessellation maps of the spatial representation are shown for: A) Best frequency, C) Q10dB value, F) Response threshold, G) First spike latency and H) Response duration. The outlines of AC and AC subfields are superimposed (black lines as in Fig 1). Panel B) shows the topographic position of the AC subfields of P. discolor derived from neuroarchitectural characteristics. The arrows indicate BF gradients in the tonotopically organized ventral fields. Statistical analysis of different cortical subfields are shown for: D) Best frequency, E) Q10dB value, I) Response threshold, J) First spike latency and K) Response duration. Box plots show the median (red line) and the 25th and 75th percentiles. The 'whiskers' indicate the limits of the remaining percentiles. Outliers (Values >1.5 times the inter-quartile range) are not shown in the figure. The thick black lines above the plots indicate significant differences (Kruskal-Wallis test, p < 0.05). Abbreviations as in Fig. 1C.
BMC Neuroscience 2008, 9:65 http://www.biomedcentral.com/1471-2202/9/65
Page 10 of 17(page number not for citation purposes)
tical representation of double tuned FRAs with harmoni-cally related components did not show a specificclustering within certain subfields.
Figure 7B shows the representation of the different binau-ral response types in the AC of P. discolor. The distributionof binaural response types in the dorsal cortical fields wassignificantly different (Chi-Square test, p < 0.05) com-pared to the ventral cortical fields (Fig. 7D). Units of thedorsal fields were mainly driven by input from both earsand were classified as EE (ADF: 62 %; PDF: 38 %). In con-trast, units of the ventral fields were predominantly char-acterized by EI input type. In detail, 53 % of units in AVFand 47 % of units in PVF were excited only through thecontralateral ear and were inhibited by ipsilateral stimula-tion.
DiscussionThis study investigated the localization, neuroarchitectureand basic physiological response properties of the audi-tory cortex of the bat P. discolor. The large area of neocortexresponsive to acoustic stimulation comprises four ana-tomically distinguishable fields: a ventral part of the ACwith an anterior and a posterior subdivision (AVF andPVF) and a dorsal part of the AC further divided into ante-rior and posterior subfields, ADF and PDF. The anatomi-cal parcellation of the AC was consistent with thedifferentiated distribution of basic acoustical responseproperties of units in the cortical subfields. Location andextension of the AC of P. discolor as defined by neurophys-iological and neuroarchitectural methods in this studyroughly corroborated the findings from an earlier 2-DGstudy in the same species by Esser [21].
Spatial representation of FRA types and binaural response types and distribution in different cortical subfieldsFigure 7Spatial representation of FRA types and binaural response types and distribution in different cortical subfields. Spatial representation A) and distribution in cortical subfields C) of the different FRA types. V/D mon: monotonically V-shaped/double-tuned; V/D nonmon: non-monotonically V-shaped/double-tuned; circ: circumscribed; comp: complex. Spatial represen-tation B) and distribution in cortical subfields D) of the different binaural response types. EI: Excitatory/inhibitory; EE: Excita-tory/excitatory; E0: Excitatory/non-responsive. Abbreviation of field names as in Fig. 1C.
BMC Neuroscience 2008, 9:65 http://www.biomedcentral.com/1471-2202/9/65
Page 11 of 17(page number not for citation purposes)
Comparison with the auditory cortex of other batsThe distribution of BFs in the AC of P. discolor (see Fig. 4A)showed an overrepresentation of frequencies in the spec-tral range of the bat's echolocation pulse (40 to 90 kHz).This overrepresentation might be due to the fact that thedorsal fields are mainly containing units with BFs in thehigh-frequency range. Thus, a larger amount of corticalsurface is devoted to units with high BFs as compared tounits with low BFs. In addition, more units were recordedfrom the dorsal fields and this bias might also be reflectedin the distribution of BFs. A similar overrepresentation ofBFs in the spectral range of the echolocation pulses hasbeen found in the AC of other microchiropteran bats e.g.E. fuscus [23], Myotis lucifugus [17] and C. perspicillata [20].In the CF/FM bats P. parnellii [18], R. rouxi [13] and R. fer-rumequinum [14] the overrepresentation of a narrow call-specific spectral range of the CF-part is reflected through-out the ascending auditory pathway [24-29] and is basedon specializations already implemented on the cochlearlevel [30-32].
In CF/FM bats, a large part of the AC is involved inprocessing of specific combinations of the different har-monics in the echolocation pulse and echo. In P. parnelliiand slightly less distinctive in R. rouxi, several fields can besegregated by virtue of selective responses of neurons todifferent combinations of FM-parts or CF components ofcall and echo. Neurons are tuned to delays between thecomponents and are topographically ordered [12,17,33].Such a complex representation of pulse and echo delayhas generally not been found in FM-bats so far, althoughpulse-echo delay sensitive neurons exist in the AC of e.g.M. lucifugus [34] and in the dorsal parts of the AC of thephyllostomid bat C. perspicillata [6], which is closelyrelated to P. discolor. In the present study, only pure tonesbut no echolocation related stimuli (e.g. FM/FM pairs)were used for acoustic stimulation (see Methods). Conse-quently, no statements concerning the functional involve-ment of cortical subfields other than pure tone processing(e.g. delay sensitivity) can be made, so far. Besides that,the organization and parcellation of the AC of P. discoloris generally in accordance with that of C. perspicillata. Thedorsal fields in the AC of Carollia were similarly character-ized by neurons with BFs in the high-frequency range, andthe ventral part of the AC was also composed of twotonotopically organized subfields, which shared a com-mon high-frequency border [20]. In contrast, the AC ofother non-phyllostomid FM bats like M. lucifugus and E.fuscus showed differentiation into subfields to a lesserdegree [15,19]. In both species tonotopically organizedfields with frequency gradients running in opposite direc-tions were found, but no fields with characteristics similarto the dorsal cortical fields in P. discolor were described.
A high percentage (55 %) of units in the AC of P. discolorhad first spike latencies below 10 ms. As other studies inFM-bats reported mean latencies measured at 10 to 20 dBabove threshold around 8 to 10 ms already on the level ofthe IC [35,36], this seems to be unusually short. However,short latencies in the AC of FM-bats were also reported[37]. In addition, Haplea et al. showed that on the level ofthe IC latencies in E. fuscus still could be as short as aboutthree milliseconds [35]. Although most cortical neuronsin R. rouxi had latencies in the range between 10 to 15 ms,short latencies below 10 ms were found in a substantial18 % of neurons [13]. The bias toward short latenciesbelow 10 ms in P. discolor might be explained by the factthat a large number of recordings in our study werederived from dorsal regions of the AC where short laten-cies are predominately represented.
In contrast to findings in other mammals where the AI hasbeen described to have the shortest latencies [38], the low-est median first spike latency in P. discolor was found inthe ADF, whereas in the PVF, which might be equivalentto the AI, the longest first spike latencies were found. Ourfindings in P. discolor are supported by the fact that in theAC of R. rouxi shortest latencies were also found in thedorsal fields [13]. In R. rouxi, ventral and dorsal corticalfields are not sequentially connected but rather receiveconnections from different parts of the auditory thalamusvia different projection pathways [39-41]. In P. discolor, asimilar connection pattern could explain the shorterlatencies in the dorsal fields compared to the ventralfields. However, this hypothesis needs to be proved byfuture tracer studies in this species.
Influence of anesthesia and multi unit recordings on response patternsA large proportion of units in the P. discolor AC showedonset-type responses. It is known that the response pat-tern of cortical neurons is influenced by anesthetics. Forexample, the use of barbiturates like pentobarbital thatenhances GABAA-mediated inhibition biased the distribu-tion of response types toward short onset responses in therat auditory cortex [42]. The drug Midazolam used in ourstudy, like other benzodiazepines, also enhances action ofGABA on GABAA receptors. Thus, the high abundance ofphasic onset-type responses in our study could be a con-sequence of the use of Midazolam. However, a high per-centage of onset-type response patterns (68 %) were alsofound in neurons in the AC of awake R. rouxi [13] andawake mustached bats [43], indicating that even in theun-anesthetized bat phasic responses are common. Thisminimizes the potential effect of anesthetics on responsetypes of cortical units in the present study. Another pointthat could have influenced the response pattern is thatrecordings in our study were not always derived from sin-gle units (see Methods). Seshagiri and Delgutte [44]
BMC Neuroscience 2008, 9:65 http://www.biomedcentral.com/1471-2202/9/65
Page 12 of 17(page number not for citation purposes)
showed that adjacent neurons recorded simultaneouslywith tetrodes in the inferior colliculus of cats could differsignificantly in their temporal discharge pattern althoughBFs and threshold were highly correlated. Therefore, blur-ring of response pattern is possible in some cases in multiunit recordings, but markedly dependent on the numberof contributing neurons with dissimilar response types. Asmulti unit recordings in this study were generally derivedfrom only up to three neurons (see Methods), and mostunits showed phasic responses the pooling of spikes inmulti units should not have severely effected the responsepattern in most cases.
Parcellation of the AC in P. discolorOne way of defining different fields of AC is by comparingthe afferent connections with the auditory thalamus.Common to all mammals is a strong tonotopically organ-ized projection from the ventral division of the medialgeniculate body (MGBv) to AI [45]. In contrast to this,non-tonotopically organized non-primary cortical areasreceive major projections from the dorsal division of theMGB (MGBd) [45]. CF/FM bats like horseshoe bats (e.g.R. rouxi, [39,41]) and P. parnellii [46] follow this connec-tivity pattern. In both animals, AI contains a tonotopicmap where frequencies of the CF-components of the callsare overrepresented while frequencies of the FM-compo-nents are largely absent [18]. In R. rouxi, neurons special-ized for the processing of acoustic parameters relevant forecholocation (e.g. echo delay) are mainly represented indorsally located cortical areas that are targeted by projec-tions from the MGBd [41]. The view of a congeneric pro-jection from MGBv to AI covering the entire frequencyrange has been challenged by recent findings in the glean-ing bat Antrozous pallidus. In this bat, the low frequencyportion of a coherent frequency representation in the ACis innervated by the MGBv, whereas the high-frequencypart received major projections from the supra-geniculatenucleus, a part of MGBd [47]. Neurons in the high-fre-quency range were moreover of a distinct binaural inputtype (EO) and preferred FM-sweeps, whereas neurons inthe low frequency part were classified as EI and respondedpreferentially to noise. Two functionally distinct pathwaysevidently exist in this bat species: First, a low frequencypathway serving for passive prey location and second, ahigh-frequency pathway serving for obstacle avoidanceduring active echolocation [47,48]. The approach thatpart of AI may not receive input from the MGBv chal-lenges one of the traditional definitions for AI via connec-tivity that, however, does not constitute the only validcriterion.
The distribution of binaural response types in P. discolorresembles that in A. pallidus, whereas neuroarchitectonicand neurophysiological features argue for a cortical fieldspattern of the AC in P. discolor similar to the arrangement
in R. rouxi and other mammals. Tracer experiments werenot included in the present study in P. discolor, and conse-quently data on thalamo-cortical connections are notavailable. However, neuroarchitectonic features providevaluable tools for the definition of subdivisions in ACwhen combined with neurophysiological outcomes.Undoubtedly, the combination of all three approacheswould yield optimal possibilities to classify cortical subdi-visions. The specific usefulness of different neurohistolog-ical stains to determine cortical fields will be discussed inthe following: The staining for zinc proved to be specifi-cally helpful, complementing staining for cells and myeli-nated fibers. The zinc stain reveals horizontal bands in theneocortex that show characteristic variation in width andstaining intensity among cortical regions, sharply definingthe borders between cortical areas and their subdivisions,and are generally coincident with the limits defined in theNissl stained sections. The banding patterns are stableamong the species studied so far, allowing for an interspe-cies comparison (e.g. rats: [49-51] ; mice: [52] ; cats: [53]; wallabies: [54] and humans [55]).
The PVF shows several features in the zinc stain character-izing primary sensory regions in the mammalian neocor-tex: conspicuous pale zinc staining of the outer portion oflayer I, the differentiation of layer V in sublayers and,most characteristic, a wide, light band corresponding tolayer IV encompassing the lower portion of layer III. InPDF, most distinctive to the PVF is the zinc staining oflayer IV, which is narrower and more heavily stained,whereas layer V is thicker and of higher staining intensity.Zinc staining in AVF is generally intense. These features ofPDF and ADF have been described to be characteristic forsecondary sensory regions (rats: [49-51] ; mice: [52] ; cats:[53] ; wallabies: [54] and humans [55]). Furthermore, thestructure of ADF seems unique in that it could be an amal-gam of auditory and neighboring non-auditory, probablysomatosensory areas. Mixed auditory-somatosensoryfields neighboring the AC rostrally have been reported forseveral mammalian species (flying fox and gray squirrel:[56,57] ; mouse: [58] ; cat: [59] ; rat: [60]).
The accordance of response properties of cortical units inAVF and PVF with the anatomical partitioning of ventralauditory fields in the cortex is a further strong support,that the PVF might correspond to AI in P. discolor. PVF istonotopically organized with BFs increasing from caudalto rostral. The AVF shows also a tonotopic organizationbut in contrast to the PVF, BFs increase from rostro-ventralto caudo-dorsal locations. This organization is in accord-ance to findings in other mammals where tonotopic gra-dients with roughly opposite directions have also beenidentified in the AI and the AAF (e.g. cat: [61]; ferret: [62];gerbil: [63]; bat: C. perspicillata [20]). Because of the com-mon high-frequency border of the AVF and PVF, high fre-
BMC Neuroscience 2008, 9:65 http://www.biomedcentral.com/1471-2202/9/65
Page 13 of 17(page number not for citation purposes)
quencies are represented all the way along the medialborder of the PVF down to the most ventral border of thisfield (see Fig. 6A). In addition, no clear tonotopic gradientcan be seen in the PDF that could be a tonotopic continu-ation of the frequency representation in the ventrallylocated PVF. Thus, it is unlikely that the PDF just repre-sents the high-frequency portion of a contiguous fre-quency representation starting with low frequencies in thePVF as assumed for the AC of A. pallidus [47]. It is morelikely that the PDF represents a non-tonotopically organ-ized field like the dorsal fields found in other bats before(e.g. R. rouxi [13] and C. perspicillata [20], see above).However, also in C. perspicillata information about thethalamo-cortical connections is lacking.
In addition to BF, the distribution of several responseproperties like duration and first spike latency showed sig-nificant differences between the PDF and the PVF. To fur-ther test the possibility that high-frequency units in thePDF and PVF belong to a contiguous frequency represen-tation like in A. pallidus [47], we additionally tested thedifferences of latency and response duration only for thehigh-frequency units (BF > 50 kHz) of both cortical fields.Latency and response duration for high-frequency unitsalone were still significantly different (Mann-Whitney Utest, p < 0.05) between PDF and PVF. These findings fur-ther strengthen our parcellation of the AC based on theanatomical findings.
ConclusionIn this study, four subfields were identified in the AC ofthe bat P. discolor. These differed in their neuroanatomicalattributes and in the response properties of their units topure tone stimulation. The neuroanatomical and neuro-physiological properties of the tonotopically organizedPVF reflected common characteristics of AI in the mam-malian AC (e.g. very wide and pale zinc staining band inlayer III/IV, BF gradient ascending from caudal to rostral).The AVF located rostrally to the PVF showed a tonotopicBF gradient running roughly in opposite direction to thegradient of the PVF. Thus, the AVF of P. discolor might rep-resent the AAF described in other mammals. The dorsalpart of the AC of P. discolor was non-tonotopically organ-ized with BFs mainly in the high-frequency range. As mostenergy of the echolocation pulse of this bat species is con-tained in the frequency range between 60 to 80 kHz, thedorsal region of the AC of P. discolor seems to be particu-larly important for echolocation. With regard to the rela-tive position of cortical fields and their basic properties ofBF representation, the AC of P. discolor seems to follow theorganizational pattern seen in other phyllostomid bats.
To further compare the parcellation of the AC of P. discolorwith those of other bats and mammals, the specific con-nectivity between subdivisions of the AC and different
divisions of the auditory thalamus of P. discolor must beinvestigated in future studies.
MethodsExperimental animalsAll experiments were performed in agreement with theprinciples of laboratory animal care and under the regula-tions of the current version of German Law on AnimalProtection (approval 209.1/211-2531-68/03 Reg. Ober-bayern).
Five male and five female adult spear-nosed bats (Phyllos-tomus discolor, body weight: 30 to 45 g) were used in thisstudy. The animals originated from a breeding colony inthe Department Biology II of the Ludwig-Maximilians-University in Munich. For experiments, animals were keptseparated from other bats under semi-natural conditions(12 h day/12 h night cycle, 65 to 70 % relative humidity,28°C) with free access to food and water.
Anesthesia and surgical preparationIn a pre-recording surgical session, the bat was preparedunder anesthesia to provide for stable stereotaxic fixationin well defined coordinates and proper access to the targetarea. For anesthesia, a combination of Medetomidin(Domitor®, Novartis, Mississauga, Canada), Midazolam(Dormicum®, Hoffmann-La Roche, Mississauga, Canada)and Fentanyl (Fentanyl-Janssen®, Janssen-Cilag, Neuss,Germany) was injected subcutaneously (MMF, 0.4, 4.0and 0.04 g/g body weight). Skin and muscles coveringthe upper part of the cranium were cut rostro-caudallyalong the midline and shifted aside laterally. The cranialbone was completely cleaned of all remaining tissue anda small metal rod was fixed onto the caudal part of thebat's skull using light-curing dental cement (Charisma®,Heraeus Kulzer, Wehrheim Germany). After surgery, theanesthesia of the animal was antagonized by injecting aweight-dependent dose of a mixture of atipamezolehydrochloride (Antisedan®, Novartis), Flumazenil (Anex-ate®, Hoffmann-La Roche) and Naloxon (DeltaSelect®,DeltaSelect, Dreieich, Germany) subcutaneously (AFN:8.1, 0.034 and 0.32 g/g bodyweight). To alleviate post-operative pain, the analgesic Meloxicam (Metacam®, Boe-hringer-Ingelheim, Ingelheim, Germany, 0.2 mg/kgbodyweight) was administered after full recovery of thebat.
Stereotaxic procedure and verification of recording sites and correlation with neuroarchitectural featuresA detailed description of the stereotaxic procedure, deter-mination of brain orientation and reconstruction ofrecording sites has been already published elsewhere [64].In brief, the animal's head was fastened with the surgicallymounted rod to a stereotaxic frame in a well defined ori-entation. The alignment of the animal's skull and conse-
BMC Neuroscience 2008, 9:65 http://www.biomedcentral.com/1471-2202/9/65
Page 14 of 17(page number not for citation purposes)
quently the brain within the stereotaxic coordinate systemwas measured by scanning characteristic profile lines ofthe skull. The profile lines were measured in parasagittaland frontal planes (500 m steps) relative to a fixed refer-ence point and compared to a profile defining a standard-ized orientation of the skull and brain of P. discolor (Fenzland Nixdorf, unpublished data), that also determines thenormal axes of the available brain atlas of the animal.Thus, deviations of the actual alignment of the bat's headfrom the standardized position could be corrected byappropriate tilt and pitch of the animal within the experi-mental setup. Any reorientation of the skull is thus underaccurate stereotaxic control. This procedure allowed thepooling and comparison of all electrophysiologicallymeasured data, brain lesions and tracer deposits withinone and among different experimental animals. Locationsof lesions or marker (HRP, WGA-HRP) deposits weredetermined after transcardial perfusion and subsequenthistological processing of the brain based on the brainatlas. These atlas-oriented coordinates were comparedwith those of the physiologically determined reconstruc-tion of the specific location. This allowed a verification ofthe validity of recording coordinates, or eventually indi-cated errors that could typically be corrected after retrac-ing the mistake in localization.
For the analysis of the neuroarchitectural features of theauditory cortex, series of frontal sections stained for cresylviolet, myelin [65] and zinc were available. For the detec-tion of zinc, brains were processed according to a modifi-cation of the Timm method [66]. Zinc plays an importantrole in cell physiology [67] and has synaptic signalingfunctions in the mammalian brain [68,69]. In the neocor-tex, the stain for zinc reveals horizontal bands that showmarked variation in width and staining intensity amongfunctionally different cortical regions. These characteristicbanding patterns are generally coincident with the limitsdefined in the Nissl stained sections, but have the advan-tage that they are readily noticeable at low magnification.
Additional series of frontal sections stained for the cal-cium-binding proteins, acetylcholine-esterase (ACHe),cytochrome-oxidase were not included in the analysis pre-sented here, as they did not allow the differentiationbetween core and belt regions as clearly as described forother mammals with a more highly evolved neocortex(e.g., ACHe: [70,71]; Cytochromoxidase: [72]; calcium-binding proteins: [73,74]). Therefore, although involvinga complicated perfusion procedure, the stain for zinc waschosen as histochemical marker to delineate corticalareas.
Acoustic stimuli and recording of neuronal responsesAll experiments were conducted in a heated (36°C), elec-trically shielded and anechoic chamber. They normally
lasted 4 hours per session and were performed at four daysa week for up to six weeks. For each session, the bat wasanaesthetized using MMF (see above). Throughout thewhole experiment the animals were supplied with oxygen.To lower electrodes into the brain areas for recording ofneural responses, small holes of about 500 microns indiameter were drilled into the animal's skull above theauditory cortex and the dura was perforated. Electrodepenetrations were generally carried out in tangential direc-tion, roughly parallel to the surface of the brain (bat #1–5,#8 and #9) or in a roughly perpendicular direction to thebrain surface (bat #10). Two mapping experiments weredone with orthogonal electrode penetrations (bat #6 and#7) to cover the entire auditory cortex in single individualbats and to neurophysiologically outline the borders andreveal possible tonotopic trends of the AC as a whole.Only basic properties like tuning and threshold wererecorded in these two experiments.
Search stimuli for neuronal activity were pure tones with20 ms duration produced with a frequency generator(Wavetek model 136, 186, FG-5000) and a custom-madepulse former. The attenuation of these stimuli could bemodified manually (external attenuator AP401, adretelectronique, France). The stimuli were presented via cus-tom-made ultrasonic earphones [75] with a flat frequencyresponse (± 3 dB SPL between 10 to 100 kHz). As it wasnot always possible to discriminate the activity of a singleneuron, the term 'unit' is used in the text to describe theactivity of one neuron to clusters of up to three neuronsrecorded at a distinct recording site. Once a unit wasdetected, its BF was determined audio-visually. For mostunits, the frequency response area (FRA) was determinedin more detail. Therefore, pure tone stimuli (20 ms dura-tion, 2 ms rise and fall time), in various frequency andsound pressure level combinations were presented con-tralaterally. Although P. discolor emits FM-pulses for echo-location, pure tone stimuli were used to allowcomparison of the data to a previous study in a closelyrelated phyllostomid bat, C. perspicillata, [20]. The stimu-lus duration of 20 ms is roughly intermediate between theshort echolocation pulses (< 3 ms) and longer social calls(about 50 ms, [76]) of P. discolor.
The binaural response properties were determined at theunit's BF by using ABI (averaged binaural intensity, [77]).20 ms long pure tones were presented binaurally withincreasing intensity at contralateral and decreasing inten-sity at ipsilateral side and vice versa. The interaural inten-sity difference (IID) was changed from -20 dB SPL to +20dB SPL in steps of 5 dB SPL. The level of the signals waschosen so, that both ears were stimulated at 20 dB SPLabove the unit's auditory threshold. Thereafter, the samestimuli were presented monaurally to the contralateraland ipsilateral ear.
BMC Neuroscience 2008, 9:65 http://www.biomedcentral.com/1471-2202/9/65
Page 15 of 17(page number not for citation purposes)
All stimuli for neuronal recordings were computer-gener-ated (Matlab® 6.1; Mathworks, Natick, USA), digital-ana-log converted (RX6; sampling rate 260 kHz, Tucker DavisTechnologies, Gainsville, USA) and attenuated (PA5,Tucker Davis Technologies, Gainsville, USA). The acousti-cal stimulus parameters (frequency/sound pressure levelcombinations) were presented pseudo-randomly with arepetition rate of 1.3 Hz, a silent interval of 10 to 50 msleading stimulus onset and with 10 repetitions of theentire parameter set.
Responses from units in the auditory cortex were recordedextracellularly by using either borosilicate glass electrodes(#1B100F-3, WPI, Sarasota, USA) filled with 2 M NaCland 4 % pontamine sky blue (3 to 8 M impedance), car-bon fiber microelectrodes (Carbostar-1, Kation Scientific,Minneapolis, USA; 0.4 to 0.8 M impedance) or glassinsulated tungsten microelectrodes (Alpha OmegaGmbH, Ubstadt-Weiher, Germany, 1 to 2 M imped-ance). Responses were amplified (Electro 705, WPI;ExAmp-20 FB, Kation Scientific or RA16PA, Tucker DavisTechnologies, Gainsville, USA for glass microelectrodes,carbon fiber electrodes or tungsten microelectrodes,respectively), band-pass filtered and fed into an A/D-con-verter (RP2.1 or RX5, Tucker Davis Technologies, Gains-ville, USA, sampling rate: 25 kHz). Using the stimulationand analysis software "Brainware" (J. Schnupp, distrib-uted by Tucker Davis Technologies, Gainsville, USA)action potentials were threshold discriminated and savedfor offline analysis on a personal computer.
Data analysisAll non-commercial computer programs used for dataanalysis were written in Matlab®. Data analysis was donebased on peri-stimulus time histograms (PSTH, 1 ms binwidth) constructed from the spike responses to differentparameter sets. The time window for analysis was adjustedto the total response duration of the unit. It started whenthe first bin exceeded the level of spontaneous activity andended when the response reached steady spontaneouslevel again. The level of spontaneous activity was derivedfrom the silent period preceding each stimulus onset. Firstspike latency was determined for stimuli presented at theunit's BF at a level of 20 dB SPL above threshold (seebelow for details on BF and threshold). The latency of thefirst spike to each presentation was used to calculate themedian value of first spike latency. Only spikes occurringwithin the time window for analysis were included in thecalculation.
The response characteristics of units that were tested at dif-ferent combinations of frequency and sound pressurelevel, were visualized as FRA constructed from thesummed activity within the given time window.Responses at different frequency level combinations were
considered to be significant if the spike rate exceeded 20% of the absolute maximum response of the unit. Basiccharacteristic values of the units like best frequency andtuning quality (Q10dB and Q30dB) were directly derivedfrom the FRA. The data basis for best frequency thresholdsis the same as used for a previous publication [78]. How-ever, data was re-analyzed in the present paper regardingthe topographical distribution of thresholds within theAC of P. discolor. FRAs of units were classified as V-shaped,circumscribed, double-tuned or complex followingroughly the categories used by Heil and Irvine [79] andSutter [80]. The spike rate of units with circumscribedFRAs decreased at all frequencies to zero with increasingstimulus level. Double tuned units had FRAs that showedtwo clearly separable response regions, whereas complexFRAs consisted of multiple activity patches separated byregions of low activity. Cortical units classified as V-shaped responded over a contiguous range of frequencylevel combinations. V-shaped and double tuned FRAswere further distinguished according to their spike ratelevel function as monotonic or non-monotonic. The unitwas labeled as non-monotonic if the spike-rate decreasedagain to below 75 % of the maximum at BF at higher lev-els. Thus, units with circumscribed FRAs always featurednon-monotonic spike-rate-level functions by definition.Q10dB values as a measure of sharpness of frequency tun-ing were calculated using the following equation: Q10dB =BF/bandwidth measured 10 dB SPL above threshold.Double tuned and complex units did not generally allowdetermining a Q10dB value. If the shape of FRAs allowed,Q30dB values were also measured.
To determine a unit's binaural properties, the meannumber of spikes was plotted as a function of IID for bin-aural, monaural contralateral and monaural ipsilateralstimulation. Comparison of these curves allowed thegrouping of the binaural properties into four categories.Units that were excited by monaural stimulation of eachear were named EE (excitatory-excitatory). Units that onlyreceived excitatory input from the contralateral ear arenamed E0 (excitatory input only from the contralateralear). In case the unit was excited by monaural contralat-eral stimulation, did not respond to monaural ipsilateralstimulation and showed inhibition in binaural stimula-tion, it was classified as EI (excitatory-inhibitory). The lastgroup ("other") contained units that could not be rankedinto one of the previous groups.
The locations of recording sites were projected to the flat-tened surface of the auditory cortex. For a detailed descrip-tion of the surface projection method, see [81]. Briefly,each recording site was projected to the location at thecortical surface that had the shortest distance to therecording site. For the flattening process, the distance ofthe projected recording site to the origin fixed at 2000 m
BMC Neuroscience 2008, 9:65 http://www.biomedcentral.com/1471-2202/9/65
Page 16 of 17(page number not for citation purposes)
lateral from the midline of the brain (upper blue line inFig. 1B) was calculated. Thus, distortions due to irregular-ity of the cortical surface (e.g. pseudocentral sulcus) wereavoided.
Distribution and trends of parameters on the cortical sur-face are represented with the help of the Voronoi tessella-tion procedure in two dimensions implemented withMatlab®. In detail, recording sites of the chosen parameterare connected with all neighboring recording sites. Cellscharacterizing the value of a special parameter aroundrecording sites are constructed as polygons whose sidespass equidistantly between recording sites and cross theconnection lines perpendicularly.
Authors' contributionsSH, UF, GS and BS performed the electrophysiologicalexperiments. SR–S performed the histological and neuro-anatomical procedures. SH, UF and SR–S analyzed thedata. SH, UF, SR–S and GS wrote the paper.
AcknowledgementsWe thank Claudia Schulte and Horst König for their technical help. Special thanks go to Tom Fenzl and Andreas Nixdorf for providing additional ana-tomical material and for help with the preparation of the Phyllostomus brain atlas. We also thank three anonymous reviewers whose comments helped to improve the manuscript. This work was supported by the Volkswagen Foundation (I/79782) and the Deutsche Forschungsgemeinschaft GRK 1091 "Orientation and Motion in Space".
References1. Esser KH, Lud B: Discrimination of sinusoidally frequency-
modulated sound signals mimicking species-specific commu-nication calls in the FM-bat Phyllostomus discolor. J Comp Phys-iol [A] 1997, 180:513-522.
2. Grunwald JE, Schörnich S, Wiegrebe L: Classification of naturaltextures in echolocation. Proc Natl Acad Sci USA 2004,101:5670-5674.
3. Fenzl , Thomas , Schuller , Gerd : Echolocation calls and commu-nication calls are controlled differentially in the brainstem ofthe bat Phyllostomus discolor. BMC Biol 2005, 3:17.
4. Firzlaff U, Schuller G: Cortical responses to object size-depend-ent spectral interference patterns in echolocating bats. Eur JNeurosci 2007, 26:2747-2755.
5. Esser KH, Schmidt U: Behavioral auditory thresholds inneonate lesser spear-nosed bats, Phyllostomus discolor. Natur-wissenschaften 1990, 77:292-294.
6. Hackel P, Esser KH: Classification of single units in the high-fre-quency fields of the Carollia auditory cortex. Göttingen Neuro-biology Report 1998. Proceedings of the 26th Göttingen NeurobiologyConference. Stuttgart :328.
7. Firzlaff U, Schörnich S, Hoffmann S, Schuller G, Wiegrebe L: A neuralcorrelate of stochastic echo imaging. J Neurosci 2006,26:785-791.
8. Firzlaff U, Schuchmann M, Grunwald JE, Schuller G, Wiegrebe L:Object-oriented echo perception and cortical representa-tion in echolocating bats. PLoS Biol 5(5):e100.
9. Clarey JC, Barone P, Imig TJ: Physiology of thalamus and cortex.In The Mammalian Auditory Pathway: Neurophysiology. Springer Hand-book of Auditory Research Edited by: Popper AN, Fay RR. Berlin:Springer-Verlag; 1992:232-334.
10. Ehret G: The auditory cortex. J Comp Physiol [A] 1997,181:547-557.
11. Fitzpatrick DC, Suga N, Olsen JF: Distribution of response typesacross entire hemispheres of the mustached bat's auditorycortex. J Comp Neurol 1998, 391:353-365.
12. O'Neill WE, Suga N: Encoding of target range and its represen-tation in the auditory cortex of the mustached bat. J Neurosci1982, 2:17-31.
13. Radtke-Schuller S, Schuller G: Auditory cortex of the rufoushorseshoe bat. 1. Physiological response properties to acous-tic stimuli and vocalizations and the topographical distribu-tion of neurons. Eur J Neurosci 1995, 7:570-591.
14. Ostwald J: Tonotopical organization and pure tone responsecharacteristics of single units in the auditory cortex of thegreater horseshoe bat. J Comp Physiol [A] 1984, 155:821-834.
15. Dear SP, Fritz J, Haresign T, Ferragamo M, Simmons JA: Tonotopicand functional organization in the auditory cortex of the bigbrown bat, Eptesicus fuscus. J Neurophysiol 1993, 70:1988-2009.
16. Jen PHS, Chen QC, Wu FJ: Interaction between excitation andinhibition affects frequency tuning curve, response size andlatency of neurons in the auditory cortex of the big brownbat, Eptesicus fuscus. Hear Res 2003, 174:281-289.
17. O'Neill WE: The bat auditory cortex. In Hearing by Bats Edited by:Popper AN, Fay RR. New York: Springer-Verlag; 1995:416.
18. Suga N, Jen PHS: Disproportionate tonotopic representationfor processing CF-FM sonar signals in the mustache bat audi-tory cortex. Science 1976, 194:542-544.
19. Wong D, Shannon SL: Functional zones in the auditory cortexof the echolocating bat, Myotis lucifugus. Brain Res 1988,453:349-352.
20. Esser KH, Eiermann A: Tonotopic organization and parcellationof auditory cortex in the FM-bat Carollia perspicillata. Eur JNeurosci 1999, 11:3669-3682.
21. Esser KH: Auditory processing in the FM-bat Phyllostomus dis-color. From behavior to neocortical maps. In 23rd GöttingenNeurobiology Conference, Learning and Memory, I Edited by: Elsner N,Menzel R. New York: Thieme; 1995:193.
22. McDaniel VR: Brain anatomy. In Biology of Bats of the New WorldFamily Phyllostomattidae, Part I Edited by: Baker RJ, Jones JK, CarterDC. Lubbock: Texas Tech Press; 1976:147-199.
23. Jen PHS, Sun X, Lin PJJ: Frequency and space representation inthe primary auditory cortex of the frequency modulating batEptesicus fuscus. J Comp Physiol [A] 1989, 165:1-14.
24. Ross LS, Pollak GD, Zook JM: Origin of ascending projections toan isofrequency region of the mustache bat's inferior collic-ulus. J Comp Neurol 1988, 270:488-505.
25. Schuller G, Pollak G: Disproportionate frequency representa-tion in the inferior colliculus of Doppler-compensatinggreater horseshoe bats: Evidence for an acoustic fovea. JComp Physiol [A] 1979, 132:47-54.
26. Zook JM, Winer JA, Pollak GD, Bodenhamer RD: Topology of thecentral nucleus of the mustache bat's inferior colliculus. JComp Neurol 1985, 231:530-546.
27. Rübsamen R, Neuweiler G, Sripathi K: Comparative colliculartonotopy in two bat species adapted to movement detec-tion, Hipposideros speoris and Megaderma lyra. J Comp Physiol[A] 1988, 163:271-285.
28. Metzner W, Radtke-Schuller S: The nuclei of the lateral lemnis-cus in the rufous horseshoe bat, Rhinolophus rouxi. J CompPhysiol [A] 1987, 160:395-411.
29. Reimer K: Auditory properties of the superior colliculus in thehorseshoe bat, Rhinolophus rouxi. J Comp Physiol [A]169:719-728.
30. Kössl M, Vater M: The cochlear frequency map of the mus-tache bat, Pteronotus parnellii. J Comp Physiol [A] 1985,157:687-697.
31. Kössl M: Otoacoustic emissions from the cochlea of the 'con-stant frequency' bats, Pteronotus parnellii and Rhinolophusrouxi. Hear Res 1994, 72:59-72.
32. Vater M, Feng AS, Betz M: An HRP-study of the frequency-placemap of the horseshoe bat cochlea: morphological correlatesof the sharp tuning to a narrow frequency band. J Comp Physiol[A] 1985, 157:671-686.
33. Suga N, Horikawa J: Multiple time axes for representation ofecho delays in the auditory cortex. J Neurophysiol 1986,55:776-805.
34. Paschal WG, Wong D: Frequency organization of delay-sensi-tive neurons in the auditory cortex of the FM bat Myotis luci-fugus. J Neurophysiol 1994, 72:366-379.
BMC Neuroscience 2008, 9:65 http://www.biomedcentral.com/1471-2202/9/65
Page 17 of 17(page number not for citation purposes)
35. Haplea S, Covey E, Casseday JH: Frequency tuning and responselatencies at three levels in the brainstem of the echolocatingbat Eptesicus fuscus. J Comp Physiol [A] 174:671-683.
36. Klug A, Khan A, Burger RM, Bauer EE, Hurley LM, Yang L, Grothe B,Halvorsen MB, Park TJ: Latency as a function of intensity inauditory neurons: influences of central processing. Hear Res2000, 148:107-123.
37. Sullivan WE: Neural representation of target distance in audi-tory cortex of the echolocating bat Myotis lucifugus. J Neuro-physiol 1982, 48:1011-1032.
38. Mendelson JR, Schreiner CE, Sutter ML: Functional topography ofcat primary auditory cortex: response latencies. J Comp Physiol[A] 1997, 181:615-633.
39. Radtke-Schuller S: Cytoarchitecture of the medial geniculatebody and thalamic projections to the auditory cortex in therufous horseshoe bat (Rhinolophus rouxi). I. Temporal fields.Anat Embryol (Berl) 2004, 209:59-76.
40. Fitzpatrick DC, Olsen JF, Suga N: Connections among functionalareas in the mustached bat auditory cortex. J Comp Neurol1998, 391:366-396.
41. Radtke-Schuller S, Schuller G, O'Neill WE: Thalamic projectionsto the auditory cortex in the rufous horseshoe bat (Rhinolo-phus rouxi). II. Dorsal fields. Anat Embryol (Berl) 2004, 209:77-91.
42. Gaese BH, Ostwald J: Anesthesia changes frequency tuning ofneurons in the rat primary auditory cortex. J Neurophysiol2001, 86:1062-1066.
43. Horikawa J, Tanahashi A, Suga N: After-discharges in the audi-tory cortex of the mustached bat: No oscillatory dischargesfor binding auditory information. Hear Res 1994, 76:45-52.
44. Seshagiri CV, Delgutte B: Response properties of neighboringneurons in the auditory midbrain for pure-tone stimulation:a tetrode study. J Neurophysiol 2007, 98:2058-2073.
45. Winer JA, Miller LM, Lee CC, Schreiner CE: Auditory thalamocor-tical transformation: structure and function. Trends Neurosci2005, 28:255-263.
46. Pearson JM, Crocker WD, Fitzpatrick DC: Connections of func-tional areas in the mustached bat's auditory cortex with theauditory thalamus. J Comp Neurol 2007, 500:401-418.
47. Razak KA, Shen W, Zumsteg T, Fuzessery ZM: Parallel thalamo-cortical pathways for echolocation and passive sound locali-zation in a gleaning bat, Antrozous pallidus. J Comp Neurol 2007,500:322-338.
48. Razak KA, Fuzessery ZM: Functional organization of the pallidbat auditory cortex: emphasis on binaural organization. JNeurophysiol 2002, 87:72-86.
49. Haug FM: Heavy metals in the brain. A light microscope studyof the rat with Timm's sulphide silver method. Methodolog-ical considerations and cytological and regional staining pat-terns. Adv Anat Embryol Cell Biol 1973, 47:71.
50. Zilles K, Wree A, Dausch ND: Anatomy of the neocortex: neu-rochemical organization. In The Cerebral Cortex of the Rat Editedby: Kolb B, Tees RC. Cambridge (MA): The MIT Press; 1990:113.
51. Perez-Clausell J: Distribution of terminal fields stained for zincin the neocortex of the rat. J Chem Neuroanat 1996, 11:99-111.
52. Garrett B, Geneser FA, Slomianka L: Distribution of acetylcho-linesterase and zinc in the visual cortex of the mouse. AnatEmbryol (Berl) 1991, 184:461-468.
53. Dyck R, Beaulieu C, Cynader M: Histochemical localization ofsynaptic zinc in the developing cat visual cortex. J Comp Neurol1993, 329:53-67.
54. Garrett B, Osterballe R, Slomianka L, Geneser FA: Cytoarchitec-ture and staining for acetylcholinesterase and zinc in the vis-ual cortex of the Parma wallaby (Macropus parma). BrainBehav Evol 1994, 43:162-172.
55. Franco-Pons N, Casanovas-Aguilar C, Arroyo S, Rumia J, Perez-Clausell J, Danscher G: Zinc-rich synaptic boutons in humantemporal cortex biopsies. Neuroscience 2000, 98:429-435.
56. Krubitzer LA, Calford MB, Schmid LM: Connections of somato-sensory cortex in megachiropteran bats: The evolution ofcortical fields in mammals. J Comp Neurol 1993, 327:473-506.
57. Krubitzer LA, Sesma MA, Kaas JH: Microelectrode maps mye-loarchitecture and cortical connections of three somatotop-ically organized representations of the body surface in theparietal cortex of squirrels. J Comp Neurol 1986, 250:403-430.
58. Carvell GE, Simons DJ: Thalamic and corticocortical connec-tions of the second somatic sensory area of the mouse. JComp Neurol 1987, 265(3):409-27.
59. Clemo HR, Stein BE: Organization of a fourth somatosensoryarea of cortex in cat. J Neurophysiol 1983, 50:910-925.
60. Brett-Green B, Fifkova E, Larue DT, Winer JA, Barth DS: A multi-sensory zone in rat parietotemporal cortex: intra- and extra-cellular physiology and thalamocortical connections. J CompNeurol 2003, 460:223-237.
61. Reale RA, Imig TJ: Tonotopic organization in auditory cortex ofthe cat. J Comp Neurol 1980, 192:265-291.
62. Bizley JK, Nodal FR, Nelken I, King AJ: Functional organization offerret auditory cortex. Cereb Cortex 2005, 15:1637-1653.
63. Thomas H, Tillein J, Heil P, Scheich H: Functional organization ofauditory cortex in the Mongolian gerbil (Meriones unguicula-tus). 1. Electrophysiological mapping of frequency represen-tation and distinction of fields. Eur J Neurosci 1993, 5:882-897.
64. Schuller G, Radtke-Schuller S, Betz M: A stereotaxic method forsmall animals using experimentally determined referenceprofiles. J Neurosci Methods 1986, 18:339-350.
65. Gallyas F: Silver staining of myelin by means of physical devel-opment. Neurol Res 1979, 1:203-209.
66. Danscher G: Histochemical demonstration of heavy metals. Arevised version of the sulphide silver method suitable forboth light and electronmicroscopy. Histochemistry 1981,71:1-16.
67. Vallee BL, Falchuk KH: The biochemical basis of zinc physiology.Physiol Rev 1993, 73:79-118.
68. Frederickson CJ, Moncrieff DW: Zinc-containing neurons. BiolSignals 1994, 3:127-139.
69. Frederickson CJ: Neurobiology of zinc and zinc-containingneurons. Int Rev Neurobiol 1989, 31:145-238.
70. Wallace MN, Kitzes LM, Jones EG: Chemoarchitectonic organi-zation of the cat primary auditory cortex. Exp Brain Res 1991,86:518-526.
71. Hackett TA, Preuss TM, Kaas JH: Architectonic identification ofthe core region in auditory cortex of macaques, chimpan-zees, and humans. J Comp Neurol 2001, 441:197-222.
72. Clarke S, Rivier F: Compartments within human primary audi-tory cortex: Evidence from cytochrome oxidase and acetyl-cholinesterase staining. Eur J Neurosci 1998, 10(2):741-745.
73. Hackett TA, Stepniewska I, Kaas JH: Subdivisions of auditory cor-tex and ipsilateral cortical connections of the parabelt audi-tory cortex in macaque monkeys. J Comp Neurol 1998,394:475-495.
74. Cruikshank SJ, Killackey HP, Metherate R: Parvalbumin and calbi-ndin are differentially distributed within primary and sec-ondary subregions of the mouse auditory forebrain.Neuroscience 2001, 105:553-569.
75. Schuller G: A cheap earphone for small animals with good fre-quency response in the ultrasonic frequency range. J NeurosciMethods 1997, 71:187-190.
76. Esser KH, Daucher A: Hearing in the FM-bat Phyllostomus dis-color : A behavioral audiogram. J Comp Physiol [A] 1996,178:779-785.
77. Irvine DR, Rajan R, Aitkin LM: Sensitivity to interaural intensitydifferences of neurons in primary auditory cortex of the cat.I. types of sensitivity and effects of variations in sound pres-sure level. J Neurophysiol 1996, 75:75-96.
78. Hoffmann S, Baier L, Borina F, Schuller G, Wiegrebe L, Firzlaff U: Psy-chophysical and neurophysiological hearing thresholds in thebat Phyllostomus discolor. J Comp Physiol A Neuroethol Sens NeuralBehav Physiol 2008, 194(1):39-47.
79. Heil P, Irvine DR: The posterior field P of cat auditory cortex:coding of envelope transients. Cereb Cortex 1998, 8:125-141.
80. Sutter ML: Shapes and level tolerances of frequency tuningcurves in primary auditory cortex: quantitative measuresand population codes. J Neurophysiol 2000, 84:1012-1025.
81. Schuller G, O'Neill WE, Radtke-Schuller S: Facilitation and delaysensitivity of auditory cortex neurons in CF-FM bats, Rhinol-ophus rouxi and Pteronotus p. parnellii. Eur J Neurosci 1991,3:1165-1181.