the attitude and technology resistance towards …
TRANSCRIPT

THE ATTITUDE AND TECHNOLOGY RESISTANCE TOWARDS
AUTONOMOUS VEHICLE ACCEPTANCE IN THAILAND
THICHACHOM MAKANUPUK
A THEMATIC PAPER SUBMITTED IN PARTIAL
FULFILLMENT OF THE REQUIREMENTS FOR
THE DEGREE OF MASTER OF MANAGEMENT
COLLEGE OF MANAGEMENT
MAHIDOL UNIVERSITY
2020
COPYRIGHT OF MAHIDOL UNIVERSITY

Thematic paper
entitled
THE ATTITUDE AND TECHNOLOGY RESISTANCE TOWARDS
AUTONOMOUS VEHICLE ACCEPTANCE IN THAILAND
was submitted to the College of Management, Mahidol University
for the degree of Master of Management
on
August 29, 2020
..............................................................
Ms. Thichachom Makanupuk
Candidate
.............................................................. ..............................................................
Assoc. Prof. Nathasit Gerdsri, Assoc. Prof. Randall Shannon,
Ph.D. Ph.D.
Advisor Chairperson
.............................................................. ..............................................................
Asst. Prof. Duangporn Arbhasil, Sarinya Laisawat Suttharattanagul,
Ph.D. Ph.D.
Dean Committee member
College of Management
Mahidol University

ACKNOWLEDGEMENTS
This research cannot be successful without the encouragement, cooperation,
and guidance of several individuals. Their support during the research is extra valuable.
I would like to express great appreciation to my advisor, Assoc. Prof.
Nathasit Gerdsri, for insightful experiences and encouragement toward the thematic
paper. His advice is a major part of this research and it would not be successful without
him.
I would like to thank College of Management Mahidol University for
providing various resources and equipment that need to use during the research.
Finally, I would like to express my profound gratitude to my parents and my
friends who always their supporting, giving suggestion and encouraging me.
Thichachom Makanupuk
iv
CONTENTS
Page
ACKNOWLEDGEMENTS ii
ABSTRACT iii
LIST OF TABLES vii
LIST OF FIGURES viii
CHAPTER I INTRODUCTION 1
1.1 Background 1
1.2 Problem Statement 2
1.3 Research Question 4
1.4 Research Objective 5
1.5 Research Scope 5
CHAPTER II LITERATURE REVIEW 6
2.1 Autonomous Vehicle 6
2.2 Autonomous Truck (Driverless Truck or Auto-Driving Truck) 7
2.2.1 Perceived Usefulness 7
2.2.2 Perceived Ease of Use 9
2.2.3 Trust 9
2.2.4 Social Influence 10
2.2.5 Attitude 10
2.2.6 Perceived Risk 10
2.2.7 Resistance to Change 11
2.2.8 Autonomous Truck Acceptance 13
2.3 Existing Reference Framework 13
2.3.1 TAM Model 13
2.3.2 Extended from TAM Model 14
CHAPTER III RESEARCH METHODOLOGY 15
3.1 Data Source 15
3.1.1 Target Population 15
v
CONTENTS (cont.)
Page
3.1.2 Sampling Method 15
3.1.3 Sample Size 15
3.2 Data Collection 16
3.2.1 Sample Survey Research 16
3.2.3 Preparation for the survey 16
3.3 Data Measurement 16
3.4 Data Analysis 20
CHAPTER IV RESEARCH FINDING AND ANALYSIS 21
4.1 Frequency Distribution 21
4.2 Descriptive Statistic 24
4.3 Reliability Analysis 24
4.4 Cross tabulation and interpretation 25
4.4.1 The relationship between autonomous vehicle
acceptance (APA) and gender 25
4.4.2 The relationship between autonomous vehicle
acceptance (APA) and media channel 27
4.5 Path Analysis 29
4.5.1 Test of the proposed model 29
4.6 Correlation Coefficients with Spearman method 30
4.7 Covariance structure (Path Analysis) 31
4.7.1 Standardized Estimates 32
4.7.2 Descriptive Statistic and Correlation Matrix 33
4.7.3 Standardized Direct Effects and interpretation 35
4.7.4 Standardized Indirect Effects and interpretation 35
4.7.5 Standardized Total Effects and interpretation 36
CHAPTER V CONCLUSION AND RECOMMENDATION 37
5.1 Discussion of research finding 37
5.2 Limitation and Suggestions 38
vi
CONTENTS (cont.)
Page
5.2.1 Scope of Study 38
5.2.2 Population and demographic profile of the respondent 38
5.2.3 Implication for future research project 38
5.3 Recommendation 39
5.3.1 Recommendation for Attitude 39
5.3.2 Recommendation for Resistance to Change 39
5.4 Conclusion 40
REFERENCES 41
APPENDICES 43
Appendix A: Quantitative Questionnaire Items 44
BIOGRAPHY 49

viii
LIST OF FIGURES
Figure Page
1.1 Using 5G networks to connect with everything 1
1.2 Reason for bad working conditions among truck drivers across India 3
1.3 The increasing number of truck drivers from the year 2012 to the year 2026 3
1.4 Share of the population older than 65 in Thailand from 2015 to 2055 4
2.1 Technology Acceptance Model (TAM) developed by Davis (1989) 14
2.2 Extended model from Technology Acceptance Model (TAM) 14
3.1 Example of questionnaire format 17
4.1 Genders 22
4.2 Age 22
4.3 Education 23
4.4 Income 23
4.5 Media Channel 23
4.6 The correlation weight (Extended conceptual model from TAM) 29
4.7 The result of estimate standardized regression weight 31

vii
LIST OF TABLES
Table Page
3.1 Data Scale and Measured Technique on Each variable in Part A 18
3.2 Data Scale and Measured Technique on Each variable in Part B 20
4.1 Descriptive Statistics 24
4.2 Reliability statistic 25
4.3 Crosstabulation on gender and AVA, Question 1 25
4.4 Crosstabulation on gender and AVA, Question 2 26
4.5 Crosstabulation on gender and AVA, Question 3 26
4.6 Crosstabulation on gender and AVA, Question 4 27
4.7 Crosstabulation on Media channel and AVA 28
4.8 Correlation coefficient with Spearman method 30
4.9 Measure of model fit 31
4.10 Standardized Regression Weights 32
4.11 Unstandardized Regression Weights 33
4.12 Estimates of covariances among exogenous variables. 33
4.13 Descriptive statistic and correlation matrix 34
4.14 Standardized Direct Effects 35
4.15 Standardized Indirect Effects 35
4.16 Standardized Total Effects 36

1
CHAPTER I
INTRODUCTION
1.1 Background Evolution in technological brings intelligent connectivity combination of
the 5G, artificial intelligence (AI), and Internet of Things (IoT), to escalate technological
development and enable new digital services. Before handling the user to fulfill the
interaction between people and the surrounding environment, it uses to collect the digital
information to make up IoT by using devices, machines, and sensors and analyzed and
contextualized by AI technologies (Pasqua, 2019).
As the world never stop developing, 5G represent the missing pieces to bring
the new level of technologies and enable the intelligent connectivity vision. New
transformational capability may impact on the way of living, society, and industry
sector. As 5G unified connectivity can be link with many things such as vehicle-to-
network, vehicle-to-vehicle, vehicle-to-pedestrian, and vehicle-to-infrastructure. The
major role that intelligent connectivity wants to focus on which are industrial and
manufacturing operations, healthcare, public safety, and other sectors especially for
transportation and logistics.
Figure 1.1 Using 5G networks to connect with everything (Source: Qualcomm)
2
The major role that intelligent connectivity wants to focus on which are
industrial and manufacturing operations, healthcare, public safety, and other sectors
especially for transportation and logistics.
An autonomous vehicle is one of the products from these combinations that
bring many advantages to the user such as reduced emission, decreased number of road
injuries, and less traffic. As this technology becomes more realistic, there are many truck
companies interesting and trying to invent and develop their product to go along with
the world evolution such as Volvo, Scania, Daimler, and Tesla. Moreover, some truck
companies especially Daimler have tested their product as they get approval to drive on
the public roads in Nevada, The United States.
They claim that autonomous truck can reduce:
• The burden of long-haul trucks causes the fatigue of drivers.
• The Congestion, maintenance costs, emission vehicle downtime, and fuel
consumption by four to seven percent.
• May change insurance policy and its rate
• Reduce poor infrastructure or human fallibility.
1.2 Problem Statement From Heinrich’s triangle theory about explaining the majority reason for
occurring the accident that came from fatigue, uses a mobile phone, eating and look
something at the back seat. If there are 2 million drivers doing this activity while driving,
it leads 240,000 of near misses, 20,000 of minor injuries, 400 lost times injuries, and 1
fatality (Songsakul, 2018).
This graph showing the reasons for bad working conditions among truck
drivers in India and I believe that it also occurs in Thailand and it may lead to the
shortage of truck drivers for over the world.

3
Figure 1.2 Reason for bad working conditions among truck drivers across India
as of February 2020
According to the ATA record from the year 2017 that shows the increasing
number of shortages in the truck drivers. They explained that the shortage of truck
drivers is not only happening because of the turnover but it can happen by demographic
(age and gender), lifestyle, more job alternatives, and regulation.
Figure 1.3 The increasing number of truck drivers from the year 2012 to the year
2026 (Source: American Trucking Association)
4
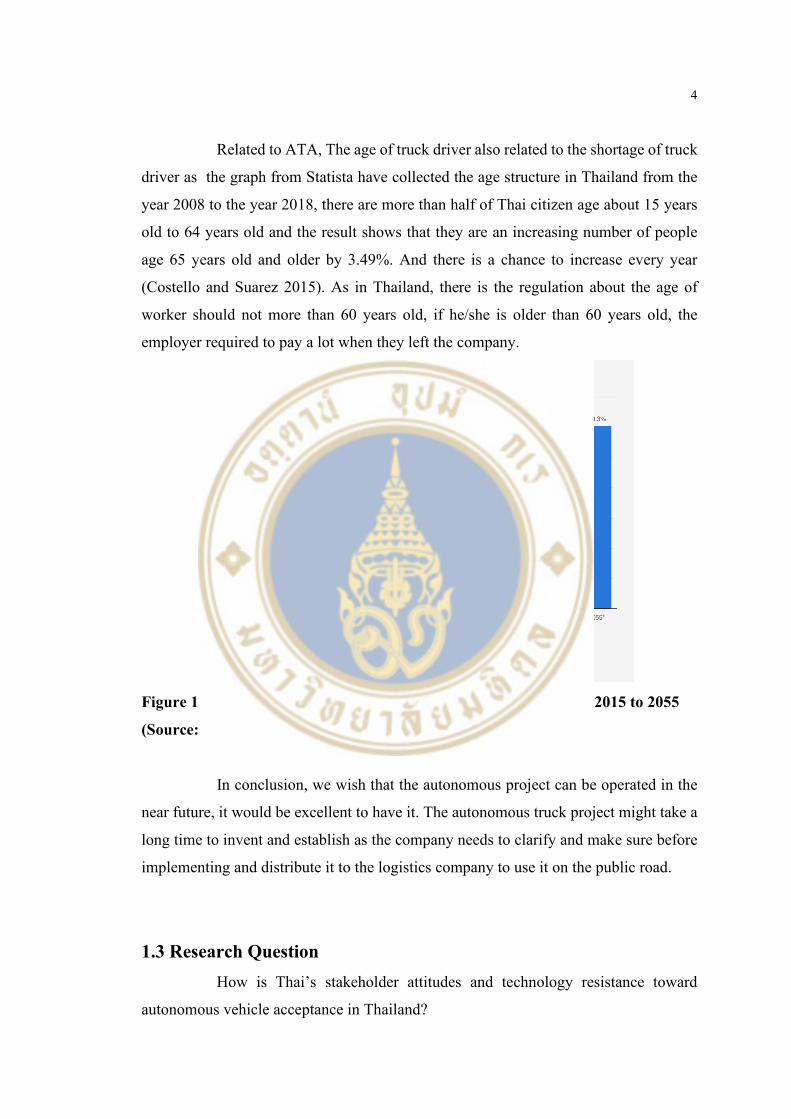
Related to ATA, The age of truck driver also related to the shortage of truck
driver as the graph from Statista have collected the age structure in Thailand from the
year 2008 to the year 2018, there are more than half of Thai citizen age about 15 years
old to 64 years old and the result shows that they are an increasing number of people
age 65 years old and older by 3.49%. And there is a chance to increase every year
(Costello and Suarez 2015). As in Thailand, there is the regulation about the age of
worker should not more than 60 years old, if he/she is older than 60 years old, the
employer required to pay a lot when they left the company.
Figure 1.4 Share of the population older than 65 in Thailand from 2015 to 2055
(Source: Statista)
In conclusion, we wish that the autonomous project can be operated in the
near future, it would be excellent to have it. The autonomous truck project might take a
long time to invent and establish as the company needs to clarify and make sure before
implementing and distribute it to the logistics company to use it on the public road.
1.3 Research Question How is Thai’s stakeholder attitudes and technology resistance toward
autonomous vehicle acceptance in Thailand?
5
1.4 Research Objective
• To study the stakeholder’s attitude toward autonomous vehicle technology
• To observe how much chance of acceptance to use the autonomous truck
in Thailand
• To study the concern problem of stakeholder toward autonomous vehicle
technology
1.5 Research Scope The research will be focused on all stakeholder that have an impact on the
evolution of autonomous trucks who use the public road in Thailand which I plan to
collect the data from all gender, age, and society level. Since technology has been
developed, intelligent connectivity is booming, and the increasing number of shortages
in truck drivers, it will be beneficial for all citizens and the environment.

6
CHAPTER II
LITERATURE REVIEW
After the U.S. Defense Advance Research Project Administration (DARPA)
has created a contest about developing Autonomous cars (Fagnant and Kockelman
2015).
People are dreaming of a car that does not require a driver or we know as
Autonomous vehicles (AV), driverless cars, or self-driving cars. So, it spread to the
truck dealer to adopt this technology with their products. The National Highway Traffic
Safety Administration (NHTSA) categorized AV into five levels which each level has
a different context(Anderson, Kalra et al. 2016).
• Level 0: The human driver is in complete control of all functions of the
car.
• Level 1: One function is automated.
• Level 2: More than one function is automated at the same time (e.g.,
steering and acceleration), but the driver must remain constantly attentive.
• Level 3: The driving functions are sufficiently automatic that the driver
can safely engage in other activities.
• Level 4: The car can drive itself without a human driver.
2.1 Autonomous Vehicle Automated vehicles (AVs) refer to the vehicle that is able to sense its
navigating and environment without human control (Zhang, Tao et al. 2019). The
solution for reducing accidents is to eliminate human action from driving such as
autonomous vehicles which are fully automation passenger vehicles. These autonomous
vehicles which also referred to “self-driving” vehicles or “driverless” vehicles.
Autonomous trucks will operate without human interference, utilizing based on the
computer system to detect and gather information of the surrounding environment,

7
identify aisle and risks, as well as control functions such as the speed and drive to
navigate the vehicle. Even though the autonomous vehicle is invented but it does not
completely remove the human action from driving; they need to develop the algorithm
and write the code to control the system. Thus, there is still a human error in an accident,
but it has the potential to become lower (Hulse, Xie et al. 2018). In 2013, the
Autonomous vehicle was tested and examined to the technical aspect and feasibility of
AVs and the impacts on congestion and safety (Haboucha, Ishaq et al. 2017).
2.2 Autonomous Truck (Driverless truck or Auto-Driving Truck) Automated vehicles (AVs) refer to vehicles that are capable of sensing its
environment and navigating without human input. As the intelligent connectivity which
included 5G network, Internet of Things and artificial intelligence, and machine control
so the autonomous vehicle is becoming interested in many business sectors. There is a
lot of money by funding from the industry, academia and government to support an
autonomous vehicle project and they also give manpower for it. There are many positive
effects of autonomous trucks as they can save fuel consumption, decrease in release
emission and decrease traffic consumption (Song, Chen et al. 2019).
2.2.1 Perceived Usefulness
In Technology Acceptance Model which have perceived usefulness and
perceived ease of use are the two external variables that mostly contribute acceptance
in technology. Davis (1989) has described Perceived usefulness as the rate to which
people believe in using the system would complement his or her job conduct. As the
definition, Perceived usefulness, it is really close to performance expectancy in UTAUR
and it also describes how the system is able to use advantageously (Xu, Zhang et al.
2018).
2.2.1.1 Safety
Autonomous vehicles have a possibility to definitely decrease
crashes that happen from some combination of distraction, alcohol, drug involvement
and/or fatigue. At least 40% of fatal crash-rate reduction by using self-driven vehicles
and it will not make errors as human failings. Automated malfunction can minimize the
8
levels of long-distance, poor weather driving and nighttime driving. Automated
malfunction does not reflect on crashes due to aggressive driving, speeding,
inexperienced, slow reaction times, inattention, over-compensation and other assorted
driver ship comings. Over 90%, the drivers believe their own reason and sense, so it is
the cause of the crash. Even though there are critical reasons behind the crash as to the
roadway, environment or vehicle, also human factors such as distraction, inattention or
speeding are usually found to the crash occurrence and/or injury severity (Fagnant and
Kockelman 2015).
2.2.1.2 Congestion and traffic operations
To develop ways of Autonomous vehicle technology to reduce
the fuel consumption and traffic congestion. For example, Autonomous vehicles can
assume and predict vehicles of braking and accelerating decisions. This technology is
excellent as they provide a smoother braking system and the speed adjustment that the
driver should follow, so it is the main reason of reducing the fuel consumption, and
reduction in traffic problems (Fagnant and Kockelman 2015).
2.2.1.3 Travel-behavior impacts
There is a good signal of travel behavior due to the safety and
reduction of congestion on the road that occur by Autonomous vehicles. For example,
Autonomous vehicles can support young children, those who can’t drive, the elderly,
and the disability. As autonomous vehicles can do self-park so it may impact on the
parking pattern to be in less-expensive areas. Autonomous vehicle can serve and expand
multiple persons as it can share a car or a ride (Haboucha, Ishaq et al. 2017).
2.2.1.4 Freight transportation
Autonomous vehicles can impact freight transport both on and
off the road. As one example, they are a mining company which is named Rio Tinto.
They have 53 self-driving ore trucks and they drive about 2.4 million miles and carry
200 million tons (Rio Tinto, 2014). Also, the same technologies can contribute from
autonomous cars to the trucking industry as it can increase fuel economy and lower the
need for truck drivers. For transporting the worker still requires for load and unload the
cargo but they no need to drive for long-distance journeys. The technology may face
resistance from blue worker or labor groups, like teamsters and competing industries
such as freight that use railroad (Fagnant and Kockelman 2015).
9
2.2.1.5 Available time for truck drivers
Autonomous vehicles allow the drivers to have more free time
while driving as they no need to monitor the roadways. So, they can do other activities
such as sleeping, relaxing, eating or working while the truck is run (Fagnant and
Kockelman 2015).
2.2.2 Perceived Ease of Use
Perceived Ease of Use means the scope of people believe that it will not
require effort while they are using autonomous vehicles. Its relevance cannot change or
devalue in autonomous vehicle acceptance that autonomous vehicle’s operation is
entirely new experience which require a lot of effort to learning it (Zhang, Tao et al.
2019)
2.2.3 Trust
Trust can be defined as our intention to put ourselves in a position at risk
with technology, along with the positive expectations of the result or the positive traits
of future behavior. The definition above can be broken down into three compassion,
belief of capacity and completeness, with capacity meaning to have a know-how and
erudition to achieve the task; completeness meaning to keep the promise to complete
the mission; and compassion refer to this as an automatic vehicle issue, in this case, to
look after the interests of users. When the user has trustiness in an autonomous vehicle,
believe in its ability and the service provider that they can protect his/her information
from abuse and problems that may occur in the future. Users may find that "Reducing
in humanity" to lose "choice and control" when behind the wheel of the car that drives
by itself. Driverless car means the user will have dependence on car control that
monitors the vehicle's internal factors, including road driving, driving conditions, and
checking electrical signaling information together with the infrastructure or vehicle or
other vehicles in the vicinity or the government that may participate in supervision
activities (Kaur and Rampersad 2018).
10
2.2.4 Social Influence
Social Influence is the term which the perception of a person that is
important for him or her should believe to use the new system (Adnan, Md Nordin et al.
2018).
It is the perception of the public that will be related to the adoption of
autonomous vehicles. Moreover, autonomous vehicles will be vulnerable for road users
particularly for pedestrian and bicyclist and the perception of road users towards
autonomous vehicles. Also, there is a chance for autonomous vehicles to run on the road
or share the road with other users, so it needs to know the facts from the public about
their perception. To use autonomous vehicles is also related with the policies and
electing politicians that will allow the autonomous vehicles to share the road with other
users. To understand other perceptions, they should focus on public feeling, expectation,
prediction and belief towards autonomous vehicles (Penmetsa, Adanu et al. 2019).
2.2.5 Attitude
The attitude means an individual’s positive or negative feelings toward
using technology. Various studies have found that most consumers that have a positive
attitude toward technology tend to have higher intention to use it. By the way this factor
has been confirmed as it is the most stable one in the original of Technology Acceptance
Model (Zhang, Tao et al. 2019).
2.2.6 Perceived Risk
The perception of risk theory is used to describe consumer behavior.
Essentially research has examined the impact of risk on traditional consumer decisions.
Peter and Ryan (1976) defined the perceived risk as expected subjective loss and
Featherman and Pavlou (2003) determine the risk that is perceived as a potential loss
when taking the desired results. To determine Perceived Risk, Lee Ming-Chi (2019) has
separated into 6 types, performance risk, the possibility of product malfunctions and not
working as designed and advertised and therefore unable to deliver the desired benefits;
Social risk, loss of status that may occur in one of the social groups as a result of using
products or services that are foolish or useless; Financial risk, the possibility that a
purchase results in a loss of money including the consequent maintenance costs of the
11
product; Privacy risk, Losses that may arise from the control of personal information,
such as when information is used about you without your knowledge or permission.
Severe cases are where consumers are "falsified", meaning criminals use their identities
in counterfeit transactions; Time risk, consumers can waste time when making poor
purchase decisions by spending time researching and making purchases, learning how
to use products or services just to replace them if they do not meet expectations; and
Physical risk, the possibility that the product is purchased results in a hazard to human
life (Lee 2009).
It needs to be confirmed that it is safe for drivers, passengers and other road
users and reduction in traffic crashes that happen by humans has motivated the evolution
of autonomous vehicles. Safety is the main selling point of autonomous vehicles. But
for humans, autonomous vehicles are linked with risks, loss of control and uncertainty
as they cannot believe in technology. Driving is an activity that is requiring the most
safety to do this activity. Most of the users demand for safety more than self-drive. The
public think that self-driving vehicles should be four to five times as safe as human
driven vehicles. Its users cannot perceive enough safety from using autonomous
vehicles so they cannot expect to accept this technology and adopt autonomous vehicles.
Also, many people concern safety and security issues on autonomous vehicles which
lead the user to be unwilling to use autonomous vehicles (Xu, Zhang et al. 2018).
According to Menon et al. (2016), the majority of the public extremely about
36.5% or moderately about 52.6% have concerned with the safety of autonomous
vehicles and road users which about 7.1% did not concern at all. Most people are
worried about safety due to the system or equipment failure was the reason for people
unlikely to use the autonomous vehicles (Zhang, Tao et al. 2019).
From (Hudson, Orviska et al. 2019), most of the user’s concern on
equipment failure, deal with unexpected situations, legal liability, privacy issues and
system hacking. They also found that men are more willing to use this technology than
women.
2.2.7 Resistance to Change
According to (Bauer 2012), resistance is unsuitable to use in the new
technology context. Using this word most people think that it implies a managerial and

12
technocratic bias. By the way, he was confident that ‘resistance’ would prove unclear in
meaning and rich in meanings, especially in the European context. In this context, it
really challenges the idea of resistance and to revise the historical events, to revive the
ideas. In (Bauer 2012)’s view this may be achieved by analyzing the resistance in terms
of various results.
According to Lapointe Liette and Rivard Suzanne, 2005, there are five basic
components of resistance behaviors, subject, object, initial conditions and treats.
2.2.7.1 Resistance behavior
Behavior is the main dimension of resistance such as behavior,
responses and action found in almost all definitions. Anti-behavior exists throughout the
spectrum, does not cooperate patiently with participation in destructive behavior or from
lack of participation to wreck (Lapointe and Rivard 2005).
2.2.7.2 Object of resistance
The resistance verb is a transitive verb, which means that it must
use the object directly. Identifying and understanding this object is important because
resistance is shaped in part by "Contents of being opposites" (Lapointe and Rivard
2005).
2.2.7.3 Perceived Threats
Perceived Threats is identified by expressions such as
"Obsessive emotional pain" or "perception of dangerous situations". Users resist
changes that they believe will result in loss of stature, loss of income or loss of power
(Lapointe and Rivard 2005).
2.2.7.4 Initial conditions
Some authors emphasize the role of perpetrators of resistance.
They argue that resistance to understanding requires attention on the subject. Some
people or groups may accept the change, but others may reject it. In addition to the
ability or lack of awareness of threats, certain prerequisites, such as decentralization or
established routines, may influence how the perceived threat of an object is (Lapointe
and Rivard 2005).
2.2.7.5 Subject of resistance

13
The issue of opposition is an entity that uses resistance behavior
when studying resistance from a psychological point of view about being an individual
(Lapointe and Rivard 2005).
2.2.7.6 Resistance of Autonomous Vehicle
Kyriakidis et al. (2015) used an internet survey to analyze 5,000
responses to autonomous vehicles from 109 countries. This was a minor problem
because the answer was biased towards internet users who might not represent the
population as a whole. Respondents from developed countries feel uncomfortable with
transmission of information from vehicles (Hudson, Orviska et al. 2019).
2.2.8 Autonomous Truck Acceptance
Acceptance is "a condition to allow new automotive technology to achieve
the expected level of benefits." This definition means that acceptance is necessary for
the introduction of new technology in transportation systems. Adell et al. (2014) also
consider acceptance of the driver in the vehicle's interior system: "The level that each
person integrates with his / her driving system or if the system is not available, intends
to use it". Although the acceptance is determined in different ways, the general
understanding is that it is a multi-faceted concept. Researchers usually focus on one-
sided acceptance. Human behavior and various theories about the acceptance of
technology proposed to explain user acceptance including the Unified Theory of
Acceptance and Use of Technology (UTAUT), UTAUT2, Technology Acceptance
Model (TAM) and Theory of Planned Behavior (TPB) (Xu, Zhang et al. 2018).
2.3 Exiting Reference Framework
2.3.1 TAM Model
While perceived usefulness is correlated with utility values from system
usage and can be set to the level that a person believes that the use of certain technologies
will increase his / her performance. Perceived Easy to use refers to the level that
individuals believe that using specific technology will not require effort. Both of these
variables have an effect on attitude and behavioral intention. Attitude refers to the

14
evaluation of technology users while behavioral intentions indicate the level at which
users are willing to perform certain behaviors (Pantano 2012)
TAM has been extended with multiple acceptance factors for the
development of outstanding models that can better predict user behavior in various
applications (Pantano 2012).
Figure 2.1 Technology Acceptance Model (TAM) developed by Davis (1989)
2.3.2 Extended from TAM
Figure 2.2 Extended model from Technology Acceptance Model (TAM)
15
CHAPTER III
RESEARCH METHODOLOGY
This chapter discusses the research methodology, which can be divided into
four main topics, data source, data collection, data measurement, and data analysis.
First, the source of data discussed the target population of the research, sampling method
and sample size. Second, the data collection discusses the procedure to collect from the
questionnaire are quantitative. Third, the techniques to measure data collected from the
questionnaire are discussed. Finally, the data analysis statistical technique used in this
research.
3.1 Data Source
3.1.1 Target Population
The research is done in Thailand since “autonomous trucks have the
potential to be used in all parts of Thailand even the head branch is located in Bangkok
and metropolitan areas”. Therefore, the population in this research is various as they
have an impact on autonomous truck acceptance.
3.1.2 Sampling Method
The research uses simple random sampling, which is one method of
probability sampling method. “Simple Random Sampling (SRS) is one type of sampling
that is often used as a sampling technique”. For SRS principle, the sample has the same
probability to be chosen but it may be across sampling design (Meng 2013).
3.1.3 Sample Size
According to a well-known researcher named Kline (1998), an acceptance
of sample size should always be 10 times the amount of the parameters in Path analysis.
16
3.2 Data Collection The data was collected using quantitative methods which is sample survey
research.
3.2.1 Sample Survey Research
Data is gathered from stakeholder which are people that involve and impact
on Autonomous trucks or people who are using the public road in Thailand. The survey,
which is a structured interview with the questionnaire, was used to collect most of the
primary data used in this research.
3.2.3 Preparation for the survey
The survey was conducted online via Google form. In order to avoid time-
consuming for a survey and have a fast implementation.
3.3 Data Measurement The questionnaire is composed of 32 questions divided into two parts as
follows (Please see the full questionnaire in Appendix A)

17
Figure 3.1 Example of questionnaire format
Part A: Perceived characteristic and other factors of Autonomous Truck
Part B: Personal Detail of Respondent
The measurement scales used in the questionnaire are nominal and interval
scales. The measurement techniques used in the questionnaire are single response,
Likert scale and dichotomous scale as shown in Table 3.3 A-B. Most of the questions in
the questionnaire use a 5-level Likert scale to measure the perception and attitude of the
respondent. To define the minimum and maximum length of the 5-point Likert type of
scale. Also, the questions require an answer of the Determinant-choice question
(respondent chooses one and only one choice from 3 or more options. The respondent
is asked to score the degree of agreement or disagreement with each statement in five
levels as shown below.
“1” = Strongly Disagree
“2” = Disagree
“3” = Neutral
“4” = Agree
“5” = Strongly Agree

18
The designed questionnaire is corresponded with the research framework.
Table 3.2 A-B shows variables of the research, data type, measured technique and
reference question in the questionnaire.
Table 3.1 Data Scale and Measured Technique on Each variable in Part A
Factor Group Variable Data Type Measured
Technique
Question
No.
Attitude
Traffic congestion Interval Likert 1 - 5 Q1
Road injuries and Human
fallibility Interval Likert 1 - 5 Q2
Emission and Greenhouse
effect Interval Likert 1 - 5 Q3
Fuel consumption Interval Likert 1 - 5 Q4
Fatigue of drivers Interval Likert 1 - 5 Q5
Adapting with other logistic Interval Likert 1 - 5 Q6
Social Influence
Partnership with famous brand Interval Likert 1 - 5 Q7
Influence from Friend(s) Interval Likert 1 - 5 Q8
News about Achievement Interval Likert 1 - 5 Q9
Social influencers Interval Likert 1 - 5 Q10
Trust Believe in technology Interval Likert 1 - 5 Q11
Perceived
usefulness
Make life more safety Interval Likert 1 - 5 Q12
Enhance the comfortable life Interval Likert 1 - 5 Q13
Improving logistic of entire
country Interval Likert 1 - 5 Q14

19
Table 3.1 Data Scale and Measured Technique on Each variable in Part A (cont.)
Factor Group Variable Data Type Measured
Technique
Question
No.
Perceived ease of Use Easy to learn and easy to
understand Interval Likert 1 - 5 Q15
Perceived Risk
Illegal access Interval Likert 1 - 5 Q16
Data Leakage Interval Likert 1 - 5 Q17
Breakdown Interval Likert 1 - 5 Q18
Breakdown and Fatality Interval Likert 1 - 5 Q19
Resistance to change
Hard to establish in
Thailand Interval Likert 1 - 5 Q20
Impact on Driver turnover
rate Interval Likert 1 - 5 Q21
Resist about Autonomous
Truck Interval Likert 1 - 5 Q22
Disagree even doing
testimonial Interval Likert 1 - 5 Q23
Autonomous Vehicle
Acceptance
Accept the technology if
they test on road in other
country Interval Likert 1 - 5 Q24
Accept the technology if
they test on road in
Thailand Interval Likert 1 - 5 Q25
Accept technology in the
next 5 years Interval Likert 1 - 5 Q26
Workable on Real Life Interval Likert 1 - 5 Q27

20
Table 3.2 Data Scale and Measured Technique on Each variable in Part B
Factor Group Variable Data Type Measured
Technique
Question
No.
Socioeconomic
Gender Nominal Single Response Q28
Age Nominal Single Response Q29
Education Nominal Single Response Q30
Income Nominal Single Response Q31
Media Channel Nominal Single Response Q32
3.4 Data Analysis Using IBM SPSS AMOS version 20 for Windows, computer program to
analyze frequency, Crosstabulation and Path analysis (SEM).
Data process are as follows:
1. A descriptive statistic is used to explain the respondents’ information
such as gender, age, education, monthly income, and media channel. The results will be
in the form of mean, frequencies, standard deviation and significance.
2. Finding difference in the rating of the attitude and technology resistance
toward autonomous vehicle acceptance in Thailand in many aspects by perceived
usefulness, perceived ease of use, perceived risk, social influence, trust, attitude and
resistance to change by use of analysis of Covariance structure. (Path analysis, SEM)
3. Testing the relationship between two variables or multi-variables by
using Crosstabulation method such as perceived usefulness, perceived ease of use,
perceived risk, social influence, trust, attitude and resistance to change.
21
CHAPTER IV
RESEARCH FINDING AND ANALYSIS
According to the research methodology from chapter 3, the results from the
data analysis describe the frequency, Crosstabulation and Path analysis (SEM) as shown
below.
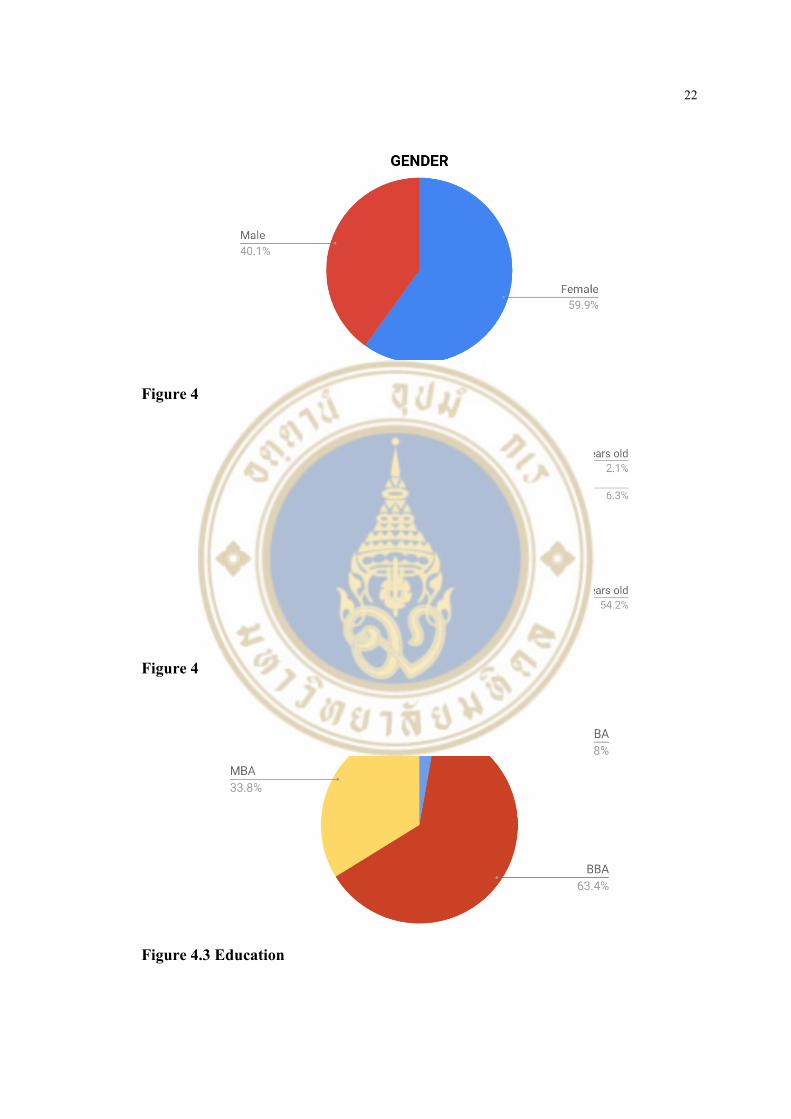
4.1 The results in frequency distribution In this research collected data by online survey (Google form) which
targeted on Thai people that have an impact on autonomous vehicles. There are 142
respondents in this research.
The respondents included 85 females and 57 males. The majority in this
research are the people who have age range between 21 - 29 years old which account
for 54.2%, following by 35.2% of people who are between 30 - 49 years old, 2.1% of
people who are under 18 years old, 1.4% of respondents who are range between 50 - 59
years old and 0.7% of respondents who are range between above 60 years old. For
Education, most of the respondents who had an education level equal to bachelor’s
degree which have 63.4% respectively. Moving to monthly income, most of respondent
have salary around 10,001 to 30,000 Thai baht which account for 30.4% and around
30,001 to 50,000 Thai Baht which account for 21.8%. Lastly, 98.6% are people who
receive information by online channels such as websites, YouTube, Line, Facebook,
Twitter, Online newspaper, and blog.
22
Figure 4.1 Genders
Figure 4.2 Age
Figure 4.3 Education

23
Figure 4.4 Income
Figure 4.5 Media Channel
24
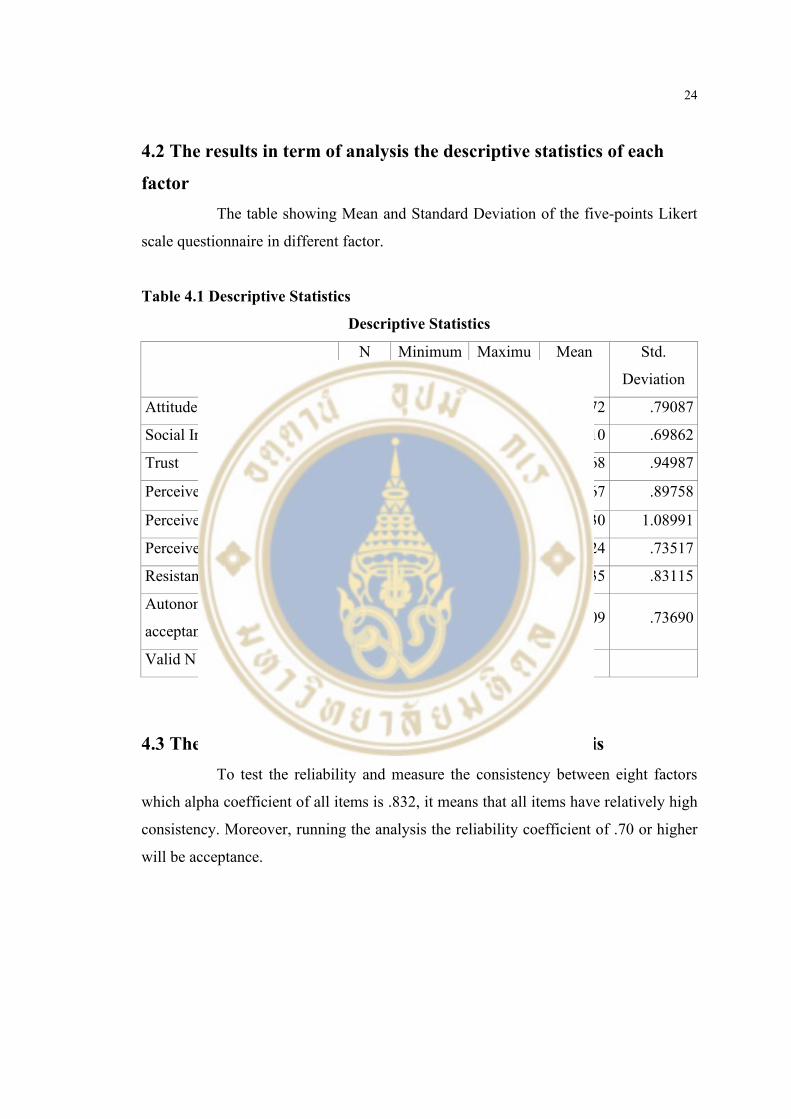
4.2 The results in term of analysis the descriptive statistics of each
factor The table showing Mean and Standard Deviation of the five-points Likert
scale questionnaire in different factor.
Table 4.1 Descriptive Statistics
Descriptive Statistics
N Minimum Maximu
m
Mean Std.
Deviation
Attitude 142 1.33 5.00 3.9272 .79087
Social Influence 142 2.00 5.00 3.8310 .69862
Trust 142 1.00 5.00 3.6268 .94987
Perceived usefulness 142 1.00 5.00 3.8967 .89758
Perceived ease of use 142 1.00 5.00 3.4930 1.08991
Perceived risk 142 2.00 5.00 4.2324 .73517
Resistance to change 142 1.00 5.00 3.0335 .83115
Autonomous vehicle
acceptance 142 1.50 5.00 4.1109 .73690
Valid N (listwise) 142
4.3 The Results in Term of Analysis of Reliability Analysis To test the reliability and measure the consistency between eight factors
which alpha coefficient of all items is .832, it means that all items have relatively high
consistency. Moreover, running the analysis the reliability coefficient of .70 or higher
will be acceptance.

25
Table 4.2 Reliability statistic
Reliability Statistics
Cronbach's Alpha N of Items
.832 27
4.4 The results in terms of Cross Tabulation method and interpretation
4.4.1 The table will show the relationship between autonomous vehicle
acceptance (APA) and gender.
4.4.1.1 Statement: I will accept the technology and system of
autonomous vehicles if there is a road trial in other country.
Table 4.3 The number of respondents who have different gender versus
autonomous vehicle acceptance (Testing on the road in other countries)
I will accept the technology and system of autonomous vehicles if there is
a road trial in other country.
Total
Strongly
Disagree
Disagree Neutral Agree Strongly
Agree
Gender FEMALE 3 2 20 32 28 85
MALE 1 3 7 13 33 57
Total 4 5 27 45 61 142
Interpretation
According to Table 4.3, this statement shows that Male willing to be accept
the technology if it tests on the road in other country than Female which is 33 comparing
to 28 respondents, respectively. And there are 42% of people who are strongly agree for
this statement.
4.4.1.2 Statement: I will accept the technology and system of
autonomous vehicles if there is a road trial in Thailand.

26
Table 4.4 The number of respondents who have different gender versus
autonomous vehicle acceptance (Testing on the road in Thailand)
I will accept the technology and system of autonomous vehicles if there is a road
trial in Thailand.
Total
Strongly Disagree Disagree Neutral Agree Strongly Agree
Gender FEMALE 1 3 15 26 40 85
MALE 1 2 6 18 30 57
Total 2 5 21 44 70 142
Interpretation
According to Table 4.4, this statement shows that Female have the
willingness to accept the technology if it tests on the road in Thailand than Male about
40 comparing to 30, respectively. Moreover, there were about 80% of respondents
answer agree and strongly agree.
4.4.1.3 Statement: I will accept the technology and systems of
autonomous vehicles in the next 5 years.
Table 4.5 The number of respondents who have different gender versus
autonomous vehicle acceptance (Will accept technology in the next 5 years)
I will accept the technology and systems of autonomous vehicles in the
next 5 years.
Total
Strongly
Disagree
Disagree Neutral Agree Strongly
Agree
Gender FEMALE 2 7 25 26 25 85
MALE 2 1 15 14 25 57
Total 4 8 40 40 50 142

27
Interpretation
According to Table 4.5, there are the same number of male and female that
show strongly agree on accepting technology in the next 5 years which is 35% out of
142 respondents.
4.4.1.4 Statement: I think it is possible to use autonomous
vehicles.
Table 4.6 The number of respondents who have different gender versus
autonomous vehicle acceptance (Think that technology is workable in real-life)
I think it is possible to use autonomous vehicles. Total
Strongly Disagree Disagree Neutral Agree Strongly Agree
Gender FEMALE 2 4 9 32 38 85
MALE 0 2 8 14 33 57
Total 2 6 17 46 71 142
Interpretation
According to Table 4.6, there are 50% for strongly agree of both male and
female respondent think that autonomous vehicle is possible to use in Thailand. Next
32% for respondent who answer agree on this statement.
4.4.2. The table will show the relationship between autonomous vehicle
acceptance (APA) and media channel.
4.4.2.1 Statement: I will accept the technology and system of
autonomous vehicles if there is a road trial in other country, I will accept the technology
and system of autonomous vehicles if there is a road trial in Thailand, I will accept the
technology and systems of autonomous vehicles in the next 5 years, and I think it is
possible to use autonomous vehicles.

28
Table 4.7 The number of respondents who have perceive different media
channels versus autonomous vehicle acceptance
I will accept the technology and system of autonomous vehicles if there is a road
trial in other country. Total
Strongly
Disagree Disagree Neutral Agree
Strongly
Agree
Media Online 4 5 26 44 61 140
Offline 0 0 1 1 0 2
Total 4 5 27 45 61 142
I will accept the technology and system of autonomous vehicles if there is a road
trial in Thailand. Total
Strongly
Disagree Disagree Neutral Agree
Strongly
Agree
Media Online 1 5 20 44 70 140
Offline 1 0 1 0 0 2
Total 2 5 21 44 70 142
I will accept the technology and systems of autonomous vehicles in the next 5
years. Total
Strongly
Disagree Disagree Neutral Agree
Strongly
Agree
Media Online 4 8 39 39 50 140
Offline 0 0 1 1 0 2
Total 4 8 40 40 50 142
I think it is possible to use autonomous vehicles.
Total Strongly
Disagree Disagree Neutral Agree
Strongly
Agree
Media Online 2 5 16 46 71 140
Offline 0 1 1 0 0 2
Total 2 6 17 46 71 142
Interpretation
According to Table 4.7, this statement shows that the majority of the
respondents strongly agree that they will accept autonomous vehicle if it has a trial on
the road in other country and in Thailand. Moreover, they will accept the technology
and system in the next five years, and they think autonomous vehicle is possible to use
in Thailand are people who use online media as a channel.
29
4.5 Path Analysis Path analysis used to identity the factor that related in correlation matrix and
it also extension from the regression model. The analysis can be interpreting both direct,
indirect and total effects which shown by a line that link a square which shows the
causation. Regression weight also forecasted by the model. Next the goodness of fit
statistic is calculated in order to see the fitting of the model.
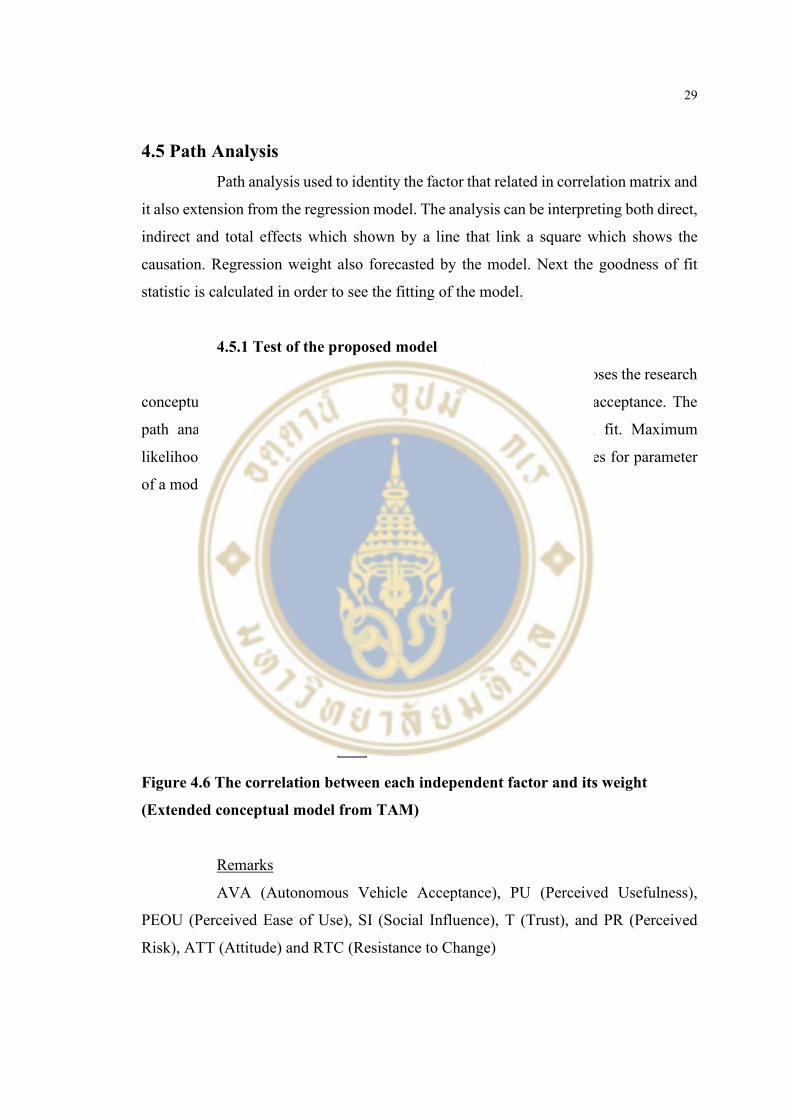
4.5.1 Test of the proposed model
Regarding to the literature reviews in Chapter two, it composes the research
conceptual model in figure 4.6 towards autonomous vehicle (truck) acceptance. The
path analysis implements with AMOS program to test the model fit. Maximum
likelihood estimation (MLE) is a method that use to interpret the values for parameter
of a model which is in SEM analytic tool.
Figure 4.6 The correlation between each independent factor and its weight
(Extended conceptual model from TAM)
Remarks
AVA (Autonomous Vehicle Acceptance), PU (Perceived Usefulness),
PEOU (Perceived Ease of Use), SI (Social Influence), T (Trust), and PR (Perceived
Risk), ATT (Attitude) and RTC (Resistance to Change)

30
4.6 The results in term of Correlation Coefficients with Spearman
method The graph shows the correlation coefficient with Spearman method for all
variables as avoid the problem of multicollinearity so the variable should not exceed
0.70. It uses bivariate correlation method to test the model in SPSS.
Table 4.8 Correlation coefficient with Spearman method ATT SI T PU PEOU PR RTC AVA
Spearman's rho
ATT
Correlation Coefficient 1.000 .483** .483** .565** .414** .056 -.240** .511**
Sig. (2-tailed) . .000 .000 .000 .000 .505 .004 .000
N 142 142 142 142 142 142 142 142
SI
Correlation Coefficient .483** 1.000 .462** .555** .489** .108 -.103 .463**
Sig. (2-tailed) .000 . .000 .000 .000 .199 .225 .000
N 142 142 142 142 142 142 142 142
T
Correlation Coefficient .483** .462** 1.000 .661** .469** -.244** -.387** .423**
Sig. (2-tailed) .000 .000 . .000 .000 .003 .000 .000
N 142 142 142 142 142 142 142 142
PU
Correlation Coefficient .565** .555** .661** 1.000 .532** .085 -.424** .542**
Sig. (2-tailed) .000 .000 .000 . .000 .312 .000 .000
N 142 142 142 142 142 142 142 142
PEOU
Correlation Coefficient .414** .489** .469** .532** 1.000 .073 -.149 .461**
Sig. (2-tailed) .000 .000 .000 .000 . .385 .076 .000
N 142 142 142 142 142 142 142 142
PR
Correlation Coefficient .056 .108 -.244** .085 .073 1.000 .237** .091
Sig. (2-tailed) .505 .199 .003 .312 .385 . .005 .283
N 142 142 142 142 142 142 142 142
RTC
Correlation Coefficient -.240** -.103 -.387** -.424** -.149 .237** 1.000 -.310**
Sig. (2-tailed) .004 .225 .000 .000 .076 .005 . .000
N 142 142 142 142 142 142 142 142
AVA
Correlation Coefficient .511** .463** .423** .542** .461** .091 -.310** 1.000
Sig. (2-tailed) .000 .000 .000 .000 .000 .283 .000 .
N 142 142 142 142 142 142 142 142
**. Correlation is significant at the 0.01 level (2-tailed).
According to the result, almost of the variable is under 0.70 in a positive
direction. Which perceived risk and resistance to change are the only factor that the
correlates in the negative direction as the researcher intend to find the negative
perception from the respondent to make sure that there are no bias in the questionnaire
set. To conclude, the variable has no multicollinearity by following this result.
31
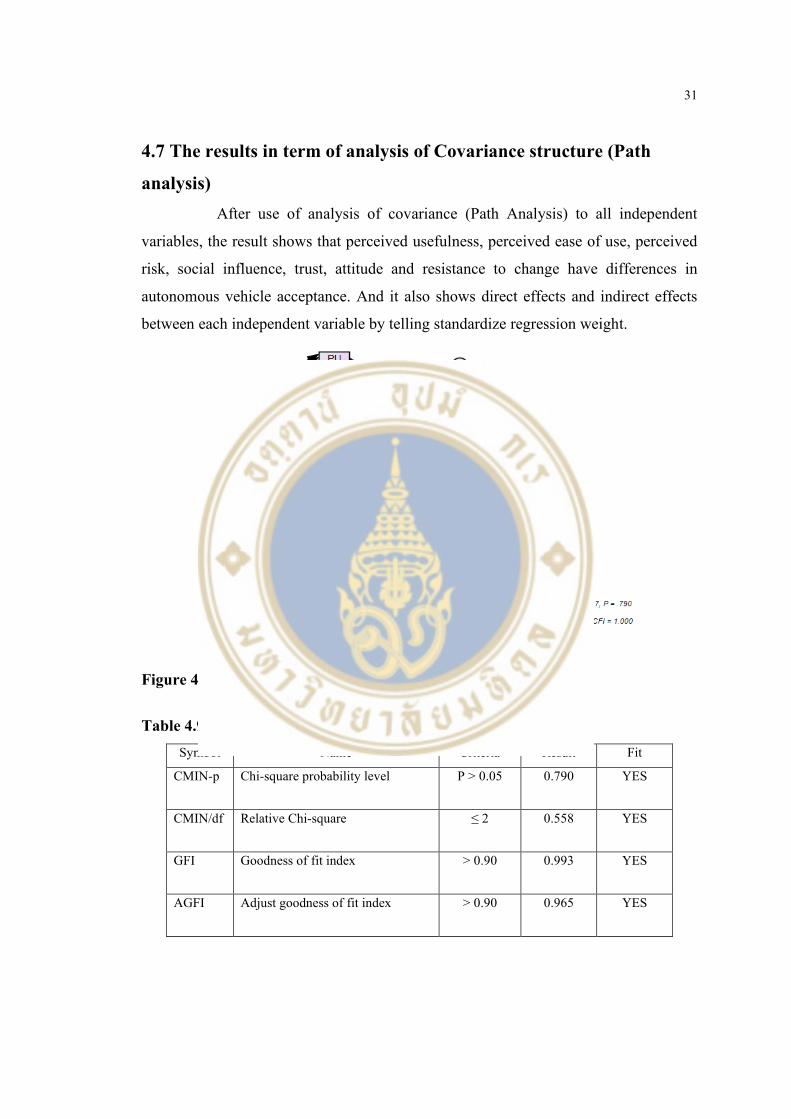
4.7 The results in term of analysis of Covariance structure (Path
analysis) After use of analysis of covariance (Path Analysis) to all independent
variables, the result shows that perceived usefulness, perceived ease of use, perceived
risk, social influence, trust, attitude and resistance to change have differences in
autonomous vehicle acceptance. And it also shows direct effects and indirect effects
between each independent variable by telling standardize regression weight.
Figure 4.7 The result of estimate standardized regression weight
Table 4.9 Measure of model fit Symbol Name Criteria Result Fit
CMIN-p Chi-square probability level P > 0.05 0.790 YES
CMIN/df Relative Chi-square ≤ 2 0.558 YES
GFI Goodness of fit index > 0.90 0.993 YES
AGFI Adjust goodness of fit index > 0.90 0.965 YES

32
Table 4.9 Measure of model fit (cont.)
Symbol Name Criteria Result Fit
CFI Comparative fit index > 0.90 1 YES
Symbol Name Criteria Result Fit
RMSEA Root mean square error of
approximately
< 0.05 0 YES
4.7.1 Standardized Estimates
Table 4.10 Standardized Regression Weights Estimate
ATT <--- SI .253
ATT <--- PU .438
ATT <--- T .098
RTC <--- SI .286
RTC <--- PU -.527
RTC <--- ATT -.141
RTC <--- PR .296
AVA <--- SI .193
AVA <--- RTC -.238
AVA <--- ATT .272
AVA <--- PEOU .222
Interpretation
From this graph, it shows the estimate of Standardized Regression Weight
that link each variable in the model. As the result, Attitude show the highest weight
which is 0.272 that link to Autonomous Vehicle Acceptance. The following is
Resistance to Change which is 0.238 and lastly is Perceived Ease of Use which is 0.222.
for this table, it has no meaning for minus (-) sign as it uses only the number to analyze
the weight.

33
Table 4.11 Unstandardized Regression Weights
Estimate S.E. C.R. P Significance
ATT <--- SI .430 .132 3.261 .001 YES
ATT <--- PU .772 .157 4.917 *** YES
ATT <--- T .488 .419 1.164 .244 NO
RTC <--- SI .340 .107 3.180 .001 YES
RTC <--- PU -.650 .121 -5.395 *** YES
RTC <--- ATT -.099 .066 -1.492 .136 NO
RTC <--- PR .335 .078 4.317 *** YES
AVA <--- SI .204 .088 2.313 .021 YES
AVA <--- RTC -.211 .060 -3.532 *** YES
AVA <--- ATT .169 .051 3.331 *** YES
AVA <--- PEOU .600 .205 2.931 .003 YES
Remark: Significance *p < 0.05, **p < 0.001
Interpretation
According to Table 4.11, Unstandardized Regression Weight or Regression
Weight show the amount by which dependent variables changes if we change
independent variable by one unit (Bhalla, n.d.) . To explain for this result, it shows that
if Resistance to Change goes up by one-unit, Autonomous Vehicle Acceptance effect
will go down by 0.211.
4.7.2 Descriptive Statistic and Correlation Matrix
Table 4.12 Estimates of covariances among exogenous variables
Estimate S.E. C.R. P Significant
PU <--> PEOU 1.646 .282 5.839 *** YES
PEOU <--> SI 1.587 .288 5.517 *** YES

34
Table 4.12 Estimates of covariances among exogenous variables (cont.)
Estimate S.E. C.R. P Significant
SI <--> T 1.403 .251 5.578 *** YES
T <--> PR -.653 .240 -2.721 .007 YES
SI <--> PR .678 .690 .983 .326 NO
PEOU <--> PR .112 .268 .418 .676 NO
PU <--> PR .239 .662 .360 .719 NO
PEOU <--> T .536 .098 5.491 *** YES
PU <--> T 1.715 .258 6.646 *** YES
PU <--> SI 4.509 .735 6.135 *** YES
Table 4.13 Descriptive statistic and correlation matrix
Mean SD PU PEOU SI T PR
PU 3.8967 0.898 1
PEOU 3.4930 1.090 0.565** 1
SI 3.8310 0.699 0.603** 0.525** 1
T 3.6268 0.950 0.675** 0.522** 0.532** 1
PR 4.2324 0.735 0.030 0.035 0.083 -0.235** 1
The result from Table 4.12, there are 6 pairs of significance at the level of p
< 0.001 and 1 pairs that significance at the level of p < 0.05. However, there are three
pair that show not significant values which are SI <--> PR, PEOU <--> PR and PU <--
> PR that P-value are 0.326, 0.676 and 0.719, respectively.
35
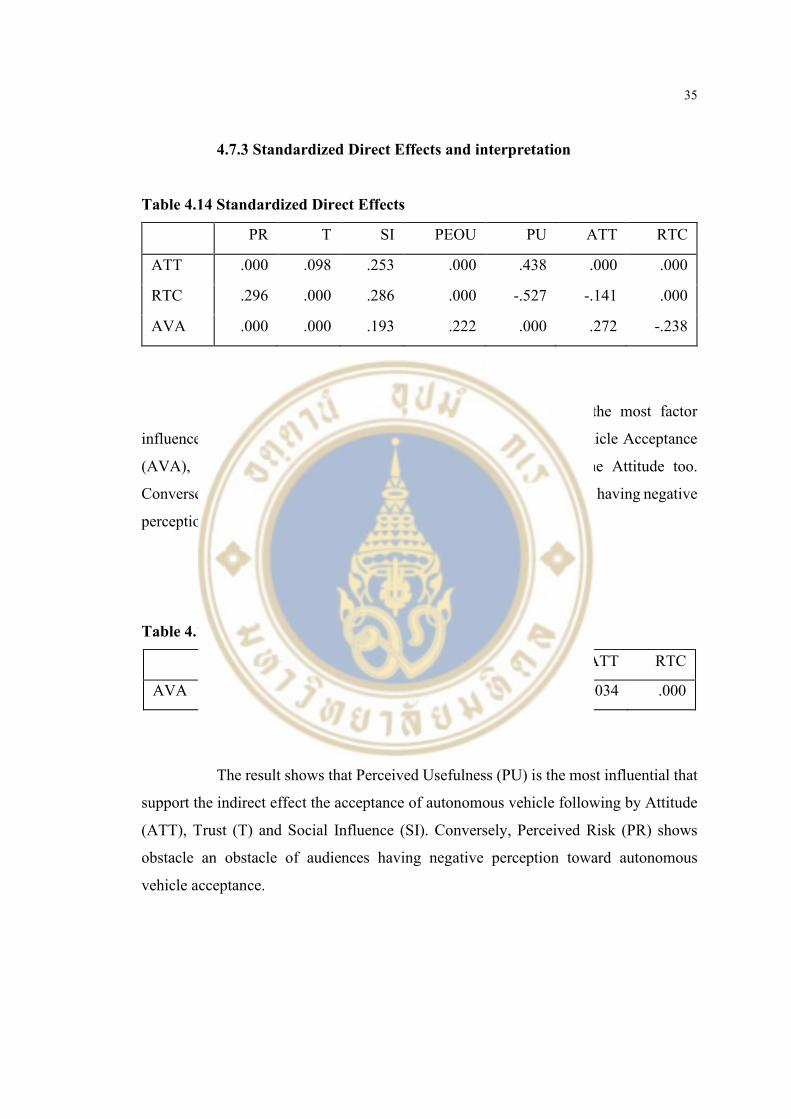
4.7.3 Standardized Direct Effects and interpretation
Table 4.14 Standardized Direct Effects
PR T SI PEOU PU ATT RTC
ATT .000 .098 .253 .000 .438 .000 .000
RTC .296 .000 .286 .000 -.527 -.141 .000
AVA .000 .000 .193 .222 .000 .272 -.238
Interpretation
The results shows that Perceived Usefulness (PU) is the most factor
influence audience to create Attitude (ATT) toward Autonomous Vehicle Acceptance
(AVA), whereas Trust (T) and Social Influence (SI) influence the Attitude too.
Conversely, Resistance to Change (RTC) show an obstacle of audiences having negative
perception toward autonomous vehicle acceptance.
4.7.4 Standardized Indirect Effects and interpretation
Table 4.15 Standardized Indirect Effects
PR T SI PEOU PU ATT RTC
AVA -.070 .030 .009 .000 .259 .034 .000
Interpretation
The result shows that Perceived Usefulness (PU) is the most influential that
support the indirect effect the acceptance of autonomous vehicle following by Attitude
(ATT), Trust (T) and Social Influence (SI). Conversely, Perceived Risk (PR) shows
obstacle an obstacle of audiences having negative perception toward autonomous
vehicle acceptance.

36
4.7.5 Standardized Total Effects and interpretation
Table 4.16 Standardized Total Effects
PR T SI PEOU PU ATT RTC
ATT .000 .098 .253 .000 .438 .000 .000
RTC .296 -.014 .250 .000 -.589 -.141 .000
AVA -.070 .030 .203 .222 .259 .306 -.238
The result shows that Perceived usefulness, Social Influence and Trust are
the influential audience to accept the autonomous vehicle. Conversely, perceived risk
and resistance to change both are negative effect on Autonomous Vehicle Acceptance.

37
CHAPTER V
CONCLUSION AND RECOMMENDATION
The objective of the research project was to understand how the customers’
acceptance to autonomous vehicle through the Technology Acceptance Model (TAM),
as well as study of technology resistance, social influence and trust structure as the
determinants.
5.1 Discussion of research finding This research proposes to study the factors that influence attitude and
technology resistance regarding autonomous vehicle acceptance through quantitative
research. The paper develops the TAM, Perceived, Resistance to Change, Trust and
Social Influence as the conceptual model that consists of Perceived Usefulness,
Perceived Ease of Use and Attitude.
The online questionnaire with items provides to the respondents who lives
in Thailand with 142 valid samples. Analysis data with IBM SPSS AMOS program
through Path Analysis is the key finding in this paper for direct, indirect and total effects
between factors that influence the technology to get acceptance. The result from factors
that influence the audiences’ attitude to accept the technology is perceived usefulness
that explain for 43.8%, social influence 25.3% and trust 9.8%. According to technology
resistance influence autonomous vehicle acceptance by 23.8% which is linked with
perceived usefulness 58.9%, perceived risk 29.6%, social influence 25%, and attitude
14.1%. Moreover, the acceptance of autonomous vehicle is influenced by perceived
usefulness which are 25.9%, resistance to change 23.8%, perceived ease of use 22.2%
and social influence 20.3%. From the result, it is clear that perceived usefulness is
influence of all factor include attitude, resistance to change and autonomous vehicle
acceptance with the highest rate.
38
The significance correlation between factor that show in the standardized
correlation matrix are perceived usefulness and trust (0.675), social influence and
perceived usefulness (0.603) and perceived ease of use and perceived usefulness
(0.565). Inversely, perceived risk has the least correlation with all factor.
5.2 Limitation and Suggestions
5.2.1 Scope of the study
From the limitation of the method of this research is only focus on
quantitative due to the limitation of time, a qualitative such as focus group or in-depth
interview could be helping to understand the concentration of audience.
5.2.2 Population and demographic profile of the respondent
Moreover, this research is study only the perception of audience toward
autonomous truck, this shows that the autonomous vehicle topic needs to discuss with
other group as well, such as truck manufacturer, government agency, logistic company
and end user. Also, the questionnaire is distributed on via google form which is online
base so it might bias on the information of media channel of respondent used.
5.2.3 Implication for future research project
As the limited scope of study mentioned above, for future research project
could enlarged the quality of the study for further area, not only Bangkok area.
Furthermore, the research should focus other sector such as truck manufacturer,
government agency, logistic company and end user, to learn more about the perception
of each group. In addition, the research focus only perceived usefulness, perceived ease
of use and technology resistance. For further research should focus on other factor that
create a positive effect on autonomous truck acceptance by qualitative research such as
in-depth interview and focus group.

39
5.3 Recommendation From Path analysis model and AMOS SPSS program help the researcher to
identify the correlation between the factor and identified the linkage between each
factor.
5.3.1 Recommendation for Attitude
According to Attitude (ATT) factor which linked with Perceived Usefulness
(PU), Social Influence (SI) and Trust (T) to make the audience more acceptance the
autonomous vehicle. Therefore, the manufacturer and distributor should improve the
attitude and viewpoint of the audience as it can increase the positive image of the
autonomous truck.
This factor has the highest effect on acceptance toward autonomous vehicle
of the audience. Therefore, my recommendation is the distributor and manufacturer
should give the information of the technology and it useful to the audience to make them
trust in autonomous vehicle such as give them knowledge how the autonomous vehicle
can help and solve the problems of traffic congestion, road injuries that occur by human
fallibility, reduce fatigue of truck driver, fuel consumption and emission. When the
audience trust the product, they will be spokesperson for autonomous truck. Moreover,
the manufactures might need to be a partner with the well-known company that expertise
in this industry.
5.3.2 Recommendation for Resistance to change
Furthermore, the manufacturer and distributor also need to take attention on
technology resistance as it also relates with the audience’s acceptance on autonomous
truck too. In the path analysis model, it shows that Resistance to Change (ATC) is linked
with Social Influence (SI), Perceived Usefulness (PU), Attitude (ATT) and Perceived
Risk (PR) which the manufacturer and distributor should find the solution to deal with
this situation.
This factor has an effect on autonomous vehicle acceptance of the audience.
For this factor, I would like to recommend that the distributor should find the solution
to protect the breakdown that will occur fatality between end user and the audience.
40
Also, there concern about illegal access that might use the autonomous truck to make
the audience get injury. Moreover, there are some group of the audience think that it
hard to establish in Thailand and they think that it will impact on the driver job. So, the
distributor should give the information about the way to establish and the system of
autonomous vehicle that the road and motorcycle is not the problem of launching this
technology. Also, the distributor should explain the usage of autonomous truck that how
it will be benefit to the truck driver such as the driver can do other activity while the
truck is running, they also have a meal and use mobile phone that make them more relax
as they only need to control the system only.
5.4 Conclusion Almost 82% of the respondents think that autonomous vehicle is possible to
run in Thailand and there is 63% of the respondent will accept this autonomous in the
near future. If the autonomous truck can be test on the road in Thailand, they will be
more chance for audience to accept the technology. In Thailand, there are many cases
of injuries that occur by truck. Also, there is many people that have attention on emission
that sometime occur by the truck such as climate change, carbon monoxide, carbon
footprint.
From a theoretical point of view, this research has served broaden the
understanding of the factors influencing autonomous vehicle acceptance of the
audience’s view. One of the theoretical contributions of this study is the extension of
TAM by including Perceived risk, Trust, Social influence and Technology resistance.
As there are many factors that give a negative image and feedback on autonomous truck,
so it leads to the doubt of acceptance of autonomous truck to use in Thailand.
From the result, the research found that attitude which include perceived
usefulness, trust and social influence have an impact audience’s acceptance. Moreover,
the technology resistance can be reduced by give an information about perceived
usefulness, build a good spokesperson on social influence and increase the audience’s
attitude. In additional, the analysis indicated that female and male tend to accept the
technology in the next 5 years and both of gender think that the autonomous vehicle is
possible to launch in Thailand.

41
REFERENCES
Adnan, N., et al. (2018). "How trust can drive forward the user acceptance to the
technology? In-vehicle technology for autonomous vehicle." Transportation
Research Part A: Policy and Practice 118: 819-836.
Anderson, J. M., et al. (2016). "Autonomous Vehicle Technology."
Bauer, M. (2012). "Resistance to new technology and its effects on nuclear power,
information technology and biotechnology."
Bhalla, D. (n.d.). Standardized vs Unstandardized Regression Coefficient. ListenData.
Retrieved August 9, 2020, from
https://www.listendata.com/2015/04/standardized-vs-unstandardized.html
Costello, B. and R. Suarez (2015). "Truck driver shortage analysis 2015." Arlington,
VA: The American Trucking Associations.
Fagnant, D. J. and K. Kockelman (2015). "Preparing a nation for autonomous vehicles:
opportunities, barriers and policy recommendations." Transportation
Research Part A: Policy and Practice 77: 167-181.
Haboucha, C. J., et al. (2017). "User preferences regarding autonomous vehicles."
Transportation Research Part C: Emerging Technologies 78: 37-49.
Hudson, J., et al. (2019). "People’s attitudes to autonomous vehicles." Transportation
Research Part A: Policy and Practice 121: 164-176.
Hulse, L. M., et al. (2018). "Perceptions of autonomous vehicles: Relationships with
road users, risk, gender and age." Safety Science 102: 1-13.
Kaur, K. and G. Rampersad (2018). "Trust in driverless cars: Investigating key factors
influencing the adoption of driverless cars." Journal of Engineering and
Technology Management 48: 87-96.
Lapointe, L. and S. Rivard (2005). "A multilevel model of resistance to information
technology implementation." MIS quarterly: 461-491.
42
REFERENCES (cont.)
Lee, M.-C. (2009). "Factors influencing the adoption of internet banking: An integration
of TAM and TPB with perceived risk and perceived benefit." Electronic
Commerce Research and Applications 8(3): 130-141.
Meng, X. (2013). Scalable simple random sampling and stratified sampling.
International Conference on Machine Learning.
Pantano, E., & Di Pietro, L. (2012). "Understanding Consumer’s Acceptance of
Technology-Based Innovations in Retailing. Journal of Technology
Management & Innovation."
Penmetsa, P., et al. (2019). "Perceptions and expectations of autonomous vehicles – A
snapshot of vulnerable road user opinion." Technological Forecasting and
Social Change 143: 9-13.
Bhalla, D. (n.d.). Standardized vs Unstandardized Regression Coefficient. ListenData.
Retrieved August 9, 2020, from
https://www.listendata.com/2015/04/standardized-vs-unstandardized.html
Pasqua, E. (2019). How 5G, AI and IoT enable “Intelligent Connectivity.” https://iot-
analytics.com/how-5g-ai-and-iot-enable-intelligent-connectivity/
Songsakul, P. (2018). The Statistic of sleep without closing eyes that cause the fatality
which can prevent by Guardian System [Advertorial]. THE STANDARD.
https://thestandard.co/guardian-system/
Song, M., et al. (2019). A Simulation of the Traffic Behavior with Autonomous Truck
Platoons Based on Cellular Automaton, IEEE: 416-423.
Xu, Z., et al. (2018). "What drives people to accept automated vehicles? Findings from
a field experiment." Transportation Research Part C: Emerging
Technologies 95: 320-334.
Zhang, T., et al. (2019). "The roles of initial trust and perceived risk in public’s
acceptance of automated vehicles." Transportation Research Part C:
Emerging Technologies 98: 207-220.

43
APPENDICES

44
Appendix A: Quantitative Questionnaire Items
Questionnaire to extend the understanding of the attitude and technology resistance of
Thai stakeholder towards autonomous vehicle acceptance in Thailand
_____________________________________________________________________
This questionnaire is intended to explore consumer attitudes towards autonomous
vehicles (trailer, semi-trailer or trucks) for the master’s degree of the College of
Management. Mahidol University. The collected information is for research case studies
only. Information of all respondents will be kept only with the project leader and adviser.
The questionnaire takes approximately 5-10 minutes.
What is Autonomous Vehicle?
Autonomous Vehicle (AV) has applications from many different technologies including
Sensors (to detect obstructions around the car), IoT (INTERNET OF THINGS),
Artificial Intelligence (AI) is used to recognize different contexts on the road and
analyze different situations like stopping the car or keep moving and Big Data Analytics
(for driving intelligence)
The benefits of Driverless vehicles
• The roads are safer - Vehicles communicate and respond quickly.
• Traffic and fuel consumption will be more efficient - Automated systems will
allow vehicles to drive at optimal speed while maintaining control of the vehicle.
Efficient braking and accelerator Reduce unnecessary energy use and can also
reduce gas emissions that can cause glazing conditions.
• More time - when the vehicle is autonomous Users can take the time to travel to
do other things fully. And having an automatic system reduces traffic jams Will
shorten the travel time Because all cars are communicating and driving
automatically

45
Part I: Evaluate of related questions on Autonomous vehicle
Instruction: Please identify to what extend you agree or disagree with each of the following statements.
1. Please rate how you agree with the following attributes about using Autonomous vehicle. (Single answer for each statement)
Items
Low High 1 2 3 4 5
Strong Disagree Disagree Neutral Agree Strongly
Agree Attitude
1. I believe that autonomous vehicles will help to solve about the traffic problem 2. I believe autonomous vehicles can help reduce accidents caused by terrain and climate 3. I believe autonomous vehicles will help the environment such as carbon dioxide emissions that cause greenhouse conditions 4. I believe autonomous vehicles will help to reduce fuel consumption 5.I believe that autonomous vehicles will reduce fatigue problem as they are only responsible for the system and there is no need for driving skills. 6. I believe that autonomous vehicles can be developed for other applications such as water and air transport
Social Influence 7. I will have the confidence if autonomous vehicles are produced in collaboration with leading tractor companies and well-known developer of autonomous vehicle systems.
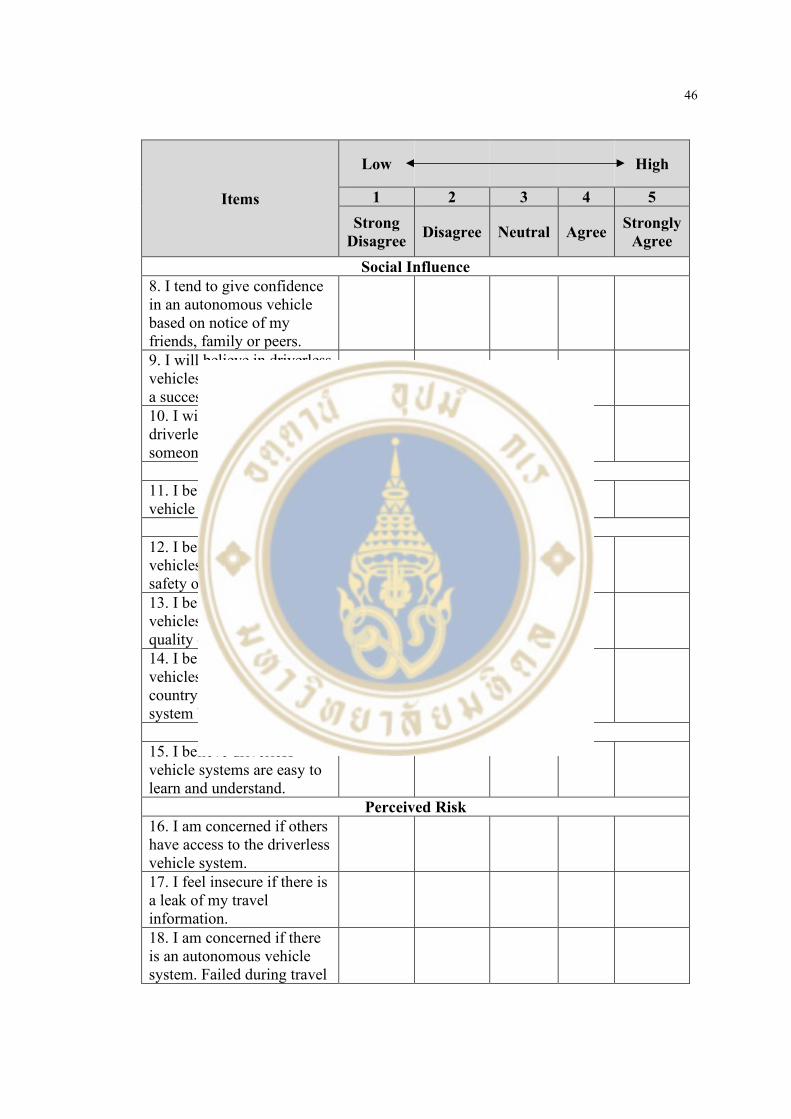
46
Items
Low High
1 2 3 4 5 Strong
Disagree Disagree Neutral Agree Strongly Agree
Social Influence 8. I tend to give confidence in an autonomous vehicle based on notice of my friends, family or peers. 9. I will believe in driverless vehicles. If there is news of a successful trial of use 10. I will follow the news of driverless vehicles. If someone I trust talks about
Trust 11. I believe in unmanned vehicle technology.
Perceived Usefulness 12. I believe driverless vehicles It will increase the safety of my life and others. 13. I believe driverless vehicles. Will improve my quality of life 14. I believe driverless vehicles. Will make my country's transportation system better
Perceived ease of use 15. I believe driverless vehicle systems are easy to learn and understand.
Perceived Risk 16. I am concerned if others have access to the driverless vehicle system. 17. I feel insecure if there is a leak of my travel information. 18. I am concerned if there is an autonomous vehicle system. Failed during travel
47
Items
Low High
1 2 3 4 5 Strong
Disagree Disagree Neutral Agree Strongly Agree
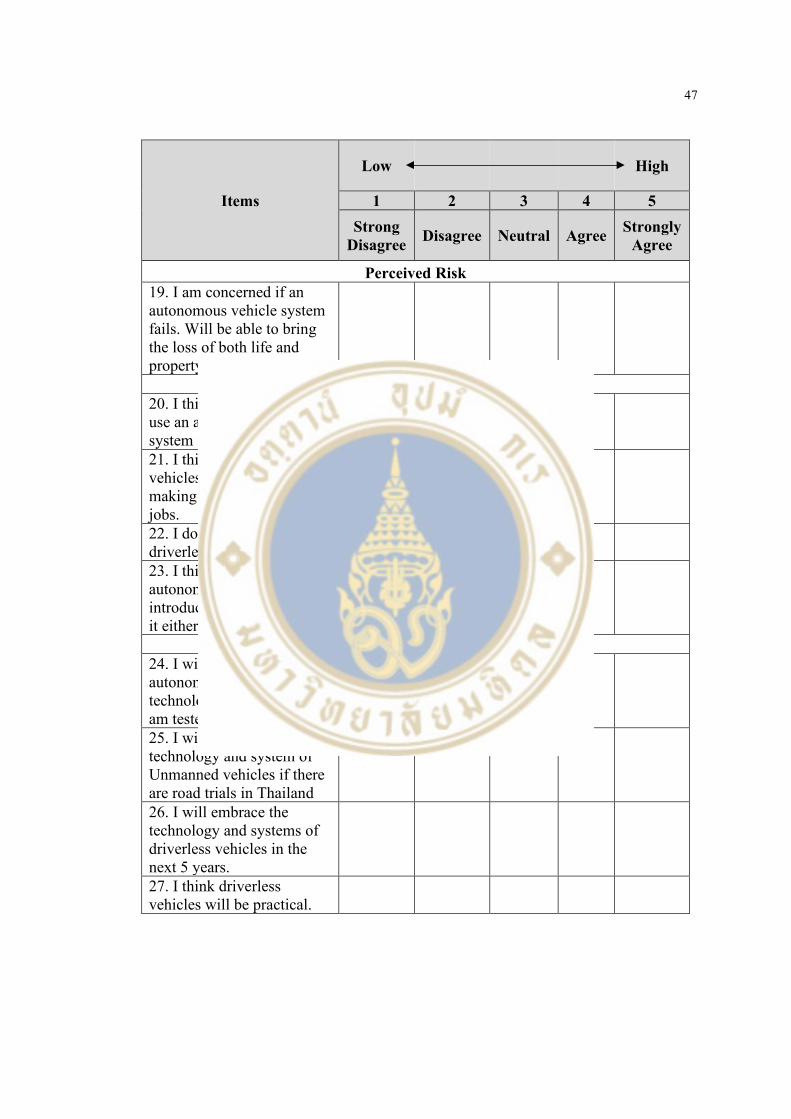
Perceived Risk 19. I am concerned if an autonomous vehicle system fails. Will be able to bring the loss of both life and property
Resistance to change 20. I think it is difficult to use an autonomous vehicle system in Thailand. 21. I think driverless vehicles play a big role in making drivers lose their jobs. 22. I do not agree with the driverless vehicle system. 23. I think that if an autonomous vehicle is introduced, I won't support it either.
Autonomous Vehicle Acceptance 24. I will accept autonomous vehicle technology and systems if I am tested on roads abroad. 25. I will accept the technology and system of Unmanned vehicles if there are road trials in Thailand 26. I will embrace the technology and systems of driverless vehicles in the next 5 years. 27. I think driverless vehicles will be practical.

48
Part II: Demographic Information
28. Gender
Male Female
29. Age
Below 18 years old
18 – 20 years old
21 – 29 years old
30 – 49 years old
50 – 59 years old
Above 60 years old
30. Education
Below bachelor degree
Bachelor degree
Master degree
Doctoral degree
31. Salary (monthly Income)
Below 9,000 Baht
9,001 – 10,000 Baht
10,001 – 30,000 Baht
30,001 – 50,000 Baht
50,001 – 70,000 Baht
70,001 – 90,000 Baht
90,001 – 120,000 Baht
120,001 – 150,000 Baht
Above 150,001 Baht
32. Media Channel
Online Media Channel (Website, Blog, YouTube, Twitter, etc.)
Television/ Digital poster/ Radio
Offline Media channel (Newspaper, Magazine, Infographic)
49
BIOGRAPHY
NAME Miss Thichachom Makanupuk
DATE OF BIRTH 30 April 1993
PLACE OF BIRTH Nakhonsawan, Thailand
INSTITUTIONS ATTENDED Bachelor in Business Management,
Assumption University, 2016
Master of Management,
Mahidol University, 2020
RESEARCH GRANTS -
PUBLICATION / PRESENTATION -
HOME ADDRESS 52/5-6 Vibhavadi rangsit 42 Lane 2 Latyao,
Chatuchak, Bangkok 10900
Tel. 099-964-4955
Email: [email protected]
EMPLOYMENT ADDRESS 99/46 Moo.8 Chiang Rak Noi Bang Pa-in
Phra Nakhon Si Ayutthaya Thailand 13180
Email: [email protected]