the atmospheric pollution and the economic development in china
TRANSCRIPT

The Atmospheric Pollution and
the Economic Development in China

Outline
1. Introduction and overview of the current state of the atmospheric pollution in the Asia-Pacific region
2. Sulfur dioxide (SO2) pollution in China
3. Carbon dioxide (CO2) pollution in China
4. Concluding remarks

Overview
• Atmospheric pollution increased significantly in the last three decades due to:– Rapid economic growth– More widespread use of motor vehicles

In the Asia-Pacific region...
• In 1992, the region accounted for 21% of the world’s commercial energy consumption (shown in Fig 1)
• Energy consumption grew by 6.2% while the global energy consumption fell by 1%
• 80% of the energy generated by fossil fuels, 40% of which was coal

Fig 1: Share of world energy demand (1992)
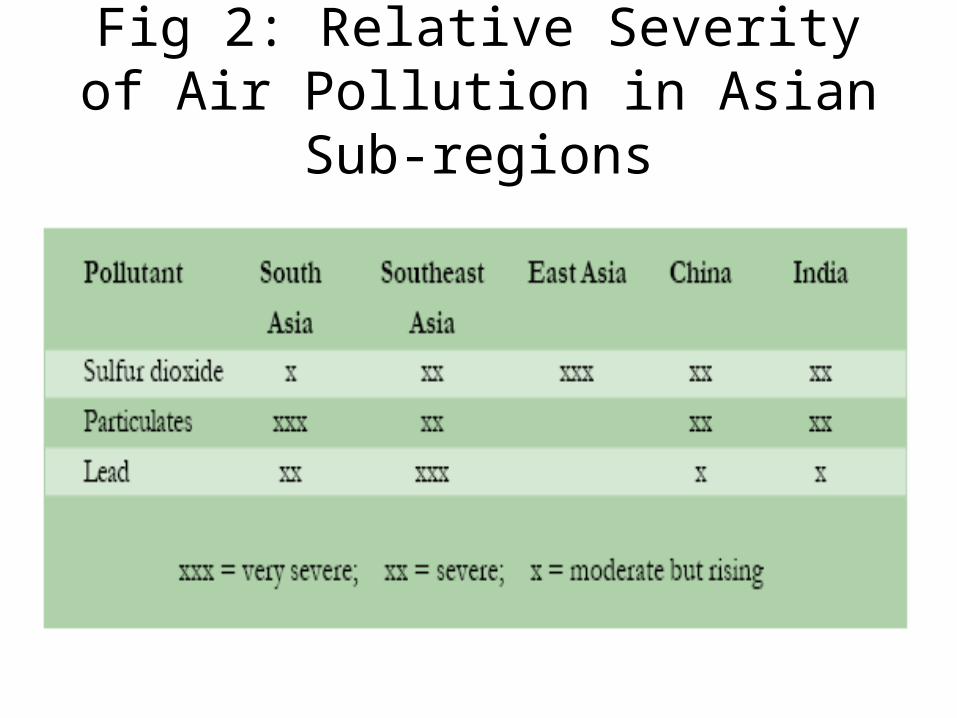
Fig 2: Relative Severity of Air Pollution in Asian Sub-regions

In the Asia-Pacific region... Con’d
• Sulfur oxide emission increased by 80% (1970-1986)
• Sulfur dioxide emission was 50% higher than either Africa or Latin America
• Nitrogen oxide emission increased by 70% (1970-1986)
• Carbon dioxide grew 60% faster than elsewhere

Air quality in Asia’s mega-cities…

In the Asia-Pacific region... Con’d
• Energy demand will double every 12 years (the world average: 28 years)
• Demand for coal will remain high (6.5% annual increase) thanks to:– The abundance of coal– Its easy recoverability
• SO2 emission triple in the next 12 years
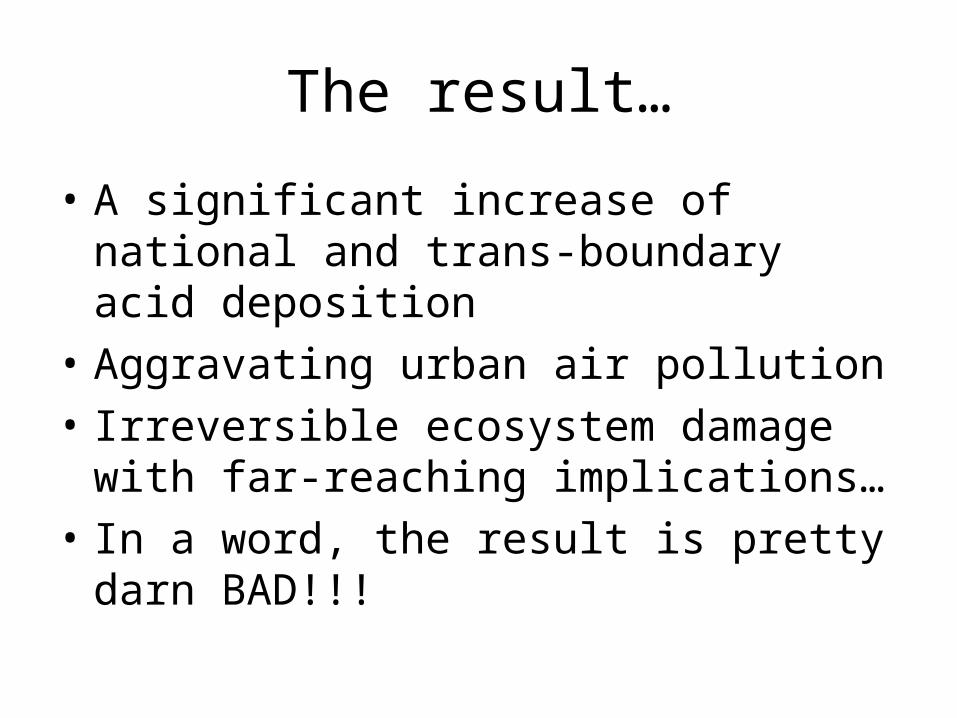
The result…
• A significant increase of national and trans-boundary acid deposition
• Aggravating urban air pollution
• Irreversible ecosystem damage with far-reaching implications…
• In a word, the result is pretty darn BAD!!!

Sulfur dioxide (SO2) pollution
• Generated as a result of the burning of coal and petroleum
• When released into the air, it reacts with atmospheric water and oxygen to produce sulfuric acid – major component of acid rain

The acid rain…
• Has substantially harmful effects on forests, fresh water and soils
• Kills off insect and aquatic life forms
• Causes chemical weathering to statues and buildings

Fig 4: SO2 Emission Level from 2000 to 2005 (10,000 tons)
100
300500
700900
1100
13001500
17001900
2100
23002500
2000 2001 2002 2003 2004 2005
Aggregate SO2Emi ssi on LevelI ndustri alEmi ssi onHousehol dEmi ssi on

SO2 in China…
• In 2005, over 50% of SO2 emitted from the “Production and Distribution of Electric Power and Heat Power Industry” (11.67 million tonnes)
• In which 11.12 million tonnes were the result of “Firepower Electricity” generation

Fig 5: Total Electricity and Firepower Electricity (1 Billion kwh)
0200400600800
100012001400160018002000
1990 1995 2000 2002 2003
TotalEl ectri ci tyOutput
Fi repowerEl ectri ci ty

Fig 6: Percentage of Firepower Electricity in Total Electricity Output
% of Fi repower El ectri ci tyi n Total El ectri ci ty Output
70. 00%
75. 00%
80. 00%
85. 00%
90. 00%
95. 00%
100. 00%
1990 1995 2000 2002 2003
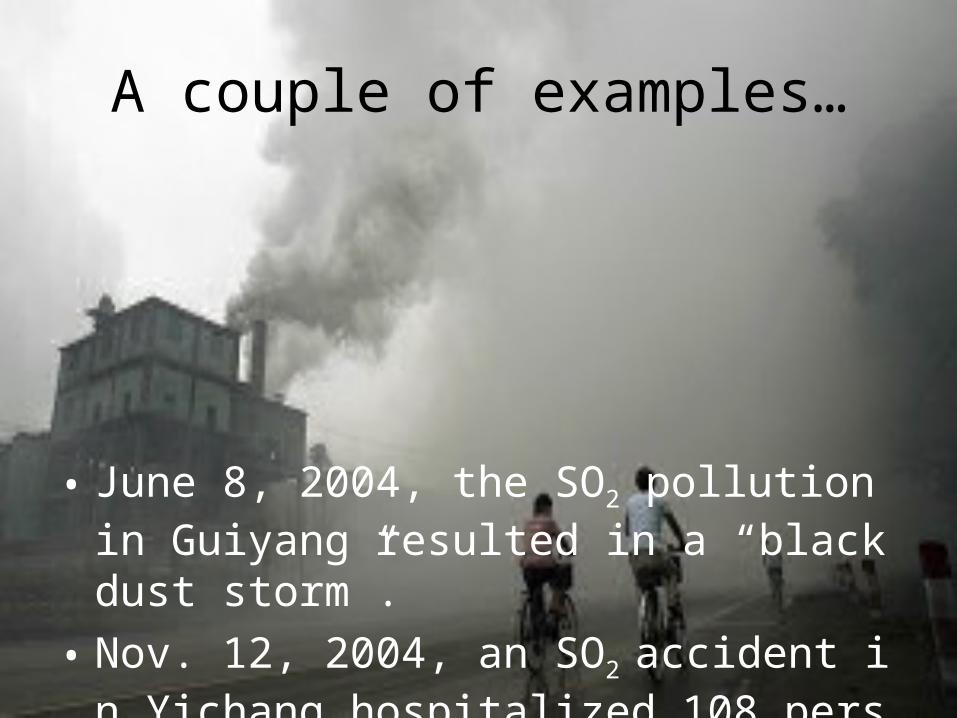
A couple of examples…
• June 8, 2004, the SO2 pollution in Guiyang resulted in a “black dust storm”.
• Nov. 12, 2004, an SO2 accident in Yichang hospitalized 108 persons.

Any optimism here?......Yes!
• A study of national income and SO2 emissions in 12 Western European countries in 2006
• Used 132 years of data
• Came up with an “Environmental Kuznets Curve” (EKC)

Fig 7: Kuznets Curve
Income per capita
IncomeInequality
orEnvironmental
Quality

In that study…
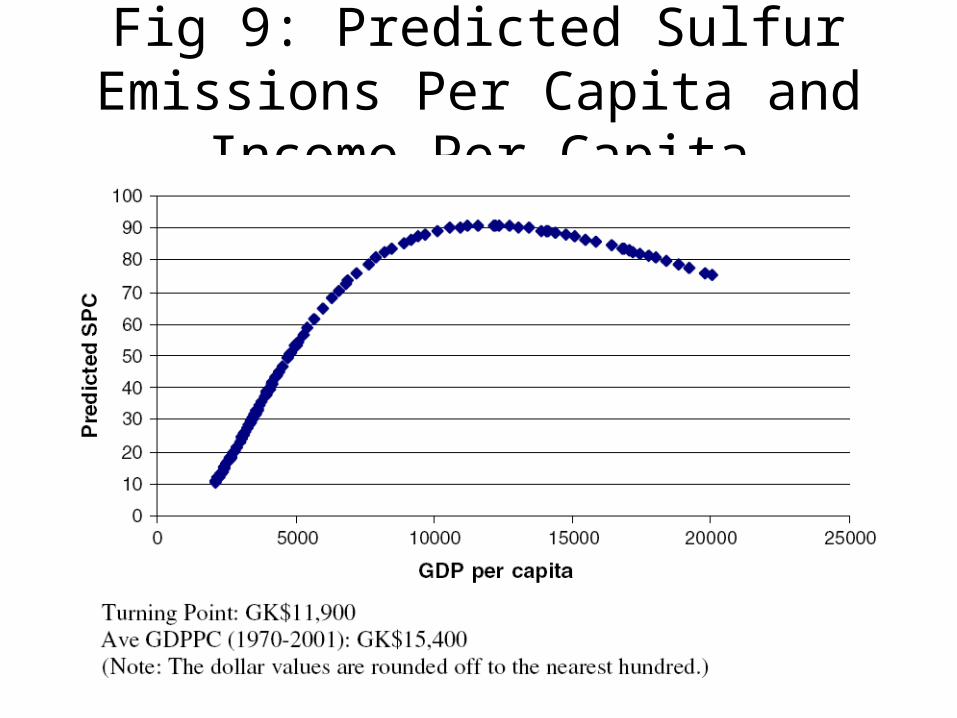
Fig 9: Predicted Sulfur Emissions Per Capita and Income Per Capita

Fig 10: Pollution-Income Relationship

Compare with the current Chinese situation…
• The 2006 income per capita in China is $1,500
• Compared to the Western Europe turning points of $11,900 with regulations, and $12,200 without regulations

Fig 11: Per capita income and industrial SO2 emission (1995-
2004)I ndustri al SO2 Emi ssi on (Mi l l i on Tons)
(1995-2004)
02
46
81012
1416
1820
4500 5500 6500 7500 8500 9500 10500 11500
Per Capi ta I ncome (Yuan)
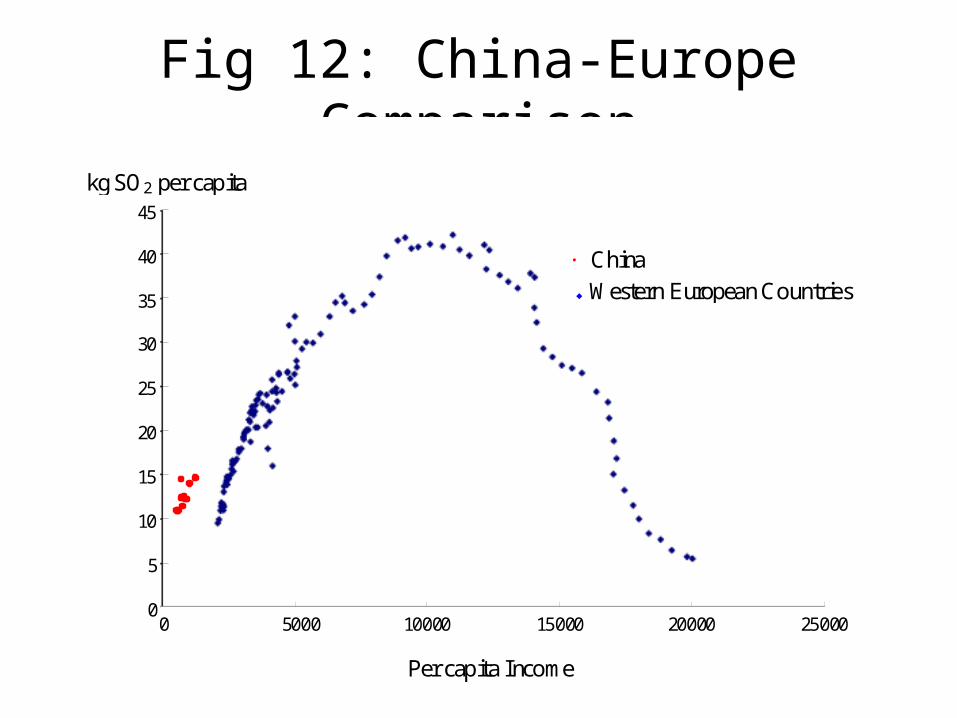
Fig 12: China-Europe Comparison
Chi na
0
5
10
15
20
25
30
35
40
45
0 5000 10000 15000 20000 25000
I ncome per capi ta
kg S
O2 p
er c
apit
a
40
45
35
30
25
20
15
10
5
0 0 5000 10000 15000 20000 25000
Per capita Income
· China ◆ Western European Countries
kg SO2 per capita

Carbon Dioxide (CO2) Pollution
• Atmospheric concentration of CO2 is mainly caused by:– Fossil fuel combustion– Deforestation
• A vicious domino effect:
SO2 emission → Acid rain →Deforestation →High atmospheric CO2 concentration→Greenhouse Effect & Global Warming

Fig 13: Historical Global Fossil Carbon Emissions

Fig 14: Carbon Dioxide Emissions by Country (1000 tonnnes)

In 2002 UN statistics…
• U.S. was the largest CO2 emitter (24.3%)
• European Union (15.3%)
• China (14.5%)
• India, Japan and South Korea ranked No.4, 5, and 9 respectively
• Canada ranked No. 8

Fig 15: Per capita CO2 emission (2002)

Fig 16: Sectoral contribution to Greenhouse Gases emission (2000)

Fig 17: Energy consumption and CO2 emission in China
Total Engergy Consumpti on(mi l l i on tons of coal equi val ent)
500
700
900
1100
1300
1500
1700
1900
2100
1977 1980 1983 1986 1989 1992 1995 1998 2001 2004
Per Capita CO2 Emission

Fig 17+: Number of Vehicles for Civilian Use
Number of Vehi cl es f or Ci vi l i an Use(mi l l i on)
02468
1012141618202224262830
1975 1980 1985 1990 1995 2000 2005

Fig 18: Per Capita Carbon Emission and Per Capita Income
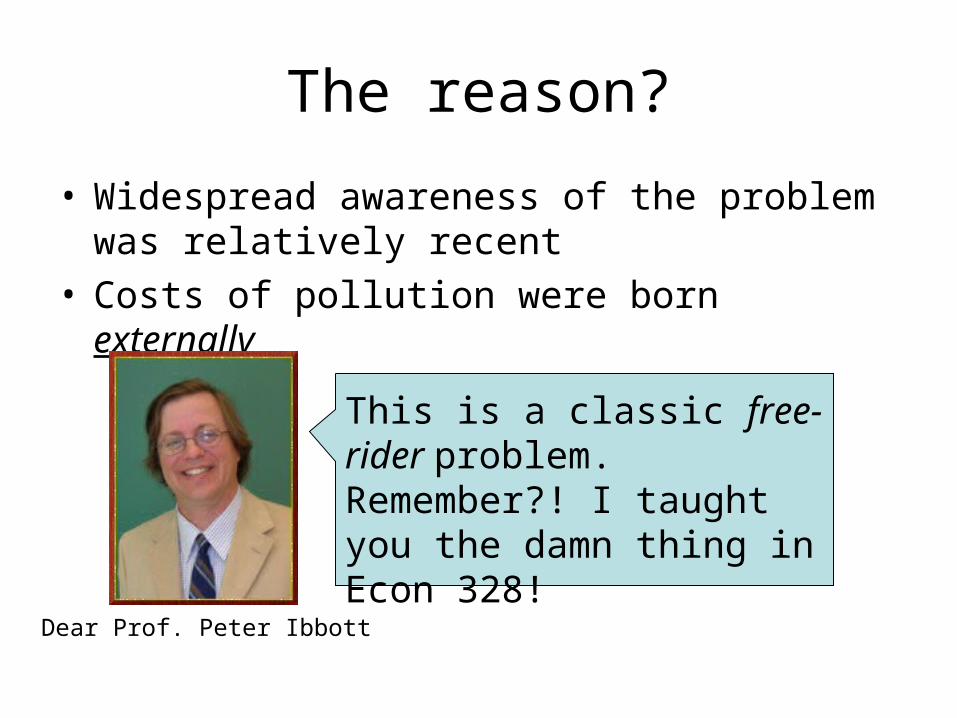
The reason?
• Widespread awareness of the problem was relatively recent
• Costs of pollution were born externally
This is a classic free-rider problem.Remember?! I taught you the damn thing in Econ 328!
Dear Prof. Peter Ibbott
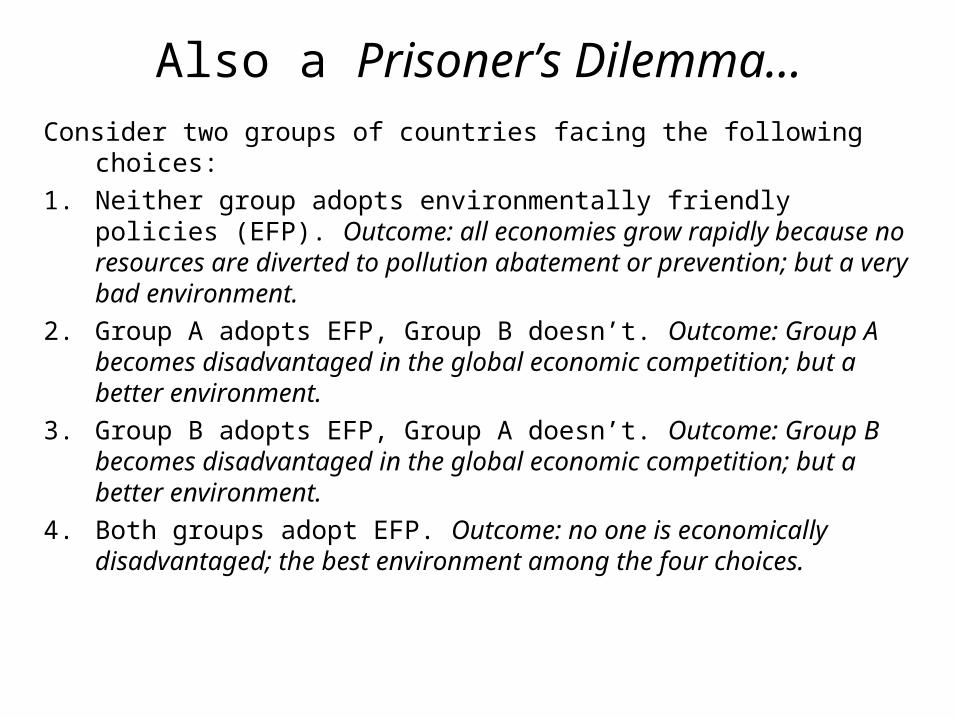
Also a Prisoner’s Dilemma…Consider two groups of countries facing the following choices:
1. Neither group adopts environmentally friendly policies (EFP). Outcome: all economies grow rapidly because no resources are diverted to pollution abatement or prevention; but a very bad environment.
2. Group A adopts EFP, Group B doesn’t. Outcome: Group A becomes disadvantaged in the global economic competition; but a better environment.
3. Group B adopts EFP, Group A doesn’t. Outcome: Group B becomes disadvantaged in the global economic competition; but a better environment.
4. Both groups adopt EFP. Outcome: no one is economically disadvantaged; the best environment among the four choices.

Solution…
• A coercive authority or a third-party organization, e.g. government and the UN
• Kyoto Protocol– To stabilize CO2 and five other Greenhouse
Gases concentration in the atmosphere at a level that would prevent dangerous anthropogenic interference with the climate system.

Fig 19: Kyoto Protocol Participation

Under Kyoto Protocol…
• Developed countries– Obligated to reduce GHG emission to a
certain level by 2012
• Developing countries (including China)– Do not have the obligation of emission
reduction

CO2 pollution in the near future…
• Not so optimistic:
• China has passed the EU and become the second largest CO2 emitter in the world
• China is building one coal-fired power plant every week (unsubstantiated)
• Not China’s fault? (yet to be evidenced)
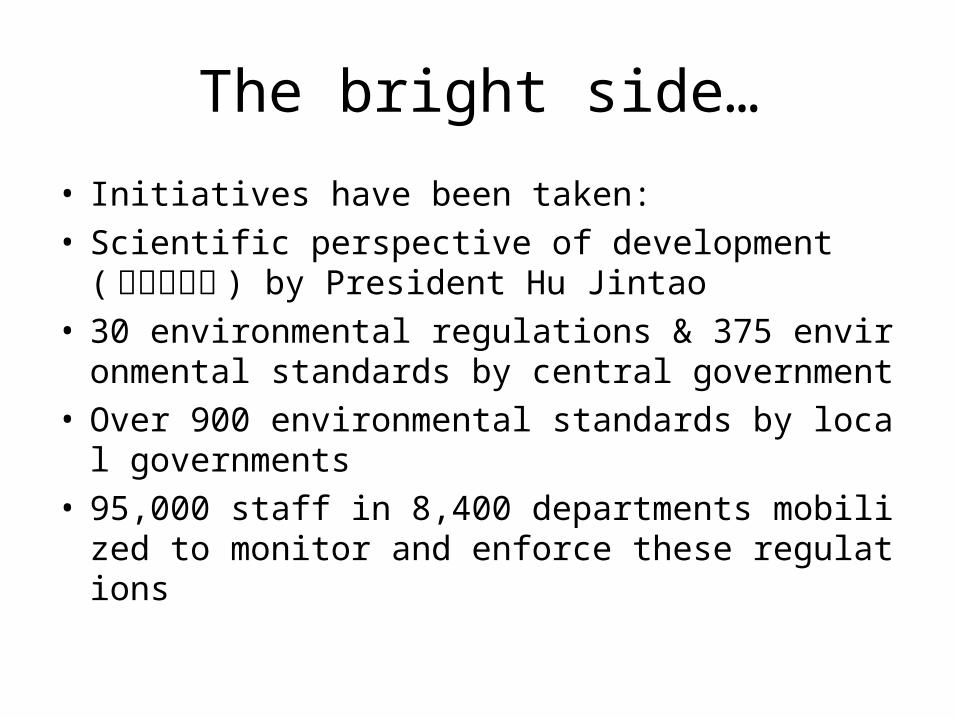
The bright side…
• Initiatives have been taken:• Scientific perspective of development (科学发展观 ) by President Hu Jintao
• 30 environmental regulations & 375 environmental standards by central government
• Over 900 environmental standards by local governments
• 95,000 staff in 8,400 departments mobilized to monitor and enforce these regulations

Concluding remarks
• Al Gore in An Inconvenient Truth: “We got everything we need [to better our environment], save perhaps, political will…”
• A will to even sacrifice the current relative economic advantage
• The environmental issue is not an economic issue so much as a political issue

A better environment…
We hope that, with their excellence in leadership and
statesmanship, the political leaders in the world will make
this happen. And we’re counting on them.

THE ENDTHANK YOU!