atmospheric pollution research - core
TRANSCRIPT
Atmospheric Pollution Research 2 (2011) 492 505
Atmospheric Pollution Research www.atmospolres.com
Source apportionment of particulate organic compounds in a ruralarea of Spain by positive matrix factorization
Oscar Pindado, Rosa M. Perez
Chemistry Division, Department of Technology, CIEMAT. Av. Complutense 22, 28040 Madrid, Spain
ABSTRACT
This study was conducted in order to identify possible sources and to estimate their contribution to particulatematter in a rural area. For this purpose, a commonly used receptor model, positive matrix factorization (PMF), wasapplied to a PM2.5 data set collected in a rural area of Madrid (Spain) between May 2004 and April 2005. A total ofeighty nine samples were gathered. Chemical composition of particulate matter including major components, traceelements, total carbon, alkanes, PAHs, alcohols and acids were analyzed to study sources of atmospheric aerosolsusing the positive matrix factorization model. This work is characterized by including some organic tracers withinPMF analysis, through which we can get a more accurate source apportionment. To our knowledge, this is the firstwork employing organic tracers for source apportionment by PMF model in a rural area of Spain. To assign PMFfactor with a possible source, authors have based on the presence of tracer species. PMF apportioned the PM2.5
mass into nine factors. The factors included (1) even n–alcohols/acids factor, (2) n–alkanes factor, (3) secondarynitrate factor, (4) secondary sulfate factor, (5) secondary organic aerosol, (6) palmitic/stearic factor, (7) PAHs factor,(8) crustal factor and (9) low molecular weight alcohols/acids factor. Six of these factors are related to primaryemissions and three of them are categorized as secondary aerosol. PMF identified two mixed sources, factor 6identified as cooking /microbial source and factor 9 identified as a mixed source.
Keywords:Atmospheric aerosolOrganic compounds
PM2.5
PMFSource apportionment
Article History:Received: 17 December 2010
Revised: 16 March 2011Accepted: 18 March 2011
Corresponding Author:Oscar Pindado
Tel: +34 91 346 6523Fax: +34 91 346 6121
E mail: [email protected]
© Author(s) 2011. This work is distributed under the Creative Commons Attribution 3.0 License. doi: 10.5094/APR.2011.056
1. Introduction
Organic fraction is a major component of atmosphericparticulate matter, being more significant in rural areas (Alves etal., 2001; Bi et al., 2005; Sharma and Maloo, 2005). As a result,during last years the number of works related to organic fractionhas been increased significantly. This increase was due to thegrowing concern about atmospheric aerosol because theirhazardous effects on human health (WHO, 2003; Perez et al., 2008;Woelz et al., 2010) and as far as its role in global climate change(IPCC, 2007; Haywood et al., 2008; Xu et al., 2010).
Organic fraction of atmospheric aerosol includes thousands ofcompounds, showing some of them a higher interest from theresearch community. In fact, alkanes and PAHs have been widelystudied and there are numerous worldwide works about them (Laoet al., 1973; Lee et al., 1976; Simoneit and Mazurek, 1982; Mendezet al., 1993). Over the years, studies become more widespread,characterizing a larger number of compounds (Gogou et al., 1998;Pio et al., 2001a; Guo et al., 2004). Currently, some authors havecharacterized more than 300 organic compounds associated toparticulate matter (Oliveira et al., 2007).
In order to reduce harmful effects of particulate matter, andtherefore to increase air quality, two premises are needed: Thecomposition of the particulate matter must be fully disclosed andemissions of particulate matter must be controlled in their origin.Thereby we can identify the most hazardous compounds to humanhealth, identifying their origin and reducing emissions wherepossible. During the last years, the organic fraction of aerosols hasbeen widely analyzed and as a result, a greater number of species
has been identified (Kourtchev et al., 2008; Agarwal et al., 2010;Alves at al., 2010; Ladji et al., 2010). On the other hand, manysources of organic aerosols have also been identified. Amongthem, anthropogenic sources include fossil fuel combustion, coaland wood burning, meat cooking, cigarette smoke, agriculturedebris and resuspension of soil particles, while emission of plantswax, fungi, bacteria, pollen, algae and natural combustionprocesses as wildfires and volcano eruptions are the main naturalsources (Bi et al., 2002; Brown et al., 2002; Cincinelli et al., 2003; Biet al., 2005; Dutton et al., 2010; Harrison and Yin, 2010; Pey et al.,2010).
Many studies have been conducted using statistical methods,such as factor analysis (FA), principal component analysis (PCA),chemical mass balance (CMB) and lately, positive matrixfactorization (PMF) with the only aim of identifying sources ofparticulate matter. However, few studies have performed a sourceapportionment methodology incorporating organic molecularmarker data due to the time and effort required to collect a longenough time series of detailed measurements and uncertaintiesassociated.
One of the most important advantages of PMF is the inclusionof uncertainties in the model that allows us to apply differentweights to different variables, taking into consideration the lack ofprecision of the analytical methods; thus it selects only rotatedsolutions with positive contributions from the sources. Otheradvantage is that PMF can identify particulate matter sources andprovide the contribution of each source in absence of priorinformation on sources. Also PMF identifies and quantifies sourcesrelatively faster than other models such as CMB and PCA.
brought to you by COREView metadata, citation and similar papers at core.ac.uk
provided by Elsevier - Publisher Connector
Pindado and Perez – Atmospheric Pollution Research 2 (2011) 492 505 493
In light of the above, this study has two different aims: firstlyto characterize the particulate fraction of atmospheric aerosol in arural area and secondly to identify sources of PM according tochemical characterization. PMF model was chosen because this isthe first study accomplished in this area and therefore there is noprior information about sources. Thus, chemical composition of89 samples of PM2.5 collected over 1 year has been used in order toestimate the fine aerosol sources and their contributions. Also,meteorological parameters and gaseous species were included toassist interpretation of the source factors.
2. Experimental
2.1. Samples collection and analysis
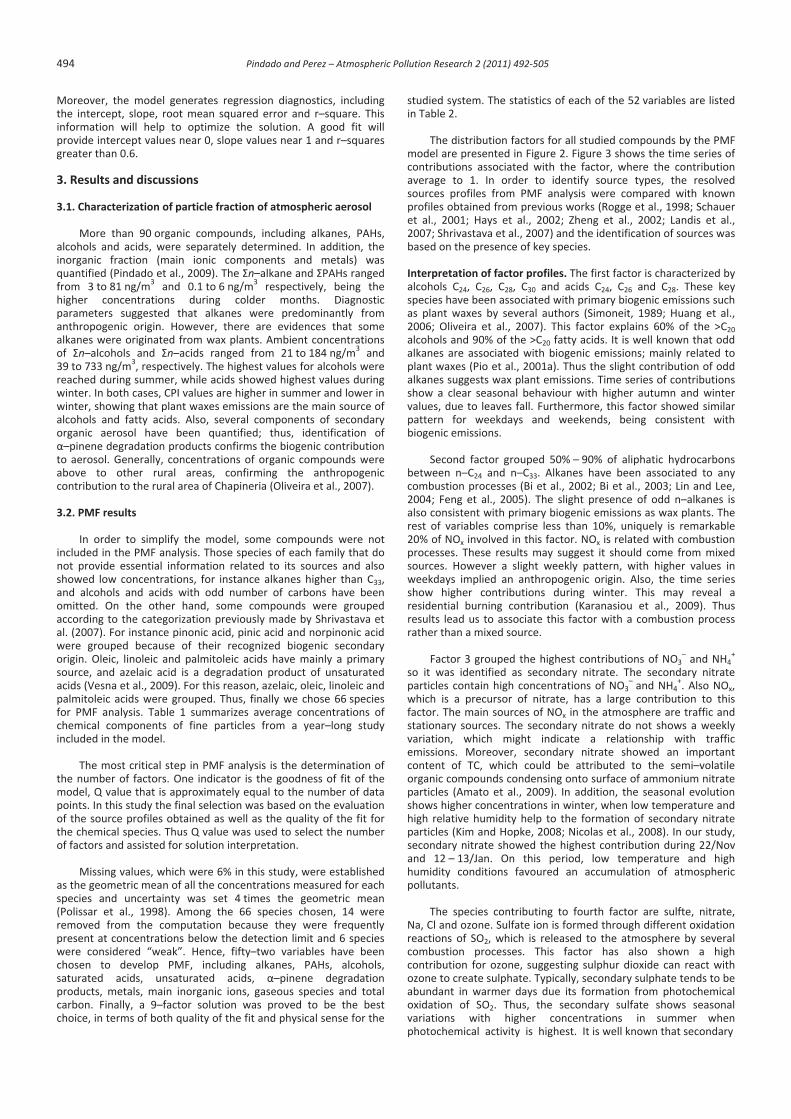
Sampling took place in Chapinería (altitude: 675 meters oversea level; latitude: 40° 22’ 45’’ North; longitude: 4° 12’ 15’’ West).Chapineria is a little town located 50 km from Madrid and has lessthan 2 000 inhabitants (Figure 1). Sampling area is surrounded byQuercus ilex forest and there are not significant industrial activitiesaround it. For these reasons, this site is considered as a rural area.This region, as same as all Iberian Peninsula, is influenced by long–range transport processes of desert dust from North Africa.
Figure 1.Map of the sampling site.
Particulate matter was collected using a high volume samplerwith quartz filters, previously baked out. Measurements weretaken between May 2004 and April 2005. Two samples wereconsecutively collected each seven days. Sampling duration was24 h. Eighty nine samples were collected. Field blank filters werealso collected to subtract concentrations due to adsorption of gas–phase organic components onto the quartz filter during and aftersampling. Concentrations measured in blanks were negligibleexcept for stearic acid and palmitic acid.
For each sample, PM2.5 mass concentration and chemicalcomposition were obtained. The analysis was separatelyperformed for organic and inorganic fractions. For this purpose,filters were cut into two subsamples. The analytical proceduresfollowed for the analysis of these species has been alreadypublished (Pindado et al., 2009). Briefly, ionic components, such asSO4
2–, NO3–, NO2
–, Cl–, Na+, K+, NH4+, Ca2+ and Mg2+ were leached
with water and analyzed by ion chromatography (IC). On the otherhand, an acid digestion with HNO3 and HCl was performed and24 trace elements were analyzed by Inductively CoupledPlasma/Mass Spectrometry (ICP/MS) and Atomic Absorption. Totalcarbon was determined by combustion elemental analysis. In orderto analyze organic composition, filters were Soxhlet extracted withCH2Cl2/Acetone 3:1 mixture, extracts were purified via sequentialelution through a glass column packed with 1.5 g of silica gel using
solvents of increasing polarity. Four fractions were eluted toprovide a separate chromatographic analyses; alkanes, alcoholsand acids were subject to gas chromatographic–massspectrometric (GC–MS) analysis, performing a derivatization withN,O–bis–(thrimethylsilyl)–trifluoracetamide (BSTFA) for polarcompounds, meanwhile PAHs were submitted to high performanceliquid chromatography (HPLC) with fluorescence detector. Also,two gaseous species, NOx and ozone, were continuously measuredby Chemiluminescence and UV absorption respectively, andincluded into PMF analysis.
Uncertainties associated with organic compounds werecalculated individually. Briefly, five sources of uncertainties wereidentified: sampling, extraction, clean–up, derivatization andanalysis, being extraction stage the highest contributor touncertainty, mainly for polar species. As a result, combineduncertainty ranged from 10 to 18% for alkanes, 12 – 16% for PAHs,10 – 18% for alcohols and 9 – 21% for acids (Pindado et al., 2010).Uncertainties of inorganic compounds were calculated identifyingthree main sources: sampling, extraction and analysis. For thesevariables, uncertainties ranged from 5 to 10%.
2.2. PMF description
The PMF model was developed by Paatero at the University ofHelsinki in Finland in the mid 1990s (Paatero, 1997; Paatero, 1999).PMF assumes that concentrations at receptor sites are impacted bylinear combinations of source emissions, which are derived asfactors in the model. Thus, model supposes there are p sourcesimpacting a receptor, and linear combinations of the impacts fromthe p sources give rise to the observed concentrations of thevarious species. Mathematically can be written as:
pij ik kj ijk 1
X G F E (1)
where Xij is the (i x j) matrix of ambient concentrations of j specieson the i days, Gik is the (i x k) matrix of sources contributions ofk factors on i days, Fkj is the (k x j) matrix of source profiles ofk factors that is species j, and Eij is the (i x j) matrix of residuals notfitted by the model. The task of PMF model is to minimize the Qfunction using constrained, weighted least–squares. This functionis defined as:
2pn mij ik kjk 1
iji 1 j 1
X G FQ
S(2)
where Sij is an uncertainty estimate in the j species measured onthe i days.
To perform the PMF model, a qualitative knowledge of thesources is only required, however PMF model also has limitationssuch as inability to clearly separate covariant sources. It isremarkable that PMF factors only reveal species temporally covaryand thus the model will group them. However, temporal variabilityof a pollutant concentration is not solely determined by changes inemissions, as PMF model assumes, so we should not link thefactors to source profiles directly, although many studies refer thePMF factors as sources.
PMF requires two input files, one file with the concentrationsand one with the uncertainties associated with thoseconcentrations. The selection of modelling parameters andnumber of factors is not straightforward and is still largely affectedby the experience of authors (Paatero and Hopke, 2003).
EPA PMF1.1 was downloaded from the US EPA website(http://www.epa.gov/heasd/products/pmf/pmf.html) and used forthe current analysis. This first version of the model determinessignal–to–noise ratio (s/n) statistics for every input species.
Madrid
Chapinería
100 km 300 km 500 km
494 Pindado and Perez – Atmospheric Pollution Research 2 (2011) 492 505
Moreover, the model generates regression diagnostics, includingthe intercept, slope, root mean squared error and r–square. Thisinformation will help to optimize the solution. A good fit willprovide intercept values near 0, slope values near 1 and r–squaresgreater than 0.6.
3. Results and discussions
3.1. Characterization of particle fraction of atmospheric aerosol
More than 90 organic compounds, including alkanes, PAHs,alcohols and acids, were separately determined. In addition, theinorganic fraction (main ionic components and metals) wasquantified (Pindado et al., 2009). The n–alkane and PAHs rangedfrom 3 to 81 ng/m3 and 0.1 to 6 ng/m3 respectively, being thehigher concentrations during colder months. Diagnosticparameters suggested that alkanes were predominantly fromanthropogenic origin. However, there are evidences that somealkanes were originated from wax plants. Ambient concentrationsof n–alcohols and n–acids ranged from 21 to 184 ng/m3 and39 to 733 ng/m3, respectively. The highest values for alcohols werereached during summer, while acids showed highest values duringwinter. In both cases, CPI values are higher in summer and lower inwinter, showing that plant waxes emissions are the main source ofalcohols and fatty acids. Also, several components of secondaryorganic aerosol have been quantified; thus, identification of–pinene degradation products confirms the biogenic contribution
to aerosol. Generally, concentrations of organic compounds wereabove to other rural areas, confirming the anthropogeniccontribution to the rural area of Chapineria (Oliveira et al., 2007).
3.2. PMF results
In order to simplify the model, some compounds were notincluded in the PMF analysis. Those species of each family that donot provide essential information related to its sources and alsoshowed low concentrations, for instance alkanes higher than C33,and alcohols and acids with odd number of carbons have beenomitted. On the other hand, some compounds were groupedaccording to the categorization previously made by Shrivastava etal. (2007). For instance pinonic acid, pinic acid and norpinonic acidwere grouped because of their recognized biogenic secondaryorigin. Oleic, linoleic and palmitoleic acids have mainly a primarysource, and azelaic acid is a degradation product of unsaturatedacids (Vesna et al., 2009). For this reason, azelaic, oleic, linoleic andpalmitoleic acids were grouped. Thus, finally we chose 66 speciesfor PMF analysis. Table 1 summarizes average concentrations ofchemical components of fine particles from a year–long studyincluded in the model.
The most critical step in PMF analysis is the determination ofthe number of factors. One indicator is the goodness of fit of themodel, Q value that is approximately equal to the number of datapoints. In this study the final selection was based on the evaluationof the source profiles obtained as well as the quality of the fit forthe chemical species. Thus Q value was used to select the numberof factors and assisted for solution interpretation.
Missing values, which were 6% in this study, were establishedas the geometric mean of all the concentrations measured for eachspecies and uncertainty was set 4 times the geometric mean(Polissar et al., 1998). Among the 66 species chosen, 14 wereremoved from the computation because they were frequentlypresent at concentrations below the detection limit and 6 specieswere considered “weak”. Hence, fifty–two variables have beenchosen to develop PMF, including alkanes, PAHs, alcohols,saturated acids, unsaturated acids, –pinene degradationproducts, metals, main inorganic ions, gaseous species and totalcarbon. Finally, a 9–factor solution was proved to be the bestchoice, in terms of both quality of the fit and physical sense for the
studied system. The statistics of each of the 52 variables are listedin Table 2.
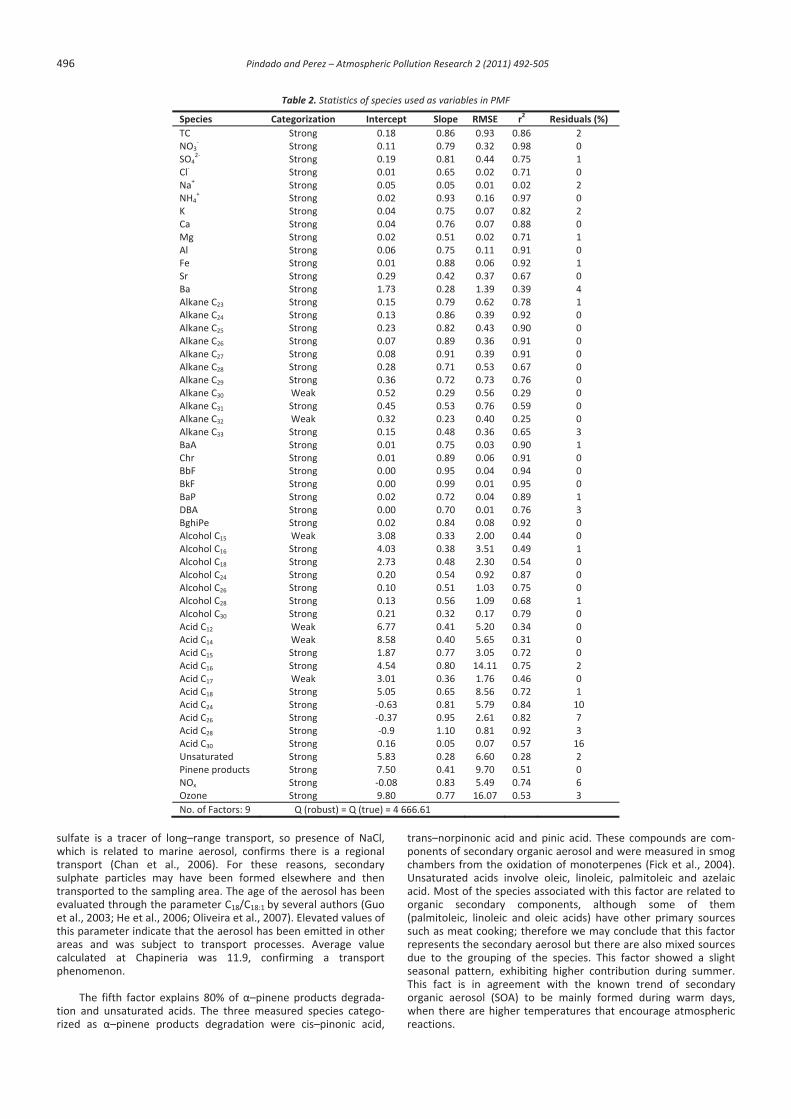
The distribution factors for all studied compounds by the PMFmodel are presented in Figure 2. Figure 3 shows the time series ofcontributions associated with the factor, where the contributionaverage to 1. In order to identify source types, the resolvedsources profiles from PMF analysis were compared with knownprofiles obtained from previous works (Rogge et al., 1998; Schaueret al., 2001; Hays et al., 2002; Zheng et al., 2002; Landis et al.,2007; Shrivastava et al., 2007) and the identification of sources wasbased on the presence of key species.
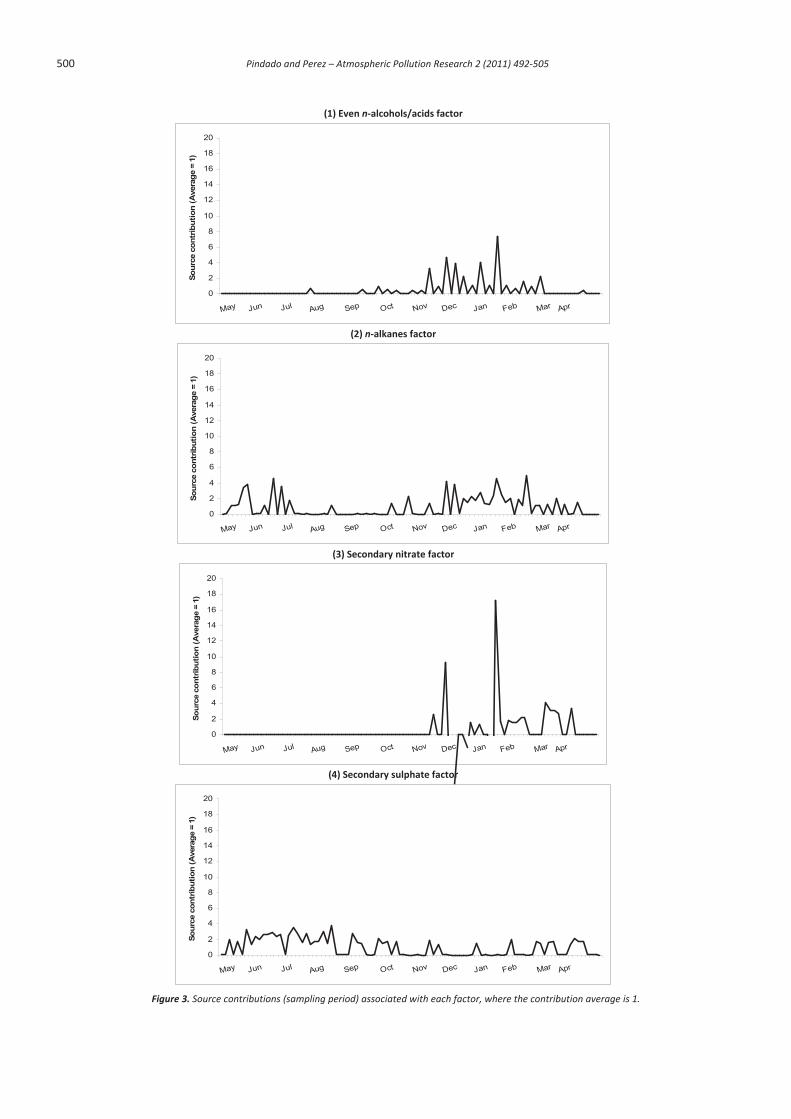
Interpretation of factor profiles. The first factor is characterized byalcohols C24, C26, C28, C30 and acids C24, C26 and C28. These keyspecies have been associated with primary biogenic emissions suchas plant waxes by several authors (Simoneit, 1989; Huang et al.,2006; Oliveira et al., 2007). This factor explains 60% of the >C20alcohols and 90% of the >C20 fatty acids. It is well known that oddalkanes are associated with biogenic emissions; mainly related toplant waxes (Pio et al., 2001a). Thus the slight contribution of oddalkanes suggests wax plant emissions. Time series of contributionsshow a clear seasonal behaviour with higher autumn and wintervalues, due to leaves fall. Furthermore, this factor showed similarpattern for weekdays and weekends, being consistent withbiogenic emissions.
Second factor grouped 50% – 90% of aliphatic hydrocarbonsbetween n–C24 and n–C33. Alkanes have been associated to anycombustion processes (Bi et al., 2002; Bi et al., 2003; Lin and Lee,2004; Feng et al., 2005). The slight presence of odd n–alkanes isalso consistent with primary biogenic emissions as wax plants. Therest of variables comprise less than 10%, uniquely is remarkable20% of NOx involved in this factor. NOx is related with combustionprocesses. These results may suggest it should come from mixedsources. However a slight weekly pattern, with higher values inweekdays implied an anthropogenic origin. Also, the time seriesshow higher contributions during winter. This may reveal aresidential burning contribution (Karanasiou et al., 2009). Thusresults lead us to associate this factor with a combustion processrather than a mixed source.
Factor 3 grouped the highest contributions of NO3– and NH4
+
so it was identified as secondary nitrate. The secondary nitrateparticles contain high concentrations of NO3
– and NH4+. Also NOx,
which is a precursor of nitrate, has a large contribution to thisfactor. The main sources of NOx in the atmosphere are traffic andstationary sources. The secondary nitrate do not shows a weeklyvariation, which might indicate a relationship with trafficemissions. Moreover, secondary nitrate showed an importantcontent of TC, which could be attributed to the semi–volatileorganic compounds condensing onto surface of ammonium nitrateparticles (Amato et al., 2009). In addition, the seasonal evolutionshows higher concentrations in winter, when low temperature andhigh relative humidity help to the formation of secondary nitrateparticles (Kim and Hopke, 2008; Nicolas et al., 2008). In our study,secondary nitrate showed the highest contribution during 22/Novand 12 – 13/Jan. On this period, low temperature and highhumidity conditions favoured an accumulation of atmosphericpollutants.
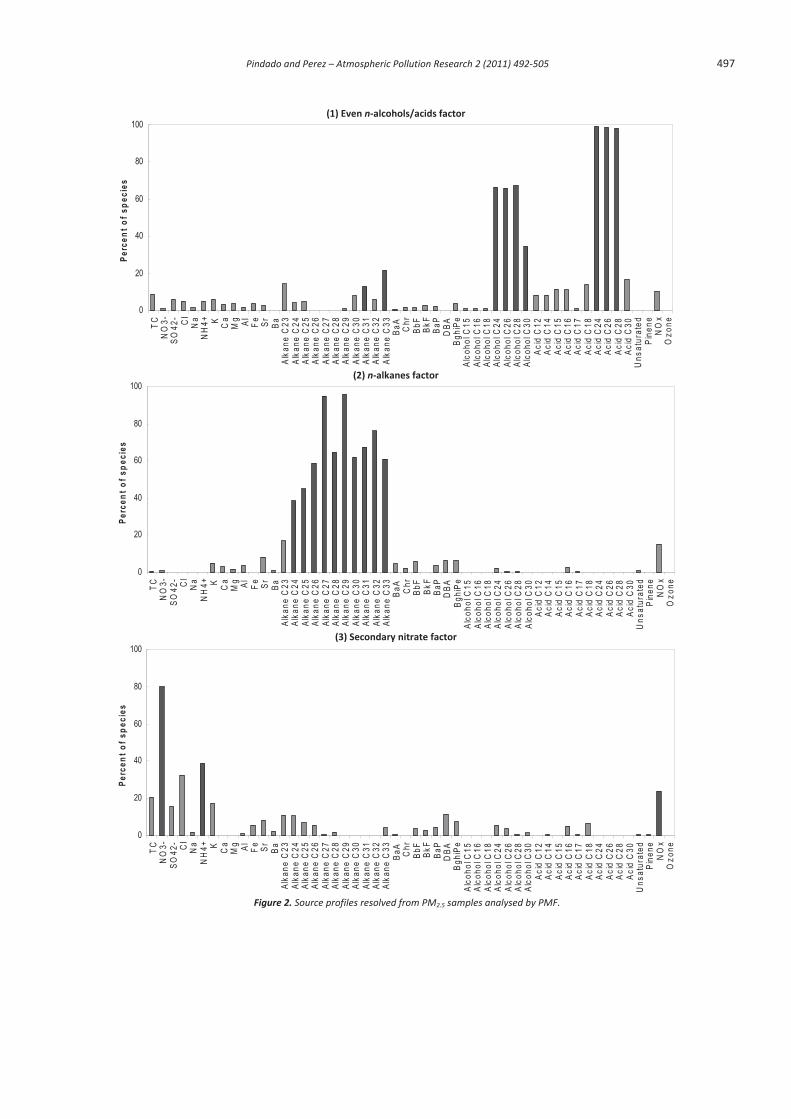
The species contributing to fourth factor are sulfte, nitrate,Na, Cl and ozone. Sulfate ion is formed through different oxidationreactions of SO2, which is released to the atmosphere by severalcombustion processes. This factor has also shown a highcontribution for ozone, suggesting sulphur dioxide can react withozone to create sulphate. Typically, secondary sulphate tends to beabundant in warmer days due its formation from photochemicaloxidation of SO2. Thus, the secondary sulfate shows seasonalvariations with higher concentrations in summer whenphotochemical activity is highest. It is well known that secondary
Pindado and Perez – Atmospheric Pollution Research 2 (2011) 492 505 495
Table 1. Average, standard deviation, maximum and minimum for each of the variables used in the PMF analysis
Species AverageStandarddeviation
Maximum Minimum BDL (%) bMissing value
(%)Particles ( g/m3) PM2.5 16.9 11.0 64.1 3.1 0 0
TC 4.0 2.7 16.6 0.03 0 0Ion components NO3 1.1 2.7 17.6 0.02 0 0( g/m3) SO4
2 1.8 0.9 4.3 0.02 0 0Cl 0.05 0.04 0.31 0.01 3 0Na+ 0.1 0.0 0.3 0.02 0 0NH4
+ 0.9 0.9 6.5 0.02 0 0Elements K 0.1 0.1 0.5 0.02 2 0( g/m3) Ca 0.3 0.3 1.5 0.04 0 0
Mg 0.0 0.0 0.1 0.02 18 0Al 0.1 0.2 0.8 0.02 0 0Fe 0.2 0.2 1.0 0.02 0 0Pb a 5.5 6.2 43.8 0.8 1 30Sr a 1.3 1.4 6.0 0.2 1 0Zn a 28.7 17.3 85.0 7.7 0 0Ba a 4.5 4.0 23.4 0.8 0 0Cu a 38.2 25.9 149.0 4.0 0 0Ni a 2.1 1.8 7.1 0.4 18 30
Gases NOx 13.8 11.1 65.7 1.04 0 0( g/m3) Ozone 64.9 23.6 116.4 8.89 0 0AHs Alkane C23 2.0 1.5 7.9 0.1 0 0(ng/m3) Alkane C24 2.0 1.5 8.3 0.2 0 0
Alkane C25 2.1 1.5 9.1 0.1 0 0Alkane C26 1.7 1.3 6.1 0.0 0 0Alkane C27 1.8 1.4 6.5 0.1 0 0Alkane C28 1.3 1.1 6.8 0.1 2 0Alkane C29 2.0 1.8 9.2 0.1 1 0Alkane C30 1.0 1.2 10.6 0.0 6 0Alkane C31 1.6 1.7 11.0 0.1 8 0Alkane C32 0.6 1.0 8.7 0.0 10 0Alkane C33 0.9 1.1 5.3 0.0 17 0Fitane 1.1 0.5 2.9 0.4 14 17Pristane 0.8 0.5 3.4 0.1 4 17
PAHs F 3 3 21 0.2 24 14(pg/m3) Ph 74 53 366 4 2 14
An 8 25 214 0.2 11 14Fl 96 67 391 10 7 14Py 190 209 1 054 9 3 14BaA 98 122 621 7 2 14Chr 217 211 941 18 2 14BbF 162 171 844 3 1 14BkF 59 69 344 4 6 14BaP 115 179 1 056 3 2 14DBA 19 22 102 0.4 26 14
BghiPe 256 339 1 871 6 1 14Alcohols Alcohol C14 25.4 13.2 65.1 0.3 0 2(ng/m3) Alcohol C15 4.7 5.3 19.8 0.3 50 2
Alcohol C16 9.9 9.0 43.2 0.2 18 2Alcohol C18 7.2 5.1 19.5 0.3 9 2Alcohol C24 3.1 5.1 27.2 0.1 36 2Alcohol C26 4.3 7.2 46.5 0.2 41 2Alcohol C28 3.3 3.4 18.3 0.3 51 2Alcohol C30 1.7 1.6 6.9 0.1 73 2
Acids Acid C12 15.6 8.9 47.6 1.4 0 4(ng/m3) Acid C13 5.1 5.0 25.2 0.1 11 4
Acid C14 18.0 9.5 59.1 2.6 0 4Acid C15 10.7 6.4 26.2 0.1 9 4Acid C16 56.5 57.0 404.4 0.1 1 4Acid C17 4.7 4.5 19.3 0.1 37 4Acid C18 25.8 27.9 203.4 0.1 13 4Acid C24 16.4 20.4 101.8 0.7 47 4Acid C26 8.1 7.4 35.0 0.6 58 4Acid C28 3.8 3.0 14.9 1.3 61 4Acid C30 2.9 2.0 8.3 1.1 73 4
Unsaturated c 14.6 20.3 114.5 0.1 32 7Pinene
products d27.3 31.2 179.0 1.6 9 7
a (ng/m3)b Below Detection Limitc Unsaturated: palmitoleic acid, linoleic acid, oleic acid, azelaic acidd Pinene products: pinic acid, pinonic acid, norpinonic acid
496 Pindado and Perez – Atmospheric Pollution Research 2 (2011) 492 505
Table 2. Statistics of species used as variables in PMF
Species Categorization Intercept Slope RMSE r2 Residuals (%)TC Strong 0.18 0.86 0.93 0.86 2NO3 Strong 0.11 0.79 0.32 0.98 0SO4
2 Strong 0.19 0.81 0.44 0.75 1Cl Strong 0.01 0.65 0.02 0.71 0Na+ Strong 0.05 0.05 0.01 0.02 2NH4
+ Strong 0.02 0.93 0.16 0.97 0K Strong 0.04 0.75 0.07 0.82 2Ca Strong 0.04 0.76 0.07 0.88 0Mg Strong 0.02 0.51 0.02 0.71 1Al Strong 0.06 0.75 0.11 0.91 0Fe Strong 0.01 0.88 0.06 0.92 1Sr Strong 0.29 0.42 0.37 0.67 0Ba Strong 1.73 0.28 1.39 0.39 4Alkane C23 Strong 0.15 0.79 0.62 0.78 1Alkane C24 Strong 0.13 0.86 0.39 0.92 0Alkane C25 Strong 0.23 0.82 0.43 0.90 0Alkane C26 Strong 0.07 0.89 0.36 0.91 0Alkane C27 Strong 0.08 0.91 0.39 0.91 0Alkane C28 Strong 0.28 0.71 0.53 0.67 0Alkane C29 Strong 0.36 0.72 0.73 0.76 0Alkane C30 Weak 0.52 0.29 0.56 0.29 0Alkane C31 Strong 0.45 0.53 0.76 0.59 0Alkane C32 Weak 0.32 0.23 0.40 0.25 0Alkane C33 Strong 0.15 0.48 0.36 0.65 3BaA Strong 0.01 0.75 0.03 0.90 1Chr Strong 0.01 0.89 0.06 0.91 0BbF Strong 0.00 0.95 0.04 0.94 0BkF Strong 0.00 0.99 0.01 0.95 0BaP Strong 0.02 0.72 0.04 0.89 1DBA Strong 0.00 0.70 0.01 0.76 3BghiPe Strong 0.02 0.84 0.08 0.92 0Alcohol C15 Weak 3.08 0.33 2.00 0.44 0Alcohol C16 Strong 4.03 0.38 3.51 0.49 1Alcohol C18 Strong 2.73 0.48 2.30 0.54 0Alcohol C24 Strong 0.20 0.54 0.92 0.87 0Alcohol C26 Strong 0.10 0.51 1.03 0.75 0Alcohol C28 Strong 0.13 0.56 1.09 0.68 1Alcohol C30 Strong 0.21 0.32 0.17 0.79 0Acid C12 Weak 6.77 0.41 5.20 0.34 0Acid C14 Weak 8.58 0.40 5.65 0.31 0Acid C15 Strong 1.87 0.77 3.05 0.72 0Acid C16 Strong 4.54 0.80 14.11 0.75 2Acid C17 Weak 3.01 0.36 1.76 0.46 0Acid C18 Strong 5.05 0.65 8.56 0.72 1Acid C24 Strong 0.63 0.81 5.79 0.84 10Acid C26 Strong 0.37 0.95 2.61 0.82 7Acid C28 Strong 0.9 1.10 0.81 0.92 3Acid C30 Strong 0.16 0.05 0.07 0.57 16Unsaturated Strong 5.83 0.28 6.60 0.28 2Pinene products Strong 7.50 0.41 9.70 0.51 0NOx Strong 0.08 0.83 5.49 0.74 6Ozone Strong 9.80 0.77 16.07 0.53 3No. of Factors: 9 Q (robust) = Q (true) = 4 666.61
sulfate is a tracer of long–range transport, so presence of NaCl,which is related to marine aerosol, confirms there is a regionaltransport (Chan et al., 2006). For these reasons, secondarysulphate particles may have been formed elsewhere and thentransported to the sampling area. The age of the aerosol has beenevaluated through the parameter C18/C18:1 by several authors (Guoet al., 2003; He et al., 2006; Oliveira et al., 2007). Elevated values ofthis parameter indicate that the aerosol has been emitted in otherareas and was subject to transport processes. Average valuecalculated at Chapineria was 11.9, confirming a transportphenomenon.
The fifth factor explains 80% of –pinene products degradation and unsaturated acids. The three measured species categorized as –pinene products degradation were cis–pinonic acid,
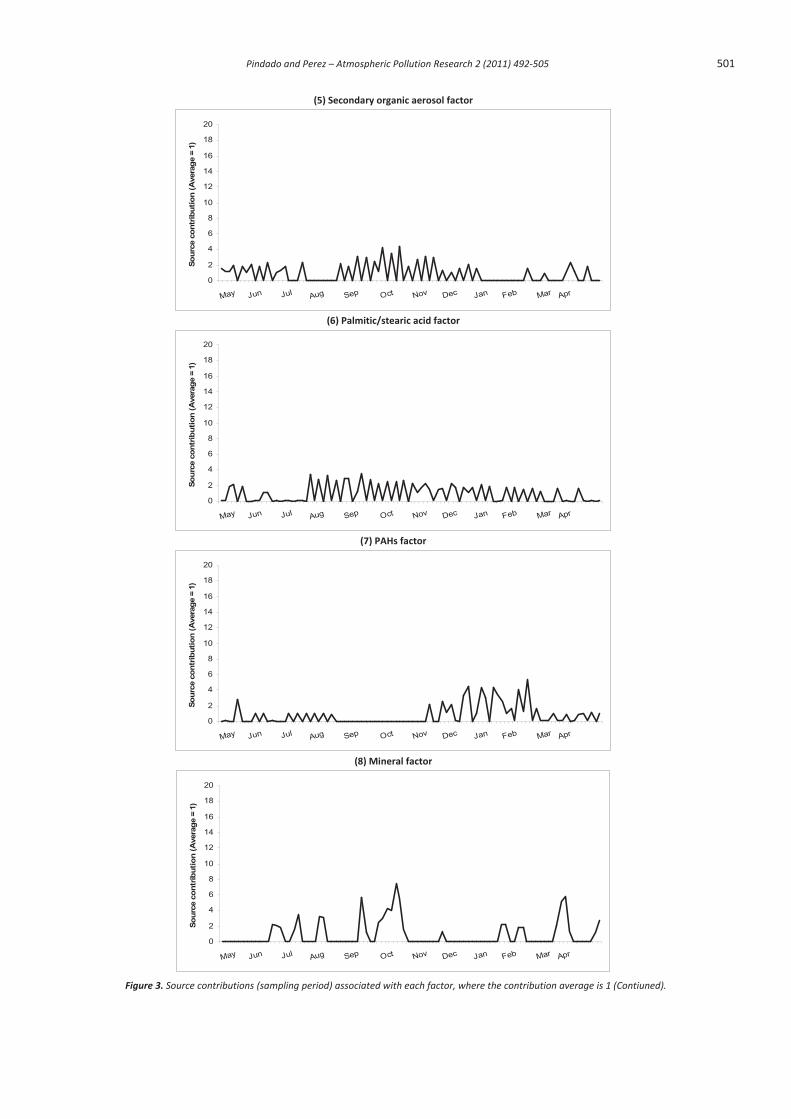
trans–norpinonic acid and pinic acid. These compounds are components of secondary organic aerosol and were measured in smogchambers from the oxidation of monoterpenes (Fick et al., 2004).Unsaturated acids involve oleic, linoleic, palmitoleic and azelaicacid. Most of the species associated with this factor are related toorganic secondary components, although some of them(palmitoleic, linoleic and oleic acids) have other primary sourcessuch as meat cooking; therefore we may conclude that this factorrepresents the secondary aerosol but there are also mixed sourcesdue to the grouping of the species. This factor showed a slightseasonal pattern, exhibiting higher contribution during summer.This fact is in agreement with the known trend of secondaryorganic aerosol (SOA) to be mainly formed during warm days,when there are higher temperatures that encourage atmosphericreactions.
Pindado and Perez – Atmospheric Pollution Research 2 (2011) 492 505 497
(1) Even n alcohols/acids factor
(2) n alkanes factor
(3) Secondary nitrate factor
Figure 2. Source profiles resolved from PM2.5 samples analysed by PMF.
0
20
40
60
80
100
TC
NO
3-S
O42
- Cl
Na
NH
4+ K Ca
Mg Al
Fe Sr
Ba
Alk
ane
C23
Alk
ane
C24
Alk
ane
C25
Alk
ane
C26
Alk
ane
C27
Alk
ane
C28
Alk
ane
C29
Alk
ane
C30
Alk
ane
C31
Alk
ane
C32
Alk
ane
C33
BaA C
hrB
bF BkF
BaP
DB
AB
ghiP
eA
lcoh
ol C
15A
lcoh
ol C
16A
lcoh
ol C
18A
lcoh
ol C
24A
lcoh
ol C
26A
lcoh
ol C
28A
lcoh
ol C
30A
cid
C12
Aci
d C
14A
cid
C15
Aci
d C
16A
cid
C17
Aci
d C
18A
cid
C24
Aci
d C
26A
cid
C28
Aci
d C
30U
nsat
urat
edP
inen
eN
Ox
Ozo
ne
Perc
ent o
f spe
cies
498 Pindado and Perez – Atmospheric Pollution Research 2 (2011) 492 505
(4) Secondary sulphate factor
(5) Secondary organic aerosol factor
(6) Palmitic/stearic acid factor
Figure 2. Source profiles resolved from PM2.5 samples analysed by PMF (Continued).
0
20
40
60
80
100
TC
NO
3-S
O42
- Cl
Na
NH
4+ K Ca
Mg Al
Fe Sr
Ba
Alk
ane
C23
Alk
ane
C24
Alk
ane
C25
Alk
ane
C26
Alk
ane
C27
Alk
ane
C28
Alk
ane
C29
Alk
ane
C30
Alk
ane
C31
Alk
ane
C32
Alk
ane
C33
BaA C
hrB
bF BkF
BaP
DB
AB
ghiP
eA
lcoh
ol C
15A
lcoh
ol C
16A
lcoh
ol C
18A
lcoh
ol C
24A
lcoh
ol C
26A
lcoh
ol C
28A
lcoh
ol C
30A
cid
C12
Aci
d C
14A
cid
C15
Aci
d C
16A
cid
C17
Aci
d C
18A
cid
C24
Aci
d C
26A
cid
C28
Aci
d C
30U
nsat
urat
edP
inen
eN
Ox
Ozo
ne
Perc
ent o
f spe
cies
Pindado and Perez – Atmospheric Pollution Research 2 (2011) 492 505 499
(7) PAHs factor
(8) Mineral factor
(9) Low molecular weight alcohols/acids factor
Figure 2. Source profiles resolved from PM2.5 samples analysed by PMF (Continued).
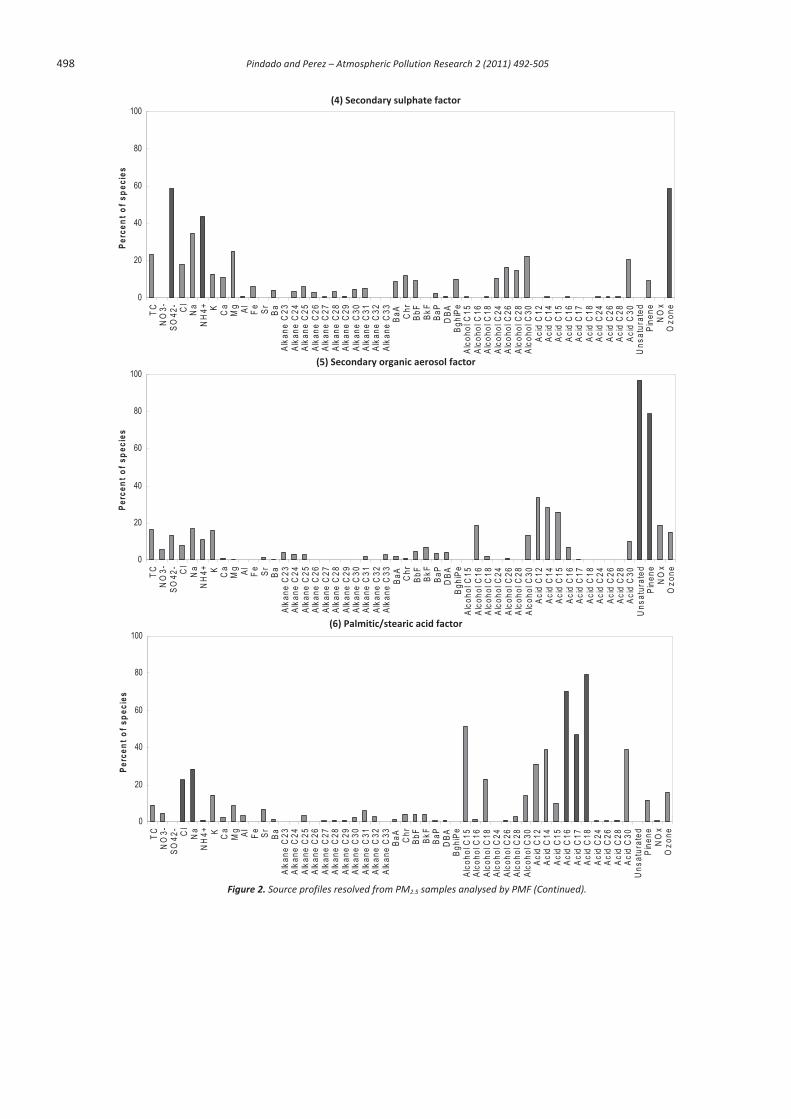
The sixth factor was dominated by palmitic and stearic acids.Both compounds are elevated in source profiles such as seed oil,meat cooking (Dutton et al., 2010) and other primary sources astraffic emissions or microbial sources. Also, high contributions ofacids and alcohols with less than 20 atoms of carbon are related tomicrobial sources (Simoneit and Mazurek, 1982; Yue and Fraser,2004). The occurrence of NaCl in this factor might also confirmcooking emissions. This factor does not show a clear seasonality,which points to cooking emissions rather than traffic emissions.However, since important tracers to apportion cooking emissions
were not analyzed, it is very difficult to link this factor to cookingemission so authors have decided to assign this as a mixed factor:cooking and microbial sources.
Factor 7 describes 60% – 80% of most PAHs included in themodel. A contribution of 15% of NOx and K is also explained in thisfactor. PAHs are associated with incomplete combustion of fossilfuels meanwhile NOx and K are also related with combustionprocesses (Jeong et al., 2008). In accordance to these results,factor 7 is related to combustion processes, like the factor 2.
0
20
40
60
80
100
TC
NO
3-S
O42
- Cl
Na
NH
4+ K Ca
Mg Al
Fe Sr
Ba
Alk
ane
C23
Alk
ane
C24
Alk
ane
C25
Alk
ane
C26
Alk
ane
C27
Alk
ane
C28
Alk
ane
C29
Alk
ane
C30
Alk
ane
C31
Alk
ane
C32
Alk
ane
C33
BaA C
hrB
bF BkF
BaP
DB
AB
ghiP
eA
lcoh
ol C
15A
lcoh
ol C
16A
lcoh
ol C
18A
lcoh
ol C
24A
lcoh
ol C
26A
lcoh
ol C
28A
lcoh
ol C
30A
cid
C12
Aci
d C
14A
cid
C15
Aci
d C
16A
cid
C17
Aci
d C
18A
cid
C24
Aci
d C
26A
cid
C28
Aci
d C
30U
nsat
urat
edP
inen
eN
Ox
Ozo
ne
Perc
ent o
f spe
cies
500 Pindado and Perez – Atmospheric Pollution Research 2 (2011) 492 505
(1) Even n alcohols/acids factor
(2) n alkanes factor
(3) Secondary nitrate factor
(4) Secondary sulphate factor
Figure 3. Source contributions (sampling period) associated with each factor, where the contribution average is 1.
0
2
4
6
8
10
12
14
16
18
20
May Jun Jul Aug Sep Oct Nov Dec Jan Feb Mar Apr
Sour
ce c
ontr
ibut
ion
(Ave
rage
= 1
)
0
2
4
6
8
10
12
14
16
18
20
May Jun Jul Aug Sep Oct Nov Dec Jan Feb Mar Apr
Sour
ce c
ontr
ibut
ion
(Ave
rage
= 1
)
0
2
4
6
8
10
12
14
16
18
20
May Jun Jul Aug Sep Oct Nov Dec Jan Feb Mar Apr
Sour
ce c
ontr
ibut
ion
(Ave
rage
= 1
)
0
2
4
6
8
10
12
14
16
18
20
May Jun Jul Aug Sep Oct Nov Dec Jan Feb Mar Apr
Sour
ce c
ontr
ibut
ion
(Ave
rage
= 1
)
Pindado and Perez – Atmospheric Pollution Research 2 (2011) 492 505 501
(5) Secondary organic aerosol factor
(6) Palmitic/stearic acid factor
(7) PAHs factor
(8) Mineral factor
Figure 3. Source contributions (sampling period) associated with each factor, where the contribution average is 1 (Contiuned).
0
2
4
6
8
10
12
14
16
18
20
May Jun Jul Aug Sep Oct Nov Dec Jan Feb Mar Apr
Sour
ce c
ontr
ibut
ion
(Ave
rage
= 1
)
0
2
4
6
8
10
12
14
16
18
20
May Jun Jul Aug Sep Oct Nov Dec Jan Feb Mar Apr
Sour
ce c
ontr
ibut
ion
(Ave
rage
= 1
)
0
2
4
6
8
10
12
14
16
18
20
May Jun Jul Aug Sep Oct Nov Dec Jan Feb Mar Apr
Sour
ce c
ontr
ibut
ion
(Ave
rage
= 1
)
0
2
4
6
8
10
12
14
16
18
20
May Jun Jul Aug Sep Oct Nov Dec Jan Feb Mar Apr
Sour
ce c
ontr
ibut
ion
(Ave
rage
= 1
)

502 Pindado and Perez – Atmospheric Pollution Research 2 (2011) 492 505
(9) Low molecular weight alcohols/acids factor
Figure 3. Source contributions (sampling period) associated with each factor, where the contribution average is 1 (Contiuned).
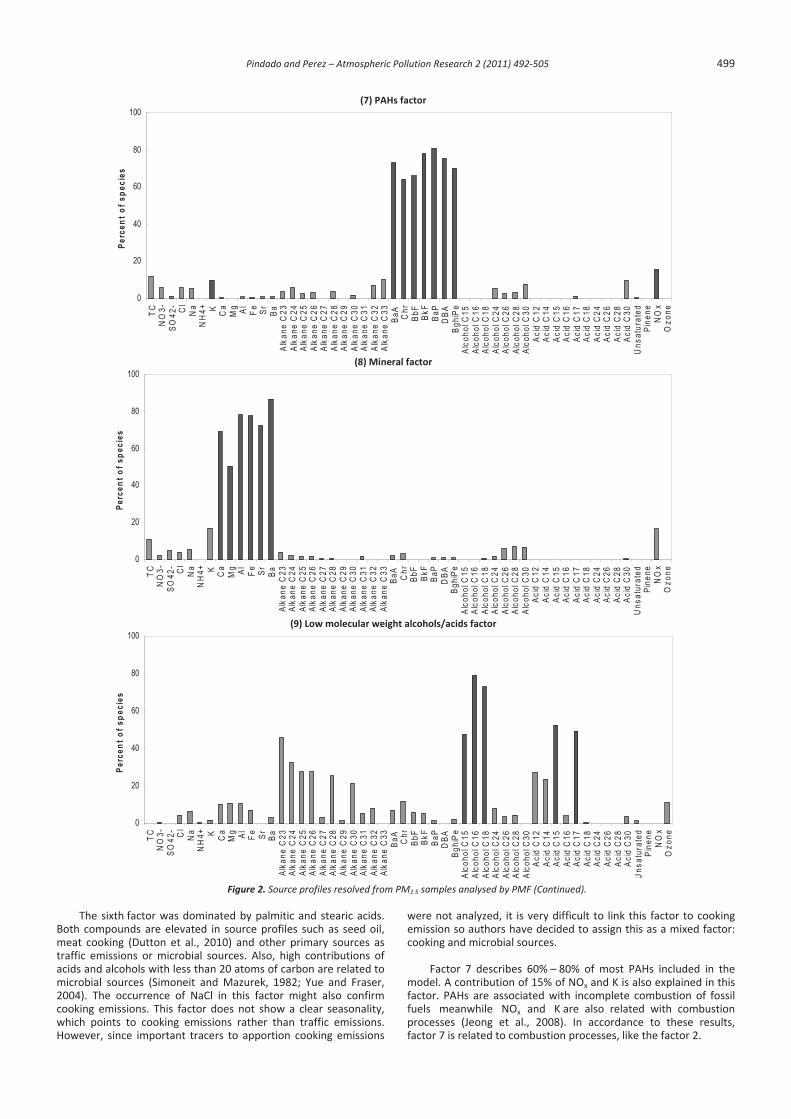
However, the model has separated both factors, because thefactor 7 had a strong weekly variability, with higher values duringthe weekdays, a trend not clearly shown in factor 2. This weeklyvariability suggests anthropogenic origin and can be attributed totraffic emissions. The ratio of BaA/(BaA+Chry) was 0.31, which isvery close to those reported in previous studies: 0.27 in dieselvehicles (Moon et al., 2008) and 0.40 in gasoline vehicle (Kavouraset al., 1999).This factor cannot differentiate between exhaustsfrom diesel or gasoline engines.
The eighth factor grouped Ca, Mg, Al, Fe, Sr and Ba. Thepercentage apportioned for these species to this factor rangedfrom 50% to 80%. All species associated with this factor are relatedto crustal material. This factor showed a contribution six timeshigher than mean value in three periods; September 2004, October2004 and March 2005. During these days, three long–rangetransport processes of desert dust from Sahara were registered(Gomez–Comino and Artinano, 2006; Salvador et al., 2008). Thosedust episodes transported from Sahara Desert have beenextensively analysed (Nicolas et al., 2008; Amato et al., 2009; Vianaet al., 2010) In light of the above, factor 8 has been allocated asdust soil.
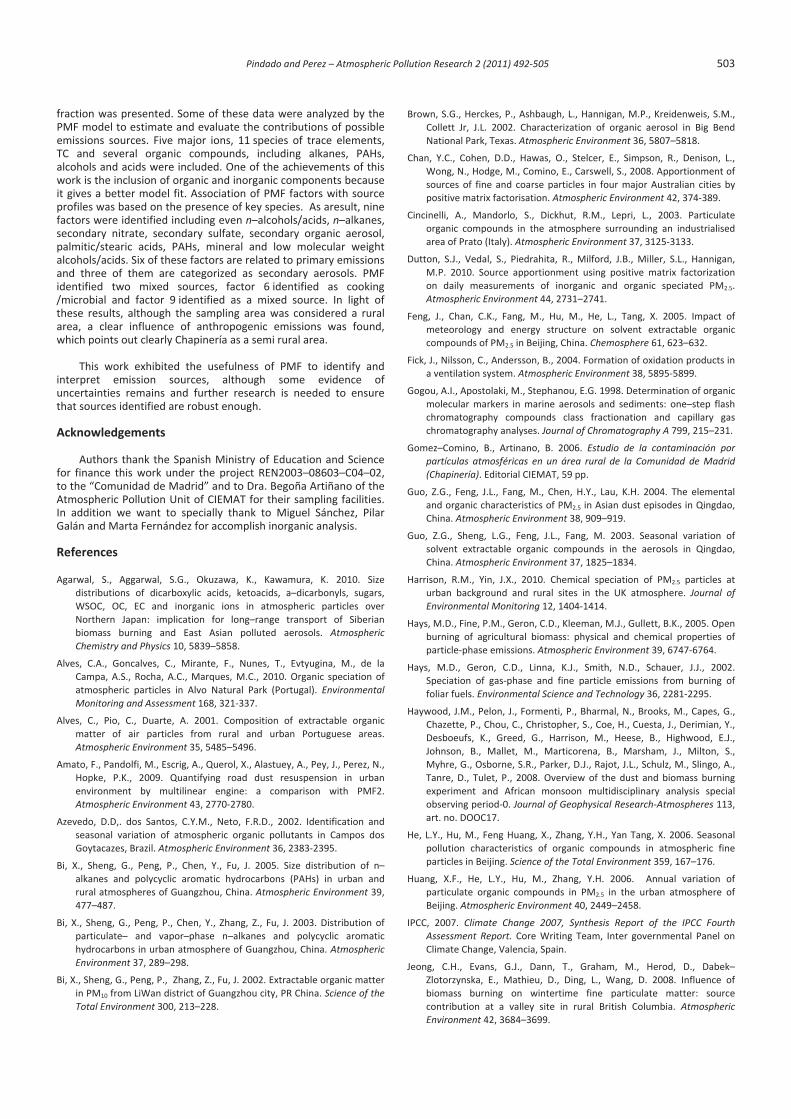
Factor 9 explains 50 – 70% of the alcohols and acids with lessthan 20 atoms of carbon. According to previous works, thesealcohols are associated with microbiological emissions (Zheng etal., 2000; Alves et al., 2001; Pio et al., 2001b); meanwhile acidswith less than 20 atoms of carbon are linked with microbiologicalemissions as well as anthropogenic emissions (Rogge et al., 1993;Pio et al., 2001a; Schauer et al., 2001; Azevedo et al., 2002; Hays etal., 2002; Radzi Bin Abas et al., 2004; Hays et al., 2005; Oliveira et
al., 2007). Thus factors 6 and 9 are closely related because bothshowed markers of cooking and microbial origin. However, PMFmodel have separated them due to the high contribution of evenalkanes to factor 9. Even alkanes are characteristic fromanthropogenic sources such as traffic and biomass burning (Bi etal., 2002; Bi et al., 2003; Lin and Lee, 2004; Feng et al., 2005). Sincefactor 2 grouped alkanes emitted from biomass burning, alkanesassociated to factor 9 may be related to traffic emissions. In light ofthese, it is very likely that factor 9 represents a mixed source.
Model performance. The ability of the PMF model to reproducethe measured PM2.5 concentration was evaluated by comparisonbetween measured and predicted concentrations. Figure 4 showsthe sum of concentration measured for all species included in themodel (abscissa) versus the sum of concentrations calculated forall species by the model (ordinate). The correlation coefficient was0.99, indicating that the 9 factor solution account for the variationin mass concentration of species. The slope of the correlationcurve was 1.02, which implies the PMF model slightlyoverestimates concentrations.
4. Conclusions
The chemical characterization of several organic and inorganiccompounds associated to PM2.5 fraction of aerosol present in therural site has been performed along one year. The families oforganic compounds consistently quantified were alkanes, PAHs,alcohols and carboxylic acids, meanwhile inorganic compoundsquantified encompass ionic components and 24 trace elements.Moreover, TC was determined and gravimetric analysis for PM2.5
Figure 4. Correlation plot between measured and predicted concentrations by PMF model.
0
2
4
6
8
10
12
14
16
18
20
May Jun Jul Aug Sep Oct Nov Dec Jan Feb Mar Apr
Sour
ce c
ontr
ibut
ion
(Ave
rage
= 1
)
y = 1,0238x + 1,0122R2 = 0,9909
0
10
20
30
40
50
60
0 10 20 30 40 50
Conc. measured ( g/m3)
Con
c. m
odel
led
(g/
m3 )
Pindado and Perez – Atmospheric Pollution Research 2 (2011) 492 505 503
fraction was presented. Some of these data were analyzed by thePMF model to estimate and evaluate the contributions of possibleemissions sources. Five major ions, 11 species of trace elements,TC and several organic compounds, including alkanes, PAHs,alcohols and acids were included. One of the achievements of thiswork is the inclusion of organic and inorganic components becauseit gives a better model fit. Association of PMF factors with sourceprofiles was based on the presence of key species. As aresult, ninefactors were identified including even n–alcohols/acids, n–alkanes,secondary nitrate, secondary sulfate, secondary organic aerosol,palmitic/stearic acids, PAHs, mineral and low molecular weightalcohols/acids. Six of these factors are related to primary emissionsand three of them are categorized as secondary aerosols. PMFidentified two mixed sources, factor 6 identified as cooking/microbial and factor 9 identified as a mixed source. In light ofthese results, although the sampling area was considered a ruralarea, a clear influence of anthropogenic emissions was found,which points out clearly Chapinería as a semi rural area.
This work exhibited the usefulness of PMF to identify andinterpret emission sources, although some evidence ofuncertainties remains and further research is needed to ensurethat sources identified are robust enough.
Acknowledgements
Authors thank the Spanish Ministry of Education and Sciencefor finance this work under the project REN2003–08603–C04–02,to the “Comunidad de Madrid” and to Dra. Begoña Artiñano of theAtmospheric Pollution Unit of CIEMAT for their sampling facilities.In addition we want to specially thank to Miguel Sánchez, PilarGalán and Marta Fernández for accomplish inorganic analysis.
References
Agarwal, S., Aggarwal, S.G., Okuzawa, K., Kawamura, K. 2010. Sizedistributions of dicarboxylic acids, ketoacids, a–dicarbonyls, sugars,WSOC, OC, EC and inorganic ions in atmospheric particles overNorthern Japan: implication for long–range transport of Siberianbiomass burning and East Asian polluted aerosols. AtmosphericChemistry and Physics 10, 5839–5858.
Alves, C.A., Goncalves, C., Mirante, F., Nunes, T., Evtyugina, M., de laCampa, A.S., Rocha, A.C., Marques, M.C., 2010. Organic speciation ofatmospheric particles in Alvo Natural Park (Portugal). EnvironmentalMonitoring and Assessment 168, 321 337.
Alves, C., Pio, C., Duarte, A. 2001. Composition of extractable organicmatter of air particles from rural and urban Portuguese areas.Atmospheric Environment 35, 5485–5496.
Amato, F., Pandolfi, M., Escrig, A., Querol, X., Alastuey, A., Pey, J., Perez, N.,Hopke, P.K., 2009. Quantifying road dust resuspension in urbanenvironment by multilinear engine: a comparison with PMF2.Atmospheric Environment 43, 2770 2780.
Azevedo, D.D,. dos Santos, C.Y.M., Neto, F.R.D., 2002. Identification andseasonal variation of atmospheric organic pollutants in Campos dosGoytacazes, Brazil. Atmospheric Environment 36, 2383 2395.
Bi, X., Sheng, G., Peng, P., Chen, Y., Fu, J. 2005. Size distribution of n–alkanes and polycyclic aromatic hydrocarbons (PAHs) in urban andrural atmospheres of Guangzhou, China. Atmospheric Environment 39,477–487.
Bi, X., Sheng, G., Peng, P., Chen, Y., Zhang, Z., Fu, J. 2003. Distribution ofparticulate– and vapor–phase n–alkanes and polycyclic aromatichydrocarbons in urban atmosphere of Guangzhou, China. AtmosphericEnvironment 37, 289–298.
Bi, X., Sheng, G., Peng, P., Zhang, Z., Fu, J. 2002. Extractable organic matterin PM10 from LiWan district of Guangzhou city, PR China. Science of theTotal Environment 300, 213–228.
Brown, S.G., Herckes, P., Ashbaugh, L., Hannigan, M.P., Kreidenweis, S.M.,Collett Jr, J.L. 2002. Characterization of organic aerosol in Big BendNational Park, Texas. Atmospheric Environment 36, 5807–5818.
Chan, Y.C., Cohen, D.D., Hawas, O., Stelcer, E., Simpson, R., Denison, L.,Wong, N., Hodge, M., Comino, E., Carswell, S., 2008. Apportionment ofsources of fine and coarse particles in four major Australian cities bypositive matrix factorisation. Atmospheric Environment 42, 374 389.
Cincinelli, A., Mandorlo, S., Dickhut, R.M., Lepri, L., 2003. Particulateorganic compounds in the atmosphere surrounding an industrialisedarea of Prato (Italy). Atmospheric Environment 37, 3125 3133.
Dutton, S.J., Vedal, S., Piedrahita, R., Milford, J.B., Miller, S.L., Hannigan,M.P. 2010. Source apportionment using positive matrix factorizationon daily measurements of inorganic and organic speciated PM2.5.Atmospheric Environment 44, 2731–2741.
Feng, J., Chan, C.K., Fang, M., Hu, M., He, L., Tang, X. 2005. Impact ofmeteorology and energy structure on solvent extractable organiccompounds of PM2.5 in Beijing, China. Chemosphere 61, 623–632.
Fick, J., Nilsson, C., Andersson, B., 2004. Formation of oxidation products ina ventilation system. Atmospheric Environment 38, 5895 5899.
Gogou, A.I., Apostolaki, M., Stephanou, E.G. 1998. Determination of organicmolecular markers in marine aerosols and sediments: one–step flashchromatography compounds class fractionation and capillary gaschromatography analyses. Journal of Chromatography A 799, 215–231.
Gomez–Comino, B., Artinano, B. 2006. Estudio de la contaminación porpartículas atmosféricas en un área rural de la Comunidad de Madrid(Chapinería). Editorial CIEMAT, 59 pp.
Guo, Z.G., Feng, J.L., Fang, M., Chen, H.Y., Lau, K.H. 2004. The elementaland organic characteristics of PM2.5 in Asian dust episodes in Qingdao,China. Atmospheric Environment 38, 909–919.
Guo, Z.G., Sheng, L.G., Feng, J.L., Fang, M. 2003. Seasonal variation ofsolvent extractable organic compounds in the aerosols in Qingdao,China. Atmospheric Environment 37, 1825–1834.
Harrison, R.M., Yin, J.X., 2010. Chemical speciation of PM2.5 particles aturban background and rural sites in the UK atmosphere. Journal ofEnvironmental Monitoring 12, 1404 1414.
Hays, M.D., Fine, P.M., Geron, C.D., Kleeman, M.J., Gullett, B.K., 2005. Openburning of agricultural biomass: physical and chemical properties ofparticle phase emissions. Atmospheric Environment 39, 6747 6764.
Hays, M.D., Geron, C.D., Linna, K.J., Smith, N.D., Schauer, J.J., 2002.Speciation of gas phase and fine particle emissions from burning offoliar fuels. Environmental Science and Technology 36, 2281 2295.
Haywood, J.M., Pelon, J., Formenti, P., Bharmal, N., Brooks, M., Capes, G.,Chazette, P., Chou, C., Christopher, S., Coe, H., Cuesta, J., Derimian, Y.,Desboeufs, K., Greed, G., Harrison, M., Heese, B., Highwood, E.J.,Johnson, B., Mallet, M., Marticorena, B., Marsham, J., Milton, S.,Myhre, G., Osborne, S.R., Parker, D.J., Rajot, J.L., Schulz, M., Slingo, A.,Tanre, D., Tulet, P., 2008. Overview of the dust and biomass burningexperiment and African monsoon multidisciplinary analysis specialobserving period 0. Journal of Geophysical Research Atmospheres 113,art. no. DOOC17.
He, L.Y., Hu, M., Feng Huang, X., Zhang, Y.H., Yan Tang, X. 2006. Seasonalpollution characteristics of organic compounds in atmospheric fineparticles in Beijing. Science of the Total Environment 359, 167–176.
Huang, X.F., He, L.Y., Hu, M., Zhang, Y.H. 2006. Annual variation ofparticulate organic compounds in PM2.5 in the urban atmosphere ofBeijing. Atmospheric Environment 40, 2449–2458.
IPCC, 2007. Climate Change 2007, Synthesis Report of the IPCC FourthAssessment Report. Core Writing Team, Inter governmental Panel onClimate Change, Valencia, Spain.
Jeong, C.H., Evans, G.J., Dann, T., Graham, M., Herod, D., Dabek–Zlotorzynska, E., Mathieu, D., Ding, L., Wang, D. 2008. Influence ofbiomass burning on wintertime fine particulate matter: sourcecontribution at a valley site in rural British Columbia. AtmosphericEnvironment 42, 3684–3699.
504 Pindado and Perez – Atmospheric Pollution Research 2 (2011) 492 505
Karanasiou, A.A., Siskos, P.A., Eleftheriadis. 2009. Assessment of sourceapportionment by Positive Matrix Factorization analysis on fine andcoarse urban aerosol size fractions. Atmospheric Environment 43,3385–3395.
Kavouras, I.G., Lawrence, J., Koutrakis, P., Stephanou, E.G., Oyola, P., 1999.Measurement of particulate aliphatic and polynuclear aromatichydrocarbons in Santiago de Chile: source reconciliation and evaluationof sampling artifacts. Atmospheric Environment 33, 4977 4986.
Kim, E., Hopke, P.K. 2008. Source characterization of ambient fine particlesat multiple sites in the Seattle area. Atmospheric Environment 42,6047–6056.
Kourtchev, I., Warnke, J., Maenhaut, W., Hoffmann, T., Claeys, M. 2008.Polar organic marker compounds in PM2.5 aerosol from a mixed forestsite in western Germany. Chemosphere 73, 1308–1314.
Ladji, R., Yassaa, N., Balducci, C., Cecinato, A. 2010. Organic components ofAlgerian desert dusts. Chemosphere 81, 925–931.
Landis, M.S., Lewis, C.W., Stevens, R.K., Keeler, G.J., Dvonch, J.T., Tremblay,R.T., 2007. Ft. Mchenry tunnel study: source profiles and mercuryemissions from diesel and gasoline powered vehicles. AtmosphericEnvironment 41, 8711 8724.
Lao, R.C., Thomas, R.S., Oja, H., Dubois, L. 1973. Application of a gaschromatograph–mass spectrometer–data processor combination tothe analysis of the polycyclic aromatic hydrocarbon content of airbornepollutants. Analytical Chemistry 45, 908–915.
Lee, M.L., Novotny, M., Bartle, K.D. 1976. Gas chromatography/massspectrometric and nuclear magnetic resonance spectrometric studiesof carcinogenic polynuclear aromatic hydrocarbons in tobacco andmarijuana smoke condensates. Analytical Chemistry 48, 405–416.
Lin, J.J., Lee, L.C., 2004. Characterization of n alkanes in urban submicronaerosol particles (PM1). Atmospheric Environment 38, 2983 2991.
Nicolas, J., Chiari, M., Crespo, J., Orellana, I.G., Lucarelli, F., Nava, S., Pastor,C., Yubero, E., 2008. Quantification of Saharan and local dust impact inan arid Mediterranean area by the positive matrix factorization (PMF)technique. Atmospheric Environment 42, 8872 8882.
Mendez, J., Quejido, A.J., Perezpastor, R., Perezgarcia, M., 1993.Chemometric study of organic pollution in the aerosol of Madrid.Analytica Chimica Acta 283, 528 537.
Moon, K.J., Han, J.S., Guim, Y.S., Kim, Y.J. 2008. Source apportionment offine carbonaceous particles by positive matrix factorization at Gosanbackground site in East Asia. Environment International 34, 654–664.
Oliveira, T.S., Pio, C.A., Alves, C.A., Silvestre, A.J.D., Evtyugina, M., Afonso,J.V., Fialho, P., Legrand, M., Puxbaum, H., Gelencser, A., 2007. Seasonalvariation of particulate lipophilic organic compounds at nonurban sitesin Europe. Journal of Geophysical Research Atmospheres 112, art. no.D23S09.
Paatero, P., Hopke, P.K. 2003. Discarding or downweighting high–noisevariables in factor analytic models. Analytical Chimica Acta 490, 277–289.
Paatero, P., 1999. The multilinear engine a table driven, least squaresprogram for solving multilinear problems, including the n way parallelfactor analysis model. Journal of Computational and GraphicalStatistics 8, 854 888.
Paatero, P., 1997. Least squares formulation of robust non negative factoranalysis. Chemometrics and Intelligent Laboratory Systems 37, 23 35.
Perez, L., Tobias, A., Querol, X., Kunzli, N., Pey, J., Alastuey, A., Viana, M.,Valero, N., Gonzalez Cabre, M., Sunyer, J., 2008. Coarse particles fromsaharan dust and daily mortality. Epidemiology 19, 800 807.
Pey, J., Alastuey, A., Querol, X., Rodriguez, S., 2010. Monitoring of sourcesand atmospheric processes controlling air quality in an urbanMediterranean environment. Atmospheric Environment 44, 4879 4890.
Pindado, O., Perez, R.M., Garcia, S. 2010. Assessment uncertaintyassociated to the analysis of organic compounds linked to particulatematter of atmospheric aerosols. Talanta 80, 1121–1128.
Pindado, O., Perez, R.M., Garcia, S., Sanchez, M., Galan, P., Fernandez, M.,2009. Characterization and sources assignation of PM2.5 organic aerosolin a rural area of Spain. Atmospheric Environment 43, 2796 2803.
Pio, C., Alves, C., Duarte, A., 2001a. Organic components of aerosols in aforested area of central greece. Atmospheric Environment 35, 389 401.
Pio, C., Alves, c., Duarte, A. 2001b. Identification, abundance and origin ofatmospheric organic particulate matter in a Portuguese rural area.Atmospheric Environment 35, 1365–1375.
Polissar, A.V., Hopke, P.K., Paatero, P., 1998. Atmospheric aerosol overAlaska 2. Elemental composition and sources. Journal of GeophysicalResearch Atmospheres 103, 19045 19057.
Radzi Bin Abas, M., Rahman, N.A., Omar, N.Y.M.J., Maah, M.J., Abu Samah,A., Oros, D.R., Otto, A., Simoneit, B.R.T. 2004. Organic composition ofaerosol particulate matter during a haze episode in Kuala Lumpur,Malaysia. Atmospheric Environment 38, 4223–4241.
Rogge, W.F., Hildemann, L.M., Mazurek, M.A., Cass, G.R., Simoneit, B.R.T.1998. Sources of fine organic aerosol. Pine. Oak, and synthetic logcombustion in residential fireplaces. Environmental Science andTechnology 32, 13–22.
Salvador, P., Artinano, B., Querol, X., Alastuey, A., 2008. A combinedanalysis of backward trajectories and aerosol chemistry to characteriselong range transport episodes of particulate matter: The Madrid airbasin, a case study. Science of the Total Environment 390, 495 506.
Schauer, J.J, Keeman, M.J., Cass, G.R., Simoneit, B.R.T. 2001. Measurementof emissions from air pollution sources. C1–C29 organic compoundsfrom fireplace combustion of wood. Environmental Science andTechnology 35, 1716–1728.
Sharma, M., Maloo, S., 2005. Assessment of ambient air PM10 and PM2.5
and characterization of PM10 in the city of Kanpur, India. AtmosphericEnvironment 39, 6015 6026.
Simoneit, B.R.T., 1989. Organic matter of the troposphere V: application ofmolecular marker analysis to biogenic emissions into the tropospherefor source reconciliations. Journal of Atmospheric Chemistry 8, 251275.
Simoneit, B.R.T., Mazurek, M.A., 1982. Organic matter of the troposphere.II. Natural background of biogenic lipid matter in aerosols over therural western United States. Atmospheric Environment 16, 2139 2159.
Shrivastava, M.K., Subramanian, R., Rogge, W.F., Robinson, A.L. 2007.Source of organic aerosol: positive matrix factorization of molecularmarker data and comparison of results from different sourceapportionment models. Atmospheric Environment 41, 9353–9369.
Vesna, O., Sax, M., Kalberer M., Gaschen, A., Ammann, M. 2009. Productstudy of linoleic acid ozonolysis as function of humidity. AtmosphericEnvironment 43, 3662–3669.
Viana, M., Salvador, P., Artinano, B., Querol, X., Alastuey, A., Pey, J., Latz,A.J., Cabanas, M., Moreno, T., Dos Santos, S.G., Herce, M.D.,Hernandez, P.D., Garcia, D.R., Fernandez Patier, R., 2010. Assessing theperformance of methods to detect and quantify African dust inairborne particulates. Environmental Science and Technology 44, 88148820.
WHO, 2003. Climate change and human health – risks and responses.World Health Organization in collaboration with UNEP and WMO. 37pp.
Wolz, J., Fleig, M., Schulze, T., Maletz, S., von Varel, U.L., Reifferscheid, G.,Kuhlers, D., Braunbeck, T., Brack, W., Hollert, H., 2010. Impact ofcontaminants bound to suspended particulate matter in the context offlood events. Journal of Soil and Sediment 10, 1174 1185.
Xu, Y.S., Nadykto, A.B., Yu, F.Q., Herb, J., Wang, W. 2010. Interactionbetween common organic acids and trace nucleation species in theEarth’s atmosphere. Journal of Physical Chemistry A 114, 387–396.
Yue, Z., Fraser, M.P. 2004. Polar organic compounds measured in fineparticulate matter during TexAQS 2000. Atmospheric Environment 38,3253–3261.

Pindado and Perez – Atmospheric Pollution Research 2 (2011) 492 505 505
Zheng, M., Cass, G.R., Schauer, J.J., Edgerton, E.S., 2002. Sourceapportionment of PM2.5 in the southeastern United States using solventextractable organic compounds as tracers. Environmental Science andTechnology 36, 2361 2371.
Zheng, M., Feng, M., Wang, F., To, K.L. 2000. Characterization of the solventextractable organic compounds in PM2.5 aerosols in Hong Kong.Atmospheric Environment 34, 2691–2702.