the association between generation x and y...
TRANSCRIPT

THE ASSOCIATION BETWEEN GENERATION X AND Y AND INTENTION TO LEAVE
GAN SUK CHING
MASTER OF BUSINESS ADMINISTRATION
UNIVERSITI TUNKU ABDUL RAHMAN
FACULTY OF ACCOUNTANCY AND MANAGEMENT
NOVEMBER 2012

Page i of 96
The Association between Generation X and Y and
Intention to Leave
Gan Suk Ching
A research project submitted in partial fulfillment of the
requirement for the degree of
Master of Business Administration
Universiti Tunku Abdul Rahman
Faculty of Accountancy and Management
November 2012

Page ii of 96
The Association between Generation X and Y and
Intention to Leave
By
Gan Suk Ching
This research project is supervised by:
Dr. Ong Seng Fook
Assistant Professor
Department of International Business
Faculty of Accountancy and Management

Page iii of 96
Copyright @ 2012
ALL RIGHTS RESERVED. No part of this paper may be reproduced, stored in a
retrieval system, or transmitted in any form or by any means, graphic, electronic,
mechanical, photocopying, recording, scanning, or otherwise, without the prior
consent of the authors.

Page iv of 96
DECLARATION
I hereby declare that:
(1) This MKMA25106 Research Project is the end result of my own work and that
due acknowledgement has been given in the references to all sources of
information be they printed, electronic, or personal.
(2) No portion of this research project has been submitted in support of any
application for any other degree or qualification of this or any other university,
or other institutions of learning.
(3) The word count of this research report is 19,662.
Name of Student : Gan Suk Ching
Student ID : 08UKM07894
Signature : _________________
Date : 9th November 2012

Page v of 96
ACKNOWLEDGEMENT
First at all, I would like to take this opportunity to express my deepest gratitude to
my supervisor, Dr. Ong Seng Fook for his supports, advices, and guidance in
completing my MBA research project.
Secondly, I would like to express thanks to UTAR Library for providing me the
sufficient data and information. I really appreciate for its resources along the
journey.
I would also like to take this opportunity to thank my family and friends for their
understanding and support during the time of completing my paper.
Lastly, I would like to be grateful to my respondents who had contributed their
sincere opinions in my questionnaires and made my data and analysis completed.
Page vi of 96
TABLE OF CONTENTS
Page
Copyright Page………………………………………………………………
Declaration…………………………………………………………….........
Acknowledgement…………………………………………………………..
Table of Contents……………………………………………………………
List of Tables………………………………………………………………..
List of Figures……………………………………………………………….
Abstract……………………………………………………………………...
CHAPTER 1 INTRODUCTION
1.0 Background of Study………………………………………..
1.1 Labour Force in Malaysia……………………………..........
1.2 Problem Statement…………………………………………..
1.3 Research Questions (RQ)...………………………………….
1.4 Research Objectives (RO)...…………………………………
1.5 Scope of Study………………………………………………
1.6 Hypothesis Development……………………………………
1.7 Theoretical Framework……………………………………...
1.8 Conclusion…………………………………………………..
CHAPTER 2 LITERATURE REVIEW
2.1 Finance Team………………………………………………..
2.2 Staff'’s Intention to Leave……………………………………
2.3 Motivation…………………………………………………...
iii
iv
v
vi
x
xii
xiii
1
3
8
13
13
14
14
18
18
19
20
22

Page vii of 96
2.4 Generations………………………………………………….
2.4.1 Generation X………………………………………...
2.4.2 Generation Y………………………………………...
2.5 Conclusion…………………………………………………..
CHAPTER 3 RESEARCH METHOD
3.0 Overview…………………………………………………….
3.1 Research Design……………………………………………..
3.2 Data Collection Method……………………………………..
3.3 Sampling Design…………………………………………….
3.3.1 Target Population……………………………………
3.3.2 Sample Size……………………………………….....
3.3.3 Sampling Method……………………………………
3.4 Research Instrument…………………………………………
3.4.1 Questionnaire Design………………………………..
3.4.2 Measurement Scales…………………………………
3.4.2.1 Nominal Scale……………………………...
3.4.2.2 Ordinal Scale……………………………….
3.5 Pilot Test…………………………………………………….
3.6 Data Processing……………………………………………...
3.6.1 Descriptive Analysis………………………………...
3.6.2 Reliability Analysis………………………………….
3.6.3 Independent T-test…………………………………..
3.6.4 Multiple Linear Regression Analysis………………..
3.7 Conclusion…………………………………………………..
25
27
28
30
31
31
32
33
34
34
35
35
36
36
37
37
38
39
40
40
41
42
44

Page viii of 96
CHAPTER 4 RESEARCH RESULTS
4.0 Overview…………………………………………………….
4.1 Descriptive Analysis………………………………………...
4.1.1 Frequency of Respondent Based on Gender Group…
4.1.2 Frequency of Respondent Based on Age Group…….
4.1.3 Frequency of Respondent Based on Race Group…...
4.1.4 Frequency of Respondent Based on Education
Attainment…………………………………………..
4.1.5 Frequency of Respondent Based on Total Year(s) of
Working…………………………………………….
4.1.6 Frequency of Respondent Based on Number of
Company have been Working With………………...
4.1.7 Frequency of Respondent Based on Position Level
in Current Organization……………………………..
4.1.8 Frequency of Respondent Based on Year(s) of
Working in Current Organization…………………...
4.1.9 Mean of Respondent Based on Expectation of
Motivational Factors………………………………...
4.2 Independent T-test Analysis………………………………...
4.3 Multiple Linear Regression Analysis………………………..
4.3.1 Motivation and Staff’s Intention to Leave…………..
4.3.2 Motivation and Gen X’s Intention to Leave………...
4.3.3 Motivation and Gen Y’s Intention to Leave………...
4.4 Summary Results of Hypothesis Test……………………….
4.5 Conclusion………………………………………………….
45
45
46
46
47
48
49
50
51
52
52
55
58
58
61
64
67
69

Page ix of 96
CHAPTER 5 DISCUSSION AND CONCLUSION
5.1 Discussion of Major Findings……………………………….
5.1.1 Motivation and Staff’s Intention to Leave…………..
5.1.2 Motivational Factors and Staff’s Intention to Leave..
5.1.3 Generational Differences and Motivation…………..
5.1.4 Generational Differences and Motivational Factors...
5.1.5 Motivation and Gen X’s Intention to Leave…...........
5.1.6 Motivational Factors and Gen X’s Intention to Leave
5.1.7 Motivation and Gen Y’s Intention to Leave………...
5.1.8 Motivational Factors and Gen Y’s Intention to Leave
5.2 Recommendations…………………………………………...
5.2.1 Understand Them……………………………………
5.2.2 Serve Their Needs…………………………………...
5.2.3 Analyse Them from Time to Time………………….
5.3 Implications of the Study……………………………………
5.4 Limitation of the Study……………………………………...
5.5 Future Research……………………………………………..
5.6 Conclusion…………………………………………………..
REFERENCES………………………………………………………………
APPENDIX…………………………………………………………………..
70
70
71
72
73
74
74
75
76
77
77
78
79
79
80
81
82
84
93

Page x of 96
LIST OF TABLES
Page
Table 1: Reliability Anaysis Result for Pilot Testing………………………
Table 2: Alpha Coefficient………………………………………………….
Table 3: Gender Group……………………………………………………..
Table 4: Age Group………………………………………………………...
Table 5: Race Group………………………………………………………..
Table 6: Educational Attainment…………………………………………...
Table 7: Total Year(s) of Working…………………………………………
Table 8: Number of Company have been Working with…………………...
Table 9: Position Level in Current Company………………………………
Table 10: Year(s) of Working in Current Organization……………………..
Table 11: Ranking of Motivational Factors for Gen X……………………...
Table 12: Ranking of Motivational Factors for Gen Y……………………...
Table 13: Independent T-test between Generational Differences and
Interpersonal Relationships and Working Condition…………….
Table 14: Independent T-test between Generational Differences and
Growth, Job Itself, Achievement, Recognition, Supervision, and
Compensation……………………………………………………
Table 15: Multiple Linear Regression Analysis between Motivation and
Staff Retention…………………………………………………...
Table 16: ANOVA(b) for Relationship between Motivation and Staff’s
Intention to Leave………………………………………………..
39
41
46
46
47
48
49
50
51
52
53
54
56
57
58
59

Page xi of 96
Table 17: Coefficients (a) for Relationship between Motivation and Staff’s
Intention to Leave………………………………………………..
Table 18: Multiple Linear Regression Analysis between Motivation and
Gen X’s Intention to Leave………………………………………
Table 19: ANOVA(b) for Relationship between Motivation and Gen X’s
intention to leave…………………………………………………
Table 20: Coefficients (a) for Relationship between Motivational Factors
and Gen X’s intention to leave…………………………………...
Table 21: Multiple Linear Regression Analysis between Motivation and
Gen Y’s Intention to Leave………………………………………
Table 22: ANOVA(b) for Relationship between Motivation and Gen Y’s
Intention to Leave………………………………………………..
Table 23: Coefficients (a) for Relationship between the Motivational
Factors and Gen Y’s Intention to Leave…………………………
Table 24: Summary Result of Hypothesis Test……………………………..
Table 25: Summary Result of Multiple Linear Regression Analysis……….
Table 26: Summary Result of Mean Value………………………………….
Table 27: Summary Result of Independent T-test Analysis………………...
Table 28: Summary Result of Motivational Factors towards Gen X’s
Intention to Leave………………………………………………..
Table 29: Summary Result of Motivational Factors towards Gen Y’s
Intention to Leave………………………………………………..
60
61
62
63
64
65
66
67
72
73
74
75
77

Page xii of 96
LIST OF FIGURES
Page
Figure 1: Principal statistic of labour force, Malaysia, 2010………………..
Figure 2: Number of employed persons by stratum and sex, Malaysia, 2010
Figure 3: Number of employed persons by status in employment and sex,
Malaysia, 2010……………………………………………………
Figure 4: Number of employed persons by age group and sex, Malaysia,
2010……………………………………………………………….
Figure 5: Number of employed persons by highest certificate obtained and
sex, Malaysia, 2010……………………………………………….
Figure 6: Number of employed persons by occupation and sex, Malaysia,
2010……………………………………………………………….
Figure 7: Model for measurement of human resource replacement costs…..
Figure 8: The relational condition of the categories to be tested and the
corresponding research…………………………………………...
4
5
5
6
7
8
10
18

Page xiii of 96
ABSTRACT
The purpose of this research paper is to examine the association between Gen X
and Gen Y who are currently working in finance-related field and their intention
to leave their organizations. In order to understand better their intention,
researcher adopts motivation as a variable to test the relationships between the two
generations and their voluntary turnover intention. Motivational factors are
developed with a reference to Hertzberg’s Two-Factor Theory and concluded as
eight major factors: growth, job itself, achievement, recognition, supervision,
interpersonal relationships, working condition and compensation.
Four main hypotheses were developed to fulfill the research questions and
research objectives of the study. In addition, each of the main hypotheses carries
eight minor hypotheses where each of the motivational factors was tested their
relationships with Gen X’s and Gen Y’s intention to leave.
A survey questionnaire was developed and used to collect data from targeted
respondents who are all from finance-related field. A group of 222 respondents
was asked their opinions on their expectation and what they currently derive from
their current organization and their current intention to leave or stay the
organizations. The data was then being analysed using Social Science Version 12
(SPSS 12). Moreover, Independent T-test Analysis and Multiple Linear
Regression Analysis were being used to test the hypotheses of the study.
After concluded all the findings, it found that motivation is significantly
influencing staff’s turnover intention whereas generational differences between
Gen X and Gen Y is also having an influential impact to the expectation of
motivation.

Page 1 of 96
CHAPTER 1
INTRODUCTION
1.0 Background of Study
There are a lot of researches discussing the association between generations and
intention to leave the workplace. Yet, there are not much of the researches
discussing the relationship between generations and intention to leave among the
staff work in finance-related field. Every research is different from each other in
terms of research objectives, research questions, variables, environment,
respondents, etc. (Maura, Igor & Adalgisa, 2011; Michael & Crispen, 2009; Rita
& Mieke, 2008). In this study, researcher is going to take motivation as the
independent variable to link up generations and intention to leave.
Finance creates a lot of work opportunities in labour market. It is because finance
is one of the necessary functions in a company regardless small, medium, or large
size of company. One of the roles of finance is to manage a company’s capital and
financial resources. It also highly involves in company’s long-range planning and
implementation as finance is the one who provides facts and figures to the top
management in their planning, and is the one who analyses and manages the
accuracy and accountability of the plans upon implementation (Mak, 2010). Due
to the important role of finance, a team of intelligent finance professionals is
essential to work for the company.
When an employee has the intention to leave the current organization, it would
very soon lead to the actual action, which is job resignation. Job resignation is one

Page 2 of 96
kind of staff voluntary turnover that always harasses recruitment managers. Staff
turnover rate is an important concern for every organization because
organizational stability is having a high degree of correlation with low turnover.
Besides that, voluntary turnover would also incur both direct and indirect costs to
an organization. Direct costs, for example, recruitment, selection, and training,
whereas indirect costs include workloads and overtime expenses for co-workers
who stay with the company (Missouri Small Business & Technology
Development Centers, 2002). These costs can significantly affect the financial
performance of an organization (MSBTDC, 2002). Moreover, according to Miller
(2006), employee retention is important not only from an organization’s financial
standpoint, but also the effect that turnover has on employee morale, which
subsequently influence the company performance in terms of customer service
and satisfaction.
Some researchers believe that motivation is related to staff retention. Motivation is
an accumulation of different processes which would affect our behaviours to
achieve some specific goals (Baron, 1983). It is like a drive that pushing us
towards the specific goals, perhaps personal goals or organizational goals.
Motivation is categorized into two, which are intrinsic motivation and extrinsic
motivation. Intrinsic motivation refers to the activity itself provides the
satisfaction and pleasure to the actor (Agarwal, 2010). On the other hand, extrinsic
motivation refers to the factors that often relate to satisfying non-work related
needs, such as tangible rewards (Frey & Osterloh, 2002). Motivation must be
applied appropriately as it varies from people to people. It is needed not only in
the workplace, it also could be taken place almost everything in one’s life such as
eating, drinking, studies, sports, savings, spending, and etc.
In current labour market of most of the countries, it consists of three generations,
which are Baby Boomers, Generation X (Gen X) and Generation Y (Gen Y).
However, it is a fact that Baby Boomers are going to retire in next several years.
Their leaving will create a lot of vacancies in the market. Subsequently, demand

Page 3 of 96
of Gen X and Gen Y would be increased. Hence, retaining the existing employees
in the companies, especially Gen X and Gen Y, is very crucial. A lot of researches
show that the motivation on work varies by generations. It is because the world
keeps on changing from time to time due to the country development,
technologies, communication systems, etc. These changes have built different
lifestyle, attitudes and demand across the generations (Zemke, Raines & Filipczak,
2000; Smola & Sutton, 2002; Spiro, 2006; Glass, 2007; Cennamo & Gardner,
2008; Tay, 2011).
Motivation to work is very important for every employee of an organization
because employee spends most of their time working in organization (Drafke,
Michael, & Stan, 1998). The retirement age of government servants in Malaysia is
currently at 58 while private sector employees are allowed to work until age 64. If
most of the people start working at their 20 and decided to retire at their 60, they
would have to work for 40 years in order to get retired. If normal working hour is
10 hours per day with five working days per week, which means that people
would spend about 30 percent of the 40-year time or 104,000 hours in working.
Hence, the major concern is how the organizations keep Gen X and Gen Y being
motivated in their 104,000 hours and consequently reduce the staff turnover rate?
1.1 Labour Force in Malaysia
According to the Malaysia Labour Force Statistics 2010 as shown in Figure 1,
total workforce recorded 18.37 million which consisted of local labours (62.7%)
and foreign labours (37.3%). In this study, local labour force of 11.52 million will
be examined. Besides that, Figure 1 also shows that Malaysia had reached 96.6
percent of employment rate in year 2010 with 11.1 million employed persons.
Among these employed labours, 7.1 million are male whereas another 4 million
are female.

Page 4 of 96
Figure 1: Principal statistic of labour force, Malaysia, 2010
Note. Adapted from Labour Force Statistics Malaysia. (2010). Retrieved June 18, 2011, from
http://www.statistics.gov.my/portal/download_Labour/files/BPTMS/ringkasan_perangkaan
_2010.pdf
In Figure 2, it shows that 7.6 million of them were located at urban areas while 3.5
million of them were working at rural areas.

Page 5 of 96
Figure 2: Number of employed persons by stratum and sex, Malaysia, 2010
Note. Adapted from Labour Force Statistics Malaysia. (2010). Retrieved June 18, 2011, from
http://www.statistics.gov.my/portal/download_Labour/files/BPTMS/ringkasan_perangkaan
_2010.pdf
In addition, Figure 3 illustrates that there were 438 thousand of employers
competing for 8.3 million labours in the market.
Figure 3: Number of employed persons by status in employment and sex,
Malaysia, 2010
Note. Adapted from Labour Force Statistics Malaysia. (2010). Retrieved June 18, 2011, from
http://www.statistics.gov.my/portal/download_Labour/files/BPTMS/ringkasan_perangkaan
_2010.pdf

Page 6 of 96
As shown in the statistics (see Figure 4), workforce in Malaysia consisted of the
labours ranging from age 15 to 64. From the age range, the number of labours
with age 20 to 29 were the most and followed by labours with age 30s and thirdly
labours with age 40s, which were 3.3 million, 3.1 million and 2.6 million
respectively.
Figure 4: Number of employed persons by age group and sex, Malaysia, 2010
Note. Adapted from Labour Force Statistics Malaysia. (2010). Retrieved June 18, 2011, from
http://www.statistics.gov.my/portal/download_Labour/files/BPTMS/ringkasan_perangkaan
_2010.pdf
However, Figure 5 demonstrates that only 2.0 million of total employed persons
had obtained their diploma or degree certificates while 4.1 million and 1.6 million
persons only completed their STPM and SPM.

Page 7 of 96
Figure 5: Number of employed persons by highest certificate obtained and sex,
Malaysia, 2010
Note. Adapted from Labour Force Statistics Malaysia. (2010). Retrieved June 18, 2011, from
http://www.statistics.gov.my/portal/download_Labour/files/BPTMS/ringkasan_perangkaan
_2010.pdf
In addition, Figure 6 illustrates that 1.9 million persons were working as service
workers and salespersons. Another 1.6 million persons were technicians and
associate professionals, whereas 1.3 million persons were skilled agricultural and
fishery workers. On the other hand, only 837 thousand persons were legislators,
senior officers and managers whilst 706 thousand persons were professionals.

Page 8 of 96
Figure 6: Number of employed persons by occupation and sex, Malaysia, 2010
Note. Adapted from Labour Force Statistics Malaysia. (2010). Retrieved June 18, 2011, from
http://www.statistics.gov.my/portal/download_Labour/files/BPTMS/ringkasan_perangkaan
_2010.pdf
1.2 Problem Statement
Human capital is the key ingredient to organizational success and failure (Baron &
Kreps, 1999) as well as for a company to be a societal system in business world
nowadays (Barber, 1998). There are a lot of researches on employee turnover and
the factors or solutions to reduce the turnover. However, this phenomenon is still a
major challenge faced by Human Resources (HR) managers. In fact, employee

Page 9 of 96
turnover is very common in every organization. The only difference between the
companies’ turnover rate is high or low.
Nevertheless, it is very normal in an organization that people come and go. From
the societal perspective, turnover could have positive effects on mobility and
migration to new industries which are necessary for economic development
(Vikineswaran, 1999). However, productivity growth in human resource
development will be affected due to too much of turnover (Vikineswaran, 1999).
From the organizational perspective, turnover imposes a significant cost. Ramlall
(2003) pointed out the cost of staff voluntary turnover is estimated 150% of the
annual salary of an individual employee. This can be seen clearer in the model
presented by Falmholtz (1974, as cited in Vikineswaran, 1999) as shown in Figure
7. Falmholtz (1974, as cited in Vikineswaran, 1999) explained that the employee
replacement costs are divided into three categories, which are acquisition costs,
learning costs and separation costs. Acquisition costs are related to the recruiting
processes as well as cost of internal transfer or promotion, learning costs are
normally caused by training provided to the new comers, whereas separation costs
are separation pay and cost of inefficiency prior separation as well as after
separation (Falmholtz, 1974, as cited in Vikineswaran, 1999).

Page 10 of 96
Figure 7: Model for measurement of human resource replacement costs
Note. Adapted from Falmholtz, 1774 (as cited in Vikineswaran, 1999)
Furthermore, James-Francis (2005) stated that valuable knowledge and expertise,
as well as the relationships with colleagues and clients, are always gone with the

Page 11 of 96
leaving staff. This turnover loss is not only applicable to one company or one
industry, but to all employers. A research done by Miller (2010) mentioned that
the loss of qualified and skilled employees is positively related to the reduction in
competitiveness, innovation and service quality in restaurants in London. Wagner
(2010) also pointed out that nursing turnover is risky as it is linked to individual
and organizational performance, drop in quality of care, increase in workload on
the staff who stay with the healthcare centre, loss in morale and consequently
more turnover taking place.
Some people might argue that new employees would bring in more new thoughts
and ideas to the company. Yet, existing employees possess the skills and
knowledge that the new employees might not have. It is impossible that two
different companies have the exactly same operating modes. It can be said that
every company needs its own-customized system to operate. Existing staff are
those have already adapted to the current company and had the skills and
knowledge that suit the operation of the company. Losing the staff is equivalent to
losing the knowledge and technical skills. Moreover, it is very costly and time
consuming to train a new staff up to adapt to the job as well as the company’s
current operating system. In addition, the new staff might not adapt to the working
environment and might leave the company after joining some time.
Furthermore, turnover can also affect the customer satisfaction and loyalty.
Reichheld (1993) pointed out that deliver of service and customer loyalty may be
jeopardized in service industry when employees leave. Existing employees may
enjoy a group of loyal customers. Once the particular employees left, the group of
customers may follow the employees to switch to the new companies. Moreover,
the shortage of manpower after the employees left will create the delay in
customer service (Machalaba, 1993). In addition, inexperienced new employees
may be impersonal as they do not know the loyal customers’ preferences
(Darmon, 1990).

Page 12 of 96
In fact, the HR staff have only limited power over voluntary turnover (Beulen,
2009). Once the individual staff has made the decision of resignation, it is hard to
change his or her mind (Mosley & Hurley, 1999). Therefore, instead of
persuading them to pull back the termination decision, retention strategies are
more crucial and even more effective to control the turnover.
According to Hewitt’s 2007 Total Compensation Management survey, average
staff turnover rate in Malaysia reported 18 per cent in year 2007 (Hewitt
Associates LLC, 2008). Among them, Gen X and Gen Y contributed the highest
turnover rate in the year and company loyalty tends to be weak among the
younger generations (Hewitt Associates LLC, 2008).
A survey had been done by Hay Group in 2010 on how to manage the staff with
across generations in Malaysia. In the article, it stated that no “one-size fits all”
approach for managing a cross-generational workforce. Employers must know
what each generation wants and tailoring the management and reward system in a
fair and equitable way (Hay Group, 2010). Another research from Yochai (2011)
stated that “if you want employees to work harder, incorporate pay for
performance and monitor their results more closely. If you want executives to do
what’s right for shareholders, pay them in stock. If you want doctors to look after
patients better, threaten them with malpractice suits.” Giving employees what they
really need is the best way to motivate them and even stick them with the
company.

Page 13 of 96
1.3 Research Questions (RQ)
There are few research questions in this study, which are as below:
(a) To what extent that motivation influences staff’s intention to leave?
(b) To what extent that generational differences have impact on motivation
(growth, job itself, achievement, recognition, supervision, interpersonal
relationship, working condition, and compensation)?
(c) To what extent that motivation (growth, job itself, achievement,
recognition, supervision, interpersonal relationship, working condition,
and compensation) affect Gen X’s intention to leave?
(d) To what extent that motivation (growth, job itself, achievement,
recognition, supervision, interpersonal relationship, working condition,
and compensation) affect Gen Y’s intention to leave?
1.4 Research Objectives (RO)
To answer the research questions above, few objectives have been set in order to
meet the final purpose of this study:
(a) To understand the influence of motivation on staff’s intention to leave.
(b) To determine the impact of generational differences on motivation (growth,
job itself, achievement, recognition, supervision, interpersonal relationship,
working condition, and compensation).
(c) To analyze the relationship between motivation (growth, job itself,
achievement, recognition, supervision, interpersonal relationship, working
condition, and compensation) and Gen X’s intention to leave.
(d) To analyze the relationship between motivation (growth, job itself,
achievement, recognition, supervision, interpersonal relationship, working
condition, and compensation) and Gen Y’s intention to leave.
Page 14 of 96
1.5 Scope of Study
This research is mainly focusing on Gen X and Gen Y who are currently working
in a finance team or finance department in their organizations based in Malaysia.
Only full-time employees are qualified to be the respondents of the study. To
ensure the précised data being collected, only those who meet the criteria as listed
below are selected as the sample for the study:
1. A Malaysian;
2. Born after year 1964;
3. Employed; and
4. Currently working in finance-related job.
1.6 Hypothesis Development
In the research done by Yoon and James (2009), intrinsic motivation and extrinsic
motivation are negatively related to staff’s intention to leave. If the workers are
not motivated, turnover will increase (Huselid, 1995; Maidani, 1991; Tietjen &
Myers, 1998; Robbins, 2001; Parsons & Broadbridge, 2006). Another research
done on auditors also showed that higher degrees of job satisfaction have higher
degrees of intention to stay (Chang, Wunn & Tseng, 2011). Conversely, higher
degrees of job satisfaction have lower degrees of intention to leave. Hence, the
hypothesis will be postulated as:
Hypothesis 1: There is a significant relationship between motivation and staff’s
intention to leave.
Hypothesis 1a: There is a significant relationship between growth and staff’s
intention to leave.

Page 15 of 96
Hypothesis 1b: There is a significant relationship between job itself and staff’s
intention to leave.
Hypothesis 1c: There is a significant relationship between achievement and staff’s
intention to leave.
Hypothesis 1d: There is a significant relationship between recognition and staff’s
intention to leave.
Hypothesis 1e: There is a significant relationship between supervision and staff’s
intention to leave.
Hypothesis 1f: There is a significant relationship between interpersonal
relationships and staff’s intention to leave.
Hypothesis 1g: There is a significant relationship between working condition and
staff’s intention to leave.
Hypothesis 1h: There is a significant relationship between compensation and
staff’s intention to leave.
Work motivation varies by generations (Anexlsson & Bokedal, 2009). It is
because the world keeps on changing from time to time due to the country
development, technologies, communication systems, etc. These changes have built
different lifestyle and attitudes across the generations, and it also makes the
demand of each generation different from each other (Zemke et al., 2000; Smola
& Sutton, 2002; Spiro, 2006; Glass, 2007; Cennamo & Gardner, 2008; Tay, 2011).
Hence, the hypothesis will be postulated as:
Hypothesis 2: Generational differences have significant influence to motivation.
Hypothesis 2a: Generational differences have significant influence on expectation
of growth.
Hypothesis 2b: Generational differences have significant influence on expectation
of job itself.

Page 16 of 96
Hypothesis 2c: Generational differences have significant influence on expectation
of achievement.
Hypothesis 2d: Generational differences have significant influence on expectation
of recognition.
Hypothesis 2e: Generational differences have significant influence on expectation
of supervision.
Hypothesis 2f: Generational differences have significant influence on expectation
of interpersonal relationships.
Hypothesis 2g: Generational differences have significant influence on expectation
of working condition.
Hypothesis 2h: Generational differences have significant influence on expectation
of compensation.
Hypothesis 3: There is significant relationship between motivation and Gen X’s
intention to leave.
Hypothesis 3a: There is a significant relationship between growth and Gen X’s
intention to leave.
Hypothesis 3b: There is a significant relationship between job itself and Gen X’s
intention to leave.
Hypothesis 3c: There is a significant relationship between achievement and Gen
X’s intention to leave.
Hypothesis 3d: There is a significant relationship between recognition and Gen
X’s intention to leave.
Hypothesis 3e: There is a significant relationship between supervision and Gen
X’s intention to leave.
Hypothesis 3f: There is a significant relationship between interpersonal
relationships and Gen X’s intention to leave.

Page 17 of 96
Hypothesis 3g: There is a significant relationship between working condition and
Gen X’s intention to leave.
Hypothesis 3h: There is a significant relationship between compensation and staff
Gen X’s intention to leave.
Hypothesis 4: There are significant relationship between motivation and Gen Y’s
intention to leave.
Hypothesis 4a: There is a significant relationship between growth and Gen Y’s
intention to leave.
Hypothesis 4b: There is a significant relationship between job itself and Gen Y’s
intention to leave.
Hypothesis 4c: There is a significant relationship between achievement and Gen
Y’s intention to leave.
Hypothesis 4d: There is a significant relationship between recognition and Gen
Y’s intention to leave.
Hypothesis 4e: There is a significant relationship between supervision and Gen
Y’s intention to leave.
Hypothesis 4f: There is a significant relationship between interpersonal
relationships and Gen Y’s intention to leave.
Hypothesis 4g: There is a significant relationship between working condition and
Gen Y’s intention to leave.
Hypothesis 4h: There is a significant relationship between compensation and Gen
Y’s intention to leave.
Page 18 of 96
H2
H1,
H3,
H4
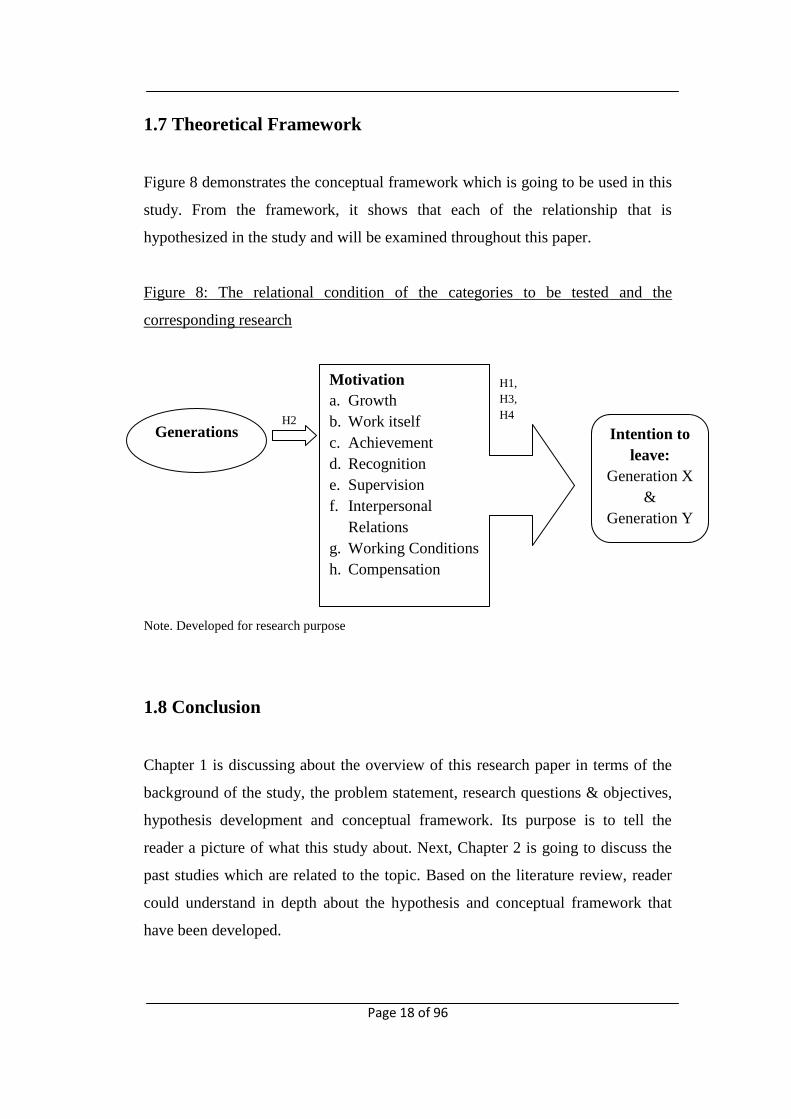
1.7 Theoretical Framework
Figure 8 demonstrates the conceptual framework which is going to be used in this
study. From the framework, it shows that each of the relationship that is
hypothesized in the study and will be examined throughout this paper.
Figure 8: The relational condition of the categories to be tested and the
corresponding research
Note. Developed for research purpose
1.8 Conclusion
Chapter 1 is discussing about the overview of this research paper in terms of the
background of the study, the problem statement, research questions & objectives,
hypothesis development and conceptual framework. Its purpose is to tell the
reader a picture of what this study about. Next, Chapter 2 is going to discuss the
past studies which are related to the topic. Based on the literature review, reader
could understand in depth about the hypothesis and conceptual framework that
have been developed.
Generations
Motivation
a. Growth
b. Work itself
c. Achievement
d. Recognition
e. Supervision
f. Interpersonal
Relations
g. Working Conditions
h. Compensation
Intention to
leave:
Generation X
&
Generation Y
Page 19 of 96
CHAPTER 2
LITERATURE REVIEW
2.1 Finance Team
Finance team is needed in every organization regardless the organization size. It
plays a fundamental role of manages and controls the company’s financial
resources. However, role of finance team has been evolving over the years and it
has become more important. It no longer is a department that merely doing
financial statements monthly, quarterly, and annually for the company. According
to Mak (2010), finance team functions to ensure data quality control, shoring up
working capital and improve operational efficiency. As mentioned at the
beginning of the study, finance is also one of the participants in company planning.
It provides facts and figures in top management decision making and planning.
Finance is also the one to ensure the accuracy and accountability upon the
implementation of the company’s plans (Mak, 2010).
Normally, finance team has a solid-line reporting structure to company’s Chief
Financial Controller (CFO). It also has to report to other team leaders such as
customer service team leader and sales team leader so that the key persons would
know their team performance and to improve themselves accordingly.
Normally, the number of staff in finance department could be ranging from one to
over hundreds. It depends on the transaction volume of the company. If the
transaction volume is small, the company could have only one finance staff who
handles day-to-day transactions as well as the financial statements. On the other

Page 20 of 96
hand, if the transaction volume is big, the company would have to get more
persons to handles different section in its finance department such as accounts
payables, accounts receivables, financial reporting, financial control, etc.
2.2 Staff’s Intention to Leave
Staff’s intention to leave would always lead to staff voluntary turnover. When a
staff has the intention to leave, there must be some factors that cause that feeling
of intention and these factors are the major keys to understand and manage staff
voluntary turnover. Staff turnover is always a major concern in an organization.
Rmalall (2004) said that organizations, regardless of size, technological advances,
market focus and other factors, are facing retention challenges. It would not only
lead to higher cost of replacement, it would also influence the staff morale,
customer satisfaction as well as customer loyalty (Miller, 2006). Therefore, staff
retention is much more important before the staff turnover happens.
When an organization does not able to retain her employees effectively, means her
staff turnover rate would be high. Staff turnover is defined as the rotation of
labours around the labour market between organizations, jobs and occupations, as
well as between the status of employed and unemployed (Abassi & Hollman,
2000). Price (1977) described the turnover as the ratio of the number of leaving
employees during the period against the average number of employees in the
organization during the period. Woods (1995), on the other hand, explained
turnover as a process associated with filling a vacancy where the vacancy is due to
either voluntary turnover or involuntary turnover.
As discussed previously, staff turnover brings a lot of costs to the organizations if
it is not well-managed. Voluntary turnover causes a loss to human capital
investment in an organization (Fair, 1992). It is because the leaving staff are
always taking with them the knowledge and skills which are valuable to the

Page 21 of 96
organizations (James-Francis, 2005). Hence, Michael and Crispen (2009)
concluded that staff retention is intentionally to prevent the loss of competent
employees from the organization.
In fact, staff retention is always a contradiction to staff turnover. Retention always
means the action done by an organization in engaging the employees for long term
(Chaminade, 2007). Job retention is defined by Mallol (2003) as the rate at which
continuous employment of the employees against the total number of employees
hired as well as total number of employees. Chaminade (2007) stated that
retention is a voluntary action done by the employer to create an environment that
could engage the employees for long term. Mitchell and friends (2001)
commented that people often leave their jobs for reasons unrelated to their jobs,
whereas they always stay in their jobs due to the sense of ‘fit’ and attachments on
the jobs and community. This sense of ‘fit’ and attachments would always cause
the feeling of commitment to employees and consequently lead to positive
attitudes towards their job (Chang, 1999).
Motivation was found to be related to organizational commitment. According to
O’Malley (2000), “commitment is critical to organizational performance, but it is
not a panacea. In achieving important organizational ends, there are other
ingredients that need to be added to the mix. When blended in the right
complements, motivation is the result”. Organizational commitment is positively
related to staff’s intention to stay (Becker, 1992). This is supported by James-
Francis (2005) who stated that commitment is the central to staff retention. Tietjen
and Myers (1998) defined the organizational commitment as a staff’s conscious
and deliberate willingness to stick with his or her employer.
Furthermore, some studies in organizational commitment conclude that job
satisfaction is positively associated with staff retention (Becker, 1992; William &
Hazar, 1986). This is supported by Mitchell et al. (2001) that people who feel
satisfied with their pay, career mobility, working conditions and work schedule,

Page 22 of 96
will stay with their employers. Another research done by Riggs and Rantz (2001)
concludes that the factors, such as participation in decision making, effective
interpersonal relationships and supervision, contribute to job satisfaction and
relate to staff retention.
2.3 Motivation
Motivation is a common word that we always heard in our life. The word
“motivation” origins from Latin word with the meaning of “to move” (Axelsson &
Bokedal, 2009; Kretiner, 1998). For employers, motivation is one of the major
methods to encourage their staff towards the organization goals and even to
reduce and control their turnover rates.
Motivation is a process that stimulates, energizes, directs and maintains people’s
attitudes, actions and performance (Luthans, 1998; Kreitner & Kinicki, 2004).
Mitchell & Daniels (2003) said that motivation varies within and across
individuals and it is a voluntary behaviour that works together with ability to
produce performance. Dorman and Gaudino (n.d.) mentioned that motivation is a
process that starts with psychological or physiological need that encourage a
particular attitude or behaviour that is aimed at a goal. It is an act of stimulating
people to have desired action in order to achieve desired goals. Rizwan, Azeem
and Asif (2010) stated that motivation encourages individuals internally on their
behaviours which help them to accomplish a task effectively and make them being
more committed to their works. This is supported by Pfeffer (1998) who said the
organizational effectiveness could be achieved if the employers know how to
utilize and manage their talents as well as satisfying their employees.
When people talk about motivation, most of the time they would think that
motivation is always positive. Actually, motivation can be positive and negative.
Positive motivation is taking place when, for example, people know that they

Page 23 of 96
would be rewarded after accomplishing a goal. The rewards can be either in
monetary terms such as salary increment, bonus and incentives, or in non-
monetary terms such as praise, personal advancement, recognition, etc. Negative
motivation, on the other hand, means that people are motivated by the previous
failures, others’ criticism or to avoid punishment. Besides that, motivation is
always goal-oriented and it is a continuous process so that the desired goals could
be achieved and maintained.
Employees need motivation in their workplaces. Once they are motivated, their
efficiency and effectiveness in work will be increased where their attendance will
also be improved. Highly motivated staff will not leave the companies easily and
consequently turnover rate is reduced and staff morale is increased (Miller, 2006).
Additionally, motivated employees are normally highly committed to their
employers and always think of company’s interest. As a result, corporation image
would also be improved.
Most of the time, monetary factors are taken place when people think of
motivation. In fact, motivation can be divided into two categories, which are
intrinsic motivation and extrinsic motivation. Deci, Connel and Ryan (1989)
defined intrinsic motivation as a motivation in performing task in order to obtain
the pleasure and satisfaction from the particular activity. The other researcher,
Agarwal (2010), also stated that intrinsic motivaion is derived when the action
itself provides pleasure and satisfaction to the actor. On the other hand, extrinsic
motivation is always linked to non-work related needs and work acts as a tool to
satisfy those tangible rewards such as salary, incentives, promotions, and so on
(Frey & Osterloh, 2002). Other than rewards, coercion and threat punishment,
which are known as negative motivation, are also types of extrinsic motivation.
Nevertheless, people prefer intrinsic motivation do not mean that they will not
seek for rewards, it just means that external rewards are not enough to keep a
person motivated. Frey (1997) also mentioned that extrinsic motivation sometimes
may interact negatively with intrinsic motivation.

Page 24 of 96
Motivation and satisfaction are very similar and considered to be synonymous
terms (Tan & Amna, 2011). However, there are also researchers pointed out the
differences between motivation and satisfaction (Hersey & Blanchard, 1988; Carr,
2005). A research done by Huselid (1995) says that turnover will increase if the
employees are not motivated. This statement was supported by other researchers
(Maidani, 1991; Tietjen & Myers, 1998; Robbins, 2001; Parsons & Broadbridge,
2006).
There are a lot of motivational theories developed and widely used by education
institutions and researchers nowadays. Herzberg’s two-factor theory is one the
well-known theory and had been applied in many researches (Tan & Amna, 2011;
Shannon, 2005; Michael & Crispen, 2009; Vera & Michael, 2004). It is also the
main reference for the independent variables (motivational factors) of this study.
Herzberg’s two-factor theory was presented by Fredrick Herberg and friends in
year 1959. This theory postulated satisfaction and dissatisfaction of employees. It
divides the motivational factors into two categories, which are motivator and
hygiene. Motivators which are intrinsic to the people, such as work itself,
recognition, achievement, etc, is normally creating satisfaction and motivation to
the actor if they are met. On the other hand, hygiene factors which are
characterized as extrinsic components, such compensation, company policies,
relationship with superiors and peers, working condition, etc, will not create
satisfaction and motivation to the actor if the factors are met. Its purpose is to keep
the actor away from dissatisfaction.
As mentioned previously, Herzberg’s Two-Factor Theory will be the reference for
the independent variables for this paper. Hence, four factors will be selected from
motivators (growth, job itself, achievement and recognition) and another four
factors will be selected from hygiene factors (supervision, interpersonal
relationships, working condition and compensation). Simple definitions of the
eight motivational factors are given as below:

Page 25 of 96
Independent
Variables Definition
Growth Opportunities of learning new skills with advancement
within the current job as well as personal growth
Job Itself Content of job
Achievement Satisfaction of completing a job, solving a problem, and
seeing the results of own's efforts
Recognition Recognition by others for completing a job well or
personal accomplishment
Supervision Technical ability and job knowledge of the supervisors
including the their willingness to teach or delegate
authority and fairness
Interpersonal Relations Job interactions & social interactions between
superiors, subordinates and peers
Working Conditions Physical environment of workplace (eg: workload,
facilities, space) as well as flexibility of workplace (eg:
working hours, dressing code, etc.)
Compensation Salary, allowances, bonus, increment, etc.
2.4 Generations
The impact of having few generations in the organizations has been seen and this
has increased the attention of researchers to analyse it since past decades (Kertner,
1983; Schuman & Scott, 1989; Jurkiewicz, 2000; Pekala, 2001; Hill, 2002; Noble
& Schewe, 2003; Glass, 2007; Lim, Pek & Yee, 2008; Tay, 2011).
Kupperschmidt (2000) defined generation as an “identifiable group that shares
birth, years, age, location and significant life events at critical developmental
stages”. Because of the different generation was born in different time, they are
most probably having the different lifestyle, values, attitudes, thinking,
expectations and this can be supported by few literatures. Cennamo and Gardner
(2008) claimed that the individual’s life experiences of each generational group
tend to shape their unique characteristics, aspirations, and expectations. Smola &
Sutton (2002) and Zemke et al. (2000) also stated that “the individuals share

Page 26 of 96
similar historical, economic, and social environment, they would also have similar
work values, attitudes and behaviours”. Gursoy, Maier and Chi (2008) said
“individuals who come of age in lean times or war years tend to think and act
differently than those born in peace and abundance”.
There are four generations being discussed since the past decades until today, they
are Traditionalists, Baby Boomers, Generation X (Gen X) and Generation Y (Gen
Y). These four generations represent four groups of people who born in four
different range of years.
Traditionalists refer to the people who were born before year 1946. They are also
called World War II Generation because they are the generation who has
experienced World War II. Baby boomers are the people who were born between
year 1946 to 1964 and they grew up in the post-World War II era. Gen X are those
who were born between year 1965 to 1980 while Gen Y refer to those who were
born after year 1980. In this study, Gen X and Gen Y are the focus and will be
discussed further in the following sections.
Consequently, employees from multi-generational in an organization should be
handled carefully. Hill & Stephens (2003) mentioned that the organizations could
stay away from inter-generational employee tensions and conflicts if management
understands the way they think and work, as well as sensitive to the needs of the
different groups of employees. It is mainly attributable to the differences between
the groups in terms of their distinct set of values, view of authority, orientation to
the world, loyalty, expectations of their leadership and ideal work environment
(Spiro, 2006). Because of the influential differences, every generation could
always bring something new and important to the workforce (Spiro, 2006).
Furthermore, Kowske, Rasch and Wiley (2010) also pointed out that there are
significant differences between Gen X and Gen Y in terms of the job satisfaction
and turnover intention. Hence, researcher will be discussing these two generations
in-depth in next sessions.

Page 27 of 96
2.4.1 Generation X
As mentioned above, Gen X are those who were born between year 1965 to 1980.
In US, this group of people was smaller than the boomer generation because of the
easier access to birth control and the decision to have smaller families (Glass,
2007).
When they were children, Gen X saw the recession, inflation, and stagflation had
worried the adults around them (Association of American Retired Persons, 2007).
The role of women had also changed. Their mothers were no longer waiting them
back from school at home but had to work outside. Hence, Gen X grew up as
latchkey kids and they had to take care of themselves as they were mostly having
working parents during their childhood (Glass, 2007).
They were also experiencing the high divorce rate around them during their
childhood which either their own parents, they aunts and uncles, or their friends’
parents (AARP, 2007). This phenomenon may influence them to be reluctant to
commit and to give their loyalty away (AARP, 2007).
In addition, they grew up during the beginning of the technology era where the
first type of personal computer was introduced and made the home computers and
internet were extensively used by the household (Brian, n.d.).
As a result, these changes have shaped them differently from previous
generations. They try to avoid the mistakes done by their parents and become a
group who values education, hard work and the power of money (Brian, n.d.).
In the workplace, Gen X employees are more money-oriented and skeptical than
the Boomers as they worry more about the uncertain future (Tay, 2011). Some
literatures described that Gen X tend to work smart and they prefer work-life
balance (Twenge, 2010; Gursoy et al., 2008; Spiro, 2006; Smola & Sutton, 2002).

Page 28 of 96
They place their family and social life greater than work (Spiro, 2006). They also
prefer autonomy and freedom from supervision in the workplace (Jurkiewicz,
2000). Gen X would expect appreciation and rewards from their employers when
they have achieved the organizational goals (Tay, 2011). Altimier (2006) said that
Gen X is not afraid of job-hoping as they are confident that they would be at
higher positions with higher pays in the next companies.
Like Baby Boomers, Gen X prefers face-to face communication. They would
rather to talk directly to their superiors for prompt response instead of sending
emails and waiting replies from their superiors (Tay, 2011; Glass, 2007). In the
study of Tay (2011), Gen X would stay longer with their employers if the jobs are
interesting with flexible work schedules as well as the jobs bring opportunities for
promotion.
2.4.2 Generation Y
Gen Y are the group of people who were born after year 1980. They are currently
the youngest employees in labour force. They can be considered as the
replacement to Baby Boomers who are going to retire in the next few years. Gen
Y are also named as Millenials. They are seen as a potential group of the nation’s
future leaders, managers, employees and consumer with high purchasing power
(Tay, 2011).
Most of the Gen Y are similar to Gen X, having double-income parents. They
grew up with modern technologies and computers are their essential tools in life.
Smartphones, such as Blackberry and iPhone are also widely used by this
generation. Social networking facilities such as Facebook, Twitter, Blogs, etc.
have become their major communication tools with their friends and families.
They also prefer to obtain the needed or latest information from internet search
engines rather than physical books, newspapers or magazines. Marketers call Gen
Page 29 of 96
Y as ‘first adapter’ as they are unafraid of new gadgets and technologies and
willing to be the first to try and buy (Glass, 2007).
Furthermore, Gen Y are perceived as confident, independent and goal-oriented
(Brian, n.d.). Leahy, McGinley, Thompson, Weese and Cohort 2 (n.d.) are having
the same definition of Gen Y with Spiro (2006), that Gen Y as self-sufficient,
hardworking, helpful, value networks and groups, knowledgeable and comfortable
with technology. They are also seen as civic-minded and fast learners but unhappy
with inflexible schedules and rigid procedures (Tay, 2011). Wong (2009)
described Gen Y as computer savvy. They stress on social networking, prefer
challenge and recognition, emphasize personal development, prefer efficient
communications and flexibility, work-life balance and job authority (Wong,
2009).
In workplace, Gen Y are more cooperative, better team players and more
optimistic about their future than previous generations (Zemke et al, 2000). They
are always willing to learn new skills and take up new challenges (Spiro, 2006).
They expect their superiors to remember their names and understand their needs
as well as care about their development (Gursoy et al., 2008). They are more
comfortable to communicate with their superiors and colleague by sending emails
or instant messaging, in stead of face to face conversation (Glass, 2007).
Moreover, they expect constant feedback and feel at ease in doing their works
with detailed instructions from their superiors (Glass, 2007).
In addition, they expect the organizations to spend more money and effort in
social responsibilities to save the environment (Tay, 2011). According to the
survey done by PricewaterhouseCooper (PwC) Malaysia (2009), corporate
responsibility is one of the crucial factors for Gen Y in choosing their employers.
The result of the survey shows that 86% of Gen Y respondents would choose their
employers based on the effort on corporate responsibility done by the particular

Page 30 of 96
companies, and 77% of them would leave the companies which do not match their
expectations on corporate responsibility.
2.5 Conclusion
Chapter 2 is actually covering the review of past studies. All the articles
highlighted in this chapter are to further discuss the development of the theoretical
framework and hypothesis for this study. Next, further explanation for research
methodology will be presented in Chapter 3.

Page 31 of 96
CHAPTER 3
RESEARCH METHOD
3.0 Overview
This study is concerning the association between Gen X and Gen Y and their
intention to leave the organizations. Motivation is the variable that links up the
two generations and their intention to leave.
The purpose of this chapter is to explain the research strategy that will be used to
gather data as well as analyze the collected data in order to generate the required
results. Therefore, in the rest of the chapter, several elements will be discussed,
including research design, data collection method, research design, questionnaire
design, sampling strategy and data analysis method.
3.1 Research Design
Research design is a master plan which indicates the methods and procedures for
collecting and analyzing the collected information (Zikmund, 2003). Research
design can also be considered as a blueprint for answering the research questions
and in turn fulfilling the research objectives (Cooper & Schindler, 2006). In
simple words, it shows the steps on how the research paper being conducted.
Descriptive analysis was used in the study. Creswell (1994) stated that descriptive
analysis is used to gather information about the present existing condition and it is

Page 32 of 96
more to describing but not judging or interpreting. Zikmund (2003) also explained
that descriptive analysis is normally used to describe the characteristics of a
population or phenomena. Hence, the aim of descriptive analysis is to obtain the
accurate profile of people or conditions. With this type of research analysis,
researcher must have a clear picture of the phenomena being identified before the
data being collected. Furthermore, the researcher uses this kind of research
method to obtain first hand data from the respondents in order to formulate
rational and sound conclusions and recommendations for the study. In this study,
the descriptive analysis was used to identify the impact of motivation to Gen X’s
intention to leave and Gen Y in an organization.
3.2 Data Collection Method
After the research design was established, researcher can start his or her process of
gathering data from the selected sample or respondents (Zikmund, 2003). Data
can be collected into two types, which are primary data and secondary data.
Primary data is the first hand data collected directly from the selected sample or
respondents and it is prior to analysis. On the other hand, secondary data is
obtained from the published literatures which were done previously by other
researchers. In this study, secondary data is not suitable to be used because there
are limited similar researches were being done in Malaysia and consequently
accurate data may be unable to be collected. Therefore, primary data will be
collected from the targeted respondents and then proceed to statistical testing and
analyzing.
As explained previously, primary data is the first hand data that collected directly
from the targeted sample or group of respondents and is intentionally collected to
complete a particular research project (Zikmund, 2003; Hair, Money, Samouel &
Page, 2007). Additionally, Cooper and Schindler (2006) defined primary data as
the original work of research or raw data prior to further interpretation that

Page 33 of 96
represents an official opinion or perception from the targeted sample. Despite
primary data collection is time consuming and costly, its results are having high
reliability due to the data is directly gathered from potential respondents.
To collect primary data, there are 3 methods, which are qualitative, quantitative as
well as mixed of these two methods. In this study, quantitative method is more
suitable because causal relationship will be going to analyze. Quantitative method
is used to gather numerical data using structured questionnaires of observational
guides to collect primary data (Hair et al., 2007). Zikmund (2003) mentioned that
survey questionnaire is a research technique in which the data is obtained from a
group of people and it is the most common way in generating primary data.
Hence, survey questionnaire was adopted in this study to gather needed
information from the targeted respondents because it is easy to administer and
transform into statistical information.
In this paper, survey questionnaire reached the respondents by using the
combination of traditional distribution and electronic survey. Electronic survey is
widely used nowadays because it is convenient, fast and easy data collection
process as well as analysis process (Hair et al., 2007). It makes the survey
questionnaire easily reach a huge population and a large volume of data could be
collected. It also eases the data collection process and reduces the cost and time
consumption. Moreover, it helps to capture, analyze and filter the unqualified data
from the massive data.
3.3 Sampling Design
This section discusses in depth about the target sample which is going to be
analyzed. Sampling is a process to select the elements or characteristics of the
potential respondents from a population (Sekaran, 2003). Cooper and Schindler

Page 34 of 96
(2006) defined population in research as a total collection of elements that
researchers prefer to make some inferences.
Zikmund (2003) explained that sampling involves any measures that use a small
number of items or a small group of a population to make a conclusion about the
population. In simple words, sampling is used to examine the result collected from
a portion of a population in order to represent the point of view of the entire
population.
3.3.1 Target Population
Target population is a specific group that is relevant to the research project
(Zikmund, 2003). The objective of this research paper is to examine the impact of
motivation to staff Gen X’s intention to leave and Gen Y in an organization.
Therefore, the target population is definitely Gen X who were born from 1960 to
1979 and Gen Y who were born after 1980. Moreover, these two groups of
respondents must be the full-time working adults who are currently holding a
position in finance or accounting department or finance-related field.
3.3.2 Sample Size
Sample size is defined as the number of respondents required in a study.
According to Roscoe (1975), sample size in the range of 30 to 500 is appropriate
for most of the researches. Hence, the targeted sample size of this study is at
around 200 with 100 from Gen X and another 100 from Gen Y. However, at least
250 respondents were approached to prevent the failure of achieving targeted
sample size due to too much unusable data.

Page 35 of 96
3.3.3 Sampling Method
Sampling technique is categorized into two major alternatives, which are
probability sampling technique and non-probability technique (Hair et al., 2007).
Probability sampling technique says that every element in the population was
known but not necessarily equal to probability of being selected as sample
(Zikmund, 2003; Hair et al., 2007). Furthermore, Hair et al. (2007) also mentioned
that probability sampling is having few methods including simple random
sampling, systematic sampling, stratified sampling, cluster sampling and multi-
stage cluster sampling. On the other hand, non-probability technique is defined as
a sampling technique that not every element of the target population has a chance
of being selected because the inclusion or exclusion of elements in a sample is left
to the discretion of the research (Zikmund, 2003; Hair et al., 2007). Convenience
sampling, judgment sampling, quota sampling and snowball sampling are
included in non-probability technique (Hair et al., 2007).
In this study, non-probability technique was being utilized especially the
convenience sampling and snowball sampling. Convenience sampling is to assure
the targeted sample and sample size are easily reached. It normally is the samples
that are available to participate in the survey and can provide the needed
information (Zikmund, 2003; Hair et al., 2007). Snowball sampling is also named
as referral sampling which means the respondents may introduce others who are
also in this category and willing to participate in this survey. When time goes by,
the number of respondent might achieve to the desired level.
3.4 Research Instrument
Research instruments including questionnaire design and scale measurement will
be discussed in-depth in the following section.

Page 36 of 96
3.4.1 Questionnaire Design
Questionnaire survey is the most common way and widely used by the
researchers. Zikmund (2003) defined questionnaire survey as a set of questions
that being developed in order to obtain the needed information from the targeted
sample.
In this study, questionnaire is the main instrument being used to gather the data. It
is divided into three sections, which are (A) respondent profile, (B) perception of
motivational factors and level of satisfaction in current organization, and (C)
intention to leave current organization. Section B and C are designed in close-
ended form and assessed by using Five-Point Likert Scale (eg. 1=strongly
disagree, 5=strongly agree) and respondents are given the options to choose the
answers that best describe their ideas. Data is easier to be recorded and measured
by using close-ended form despite close-ended form may be difficult to designed
(Zikmund, 2003).
3.4.2 Measurement Scales
Zikmund (2003) defined measurement scale as any series of items that are
arranged progressively according to value or magnitude, into which an item can
be categorized according to its quantification and reflect the characteristics of the
items being measured. Zikmund (2003) also stated that a scale is a continuous
spectrum or series of categories to represent quantitatively an item’s, a person’s or
a situation’s status in the range. Measurement scale is divided into few types,
which are nominal scale, ordinal scale, interval scale and ratio scale. In this study,
nominal scale and ordinal scale were being used to measure the questionnaire.

Page 37 of 96
3.4.2.1 Nominal Scale
Nominal scale uses a numbers as labels to identify and categorized the
individuals, objects or events on a scale (Zikmund, 2003; Hair et al., 2007). It is
the easiest type of scale and applicable to most of the researches. In this study,
nominal scale was used to measure the respondent profile including gender, races
and educational attainment.
3.4.2.2 Ordinal Scale
Ordinal scale is defined as ranking scale and it divides the objects into pre-
determined categories according to some criteria such as preference, age, and
income group (Hair et al., 2007). This was supported by Zikmund (2003) who
stated that ordinal scale arranges objects according to their magnitudes. The
respondent profile regarding to year(s) of working experience, number of
company that have been working with, year(s) of working in current companies
and current position level in current companies were measured by ordinal scale in
this study.
In addition, there is one type of ordinal scale which is most common and widely
used in research study, named Likert Scale. Likert Scale could be applied on the
questionnaire for both dependent and independent variables. It is normally being
used to measure how the respondents indicate their level of feeling that best
describes their view or idea to certain issue or topic (Likert, 1932). Five-point
Likert Scale is the most common Likert Scale and it is usually used to measure the
respondents’ level of agreement or level of satisfaction (1=strongly disagree/very
dissatisfied, 2=disagree/dissatisfied, 3=neutral, 4=agree/satisfied, 5=strongly
agree/very satisfied).

Page 38 of 96
Likert Scale was used to measure Section B in this study regarding to the
perception of motivational factors (growth, job itself, achievement, recognition,
supervision, interpersonal relationships, working conditions, and compensation)
and level of satisfaction towards the eight factors in current organization. Each of
the questions in Section B were scaled using Five-Point Likert Scale and the
respondents were required to choose the scale the best aligns with their opinion.
3.5 Pilot Test
Pilot testing is a small size of data collection before the actual data collection
being conducted. Its purpose is to detect the weaknesses in the designed
questionnaire by using a probability sample served as a guide for the main study
(Cooper & Schindler, 2006). The weaknesses detected will then be rectified
accordingly. Therefore, its role is to ensure the designed questionnaire is
understandable and effective in gathering needed information. It can also identify
the reliability and validity of the questionnaire.
Hence, before the data collection process started for this paper, a pilot test had
been conducted. 20 respondents were required to answer the questionnaire and the
collected data were then being tested its reliability. Table 1 shows the reliability
result for the pilot test using Cronbach’s Alpha Coefficient.

Page 39 of 96
Table 1: Reliability Analysis Result for Pilot Testing
My Expectation My current
organization
Growth 4 0.931 0.828
Job Itself 4 0.835 0.839
Achievement 4 0.961 0.887
Recognition 4 0.889 0.884
Supervision 4 0.918 0.826
Interpersonal Relationships 4 0.863 0.897
Working Condition 4 0.935 0.855
Compensation 4 0.863 0.881
Dependent
Variable
Intention to Leave 3 N/A 0.735
Cronbach's Alpha CoefficientNo. of
ItemsVariables
Independent
Variables
Note. Developed for research purpose
In Table 1, it shows that both of the independent and dependent variables are
reliable because they managed to achieve the values of above 0.7 for the reference
to Cronbach’s Alpha Coefficient. It means that this questionnaire is
understandable and reliable. Therefore, it is ready to distribute to the targeted
sample for data collection.
3.6 Data Processing
After the data collection process is done, the collected data will be analyzed by
using certain research tool such as computer software program. The analysis result
allows the researcher to understand in depth about the collected information and
subsequently justify the hypothesis.
In this paper, Statistical Package for Social Science Version 12 (SPSS 12) was
being used to do the necessary data analysis. It is a computer software program
that enables the researcher to measure and analyze the quantitative data with a

Page 40 of 96
more effective and efficient way. Descriptive analysis, reliability analysis and
Multiple Linear Regression Analysis were being conducted throughout this study.
3.6.1 Descriptive Analysis
Descriptive analysis is usually used to analyze the demographic and general data.
The result of the analysis will then be presented through the frequency
distribution. Zikmund (2003) defined frequency distribution as a set of data
organized by summarizing the number of times a particular value of a variable
occurs. Frequency distribution can be presented in the form of bar chart, pie chart,
line chart and other, so that the data is easier being analyzed by the researcher. By
analyzing the frequency distribution, the relevancy of the targeted sample for the
research is easier to be interpreted. Therefore, this frequency distribution analysis
had been used to analyze the respondent profile.
3.6.2 Reliability Analysis
Reliability is defined as the degree to which measures are error-free and
consequently yield consistent results (Zikmund, 2003). Sekaran (2003) also stated
that the reliability is to indicate the stability and consistency of the survey
questionnaire in measuring the concept and facilitate the access for “goodness” of
measures. In simple word, reliability test is used to ensure the questionnaire is
able to measure the variables. Low reliability means that the measuring process is
imperfect and will influence the whole research paper in different ways each when
the measurement is taken (Zikmund, 2003).
Reliability is normally indicated by Cronbach’s Alpha or Coeffient Alpha (Hair,
Babin, Money & Samouel, 2003). When the value for the Cronbach’s Alpha or
Coefficient Alpha is high, it means that the correlation among the items in the

Page 41 of 96
survey is strong and results a high reliability to the research results. Table 2 shows
the rules of thumb for Cronbach’s Alpha coefficient acceptance or rejection by the
researcher.
Table 2: Alpha Coefficient
Alpha Coefficient Range Strength of Association
Less than 0.6 Poor
0.6-0.7 Moderate
0.7-0.8 Good
0.8-0.9 Very Good
0.9 and above Excellent
Note. Adapted from Hair, J.F., Babin, B., Money, A.H., & Samouel, P. (2003). Essentials of
Business Research Methods. United States of America: John Wiley & Sons, Inc.
Hair et al. (2003) suggested that a minimum reliability value of 0.7 is required in
order to fulfil the research purpose as it indicates that the instrument is able to
generate a 70% of consistency for the research paper.
3.6.3 Independent T-test
Independent T-test is one of the analyses that used to do the hypothesis testing. It
is normally used to test if the mean scores of interval-scaled variable are
significantly different for two independent samples (Zikmund, 2002). It is also a
distribution that resembles the normal curve. According to Antonius (2003),
Independent T-test is useful for the researcher to determine whether the two
independent samples are likely from the same population. In this study,
Independent T-test will be used to test Hypothesis 2.

Page 42 of 96
For Independent T-test, Levene test for equality of variances is used to examine
the homogeneity of variances between the two independent samples. If the result
is significant with p value lower than 0.05, the null hypothesis (H0) on the equality
of variance is rejected while the alternative hypothesis is accepted (H1). On the
other hand, if the result with p value more than 0.05, it means the null hypothesis
(H0) on the equality of variance is accepted while the alternative hypothesis (H1) is
rejected.
3.6.4 Multiple Linear Regression Analysis
Multiple Linear Regression Analysis is being used to examine Hypothesis 1, 3 and
4 in this study. Regression analysis is divided into univariate and bivariate
analysis. In this paper, it is more appropriate to utilize bivariate regression
analysis. Hair et al. (2003) explained that bivariate analysis is a type of regression
that with single metric dependent variable and single metric independent variable
and it identifies the relationship between one independent variable and dependent
variable. Multiple Linear Regression Analysis is the extension of bivariate
regression analysis where it investigates the effect of two or more independent
variables on a single metric dependent variable (Zikmund, 2003). Nevertheless, a
separate regression coefficient is calculated for each independent variable to
describe its individual relationship with the dependent variable (Hair et al., 2003).
The relationship between independent variables and dependent variable can be
determined by using a linear equation (Zikmund, 2003; Hair et al., 2003; Cooper
& Schindler, 2006) as follows:

Page 43 of 96
Y= a + b1X1 + b2X2 + b3X3 + …+ bnXn
Where: Y = Predicted Variable
a = Constant value, the value of Y when the line cuts Y axis all X
value =0
b = The slope, or change in Y for any corresponding change in
one
unit of X
X = The Variable use to predict Y
To explain the impact of variation in independent variables (X) to variation in
dependent variable (Y), coefficient of multiple determinations or multiple index of
determination (adjusted R2) will play the role. Zikmund (2003) stated that adjusted
R2
shows the percentage of variation in Y is explained by the variation in the X in
Multiple Linear Regression Analysis. For instance, the result of 0.8 for adjusted
R2 explains that the variation in X collectively will bring 80% variation to Y.
Furthermore, in order to justify how great the effect of each independent variable
to the dependent variable, the value of unstandardized beta coefficients is
significant. It indicates “the change in dependent variables that results from one-
standard-deviation change in the independent variable” (Schroeder, Sjoquist &
Stephan, 1986).
Additionally, F-test is also important in explaining the relationship between X and
Y especially used to evaluate the hypothesis that involve multiple parameters
(Blackwell, 2008). The larger the F-ratio or F-statistic is, the more valid the model
is (Fall, 2004).
In this paper, the impact of motivational factors to Gen X’s intention to leave and
Gen Y in Finance team will be tested by using the Multiple Linear Regression
Analysis. It is because Multiple Linear Regression Analysis explains the
relationship between the independents variables and dependent variable. Hence, it

Page 44 of 96
can help to explain the relationship between the eight motivational factors and
staff retention for the study.
3.7 Conclusion
Chapter 3 explains in-depth about the research methodology that was being used
throughout the study. The research methods of this study are presented from
research design, data collection method, sampling design, research instruments, to
data processing methods. Hence, next chapter is going to interpret the data that
have been obtained from the targeted sample via questionnaire survey.

Page 45 of 96
CHAPTER 4
RESEARCH RESULTS
4.0 Overview
After the research methodology was introduced in preceding chapter, the research
results and findings will be discussed in this chapter. As elaborated previously, the
data of this study was collected and analyzed by using SPSS 12. The results are going
to be presented as descriptive analysis, Independent T-test and Multiple Linear
Regression Analysis.
4.1 Descriptive Analysis
The questionnaires were reached the respondents by using the combination of
traditional distribution and electronic survey. 250 sets of data were the targeted
sample as mentioned in previous chapter. Around 80 sets of questionnaire were
distributed traditionally. After filtered, there are 74 sets completed to be analyzed.
On the other hand, researcher managed to derive another 167 sets of response
from electronic survey whereas 148 sets of them met the requirements of the
study. Hence, total of 222 sets of data were being analyzed and further discussed.
In descriptive analysis, respondents profile was presented in terms of gender, age,
race and educational attainment. Furthermore, the respondents were also being
asked about the years of working, number of companies that have been working
for, years of working in current company as well as current position level.
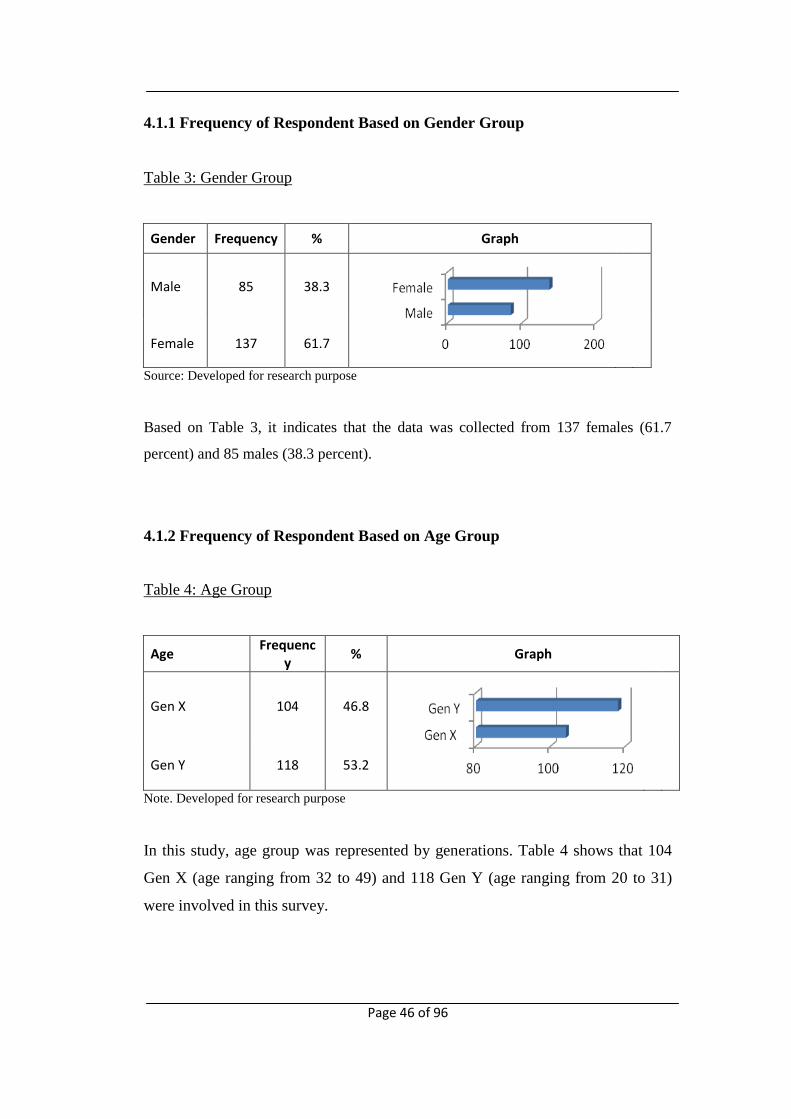
Page 46 of 96
4.1.1 Frequency of Respondent Based on Gender Group
Table 3: Gender Group
Gender Frequency % Graph
Male 85 38.3
Female 137 61.7
Source: Developed for research purpose
Based on Table 3, it indicates that the data was collected from 137 females (61.7
percent) and 85 males (38.3 percent).
4.1.2 Frequency of Respondent Based on Age Group
Table 4: Age Group
Age Frequenc
y % Graph
Gen X 104 46.8
Gen Y 118 53.2
Note. Developed for research purpose
In this study, age group was represented by generations. Table 4 shows that 104
Gen X (age ranging from 32 to 49) and 118 Gen Y (age ranging from 20 to 31)
were involved in this survey.

Page 47 of 96
4.1.3 Frequency of Respondent Based on Race Group
Table 5: Race Group
Race Frequency % Graph
Malay 38 17.1
Chinese 143 64.4
India 38 17.1
Others 3 1.4
Note. Developed for research purpose
The targeted respondents of this study are Gen X and Gen Y who are currently
working in finance team. Table 5 shows that the total of 222 respondents is the
combination of 143 Chinese respondents (64.4 per cent), 38 Malay respondents (17.1
per cent), 38 Indian respondents (17.1 per cent), and the remaining 3 respondents are
from other races (1.4 per cent) including Sino Dusun, Punjabi and Iban.

Page 48 of 96
4.1.4 Frequency of Respondent Based on Educational Attainment
Table 6: Educational Attainment
Education Attainment
Frequency % Graph
Secondary School
3 1.4
High School 5 2.3
Diploma 47 21.2
Degree 127 57.2
Post-Degree 33 14.9
Professional Certificate
7 3.2
Note. Developed for research purpose
In terms of highest educational attainment, 127 respondents (57.2 per cent) have
obtained their Bachelor Degree, followed by 47 respondents (21.2 per cent) who have
completed their Diploma courses, 33 respondents (14.9 per cent) have done their
Post-degree courses, 7 respondents (3.2 per cent) have professional qualification, 5
respondents (2.3 per cent) have stopped their studies at high school level and lastly 3
respondents (1.4 per cent) have only completed secondary school.
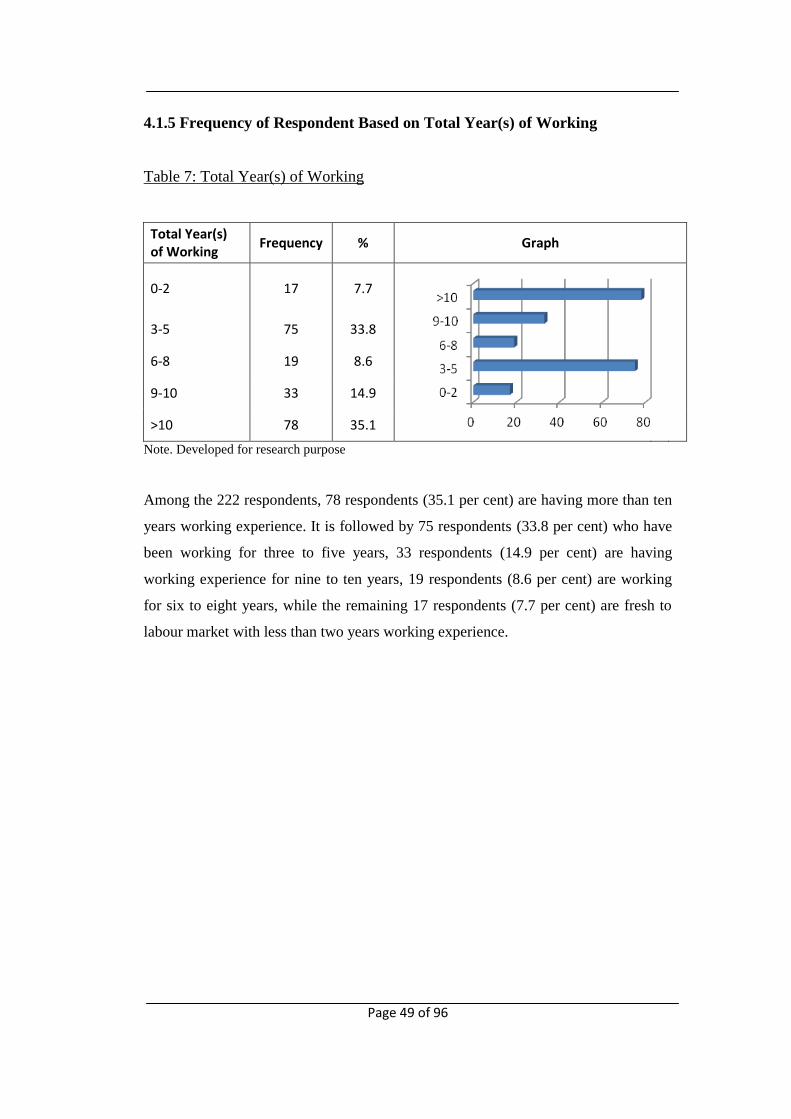
Page 49 of 96
4.1.5 Frequency of Respondent Based on Total Year(s) of Working
Table 7: Total Year(s) of Working
Total Year(s) of Working
Frequency % Graph
0-2 17 7.7
3-5 75 33.8
6-8 19 8.6
9-10 33 14.9
>10 78 35.1
Note. Developed for research purpose
Among the 222 respondents, 78 respondents (35.1 per cent) are having more than ten
years working experience. It is followed by 75 respondents (33.8 per cent) who have
been working for three to five years, 33 respondents (14.9 per cent) are having
working experience for nine to ten years, 19 respondents (8.6 per cent) are working
for six to eight years, while the remaining 17 respondents (7.7 per cent) are fresh to
labour market with less than two years working experience.

Page 50 of 96
4.1.6 Frequency of Respondent Based on Number of Company have been
Working With
Table 8: Number of Company have been Working With
No. of Company have been working with
Frequency % Graph
1 24 10.8
2 70 31.5
3 36 16.2
4 46 20.7
5 34 15.3
>5 12 5.4
Note. Developed for research purpose
Out of the total of 222 respondents, 70 of them (31.5 per cent) have been working
for two companies. It is then followed by 46 respondents (20.7 per cent) who have
worked for four employers, 36 respondents (16.2 per cent) have worked for three
employers, 34 respondents (15.3 per cent) are working in their fifth company, 24
respondents (10.8 per cent) are working for the first employer, whereas the
remaining 12 respondents (5.4 per cent) have been working with more than five
employers.

Page 51 of 96
4.1.7 Frequency of Respondent Based on Position Level in Current
Organization
Table 9: Position Level in Current Company
Position Level Frequency % Graph
Non-executive 23 10.3
Executive 130 58.6
Manager 42 18.9
>Manger 27 12.2
Note. Developed for research purpose
Out of the total of 222 respondents, 130 of them (58.6 per cent) are executives in
their current companies and it is then followed by 42 managers (18.9 per cent).
Moreover, 27 respondents (12.2 per cent) are currently at the position of above
manager whereas 23 respondents (10.3 per cent) are at non-executive level.

Page 52 of 96
4.1.8 Frequency of Respondent Based on Year(s) of Working in Current
Organization
Table 10: Year(s) of Working in Current Organization
Year(s) of Working in Current Firm
Frequency
% Graph
0-2 108 48.6
3-5 72 32.4
6-8 15 6.8
9-10 20 9.0
>10 7 3.2
Note. Developed for research purpose
Among the 222 respondents, 108 of them (48.6 per cent) newly joined their
current companies with service less than two years. 72 respondents (32.4 per cent)
have been working for three to five years in current companies, followed by 20
respondents (9.0 per cent) with nine- to ten-year service, 15 respondents (6.8 per
cent) with six- to eight-year service, while the remaining 7 respondents (3.2 per
cent) have been working for more than ten years with their current employers.
4.1.9 Mean of Respondent Based on Expectation of Motivational Factors
Mean was being used to figure out the ranking of motivational factors between
Gen X and Gen Y. The purpose is to examine if the generational difference has
significant impact to the expectation of motivational factors, which was shown as
below:

Page 53 of 96
H0 : Generational differences have no significant influence to motivation.
H2 : Generational differences have significant influence to motivation.
Table 11 shows that motivational factors that ranked by Gen X. At the scale of 1
to 5, an efficient supervision is the most important factor to motivate Gen X in
their work, where the mean value is 4.35. It is followed by the mean value of 4.32
and 4.29 for achievement and compensation respectively. Growth and working
condition were both recorded at the same mean value of 4.16 and ranked at 4th
place. The mean value of 4.14 and 3.89 were given to job itself and recognition by
Gen X while the least important factor to motivate Gen X is interpersonal
relationship with the mean value of 3.55.
Table 11: Ranking of Motivational Factors for Gen X
Expectation of Motivation
Mean Graph
Growth 4.16
Job itself 4.14
Achievement 4.32
Recognition 3.89
Supervision 4.35
Interpersonal Relationships
3.55
Working Condition
4.16
Compensation 4.29
Note. Developed for research purpose
On the other hand, Table 12 shows that motivational factors that ranked by Gen Y
in this study. At the scale of 1 to 5, job itself and achievement were ranked the
same by Gen Y with the highest mean of 4.27 respectively. They are then

Page 54 of 96
followed by working condition and growth with the mean value of 4.36 and 4.31
respectively. Among the eight motivational factors, supervision, compensation
and recognition were reported as 5th
, 6th
and 7th
important factor to motivate Gen
Y while the least important factor is interpersonal relationships with mean value
of 3.93.
Table 12: Ranking of Motivational Factors for Gen Y
Expectation of Motivation
Mean Graph
Growth 4.31
Job itself 4.27
Achievement 4.27
Recognition 4.05
Supervision 4.30
Interpersonal Relationships
3.93
Working Condition
4.36
Compensation 4.16
Note. Developed for research purpose
From the two tables above (Table 11 and Table 12), they show that Gen X and
Gen Y ranked their expectation on the motivational factors different from each
other. It could be concluded that generational difference has a significant
influence on the expectation of motivational factors. Hence, H0 is rejected while
H2 is accepted.

Page 55 of 96
4.2 Independent T-test Analysis
Independent T-test was used to examine Hypothesis 2a to 2h as below:
H0 : Generational differences have no significant influence to the expectation
motivational factors (growth, job itself, achievement, recognition, supervision,
interpersonal relationship, working condition and compensation).
H2a - H2h : Generational differences have significant influence to the expectation
of motivational factors (growth, job itself, achievement, recognition, supervision,
Interpersonal relationship, working condition and compensation).
As mentioned previously, Levene’s test for equality of variance was conducted to
measure the homogeneity of the variance. Based on the result in Table 13, the p
value shows that interpersonal relationships (p = .000) and working condition (p =
.036) are significantly influenced by generational difference between Gen X and
Gen Y. Hence, H0 for these two factors are rejected.

Page 56 of 96
Table 13: Independent T-test between Generational Differences and Interpersonal
Relationships and Working Condition
Levene's Test for Equality of
Variances t-test for Equality of Means
F Sig. t df
Sig. (2-
tailed) Mean
Difference Std. Error Difference
95% Confidence
Interval of the Difference
Lower Upper
My expectation _Interpersonal Relationships
Equal variances assumed 33.323 0.000
-3.698 220.000 0.000 -0.384 0.104
-0.589
-0.179
Equal variances not assumed
-3.621 182.429 0.000 -0.384 0.106
-0.593
-0.175
My expectation _Workplace
Equal variances assumed 1.402 0.238
-2.109 220.000 0.036 -0.192 0.091
-0.372
-0.013
Equal variances not assumed
-2.086 202.113 0.038 -0.192 0.092
-0.374
-0.011
Note. Developed for research purpose
On the other hand, other factors such as growth, job itself, achievement,
recognition, supervision and compensation are having p value higher than .05 as
shown in Table 14, which are not significantly influenced by generational
differences between Gen X and Gen Y. Hence, H2a, H2b, H2c, H2d, H2e, and H2h are
rejected.
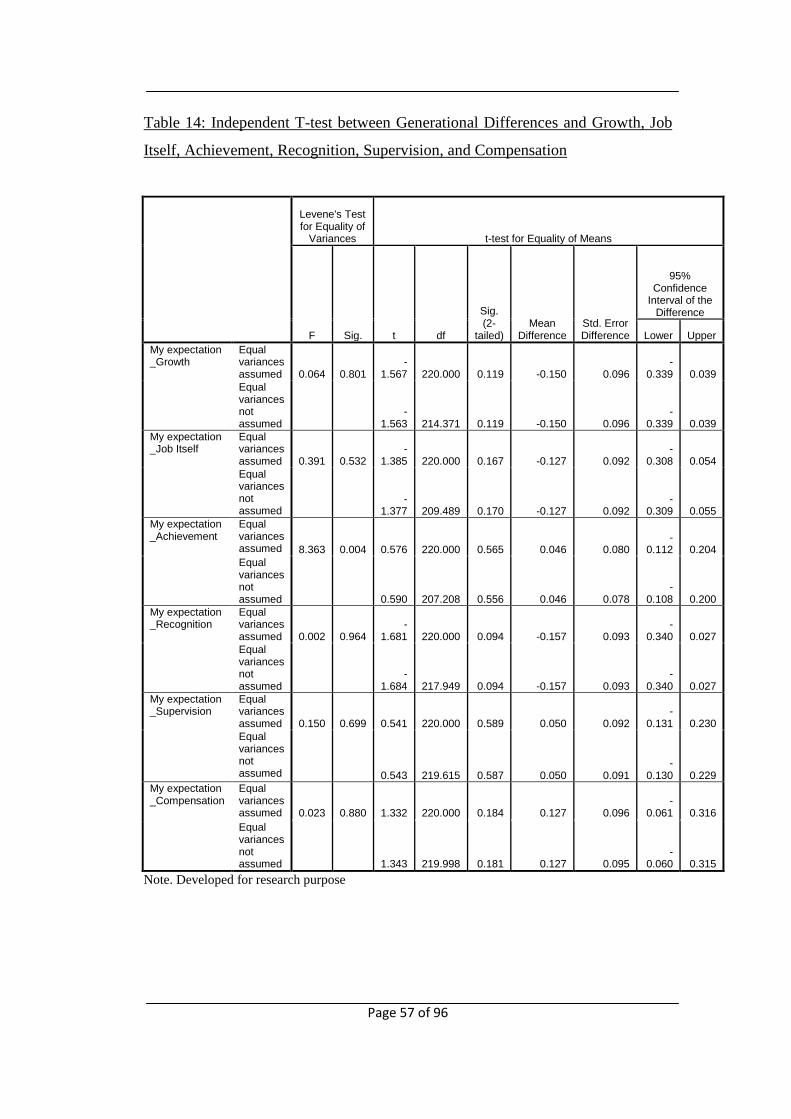
Page 57 of 96
Table 14: Independent T-test between Generational Differences and Growth, Job
Itself, Achievement, Recognition, Supervision, and Compensation
Levene's Test for Equality of
Variances t-test for Equality of Means
F Sig. t df
Sig. (2-
tailed) Mean
Difference Std. Error Difference
95% Confidence
Interval of the Difference
Lower Upper
My expectation _Growth
Equal variances assumed 0.064 0.801
-1.567 220.000 0.119 -0.150 0.096
-0.339 0.039
Equal variances not assumed
-1.563 214.371 0.119 -0.150 0.096
-0.339 0.039
My expectation _Job Itself
Equal variances assumed 0.391 0.532
-1.385 220.000 0.167 -0.127 0.092
-0.308 0.054
Equal variances not assumed
-1.377 209.489 0.170 -0.127 0.092
-0.309 0.055
My expectation _Achievement
Equal variances assumed 8.363 0.004 0.576 220.000 0.565 0.046 0.080
-0.112 0.204
Equal variances not assumed 0.590 207.208 0.556 0.046 0.078
-0.108 0.200
My expectation _Recognition
Equal variances assumed 0.002 0.964
-1.681 220.000 0.094 -0.157 0.093
-0.340 0.027
Equal variances not assumed
-1.684 217.949 0.094 -0.157 0.093
-0.340 0.027
My expectation _Supervision
Equal variances assumed 0.150 0.699 0.541 220.000 0.589 0.050 0.092
-0.131 0.230
Equal variances not assumed 0.543 219.615 0.587 0.050 0.091
-0.130 0.229
My expectation _Compensation
Equal variances assumed 0.023 0.880 1.332 220.000 0.184 0.127 0.096
-0.061 0.316
Equal variances not assumed 1.343 219.998 0.181 0.127 0.095
-0.060 0.315
Note. Developed for research purpose

Page 58 of 96
4.3 Multiple Linear Regression Analysis
Multiple Linear Regression Analysis was used to examine Hypothesis 1, 3 and 4
in this study.
4.3.1 Motivation and Staff’s Intention to Leave
H0 : There is no relationship between motivation and staff’s intention to leave.
H1 : There is a significant relationship between motivation and staff’s intention to
leave.
From Table 15, it shows that adjusted R² at 0.237 which indicates that the eight
motivational (growth, job itself, achievement, recognition, supervision,
interpersonal relationships, working condition and compensation) are explaining
23.7 per cent of the relationship between motivation and intention to leave
collectively.
Table 15: Multiple Linear Regression Analysis between Motivation and Staff
Retention
Model R R Square Adjusted R
Square Std. Error of the Estimate
1 .487(a) .237 .208 .946
Note. Developed for research purpose
Furthermore, the ANOVA table as shown in Table 16 indicates that the model is
highly significant and accepted since the p value of the F ratio is less than .05 (p =
.000). As a result, the eight motivational factors in this regression model manage
to explain the relationship between motivation and intention to leave. Hence, H0 is
rejected.

Page 59 of 96
Table 16: ANOVA(b) for Relationship between Motivation and Staff’s Intention
to Leave
Model Sum of
Squares df Mean Square F Sig.
1 Regression 59.155 8 7.394 8.265 .000(a)
Residual 190.561 213 .895
Total 249.716 221
Note. Developed for research purpose
In order to determine the relationship between each of the independent variables
and staff’s intention to leave, hypothesis was postulated as below:
H0: There are no significant relationships between the motivational factors
(growth, job itself, achievement, recognition, supervision, interpersonal
relationships, working condition, and compensation) and staff’s intention to leave.
H1a - H1h: There are significant relationships between the motivational factors
(growth, job itself, achievement, recognition, supervision, interpersonal
relationships, working condition, and compensation) and staff’s intention to leave.
Table 17 shows that only two motivational factors are having statistically
significant influence to the model with p value less than .05. The two factors are
job itself (p = .003) and recognition (p = .038). Therefore, H0 for these two factors
are rejected whereas H1a, H1c, H1e, H1f, H1g and H1h are also rejected.

Page 60 of 96
Table 17: Coefficients (a) for Relationship between Motivation and Staff’s
Intention to Leave
Model
Unstandardized Coefficients
Standardized Coefficients
t Sig. B Std. Error Beta
1 (Constant) 5.465 .409 13.359 .000
My organization_ Growth -.177 .125 -.132 -1.411 .160
My organization_ Job Itself -.363 .119 -.265 -3.044 .003
My organization_ Achievement .220 .119 .148 1.844 .067
My organization_ Recognition -.225 .108 -.171 -2.089 .038
My organization_ Supervision -.055 .098 -.044 -.562 .575
My organization_ Interpersonal Relationships -.174 .113 -.132 -1.539 .125
My organization_ Working Condition .063 .096 .053 .658 .511
My organization_ Compensation -.043 .095 -.033 -.448 .654
Note. Developed for research purpose
In addition, unstandardized coefficients values are explaining that the contribution
of every motivational factors to the staff’s intention to leave. According to the
Table 17, achievement (0.220) and working condition (0.063) are having positive
relationship with staff’s intention to leave. On the other hand, growth (-0.177), job
itself (-0.363), recognition (-0.225), supervision (-0.055), interpersonal
relationship (-0.174) and compensation (-0.043) are negatively related to staff’s
intention to leave. Hence, the relationship between motivation and staff’s intention
to leave can be explained by using the following equation:
Staff’s intention to leave = 5.465 - 0.177G - 0.363J + 0.220A - 0.225R - 0.055S -
0.174I + 0.063W – 0.043C
G = Growth
J = Job Itself

Page 61 of 96
A = Achievement
R = Recognition
S = Supervision
I = Interpersonal Relationships
W = Working Condition
C = Compensation
4.3.2 Motivation and Gen X’s intention to leave
H0 : There is no relationship between motivation and Gen X’s intention to leave.
H3 : There is a significant relationship between motivation (growth, job itself,
achievement, recognition, supervision, interpersonal relations, working conditions
and compensation) and Gen X’s intention to leave.
From Table 18, it shows that adjusted R² at 0.551 which indicates that the eight
motivational (growth, job itself, achievement, recognition, supervision,
interpersonal relationships, working condition and compensation) are explaining
55.1 per cent of the relationship between motivation and staff Gen X’s intention to
leave collectively.
Table 18: Multiple Linear Regression Analysis between Motivation and Gen X’s
intention to leave
Model R R Square Adjusted R
Square Std. Error of the Estimate
1 .742(a) .551 .513 .686
Note. Developed for research purpose
Furthermore, the ANOVA table as shown in Table 19 indicates that the model is
highly significant and accepted since the p value of the F ratio is less than .05 (p =

Page 62 of 96
.000). As a result, the eight motivational factors in this regression model manage
to explain the relationship between motivation and staff Gen X’s intention to
leave. Hence, H0 is rejected.
Table 19: ANOVA(b) for Relationship between Motivation and Gen X’s intention
to leave
Model Sum of
Squares df Mean Square F Sig.
1 Regression 54.865 8 6.858 14.587 .000(a)
Residual 44.664 95 .470
Total 99.529 103
Note. Developed for research purpose
To test the relationship between each of the independent variables and Gen X’s
intention to leave, hypothesis was postulated as below:
H0: There is no significant relationship between the motivational factors (growth,
job itself, achievement, recognition, supervision, interpersonal relationships,
working condition, and compensation) and Gen X’s intention to leave.
H3a – H3h: There are significant relationships between the motivational factors
(growth, job itself, achievement, recognition, supervision, interpersonal
relationships, working condition, and compensation) and Gen X’s intention to
leave.
Table 20 shows that among the eight motivational factors, three of them are
having statistically significant influence to the model with p value less than .05.
The three factors are job itself (p = .013), interpersonal relationship (p = .000) and
working condition (p = .045). However, there are five factors with p value more
than .05, which are growth, (p = .449), achievement (p = .083), recognition (p =
.087), supervision (p = .054) and compensation (p = .859). Hence, H0 for the three
factors are rejected whereas H3a, H3c, H3d, H3e, and H3h are also rejected.

Page 63 of 96
Table 20: Coefficients (a) for Relationship between Motivational Factors and Gen
X’s intention to leave
Model
Unstandardized Coefficients
Standardized Coefficients
t Sig. B Std. Error Beta
1 (Constant) 5.792 .755 7.667 .000
My organization_Growth .188 .247 .110 .761 .449
My organization_Job Itself -.656 .259 -.473 -2.535 .013
My organization_ Achievement .312 .178 .165 1.751 .083
My organization_ Recognition -.277 .160 -.193 -1.732 .087
My organization_ Supervision .256 .131 .177 1.951 .054
My organization_ Interpersonal Relationships -1.017 .216 -.748 -4.708 .000
My organization_ Working Condition .372 .183 .324 2.036 .045
My organization_ Compensation -.028 .159 -.021 -.179 .859
Note. Developed for research purpose
In addition, unstandardized coefficients values are explaining that the contribution
of every motivational factors to the Gen X’s intention to leave. According to the
Table 20, growth (0.188), achievement (0.312), supervision (0.256) and working
condition (0.372) are having positive relationship with Gen X’s intention to leave.
On the other hand, job itself (-0.656), recognition (-0.277), interpersonal
relationships (-1.017), and compensation (-0.028) are negatively related to Gen
X’s intention to leave. Hence, the relationship between motivation and Gen X’s
intention to leave can be explained by using the following equation:
Gen X’s intention to leave = 5.792 + .188G - 0.656J + 0.312A - 0.277R + 0.256S
- 1.017I + 0.372W – 0.028C
G = Growth
J = Job Itself

Page 64 of 96
A = Achievement
R = Recognition
S = Supervision
I = Interpersonal Relationships
W = Working Condition
C = Compensation
4.3.3 Motivation and Gen Y’s Intention to Leave
H0 : There is no relationship between motivation and Gen Y’s intention to leave.
H4 : There is a significant relationship between motivation and Gen Y’s intention
to leave.
From Table 21, it shows that adjusted R² at 0.253 which indicates that the eight
motivational (growth, job itself, achievement, recognition, supervision,
interpersonal relationships, working condition and compensation) are explaining
25.3 per cent of the relationship between motivation and Gen Y’s intention to
leave collectively.
Table 21: Multiple Linear Regression Analysis between Motivation and Gen Y’s
Intention to Leave
Model R R Square Adjusted R
Square Std. Error of the Estimate
1 .503(a) .253 .198 1.012
Note. Developed for research purpose
Furthermore, the ANOVA table as shown in Table 22 indicates that the model is
highly significant and accepted since the p value of the F ratio is less than .05 (p =
.000). As a result, the eight motivational factors in this regression model manage

Page 65 of 96
to explain the relationship between motivation and Gen Y’s intention to leave.
Hence, H0 is rejected
Table 22: ANOVA(b) for Relationship between Motivation and Gen Y’s Intention
to Leave
Model Sum of
Squares df Mean Square F Sig.
1 Regression 37.771 8 4.721 4.608 .000(a)
Residual 111.687 109 1.025
Total 149.458 117
Note. Developed for research purpose
Hypothesis 4a to 4h was postulated to examine the relationships between the eight
motivational factors and Gen Y’s intention to leave as below:
H0: There is no significant relationship between the motivational factors (growth,
job itself, achievement, recognition, supervision, interpersonal relationships,
working condition, and compensation) and Gen Y’s intention to leave.
H4a – H4h: There are significant relationships between the motivational factors
(growth, job itself, achievement, recognition, supervision, interpersonal
relationships, working condition, and compensation) and Gen Y’s intention to
leave.
Table 23 shows that among the eight motivational factors, only one of them is
having statistically significant influence to the model with p value less than .05,
which is growth (p = .044) while the other seven factors are insignificant to the
model: job itself (p = .056), achievement (p = .234), recognition (p = .587),
supervision (p = .171), interpersonal relationship (p = .123), working condition (p
= .679) and compensation (p = .250). As a result, H0 for growth was rejected
while H4b, H4c, H4d, H4e, H4f, H4g, and H4h are rejected.

Page 66 of 96
Table 23: Coefficients (a) for Relationship between the Motivational Factors and
Gen Y’s Intention to Leave
Model
Unstandardized Coefficients
Standardized Coefficients
t Sig. B Std. Error Beta
1 (Constant) 4.861 .506 9.609 .000
My organization_ Growth -.318 .156 -.267 -2.041 .044
My organization_ Job Itself -.303 .157 -.223 -1.932 .056
My organization_ Achievement .191 .160 .143 1.197 .234
My organization_ Recognition -.086 .158 -.069 -.545 .587
My organization_ Supervision -.193 .140 -.165 -1.379 .171
My organization_ Interpersonal Relationships .224 .144 .173 1.556 .123
My organization_ Working Condition .055 .133 .046 .415 .679
My organization_ Compensation -.151 .131 -.119 -1.156 .250
Note. Developed for research purpose
In addition, the contribution of each factor to the model is explained by
unstandardized coefficients values as shown in Table 23. According to the Table
23, growth, job itself, recognition, supervision and compensation are negatively
related to Gen Y’s intention to leave whereas the other three factors (achievement,
interpersonal relationships and working condition) are having positive relationship
with Gen Y’s intention to leave. Hence, the relationship between motivation and
Gen Y’s intention to leave can be explained by using the following equation:
Gen Y’s intention to leave = 4.861 - 0.318G - 0.303J + 0.191A - 0.086R – 0.193S
+ 0.224I + 0.055W – 0.151C
G = Growth
J = Job Itself
A = Achievement

Page 67 of 96
R = Recognition
S = Supervision
I = Interpersonal Relationships
W = Working Condition
C = Compensation
4.4 Summary Results of Hypothesis Test
After discussed the findings, researcher summarized the hypothesis test in Table
24.
Table 24: Summary Result of Hypothesis Test
Hypothesis Accepted Rejected
1. There is a significant relationship between motivation
and staff retention. √
1a. There is a significant relationship between growth
and staff retention.
√
1b. There is a significant relationship between job itself
and staff retention. √
1c. There is a significant relationship between
achievement and staff retention. √
1d. There is a significant relationship between
recognition and staff retention. √
1e. There is a significant relationship between
supervision and staff retention.
√
1f. There is a significant relationship between
interpersonal relationships and staff retention. √
1g. There is a significant relationship between working
condition and staff retention.
√
1h. There is a significant relationship between
compensation and staff retention.
√
2. Generational difference has a significant influence on
expectation of motivational factors. √

Page 68 of 96
2a. Generational difference has a significant influence on
expectation of growth.
√
2b. Generational difference has a significant influence on
expectation of job itself. √
2c. Generational difference has a significant influence on
expectation of achievement.
√
2d. Generational difference has a significant influence on
expectation of recognition.
√
2e. Generational difference has a significant influence on
expectation of supervision.
√
2f. Generational difference has a significant influence on
expectation of interpersonal relationships. √
2g. Generational difference has a significant influence on
expectation of working condition. √
2h. Generational difference has a significant influence on
expectation of compensation.
√
3. There is a significant relationship between motivation
and staff retention of Gen X. √
3a. There is a significant relationship between growth
and staff retention of Gen X.
√
3b. There is a significant relationship between job itself
and staff retention of Gen X. √
3c. There is a significant relationship between
achievement and staff retention of Gen X.
√
3d. There is a significant relationship between
recognition and staff retention of Gen X.
√
3e. There is a significant relationship between
supervision and staff retention of Gen X.
√
3f. There is a significant relationship between
interpersonal relationships and staff retention of Gen
X.
√
3g. There is a significant relationship between working
condition and staff retention of Gen X. √
3h. There is a significant relationship between
compensation and staff retention of Gen X.
√
4. There is a significant relationship between motivation
and staff retention of Gen Y. √
4a. There is a significant relationship between growth
and staff retention of Gen Y. √
4b. There is a significant relationship between job itself
and staff retention of Gen Y. √
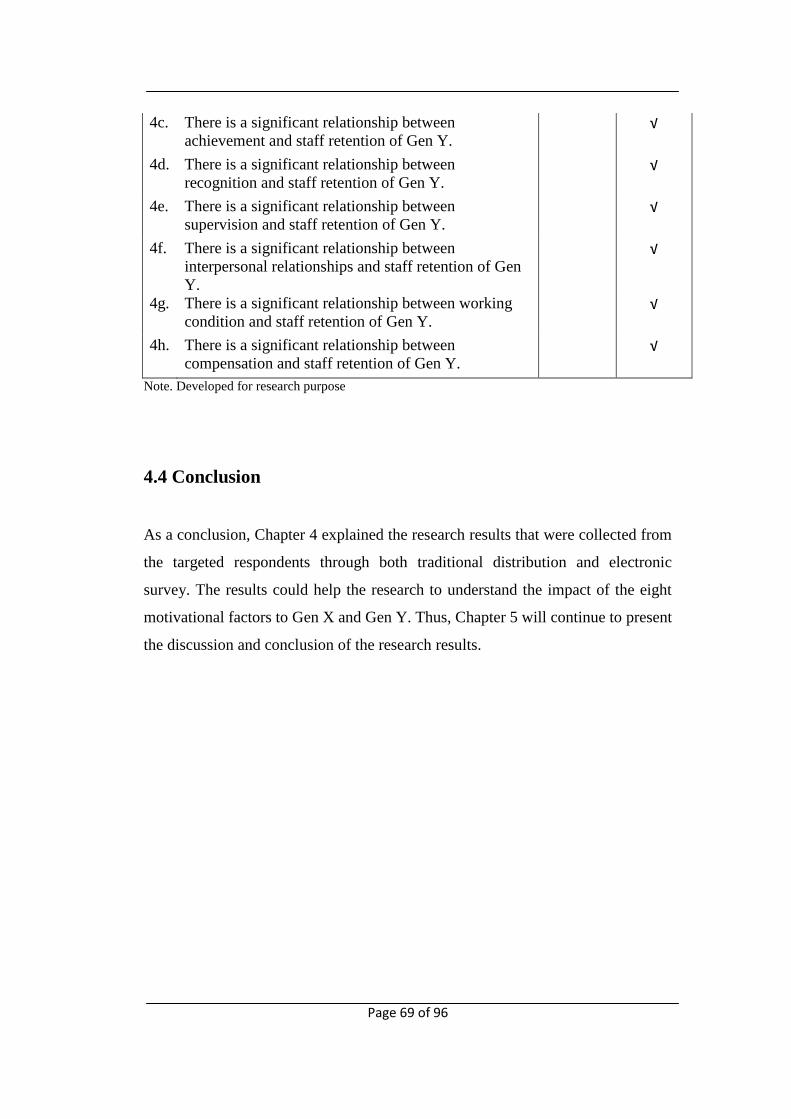
Page 69 of 96
4c. There is a significant relationship between
achievement and staff retention of Gen Y.
√
4d. There is a significant relationship between
recognition and staff retention of Gen Y.
√
4e. There is a significant relationship between
supervision and staff retention of Gen Y.
√
4f. There is a significant relationship between
interpersonal relationships and staff retention of Gen
Y.
√
4g. There is a significant relationship between working
condition and staff retention of Gen Y.
√
4h. There is a significant relationship between
compensation and staff retention of Gen Y.
√
Note. Developed for research purpose
4.4 Conclusion
As a conclusion, Chapter 4 explained the research results that were collected from
the targeted respondents through both traditional distribution and electronic
survey. The results could help the research to understand the impact of the eight
motivational factors to Gen X and Gen Y. Thus, Chapter 5 will continue to present
the discussion and conclusion of the research results.
Page 70 of 96
CHAPTER 5
DISCUSSION AND CONCLUSION
5.1 Discussion of Major Findings
This research project is mainly to analyze the association between Gen X and Gen
Y and intention to leave especially in a finance-related field. Based on the
research findings in previous chapter, an in-depth explanation will be presented in
current chapter. Furthermore, the explanation will be linked to the research
questions and research objectives of the study. With the clear explanation, the
readers could understand better the issues and the outcomes of the study.
5.1.1 Motivation and Staff’s Intention to Leave
As shown in ANOVA table (Table 16) in Chapter 4, the result indicates that the
motivation model that developed for the study purpose is highly significant with
the p value = .000. The result means that motivation negatively influences staff’s
intention to leave and it is supported by few past studies (Huselid, 1995; Maidani,
1991; Tietjen & Myers, 1998; Robbins, 2001; Parsons & Broadbridge, 2006;
Yoon & James, 2009). As mentioned in the Chapter Two, job satisfaction is
positively related to intention to stay. If motivation creates the feeling of
satisfaction to the employees, it would increase the intention to stay in their
current organizations. There are few articles done in past to support that the
satisfaction is positively related to intention to stay of employees (Becker, 1992;

Page 71 of 96
William & Hazar, 1986; Holtom et al., 2001; Riggs & Rantz, 2001; Chang, Wunn
& Tseng, 2011). It is also supported by Crossman (2003) that satisfied employees
are able to be retained within the organization for a longer period whereas
unsatisfied employees are having greater tendency to quit their jobs.
5.1.2 Motivational Factors and Staff’s Intention to Leave
In order to test the relationship and influences between the independent variables
(growth, job itself, achievement, recognition, supervision, interpersonal
relationship, working condition, and compensation) and dependent variable
(staff’s intention to leave) as postulated in Hypothesis 1a to Hypothesis 1h,
Multiple Linear Regression Analysis was being tested. As shown in the
summarized results in Table 25, there are two factors (job itself and recognition)
significantly influence staff’s intention to leave. The findings are supported with a
study done by Michael and Crispen (2009) which saying that job itself and
recognition are significantly related to staff retention in private sector in South
Africa. Nevertheless, this finding is contrast with few past studies which have
pointed out that extrinsic factors such as competitive salary, good interpersonal
relationships, friendly working environment, and job security were cited by
employees as key motivational variables that influenced their retention in the
organizations (Kinnear and Sutherland, 2001; Meudell and Rodham, 1998; Maertz
and Griffeth, 2004).

Page 72 of 96
Table 25: Summary Result of Multiple Linear Regression Analysis
Independent Variable t-value p-value
Independent
Variables & Staff
Retention
Growth -1.411 .160
Job Itself -3.044 .003*
Achievement 1.844 .067
Recognition -2.089 .038*
Supervision -0.562 .575
Interpersonal Relationship -1.539 .125
Working Condition 0.658 .511
Compensation -0.448 .654
Note. Developed for research purpose * significant factor
5.1.3 Generational Differences and Motivation
To identify the relationship between generational difference and expectation of
motivational factors as postulated as Hypothesis 2, comparison of mean value
between Gen X and Gen Y on their expectation of motivational factors had been
done (as shown in Table 11 and Table 12). Table 26 shows the two generations’
expectation of motivational factors is different from each other. The results are
aligned with the research done by Anexlsson and Bokedal (2009), who said that
work motivation varies by generations. This statement is also supported by Eisner
(2005) that each generation is motivated by different personal, professional and
organizational standards. In addition, John and Michelle (2011) said that some of
the significant changes in terms of attitudes and expectations can be explained by
changing of characteristics of workforce due to generational differences. It is
because the different generations grew up with different environment. Due to this
reason, they have different lifestyle, attitudes and demand from each other (Zemke
et al., 2000; Smola & Sutton, 2002; Spiro, 2006; Glass, 2007; Cennamo &
Gardner, 2008; Tay, 2011).

Page 73 of 96
Table 26: Summary Result of Mean Value
Ranking Gen X Gen Y
1 Supervision Job Itself
2 Achievement Achievement
3 Compensation Working Condition
4 Growth Growth
5 Working Condition Supervision
6 Job Itself Compensation
7 Recognition Recognition
8 Interpersonal Relationships Interpersonal Relationships
Note. Developed for research purpose
5.1.4 Generational Differences and Motivational Factors
In order to determine the relationship between generational difference with
individual motivational factor (growth, job itself, achievement, recognition,
supervision, interpersonal relationships, working condition, and compensation) as
postulated in Hypothesis 2a to Hypothesis 2h, Independent T-test Analysis was
done as shown in Table 13 and Table 14.
Table 27 shows the summary result for significance of the relationship between
generational difference and the eight motivational factors. Interpersonal
relationships and working condition were tested to be influenced significantly by
generational differences whereas growth, job itself, achievement, recognition,
supervision and compensation are not impacted by generational differences.
Nevertheless, these findings are contrast with past study that the impact of
generational differences between Gen X and Gen Y are having significant impact
to hygiene factors and motivator factors (Denny, Douglas, Stephen, & James,
2011).

Page 74 of 96
Table 27: Summary Result of Independent T-test Analysis
Independent Variable Sig. (2-tailed)
Generational
Difference &
Independent
Variables
Growth 0.119
Job Itself 0.170
Achievement 0.556
Recognition 0.094
Supervision 0.587
Interpersonal Relationship 0.000*
Working Condition 0.038*
Compensation 0.127
Note. Developed for research purpose * significant factor
5.1.5 Motivation and Gen X’s Intention to Leave
Multiple Linear Regression Analysis was conducted to examine the relationship
between motivation and Gen X’s intention to leave as postulated in Hypothesis 3.
As shown in ANOVA table in Table 19, the p value (p = .000) indicates that the
model is highly significant to the influence of motivation to Gen X’s intention to
leave. It is supported by few past studies which concluded that Gen X has greater
intention to leave than other generations when they are dissatisfied due to their
unique characteristics and different sets of goals, aspirations and values (Ahlrichs,
2007; Johnson, 2004; Western & Yamamura, 2006).
5.1.6 Motivational Factors and Gen X’s Intention to Leave
Furthermore, the relationship between each individual motivational factor and
Gen X’s intention to leave was tested (as postulated in Hypothesis 3a to
Hypothesis 3h) and the result is summarized in Table 28. The result indicates that

Page 75 of 96
job itself, interpersonal relationships and working condition are significantly
related to Gen X’s intention to leave. However, a study done by Dogan, Thomas
and Christina (2008) which concluded that growth, job itself, achievement,
recognition, supervision, interpersonal relationships (see also John & Michelle,
2011), working condition and compensation are having significant impact on Gen
X’s job satisfaction. As mentioned earlier, job satisfaction and motivation are
almost the synonymous to each other and always lead to reducing turnover. Hence,
the current finding is not fully supported.
Table 28: Summary Result of Motivational Factors towards Gen X’s Intention to
Leave
Independent Variable t-value p-value
Independent
Variables & Gen
X’s intention to
leave
Growth 0.761 .449
Job Itself -2.535 .013*
Achievement 1.751 .083
Recognition -1.732 .087
Supervision 1.951 .054
Interpersonal Relationship -4.708 .000*
Working Condition 2.036 .045*
Compensation -0.179 .859
Note. Developed for research purpose * significant factor
5.1.7 Motivation and Gen Y’s Intention to Leave
As postulated in Hypothesis 4, the relationship between motivation and retention
of Gen Y was determined by using Multiple Linear Regression Analysis. As
shown in ANOVA table in Table 22, the p value (p = .000) indicates that the
model is highly significant to the influence of motivation to Gen Y’s intention to
leave. Lowe, Levitt, and Wilson (2008) stated that if Gen Y are dissatisfied at

Page 76 of 96
their workplace, they are ready to leave the organizations. Hence, it could be
concluded that if Gen Y are not motivated, they will have intention to leave the
organizations.
5.1.8 Motivational Factors and Gen Y’s Intention to Leave
In addition, the relationship between each individual motivational factor and
retention of Gen Y was examined (as postulated in Hypothesis 4a to Hypothesis
4h) and the result is summarized in Table 29. The result indicates that only job
itself is significantly related to Gen Y’s intention to leave. This finding is aligned
with the past studies that Gex Y values career advancement as the important factor
in their own careers (Oliver, 2006; Wong, Gardiner, Land, & Coulon, 2008;
Zemke et al., 2000).
However, this finding is contrast with some other researches which found that job
itself (Corporate Leadership Council, 2005; Lancaster & Stillman, 2002),
recognition (Smola & Sutton, 2002; Hobart & Sendek, 2009), supervision (Lipkin
& Perrymore, 2009; Raines & Armsperger, 2010), interpersonal relationships
(Dogan et al., 2011), working condition (Cennamo & Gardner, 2008; Smola &
Sutton, 2002; Twenge, 2010), promotions and compensations (Ng, Schweitzer &
Lyons, 2010) are significantly influencing job satisfaction of Gen Y where job
satisfaction could reduce turnover intention.

Page 77 of 96
Table 29: Summary Result of Motivational Factors towards Gen Y’s Intention to
Leave
Independent Variable t-value p-value
Independent
Variables & Gen
Y’s Intention to
Leave
Growth -2.041 .044*
Job Itself -1.932 .056
Achievement 1.197 .234
Recognition -0.545 .587
Supervision -1.379 .171
Interpersonal Relationship 1.556 .123
Working Condition 0.415 .679
Compensation -1.156 .250
Note. Developed for research purpose * significant factor
5.2 Recommendations
This study is mainly discussing about the association between motivation and staff
retention especially Gen X and Gen Y. Throughout the paper, most of time
motivation and staff Gen X’s intention to leave and Gen Y are determined
separately. In fact, to manage the staff turnover in a multi-generation workforce,
employers or managers could not manage their employees separately based on the
generation. They should make these two generations interact well with each other.
5.2.1 Understand Them
“Understanding your staff” is actually a simple concept that everyone knows and
yet it is neglected by most of the organizations. Most of the time, there is always
not only one generation in a workplace. MSA|Clark Consulting – Healthcare
Group (MSA|Clark) in US stated that “improving the motivation and performance

Page 78 of 96
levels of employees within a multi-generational workplace first requires an
assessment of the employee population” (as cited in Integrated Healthcare
Strategies, n.d.). An employer who could understand their employees would
improve the employees’ satisfaction and commitment to stay on the job (Frank,
Finnegan & Taylor, 2004). To a manager, he or she should be the one best
understand the staff. Despite there are a lot of researches that defined Gen X and
Gen Y with their characteristics, but individual is different from each other even
though they grew up at similar time. Hence, manager should also communicate
with staff from time to time in order to know what their current thinking and what
they currently need.
There are some superiors always intend to apply own thinking to the subordinates
and expects the subordinates to follow their way of doing things. Nevertheless, not
all the subordinates could fully understand and agree with the manager’s thinking
because they are coming from different background and having the different
experiences. Therefore, manager must have an open and subjective mind-set prior
to understand the attitudes, behaviours and needs of the staff.
5.2.2 Serve Their Needs
Normally, “serve their needs” are applied by subordinates to superiors in terms of
expectation of work. The other way round, superiors should also serve
subordinates’ needs accordingly. Once the manager understands the staff’s
expectation, he or she should better know how to motivate the subordinates to be
more productive and committed by serving them their needs. Yochai (2011) stated
that “if you want employees to work harder, incorporate pay for performance and
monitor their results more closely. If you want executives to do what’s right for
shareholders, pay them in stock. If you want doctors to look after patients better,
threaten them with malpractice suits.” Hence, giving the right thing to the right
person is very important in motivating an individual.

Page 79 of 96
5.2.3 Analyse Them from Time to Time
Analyzing the staff’s behaviour should be part of HR functions. Individual is
changing his or her attitude, behaviour and expectation from time to time. In order
to manage the employees’ current thinking, HR could conduct survey. This survey
could be a simple questionnaire that requires employees to respond their current
view to the organization as well as to their current job responsibilities. Some staff
might be worried that organization would take action against if negative
comments are given. Hence, the survey form must be filled in anonymously. By
doing this, genuine answers could only be obtained.
However, this method does not allow HR to understand each of the staff but
general views would be obtained. Nevertheless, HR could know the thinking of
majority of the staff and come out with better policies to benefit both organization
and employees.
5.3 Implications of the Study
In order to manage the staff turnover, understanding the antecedents of the
employees’ intention is very crucial. This study tries to provide in-depth
measurement and analysis to help the employers to understand the Gen X and Gen
Y in the finance team. Based on the research results, it could provide the impact
and idea to employers to better understand the desire in the workplace among the
two generations. With the analysis, researcher hopes that it would be able to help
the organizations to well-manage their employee turnover issues especially
finance staff.

Page 80 of 96
5.4 Limitation of the Study
There are some limitations of this research paper. These limitations are
highlighted in order to improve the future research in the relevant field.
First, researcher found difficult to gain the relevant articles especially related to
finance team in Malaysia and even in overseas. The literatures in this study are
very limited in discussing the current phenomena of staff turnover within finance
department. Hence, it would affect the comparison and interpretation between the
current study and past studies.
Second, this research was conducted in relation to Gen X and Gen Y, and yet it
excludes other working generations in Malaysia. Hence, the results are not
applicable to the entire workforce in Malaysia.
Third, the independent variables are limited to eight factors. There are plenty of
motivational theories and motivational factors have been studied since decades
ago. This research paper chose only eight factors from Hertzberg’s Two Factor
Theory. Other factors such as company culture, management style, Human
Resources Management System (HRMS), reward systems, etc, have not been
analyzed and yet these factors are also very important to influence the employee’s
intention to stay or leave their organizations.
Fourth, the survey questionnaires in this paper were distributed via traditional
distribution and electronic survey. Traditional distribution normally means that
questionnaires are distributed face-to-face to the targeted respondents and get their
response on the spot. There is a challenge in collecting the data in this manner.
Targeted respondents would have a doubt that it might be a research done by their
employers. They had to clarify few times with the research to make sure the
survey was not from their employers before they put the answers in the survey
questionnaires. Some of them may play safe to give a favourable answers when

Page 81 of 96
asking about their opinions to the current organizations. Hence, the answers given
might directly affect the accuracy of the research findings.
The limitations as highlighted above had been acknowledged and yet it will not
affect the discussions of the study. It just provides an proposal for future research.
5.5 Future Research
After the discussion of the present study, several suggestions are concluded for
future research study.
First, expanding the targeted respondents to other generations such as
traditionalists and baby boomers, who are still active in labour market in Malaysia.
To have the analysis on all the generations in Malaysia would provide the
employers or the organizations a full picture on the differences and the desires
between the four generations which are still active in the labour market. By have
the full picture, the employers or organizations would be able to come out a
strategic plan to manage the multi-generation employees.
Second, perhaps the future researchers could be analyzing the data more
specifically based on gender and position level of the respondents. Opinions may
vary by male and female, as well as managerial level employees and non-
managerial level employees. It is because the perspective of different gender and
level would be different from each other. To be more specifically, the findings
would be more accurate and useful to the organizations.
Third, expanding the motivational factors to be more comprehensive. In current
study, the independent variables proposed are more to individual level. Perhaps
the independent variables could be including the organizational level such as
company policy, company culture, reward systems, Human Resources

Page 82 of 96
Management Systems (HRMS), and so on. It could help the organizations to
understand that the impact is not only from the individual’s desires but also the
management of the companies.
5.6 Conclusion
After some readings, research found that staff turnover is definitely a major
challenge to employers. As discussed earlier, it creates a lot of unforeseen costs to
an organization. Gen X and Gen Y make up a large portion in labour market when
Baby Boomers retire gradually in next few years. Hence, these two generations
would become the important workforce in an organization.
The purpose of this research paper is to examine the association between Gen X
and Gen Y who are currently working in finance-related field and their intention
to leave their organizations. Motivation was used as the variable to connect the
two generations and their voluntary turnover intention.
The findings showed that motivation is significantly influencing staff’s turnover
intention whereas generational differences between Gen X and Gen Y are also
having an influential impact to the expectation of motivation. It is because both of
the generations were growing up in different time and they are shaped into
different lifestyle, values, attitudes and expectations (Cennamo & Gardner, 2008;
Smola & Sutton, 2002;, Zemke at el., 2000; Gursoy at el., 2008).
The findings show that motivation plays an important role to reduce turnover
intention. Among the eight factors, job itself and recognition influence the staff
turnover intention significantly. Generational differences were found to affect the
expectation of motivation among Gen X and Gen Y. Gen X ranked supervision as
the most important motivational factor while Gen Y ranked job itself as the most
significant motivational factor in workplace.

Page 83 of 96
However, the most important motivational factor does not mean to stop Gen X
and Gen Y to leave the organization. The later findings showed differently that job
itself, interpersonal relationships and working condition are the ones to influence
Gen X’s intention to leave significantly. On the other hand, growth is the one
having impact to Gen Y’s turnover intention based on the current findings.
This study could provide the employers a clearer view on Gen X and Gen Y as
well as their expectation towards motivation. To an employer, he or she must
understand the why Gen X and Gen Y behaves in certain manner and give them
what these two generations really expect for in order to satisfy them and retain
them.

Page 84 of 96
REFERENCES
Abbasi, S., & Hollman, K. (2000). Turnover: The Real Bottom-line. Public
Personnel Management, 29(3), 333-342.
Agarwal, A. (2010). Motivation and executive compensation. IUP Journal of
Corporate Governance, 9(1/2), 27‐46.
Ahlrichs, N. S. (2007). Managing the generations differently to improve
performance and profitability. Employment Relations Today, 34(1), 21-31.
Altimier L. (2006). Leading a new generation. Newborn Infant Nursing Reviews, 6
(1), 7-9.
Anexlsson, A., & Bokedal, S. (2009). Reward Systems – motivating different
generations. (Unpublished dissertation). University of Gothenburg,
Sweden.
Antonius, R. (2003). Interpreting Quantitative Data with SPSS. United Stage of
American: Sage
Association of American Retired Persons. (2007). Leading a multigenerational
workforce. Retrieved April 16, 2012 from
http://assets.aarp.org/www.aarp.org_/cs/misc/leading_a_multigenerational_w
orkforce.pdf
Barber, A. E. (1998). Recruiting employees: Individual and organizational
perspectives. Thousand Oaks, CA: Sage Publications.
Baron, J. & Kreps, D. (1999). Strategic human resources – frameworks for
general managers. Wiley: New York.
Baron, R. A. (1983). Behaviour in organizations. New York: Allyn & Bacon, Inc.
Becker, T. (1992). Foci and bases of commitment: Are they distinctions worth
making? Academy of Management Journal, 35, 232-244.
Beulen, E. (2009). The contribution of a global service provider’s human
resources information system (HRIS) to staff retention in emerging markets –
comparing issues and implications in six developing countries, IT & People,
22(30), 270-288.

Page 85 of 96
Bitsch, Vera & Hogberg, & Michael. (2004). Employee Retention: Components
Of Job Satisfaction Of Green Industry Employees. 2004 Annual meeting,
August 1-4, Denver, CO 20281, American Agricultural Economics
Association (New Name 2008: Agricultural and Applied Economics
Association).
Brian, D. (n.d.). Generation Y: human resource management implications.
Retrieved April 16, 2012, from http://www.wbiconpro.com/452-Brian.pdf
Carr, G. (2005). Investigating the motivation of retail managers at a retail
organization in the Western Cape. (Unpublished mini-thesis). University of
the Western Cape, South Africa.
Catherine M. G. (2002). Employee turnover: a study of private clubs in the USA.
International Journal of Contemporary Hospitality Management, 14(3), 106-
113.
Cennamo, L., & Gardner, D. (2008). Generational differences in work values,
outcomes and person-organisation values fit. Journal of Managerial
Psychology, 23 (8), 891-906.
Chaminade, B. (2007). A retention checklist: how do you rate? Retrieved
February 7, 2012, from http://www.humanresourcesmagazine.co.au.
Chang, R. D., Wunn, K. T., & Tseng, Y. C. (2011). A Study Of The
Relationships Between Career Orientation, Achievement Motivation, Job
Satisfaction, And Intention To Stay For Auditors: Using Big CPA Firms
As An Example. Journal of Business & Economics Research, 1(4).
Cooper, D. R., & Schindler, P. S. (2006). Business research method (8th ed.).
New York : Mcgraw-Hill.
Corporate Leadership Council. (2005). HR considerations for engaging generation
Y employees. Washington, DC: Corporate Executive Board.
Creswell, J. W. (1994). Research design: Qualitative and quantitative
approaches. Thousand Oaks, CA: SAGE Publications.
Crossman, A. (2003). The relationships of age and length of service with job
satisfaction: an examination of hotel employees in Thailand. Managerial
Psychology, 18, 745-758.
Darmon, R. Y. (1990). Identifying sources of turnover costs: a segmental
approach. Journal of Marketing, 54(2), 46-56.

Page 86 of 96
Deci, E. L., Connell, J. P., & Ryan, R. M. (1989). Self-determination in a work
organization. Journal of Applied Psychology, 74, 580-590.
Denny, B., Douglas A., Stephen, B. C., and James J. C. (2011). A cross-
generational comparison of motivational factors in a sales career among Gen-
X and Gen-Y college students. Journal of Personal Selling & Sales
Management, 31 (1), 77-85
Dogan, G., Thomas, A. M., & Christina, G. C. (2008). Generational differences:
an examination of work values and generational gaps in the hospitality
workforce. International Journal of Hospitality Management, 27, 448-458.
Drafke, Michael, W., & Stan, K. (1998). The human side of organizations (7th
ed.). Massachusetts: Addison/Wesley.
Eisner, S.P. (2005). Managing Generation Y. SAM Advanced Management
Journal, 70, 4-15.
Fall. (2004). Testing utility of model – F-test. Retrieved February 6, 2012, from
http://www.public.iastate.edu/~alicia/stat328/Multiple%20regression%20-
%20F%20test.pdf
Flamholtz, E. (1974). Human resource accounting: a review of theory and
research. Journal of Management Studies, 11(1), 44-61.
Frank, F. D., Finnegan, R. P., & Taylor, C. R. (2004) The race for talent: retaining
and engaging workers in the 21st century. HR Human Resource Planning,
27(3), 12-25.
Frey, B. (1997). Not just for the money. An economic theory of personal
motivation. Cheltenham: Edward Elgar Publishing.
Frey, B., & Osterloh, M. (Eds.). (2002). Successful management by motivation:
balancing intrinsic and extrinsic incentives. New York: Springer‐Verlag.
Glass, A. (2007). Understanding generational differences for competitive success.
Industrial and Commercial Training, 38(2), 98-103.
Gursoy, D., Maier, T. A., & Chi, C. G. (2008). Generational differences: an
examination of work values and generational gaps in the hospitality
workforce. International Journal Hospitality Management, 27, 448-458.
Hair, J. F., Babin, B., Money, A. H., & Samouel, P. (2003). Essentials of
Business Research Methods. United States of America: John Wiley & Sons,
Inc.

Page 87 of 96
Hair, J.F., Money, A.H., Samouel, P., & Page, M. (2007). Research methods for
business. Chichester: John Wiley & Sons.
Hay Group. (2010). Mind the gap: managing across generations in Malaysia.
Malaysia.
Hersey, P., & Blanchard, K. H. (1988). Management of organization behavior:
utilizing human resource. Atlanta: Prentice Hall.
Herzberg, F., Mausner, B., & Snyderman, B. (1959). The motivation to work. New
York, John Wiley & Sons.
Hewitt Associates LLC. (2008). Malaysia-Employee Provident Fund Changes.
Retrieved February 7, 2012, from
http://www.hewittassociates.com/Lib/assets/AP/en-
AP/pdfs/global_report_malaysia.pdf
Hill, R. P. (2002). Managing across generations in the 21st century: important
lessons from the ivory trenches. Journal of Management Inquiry, 11(1), 60-
66.
Hill, R. P., & Stephens D. L. (2003). The compassionate organisation in the 21st
century. Organizational Dynamic., 32 (4), 331-341.
Hobart, B., & Sendek, H. (2009). Gen Y now: how generation Y changes your
workplace and why it requires a new leadership style. Novato, California:
Select Press.
Huselid, M. A. (1995). The impact of human resource management practices on
turnover, productivity, and corporate financial performance. Academy of
Management, 38(3), 635–672.
Integrated Healthcare Strategies. (n.d.). The multigenerational workplace:
strategies & solutions for healthcare employers. Retrieved June 12, 2012,
from
http://www.integratedhealthcarestrategies.com/documents/articles/33.pdf
John, B., & Michelle, B. (2007). Knowledge workers: what keeps them
committed; what turns them away. Work Employment Society, 21(121).
Johnson, M. (2004). New rules of engagement: life-work balance and employee
commitment. London: Chartered Institute of Personnel Development.
Jurkiewicz, C. L. (2000). Generation X and the public employee. Public
Personnel Management, 29(1), 55-74.

Page 88 of 96
Kertzer, D. I. (1983). Generation as a sociological problem. Annual Review of
Sociology, 9, 125-149.
Kinnear, L., & Sutherland, M. (2001). Money is fine, but what is the bottom –
line? Journal South African Institute People Management., 19, 15-18.
Kowske, B. J., Rasch, R., & Wiley, J. (2010). Millennials’(lack of) attitude
problem: an empirical examination of generational effects on work attitudes.
Journal of Business and Psychology, 25(2), 265–279.
Kreitner, R. (1998). Management (7th ed.). Boston: Houghton Mifflin.
Kritner, R., & Kinicki, A. (2004). Organizational Behavior (6th ed.). Burr Ridge,
ILL: McGraw-Hill/Irwin.
Kupperschmidt, B. R. (2000). Multigenerational employees: strategies for
effective management. Health Care Manage, 19 (1): 65-76.
Lancaster, L. C., & Stillman, D. (2002). When generations collide. Who they are.
Why they clash. How to solve the generational puzzle at work. New York:
Collins Business.
Leahy, K., McGinley, J., Thompson, J., Weese, T., & Cohort 2. (n.d.). Intelligence
community assessment: generational differences in workplace motivation.
Retrieved June 12, 2012, from
http://www.marines.mil/unit/hqmc/intelligence/Documents/Intelligence%20C
ommunity%20Assessment%20Generational%20Differences%20in%20Work
place%20Motivation.pdf
Likert, R. (1932). A technique for the measurement of attitudes. Archives of
Psychology, 140, 1–55.
Lipkin, N. A., & Perrymore, A. J. (2009). Y in the workplace: managing the “me
first” generation. Franklin Lakes, New Jersey: The Career Press, Inc.
Lowe, D., Levitt, K. J., & Wilson, T. (2008). Solutions for Retaining Generation Y
Employees in the Workplace. Business Renaissance Quarterly. Retrieved
February 5, 2012, from http://scholar.google.com
Luthans, F. (1998). Organisational Behaviour (8th ed.). Boston: Irwin McGraw-
Hill.
Machalaba, D. (1993) Long haul - trucking firms find it is a struggle to hire and
retain drivers. The Wall Street Journal, 222(125).

Page 89 of 96
Maertz, C. P., & Griffeth, R. W. (2004). Eight motivational forces and voluntary
turnover: A theoretical synthesis with implications for research. Journal of
Management, 30, 667–683.
Maidani, E. A. (1991). Comparative study of Herzberg's two-factor theory of job
satisfaction among public and private sectors. Public Personnel Management,
20(4), 441–448.
Mak, A. (2010). How to keep your finance staff. Retrieved April 16, 2012, from
http://www.cfoinnovation.com/content/how-keep-your-finance-staff
Maura, G., Igor, P., & Adalgisa, B. (2011). Intrinsic motivation, job autonomy,
and turnover intention in the Italian healthcare: the mediating role of affective
commitment. Journal of Management Reseach, 3(2).
Meudell, K., Rodham, K. (1998). Money isn’t everything … or is it? A
preliminary research study into money as a motivator in the licensed house
sector. International Journal of Contemporary Hospitality
Management,10(4), 128-132.
Michael, O. S., & Crispen, C. (2009). Employee retention and turnover: using
motivational variables as a panacea. African Journal of Business
Management, 3, 410-4158.
Miller, E. J. (2006). The effect of rewards, commitment, organizational climate
and work values on intentions to leave: is there a difference among
generations? (Unpublished doctoral dissertation). University of New York.
Miller, Y. (2010). Labour turnover and its impact on customer service and
success of restaurants in london. Retrieved June 12, 2012, from
http://www.articleblast.com
Missouri Small Business & Technology Development Centers. (2002). Reducing
employee turnover. Retrieved April 16, 2012, from
http://www.missouribusiness.net/sbtdc/docs/reducing_employee_turnover.as
p
Mitchell, T. R., & Daniels, D. (2003). Motivation and Work Behavior
(7th
ed.). New York: McGraw Hill.
Mitchell, T. R., Holtom, B. C., & Lee, T. W. (2001). How to keep your best
employees: Developing an effective retention policy. The Academy of
Management Executive, 15(4), 96-108.
Mosley, V., & Hurley, M. (1999). IT skill retention. Information Management &
Computer Security, 7(3), 129-132.

Page 90 of 96
Ng, E. S., Schweitzer, L., & Lyons, S. T. (2010). New generation, great
expectations: a field study of the millennial generation. Journal of Business
and Psychology, 25(2), 281–292.
Noble, S. M., & Schewe, C. D. (2003). Cohort segmentation: an exploration of its
validity.
Journal of Business Research, 56, 979-987.
O’Malley, M. (2000). Creating commitment. Chichester: John Wiley & Sons.
Parsons, E., & Broadbridge, A. (2006). Job motivation and satisfaction: unpacking
the key factors for charity shop managers. Journal of Retailing and Consumer
Service, 13(2), 121–131.
Pek, C. K., Lim, Y. M., Yee, A. P. (2008). Work values of Baby-Boomers and
Generation X of the Chinese community in Malaysia. International Journal
of Business and Management, 3(11).
Pekala, N. (2001). Conquering the generational divide. Journal of Property
Management, 66(6), 31-38.
Pfeffer, J. (1998). The human equation. Harvard Business School Press, New
York, NY.
Price, J. L. (1977). The study of turnover. Ames: Iowa State University Press.
PricewaterhouseCoopers. (2009). Malaysia’s Gen Y unplugged. Retrieved April
16, 2012, from http://www.pwc.com/en_my/my/assets/publications/gen-y.pdf
Raines, C., & Armsperger, A. (2010). Millennials at work. Retrieved February 6,
2012, from http://www.generationsatwork.com
Ramlall, S. (2004). A review of employee motivation theories and their
implications for employee retention within organizations. The Journal of
American Academy of Business, Cambridge, 5(1/2), 52-63.
Ramlall, S. (2003). Managing employee retention as a strategy for increasing
organizational competitiveness. Applied H.R.M. Research, 8(2), 63-72.
Reichheld, F. F. (1993). Loyalty-based management. Harvard Business Review,
71, 64-73.
Riggs, C.J., & Rantz, M. J. (2001). A model of staff support to improve retention
in long term care. Nursing Adminstration Quarterly, 25(2), 43-54.

Page 91 of 96
Rita, C., & Mieke, H. (2008) HR professionals' views on work motivation and
retention of older workers: a focus group study. Career Development
International, 13(2), 95-111.
Rizwan Saleem, Azeem Mahmood, & Asif Mahmood. (2010). Effect of work
motivation on job satisfaction in mobile telecommunication service
organizations of Pakistan. International Journal of Business and
Management, 5(11).
Robbins, S. P. (2001). Organizational behavior, (9th ed.). New Jersey: Prentice
Hall.
Roscoe, J. T. (1975). Fundamental Research Statistic for the Behaviour Science
(2nd
ed.). New York: Holt, Rinehart and Winston.
Schroeder, L. D., Sjoquist, D. L., & Stephan, P. E. (1986). Understanding
regression analysis: AN Introductory Guide. United Stage of American: Sage
Publications, Inc.
Schuman, H., & Scott, J. (1989). Generations and collective memories. American
Sociological Generations and Motivation 14 Review, 54(3), 359-381.
Sekaran, U. (2003). Research method for business : A skill building approach (4th
ed.). New York: John Wiley & Sons. Inc.
Smola, K. W,, & Sutton, C. D. (2002). Generational differences: Revisiting
generational work values for the new millennium. Journal Organizational
Behaviour,, 23(4), 363-82.
Spiro, C. (2006). Generation Y in the Workplace. Defense AT&L, 16-19.
Statistic Malaysia. (2010). Labour Force Statistics Malaysia 2010. Retrieved June
12, 2012, from
http://www.statistics.gov.my/portal/download_Labour/files/BPTMS/ringkasa
n_perangkaan_2010.pdf
Tan, T.H., & Amna, Waheed. (2011). Herzberg’s motivation-hygiene theory and
job satisfaction in the Malaysian retain sector: the mediating effect of love of
money. Asian Academy of Management Journal, 16(1), 73-94.
Tay, A. (2011). Managing generational diversity at the workplace: expectations
and perceptions of different generations of employees. African Journal of
Business Management, 5(2), 249-255.
Tietjen, M. A., & Myers, R. M. (1998). Motivation and job satisfaction.
Management Decision, 36(4), 226-231.

Page 92 of 96
Twenge, J. (2010). A review of the empirical evidence on generational differences
in work attitudes. Journal of Business and Psychology, 25(2), 201-210.
Vikineswaran Maniam. (1999). Antecedents, outcomes, and controls of staff
turnover in selected hotels in Malaysia. (Unpublished thesis). Universiti
Putra Malaysia.
Wagner, C. M. (2010). Predicting nursing turnover with catastrophe theory.
Journal of Advanced nursing, 66(9), 2071-2084.
Western, J. W., & Yamamura, J. H. (2006). Generational preferences for work
environment fit: effects on employee outcomes. Career Development
International, 12(2), 150−161.
Williams, L.J., & Hazer, J. T. (1986). Antecedents and consequences of
satisfaction and commitment in turnover models: a re-analysis using latent
variable structural equation methods. Journal of Applied Psychology,72(1),
219-311.
Wong, M. (2009, June 8). A Gen Y’s message to CEOs. The Edge.
Wood, R. H. (1995). Human resource management (2nd
ed.). Michigan: The
educational institute of the American Hotel and Motel Association.
Yochai, B. (2011). The unselfish Gene. Harvard Business Review, 77-85.
Yoon, J. C., & James, L. P. (2009, October). Employee motivations, managerial
trustworthiness, and work attitudes. Paper presented at 10th
Public
Management Research Association Conference, Columbus, OH.
Zemke R, Raines C, Filipczak B (2000). Generations at work: managing the clash
of Veterans, Boomers, Xers and Nexters in your workplace (2nd Ed).
American Management Association, New York, NY.
Zikmund, W. G. (2003). Business research method (7th ed.). South-Western:
Thomson.

Page 93 of 96
APPENDIX
Appendix A: Survey Questionnaire
A STUDY ON WORK MOTIVATIONAL FACTORS AND INTENTION TO LEAVE/STAY IN AN
ORGANIZATION
Dear Sir/Madam,
This survey is conducted as part of my course requirement for Master of Business
Administration in Universiti Tunku Abdul Rahman. The objective of this survey is to
identify the motivational factors and the impact of the motivational factors on one’s
intention to leave/stay in an organization.
I would like to express my gratitude for your participation in this survey. Your survey
responses will be treated as strictly confidential. Should you have any queries, please
contact me at [email protected]. Thank you!
Yours sincerely,
Suk Ching
Section A: Respondent Profile
1. Age □20-25 □26-31 □32-37 □38-43 □44-49
2. Gender □Male □Female
3. Race □Malay □Chinese □Indian □Others
4. Highest educational attainment □Secondary School
□High School
□Certificate
□Diploma
□Degree
□Post-degree
□Professional Certificate
5. Total year(s) of working:
□0-2 years □3-5 years □6-8 years □9-10 years □ >10 years

Page 94 of 96
6. Please indicate the number of company you have been working with.
□1 □2 □3 □4 □5 □ >5
7. What is your position level in current company?
□Non-executive □Executive □Manager □> Manager
8. How many years have you been working for current employer?
□0-2 years □3-5 years □6-8 years □9-10 years □>10 years
Section B: Motivational Factors
Please rate the following statements:
My expectation
Strongly Strongly
Disagree Agree
My current organization
Very Very
Dissatisfied Satisfied
Growth:
a. I feel appreciated if I was given the opportunities
for advancement by the company.
b. The most important thing to me is realizing my
ultimate personal potential.
c. People should always keep their eyes and ears
open for better opportunities in their companies.
d. I feel happy if I was given the opportunity to learn
new things from time to time in the company.
Job Itself:
a. Job requirements are important to me in
choosing an employer
b. Job requirements dictate how much effort I put in
work.
c. I feel motivated if I enjoy doing my work.
d. I prefer the job that allows me to use skills and
talent.
Achievement:
a. I want to be the best at my own job.
b. Satisfaction gained from the responsibility and
role that I have in my work is important to me.
c. I like to do things which give me a sense of
personal achievement.
d. I need to know that my skills and values are
impacting organization’s success.
Recognition:
a. I work harder on a project if public recognition
1□ 2□ 3□ 4□ 5□
1□ 2□ 3□ 4□ 5□
1□ 2□ 3□ 4□ 5□
1□ 2□ 3□ 4□ 5□
1□ 2□ 3□ 4□ 5□
1□ 2□ 3□ 4□ 5□
1□ 2□ 3□ 4□ 5□
1□ 2□ 3□ 4□ 5□
1□ 2□ 3□ 4□ 5□
1□ 2□ 3□ 4□ 5□
1□ 2□ 3□ 4□ 5□
1□ 2□ 3□ 4□ 5□
1□ 2□ 3□ 4□ 5□
1□ 2□ 3□ 4□ 5□
1□ 2□ 3□ 4□ 5□
1□ 2□ 3□ 4□ 5□
1□ 2□ 3□ 4□ 5□
1□ 2□ 3□ 4□ 5□
1□ 2□ 3□ 4□ 5□
1□ 2□ 3□ 4□ 5□
1□ 2□ 3□ 4□ 5□
1□ 2□ 3□ 4□ 5□
1□ 2□ 3□ 4□ 5□
1□ 2□ 3□ 4□ 5□
1□ 2□ 3□ 4□ 5□
1□ 2□ 3□ 4□ 5□

Page 95 of 96
is attached to it.
b. I give my best effort when I know that it will be
seen by the most influential people in an
organization.
c. If choosing jobs, I want the one that allows me
to be recognised for success.
d. I feel appreciated if my superior always
recognizes the work done by me.
1□ 2□ 3□ 4□ 5□
1□ 2□ 3□ 4□ 5□
1□ 2□ 3□ 4□ 5□
1□ 2□ 3□ 4□ 5□
1□ 2□ 3□ 4□ 5□
1□ 2□ 3□ 4□ 5□
Supervision:
a. Communication with my superior is essential in
my work.
b. I feel motivating when my superior shows me
his/her capabilities and knowledge in his/her
role.
c. I feel appreciate when my superior always give
me guidance and advice to enhance my work.
d. I would be happy if my superior allows me to
schedule my own work and to participate in
job-related decision making.
Interpersonal Relations:
a. The quality of the relationships in the informal
workgroup is quite important to me.
b. I feel more motivating while participating in
activities such as sports week, sports
tournaments, team building, etc., that can
foster my relationship with other colleagues.
c. I like to hang out with my colleagues during
holidays.
d. I would be happy working in the company if I
have a good relationship with my colleagues.
Working Conditions:
a. Good physical working environment are
important to me.
b. I prefer the company that emphasizes work-life
balance.
c. I prefer high flexibility in terms of working
space, working hour and apparel.
d. I would be happy if my work allows me to work
from home.
Compensation:
a. The salary increments given to employees who
do their jobs very well motivates them.
b. Financial incentives motivates me more than
non-financial incentives.
c. I would work harder if I knew that my effort
would lead to higher pay.
1□ 2□ 3□ 4□ 5□
1□ 2□ 3□ 4□ 5□
1□ 2□ 3□ 4□ 5□
1□ 2□ 3□ 4□ 5□
1□ 2□ 3□ 4□ 5□
1□ 2□ 3□ 4□ 5□
1□ 2□ 3□ 4□ 5□
1□ 2□ 3□ 4□ 5□
1□ 2□ 3□ 4□ 5□
1□ 2□ 3□ 4□ 5□
1□ 2□ 3□ 4□ 5□
1□ 2□ 3□ 4□ 5□
1□ 2□ 3□ 4□ 5□
1□ 2□ 3□ 4□ 5□
1□ 2□ 3□ 4□ 5□
1□ 2□ 3□ 4□ 5□
1□ 2□ 3□ 4□ 5□
1□ 2□ 3□ 4□ 5□
1□ 2□ 3□ 4□ 5□
1□ 2□ 3□ 4□ 5□
1□ 2□ 3□ 4□ 5□
1□ 2□ 3□ 4□ 5□
1□ 2□ 3□ 4□ 5□
1□ 2□ 3□ 4□ 5□
1□ 2□ 3□ 4□ 5□
1□ 2□ 3□ 4□ 5□
1□ 2□ 3□ 4□ 5□
1□ 2□ 3□ 4□ 5□
1□ 2□ 3□ 4□ 5□
1□ 2□ 3□ 4□ 5□

Page 96 of 96
d. When choosing a job I usually choose the one
that pays the most.
1□ 2□ 3□ 4□ 5□
1□ 2□ 3□ 4□ 5□
Section C: Please indicate your intention to leave/stay in your current organization.
Strongly Strongly
Disagree Agree
a. I do not have intention to leave.
b. I may consider leaving if there is a good
opportunity.
c. I will definitely leave.
1□ 2□ 3□ 4□ 5□
1□ 2□ 3□ 4□ 5□
1□ 2□ 3□ 4□ 5□