the asean way - imfconnect
TRANSCRIPT


Edited by Ana Corbacho and Shanaka J. Peiris
I N T E R N A T I O N A L M O N E T A R Y F U N D
THE ASEANWAYSustaining Growth and Stability
©International Monetary Fund. Not for Redistribution

© 2018 International Monetary Fund
Cover design: Winking Fish, Inc.
Cataloging-in-Publication DataIMF Library
Names: Corbacho, Ana. | Peiris, Shanaka J. (Shanaka Jayanath), 1975- |
International Monetary Fund.
Title: The ASEAN way : sustaining growth and stability / edited by Ana Corbacho
and Shanaka J. Peiris.
Other titles: Association of South East Asian Nations way
Description: Washington, DC : International Monetary Fund, [2018] | | Includes
bibliographical references.
Identifiers: ISBN 9781513558905 (paper)
Subjects: LCSH: ASEAN. | Economic development—Southeast Asia. | Monetary
policy—Southeast Asia.
Classification: LCC HC441.A712 2018
DISCLAIMER: The views expressed in this book are those of the authors and
do not necessarily represent the views of the IMF’s Executive Directors, its
management, or any of its members.
Recommended citation: Corbacho, Ana, and Shanaka J. Peiris, eds. 2018. The ASEAN Way: Sustaining Growth and Stability. Washington, DC: International
Monetary Fund.
ISBN: 978-1-51355-890-5 (Paper)
978-1-48435-530-5 (ePub)
978-1-48435-532-9 (Mobi)
978-1-48435-533-6 (PDF)
Please send orders to:
International Monetary Fund, Publication Services
P.O. Box 92780, Washington, D.C. 20090, U.S.A.
Tel.: (202) 623–7430 Fax: (202) 623–7201
E-mail: publications@ imf .org
Internet: www .elibrary .imf .org
www .bookstore .imf .org
©International Monetary Fund. Not for Redistribution

iii
Foreword ...................................................................................................................................... v
Acknowledgments .................................................................................................................. vii
Contributors ............................................................................................................................... ix
1 Overview ............................................................................................................................. 1Ana Corbacho and Shanaka J. Peiris
Part I From the asIan FInancIal crIsIs to the Present
2 Evolution of Monetary Policy Frameworks...........................................................15Hoe Ee Khor, Jaime Guajardo, and Shanaka J. Peiris
3 Toward a Resilient Financial Sector .........................................................................45Pablo Lopez Murphy
Part II PolIcy resPonses to Global sPIllovers
4 Global Spillovers .............................................................................................................67Shanaka J. Peiris, Minsuk Kim, and Sherillyn Raga
5 Monetary and Exchange Rate Policy Responses................................................93Hoe Ee Khor, Shanaka J. Peiris, Mia Agcaoili, Ding Ding, Jaime Guajardo, and Rui Mano
6 Macroprudential Policies .......................................................................................... 123Sohrab Rafiq
Part III challenGes ahead
7 Monetary Policy in the New Normal ................................................................... 157Juan Angel Garcia Morales, Ana Corbacho, Geraldine Dany-Knedlik, Aubrey Poon, and Umang Rawat
8 Systemic Risks and Financial Stability Frameworks ....................................... 185Pablo Lopez Murphy, Julian Chow, Ana Corbacho, David Grigorian, and Sohrab Rafiq
9 Macroeconomic Policy Synergies for Sustained Growth ............................. 217Manrique Saenz, Ana Corbacho, Ichiro Fukunaga, Dirk Muir, Shanaka J. Peiris, and Sohrab Rafiq
10 The Future of ASEAN-5 Financial Integration ................................................... 257Yiqun Wu, Ana Corbacho, Khristine L. Racoma, and Xiaohui Sharon Wu
Contents
©International Monetary Fund. Not for Redistribution

This page intentionally left blank
©International Monetary Fund. Not for Redistribution

v
The resilience and sustained growth over the past 20 years of the five founding
members of the Association of Southeast Asian Nations (ASEAN)—Indonesia,
Malaysia, the Philippines, Singapore, and Thailand—have been among the stron-
gest across emerging markets. This book shares many lessons from the ASEAN-5
countries’ policy reforms and economic resurgence after the Asian financial crisis,
including the consensus-based “ASEAN Way” of collaborating and integrating
trade, finance, and labor markets on the path toward an ASEAN Economic
Community. Cooperative frameworks also underpin the region’s financial safety
net under the Chiang Mai Initiative Multilateralization.
Overall, the ASEAN-5 economies’ monetary policy frameworks have per-
formed well, delivering both output and price stability during a period of sig-
nificant domestic and regional turbulence and transformation. A gradual move
toward greater exchange rate flexibility, coupled with the flexible inflation-
targeting frameworks put in place in Indonesia, the Philippines, and Thailand,
and the somewhat different approaches of Malaysia and Singapore, helped sus-
tain growth with low inflation. The ASEAN-5 also overhauled financial regula-
tion and supervision and undertook financial reforms aimed at restructuring
banks and nonfinancial corporations and developing local current bond mar-
kets. These policy reforms helped these countries withstand the global financial
crisis and preserve financial stability.
Global financial cycles have had a pervasive impact on ASEAN-5 business
cycles, transmitted partly through financial conditions and capital flows. Real
economy factors, such as external demand from the United States and more
recently China, have also been important, but global financial factors have tended
to dominate. To lean against the wind of capital flows and preserve financial sta-
bility, regional policymakers have relied on several policy levers, including macro-
prudential and microprudential measures, exchange rate adjustment, and foreign
exchange market intervention. These policy tools have supplemented monetary
policy. The extensive use of macroprudential policies in the ASEAN-5, a frontier
area in macro policymaking globally, provides lessons on their potential effective-
ness. Empirical and model-based approaches show that macroprudential policies
helped manage the financial cycle in ASEAN-5, allowing macro policies to focus
on the business cycle and sustain growth.
Global financial spillovers will continue to test the resilience of ASEAN-5 econ-
omies. Sustaining growth and stability will demand further upgrading of policy and
institutional frameworks, exploiting macroeconomic policy synergies, and enhanc-
ing resilience through regional financial integration. Against the backdrop of elevat-
ed global uncertainty, the policy challenges that will face the ASEAN-5 may vary
more than those they faced during recent decades, given different starting condi-
tions. Whereas some economies must grapple with persistently weak inflation amid
Foreword
©International Monetary Fund. Not for Redistribution

vi THE ASEAN WAY: SUSTAINING GROWTH AND STABILITY
high household leverage, others must carefully orchestrate an infrastructure push
and manage continued global financial volatility.
The IMF remains a committed partner in the region’s growth and transforma-
tion. I hope this book will inspire a broader conversation on how the ASEAN way
of collaboration and integration in the areas of trade, finance, and labor markets
can guide the path forward not just for Southeast Asia, but also for other emerg-
ing market and developing economies.
Christine Lagarde
Managing DirectorInternational Monetary Fund
©International Monetary Fund. Not for Redistribution

vii
This publication benefited from valuable guidance from Changyong Rhee and
Odd Per Brekk, Director and Deputy Director in the IMF’s Asia and Pacific
Department. It also benefited from insights from panelists and participants at
numerous seminars and events, including at ASEAN-5 central banks, the
ASEAN+3 Macroeconomic Research Office (AMRO)–IMF annual conferences,
the South East Asian Central Banks (SEACEN) deputy governors’ conference,
and at the IMF.
We express our strong appreciation for support from Hoe Ee Khor (AMRO),
who guided our early work; IMF Executive Director Juda Agung; and coauthors
and contributors Mia Frances R. Agcaoili, Julian T. S. Chow, Geraldine
Dany-Knedlik, Ding Ding, Ichiro Fukunaga, Juan Angel Garcia, David Grigorian,
Jaime Guajardo, Minsuk Kim, Rui C. Mano, Dirk Muir, Pablo Lopez Murphy,
Aubrey Poon, Khristine L. Racoma, Sohrab Rafiq, Sherillyn R. Raga, Umang
Rawat, Manrique Sáenz, Yiqun Wu, and Xiaohui Wu.
We are indebted to the IMF’s Editorial and Publications Division. Special
thanks go to Gemma Rose Diaz for managing the production of the book, as well
as to Sherrie Brown, Patricia Loo, and Lucy Morales for their editorial contribu-
tions. We also thank Jeffrey Hayden and Linda Griffin Kean for their
unwavering support.
We are very grateful to Francis Joseph Landicho and To-Nhu Dao, from the
Asia and Pacific Department, for their excellent job coordinating the production
of the manuscript.
Ana Corbacho and Shanaka J. Peiris
Editors
Acknowledgments
©International Monetary Fund. Not for Redistribution

This page intentionally left blank
©International Monetary Fund. Not for Redistribution

ix
Mia Frances R. Agcaoili is on secondment as economic analyst at the IMF
Resident Representative Office in Manila, Philippines, where her primary task is
to write the ASEAN-5 financial markets developments section of the ASEAN-5
Economic Monitor and provide research and statistical support to the IMF coun-
try team on the Philippines. She has also conducted some econometric work on
tax reform and monetary policy. Before being detailed to the IMF Resident
Representative Office, she was a bank officer at the Department of Economic
Statistics of the Bangko Sentral ng Pilipinas. She specialized in external debt and
balance of payments and spearheaded the central bank’s initiative in refining the
central bank’s debt sustainability model. She obtained her undergraduate degree
in statistics in 2011 and master’s in technology management in 2015—both from
the University of the Philippines.
Julian T. S. Chow is a senior economist in the IMF Monetary and Capital
Markets Department. His surveillance work on emerging market banking and the
corporate sector has been published in the IMF’s Global Financial Stability Report and Spillover Report as well as in the Financial Stability Board’s Report on Corporate Funding Structures and Incentives. He has also worked extensively in the IMF
Financial Sector Assessment Program in various capacities, as deputy mission
chief for Azerbaijan, stress tester for Mexico, and financial sector expert for India
and Malaysia. He started his career at Bank Negara Malaysia, the central bank,
where he was acting manager for foreign exchange in the Investment Operations
and Financial Markets Department. He has also worked in the private sector as a
senior fixed income fund manager. He holds a chartered financial analyst (CFA)
charter and postgraduate degrees in finance and economics from the London
School of Economics and the Royal Melbourne Institute of Technology.
Ana Corbacho is currently head of the Strategy Unit of the IMF. When this book
was under preparation, she was division chief in the IMF Asia and Pacific
Department (APD), where she led the country team on Thailand, the APD Fiscal
Group, and the APD ASEAN Group. She has also led IMF operations on a range
of countries in Latin America and the Caribbean and has overseen various
high-profile regional projects. These include APD’s participation in the first joint
test run of the IMF and the Chiang Mai Initiative Multilateralization, a financial
network report on Central America and Colombia, and work on the IMF’s
Regional Economic Outlook for the Western Hemisphere during the global finan-
cial crisis. Between 2010 and 2013, she was the principal economic advisor for
the Institutions for Development Sector at the Inter-American Development
Bank, responsible for research and dissemination. Her areas of expertise include
macroeconomic analysis, fiscal policy, public-private partnerships, financial
Contributors
©International Monetary Fund. Not for Redistribution

x THE ASEAN WAY: SUSTAINING GROWTH AND STABILITY
networks, household survey analysis, and crime and violence. She received her
PhD in economics from Columbia University and her Licentiate in economics
from Universidad de San Andrés.
Geraldine Dany-Knedlik since 2018 has held a postdoctoral position at DIW
Berlin conducting research on empirical monetary economics and macroeconom-
ics in the Macroeconomics Department. She also participates in the joint eco-
nomic forecast, commissioned by the Federal Ministry for Economic Affairs and
Energy, and is instrumental in evaluation of the overall economic situation and
development in Germany, the euro area, and the rest of the world. Before joining
DIW Berlin she was a PhD student at the Halle Institute of Economic Research,
in the Macroeconomics Department. She was also an economist at the Martin
Luther University of Halle-Wittenberg and a research intern at the IMF and the
European Central Bank in 2016. Her main research interests are monetary policy
and economics, dynamic macroeconomics, and applied time series econometrics.
She received an MSc in economics and international economics from the
University of Nottingham.
Ding Ding is a senior economist in the IMF Asia and Pacific Department. He is
currently the senior desk economist for the China team, as well as mission chief
for Kiribati. He previously worked on several advanced and emerging market
economies, including Australia, Korea, New Zealand, and Sri Lanka, and has
published on a variety of topics, including macro-financial linkages, monetary
policy transmission, and macroeconomic modeling and forecasting. He obtained
a PhD in economics from Cornell University.
Ichiro Fukunaga is senior economist in the Strategy, Policy, and Review
Department of the IMF, where he works on various areas of IMF policy. He is
also on the IMF country team for Thailand in the Asia and Pacific Department.
Before joining the IMF in 2015, he was senior economist at the Bank of Japan,
where he worked on macroeconomic projections and modeling, economic analy-
sis, and financial market analysis. He received his PhD in economics from the
London School of Economics and his MA and BA in economics from the
University of Tokyo.
Juan Angel Garcia is currently senior economist for the Thailand team in the
Asia and Pacific Department of the IMF. Before joining the IMF, he worked at
the European Central Bank in several departments and divisions, including
Directorate General Research, Capital Markets and Financial Structure, and Euro
Area Macroeconomic Developments. His areas of expertise are macroeconomics,
asset pricing, and inflation expectations. He obtained his PhD in economics from
the University of Warwick, United Kingdom.
David Grigorian is a senior economist in the IMF Asia and Pacific Department,
on secondment from the Monetary and Capital Markets Department. He holds a
©International Monetary Fund. Not for Redistribution

Contributors xi
PhD in economics from the University of Maryland at College Park, MA in eco-
nomics from the Central European University, and MSc in industrial engineering
from the American University of Armenia. Throughout his career in the Monetary
and Capital markets Department (2009–16), he dealt with a wide array of emerg-
ing and advanced market countries (including The Bahamas, Barbados, Bulgaria,
Cyprus, Greece, Jamaica, Kuwait, Morocco, Tunisia, and Vietnam) on issues such
as sovereign and corporate debt restructuring, debt market development, and finan-
cial crisis management. In his previous position as desk economist on Iraq
(2006–09), he helped the authorities prepare the macroeconomic framework under
occupation and draft federal budgets for 2007, 2008, and 2009. He has published
on a range of issues, including banking and capital markets, growth and institu-
tions, remittances, and fiscal performance, and his research is cited widely.
Jaime Guajardo is a senior economist in the IMF Asia and Pacific Department.
He works in the ASEAN-4 Division as a desk economist for Indonesia. He has
been at the IMF for 13 years and in his current department for the past 4. Before
that he worked in the Research Department, IMF Institute, and European
Department. He did his undergraduate and master level studies at the Universidad
de Chile, and he has a PhD in economics from the University of California, Los
Angeles. He is a citizen of Chile.
Hoe Ee Khor is chief economist and a senior management member of the
ASEAN+3 Macroeconomic and Research Office (AMRO). He is responsible for
the surveillance function of AMRO and for leading and managing the macroeco-
nomic and financial market surveillance work on the ASEAN+3 region and its
member economies. His previous positions include deputy director of the IMF
Asia and Pacific Department, assistant managing director of the Monetary
Authority of Singapore, and chief economist of the Abu Dhabi Council for
Economic Development. He holds a PhD in economics from Princeton University.
Minsuk Kim is an economist at the IMF. Since joining the IMF in 2011, he has
worked extensively in the areas of multilateral surveillance and structural reform
and served as a member of IMF missions to several member countries, most
recently to the Philippines, Canada, and Pakistan. He holds a PhD in economics
from the University of California, Los Angeles.
Rui C. Mano is an economist in the IMF Asia and Pacific Department. He covers
China and Hong Kong SAR and previously worked on Mongolia, Korea, and the
Philippines. He started his IMF career in the Research Department analyzing
multilateral external sector topics, including global imbalances. His research
interests are exchange rate risk, foreign exchange intervention, and global imbal-
ances, among others. He holds a PhD in economics from the University of Chicago.
Dirk Muir is a senior economist in the IMF Asia and Pacific Department, where
he works in the Australia–New Zealand Division. Previously, he was a long-standing
©International Monetary Fund. Not for Redistribution

xii THE ASEAN WAY: SUSTAINING GROWTH AND STABILITY
member of the Research Department’s Economic Modeling Division, focused on
developing and using large-scale macroeconomic models. He has worked on a large
variety of issues in international economics using models, including Australian links
with China, oil markets, and global rebalancing, as well as Australian fiscal policy,
Italian and European structural reform, and issues more generally related to fiscal
consolidation and multipliers. He holds an MA in economics from Queen’s
University (Canada). He held a variety of positions before joining the IMF, at the
Bank of Canada, the Department of Finance of Canada, the Norges Bank, the
European Central Bank, and Deutsche Bank Global Markets London.
Pablo Lopez Murphy is deputy division chief in the Regional Studies Division
of the IMF Asia and Pacific Department. He leads the IMF country team on Fiji.
Before taking this position, he was senior economist for the team that followed
Greece during 2014–16 and for the Spain team during 2012–14, in the European
Department. Between 2009 and 2011 he was in the Fiscal Affairs Department,
where he worked on the teams that followed Mexico and Lebanon. He also par-
ticipated in technical assistance missions to Hungary, Jordan, Botswana, and the
former Yugoslav Republic of Macedonia. His areas of expertise are international
macroeconomics and public finance. He received a PhD in economics from the
University of California, Los Angeles, and a Licenciate in economics from the
Universidad Nacional de La Plata in 1998.
Shanaka Jayanath (Jay) Peiris is currently the IMF Asia and Pacific Department’s
mission chief for Myanmar and deputy division chief of the ASEAN-2 Division,
covering ASEAN macro-financial surveillance for the Asia and Pacific Department.
Previously he was the IMF’s resident representative in the Philippines, senior econ-
omist in the Asia and Pacific and Monetary and Capital Markets Departments
covering Association of Southeast Asian Nation countries and south Asia, and
mission chief to Pacific island countries, and he led a sub-working group on asset
price risks for the G20 Mutual Assessment Process. He has also worked on eastern
and southern Africa. He joined the IMF in 2001 after receiving his PhD in eco-
nomics at Oxford University. He was a lecturer in mathematical economics and
econometrics at Sommerville College and Jesus College, Oxford. Earlier, he
interned at Deutsche Bank AG and the World Bank.
Aubrey Poon is a postdoctoral fellow at the University of Strathclyde and a
research associate at the Centre of Applied Macroeconomic Analysis at the
Australian National University. His main field of research is applied macroecono-
metrics, especially in the application of time-varying parameters and stochastic
volatility models to macroeconomic issues, such as business cycle analysis, fore-
casting, and inflation modeling. He received both his PhD and master’s in eco-
nomics at the Australian National University.
Khristine L. Racoma is an economic analyst on secondment in the IMF Resident
Representative Office in Manila, Philippines, where she conducts research and
©International Monetary Fund. Not for Redistribution

Contributors xiii
works on analytical notes provided to the IMF mission team. She handles requests
for collection of information and analysis on the tax reform and fiscal and real
policy issues. Before coming to the IMF, she worked as an economist II in the
Research and Information Office of the Department of Finance of the Philippines.
Her major tasks included quantitative analysis of the department’s comprehensive
tax reform program. She received her bachelor’s in economics from the University
of Santo Tomas.
Sohrab Rafiq is an economist in the IMF Asia and Pacific Department. In addition
to participation in surveillance missions to member countries, he has been involved
in supporting and negotiating a number of IMF-led programs. He previously
worked as an economist for the European Central Bank in Frankfurt and the gov-
ernment of Malaysia’s sovereign wealth fund (Khazanah Nasional) in Kuala
Lumpur. He holds a PhD in economics from the University of Nottingham, with
a specialization in macroeconometrics. He has published numerous peer-reviewed
journal articles in the areas of macroeconomics and macroeconometrics.
Sherillyn R. Raga was a research associate at the IMF Resident Representative
Office in Manila, Philippines, on secondment with the Bangko Sentral ng
Pilipinas in 2015–16, where she drafted the ASEAN-5 financial market page for
a monthly regional economic monitor, contributed to the IMF Cluster Report on the Evolution of Monetary Policy Frameworks in the ASEAN-5, and was a team
member for the IMF Article IV Mission to the Republic of Palau. Previously she
worked more than five years in the Bangko Sentral International Relations
Department, where she prepared the central bank’s positions regarding Association
of Southeast Asian Nations financial integration, the World Trade Organization,
bilateral central bank cooperation initiatives, and regional capacity-building activ-
ities, among others. She obtained her economics degree from the University of
the Philippines and is currently a candidate for an MSc in economics for devel-
opment at Oxford University.
Umang Rawat is an economist in the Monetary and Capital Markets Department
of the IMF, where he works on issues related to monetary, macroprudential, and
exchange rate policies. Previously, he worked in the Asia and Pacific Department
covering monetary and financial sector issues for Singapore and as part of the
IMF’s Regional Economic Outlook for Asia and the Pacific in 2017. He has also
worked extensively on issues related to the IMF’s special drawing rights (SDRs),
including review of the renminbi’s inclusion in the SDR basket. His areas of
expertise include macroeconomic analysis, business cycle dynamics, monetary
policy, and macro-financial linkages. He holds a PhD and bachelor’s in economics
from the University of Cambridge.
Manrique Sáenz is currently senior economist for the Thailand team in the Asia
and Pacific Department of the IMF. During his IMF career, he has gained ample
experience on emerging market issues, including fiscal sustainability,
©International Monetary Fund. Not for Redistribution

xiv THE ASEAN WAY: SUSTAINING GROWTH AND STABILITY
international capital flows, and the impact of the global financial crisis on emerg-
ing markets. During 2011–14 he was senior advisor for the minister of finance of
Costa Rica, where he worked on fiscal reform, social security issues (health insur-
ance and pensions system), and domestic fiscal financing, among others. Before
joining the IMF in 2005, he worked at the Central Bank of Costa Rica as a
researcher and advisor to the governor. His areas of expertise are macroeconomics
and fiscal policy. He obtained his PhD in economics from the University of
California, Los Angeles.
Xiaohui Wu was a summer intern in the IMF Asia and Pacific Department in
2017 and is a PhD candidate at George Washington University. Her research
interests include international finance and nonlinear econometrics models. She
has done research on nonlinear behavior of capital flows and exchange rates. She
received her MA in economics from George Washington University in 2014.
Before that, she worked in the audit department of KPMG China from 2008 to
2011, where she specialized in financial auditing of the manufacturing and tele-
communications sectors. She received a BA in economics and law from Xiamen
University in 2008.
Yiqun Wu is currently an economist in the ASEAN-2 Division of the IMF Asia
and Pacific Department, covering Myanmar and Thailand. Previously, he was the
main desk economist for the Solomon Islands, a program country under the
Extended Credit Facility. He has worked in the Asia and Pacific Department’s
Regional Studies Division and coauthored several cross-country analytical chap-
ters in the Asia and Pacific Regional Economic Outlook. His country experience at
the IMF includes Kiribati, Palau, and Papua New Guinea, and he has contributed
to the IMF’s research and policy agenda in small states, including two IMF Board
papers and several policy papers. His areas of expertise include macroeconomics,
international economics, and economic growth and development. He obtained
his PhD in economics from the State University of New York, Buffalo.
©International Monetary Fund. Not for Redistribution

1
Overview
CHAPTER 1
A bumpy normalization of monetary policies in advanced economies, capital flow
volatility, global policy missteps: these are just a few of the possible risks shaping
the global outlook in the years ahead. They represent important challenges for
emerging market and developing economies across the globe.
The Association of Southeast Asian Nations–5 (ASEAN-5: the five founding
members, comprising Indonesia, Malaysia, the Philippines, Singapore, and
Thailand) stand strong in the face of these challenges. The dramatic transforma-
tion of their policy frameworks since the Asian financial crisis delivered
macro-financial stability during significant domestic and regional transformation
as well as global macroeconomic and financial turmoil. Over the past few decades,
the ASEAN-5 have strengthened resilience, built up buffers, and adapted their
policies to respond to global spillovers.
However, global risks will continue to test ASEAN-5 economies. Against this
backdrop, this book proposes a policy agenda to sustain growth and stability in
the coming decades. Part I offers a retrospective of the evolution of monetary
policy and financial stability frameworks in the ASEAN-5, with special focus on
changes since the Asian financial crisis and the more recent period of unconven-
tional monetary policies in advanced economies. Part II looks into the channels
of transmission of global spillovers and the monetary, exchange rate, and
ASEAN-5 macroprudential policy responses. Part III concludes with forthcoming
challenges and maps out ways to further upgrade policy frameworks, exploit syn-
ergies, and enhance resilience.
The successful experience of the ASEAN-5 provides valuable lessons for other
emerging market and developing economies. The authors’ rigorous and novel
analysis leaves no stone unturned as they gather evidence of what has worked and
what could work better to meet the challenges ahead.
The analysis put forth in the book supports three broad conclusions:
1. The ambitious reforms of monetary policy and financial stability frame-
works since the Asian financial crisis paid off.
Since the Asian financial crisis, the ASEAN-5 countries have adjusted their
policy frameworks to address financial booms and busts more systematically, embarking on an ambitious and broad-ranging program of economic and finan-
cial sector reforms.
This chapter was prepared by Ana Corbacho and Shanaka J. Peiris.
©International Monetary Fund. Not for Redistribution

2 THE ASEAN WAY: SUSTAINING GROWTH AND STABILITY
With respect to monetary policy frameworks, a flexible inflation-targeting
framework in Indonesia, the Philippines, and Thailand, alongside slightly differ-
ent frameworks in Malaysia and Singapore, have served the ASEAN-5 economies
well in terms of low inflation and output volatility (Figures 1.1 and 1.2).
Chapter 2, by Hoe Ee Khor and others, examines the evolution of monetary
policy regimes since the Asian crisis, showing how ASEAN-5 countries accommo-
dated the constraints imposed by the “impossible trinity” of a fixed exchange rate,
an open capital market, and independent monetary policy. The clarification of
price stability objectives, including the adoption of explicit inflation targets in
some countries, and the strengthening of central bank operations and transparency,
have been major milestones in the evolution of monetary policy frameworks. The
transition to more consistent forward-looking frameworks allowed ASEAN-5
economies to withstand the global financial crisis well, as well as the commodity
price cycle and the recent low-inflation environment. Moreover, the ASEAN-5
gradually moved toward flexible exchange rate regimes, which strengthened mon-
etary independence and facilitated adjustment to external shocks. Finally, active
and independent liquidity management to align market conditions with the
1990s 2000s 2010–18
0
1
2
3
4
5
6
Figure 1.1. GDP Growth: ASEAN-5 and Peers(Standard deviation of year-over-year growth)
ASEAN-5 India China LAC-5 EuropeanEMs
Sources: IMF, World Economic Outlook database; and IMF staff calculations.Note: ASEAN-5 = Indonesia, Malaysia, Philippines, Singapore, Thailand; LAC-5 = Brazil, Chile, Colombia, Mexico, Peru; European EMs = Bulgaria, Hungary, Poland, Romania, Russia, Turkey, Ukraine.
©International Monetary Fund. Not for Redistribution

Chapter 1 Overview 3
announced policy stance and improved central bank communications were key
ingredients to their success.
Major reforms of micro- and macroprudential policy frameworks allowed
ASEAN-5 financial systems to build significant resilience. Chapter 3, by Pablo
Lopez Murphy, takes stock of these major initiatives. ASEAN-5 countries over-
hauled financial regulation and supervision; bank supervisors embraced Basel
core principles, strengthened supervisory policies, required banks to hold more
capital, and aligned regulations with best practice. The ASEAN-5 also worked to
restructure nonfinancial corporations, including by establishing centralized
asset-management companies and relying on out-of-court debt workouts as a
speedy, cost-effective, and market-friendly alternative to court-supervised work-
outs. To cap it off, ASEAN-5 countries developed bond markets in local curren-
cies to reduce foreign exchange mismatches, lower credit and maturity risks in
banks, and store away a spare tire should the banking system be impaired.
All these efforts helped ASEAN-5 countries navigate the global financial crisis
well and preserve financial stability. Following the global crisis, ASEAN-5 finan-
cial systems were in much better shape than those of many advanced economies
1990s
2000s2010–18
442 300
0
5
10
15
20
25
(Year-over-year percent change, average)
ASEAN-5 India China LAC-5 EuropeanEMs
Sources: IMF, World Economic Outlook database; and IMF staff calculations.Note: LAC-5 = Brazil, Chile, Colombia, Mexico, Peru; European EMs = Bulgaria, Hungary, Poland, Romania, Russia, Turkey, Ukraine.
©International Monetary Fund. Not for Redistribution

4 THE ASEAN WAY: SUSTAINING GROWTH AND STABILITY
because ASEAN policymakers routinely responded to emerging systemic risks.
Nowadays, ASEAN-5 financial systems differ in size, access, efficiency, and finan-
cial supervision structure, partly reflecting varying stages of economic develop-
ment. But they also have important similarities, including the increasing impor-
tance of shadow banks and financial markets, the large presence of financial
conglomerates, and the high participation of the government. A bird’s-eye view
suggests that macro-financial risks are contained and generally lower in ASEAN-5
countries than in the global financial system (Figure 1.3), a testament to the
benefits of decades of strong reform efforts.
2. Global spillovers will continue to test policy frameworks in
ASEAN-5 countries.
In the wake of the global financial crisis, ASEAN-5 policymakers were com-
pelled to adapt their frameworks to strengthen policy autonomy and mitigate
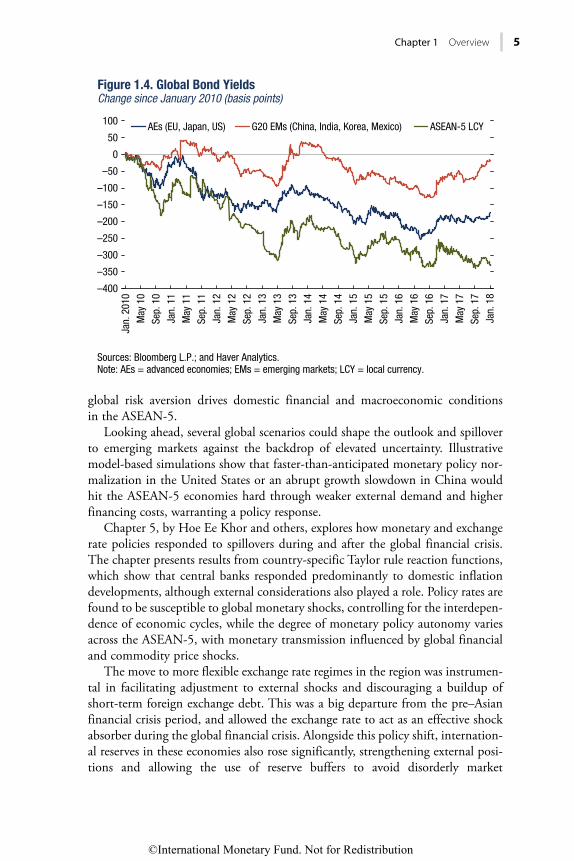
risks from global spillovers. Chapter 4, by Shanaka J. Peiris and others, considers
the channels through which global financial factors have impacted domestic
financial markets and monetary conditions in the ASEAN-5. Principal compo-
nent analysis of domestic financial conditions identifies two key macro-financial
channels of transmission of global financial shocks: one is related to the Chicago
Board Options Volatility Index (VIX) and affects largely capital flows and asset
prices; the other is linked to US interest rates and affects mainly monetary and
credit conditions. The chapter also assesses empirically the transmission of reserve
currency monetary policy to domestic short- and long-term market interest rates,
as well as to retail bank rates, given their importance in domestic monetary policy
transmission (Figure 1.4). Macro-financial spillovers to the real economy are also
investigated through Bayesian vector autoregression models. Results suggest that
global financial cycles emanate from changes in US monetary policy and that
Global 2017:Q1ASEAN-5 2017:Q1
Figure 1.3. ASEAN-5 Financial Stability Map 2017 versus Global, 20171
Inward spillover risks
Credit risks
Market and liquidityrisks
Risk appetite
Monetary and
risks
1
0
2
4
6
8
©International Monetary Fund. Not for Redistribution
Chapter 1 Overview 5
global risk aversion drives domestic financial and macroeconomic conditions in the ASEAN-5.
Looking ahead, several global scenarios could shape the outlook and spillover to emerging markets against the backdrop of elevated uncertainty. Illustrative model-based simulations show that faster-than-anticipated monetary policy nor-malization in the United States or an abrupt growth slowdown in China would hit the ASEAN-5 economies hard through weaker external demand and higher financing costs, warranting a policy response.
Chapter 5, by Hoe Ee Khor and others, explores how monetary and exchange rate policies responded to spillovers during and after the global financial crisis. The chapter presents results from country-specific Taylor rule reaction functions, which show that central banks responded predominantly to domestic inflation developments, although external considerations also played a role. Policy rates are found to be susceptible to global monetary shocks, controlling for the interdepen-dence of economic cycles, while the degree of monetary policy autonomy varies across the ASEAN-5, with monetary transmission influenced by global financial and commodity price shocks.
The move to more flexible exchange rate regimes in the region was instrumen-tal in facilitating adjustment to external shocks and discouraging a buildup of short-term foreign exchange debt. This was a big departure from the pre–Asian financial crisis period, and allowed the exchange rate to act as an effective shock absorber during the global financial crisis. Alongside this policy shift, internation-al reserves in these economies also rose significantly, strengthening external posi-tions and allowing the use of reserve buffers to avoid disorderly market
AEs (EU, Japan, US) G20 EMs (China, India, Korea, Mexico) ASEAN-5 LCYJa
n. 2
010
May
10
Sep.
10
Jan.
11
May
11
Sep.
11
Jan.
12
May
12
Sep.
12
Jan.
13
May
13
Sep.
13
Jan.
14
May
14
Sep.
14
Jan.
15
May
15
Sep.
15
Jan.
16
May
16
Sep.
16
Jan.
17
May
17
Sep.
17
Jan.
18
–400
–350
–300
–250
–200
–150
–100
–50
0
50
100
Sources: Bloomberg L.P.; and Haver Analytics.Note: AEs = advanced economies; EMs = emerging markets; LCY = local currency.
Figure 1.4. Global Bond YieldsChange since January 2010 (basis points)
©International Monetary Fund. Not for Redistribution
6 THE ASEAN WAY: SUSTAINING GROWTH AND STABILITY
conditions. Calibrated model simulations also suggest that foreign exchange
market intervention, in some circumstances, could help reduce business cycle
fluctuations in response to capital flow shocks. A key aspect of the policy respons-
es to the global financial crisis and other capital outflow episodes was the timely
use of different policy levers, taking into account macro-financial linkages.
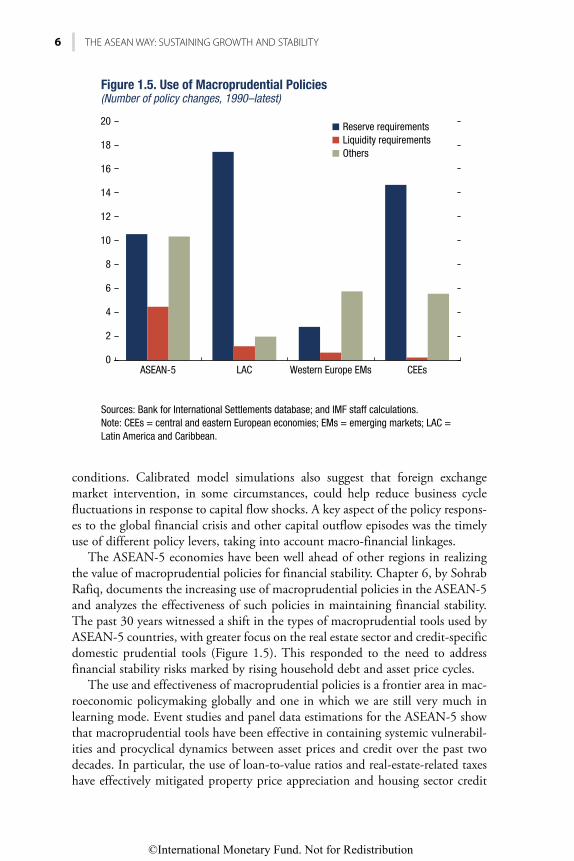
The ASEAN-5 economies have been well ahead of other regions in realizing
the value of macroprudential policies for financial stability. Chapter 6, by Sohrab
Rafiq, documents the increasing use of macroprudential policies in the ASEAN-5
and analyzes the effectiveness of such policies in maintaining financial stability.
The past 30 years witnessed a shift in the types of macroprudential tools used by
ASEAN-5 countries, with greater focus on the real estate sector and credit-specific
domestic prudential tools (Figure 1.5). This responded to the need to address
financial stability risks marked by rising household debt and asset price cycles.
The use and effectiveness of macroprudential policies is a frontier area in mac-
roeconomic policymaking globally and one in which we are still very much in
learning mode. Event studies and panel data estimations for the ASEAN-5 show
that macroprudential tools have been effective in containing systemic vulnerabil-
ities and procyclical dynamics between asset prices and credit over the past two
decades. In particular, the use of loan-to-value ratios and real-estate-related taxes
have effectively mitigated property price appreciation and housing sector credit
Reserve requirements
Liquidity requirementsOthers
Figure 1.5. Use of Macroprudential Policies(Number of policy changes, 1990–latest)
0
2
4
6
8
10
12
14
16
18
20
Sources: Bank for International Settlements database; and IMF staff calculations.Note: CEEs = central and eastern European economies; EMs = emerging markets; LAC = Latin America and Caribbean.
ASEAN-5 CEEsLAC Western Europe EMs
©International Monetary Fund. Not for Redistribution

Chapter 1 Overview 7
growth. Macroprudential policies have also complemented monetary policy and
enhanced the monetary policy transmission mechanism via the bank lending
channel. Moreover, the increased use of macroprudential tools has mirrored shifts
in the management of bank capital across the region, coincided with lower risk
taking and less reliance on noncore funding by banks, and led to more prudent
bank balance sheet management. The ASEAN-5’s successful experience with
macroprudential policies thus holds lessons for other advanced and emerging
market economies.
The more active use of macroprudential policies is a sign that ASEAN-5 poli-
cymakers have long recognized that financial imbalances can build up even during
periods of economic tranquility and benign inflation pressure. Evidence for the
ASEAN-5 implies that financial stability will not necessarily emerge as a natural
by-product of a so-called appropriate monetary policy stance. The findings in the
chapter suggest that central banks therefore have strong incentives to pursue mac-
roprudential policies to safeguard financial stability. Still, policymakers should be
mindful that macroprudential policy entails costs and trade-offs. Moreover, for
macroprudential policy to be effective, its objectives need to be defined clearly and
supported by a strong accountability framework. In this respect, ASEAN-5 coun-
tries continue to develop appropriate institutional underpinnings.
3. Challenges ahead call for upgrading policy and institutional frameworks,
exploiting policy synergies, and reaping the benefits of regional integration.
A decade after the global financial crisis, the global macroeconomic and finan-
cial landscape is still influenced by some of its legacies. ASEAN-5 countries faced
a protracted period during which most advanced economies’ expansionary mon-
etary policies were not well aligned with domestic economic conditions in emerg-
ing market economies. The global outlook is for gradual normalization of mone-
tary policy in advanced economies amid relatively low inflation pressure.
However, an inflation surprise could suddenly tighten global financial conditions
and spark capital flow volatility, with serious implications for emerging market
and developing economies across the globe.
As discussed in Chapter 7, by Juan Angel Garcia Morales and others, mone-
tary policy in ASEAN-5 countries must continue to adapt to the new normal of
uncertain and volatile global conditions. The chapter first analyzes the evolution
of inflation dynamics in the region over the past two decades. The primary focus
on price stability has enhanced the effectiveness of ASEAN-5 monetary policy
frameworks. Since the Asian financial crisis, inflation expectations have gradually
become the most important driver of inflation dynamics, confirming the
forward-looking orientation of monetary policy frameworks in the region
(Figure 1.6). The analysis in the chapter also suggests the impact of economic
slack on inflation has declined in recent years. This flattening of the Phillips curve
may have important implications for monetary policy in ASEAN-5 economies.
For example, in countries particularly affected by low-oil-price shocks and facing
below-target inflation, the recovery in inflation could be weaker than in the past.
Moreover, the decline in natural rates of interest in some of these economies,
©International Monetary Fund. Not for Redistribution

8 THE ASEAN WAY: SUSTAINING GROWTH AND STABILITY
mirroring developments in other countries around the globe, may constrain the
scope for monetary policy to counter the next economic slowdown.
Differences in inflation performance vis-à-vis central bank targets and finan-
cial sector vulnerabilities call for different responses to the global challenges in the
new normal. Potential further refinements in monetary policy frameworks may
well be asymmetric across ASEAN-5 countries. Yet all ASEAN-5 economies are
in a position to continue to adapt their monetary policy frameworks through
enhanced communication and better monitoring of inflation expectations. In this
respect, the authors present novel estimates of inflation expectations based on
trend inflation that complement existing survey-based measures. Transparency
about the response to a rapidly changing and uncertain outlook, as well as the
adjustments in monetary policy frameworks to cope with it, will likely be essential
features of effective central bank communication in the period ahead.
The ASEAN-5 weathered the global financial crisis well, but crisis legacies
continue to linger, and some financial vulnerabilities have been on the rise.
Chapter 8, by Pablo Lopez Murphy and others, provides an analysis of systemic
risks and discusses a policy agenda for strengthening financial stability frame-
works. The authors first scrutinize the fast pace of credit growth since the global
financial crisis. Yet they conclude that there is no evidence of generalized credit
booms in the ASEAN-5 following the global crisis, unlike during pre–Asian crisis
periods. However, the rapid increase in corporate leverage and household debt in
some countries calls for careful monitoring. Moreover, the high degree of
Forward-looking dynamicsOutput gap
Source: IMF staff estimates.
(Average)
Pre-2000 2000–09 2010–160
100
10
20
30
40
50
60
70
80
90
©International Monetary Fund. Not for Redistribution

Chapter 1 Overview 9
interconnectivity within the financial sector and between the financial and the
real sectors, while unavoidable in a financial deepening process, could be an
emerging vulnerability. Finally, new technologies could bring benefits but also
risks to ASEAN-5 financial systems.
The chapter discusses the challenges and policy agenda ahead for strengthen-
ing financial stability frameworks. Because they can smooth credit cycles, macro-
prudential policies are a key pillar for containing the dangers of rapid credit
growth. Policymakers should consider upgrading toolkits with systematic coun-
tercyclical macroprudential policies to build buffers during booms. Financial
system regulation and supervision and crisis management frameworks are other
key pillars for resilience. The Basel III standards should be a benchmark all coun-
tries should aspire to meet. Similarly, the Key Attributes for Effective Resolution
of Financial Institutions are the relevant metric for resolution frameworks. In
turn, while regulatory frameworks for cryptocurrencies are still evolving, they
should balance containing risk against promoting innovation.
Managing boom-and-bust cycles in the presence of global spillovers remains a
key policy challenge for ASEAN-5 economies. Chapter 9, by Manrique Saenz and
others, documents that recessions that follow a bust have entailed both temporary
and permanent output losses in the region. Moreover, growth downturns are
magnified in the presence of financial vulnerabilities, such as excessive household
and corporate debt. Countercyclical monetary policy can play a key role in man-
aging boom-and-bust cycles but, on its own, its effectiveness can be limited. The
chapter hence proposes exploiting synergies between monetary, macroprudential,
and fiscal policies to manage fluctuations along the real and financial cycles and
sustain growth.
Macroprudential policies can play an important role in complementing mon-
etary policy. Model simulations show that countercyclical macroprudential tools
targeted at financial imbalances, coupled with monetary policy focused on infla-
tion and growth, can enhance macroeconomic and financial stability and deliver
better macroeconomic results than a strategy that uses monetary policy as the
only tool. This result is robust to a relative flattening in the Phillips curve.
Countercyclical macroprudential tools are also shown to reduce systemic risks
with minimal costs to real economic activity in response to a wide array of shocks.
Fiscal policy can also complement monetary policy in smoothing out the cycle
while supporting medium- and long-term growth. Policy scenarios show the
payoff to infrastructure investment under different monetary policy reaction
functions. In particular, for countries facing persistently low inflation, an infra-
structure push, coupled with monetary accommodation, can lead to significant
increases in real GDP. The additional growth also allows them to protect their
fiscal space, even if the investment scale-up is financed with debt. For countries
with more limited fiscal space and high inflation, a focus on high-efficiency
investment is likely the best option for achieving a higher multiplier.
Deepening regional financial integration could support financial resilience,
stability, and development. Chapter 10, by Yiqun Wu and others, delves into the
benefits and challenges posed by the ASEAN Economic Community’s move
©International Monetary Fund. Not for Redistribution

10 THE ASEAN WAY: SUSTAINING GROWTH AND STABILITY
toward financial liberalization and freer capital flows by 2025. The chapter shows
that regional financial integration has lagged not only regional trade integration,
but also financial integration with countries outside the region (Figure 1.7). Based
on evidence from panel data estimations, the chapter proposes that improving
regulatory and institutional quality and reducing capital flow restrictions are
promising avenues to promote regional financial integration. The chapter also
provides empirical support for significant benefits from regional financial integra-
tion, ranging from enhanced resilience to global shocks to economic rebalancing
and higher growth.
When advancing regional financial integration, it is crucial to harness the
gains while minimizing the risks. Close attention must be paid to financial
stability and safety nets. The opening up of financial markets requires, in the
first place, strengthening domestic financial systems and improving macroeco-
nomic fundamentals. At the regional level, cooperation must proceed to
enhance information sharing, surveillance, and crisis management and to build
an effective cross-country safety net. In recent years the regional safety net has
been substantially enhanced. A multilateral currency swap arrangement among
the ASEAN Plus Three countries (Chiang Mai Initiative Multilateralization, or
CMIM) was established in March 2010, and a crisis prevention facility (the
CMIM Precautionary Line) has been introduced. An independent regional
Source: IMF staff calculations.1Trade intensity score is calculated as a country’s share in global trade as a proportion of its GDP share. Portfolio investment intensity score is calculated as a country’s share of the global
Trade integration score
Figure 1.7. Trade and Portfolio Integration, 2001–151
0
10
1
2
3
4
5
6
7
8
9
Port
folio
inte
grat
ion
scor
e
0 2 4 6 810
Indonesia
Philippines
Thailand
Vietnam
Malaysia
y = 0.3475x + 0.5509R2 = 0.09413
45-degree line
©International Monetary Fund. Not for Redistribution

Chapter 1 Overview 11
macroeconomic surveillance unit—the ASEAN+3 Macroeconomic Research
Office—has been in operation since 2011 and was converted to an internation-
al organization in 2016. The office seeks to strengthen cooperative relation-
ships with international financial institutions and inked a memorandum of
understanding with the IMF in 2017 to enhance cooperation to respond more
effectively to the needs of their common membership.
Given these preconditions and requirements, a gradual approach to regional
financial integration is likely the right way forward. Appropriately sequenced
liberalization and upgraded regulatory and policy frameworks to handle higher
cross-border interconnectivity could help contain systemic risks while ASEAN-5
countries reap the benefits of regional financial integration.
©International Monetary Fund. Not for Redistribution

This page intentionally left blank
©International Monetary Fund. Not for Redistribution

PART IPART I
From the Asian Financial Crisis to the Present
©International Monetary Fund. Not for Redistribution

This page intentionally left blank
©International Monetary Fund. Not for Redistribution

15
Evolution of Monetary Policy Frameworks
CHAPTER 2
INTRODUCTION
The experience of the economies of the Association of Southeast Asian Nations–5
(ASEAN-5) during the Asian financial crisis prompted central banks to rethink
monetary policy frameworks and exchange rate regimes. Before the crisis,
ASEAN-5 economies were characterized by tightly managed exchange rates and
relatively open capital accounts, providing limited scope for central banks to set
domestic interest rates. When the crisis hit in 1997–98, severe exchange rate
depreciation exposed significant vulnerabilities in the ASEAN-5, such as excessive
borrowing and currency mismatches by firms and banks. Major structural
reforms followed the crisis, including rethinking the monetary policy framework,
evaluating the appropriateness of the exchange rate regime, and revamping finan-
cial sector regulatory frameworks.
This chapter examines the evolution of the ASEAN-5 economies’ monetary
policy frameworks from the onset of the Asian financial crisis to the present.1 It
first assesses monetary policy frameworks in these economies using a core set of
principles of effective frameworks in countries with scope for independent mon-
etary policy. It then describes how the transition toward a more consistent
forward-looking monetary policy framework was supported by greater exchange
rate flexibility. The chapter concludes by highlighting the ASEAN-5 economies’
monetary policy frameworks, which have, on the whole, performed well since the
crisis, delivering both price and economic stability. The flexible inflation-targeting
frameworks put in place after the crisis, alongside the move to greater exchange
rate flexibility, have served the ASEAN-5 economies well and offer lessons for
other emerging market and developing economies.
EFFECTIVE MONETARY POLICY FRAMEWORKS AND THE ASEAN-5
A consensus has emerged on the set of principles that characterize effective policy
frameworks in countries with scope for independent monetary policy (IMF
2015). The monetary policy framework encompasses the institutional setup of
This chapter was prepared by Hoe Ee Khor, Jaime Guajardo, and Shanaka J. Peiris.1Chapter 3 focuses on reforms related to the financial sector.
©International Monetary Fund. Not for Redistribution

16 THE ASEAN WAY: SUSTAINING GROWTH AND STABILITY
the central bank2 as well as the specification of its goals, instruments, strategy,
operating targets and procedures, and communication. The monetary policy
strategy guides the setting of the central bank’s operating targets and its operating
procedures and specifies how its policy instruments should be adjusted to imple-
ment those targets. Central bank communication promotes transparency and
accountability, helping shape market expectations and support the public’s under-
standing of the policy framework and policy decisions.
Since the Asian financial crisis, ASEAN-5 monetary policy frameworks have
evolved to embody the key principles of effective frameworks. The central banks
gained operational independence to pursue their price-stability mandates. Several
legal amendments explicitly give the ASEAN-5 central banks operational indepen-
dence from fiscal dominance. In recognition of the importance of regulating the
monetary and banking environment free from political considerations, the Bangko
Sentral ng Pilipinas (BSP) and Bank Indonesia (BI) gained operational autonomy
in monetary policy formulation in 1993 and 1999, respectively. Central bank acts
were revised for Bank Negara Malaysia (BNM) in 2009 and the Bank of Thailand
(BOT) in 2008 to enhance and formalize the central banks’ operational indepen-
dence. Meanwhile, since its establishment in 1971 and particularly since the revi-
sion of the Monetary Authority of Singapore (MAS) Act in 1999, the MAS has
enjoyed de jure independence in setting policies to implement its goals and objec-
tives. With de jure operational autonomy, the primary objective of monetary policy
is price stability, although—as in other emerging market economies—many central
banks must also consider output, employment, and external conditions.3
Operational autonomy helped establish clear governance structures that
empowered independent policy decision-making processes. Although central
bank board members and governors are generally appointed by heads of state or
government, their legally mandated functions and duties clearly indicate that
direct operational administration, as well as final decisions on monetary policy,
fall within the powers of the central bank authorities (Table 2.1). To help the
central banks’ highest policymaking bodies evaluate the appropriate monetary
policy stance, separate high-level committees and advisory groups—focusing on
monetary policy assessment and implementation—were also put in place as an
integral part of the overall institutional setting.
The ASEAN-5 economies have adopted forward-looking monetary policy
frameworks aimed at achieving price stability. The frameworks recognize that a
single policy instrument cannot be expected to deliver on multiple objectives (for
example, growth, financial and external stability) and that monetary policy must
be complemented by other policy instruments in order to meet the other objec-
tives. With the aim of providing effective nominal anchors, Indonesia, the
Philippines, and Thailand adopted flexible inflation-targeting frameworks to
2The institutional setup includes the central bank’s statutory mandate, governance structure, and
decision-making processes.3External stability is also an explicit objective in Indonesia as observed in a few other emerging
market economies (see Ostry and others 2012).
©International Monetary Fund. Not for Redistribution

Chapter 2 Evolution of Monetary Policy Frameworks 17
replace their previous monetary targeting approaches. Thailand adopted inflation
targeting in May 2000, after the central bank had made an extensive appraisal of
the Thai economy and external developments at the conclusion of the
IMF-supported program.4 The Philippines began to modify its monetary aggre-
gate targeting approach in 1995 to put more emphasis on price stability and to
address the variable time lags in the effects of monetary policy on the real econo-
my. The BSP announced inflation targets in January 2000 and formally adopted
the inflation-targeting framework in January 2002. Indonesia abandoned its
crawling band exchange rate system in 1997 in the wake of the Asian financial
crisis, and the central bank moved toward a new nominal anchor to achieve mac-
roeconomic stability. The BI initially adopted monetary base targeting under the
IMF program, but it began announcing inflation targets in early 2000, until July
2005, when it adopted a flexible inflation-targeting framework.
4The BOT found that the relationship between money supply and output growth had become
less stable over time, particularly since the Asian financial crisis, and concluded that targeting the
money supply would be less effective than directly targeting inflation.
TABLE 2.1.
ASEAN-5 Central Banks’ Governance Structure
Indonesia Malaysia Philippines Singapore Thailand
Board MembersNumber of
Members
At least 6,
at most 9
At least 9,
at most 12
7 At least 5,
at most 14
12
Years of Term 5 Governor:
5; others: 3
Governor and
4 members: 6;
2 members: 3
3 Governor:
5; others: 3
Appointed by President Minister; others:
Yang di-Pertuan
Agong (elected
monarch)
President President King and
Cabinet of
Ministers
Chairman Governor Governor Governor Appointee
of the
president
Appointee of
the king
Decision-Making
and Voting
Process
Consensus Simple majority
vote in a quorum
Concurrence
of at least
4 members
Majority vote
in a quorum
Majority vote
in a quorum
Minimum
Number of
Statutory
Meetings
Once a week Once a month Once a week Once every
3 months
Once a month
GovernorYears of Term 5 5 6 Up to 5 5
Appointed by President Yang di-Pertuan
Agong
President President King
High-Level Committee or Meeting on Monetary Policy
Board’s
once-a-week
meeting
Monetary Policy
Committee
Advisory
Committee
Monetary and
Investment
Policy Meeting
Monetary
Policy Board
Sources: Central bank laws; and official websites.
Note: ASEAN-5 = Indonesia, Malaysia, Philippines, Singapore, Thailand.
©International Monetary Fund. Not for Redistribution

18 THE ASEAN WAY: SUSTAINING GROWTH AND STABILITY
Malaysia and Singapore followed different approaches, ultimately targeting
price stability as the primary objective. The BNM adopted a fixed exchange rate
regime in the aftermath of the Asian financial crisis, but in 2005 it moved to a
flexible exchange rate regime. The BNM’s monetary policy framework focuses on
price stability and the sustainability of economic growth, as well as considering
the impact of monetary policy on financial stability. Although the BNM does not
have an inflation target, it communicates its inflation forecast along with drivers
of and risks to the inflation outlook, which are factored into the decision on
monetary policy. Meanwhile, Singapore has developed a unique, implicit
exchange rate–based inflation-targeting regime centered on the small and open
nature of its economy (Box 2.1 and Khor and others 2007).
The ASEAN-5 central banks have set medium-term objectives and intermedi-
ate targets that serve as the foundation for their monetary policy actions.
Medium-term inflation targets5 in Indonesia, the Philippines, and Thailand are
debated and set by selected government agencies.6 Upon the recommendation of
the central banks, the Indonesian and Philippine governments announce their
three- and two-year-ahead headline inflation targets, respectively (Figure 2.1).
Thailand used quarterly average core inflation as the target in 2000–08, but shift-
ed to a one-year-ahead core inflation forecast in 2009–14. In 2015, Thailand
adopted a new inflation target using annual average headline inflation, with a
corresponding tolerance band.
Malaysia and Singapore also announce year-ahead inflation forecasts as part of
their macroeconomic outlook assessments. However, the BNM and the MAS
have developed different intermediate targets to assist them in achieving their
forward-looking policy objectives.7 Singapore uses the nominal effective exchange
rate (NEER) as an intermediate target, while the BNM uses the short-term inter-
est rate as its policy instrument. In general, the view is that the medium-term
objective needs to be both achievable and, over time, achieved, in order to be
credible (IMF 2015a). However, when intermediate targets did not fall within the
target range, ASEAN-5 central banks have explained to the public the reasons for
missing the target, the rationale for the monetary policy decisions undertaken,
and the policy approach going forward.
5The numerical medium-term inflation objective is distinct from the near-term inflation forecast.
The inflation objective is modified rarely, and changes to it are not based on short-term political
pressures or conjunctural circumstances, but rather as part of a systematic and transparent review of
the entire monetary policy framework (IMF 2015a).6The medium-term inflation objective is determined by the national government in Indonesia;
by the Development Budget Coordinating Committee composed of government economic agencies
in the Philippines; and by the BOT’s Monetary Policy Committee and minister of finance, for the
minister’s endorsement for cabinet approval.7The intermediate target refers to a variable correlated with the ultimate objective that monetary
policy can affect more directly and that the central bank treats as if it were the target for monetary
policy, or as a proxy for the ultimate policy objective (Laurens and others 2015). Intermediate tar-
gets are tools central banks use to help achieve policy objectives, but they are not policy objectives
in themselves (IMF 2015a).
©International Monetary Fund. Not for Redistribution

Chapter 2 Evolution of Monetary Policy Frameworks 19
Singapore’s monetary policy has been centered on the management of the exchange rate
since the early 1980s, with the primary objective of promoting medium-term price stability
as a sound basis for sustainable economic growth. This monetary policy regime choice is
shaped by the small and open nature of the economy. The Singapore dollar is managed
against a basket of currencies of Singapore’s major trading partners. The Monetary
Authority of Singapore operates a managed float regime for the Singapore dollar, and the
trade-weighted exchange rate is allowed to fluctuate within a policy band. The exchange
rate policy band is periodically reviewed to ensure that it remains consistent with the
underlying fundamentals of the economy; the general direction has been gradual appreci-
ation, which has been effective in keeping inflation rates below those of its major trading
partners (Figure 2.1.1). Within this framework, the level, slope, and width of the nominal
effective exchange rate (NEER) band can be adjusted to change the monetary policy
stance. The exchange rate band facilitates short-term nominal exchange rate flexibility,
while the slope and the width of the corridor anchor medium-term NEER expectations,
which in turn anchor inflation expectations. The exact location and parameters of the band
and the weights of the currencies in the NEER basket are not made public.
Midpoint of the policy band
NEER
Jun-2008 Jun-09 Jun-10 Jun-11 Jun-12 Jun-13 Jun-14 Jun-15 Jun-16 Jun-17
Upper bound
Lower bound
Sources: IMF, Information Notice System; and IMF staff estimates.Note: Midpoint, lower, and upper bounds of the policy band are IMF staff estimates. NEER = nominal effective exchange rate.
95
100
105
110
115
120
Figure 2.1.1. Nominal Effective Exchange Rate and Policy Band(January 1, 2010 = 100)
Box 2.1. Monetary Policy in Singapore
©International Monetary Fund. Not for Redistribution

20 THE ASEAN WAY: SUSTAINING GROWTH AND STABILITY
1. Indonesia
2. Philippines
3. Thailand
IT frameworkadoption
Commodityprice shock
Oil pricedecline
IT frameworkadoption
Commodityprice shock
Oil pricedecline
IT frameworkadoption
Commodityprice shock
Oil pricedecline
1,2
©International Monetary Fund. Not for Redistribution

Chapter 2 Evolution of Monetary Policy Frameworks 21
In ation forecast: lower limit (percent)In ation forecast: upper limit (percent)
BNM: overnight policy rate (percent)
In ation forecast: lower limit (percent)In ation forecast: upper limit (percent)
Headline in ation(percent)
Change in NEER(year over year, percent)
4. Malaysia
5. Singapore
Commodity price shock Oil pricedecline
Jan-
2000
Jan-
01
Jan-
02
Jan-
03
Jan-
04
Jan-
05
Jan-
06
Jan-
07
Jan-
08
Jan-
09
Jan-
10
Jan-
11
Jan-
12
Jan-
13
Jan-
14
Jan-
15
Jan-
16
Jul-
00
Jul-
01
Jul-
02
Jul-
03
Jul-
04
Jul-
05
Jul-
06
Jul-
07
Jul-
08
Jul-
09
Jul-
10
Jul-
11
Jul-
12
Jul-
13
Jul-
14
Jul-
15
Jul-
16
3,4
(Percent)
Jan-
2000
Jan-
01
Jan-
02
Jan-
03
Jan-
04
Jan-
05
Jan-
06
Jan-
07
Jan-
08
Jan-
09
Jan-
10
Jan-
11
Jan-
12
Jan-
13
Jan-
14
Jan-
15
Jan-
16
Jul-
00
Jul-
01
Jul-
02
Jul-
03
Jul-
04
Jul-
05
Jul-
06
Jul-
07
Jul-
08
Jul-
09
Jul-
10
Jul-
11
Jul-
12
Jul-
13
Jul-
14
Jul-
15
Jul-
16
Commodity price shock Oil pricedecline
2000200120022003200420052006200720082009201020112012201320142015
0.83 1.87 4.48 3.011.18 3.62 4.38 2.51
Indonesia Philippines Thailand Korea Australia New Zealand
3.01 0.25 2.97 3.00 2.663.47 0.03 3.06 2.77 1.125.96 0.63 2.93 2.34 2.29
17.12 7.71 2.37 2.35 2.67 3.046.60 6.27 1.70 1.80 3.54 3.375.78 2.78 1.22 2.53 2.33 2.38
11.06 9.28 2.04 4.67 4.35 3.962.77 3.32 0.10 2.76 1.82 2.126.96 4.11 1.17 2.96 2.85 2.303.78 4.75 2.82 4.00 3.30 4.433.65 3.17 1.82 2.19 1.76 0.888.08 2.93 1.66 1.31 2.45 1.308.36 4.18 0.64 1.27 2.49 0.913.35 1.41 0.89 0.71 1.51 0.33
–4
0
2
4
6
–2
8
–5
3
1
1
3
5
7
Figure 2.1(continued)
Sources: Central bank reports; and Haver Analytics.
targeting; NEER = nominal effective exchange rate.1
transport.2
3
4
©International Monetary Fund. Not for Redistribution

22 THE ASEAN WAY: SUSTAINING GROWTH AND STABILITY
The ASEAN-5 inflation-targeting central banks have developed forecasting
and policy analysis systems to further enhance forecasting performance and com-
municate their use to anchor expectations. In Indonesia, the central bank’s fore-
casting and policy analysis system involves several models, such as the Aggregate
Rational Inflation-Targeting Model for Bank Indonesia, which is a stripped-down
dynamic stochastic general equilibrium (DSGE)–type four-equation forecasting
policy analysis system. It is the central bank’s core forecasting model. This model
is complemented by several small-scale and medium-term macroeconomic struc-
tural models (Warjiyo 2014). The BSP’s workhorse inflation forecasting models
include the Multiple Equation Model, Single Equation Model, and quarterly
Medium-Term Macroeconometric Model (BSP 2014). The BSP also developed
a semistructural forecasting and policy analysis system model in 2012 that can
benefit from IMF Global Projection Model simulations for the external block.
The BOT uses the Bank of Thailand Macroeconometric Model, which consists
of 25 behavioral equations and 44 identities, and covers the real, monetary,
external, and public sectors. Other BOT forecasting models include a DSGE
model, vector autoregression models, and corporate and household models,
couched within a macroeconomic modeling framework similar to its macroeco-
nometric model. The MAS flagship model is the Monetary Model of Singapore
(MMS), which is a macroeconomic computable general equilibrium model
essentially derived from microeconomic optimization principles. It is used to
analyze policy effects dynamically at both the economy and industry levels. The
MMS is supported by the Satellite Model of Singapore, which is essential-
ly a DSGE model.
The ASEAN-5 central banks have refined their operational frameworks to
align market conditions with the announced policy stance and operate an interest
rate corridor system (Figure 2.2), except for Singapore (see Box 2.1). The policy
target rates are positioned in the middle of the corridor formed by the standing
deposit and lending facilities. In general, the standing facility rates have been
adjusted in tandem with the policy rate. By announcing changes to the policy
rates, central banks signal their monetary policy stances to guide market interest
rate movements that eventually act as benchmarks for lending and deposit rates.
An effectively implemented monetary operations framework that supports the
money markets allows banks to predictably place surplus liquidity with, and
obtain short-term funding from, each other or the central bank at rates related to
the policy rates (IMF 2015). For ASEAN-5 economies, central bank operations
have been able to align market rates with the announced interest rate corridor
over time. In the Philippines, short-term money market rates were for some years
much lower than the de facto policy rate corridor. To address this issue, in 2015,
the BSP adopted an interest rate corridor system and introduced a term deposit
auction facility to absorb liquidity and support price discovery in the money
market. In addition, it initiated in-house development of its systems for liquidity
forecasting and auction-based monetary operations as part of the implementation
of the interest rate corridor system (BSP 2015). As a result, the overnight interest
rate has gradually increased. Similarly, Indonesia’s overnight interbank rate was
©International Monetary Fund. Not for Redistribution

Chapter 2 Evolution of Monetary Policy Frameworks 23
BNM overnight policy rate
Floor: Policy rate –25 bps
Overnight interbank rate
Cap: Policy rate +25 bps
BOT policy target rateFloor: deposit facility rate(policy rate –0.5 ppt)Interbank rate
Cap: lending facility rate(policy rate +0.5 ppt)
BSP’s repurchase rate
BSP’s reverse repurchase rate
BSP’s SDA interest rate
Interbank call loan rate
3-month T-bill rate (PDEx)
Overnight interbank PhiRef rate
BI rate Floor: BIdepositsfacility rate
OvernightJakartainterbank rate Cap: BI lendingfacility rate
Sources: Haver Analytics; and CEIC Data Co., Ltd.Note: BI = Bank of Indonesia.
1. Indonesia: Policy and Interbank Rates(Percent)
3
8
4
5
6
7
3. Philippines: Policy, Interbank, andT-Bill Rates(Percent)
–1
0
1
2
3
4
5
6
7
Jan-
2010
Jan-
11
Jan-
12
Jan-
13
Jan-
14
Jan-
15
Jul-
10
Jul-
11
Jul-
12
Jul-
13
Jul-
14
Jul-
15
Jan-
16
Jan-
2010
Jan-
11
Jan-
12
Jan-
13
Jan-
14
Jan-
15
Jul-
10
Jul-
11
Jul-
12
Jul-
13
Jul-
14
Jul-
15
Jan-
16Ju
n-16
1.50
1.75
2.00
2.25
2.50
2.75
3.00
3.25
3.50
3.75
0.5
1.0
1.5
2.0
2.5
3.0
3.5
4.0
4.5
Jan-
2010
Jul-
10
Jan-
11
Jul-
11
Jan-
12
Jul-
12
Jan-
13
Jul-
13
Jan-
14
Jul-
14
Jan-
15
Jul-
15
Jan-
16
Sources: Haver Analytics; and CEIC Data Co., Ltd.Note: BNM = Bank Negara Malaysia; bps = basis points.
2. Malaysia: Policy and Interbank Rates(Percent)
4. Thailand: Policy and Interbank Rates(Percent)
Jan-
2010
Jun-
10N
ov-1
0Ap
r-11
Sep-
11Fe
b-12
Jul-
12D
ec-1
2M
ay-1
3O
ct-1
3M
ar-1
4Au
g-14
Jan-
15Ju
n-15
Nov
-15
Apr
-16
Sep-
16Fe
b-17
Sources: Bloomberg L.P.; Haver Analytics; and Philippine Dealing and Exchange Corp. (PDEX). Note: BSP = Bangko Sentral ng Pilipinas; PDEx = Philippine Dealing and Exchange Corp.; PhiRef = Philippine Inter-Bank Reference Rate; SDA = Special Deposit Account.
Sources: Haver Analytics; and CEIC Data Co., Ltd. Note: BOT = Bank of Thailand; ppt = percentage point.
Figure 2.2. Policy and Market Interest Rates
©International Monetary Fund. Not for Redistribution
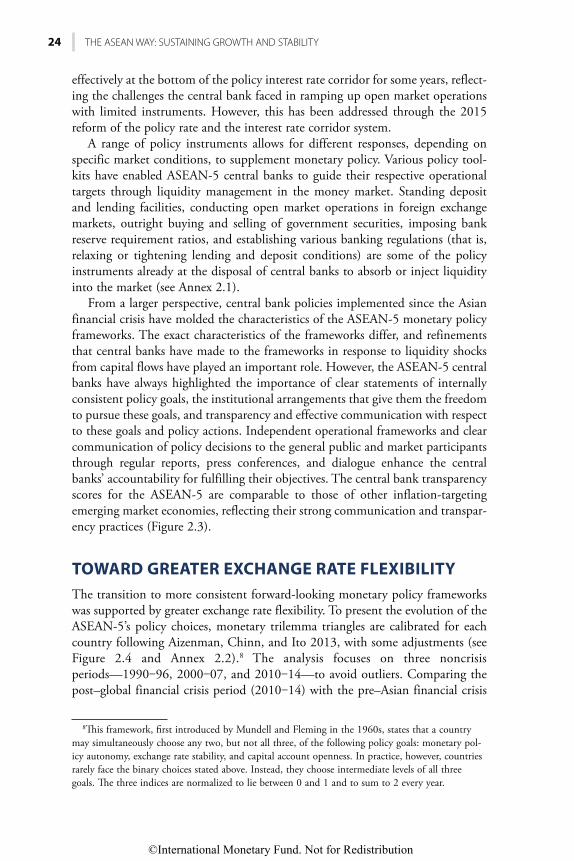
24 THE ASEAN WAY: SUSTAINING GROWTH AND STABILITY
effectively at the bottom of the policy interest rate corridor for some years, reflect-
ing the challenges the central bank faced in ramping up open market operations
with limited instruments. However, this has been addressed through the 2015
reform of the policy rate and the interest rate corridor system.
A range of policy instruments allows for different responses, depending on
specific market conditions, to supplement monetary policy. Various policy tool-
kits have enabled ASEAN-5 central banks to guide their respective operational
targets through liquidity management in the money market. Standing deposit
and lending facilities, conducting open market operations in foreign exchange
markets, outright buying and selling of government securities, imposing bank
reserve requirement ratios, and establishing various banking regulations (that is,
relaxing or tightening lending and deposit conditions) are some of the policy
instruments already at the disposal of central banks to absorb or inject liquidity
into the market (see Annex 2.1).
From a larger perspective, central bank policies implemented since the Asian
financial crisis have molded the characteristics of the ASEAN-5 monetary policy
frameworks. The exact characteristics of the frameworks differ, and refinements
that central banks have made to the frameworks in response to liquidity shocks
from capital flows have played an important role. However, the ASEAN-5 central
banks have always highlighted the importance of clear statements of internally
consistent policy goals, the institutional arrangements that give them the freedom
to pursue these goals, and transparency and effective communication with respect
to these goals and policy actions. Independent operational frameworks and clear
communication of policy decisions to the general public and market participants
through regular reports, press conferences, and dialogue enhance the central
banks’ accountability for fulfilling their objectives. The central bank transparency
scores for the ASEAN-5 are comparable to those of other inflation-targeting
emerging market economies, reflecting their strong communication and transpar-
ency practices (Figure 2.3).
TOWARD GREATER EXCHANGE RATE FLEXIBILITY
The transition to more consistent forward-looking monetary policy frameworks
was supported by greater exchange rate flexibility. To present the evolution of the
ASEAN-5’s policy choices, monetary trilemma triangles are calibrated for each
country following Aizenman, Chinn, and Ito 2013, with some adjustments (see
Figure 2.4 and Annex 2.2).8 The analysis focuses on three noncrisis
periods—1990‒96, 2000‒07, and 2010‒14—to avoid outliers. Comparing the
post–global financial crisis period (2010‒14) with the pre–Asian financial crisis
8This framework, first introduced by Mundell and Fleming in the 1960s, states that a country
may simultaneously choose any two, but not all three, of the following policy goals: monetary pol-
icy autonomy, exchange rate stability, and capital account openness. In practice, however, countries
rarely face the binary choices stated above. Instead, they choose intermediate levels of all three
goals. The three indices are normalized to lie between 0 and 1 and to sum to 2 every year.
©International Monetary Fund. Not for Redistribution

Chapter 2 Evolution of Monetary Policy Frameworks 25
period (1990‒96), all ASEAN-5 economies have moved toward greater monetary
policy autonomy, generally by forgoing exchange rate stability (Figure 2.4). The
move toward greater exchange rate flexibility took place alongside institutional
and operational reforms, as in other emerging market economies (IMF 2015b).
However, the transition from the pre–Asian financial crisis to the post–global
financial crisis regimes has been different across countries:
• Before the Asian financial crisis, Indonesia had a crawling peg exchange rate
system and an open capital account, which limited its ability to set interest
rates. After the crisis, Indonesia adopted a more flexible exchange rate
regime, which allowed for greater independence in setting its interest rate.
Since the global financial crisis, Indonesia has increased its exchange rate
flexibility and introduced capital flow management measures, providing
further autonomy for setting interest rates.
• Before the Asian financial crisis, Malaysia had a managed exchange rate and
an open capital account, which provided limited scope for setting domestic
interest rates. After the crisis, Malaysia fixed the exchange rate and managed
the capital account to be able to gain some monetary independence. Malaysia
IndonesiaMalaysia
PhilippinesSingapore
Thailand
ASEAN-5 IT-EMDEs
Non-IT EMDEs
Source: Dincer and Eichengreen 2014.Note: The de jure transparency index was developed by Dincer and Eichengreen (2014). It ranges from 0 to 15 and is the sum of scores on questions concerning political, economic, procedural, policy, and operational transparency. Median values of transparency scores were used for country groupings.
0
2
4
6
8
10
12
1998
2000 02 04 06 08 10 12 14
0
1
3
2
4
5
7
6
8
9
10
1998
2000 02 04 06 08 10 12 14
Figure 2.3. Degree of Central Bank TransparencyH
ighe
r ce
ntra
l ban
k tr
ansp
aren
cy
Hig
her
cent
ral b
ank
tran
spar
ency
2. International Comparison, Central Banks’ Transparency
1. Transparency of ASEAN-5 Central Banks
©International Monetary Fund. Not for Redistribution

26 THE ASEAN WAY: SUSTAINING GROWTH AND STABILITY
de-pegged its exchange rate in 2005, adopted a more flexible exchange rate
regime, and liberalized its capital account, which provided it with greater
autonomy for setting interest rates during and after the global financial crisis.
• Before the Asian financial crisis, the Philippines had a relatively closed cap-
ital account and a managed exchange rate regime, which allowed for a fair
degree of monetary policy independence. After the crisis, the Philippines
Figure 2.4. ASEAN-5: Trilemma Triangles
1. Indonesia: De Jure Capital Account Openness
2. Malaysia: De Jure Capital Account Openness
3. Philippines: De Jure Capital Account Openness
5. Thailand: De Jure Capital Account Openness
4. Singapore: De Jure Capital Account Openness
1990–96
1990–96
1990–96
1990–962000–07
2000–07
2000–07
2000–07
2010–14
2010–14
1990–962000–07
2010–14
2010–14
2010–14
Monetary policyautonomy
Capital accountopenness
Capital accountopenness
Capital accountopenness
Capital accountopenness
Exchange rate stability
Exchange rate stability
Exchange rate stability
Sources: Aizenman, Chinn, and Ito 2013; and IMF staff estimates.
Exchange rate stability
Exchange rate stability
Monetary policyautonomy
Monetary policyautonomy
Capital accountopenness
Monetary policyautonomy
Monetary policyautonomy
©International Monetary Fund. Not for Redistribution

Chapter 2 Evolution of Monetary Policy Frameworks 27
gradually liberalized its capital account restrictions and continued to man-
age its exchange rate to build up foreign exchange reserves, reducing its
independence in setting interest rates. In more recent years, the Philippines
has adopted a more flexible exchange rate regime, which has increased its
independence in setting interest rates.
• Singapore’s position in the monetary policy trilemma has remained relative-
ly unchanged. As a financial center, Singapore has a highly open capital
account. It also has a unique monetary policy regime centered on the man-
agement of the exchange rate. Thus, it has limited control over the setting
of interest rates, which are market determined.
• Before the Asian financial crisis, Thailand had a managed exchange rate
regime and an open capital account, which provided limited scope for setting
interest rates. After the crisis, Thailand adopted a more flexible exchange rate
regime and managed its capital account more tightly, which provided some
interest rate autonomy. In more recent years, Thailand has allowed even more
exchange rate flexibility and gained more interest rate autonomy.
The IMF’s Annual Report on Exchange Arrangements and Exchange Restrictions (AREAER) shows a similar transition of exchange rate frameworks in the
ASEAN-5 countries. Based on the AREAER classification, the ASEAN-5 econ-
omies have moved toward greater exchange rate flexibility, with all five classified
as de jure managed or free floaters since 2008 (Figure 2.5).9 However, this move
has been less pronounced in the de facto classification, with four economies
classified as managed floaters by 2015 and none classified as free floaters. This
is consistent with the experience of many advanced and emerging market econ-
omies that have successfully adopted inflation targeting, where the move toward
a floating exchange rate regime was gradual and exchange rate considerations
continued to play a role in the conduct of monetary policy, especially during
crisis periods (IMF 2015). In fact, the number of inflation-targeting emerging
market and developing economies classified as de facto managed floaters has
risen through time, although fewer countries have been classified in the inter-
mediate category.
Empirical analysis also confirms that ASEAN-5 currencies became more flex-
ible after the Asian financial crisis—even more so after the global financial crisis.10
9Singapore’s monetary policy framework is an exception and classified by the AREAER (2016) as
an exchange rate anchor, although the MAS is ultimately targeting price stability (inflation) as its
main monetary policy objective.10Consistent with this conclusion, Klyuev and Dao (2016) find little evidence that the ASEAN-5
currencies or a subset thereof are bound together in a tight “club” or peg to a reserve currency or
basket of currencies. They provide formal unit root tests in the exchange rates of the ASEAN-5
currencies against the US dollar, the yen, and the renminbi, as well as against each other, for
different periods. Results confirm the narrative of quasi dollar pegs before the Asian financial crisis.
After the global financial crisis, the ASEAN-5 currencies remained nonstationary against the US
dollar, the yen, and the renminbi, indicating the absence of a tight relationship with any of these
major currencies.
©International Monetary Fund. Not for Redistribution

28 THE ASEAN WAY: SUSTAINING GROWTH AND STABILITY
Table 2.2 shows the coefficients of variation of the ASEAN-5 exchange rates
against the US dollar at various horizons (10, 50, and 250 working days) between
1991 and 2015. Except for Malaysia during 1998–2005, the volatility of the
ASEAN-5’s exchange rates against the US dollar has risen since the Asian financial
crisis for all time horizons, indicating that the ASEAN-5 central banks have let
their exchange rates fluctuate more freely. The volatility of the ASEAN-5 curren-
cies against the US dollar also increases with the length of the time horizon,
suggesting that central banks try to dampen short-term volatility, but allow their
exchange rates to move substantially over longer periods. Still, the ASEAN-5
exchange rates exhibit lower volatility at every horizon than other free-floating
currencies, such as the Japanese yen, suggesting that the extensive use of foreign
Annual Report on Exchange Arrangements and Exchange Restrictions
3. Other IT Emerging Market Economies 4. Other IT Emerging Market Economies
De Jure Exchange Rate Regime De Facto Exchange Rate Regime
1. ASEAN-5 2. ASEAN-5
©International Monetary Fund. Not for Redistribution

C
ha
pte
r 2
Evolu
tion
of M
on
etary Po
licy Frame
wo
rks 2
9
TABLE 2.2.
Exchange Rate Volatility—Coefficient of Variation
10-day 50-day 250-day
Pre-AFC Pre-GFC GFC Post-GFC Pre-AFC Pre-GFC GFC Post-GFC Pre-AFC Pre-GFC GFC Post-GFC
ASEAN-5
Indonesia 0.10 0.83 1.33 0.50 0.31 2.20 4.17 1.27 1.14 5.89 5.78 4.04
Malaysia 0.23 0.09 0.62 0.54 0.61 0.23 1.77 1.25 1.76 0.78 3.79 2.89
Philippines 0.24 0.40 0.75 0.39 0.78 1.04 1.87 0.88 3.09 2.99 5.60 1.91
Singapore 0.24 0.30 0.73 0.39 0.60 0.74 1.90 0.90 1.69 1.73 3.28 2.23
Thailand 0.18 0.47 0.43 0.33 0.40 1.18 1.01 0.87 0.79 3.17 4.34 2.15
Other Asian Free Floaters
Australia 0.51 0.78 2.45 0.85 1.14 1.76 5.91 1.97 2.55 3.90 11.69 5.43
New Zealand 0.42 0.85 2.20 0.92 0.95 1.96 5.09 2.08 2.44 4.59 10.76 5.07
Japan 0.71 0.70 1.28 0.67 1.73 1.60 2.75 1.51 4.55 3.74 4.63 4.08
Source: IMF staff estimates.
Note: Time periods: Pre-AFC (1991 to June 1997); Pre-GFC (1999 to July 2008); GFC (September 2008 to February 2009); Post-GFC (March 2009 to latest data). AFC = Asian financial crisis; GFC = global financial crisis.
©International Monetary Fund. Not for Redistribution

30 THE ASEAN WAY: SUSTAINING GROWTH AND STABILITY
exchange intervention in the ASEAN-5 economies had an impact not only on
short-term but also on longer-term exchange rate volatility.
The lower de facto exchange rate flexibility in the ASEAN -5 economies com-
pared with advanced economies and some other emerging market economies does
warrant closer examination to identify and understand the role of the exchange
rate in the evolving monetary policy frameworks. In response to the global finan-
cial crisis, the ASEAN-5 central banks were compelled to adapt their policy
frameworks and toolkits to strengthen policy autonomy and dampen risks. Part
of the response included foreign exchange intervention and the active use of
reserve buffers during capital inflow and outflow episodes to avoid excessive
exchange rate volatility. Macroprudential and capital flow management measures
also supplemented monetary policy to address market pressures and the buildup
of systemic risks. Part II of this book delves into the spillovers from global finan-
cial factors and the global financial crisis as well as the policy responses
in the ASEAN-5.
PERFORMANCE
The ASEAN-5 monetary policy frameworks have, on the whole, performed well
since the Asian financial crisis, delivering strong inflation performance, similar to
that of other inflation-targeting emerging market and developing economies.
Most of these economies achieved lower inflation amid marginal declines in
growth between 1991‒2000 and 2001‒14. However, countries that adopted
inflation targeting have reduced inflation and volatility more than those that
didn’t (IMF 2015a, 2016a). The ASEAN-5 economies have also reduced output
and inflation volatility, reaching levels achieved by inflation-targeting economies
after adopting such regimes (Figure 2.6). Looking more closely, the ASEAN-5
inflation targeters (Indonesia, Philippines, Thailand) have performed even better,
with higher GDP growth and lower inflation as well as lower volatility in GDP
growth and inflation.11 This outcome highlights the benefits of the flexible
inflation-targeting frameworks put in place after the Asian financial crisis, along-
side the move to greater exchange rate flexibility, for ASEAN-5 economies and
provides lessons for other emerging market and developing economies.
Flexible inflation targeting has also generally achieved its objectives while
accommodating global shocks. The run-up in commodity prices during 2007–08
was the first significant common global price shock affecting the ASEAN-5 econ-
omies since the Asian financial crisis. Although evidence shows that, in general,
countries with inflation-targeting frameworks managed shocks better than their
nontargeting counterparts (Habermeier and others 2009), in some ASEAN-5
economies (Indonesia, Malaysia, Philippines), on average, headline inflation
11A country’s economic performance may not necessarily reflect the adoption of a specific
monetary policy framework. Rather, some country-specific, one-off shocks may also have influenced
growth and inflation performance in the period under consideration.
©International Monetary Fund. Not for Redistribution
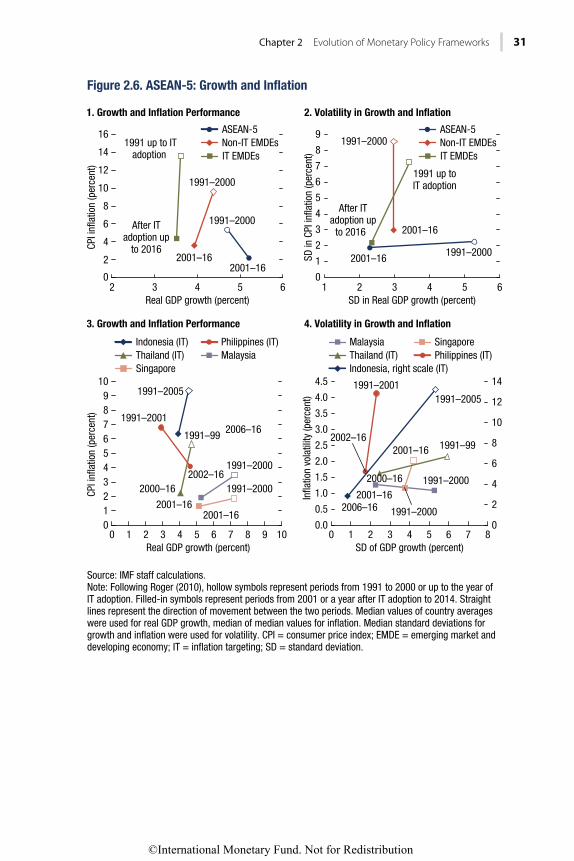
Chapter 2 Evolution of Monetary Policy Frameworks 31
ASEAN-5Non-IT EMDEsIT EMDEs
ASEAN-5Non-IT EMDEsIT EMDEs
Indonesia (IT) Philippines (IT)Thailand (IT) MalaysiaSingapore Indonesia, right scale (IT)
Philippines (IT)Thailand (IT) Malaysia Singapore
Source: IMF staff calculations.Note: Following Roger (2010), hollow symbols represent periods from 1991 to 2000 or up to the year of IT adoption. Filled-in symbols represent periods from 2001 or a year after IT adoption to 2014. Straight lines represent the direction of movement between the two periods. Median values of country averages
0
2
4
6
14
10
8
12
16
0
1
2
3
4
5
6
8
7
9
2 3 4Real GDP growth (percent)
Real GDP growth (percent)
SD in Real GDP growth (percent)
SD of GDP growth (percent)
5 6 2 31 4 5 6
0 1 2 3 4 5 6 7 8 9 10 320 1 4 5 6 7 80
1
2
3
4
5
6
9
8
7
10
0.0
0.5
1.0
1.5
2.0
2.5
3.0
4.0
3.5
4.5 14
0
2
4
6
8
10
12
1991–2000
1991–2001
After ITadoption up
to 2016
1991 up to ITadoption
2001–16 2001–16
1991–2000After IT
adoption upto 2016
1991–2000
1991 up toIT adoption
1991–2000
2001–16
2001–16
1991–2005
2006–16
1991–2000
2001–16
1991–99
2000–16
2002–16
1991–2000
2001–16
1991–2005
2006–16
1991–2001
2002–161991–99
2000–16
1991–2000
2001–16
2001–16
1991–2000
©International Monetary Fund. Not for Redistribution

32 THE ASEAN WAY: SUSTAINING GROWTH AND STABILITY
increased more than in other inflation-targeting emerging market and developing
economies in 2007–08 (Figure 2.7). However, the increase in headline inflation
did not become anchored at the higher level and fell back within the target range
thereafter. Following the global financial crisis, inflation pressure remained sub-
dued across the globe, and in most emerging markets, inflation declined during
2015–16, mainly because of lower prices for oil and other commodities (IMF
2016b). ASEAN-5 central banks took a variety of monetary policy actions during
this period, depending on their assessments of the first- and second-round effects
of the lower commodity prices. Inflation in some countries (Indonesia, Malaysia,
Philippines) picked up in 2016 (reflecting partly the removal of subsidies on
energy prices in Indonesia and Malaysia), but in Singapore and Thailand, it has
remained low. Chapter 7 elaborates on the challenges of low inflation following
the global financial crisis and the implications for monetary policy frameworks in
the years ahead.
4
6
14
16
3
6
9
15
Indo
nesi
a
Peru
Kore
a
Pola
ndN
ew Z
eala
ndB
razi
l
Sing
apor
e
©International Monetary Fund. Not for Redistribution

Chapter 2 Evolution of Monetary Policy Frameworks 33
CONCLUSION
In the past two decades, monetary policy frameworks in the ASEAN-5 economies
have evolved substantially. Before the Asian financial crisis, these economies had
tightly pegged exchange rates, which became a source of vulnerability along with
excessive borrowing and currency mismatches by firms and banks. As a result,
exchange rates came under severe pressure and depreciated sharply when the
regional currencies came under speculative attack and investors panicked, leading
to massive capital outflows. After the Asian financial crisis, the ASEAN-5 econo-
mies adjusted their policy frameworks to allow for more exchange rate flexibility
and have gained more monetary policy autonomy in the context of more open
capital accounts. The ASEAN-5 countries also embarked on substantial reforms
to strengthen financial regulatory frameworks and built up their foreign reserves
as insurance against external volatility.
On the whole, the ASEAN-5 economies’ monetary policy frameworks have
performed well, delivering both price and output stability during a period of
significant domestic and regional turbulence and transformation. Flexible
inflation-targeting frameworks, including a unique exchange rate–based targeting
approach in Singapore, have served the ASEAN-5 economies well in response to
external shocks and could provide lessons to other emerging market and develop-
ing economies. Not surprisingly, success—that is, positive outcomes—in most
cases entailed significant changes to operating frameworks and refinement of
policy objectives in response to challenges in the external environment. The
ASEAN-5 economies’ forward-looking monetary policy frameworks, active and
independent liquidity management operations to align market conditions with
the announced policy stance, and improved central bank transparency were
important ingredients of their success.
©International Monetary Fund. Not for Redistribution

3
4
THE A
SEAN
WA
Y: SU
STAIN
ING
GR
OW
TH A
ND
STAB
ILITY
AN
NE
X 2
.1. A
SE
AN
-5: M
ON
ETA
RY
PO
LIC
Y F
RA
ME
WO
RK
SANNEX 2.1
ASEAN-5: Monetary Policy Frameworks
Indonesia Malaysia Philippines Singapore Thailand
Mandate, Objective, and Strategy
1. Central Bank
Mandate
Achieve and maintain a
stable value for the
rupiah
Promote price stability and
the sustainability of eco-
nomic growth, as well as
considering the impact
of monetary policy on
financial stability
Promote and maintain price stability;
provide proactive leadership in
bringing about a strong financial
system conducive to sustainable
growth of the economy
Maintain price stability, foster a
sound and reputable financial
center and promote financial
stability, ensure prudent and
effective management of for-
eign reserves, and grow
Singapore as an internationally
competitive financial center
Maintain monetary sta-
bility and stability of
the financial and pay-
ment systems
2. Primary Monetary
Policy Objective
Stable prices of goods and
services, stable
exchange rate
Price stability Price stability Price stability Price stability
3. Stated Monetary
Policy Framework
Inflation targeting (as
of 2005)
Other Inflation targeting (as of 2002) Implicit inflation targeting Inflation targeting (as
of 2000)
4. Medium-Term
Inflation Target1
Government-approved
inflation target
2013–15: 4.0% �1 ppt
None Government-approved inflation
target
2015–18: 3.0% �1 ppt
Comfort level of about 2% Government-approved
inflation target
2015: 2.5% �1.5 ppt
5. Intermediate
Monetary Policy
Target2
BI inflation forecast
• 2015: below midpoint
of 4%
None BSP inflation forecast
• 2015: below the range of 3.0%
�1.0 ppt
• 2016: low end of 3.0% �1.0 ppt
• 2017: midpoint of 3.0% �1.0 ppt
Explicitly stated:
NEER, with undisclosed loca-
tion and parameters of the
band and weights of curren-
cies in NEER basket
BOT inflation forecast
• 2015: −0.9%
• 2016: 1.2%
Independence
6. De Jure Operational
Independence
Yes, with exceptional cases
for lending to systemi-
cally important banks
Yes Yes Yes Yes
7. Setting of De Jure
Operational Targets
(e.g., inflation or
intermediate targets)
With government interven-
tion on inflation target
Yes—BNM sets its own
targets
Needs intergovernmental commit-
tee approval for inflation target
Yes—MAS sets its own inflation
targets
Needs finance minister
and cabinet approval
for inflation target
(continued)
.
©International Monetary Fund. Not for Redistribution

C
ha
pte
r 2
Evolu
tion
of M
on
etary Po
licy Frame
wo
rks 3
5
(continued)
ANNEX 2.1
ASEAN-5: Monetary Policy Frameworks
Indonesia Malaysia Philippines Singapore Thailand
Policy Instruments
8. Central Banks’
Policy Rate or Stance
BI policy rate (7-day
reverse repo rate),
deposit and lending
rates
BNM overnight policy rate BSP overnight reverse repo or bor-
rowing rate, overnight repo or
lending rate, and Special
Deposit Account rate
MAS indicates level, slope, and
width of NEER band every 6
months
BOT 1-day bilateral
repo rate
9. Reserve Requirement Yes Yes Yes Yes Yes
Statutory Reserve
Requirement Ratio
(RRR)
Primary RRR (7%) �
secondary RRR on liquid
assets (2.5%)
3.5%, commercial banks 20%, universal and commercial
banks
3%, all banks 1%, commercial banks
10. Open Market
Operations
• Issuance of BI certificates
• Repo and reverse repo
transactions on govern-
ment securities
• Outright sale and purchase
of government securities
• Foreign exchange buying
and selling against the
rupiah
• Uncollateralized direct
borrowing
• Repo and reverse repo of
government securities
• Issuance of BNM notes
• Outright sale and pur-
chase of government
securities
• Foreign exchange swaps
• Repo and reverse repo transac-
tions on government securities
• Outright sale and purchase of
government securities
• Foreign exchange swaps
• Issuance of short-term MAS
bills
• Repo and reverse repo trans-
actions on Singapore govern-
ment securities
• Foreign exchange swaps
• Issuance of BOT bills
• Bilateral repo transac-
tions on purchase and
sale of securities
• Outright sale and pur-
chase of primarily BOT
and government bonds
• Foreign exchange
swaps
11. Standing Facilities Deposit and lending
facilities
Deposit and lending
facilities
• Fixed-term deposit (Special
Deposit Accounts) facility
• Lending (rediscounted rates)
facility
• Overnight deposit and lending
facilities
• Overnight renminbi foreign
currency lending facility
Deposit and lending
facilities
Transparency and Communications
Explanation of
12. Monetary Policy
Objective
Yes Yes Yes Yes Yes
13. Monetary Policy
Framework
Yes Yes Yes Yes Yes
14. Intermediate Target Yes, inflation target Yes, short-term interest
rate movements
Yes, inflation target Yes, direction of NEER policy
band
Yes, inflation target
15. Decision-Making
Process
Yes Yes Yes Yes Yes
(continued)
©International Monetary Fund. Not for Redistribution

3
6
THE A
SEAN
WA
Y: SU
STAIN
ING
GR
OW
TH A
ND
STAB
ILITY
ANNEX 2.1
ASEAN-5: Monetary Policy Frameworks
Indonesia Malaysia Philippines Singapore Thailand
16. Rationale or Basis for
Monetary Policy
Decisions or Stance
Yes Yes Yes Yes Yes
Timing of Publication
17. Inflation Report Monthly Not available Quarterly Semiannual Quarterly
18. Public Release of
Monetary Policy
Stance
Same day Same day Same day Same day Same day
19. Minutes or Highlights
of Monetary Policy
Meetings
Each month Not available One month after meeting date Not available Two weeks after meet-
ing date
Accountability
20. Report on Monetary
Policy Operation
Yes, quarterly report to
Parliament and the
public
Yes, regular reporting to
the minister of finance
on policies related to
principal objectives
Yes, annual report to the president
and Congress and to the public
Yes, semiannual monetary policy
statement and report on mac-
roeconomic developments to
the public
Yes, semestral report to
the cabinet
21. Public Document or
Explanation if Target
is Missed
Yes, report to Parliament
and the public
Yes, open letter to the president Yes, open letter to the
minister of finance
Sources: IMF, ASEAN-5 desk survey; and central banks’ websites.
Note: BI � Bank Indonesia; BNM � Bank Negara Malaysia; BOT � Bank of Thailand; BSP � Bangko Sentral ng Pilipinas; MAS � Monetary Authority of Singapore; NEER � nominal effective exchange rate; ppt �
percentage point. 1The numerical medium-term inflation objective is distinct from the near-term inflation forecast. The inflation objective is rarely modified, and not as a result of short-term political pressure or critical circumstances,
but rather as part of a systematic and transparent review of the entire monetary policy framework (IMF 2015).2The intermediate target refers to a variable correlated with the ultimate objective that monetary policy can affect more directly and that the central bank treats as if it were the target for monetary policy, or as a
proxy for the ultimate policy objective. Intermediate targets are tools to assist in achieving the policy objectives and not policy objectives in themselves (IMF 2015).
(continued)
©International Monetary Fund. Not for Redistribution

Chapter 2 Evolution of Monetary Policy Frameworks 37
ANNEX 2.2. ASEAN-5 MONETARY POLICY REGIMES: A VIEW THROUGH THE IMPOSSIBLE TRINITY
The impossible trinity, or trilemma, is a simple framework that can illustrate the
evolution of monetary policy regimes in the ASEAN-5 economies. This framework
states that a country may simultaneously choose any two, but not all three, of the
following policy goals: monetary policy autonomy, exchange rate stability, and cap-
ital account openness. In practice, however, countries rarely face the binary choices
stated above. Instead, they choose intermediate levels of capital account openness
and exchange rate stability to retain some monetary policy autonomy. A key mes-
sage of the impossible trinity is that policymakers face a trade-off: greater achieve-
ment of one policy goal requires less achievement of either or both of the other two.
A major challenge of the impossible trinity framework is gauging the achieve-
ment of each policy goal. Previous studies have measured these variables for a
large sample of countries, with different levels of complexity in their specifica-
tions. For example, Aizenman, Chinn, and Ito (2013) use a simple specification
to construct trilemma indices for 184 countries between 1970 and 2010.
Monetary policy autonomy was measured as the reciprocal of the annual correla-
tion of the monthly market interest rates of the home country and the base
country (the United States in most cases). Exchange rate stability was defined as
the inverse of the annual standard deviations of the monthly bilateral exchange
rate between the home and the base country. Capital account openness was mea-
sured by the de jure index developed by Chinn and Ito (2006). Each index was
normalized to lie between zero and one, in which one is full achievement.
Although intuitive and publicly available, the Aizenman, Chinn, and Ito 2013
indices suffer from several shortcomings: (1) exchange rate stability and monetary
policy autonomy are measured in relation to only one other country and thus
may be biased if the local currency is tied to a currency basket; (2) monetary
policy autonomy is subject to spurious correlation in the presence of common
shocks, in which case home and base country interest rates may move in the same
direction even though monetary policy is fully autonomous; (3) the framework
may not capture non–interest rate monetary policy moves such as changes in
banks’ reserve requirements; and (4) capital account openness measures the exis-
tence of de jure capital controls, but not their intensity or their de facto impact.
Ito and Kawai (2012) built a more robust set of trilemma indices, addressing
some of the issues associated with the Aizenman, Chinn, and Ito 2013 indices;
however, the Ito and Kawai indices are not publicly available. Thus, Aizenman,
Chin, and Ito 2013 indices are used here to assess the evolution of monetary
policy regimes in the ASEAN-5 economies since 1990. This annex also explores
how the picture changes if a de facto capital account openness measure is used.
Impossible Trinity Indices—Aizenman, Chinn, and Ito 2013
Annex Figure 2.2.1 presents Aizenman, Chinn, and Ito’s (2013) impossible trinity
indices for the ASEAN-5 economies between 1990 and 2014. Several messages emerge:
• Exchange rate stability in Indonesia and Thailand was high before the Asian
financial crisis, fell substantially during 1997–99, and has returned to
©International Monetary Fund. Not for Redistribution

38 THE ASEAN WAY: SUSTAINING GROWTH AND STABILITY
ER stabilityMP autonomyKA openness
ER stabilityMP autonomyKA openness
ER stabilityMP autonomy KA openness
ER stabilityMP autonomyKA openness
Indonesia
Malaysia
Philippines
Singapore
ThailandER stabilityMP autonomyKA openness
1. Indonesia
0.0
0.2
0.4
0.6
0.8
1.0
1990 92 94 96 98
2000 02 04 06 08 10 12 14
2. Malaysia
0.0
0.2
0.4
0.6
0.8
1.0
1990 92 94 96 98
2000 02 04 06 08 10 12 14
3. Philippines
0.0
0.2
0.4
0.6
0.8
1.0
1990 92 94 96 98
2000 02 04 06 08 10 12 14
4. Singapore
0.0
0.2
0.4
0.6
0.8
1.0
1990 92 94 96 98
2000 02 04 06 08 10 12 14
5. Thailand
0.0
0.2
0.4
0.6
0.8
1.0
1990 92 94 96 98
2000 02 04 06 08 10 12 14
6. ASEAN-5: Sum of Trilemma Indices
0.5
1.0
1.5
2.0
2.5
1990 92 94 96 98
2000 02 04 06 08 10 12 14
Sources: Aizenman, Chinn, and Ito 2012; and IMF staff calculations.Note: KA openness is measured as the sum of foreign assets (excluding foreign reserves) and foreign liabilities divided by GDP. These series for 1990–2010 are from the Wealth of Nations database of Lane and Milesi-Ferretti (2007), complemented with net international investment position data for 2012–14. This ratio is divided by that of the 70th percentile to normalize it between 0 and 1. A country is considered to have a fully open capital account (a value of 1) if the ratio is equal to or larger than the 70th percentile. ER = exchange rate; KA = capital account; MP = monetary policy.
Annex Figure 2.2.1. ASEAN-5: Impossible Trinity Indices
©International Monetary Fund. Not for Redistribution

Chapter 2 Evolution of Monetary Policy Frameworks 39
middle levels since the early 2000s. Exchange rate stability in the Philippines
and Singapore was stable during the whole period. In Malaysia it was at the
middle level before the Asian financial crisis, fell during 1997–98, and rose
sharply during 1999–2005 as the ringgit was pegged to the US dollar. It has
fallen to middle levels since 2006. All five countries had similar exchange
rate stability levels in the wake of the global financial crisis.
• Monetary policy autonomy in Malaysia and Singapore was at the middle
level during the whole period; in Indonesia it was at the middle level during
1990–2012, but it was high during 2013–14 following the taper tantrum
episode. Monetary policy autonomy in the Philippines was more volatile:
high in the early 1990s, mid to low during 1994–2008, high during
2010–12, and low during 2013–14. In Thailand it was at the middle level
during 1990–2002, low during 2003–06, and high during 2010–14.
• The Chinn and Ito 2006 de jure capital account openness index suggests
that the capital accounts of Indonesia and Malaysia have become less open
over time. The index also suggests that the Philippines and Thailand had
relatively closed capital accounts during the whole period, especially since
2010. Singapore had an open capital account during the whole sample period.
One issue with these trilemma indices is that their sum is generally less than
two.12 Singapore, Indonesia (1990–96), and Malaysia (1999–2005) are the only
cases in which the indices sum close to two. For all other countries and periods,
the sum of the indices is well below two, suggesting that countries did not make
full use of their policy space. However, this outcome may reflect mismeasure-
ment, especially the de jure capital account openness index, which considers only
the existence of capital controls, but not their intensity nor their de facto impact.
The next section explores how this assessment changes when a de facto capital
account openness measure is used.
Adding a De Facto Measure of Capital Account Openness
De facto capital account openness is measured as the sum of foreign assets
(excluding foreign reserves) and foreign liabilities divided by GDP. These series in
1990–2010 are from the Wealth of Nations database of Lane and Milesi-Ferretti
(2007), complemented with net international investment position data for
2012–14. This ratio is divided by that of the 70th percentile to normalize it
between zero and one. A country is considered to have a fully open capital
account (a value of one) if the ratio is equal to or larger than the 70th percentile.
Consistent with the de jure index, the de facto index suggests that Singapore had
a fully open capital account during the whole period (Figure 2.2.1). For Malaysia,
however, the de facto index suggests a more open capital account than the de jure
index. For Indonesia, on the other hand, the de facto index suggests a more closed
12Full achievement of one policy goal means an index equal to one. If a country fully achieves
two goals, it must give up the third completely, with the sum of the indices equal to two. If the
indices are linear, intermediate achievement means index values between zero and one, with the
sum of the three indices equal to two.
©International Monetary Fund. Not for Redistribution

40 THE ASEAN WAY: SUSTAINING GROWTH AND STABILITY
capital account than the de jure index. The Philippines and Thailand had low
capital account openness during 1990–2005 under both measures, but the de
facto measure suggests that Thailand achieved higher capital account openness
following the global financial crisis, while it remained low in the Philippines
during this period.
Using the de facto capital account openness index instead of the de jure index
yields a sum of trilemma indices close to two for Singapore and Malaysia, but
below two for Indonesia, the Philippines, and Thailand (Figure 2.2.2). This result
suggests that the mismeasurement of capital account openness does not explain
the low value of this sum for the latter three countries; rather, it reflects problems
with the measurement of exchange rate stability and monetary policy autonomy.
Improving these measures is beyond the scope of this annex, but to illustrate the
point, the exchange rate stability and monetary policy autonomy indices are
renormalized proportionally so that the trilemma indices sum to two in each year
for each country, with no index larger than one. This is done while keeping the
de facto measure of capital account openness.
The normalized trilemma indices, with de facto capital account openness,
indicate that the ASEAN-5 economies have moved toward greater monetary
policy autonomy since 2010 (Annex Figure 2.2.3).
Indonesia Malaysia Philippines Singapore Thailand
Sources: Aizenman, Chinn, and Ito 2012; and IMF staff calculations.
1. ASEAN-5: De Facto Financial Integration Index
2. ASEAN-5: Sum of Trilemma Indices
0.0
0.1
0.2
0.3
0.4
0.5
0.6
0.7
0.8
0.9
1.0
0.0
0.5
1.0
1.5
2.0
2.5
3.0
1990 92 94 96 98
2000 02 04 06 08 10 12 14
1990 92 94 96 98
2000 02 04 06 08 10 12 14
©International Monetary Fund. Not for Redistribution

Chapter 2 Evolution of Monetary Policy Frameworks 41
ER stabilityMP autonomyKA openness
ER stabilityMP autonomyKA openness
ER stabilityMP autonomyKA openness
ER stabilityMP autonomyKA openness
IndonesiaMalaysia
PhilippinesSingapore
Thailand
ER stabilityMP autonomyKA openness
Annex Figure 2.2.3. ASEAN-5: Normalized Impossible Trinity Indices with De Facto Financial Openness
1. Indonesia
0.0
0.2
0.4
0.6
0.8
1.0
1990 92 94 96 98
2000 02 04 06 08 10 12 14
2. Malaysia
0.0
0.2
0.4
0.6
0.8
1.0
1990 92 94 96 98
2000 02 04 06 08 10 12 14
3. Philippines
0.0
0.2
0.4
0.6
0.8
1.0
1990 92 94 96 98
2000 02 04 06 08 10 12 14
4. Singapore
0.0
0.2
0.4
0.6
0.8
1.0
1990 92 94 96 98
2000 02 04 06 08 10 12 14
5. Thailand
0.0
0.2
0.4
0.6
0.8
1.0
1990 92 94 96 98
2000 02 04 06 08 10 12 14
6. ASEAN-5: Sum of Trilemma Indices
0.5
1.0
1.5
2.0
2.5
1990 92 94 96 98
2000 02 04 06 08 10 12 14
Source: Aizenman, Chinn, and Ito 2012.Note: ER stability and MP autonomy have been renormalized proportionally so that all three indices sum to two each year. ER = exchange rate; KA = capital account; MP = monetary policy.
©International Monetary Fund. Not for Redistribution

42 THE ASEAN WAY: SUSTAINING GROWTH AND STABILITY
Evolution of Monetary Policy Regimes—Impossible Trinity Triangles
Having trilemma indices that sum to two in each year allows us to analyze the
evolution of monetary policy regimes in the ASEAN-5 countries using impossible
trinity triangles. The analysis focuses on three periods (to exclude crisis years):
1990–96, 2000–07, and 2010–14. Comparing the post–global financial crisis
period (2010–14) with the pre–Asian financial crisis period (1990–96), all
ASEAN-5 economies have moved toward greater monetary policy autonomy,
generally by forgoing exchange rate stability, and in some cases by reducing capi-
tal account openness. However, the transition from the pre–Asian financial crisis
to the post–global financial crisis regime has been different across countries (as
in Figure 2.1):
• Indonesia raised its monetary policy autonomy after the Asian financial
crisis by forgoing exchange rate stability and some capital account openness.
Its autonomy remained high after the global financial crisis, but its exchange
rate stability rose at the expense of lower capital account openness.
• Malaysia reduced its monetary policy autonomy and capital account open-
ness after the Asian financial crisis to achieve greater exchange rate stability,
but raised its monetary policy autonomy and capital account openness sig-
nificantly after the global financial crisis as the ringgit was allowed to float.
• The Philippines reduced its monetary policy autonomy following the Asian
financial crisis to achieve greater exchange rate stability, but its autonomy
rose following the global financial crisis at the cost of lower capital account
openness and somewhat lower exchange rate stability.
• Singapore maintained middle levels of exchange rate stability and monetary
policy autonomy, and a fully open capital account, during all three periods.
• Thailand marginally raised its monetary policy autonomy and capital
account openness following the Asian financial crisis at the cost of lower
exchange rate stability, but raised its autonomy more markedly after the
global financial crisis by forgoing exchange rate stability.
REFERENCES
Aizenman, J., M. Chinn, and H. Ito. 2013. “The ’Impossible Trinity’ Hypothesis in an Era of Global Imbalances: Measurement and Testing.” Review of International Economics 21 (3): 447–58.
Bangko Sentral ng Pilipinas (BSP). 2014. “Annual Report.” Manila. http:/ / www .bsp .gov .ph/ downloads/ publications/ 2014/ annrep2014 .pdf.
———. 2015. “Annual Report.” Manila. http:/ / www .bsp .gov .ph/ downloads/ publications/ 2015/ annrep2015 .pdf.
Chinn, Menzie D., and Hiro Ito. 2006. “What Matters for Financial Development? Capital Controls, Institutions, and Interactions.” Journal of Development Economics 81 (1): 163–92.
Dincer, Nergiz, and Barry Eichengreen. 2014. “Central Bank Transparency and Independence: Updates and New Measures.” International Journal of Central Banking 38 (3): 189‒253.
©International Monetary Fund. Not for Redistribution
Chapter 2 Evolution of Monetary Policy Frameworks 43
Habermeier, K., A. Kokenyne, R. Veyrune, and H. Anderson. 2009. “Revised System for Classification of Exchange Rate Arrangements.” IMF Working Paper 09/211, International Monetary Fund, Washington, DC.
Ito, H., and M. Kawai. 2012. “New Measures of the Trilemma Hypothesis: Implications for Asia.” ADBI Working Paper 381, Asian Development Bank Institute, Tokyo.
International Monetary Fund (IMF). 2000‒16. Annual Report on Exchange Arrangements and Exchange Restrictions. Washington, DC.
———. 2015a. “Evolving Monetary Policy Frameworks in Low-Income and Other Developing Countries.” IMF Policy Paper, Washington, DC. https:/ / www .imf .org/ external/ np/ pp/ eng/ 2015/ 102315 .pdf.
––––––––. 2015b. “Evolving Monetary Policy Frameworks in Low-Income and Other Developing Countries—Background Paper: Country Experiences.” IMF Policy Paper, Washington, DC. https:/ / www .imf .org/ external/ np/ pp/ eng/ 2015/ 102315a .pdf.
———. 2016a. “ASEAN-5 Cluster Report—Evolution of Monetary Policy Frameworks.” IMF Country Report 16/176, Washington, DC.
———. 2016b. “Global Disinflation in an Era of Constrained Monetary Policy.” In World Economic Outlook. Washington, DC, October.
Khor, H. E., J. Lee, E. Robinson, and S. Supaat. 2007. “Managed Float Exchange Rate System: The Singapore Experience.” Singapore Economic Review 52 (1).
Klyuev, V., and T. Dao. 2016. “Evolution of Exchange Rate Behavior in the ASEAN-5 Countries.” IMF Working Paper 16/165, International Monetary Fund, Washington, DC.
Lane, P., and G. Milesi-Ferretti. 2007. “The External Wealth of Nations Mark II: Revised and Extended Estimates of Foreign Assets and Liabilities, 1970–2004.” Journal of International Economics 73 (November): 223–50.
Laurens, Bernard, Kelly Eckhold, Darryl King, Abdul Naseer, Nils Maehle, and Alain Durré. 2015. “The Journey to Inflation Targeting: Easier Said than Done. The Case for Transitional Arrangements along the Road.” IMF Working Paper 15/136, International Monetary Fund, Washington, DC.
Ostry, Jonathan, Atish Ghosh, and Marcos Chamon. 2012. “Two Targets, Two Instruments: Monetary and Exchange Rate Policies in Emerging Market Economies.” IMF Staff Discussion Note 12/01, International Monetary Fund, Washington, DC.
Roger, Scott. 2010. “Inflation Targeting Turns 20.” Finance and Development 47 (1): 46–49.Warjiyo, P. 2014. “Flexible ITF in Indonesia: Framework, Modeling, and Policy Making.” Presen-
ta tion to the International Conference on Economic Modeling, Bali, Indonesia, July 16–18.
©International Monetary Fund. Not for Redistribution

This page intentionally left blank
©International Monetary Fund. Not for Redistribution

45
Toward a Resilient Financial Sector
CHAPTER 3
INTRODUCTION
Financial systems in the Association of Southeast Nations–5 (ASEAN-5) coun-
tries weathered the 2008–09 global financial crisis well. There were no systemic
banking crises or significant signs of distress, such as bank runs, losses in the
banking system, or bank liquidations. In contrast, many advanced economies and
some emerging market economies dealt with systemic banking crises in the
run-up to the global crisis and the period that followed and had to nationalize
banks, freeze deposits, declare bank holidays, provide extensive liquidity support,
purchase assets, or grant guarantees.1
In contrast, the Asian financial crisis of the late 1990s was a traumatic episode
for the ASEAN-5 financial systems. In Indonesia, of 237 banks, 70 were closed
and 13 nationalized. Nonperforming loans reached 32 percent of total loans, and
the fiscal cost of the banking crisis was 57 percent of GDP. In Malaysia, the num-
ber of finance companies dropped from 39 to 10 through intensive mergers.
Nonperforming loans reached 30 percent of total loans, and the fiscal cost was
16 percent of GDP. In the Philippines, 1 commercial bank, 7 of 88 thrift banks,
and 40 of 750 rural banks were placed under receivership. Nonperforming loans
climbed to 20 percent of total loans, and the fiscal cost was 13 percent of GDP.
In Thailand, 59 of 91 financial companies and 1 domestic bank were closed, and
4 banks were nationalized. Nonperforming loans reached 33 percent of total
loans, and the fiscal cost of the banking crisis was 44 percent of GDP.2
This chapter takes stock of major initiatives by ASEAN-5 countries following
the Asian financial crisis, describes and benchmarks the current structure of finan-
cial systems, and assesses financial stability risks. Financial systems built a level of
resilience that allowed ASEAN-5 economies to successfully weather the major
challenges posed by the global financial crisis. Nowadays, ASEAN-5 financial
systems differ in size, access, efficiency, and financial supervision structure.
However, they are similar with regard to key players, the presence of financial
conglomerates, and the influential role of governments, as well as their evolving
structures and emerging risks.
This chapter was prepared by Pablo Lopez Murphy.1These systemic banking crisis episodes are described in Laeven and Valencia (2012).2Laeven and Valencia (2008) discuss the impact of the Asian financial crisis in Indonesia,
Malaysia, the Philippines, and Thailand. The statistics mentioned in the paragraph come from
Table 1 in that paper.
©International Monetary Fund. Not for Redistribution

46 ASEAN WAY: SUSTAINING GROWTH AND STABILITY
MAJOR REFORMS SINCE THE ASIAN FINANCIAL CRISIS
In response to the Asian financial crisis, ASEAN-5 countries introduced signifi-
cant reforms that made financial systems much more resilient. The reform efforts
were concentrated in the following areas:
• Regulation and supervision practices and institutional architecture
• Development of bond markets in local currencies
• Restructuring of firms under financial stress
Regulation, Supervision, and Institutional Architecture
Before the Asian financial crisis, ASEAN-5 financial frameworks suffered from
several structural weaknesses in regulation and supervision. Banks and companies
relied extensively on short-term foreign currency loans to fund projects that gen-
erated receipts in domestic currency. This approach created both maturity and
currency mismatches. In some cases, supervisory agencies did not have enough
capacity, authority, and independence; fit-and-proper rules for owners and man-
agers of financial institutions were weak or did not exist; loan classification and
provisioning rules were inadequate; policies limiting connected lending and for-
eign exchange exposure were not effective; and financial institutions’ publicly
available data were scarce—neither supervisors nor the market had access to
timely reports on banks’ balance sheets and exposures.
Financial systems’ regulation and supervision were overhauled in ASEAN-5
countries after the Asian financial crisis. All countries made efforts to improve
their supervisory capacity and powers. Bank supervisors embraced Basel core
principles, strengthened their supervisory policies and regulations, and required
banks to hold higher levels of capital. Regulations on loan classification, provi-
sioning, and income from nonperforming loans were aligned with international
best practices in all countries. Regulations on connected lending, liquidity man-
agement, foreign currency exposure, and large exposures were improved.
Fit-and-proper rules for owners and managers were revamped. Measures were
taken to strengthen accounting, disclosure, and auditing standards.3
ASEAN-5 countries followed different models for the institutional structure of
financial regulation and supervision:
• In Indonesia, the Financial Services Authority was established in 2011 as an
integrated regulator to oversee the entire financial system. It assumed over-
sight responsibilities for capital markets and nonbank financial institutions
by the end of 2012 and for banks by the end of 2013. Bapepam-LK was
previously in charge of supervising capital markets and nonbank financial
institutions, while the central bank (Bank Indonesia) was responsible for the
3Lindgren and others (1999) describe in detail the weaknesses in regulation and supervision of
financial systems before the Asian financial crisis and the institutional reforms the crisis triggered.
©International Monetary Fund. Not for Redistribution

Chapter 3 Toward a Resilient Financial Sector 47
oversight of banks. In the taxonomy spelled out in Box 3.1, Indonesia
moved from the third to the fourth category.
• In Malaysia, the central bank (Bank Negara Malaysia) regulates banks,
insurers, and prescribed development financial institutions. Securities
Commission Malaysia supervises capital markets. Malaysia falls into the
third category in the taxonomy in Box 3.1.
• In the Philippines, the central bank (Bangko Sentral ng Pilipinas) supervis-
es banks and some nonbank financial institutions. The Insurance
Commission supervises insurance, and the Securities and Exchange
Commission supervises capital markets. The Philippines is in the second
category in the taxonomy in Box 3.1.
• In Singapore, the central bank (Monetary Authority of Singapore) oversees
the entire financial system. Singapore is in the fifth category in the tax-
onomy in Box 3.1.
• In Thailand, the central bank (Bank of Thailand) supervises banks and some
nonbank financial institutions. The Office of the Insurance Commission
oversees the insurance sector, and the Securities and Exchange Commission
is in charge of capital markets. Thailand falls into the second category in the
taxonomy in Box 3.1.
There is no consensus on whether integrated financial supervision is optimal.
Cihak and Podpiera (2006) review the literature and conclude that each setup has
advantages and disadvantages. In principle, integrated financial supervision is
more effective for dealing with financial conglomerates. However, the integrated
supervisor could become too large an organization to be managed effectively.
Moreover, it is easier to capture a single supervisor than multiple supervisors. To
a large extent, the optimal structure of supervision is country-specific and driven
by practical considerations.
Development of Bond Markets in Local Currency
Since the Asian financial crisis, ASEAN-5 countries have undertaken several
efforts to develop bond markets in local currencies. Private sector credit was per-
ceived to be excessively reliant on banks and on loans in foreign currency. The
development of bond markets in local currencies would help simultaneously
reduce foreign exchange mismatches and decrease the concentration of credit and
maturity risks in banks. Bond markets in local currencies would open another
financing channel, a financial spare tire for when the banking system is impaired.
Bond contracts are typically of longer maturity than bank loans and, unlike bank
loans, can be traded, allowing the transfer of risks. This flexibility suggests that
bonds provide larger funding and longer maturities than bank loans.
The Asian Bond Market Initiative, created by the ASEAN+3—an organization
that fosters cooperation between the ASEAN countries and China, Japan, and
Korea—promoted the development of local currency bond markets, especially by
facilitating national and regional market infrastructures for trading bonds. The
©International Monetary Fund. Not for Redistribution
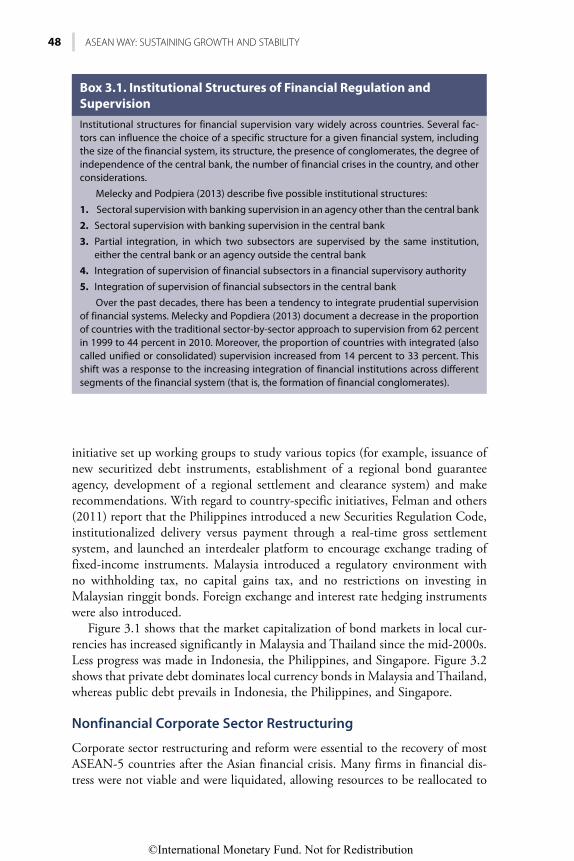
48 ASEAN WAY: SUSTAINING GROWTH AND STABILITY
initiative set up working groups to study various topics (for example, issuance of
new securitized debt instruments, establishment of a regional bond guarantee
agency, development of a regional settlement and clearance system) and make
recommendations. With regard to country-specific initiatives, Felman and others
(2011) report that the Philippines introduced a new Securities Regulation Code,
institutionalized delivery versus payment through a real-time gross settlement
system, and launched an interdealer platform to encourage exchange trading of
fixed-income instruments. Malaysia introduced a regulatory environment with
no withholding tax, no capital gains tax, and no restrictions on investing in
Malaysian ringgit bonds. Foreign exchange and interest rate hedging instruments
were also introduced.
Figure 3.1 shows that the market capitalization of bond markets in local cur-
rencies has increased significantly in Malaysia and Thailand since the mid-2000s.
Less progress was made in Indonesia, the Philippines, and Singapore. Figure 3.2
shows that private debt dominates local currency bonds in Malaysia and Thailand,
whereas public debt prevails in Indonesia, the Philippines, and Singapore.
Nonfinancial Corporate Sector Restructuring
Corporate sector restructuring and reform were essential to the recovery of most
ASEAN-5 countries after the Asian financial crisis. Many firms in financial dis-
tress were not viable and were liquidated, allowing resources to be reallocated to
Institutional structures for financial supervision vary widely across countries. Several fac-
tors can influence the choice of a specific structure for a given financial system, including
the size of the financial system, its structure, the presence of conglomerates, the degree of
independence of the central bank, the number of financial crises in the country, and other
considerations.
Melecky and Podpiera (2013) describe five possible institutional structures:
1. Sectoral supervision with banking supervision in an agency other than the central bank
2. Sectoral supervision with banking supervision in the central bank
3. Partial integration, in which two subsectors are supervised by the same institution,
either the central bank or an agency outside the central bank
4. Integration of supervision of financial subsectors in a financial supervisory authority
5. Integration of supervision of financial subsectors in the central bank
Over the past decades, there has been a tendency to integrate prudential supervision
of financial systems. Melecky and Popdiera (2013) document a decrease in the proportion
of countries with the traditional sector-by-sector approach to supervision from 62 percent
in 1999 to 44 percent in 2010. Moreover, the proportion of countries with integrated (also
called unified or consolidated) supervision increased from 14 percent to 33 percent. This
shift was a response to the increasing integration of financial institutions across different
segments of the financial system (that is, the formation of financial conglomerates).
Box 3.1. Institutional Structures of Financial Regulation and
Supervision
©International Monetary Fund. Not for Redistribution

Chapter 3 Toward a Resilient Financial Sector 49
more productive uses. Some other firms in financial distress were viable and got
some debt or operational restructuring to start hiring and investing again.
Although the formal bankruptcy regime was the natural vehicle with which to
support the corporate restructuring process, it became clear, given the extent and
magnitude of financial distress, that additional government intervention would
be necessary to jump-start and sustain the restructuring process.
Governments established out-of-court frameworks to facilitate corporate
restructuring. Greater reliance on out-of-court debt workouts was a speedy,
cost-effective, and market-friendly alternative to court-supervised workouts.
Formal bankruptcy regimes suffered from poor creditor rights and an inefficient
judicial system that hindered in-court restructuring and out-of-court deals: a
credible threat from the bankruptcy system was necessary to make out-of-court
deals effective. Indonesia, Malaysia, and Thailand upgraded their bankruptcy
laws following the Asian financial crisis and took measures to strengthen their
judicial systems to support restructuring. The Jakarta Initiative Task Force
(JITF) in Indonesia, the Corporate Debt Restructuring Committee (CDRC) in
Malaysia, and the Corporate Debt Restructuring Advisory Committee
(CDRAC) in Thailand were the government-created coordinating bodies for
Indonesia Malaysia Philippines Singapore Thailand
Source: World Bank, Global Financial Development Database.
0
20
40
60
80
100
120
Figure 3.1. Outstanding Debt in Local Currency(Percent of GDP)
2000 01 02 03 04 05 06 07 08 09 10 11 12 13 14 15
Private debt Public debt
Source: World Bank, Global Financial Development Database.
Indo
nesi
a
Mal
aysi
a
Phili
ppin
es
Sing
apor
e
Thai
land
0
20
40
60
80
100
120
Figure 3.2. Outstanding Debt in Local Currency, 2011(Percent of GDP)
©International Monetary Fund. Not for Redistribution

50 ASEAN WAY: SUSTAINING GROWTH AND STABILITY
promoting out-of-court restructuring. Claessens 2005 documents the CDRC’s
resolution of 77 percent of the distressed debt it managed by 2003, compared
with the JITF and the CDRAC, which resolved 56 percent and 48 per-
cent, respectively.
Governments also intervened more directly to support corporate restructur-
ing by establishing centralized asset management companies. The Indonesian
Bank Restructuring Agency, Danaharta (for Malaysia), and the Thai Asset
Management Corporation took over most nonperforming loans a few years
after the Asian financial crisis. In principle, asset management companies were
expected to play a key role in the restructuring process given their relatively
large bargaining power. However, in practice, their contribution was somewhat
disappointing because they were slow in resolving distressed debt (Claessens
2005). Political interference and other institutional weaknesses limited
their effectiveness.
FINANCIAL SYSTEM STRUCTURES: WHERE DO THEY STAND NOW?
The major reforms introduced after the Asian financial crisis paid off by increas-
ing the resilience of financial systems in the ASEAN-5. To describe and compare
ASEAN-5 financial system structures, this section focuses on three key dimen-
sions: (1) financial depth, the size of financial institutions and markets; (2) access,
the degree to which individuals and nonfinancial firms can use financial institu-
tions and markets; and (3) efficiency, the ability of the financial system to provide
financial services at the lowest cost. This section also zooms in on other promi-
nent structural issues raised in IMF Financial System Stability Assessment reports
that are characteristic of financial systems in ASEAN-5 countries. First, in many
countries, financial conglomerates—groups of companies under common control
that provide significant services in at least two different financial segments (bank-
ing and insurance, for instance)—have a large presence. Second, in most coun-
tries, governments tend to have a large influence in the financial sector
beyond regulation.
Financial Depth
The most common way to characterize financial depth is by the size of financial
institutions and financial markets. Financial institutions are central banks, com-
mercial banks, insurance companies, pension funds, public financial institutions,
and other financial institutions. Financial markets are bond (sovereign and cor-
porate) and stock markets.
Figure 3.3 shows deposit money banks’ assets as a percentage of GDP.
Malaysia, Singapore, and Thailand have much larger banking systems than
Indonesia and the Philippines. In Malaysia, Singapore, and Thailand, banks’
assets were well above the average for high-income countries in 2015. In contrast,
banks’ assets in Indonesia and the Philippines were less than the average for
©International Monetary Fund. Not for Redistribution

Chapter 3 Toward a Resilient Financial Sector 51
middle-income countries. Banking system size increased significantly during
1989–2014 in the Philippines, Singapore, and Thailand. In contrast, it remained
almost unchanged in Indonesia and Malaysia.
Data availability and comparability for nonbank financial institutions is much
more limited than for deposit money banks. However, insurance companies and
pension funds are usually important players within the universe of nonbank
financial institutions for which there are comparable statistics. Figure 3.4 shows
that insurance company assets in Malaysia, Singapore, and Thailand were larger
than the average for high-income countries in 2011, suggesting that insurance
markets are well developed. Insurance markets in Indonesia and the Philippines
are smaller than in the other ASEAN-5 countries but larger than the average for
middle-income countries. Figure 3.4 also shows that pension fund assets are
remarkably large in Malaysia and much more modest in Indonesia, the
Philippines, and Thailand.
Financial systems in ASEAN-5 countries are still dominated by banks, but
shadow banks are gaining ground. Shadow banks comprise a mix of institutions
(Box 3.2). In Indonesia, banks accounted for 62 percent of financial institution
assets in 2015, and in Singapore they accounted for 66 percent (Figure 3.5). The
share of shadow banks in financial institution assets increased to 9 percent from
5 percent during 2005–15 in Indonesia and to 10 percent from 4 percent in
Singapore (Figure 3.5).
High income Middle income Indonesia MalaysiaPhilippines Singapore Thailand
Source: World Bank, Global Financial Development Database.
0
20
40
60
80
100
120
140
160
180
200
Figure 3.3. Deposit Money Banks’ Assets(Percent of GDP)
1990 92 94 96 98 2000 02 04 06 08 10 12 14
©International Monetary Fund. Not for Redistribution

52 ASEAN WAY: SUSTAINING GROWTH AND STABILITY
In financial markets the size of stock markets is measured by computing their
capitalization (that is, the value of listed firms times the number of shares). The
size of stock markets has increased sharply in most ASEAN-5 countries since
2000 (Figure 3.6). Yet stock market size varies even more than the size of deposit
money banks. In all ASEAN-5 countries except Indonesia, stock markets were
larger in 2015 than the average market in high-income countries. In Malaysia, the
Insurance Pension funds
Source: World Bank, Global Financial Development Database.
High income Middleincome
Indonesia Malaysia Philippines Singapore Thailand0
10
20
30
40
50
60
70
80
Figure 3.4. Insurance and Pension Fund Assets, 2011(Percent of GDP)
The Financial Stability Board has been carefully monitoring nonbank financial institutions
to assess global trends and risks in the shadow banking system since 2011. The annual
monitoring exercise relies on a common methodology for measuring nonbank financial
institutions and covers 28 countries, including Indonesia and Singapore. It distinguishes
between the following financial institutions: central banks, banks, insurance corporations,
pension funds, public financial institutions, and other financial institutions.
The Financial Stability Board considers “other financial institutions” to be a conserva-
tive proxy for or broad measure of shadow banks. These include money market funds,
hedge funds, other investment funds, real estate trusts, trust companies, finance compa-
nies, broker-dealers, structured finance vehicles, central counterparties, and captive finan-
cial institutions and money lenders. The Financial Stability Board also estimates a narrow
measure of shadow banks focused on activities that pose higher financial stability risks.
Box 3.2. Shadow Banks: What Are They?
©International Monetary Fund. Not for Redistribution

Chapter 3 Toward a Resilient Financial Sector 53
Indonesia 2005 Indonesia 2015Singapore 2005 Singapore 2015
Source: Financial Stability Board, Global Shadow Banking Monitoring Report 2016 Dataset.
0
50
100
150
200
250
300
Central bank Banks Insurancecorporations
Pensionfunds institutions
Shadowbanks
Figure 3.5. Composition of Financial Institution Assets(Percent)
High income Middle income Indonesia MalaysiaPhilippines Singapore Thailand
Source: World Bank, Global Financial Development Database.
0
50
100
150
200
250
300
Figure 3.6. Stock Market Capitalization(Percent of GDP)
1990 92 94 96 98 2000 02 04 06 08 10 12 14
©International Monetary Fund. Not for Redistribution

54 ASEAN WAY: SUSTAINING GROWTH AND STABILITY
relatively large market in 2015 was still smaller than in the years before the Asian
financial crisis.
The relative importance of financial markets compared with financial institu-
tions in the financial system has been rising. Demirgüç-Kunt, Feyen, and Levine
(2011) show that as economies develop, they tend to demand the services of
financial markets more than those of banks. Figures 3.3 and 3.6 show that the size
of stock markets relative to that of the banking system increased in all countries
over the past 25 years.
Access
Access to financial services is a key element for inclusive financial systems that aim
to promote growth and reduce inequality. Financial services help households
smooth consumption and invest in education and health. Credit allows businesses
to invest, hire, and grow. An account at a financial institution is the first step
toward financial inclusion. Figure 3.7 shows that almost all the population in
Singapore has an account at a formal financial institution, in line with the pat-
terns observed in high-income countries. Account ownership in Malaysia and
Thailand is well above the average for middle-income countries. In contrast, it is
relatively low in Indonesia and especially low in the Philippines.
Demirgüç-Kunt and Klapper (2012) write that surveys point to several factors
discouraging financial institution accounts that are relevant for middle- and
low-income countries. These include having no money with which to open an
account, the cost of opening an account, the documentation requirements for
opening an account, the cost of maintaining an account (for example, annual
fees), and distance from the bank (especially in rural areas).
To estimate access to stock and bond markets, measures of market concentra-
tion are typically used (Figure 3.8). For stock markets, the percentage of market
capitalization outside of the 10 largest companies should increase when there is
greater access by smaller firms. In ASEAN-5 countries, except Indonesia, access
to stock markets is higher than the average in high-income and middle-income
countries. For bond markets, the percentage of nonfinancial corporate bonds to
total bonds outstanding is a measure of access that should increase with greater
access (Figure 3.2). Access by corporations to bond markets in Indonesia and the
Philippines remains low.
Efficiency
An efficient financial system performs its intermediation functions in the least
costly way possible. A common measure of efficiency of banks is the net interest
margin, defined as the accounting value of bank interest revenue net of interest
expense, as a percentage of interest-earning assets. The purpose of net interest
margins is to compensate banks for overhead costs, loan loss provisions, reserve
requirements, and taxes on profits. In Malaysia and Singapore net interest mar-
gins are lower than the average for high-income countries (Figure 3.9). In
©International Monetary Fund. Not for Redistribution

Chapter 3 Toward a Resilient Financial Sector 55
Thailand they are lower than in the Philippines, and in both countries they are
lower than the average for middle-income countries.
The stock market turnover ratio gauges financial market efficiency.4 Thailand
leads in financial market efficiency (Figure 3.10). Intuitively, the turnover ratio
measures the liquidity of the stock market. Stock markets are significantly more
liquid in Thailand than in the other ASEAN-5 countries and than the average for
high-income countries.
The Presence of Conglomerates
The presence of financial conglomerates is a key feature in several countries.
Because of their economic reach and their mix of regulated and unregulated
activities, financial conglomerates pose a challenge to effective financial over-
sight. For example,
4The stock market turnover ratio is the total value of shares traded during a period divided by the
market capitalization in that period.
Source: World Bank, Global Financial Development Database.
Hig
h-in
com
eav
erag
e
Mid
dle-
inco
me
aver
age
Indo
nesi
a
Mal
aysi
a
Phili
ppin
es
Sing
apor
e
Thai
land
0
20
40
60
80
100
120
Figure 3.7. Account Owned at a Financial Institution, 2014(Percent of population ages 15 and older)
Source: World Bank, Global Financial Development Database.
Hig
hin
com
e
Mid
dle
inco
me
Indo
nesi
a
Mal
aysi
a
Phili
ppin
es
Sing
apor
e
Thai
land
0
10
20
30
40
50
60
70
80
Figure 3.8. Market Capitalization outside of Top 10 Largest Companies, 2015(Percent of total market capitalization)
©International Monetary Fund. Not for Redistribution

56 ASEAN WAY: SUSTAINING GROWTH AND STABILITY
• In Indonesia, 49 financial conglomerates account for 70 percent of the total
assets of financial institutions. Bank-led conglomerates hold more than
90 percent of financial conglomerate assets and include insurance compa-
nies, securities firms, and finance companies. More than half of financial
conglomerates have a horizontal structure with an unregulated holding
company that controls the group. The absence of a regulated entity that
leads the remaining entities in the financial conglomerate is a major chal-
lenge for consolidated supervision.
• In Malaysia, the central bank enhanced its oversight to financial groups. The
central bank holds a licensed institution, or a financial holding company
that is the apex of the financial group, responsible for ensuring compliance
with group-wide prudential standards. The apex entity will also serve as a
focal point for supervisory activities such as obtaining information for the
purposes of assessing risks to the financial health of the group.
• In the Philippines, financial conglomerates own companies in telecommu-
nications, energy, property, retail trade, and banking. About 60 percent of
bank assets are controlled by banks belonging to conglomerates (7 of the 10
largest banks belong to conglomerates). Moreover, about 75 percent of total
Source: World Bank, Global Financial Development Database.
Hig
h-in
com
eav
erag
e
Mid
dle-
inco
me
aver
age
Indo
nesi
a
Mal
aysi
a
Phili
ppin
es
Sing
apor
e
Thai
land
0
1
2
3
4
5
6
7
Figure 3.9. Net Interest Margin, 2015(Percent)
Source: World Bank, Global Financial Development Database.
Hig
hin
com
e
Mid
dle
inco
me
Indo
nesi
a
Mal
aysi
a
Phili
ppin
es
Sing
apor
e
Thai
land
0
10
20
30
40
50
60
70
80
Figure 3.10. Turnover Ratio, 2015(Percent)
©International Monetary Fund. Not for Redistribution

Chapter 3 Toward a Resilient Financial Sector 57
stock market capitalization comes from companies that belong to conglom-
erates. The interconnection within each conglomerate exposes banks to
problems in the subsidiaries.
• Thailand is home to large banking conglomerates, with significant owner-
ship of nonbank financial institutions and considerable market share. The
Bank of Thailand exercises consolidated financial supervision, but its regu-
latory perimeter extends only to banks.
Government Presence5
Extensive government ownership in the banking sector is another remarkable
feature in ASEAN-5 financial systems. Government ownership is explained in
part by the bailouts and takeovers in the aftermath of the Asian financial crisis.
This dual role of owner and regulator generates conflicts of interest that can com-
plicate effective oversight. It can also undermine crisis management and resolution.
• In Indonesia, Bank Mandiri, which is 60 percent state owned, is the coun-
try’s largest bank, accounting for about 15 percent of total banking sector
assets in 2015. It came about through a merger of four failed banks. Bank
Rakyat Indonesia, the second-largest bank, specializing in small-scale bor-
rowing and microfinance, is also majority state owned, accounting for
14 percent of total bank assets. Bank Negara Indonesia is the fourth-largest
bank; it was recapitalized by the government during the Asian financial
crisis and is 60 percent state owned, accounting for 8 percent of
total bank assets.
• In Malaysia, the government owns a significant share of the financial sector
via its seven government-linked investment companies. These companies
are subject to government oversight and participation on their boards, usu-
ally by appointees of the Ministry of Finance or the prime minister’s office.
Government-linked investment companies control a large number of
government-linked companies—commercial companies the government
controls directly.
• In the Philippines, the two major state-owned lenders, the Development
Bank of the Philippines and the Land Bank of the Philippines, are among
the 10 largest banks as measured by assets. The United Coconut Planters
Bank is also a large state-owned bank. The Development Bank of the
Philippines, Land Bank of the Philippines, Government Service Insurance
System, and Social Security System were the four government financial
institutions that funded an ambitious public-private partnership program
aiming to revamp infrastructure.
• In Singapore, the government share in the financial system is small.
5This section draws on several IMF Financial System Stability Assessment reports (IMF 2009,
2010, 2013a, 2013b, 2017).
©International Monetary Fund. Not for Redistribution

58 ASEAN WAY: SUSTAINING GROWTH AND STABILITY
• In Thailand, the government has a significant equity stake in the commer-
cial banking sector. During the 1997 financial crisis the government had to
rescue several banks. Since then, the government has been reducing its stake,
but it still controls Krung Thai Bank, the third-largest bank as measured by
assets. Specialized financial institutions are policy banks fully owned by the
government; they account for about 30 percent of financial system assets.
The largest are the Government Savings Bank and the Bank for Agriculture
and Agriculture Cooperatives—both deposit-taking institutions. The Bank
of Thailand has been granted supervisory powers related to specialized
financial institutions since 2015, which help mitigate concerns about con-
flict of interest.
FINANCIAL STABILITY
Financial stability means that the financial system can smoothly deliver the finan-
cial services it provides and is also resilient to shocks. Financial systems provide
essential services such as taking deposits and investments for savers, loans and
securities for investors, liquidity and payment services for both, and risk-diversifi-
cation and insurance services. Financial instability impedes some (or all) of
these key services.
Macroprudential surveillance is a key element of the analytical framework for
assessing financial stability. It focuses on the financial system as a whole and com-
plements the micro surveillance of individual financial institutions by supervisors.
Some well-known quantitative analytical tools for macroprudential surveillance
are analysis of z-scores, monitoring of financial soundness indicators, and stress
testing. The analysis of macro-financial linkages is another important element of
the analytical framework for assessing financial stability. Such analysis aims to
assess the effect of various shocks on macroeconomic conditions through the
financial system. Historical evidence, including in the ASEAN-5 as shown in
Chapter 4, suggests that financial systems can amplify the effects of shocks on the
economy. The Country Financial Stability Maps developed by Cervantes and
others (2014) are a relatively novel quantitative tool used for the analysis of
macro-financial linkages.
This section analyzes z-scores, examines financial soundness indicators, dis-
cusses financial stability maps, and assesses stock market volatility to shed some
light on financial stability in ASEAN-5 countries.
Z-scores
To measure the degree of stability of financial institutions, Cihak and others
(2012) aggregate individual financial institutions’ stability measures (z-scores) to
get a system-wide measure by weighting each individual z-score by the financial
institution’s size. A higher z-score implies a lower probability of insolvency and
hence higher financial stability. Z-scores in Malaysia, the Philippines, and
©International Monetary Fund. Not for Redistribution

Chapter 3 Toward a Resilient Financial Sector 59
Singapore have been generally higher than the average for high-income and
middle-income countries (Figure 3.11). Z-scores in most countries declined in
2008, at the outset of the global financial crisis. Z-scores in Indonesia and
Thailand are below average for middle-income countries, but have been consis-
tently improving since the mid-2000s.
The z-score is defined as z = (k + μ )/ , in which k is equity capital as a percent-
age of assets, μ is return as a percentage of assets, and is standard deviation of the
return on assets. It can be shown, with a little algebra, that z-scores are inversely
related to the probability of a financial institution becoming insolvent. (There are
two limitations that should be kept in mind when interpreting z-scores. First, they
are computed from accounting data. Hence, if financial institutions can smooth out
reported data, the z-score may underestimate the risk of insolvency. Second, z-scores
neglect the interconnectedness of financial institutions in the sense that the proba-
bility of insolvency of a financial institution is likely to be higher when the rest of
the financial institutions have a higher probability of insolvency.)
Financial Soundness Indicators
Financial soundness indicators are indicators of the current financial health of a
country’s financial institutions. Financial soundness indicators aggregate individ-
ual financial institutions’ indicators (microprudential indicators) into financial
soundness indicators (macroprudential indicators). The deposit-to-loan ratio,
High income Middle income Indonesia MalaysiaPhilippines Singapore Thailand
Source: World Bank, Global Financial Development Database.
Figure 3.11. Z-scores
0
5
10
15
20
25
30
35
2006 13 1411100907 08 12 15
©International Monetary Fund. Not for Redistribution

60 ASEAN WAY: SUSTAINING GROWTH AND STABILITY
share of foreign exchange loans in total loans, and share of foreign exchange lia-
bilities in total liabilities provide information on structural risks in the bank’s
balance sheet to exchange rate fluctuations and to shifts in market confidence.
The leverage ratio, given by equity divided by assets, measures whether the bank-
ing system has a large enough capital buffer to absorb negative shocks (for exam-
ple, losses). The leverage ratio will come under pressure if the nonperforming loan
ratio is growing or if the sector is experiencing losses.
The financial soundness indicators heat map suggests that balance sheets are
strong in all countries (Table 3.1). The blue indicators in Singapore are explained
by the relatively large share of foreign exchange loans in total loans (and more
recently, by some deterioration in asset quality). Given Singapore’s position as a
large international center, and the abundant funding sources in foreign exchange
for banks, the large share of foreign exchange loans may not be a useful metric for
comparison with the other ASEAN-5 emerging markets.
Macro-Financial Linkages
Country Financial Stability Maps identify potential sources of macro-financial
risks for a specific country. They also enable assessment of these risks in a global
context through comparisons with the corresponding Global Financial Stability
Map from the IMF’s Global Financial Stability Report.By and large, macro-financial risks in the ASEAN-5 have receded since the
global financial crisis. Figure 3.12 shows that macroeconomic, spillover, and
credit risks for ASEAN-5 countries in 2017 were lower than in the immediate
aftermath of the global crisis. Risk appetite has also returned to the region, and
has been higher recently than it was during the global financial crisis. However,
in two dimensions, risks appear higher now than during the crisis. Market and
liquidity risks have increased since the global financial crisis because in several
countries credit has grown much more than deposits. This imbalance implies that
the deposit-to-loan ratio, a standard metric for assessing liquidity, has been
declining. Monetary and financial conditions have tightened because broad
money and credit, key indicators with which to assess monetary and financial
TABLE 3.1.
Balance Sheet Soundness
2009:Q4 2010:Q4 2011:Q4 2012:Q4 2013:Q4 2014:Q4 2015:Q4 2016:Q4
Indonesia n.a. n.a. L L L M L L
Malaysia L L L L L L L L
Philippines L L L L L L L L
Singapore M M M M M M M M
Thailand L L L L L L L L
Source: IMF staff estimates.
Note: Indicators are red (high, H) if the upper threshold is breached, blue (medium, M) if the indicator is between the lower
and the upper thresholds, and green (low, L) if the indicator is below the lower thresholds. The thresholds are based on anal-
yses in various issues of the IMF Global Financial Stability Report and on the Basel III leverage ratio; they are also informed by
IMF experiences in Financial Sector Assessment Programs. n.a. = not available.
©International Monetary Fund. Not for Redistribution

Chapter 3 Toward a Resilient Financial Sector 61
conditions, were growing more slowly in the first quarter of 2017 than in the
aftermath of the global financial crisis.
Moreover, the ASEAN-5 Country Financial Stability Map currently lies with-
in the Global Financial Stability Map, which suggests lower vulnerability in the
ASEAN-5 than in the global financial system. Figure 3.13 shows that macroeco-
nomic, spillover, and credit risks for ASEAN-5 countries in the first quarter of
2017 were lower than in the Global Financial Stability Map, and risk appetite was
relatively higher. However, monetary and financial conditions in the ASEAN-5
were tighter compared with global conditions and have been since the first
quarter of 2015.
The Country Financial Stability Map captures four macro-financial risk cate-
gories (macroeconomic, inward spillovers, credit, market and liquidity) and two
macro-financial conditions categories (monetary and financial conditions, risk
appetite). Each category relies on several indicators, as discussed in Cervantes and
others 2014. Each category is ranked from 0 to 10. A rank of 0 captures the
lowest risk, the highest risk aversion, and the tightest monetary and financial
conditions. A rank of 5 corresponds to long-term average risks and conditions in
a five-year period.
Financial Market Volatility
One way to measure instability of financial markets is by the volatility of daily
returns of the stock market index over a year (Figure 3.14). Stock market volatility
has been declining in all ASEAN-5 countries since the global financial crisis,
making stock markets more attractive for investors. Financial markets tend to be
relatively more stable in Malaysia and, more recently, in Singapore.
2009:Q1 2017:Q1
Figure 3.12. ASEAN-5 Financial Stability Map, 2017 versus 2009
Inward spillover risks
Creditrisks
Market andliquidity risks
Risk appetite
Monetary
risks
0
2
4
6
8
Global 2017:Q1 ASEAN-5 2017:Q1
Figure 3.13. ASEAN-5 Financial Stability Map 2017 versus Global, 2017
0
2
4
6
8
Inward spillover risks
Creditrisks
Market andliquidity risks
Risk appetite
Monetary
risks
©International Monetary Fund. Not for Redistribution

62 ASEAN WAY: SUSTAINING GROWTH AND STABILITY
TOWARD A RESILIENT FINANCIAL SYSTEM
ASEAN-5 countries overhauled the regulation and supervision of their financial
systems in response to the Asian financial crisis. They also repaired balance sheets
by restructuring not only the financial sector but also nonfinancial corporations.
Finally, they actively developed bond markets in local currency to diversify the
sources of funding for the real economy. All these efforts helped them navigate
the global financial crisis and preserve their financial stability.
Currently, the size, composition, access, efficiency, and institutional structure
of regulation and supervision are diverse in the financial systems in ASEAN-5
countries. To some extent these disparities reflect stages in economic development
within the group of countries. Singapore, for example, is a high-income country
and has a larger, more diversified, more efficient, and more extended financial
system than the rest of the countries.
But financial systems in ASEAN-5 countries also have some important simi-
larities, including the dominant role of banks, the increasing importance of
shadow banks and financial markets, the large presence of financial conglomer-
ates, and high participation of the government in financial systems.
A bird’s-eye view of financial stability risks in ASEAN-5 countries suggests
that they are contained. Z-scores are either relatively high or have been on an
upward trend. Financial soundness indicators indicate that balance sheets are
relatively strong, with few liquidity and solvency risks. Finally, macro-financial
Indonesia Malaysia Philippines Singapore Thailand
Source: World Bank, Global Financial Development Database.
0
5
10
15
20
30
25
35
40
Figure 3.14. Stock Price Volatility Index(Standard deviation of the daily return of the stock market each year)
2000 01 02 03 04 05 06 07 08 09 10 11 12 13 14 15
©International Monetary Fund. Not for Redistribution

Chapter 3 Toward a Resilient Financial Sector 63
risks are generally lower in the ASEAN-5 financial system than in the global
financial system.
REFERENCES
Cervantes, R., P. Jeasakul, J. Maloney, and L. L. Ong. 2014. “Ms. Muffet, Spidergram and the Web of Macro-Financial Linkages.” IMF Working Paper 14/99, International Monetary Fund, Washington, DC.
Cihak, M., A. Demirgüç-Kunt, E. Feyen, and R. Levine. 2012. “Benchmarking Financial Systems around the World.” World Bank Policy Research Working Paper 6175, World Bank, Washington, DC.
Cihak, M., and R. Podpiera. 2006. “Is One Watchdog Better than Three? International Experience with Integrated Financial Sector Supervision.” IMF Working Paper 06/57, International Monetary Fund, Washington, DC.
Claessens, S. 2005. “Policy Approaches to Corporate Restructuring around the World: What Worked, What Failed?” In Corporate Restructuring: Lessons from Experience, edited by M. Pomerleano and W. Shaw. Washington, DC: World Bank.
Demirgüç-Kunt, A., E. Feyen, and R. Levine. 2011. “The Evolving Importance of Banks and Securities Markets.” World Bank Policy Research Working Paper 5805, World Bank, Washington, DC.
Demirgüç-Kunt, A., and L. Klapper. 2012. “Measuring Financial Inclusion: The Global Findex Database.” World Bank Policy Research Working Paper 6025, World Bank, Washington, DC.
Felman, J., S. Gray, M. Goswami, A. Jobst, M. Pradhan, S. Peiris, and D. Seneviratne. 2011. “ASEAN-5 Bond Market Development: Where Does It Stand? Where Is It Going?” IMF Working Paper 11/137, International Monetary Fund, Washington, DC.
Financial Stability Board (FSB). 2017. “Global Shadow Banking Monitoring Report 2016.” Basel.International Monetary Fund (IMF). 2009. “Thailand: Financial Sector Stability Assessment.”
IMF Country Report 09/147, Washington, DC.———. 2010. “Philippines: Financial Sector Stability Assessment Update.” IMF Country
Report 10/90, Washington, DC.———. 2013a. “Malaysia: Financial Sector Stability Assessment.” IMF Country Report 13/52,
Washington, DC.———. 2013b. “Singapore: Financial Sector Stability Assessment.” IMF Country Report
13/325, Washington, DC.———. 2017. Indonesia: Financial Sector Stability Assessment.” IMF Country Report 17/152,
Washington, DC.Laeven, L., and F. Valencia. 2008. “Systemic Banking Crisis Database: An Update.” IMF
Working Paper 12/163, International Monetary Fund, Washington, DC.———. 2012. “Systemic Banking Crisis: A New Database.” IMF Working Paper 08/224,
International Monetary Fund, Washington, DC.Lindgren, C., T. Balino, C. Enoch, A. M. Gulde, M. Quintyn, and L. Teo. 1999. “Financial
Sector Crisis and Restructuring: Lessons from Asia.” IMF Occasional Paper 188, International Monetary Fund, Washington, DC.
Melecky, M., and A. Podpiera. 2013. “Institutional Structures for Financial Sector Supervision, Their Drivers and Historical Benchmarks.” Journal of Financial Stability 9 (3) 428–44.
©International Monetary Fund. Not for Redistribution

This page intentionally left blank
©International Monetary Fund. Not for Redistribution

PART II
Policy Responses to Global Spillovers
©International Monetary Fund. Not for Redistribution

This page intentionally left blank
©International Monetary Fund. Not for Redistribution

67
Global Spillovers
CHAPTER 4
INTRODUCTION
Global financial cycles and spillovers pose a challenge for the Association of
Southeast Asian Nations–5 (ASEAN-5) countries. Rey (2013) argues that capital
flows, asset prices, and credit growth observe a global financial cycle and that the
cycle (proxied by the Chicago Board Options Exchange Volatility Index [VIX]) is
driven mainly by US monetary policy. Potential surprises from US monetary
policy normalization and spikes in global risk aversion are sometimes accompa-
nied by capital outflows and tighter domestic financial conditions, with signifi-
cant macro-financial effects on ASEAN-5 countries.
This chapter takes stock of the impact of global shocks on ASEAN-5 econo-
mies and identifies the main transmission channels of global spillovers. It finds
that one key channel related to the VIX affects largely capital flows and asset
prices;1 another, linked to US interest rates, affects mainly monetary and credit
conditions.2 The chapter estimates global financial factors’ impact on ASEAN-5
growth cycles; these factors are transmitted partly through capital flows and are
often amplified by equity prices and domestic credit friction.3 Results show that
real economy factors, such as external demand from the United States and more
recently from China, are also relevant, but global financial shocks tend to domi-
nate growth dynamics in the ASEAN-5. The policy response of ASEAN-5 econ-
omies to these global spillovers is further examined in Chapters 5 and 6.
The extensive global spillovers to the ASEAN-5 are likely to pose new challeng-
es in the period ahead. The chapter concludes with simulations of the potential
spillovers from the realization of downside risks facing the global outlook, calibrat-
ed to one ASEAN-5 economy (the Philippines). Illustrative model-based scenarios
show that faster-than-anticipated monetary policy normalization in the United
States, an unproductive US fiscal expansion, or an abrupt growth slowdown in
China would hit the ASEAN economies hard through lower external demand and
higher financing costs, warranting a policy response. Part III of this book delves
deeper into the policy reform agenda necessary to face these new challenges.
This chapter was prepared by Shanaka J. Peiris, Minsuk Kim, and Sherillyn Raga.1Ahmed and Zlate (2013); Nier, Sedik, and Mondino (2014); and Koepke (2015) list global risk
aversion as among the most important global determinants of capital flows.2Rey (2016) presents evidence that US monetary policy shocks are transmitted internationally
and affect financial conditions even in inflation-targeting economies with large financial markets.3Financial spillovers, as discussed in IMF 2016a and Diebold and Yilmaz 2014, can be transmit-
ted across borders in part via capital flows (IMF 2016b).
©International Monetary Fund. Not for Redistribution

68 THE ASEAN WAY: SUSTAINING GROWTH AND STABILITY
GLOBAL FINANCIAL FACTORS AND DOMESTIC FINANCIAL CONDITIONS
Domestic financial conditions in the ASEAN-5 economies are sensitive to global
factors.4 Following Miranda-Agrippino and Rey (2015), a principal component
model is used to identify the underlying global factors that can explain the variabil-
ity of a comprehensive set of domestic financial indicators.5 The principal compo-
nent analysis shows that the first two common components explain about 53 to
65 percent of the variation in domestic financial conditions in the ASEAN-5
economies (Figure 4.1; Table 4.1). In general, in each economy, one of the first two
principal components seems to be associated with global interest rates and local
currency sovereign bond and retail bank interest rates, while the other component
is more closely associated with the VIX, which is related to asset prices and bank
credit (see Table 4.2).6 The results indicate that there are potentially two key trans-
mission channels of global financial shocks to domestic financial conditions: one
related to the VIX, which affects mainly capital flows and asset prices, and another
linked to US interest rates, which affects predominantly monetary and credit con-
ditions. These are examined further in the remainder of the chapter.
Both global financial conditions and domestic policy rates seem to influence
domestic financial conditions, with the former having a greater impact (Figure 4.2).
Simple recursive vector autoregression (VAR) models of the first two factors of
domestic financial conditions in the ASEAN-5, following the approach of IMF
2017a, show that US interest rates, the VIX, or both have a significant impact in all
countries.7 Policy rates also have a significant impact in most cases, albeit of a lesser
magnitude. Variance decompositions of the domestic financial conditions factors
confirm that for most ASEAN-5 economies, a greater proportion is explained by
global factors than by domestic policy rates. Still, the share of the first two principal
components explained by global factors is lower than the share explained by a coun-
try’s own shocks, suggesting that other domestic variables and structural factors
continue to influence domestic financial conditions in the ASEAN-5.
4See Adrian and Liang 2016 and IMF 2017a for a broader look at drivers and use of domestic
financial conditions.5The domestic financial factors included about 25 to 30 financial variables for each economy
used to estimate financial conditions indices for Asia in Box 1.4 of IMF 2015.6The 10-year US Treasury yield is used as a proxy for global interest rates in this section because
it acts as a benchmark for the global yield curve. In following sections, alternative US interest
rates, including the federal funds rate, are used to represent global interest rates as the key reference
reserve currency, with other systemic economies’ (China, euro area, Japan, United Kingdom, United
States) interest rates less significant a factor in the ASEAN-5.7The recursive VAR is ordered as follows: US 10-year Treasury yield, VIX, net capital inflows,
policy rates, and principal components. For parsimony, figures show only the impulse response
functions of the first two principal components for each country in response to global and
domestic shocks.
©International Monetary Fund. Not for Redistribution

Chapter4 Global Spillovers 69
US 10-year government bond yield (left scale)Factor 1 (right scale)
US 10-year government bond yield (left scale)Factor 1 (right scale)
Factor 2 (right scale) VIX (left scale)
Factor 2 (right scale) VIX (left scale)
US 10-year government bond yield (right scale)
Factor 1 (left scale)
Factor 2 (left scale) VIX (right scale)
Jan-
2007
Jun-
07
Nov
-07
Apr-
08
Sep-
08
Feb-
09
Jul-
09
Dec
-09
May
-10
Oct
-10
Mar
-11
Aug-
11
Jan-
12
Jun-
12
Nov
-12
Apr-
13
Sep-
13
Feb-
14
Jul-
14
Dec
-14
May
-15
Oct
-15
Mar
-16
Aug-
16
Jun-
2005
Dec
-05
Jun-
06
Dec
-06
Jun-
07
Dec
-07
Jun-
08
Dec
-08
Jun-
09
Dec
-09
Jun-
10
Dec
-10
Jun-
11
Dec
-11
Jun-
12
Jun-
13
Dec
-12
Dec
-13
Jun-
14
Dec
-14
Jun-
15
Dec
-15
Jun-
16
–2
0
2
4
6
–4
–3.0
–2.0
–1.0
0.0
1.0
2.0
3.0
10203040506070
0
1
3
5
–3
–1
7
–5
012345
–3–2–1
6
10
20
30
40
50
60
0
1.52.02.53.03.54.04.55.0
1.0
5.5Ja
n-20
05
Jul-
05
Jan-
06
Jul-
06
Jan-
07
Jul-
07
Jan-
08
Jul-
08
Jan-
09
Jul-
09
Jan-
10
Jul-
10
Jan-
11
Jul-
11
Jan-
12
Jul-
12
Jan-
13
Jul-
13
Jan-
14
Jul-
14
Jan-
15
Jul-
15
Jan-
16
23
01
45
–2–1
6
–3
2
3
4
5
0
1
6
10
20
30
40
50
60
70
0
0
1
2
–3
–2
–1
3
1.52.02.53.03.54.04.55.0
1.0
5.52. Malaysia
1. Indonesia
3. Philippines
Figure 4.1. Comovement of Latent Factors with Global FactorsPe
rcen
tPe
rcen
tPe
rcen
tIn
dex
Inde
xIn
dex
©International Monetary Fund. Not for Redistribution

70 THE ASEAN WAY: SUSTAINING GROWTH AND STABILITY
US 10-year government bond yield (left scale)Factor 1 (right scale)
US 10-year government bond yield (left scale)Factor 1 (right scale)
Factor 2 (right scale)VIX (left scale)
Factor 2 (right scale)VIX (left scale)
Nov
-06
Apr-
07
Sep-
07
Feb-
08
Jul-
08
Dec
-08
May
-09
Oct
-09
Mar
-10
Aug-
10
Jan-
11
Jun-
11
Nov
-11
Apr-
12
Sep-
12
Feb-
13
Jul-
13
Dec
-13
May
-14
Oct
-14
Mar
-15
Aug-
15
Jan-
16
Jun-
2006
Jun-
16
–2
–1
0
1
2
3
4
5
–3
–3–2–101234
10
20
30
40
50
60
70
0
0
1
2
3
4
6
5
–2.5–1.5–0.50.51.52.5
3.5
–3.5
–2.0 –1.5 –1.0 –0.5 0.0 0.5 1.0 1.5 2.0
–2.5
2.5
10
20
30
40
50
60
0
1
2
3
4
5
0
6
Apr-
2004
Oct
-16
Oct
-04
Apr-
05
Oct
-05
Apr-
06
Oct
-06
Apr-
07
Oct
-07
Apr-
08
Oct
-08
Apr-
09
Oct
-09
Apr-
10
Oct
-10
Apr-
11
Oct
-11
Apr-
12
Oct
-12
Apr-
13
Oct
-13
Apr-
14
Oct
-14
Apr-
15
Oct
-15
Apr-
16
4. Singapore
5. Thailand
Sources: Bloomberg Finance L.P.; CEIC Data Co. Ltd.; Haver Analytics; and IMF staff estimates.Note: VIX = Chicago Board Options Exchange Volatility Index.
Figure 4.1(continued)Pe
rcen
tIn
dex
Perc
ent
Inde
x
TABLE 4.1.
Proportion of Variance Explained by Principal Factors (Share)
Factor 1 Factor 2
Indonesia 0.41 0.22
Malaysia 0.31 0.24
Philippines 0.45 0.18
Singapore 0.45 0.19
Thailand 0.30 0.23
Source: IMF staff calculations.
©International Monetary Fund. Not for Redistribution

C
ha
pte
r4
Glo
bal Sp
illove
rs 7
1
TABLE 4.2.
Cross-Correlation of the Principal Factors with Global and Domestic Variables
US 10-year
Government
Bond Rate
VIX Index Net Portfolio
Flows
Policy Rate1 Domestic
10-year
Government
Bond Rate
Lending Rate Growth of Credit to
Private Sector2
Indonesia Factor 1 0.670370* 0.456806* �0.167171*** 0.678629* 0.980260* 0.738652* 0.174695**
Factor 2 0.284439* �0.216273** 0.229517* 0.235127* 0.107123 0.360456* �0.551433*
Malaysia Factor 1 0.529747* �0.302444* 0.030279 0.855638* �0.062190 0.757896* �0.069818
Factor 2 0.512834* �0.328599* 0.455342* �0.325326* 0.190464** 0.279002* �0.309277*
Philippines Factor 1 0.799873* 0.053589* 0.153588*** 0.799903* 0.909129* 0.946136* �0.352955*
Factor 2 0.097824 �0.224954** 0.147841 0.105539 0.011971 0.008761 0.586609*
Singapore Factor 1 0.776220* �0.332237* 0.311110* 0.069523 0.612826* �0.782458* �0.082982
Factor 2 �0.127999 �0.239292* 0.199834** 0.153374*** �0.321578* 0.370595* 0.474466*
Thailand Factor 1 0.564757* �0.079831 �0.034819 0.850952* 0.593241* �0.396958* 0.113971
Factor 2 0.521675* �0.079250 0.240941* 0.004379 0.514422* �0.667889* �0.201467**
Source: IMF staff estimates.
Note: VIX = Chicago Board Options Exchange Volatility Index.
*p < 0.01; **p < 0.05; ***p < 0.10.1For Singapore, NEER month-over-month growth was used for the variable “policy rate.”2Month-over-month growth of credit to private sector, minus inflation (month-over-month c growth).
©International Monetary Fund. Not for Redistribution

72 THE ASEAN WAY: SUSTAINING GROWTH AND STABILITY
Factor 1Factor 2
Factor 1Factor 2
Factor 1Factor 2
Standarderror
VIX Policy rateUS 10-year
bond yield
1. Indonesia: Variance Decomposition of Domestic Principal Factors (Average of 10 periods)
0
10
20
30
40
50
60
70
80
90
100
0
30
5
10
15
20
25
Standarderror
VIX Policy rateUS 10-year
bond yield
2. Malaysia: Variance Decomposition of Domestic Principal Factors (Average of 10 periods)
0
10
20
30
40
50
60
70
80
90
0
40
5
10
15
20
25
30
35
Standarderror
VIX Policy rateUS 10-year
bond yield
3. Philippines: Variance Decomposition of Domestic Principal Factors (Average of 10 periods)
82
94
84
86
88
90
92
0
12
2
4
6
8
10
Figure 4.2. Global Financial Shocks and Domestic Financial IndicatorsSh
are
Shar
eSh
are
Perc
ent
Perc
ent
Perc
ent
©International Monetary Fund. Not for Redistribution

Chapter4 Global Spillovers 73
EXTERNAL FACTORS, CREDIT SHOCKS, AND BUSINESS CYCLES
The role of external factors in driving emerging market economic growth is well
established.8 The approach in this section follows IMF 2014a and analyzes the
relationship between emerging market business cycles and external conditions by
8Studies analyzing the role of external conditions in emerging markets’ growth include Österholm and
Zettelmeyer 2007 for Latin America; Utlaut and van Roye 2010 for Asia; and Adler and Tovar 2012,
Akinci 2013, and Houssa, Mohimont, and Otrok 2013 for a more diverse group of emerging markets.
Factor 1Factor 2
Factor 1Factor 2
Source: IMF staff estimates.
4. Singapore: Variance Decomposition of Domestic Principal Factors (Average of 10 periods)
Standarderror
VIX Policy rate(right scale)
US 10-yeargovernmentbond yield
Standarderror
VIX Policy rate(right scale)
US 10-yeargovernmentbond yield
5. Thailand: Variance Decomposition of Domestic Principal Factors (Average of 10 periods)
88.0
91.0
88.5
89.0
89.5
90.0
90.5
0
8
1
2
3
4
5
6
7
84
98
86
88
90
92
94
96
0.0
5.0
0.5
1.0
1.5
2.0
2.5
3.0
3.5
4.0
4.5
Figure 4.2 (continued)Sh
are
Shar
e
Perc
ent
Perc
ent
©International Monetary Fund. Not for Redistribution

74 THE ASEAN WAY: SUSTAINING GROWTH AND STABILITY
assuming that global economic conditions are exogenous to small open emerging
market economies, at least on impact.9 Thus, the impact of external shocks on a
particular economy depends on how exposed the economy is to these shocks via
cross-border links and on how domestic policy stabilizers are allowed to work.
Over time, the cumulated effect on domestic growth may be amplified or damp-
ened as domestic policies respond further to external shocks. Although the frame-
work assumes that any contemporaneous feedback effects from emerging market
economies’ domestic conditions within a quarter are small enough to be ignored,
it allows for these domestic conditions to affect global conditions with a lag.
The chapter uses a Bayesian structural VAR model to quantify the growth
effects of external shocks. The external variables (“external block”) include US real
GDP growth, the 10-year US Treasury bond rate, the VIX, and economy-specific
terms-of-trade growth. Within the external block, the structural shocks are iden-
tified using a recursive approach, based on the above order. In other words, US
growth shocks can affect all other variables within a quarter, whereas shocks to
other variables can affect US growth only with a lag of at least one quarter. Taken
together, the US variables in the external block serve as a proxy for advanced
economy economic conditions.10 Changes in emerging market financing condi-
tions arising from factors other than external demand conditions are incorporated
through the VIX, a measure of global risk aversion. IMF 2014a also shows the
rising importance of economic activity in China, directly and indirectly through
changes in terms-of-trade growth, to represent factors other than changes in
demand from advanced economies.
The impact of external shocks on economic activity could be transmitted
through different channels and amplified by structural features and domestic poli-
cies. The baseline specification for domestic variables (“internal block”) includes
real GDP growth, domestic credit growth to the private sector, the domestic
short-term interest rate, the rate of appreciation of the economy’s real exchange rate
against the US dollar, and domestic lending rates.11 This specification captures the
more traditional transmission channels of external demand and global financing
conditions through trade channels and the domestic monetary policy response,
including credit, interest, and exchange rate channels. However, as highlighted in
the previous section, there may be an additional channel more closely related to the
VIX operating through capital flows and asset prices. Thus, an alternative specifica-
tion includes net capital flows, the foreign exchange sovereign bond yield (from the
9On the other hand, see IMF 2017b for the impact of external factors on trend or medium-term
growth in emerging markets.10With the federal funds rate at or near zero and the Federal Reserve’s focus on lowering US
interest rates at the long end following the global financial crisis, the 10-year Treasury bond rate or
term premium is likely a better proxy for US monetary policy for the analysis. That said, results are
robust to using alternative US interest rates.11The baseline model is estimated individually for each ASEAN-5 economy using quarterly data
from the first quarter of 2000 through the first quarter of 2017. An alternative specification to the
baseline to include real estate prices did not significantly change the results and is not reported here.
©International Monetary Fund. Not for Redistribution

Chapter4 Global Spillovers 75
JPMorgan Emerging Market Government Bond Index [EMBIG]), local currency
10-year government bond yield, and equity prices, with the latter a proxy for net
worth of corporations to reflect financial accelerator effects.12
The ASEAN-5 are sensitive to both real and financial external shocks
(Figure 4.3). External demand shocks from the United States and China have a
significant impact on real economic activity, as expected, with a rising role for
China. Chinese GDP shocks have a greater impact than US GDP on Singapore
and Thailand, possibly reflecting their role as hubs of regional supply chains in
Asia. On the other hand, country-specific global commodity prices, which are
partly affected by Chinese shocks, have an additional significant impact in most
countries, particularly in Indonesia and Malaysia. Global financial shocks also
have a large and significant impact on real economy dynamics. The VIX, a mea-
sure of global risk aversion, or US interest rates—or both—are consistently a
major influence on growth dynamics in all ASEAN-5 countries, with a rise in the
VIX or US interest rates tightening domestic financial conditions and having a
contractionary impact on economic activity. Higher US interest rates associated
with rising global economic activity are also at times related to higher growth in
the ASEAN-5, albeit with the contractionary effect dominating, on average.
Variance decompositions corroborate the view that global shocks, in particular
global financial shocks, are a major driver of growth dynamics in the ASEAN-5.
External shocks have a pervasive impact on the economy, operating partly
through traditional monetary transmission mechanisms. Global financial factors
such as US interest rate or VIX shocks have a strong influence on the traditional
interest rate, credit, and exchange rate channels of monetary transmission, with a
subsequent impact on real economic activity. Short-term interest rates, in partic-
ular, appear to be driven largely by global factors, raising the question as to
whether financial globalization has weakened monetary autonomy in the
ASEAN-5 countries despite the greater exchange rate flexibility observed since the
Asian financial crisis (Chapter 2). Real exchange rate dynamics are driven by
global financial shocks as well, with the Philippines and Thailand also affected by
domestic credit and terms-of-trade shocks. Singapore’s real effective exchange
rate, with its unique, nominal effective exchange rate–based inflation-targeting
regime, is influenced by a more diverse set of factors. Domestic bank credit to the
private sector is determined by a more balanced set of global and other domestic
shocks, including policy variables, suggesting that it may be more amenable to
12The model is estimated individually for each ASEAN-5 economy using quarterly data from the
first quarter of 2000 through the first quarter of 2017. The focus is on the period after the 1990s,
given the significant structural breaks (for example, the Asian financial crisis) and shifts in policies
in these economies during this time. The number of variables and lags chosen for the specification
results in a generous parameterization relative to the short sample length. As a result, degrees of
freedom are limited such that standard VAR techniques may yield imprecisely estimated relation-
ships that closely fit the data—a problem referred to as “overfitting.” A Bayesian approach, as advo-
cated by Litterman (1986), is adopted to overcome this problem. This approach allows previous
information about the model’s parameters to be combined with information contained within the
data to provide more accurate estimates (see IMF 2014a).
©International Monetary Fund. Not for Redistribution

76 THE ASEAN WAY: SUSTAINING GROWTH AND STABILITY
ID credit JIBOR ID REER ID lending rateUS GDP US term premium VIX China GDP ID terms of trade
MY 3-month T-bill rateMY credit MY REER MY lending rateUS GDP China GDPUS term premium VIX MY terms of trade
US GDP China GDPUS term premium VIX PH terms of trade
PH 3-month T-bill ratePH credit PH REER PH lending rate
1 3 4 5 9 107 862
1. Indonesia: Variance Decomposition of Domestic Activity (Share of own shock excluded)
1 3 4 5 9 107 862
2. Malaysia: Variance Decomposition of Domestic Activity (Share of own shock excluded)
1 3 4 5 9 107 862
3. Philippines: Variance Decomposition of Domestic Activity (Share of own shock excluded)
0
100
102030405060708090
0
100
102030405060708090
0
100
102030405060708090
Period
Period
Period
Figure 4.3. Domestic Activity and External Shocks (Baseline Model)Sh
are
Shar
eSh
are
©International Monetary Fund. Not for Redistribution

Chapter4 Global Spillovers 77
policy actions. Both credit demand and credit supply factors appear to be at play,
with real lending rates only one of many factors affecting credit growth paths.
External shocks are also amplified and intermediated through the domestic
financial system, partly channeled through capital flows (Figure 4.4). Impulse
response functions of alternative specifications including more asset price and bal-
ance sheet variables suggest an amplification of global financial shocks through the
financial system. The role of capital flows in transmitting and amplifying global
shocks is unambiguous in all countries (IMF 2014b). However, the transmission
US GDP China GDPUS term premium SG terms of tradeVIX
SG 3-month T-bill rate SG REERSG credit SG lending rate
US GDP China GDPUS term premium TH terms of tradeVIX
TH 3-month T-bill rate TH REERTH credit TH lending rate
1 3 4 5 9 107 862
4. Singapore: Variance Decomposition of Domestic Activity (Share of own shock excluded)
1 3 4 5 9 107 862
5. Thailand: Variance Decomposition of Domestic Activity (share of own shock excluded)
Figure 4.3 (continued)
Source: IMF staff estimates.Note: Cholesky ordering: (1) external factors: US GDP, US interest rate, VIX, and China GDP; (2) domestic factors: terms of trade, GDP, domestic credit, short-term interest rate, REER, and lending rate. ID = Indonesia; JIBOR = Jakarta interbank offered rate; MY = Malaysia; PH = Philippines; REER = real effective exchange rate; SG = Singapore; TH = Thailand; VIX = Chicago Board Options Exchange Volatility Index.
0
100
102030405060708090
0
100
102030405060708090
Period
Period
Shar
eSh
are
©International Monetary Fund. Not for Redistribution

78 THE ASEAN WAY: SUSTAINING GROWTH AND STABILITY
ID EMBIG spread ID 10-year government bond yield ID REER ID lending rateUS GDP ID terms of tradeUS term premium China GDP
MY EMBIG spread MY 10-year government bond yield MY equity priceUS GDP MY terms of tradeChina GDP
PH REER PH equity pricePH 10-year government bond yieldPH EMBIG spreadPH terms of tradeChina GDP
US GDP US 10-year government bond yield
1 3 4 5 9 107 862
1. Indonesia: Variance Decomposition of Domestic Activity (Share of own shock excluded)
2. Malaysia: Variance Decomposition of Domestic Activity (Share of own shock excluded)
Figure 4.4. Global Factors, Net Capital Flows, and Domestic Activity(Alternative Model)
0
100
20
40
60
80
Period
Perc
ent
1 3 4 5 9 107 8620
100
20
40
60
80
Period
Perc
ent
3. Philippines: Variance Decomposition of Domestic Activity (Share of own shock excluded)
1 3 4 5 9 107 8620
100
20
40
60
80
Period
Perc
ent
©International Monetary Fund. Not for Redistribution

Chapter4 Global Spillovers 79
channels are country specific and depend on external exposures, structural factors,
and policies. For example, in Indonesia, real lending rates seem to be an important
source of economic fluctuations, with yields of domestic government bonds with a
substantial foreign exposure significantly explaining their evolution. In other
ASEAN-5 economies, equity prices play a significant role in amplifying global
financial factors and capital inflows, perhaps through financial accelerator effects
that reduce the external finance premium and borrowing costs to firms. Interestingly,
local-currency-denominated borrowing from the domestic financial system through
SG 10-year government bond yield SG equity priceSG CEMBI spreadSG terms of trade
US GDP US corporate credit spread China GDP
TH credit TH 10-year government bond yield TH equity price
US GDP TH terms of tradeUS terms of trade China GDP
Source: IMF staff estimates.
(2) domestic factors: terms of trade, GDP, emerging market spread, 10-year sovereign bond yield, REER,
EMBIG = JPMorgan
1 3 4 5 9 107 862
4. Singapore: Variance Decomposition of Domestic Activity (Share of own shock excluded)
5. Thailand: Variance Decomposition of Domestic Activity (Share of own shock excluded)
0
100
20
40
60
80
Period
Perc
ent
1 3 4 5 9 107 8620
100
20
40
60
80
Period
Perc
ent
Figure 4.4 (continued)
©International Monetary Fund. Not for Redistribution

80 THE ASEAN WAY: SUSTAINING GROWTH AND STABILITY
bank credit or bonds appears more important than external financing spreads of the
sovereign (EMBIG) or firms (JPMorgan Corporate Emerging Markets Bond
Index), indicating that reliance on foreign-currency-denominated borrowing has
diminished since the Asian financial crisis (see Chapter 3).
INTEREST RATE SPILLOVERS
Although the influence of global risk aversion on emerging market equity prices
has been carefully studied (IMF 2014b; Yilmaz 2010), a closer look at spillovers
on ASEAN-5 countries’ domestic interest rates is needed, given their direct impli-
cations for the monetary and financial policy framework. How “reserve currency”
monetary policies are transmitted to domestic long-term sovereign bond yields is
of particular interest given that they act as a benchmark for pricing corporate
bonds and household mortgages. The influence of global financial factors and risk
aversion on domestic retail bank rates, directly or indirectly, through the mone-
tary transmission mechanism is also important given the dominance of banks in
the ASEAN-5 economies.13
Spillovers of Global Financial Shocks on Domestic Long-Term Sovereign Bond Yields
The methodology follows Peiris 2013, estimating an exponential generalized
autoregression conditional heteroscedastic (EGARCH [1,1]) model of sovereign
bond yields in the ASEAN-5 economies during 2000‒15 using a comprehensive set
of macro-financial variables including global factors. The results show that a decline
in the shadow US federal funds rate14 reduces long-term government bond yields in
all ASEAN-5 economies. An increase in the US term premium, such as during the
so-called taper tantrum episode in 2013, also results in higher long-term bond
yields in all ASEAN-5 economies. The results indicate that a rise in the shadow
federal funds rate and US term premium could have a greater impact on Indonesia
and the Philippines (Table 4.3). Greater global risk aversion proxied by the VIX has
a mixed effect on long-term rates, with a rise in the VIX increasing yields in
Indonesia and the Philippines while lowering yields in Thailand, probably reflecting
the greater home bias of Thai financial institutions. Robust fundamentals such as
stronger current account balances and lower public debt tend to keep bond yields
down. Expectations of currency depreciation can also drive bond yields higher. On
an interesting note, better growth expectations often result in lower bond yields
13This section is focused on estimating global spillovers on ASEAN-5 interest rates since 2000,
taking into account unconventional monetary policies in advanced economies. For a more detailed
focus on the impact of unconventional monetary policies and their potential unwinding on emerg-
ing markets, see Chen, Mancini-Griffoli, and Sahay 2014 and Eichengreen and Gupta 2014.14The federal funds rate provides the conventional measure of the US monetary policy stance, but at
a near-zero rate since the end of 2008 it cannot capture the role of unconventional monetary policy.
This prompts the consideration of other measures, including a shadow short rate (Krippner 2014).
The shadow short rate is computed using estimates from a two-state variable shadow yield curve and
has historically tracked the actual federal funds rate very closely, before reaching the zero lower bound.
©International Monetary Fund. Not for Redistribution

C
ha
pte
r4
Glo
bal Sp
illove
rs 8
1
TABLE 4.3.
Determinants of Sovereign Bond Yields (Ten-year government bond)1,2
Domestic Factors External Factors
Debt-to-GDP Expected GDP
(real % change,
1-yr forecast)
Inflation Current Account
Balance in
% of GDP (�1)
Expected
Exchange Rates
(1-yr forecast)
Share of Foreign
Holdings in Total LCY
Government Bonds
VIX Effective Federal
Funds Rate
US Term
Premium
Indonesia 0.062333* �2.080023* 0.227762* 0.11060 0.04632** 0.37055** 0.803245*
�0.046404** �0.519522 0.274776* 0.000656* �0.174364* 0.033914** 0.110244 0.63379*
Malaysia 0.018206 �0.194963*** 0.08196** 0.013592 �0.005650 0.095469 0.142382
�0.004524 0.112354 0.048385** 0.455059* �0.013591 0.000604 �0.034009 0.174713*
Philippines 0.093204* �0.899722* 0.024455 �0.178439* 0.015214* 0.41316* 0.527717*
0.118536* �0.642977** 0.208446* 0.187917* �0.003698 0.10768 0.605144*
Singapore �0.008626* �0.148974* �0.085395* �0.019263 0.003095 0.181435* 0.309268*
�0.007277** �0.029602 �0.041678*** 1.686303* �0.004503 0.051912 0.218736*
Thailand �0.03336** 0.140961 0.046901 �0.045019* �0.00817 0.269024* 0.411737*
�0.107366 0.163451 0.10453* 0.066449* 0.05807** 0.001842 0.288077* 0.48909*
Source: IMF staff estimates.
Note: LCY = local currency; VIX = Chicago Board Options Exchange Volatility Index; yr = year.
*p < 0.01; **p < 0.05; ***p < 0.10.1The coefficients reflect the marginal increase in interest rates, in percent, of a 1 percentage point rise in the explanatory variables.2Results of alternative specification considering changes in economy-specific terms of trade remain robust.
©International Monetary Fund. Not for Redistribution

82 THE ASEAN WAY: SUSTAINING GROWTH AND STABILITY
than vice versa, suggesting that investors may see better growth prospects as a sign
of improved creditworthiness rather than just a cyclical consideration. Overall, the
susceptibility of long-term bond yields to global factors is consistent with the high
degree of foreign participation in the ASEAN-5 economies, with foreign portfolio
capital flows being a key channel of spillovers, albeit with expectations and domestic
residents continuing to play a significant role.15
Spillovers of Global Shocks on Retail Bank Interest Rates
Spillovers of global factors to retail bank rates in the ASEAN-5 countries were
investigated following the approach of Ricci and Shi (2016) by estimating the
domestic and global determinants of both deposit and loan rates (Tables 4.4 and
4.5).16 In addition, the specification allows for liquidity effects and rigidities in
interest rate transmission. The results indicate that global financial factors signifi-
cantly affect bank behavior in the ASEAN-5 economies except possibly for
15The degree of foreign participation has a direct impact on sovereign bond yields in the ASEAN-5
as in other emerging markets (see Peiris 2013), while the role of global financial factors also remains
significant. The impact of quantitative easing in the euro area and Japan was not distinguishable with
US financial variables, which are the dominant global factor for the ASEAN-5. The increasing spill-
overs from China to emerging markets’ financial markets, as reported in IMF 2016b, were also not
discernible in the quarterly data from 2000–15 given the frequency of the sample.16The empirical methodology follows Ricci and Shi 2016 in assessing the robustness of the find-
ings to alternative specifications and subsample estimations, but the results were largely unchanged
from the ordinary least squares estimates below for the full sample period, allaying concerns of
omitted variable bias and structural breaks. The robustness of the results to alternative publicly
available retail bank rate data was also tested, although supervisory data on bank deposit and loan
rates were unavailable and may provide a more accurate measure of financing costs.
TABLE 4.4.
Determinants of Deposit Rates1,2
Domestic Factors External Factors
Policy Rate Reserve
Money Gap
Deposit
Interest
Rate (�1)
VIX Federal
Funds Rate
US Term
Premium
Indonesia 0.027175** �0.0000005 0.933521* �0.000949 0.008974 0.027535
0.148977* �0.000002 �0.009033 0.395125* 0.607063*
Malaysia 0.043452* �0.00000099** 0.941046* �0.001112* 0.002053 0.013723*
0.051323 0.0000126* �0.00359** 0.094911* 0.085377*
Philippines 0.064288*** 0.000000 0.888499* 0.001056 �0.004274 0.022956
0.693344* �0.00000269* �0.003013 �0.050155 0.241218*
Singapore �0.000592 0.000001 0.025152* 0.001321* 0.017002* �0.002479
�0.001191 0.000000 0.001087* 0.029868* 0.015474*
Thailand 0.051272** 0.000112 0.87608* �0.002416 0.000888 0.009568
0.309664* �0.000103 �0.008819** 0.07583* 0.022943
Source: IMF staff estimates.
Note: NEER = nominal effective exchange rate; VIX = Chicago Board Options Exchange Volatility Index.
*p < 0.01; **p < 0.05; ***p < 0.10.1For Singapore, NEER month-over-month growth was used for the variable “policy rate.”2The coefficients reflect the marginal increase in interest rates, in percent, of a 1 percentage point rise in the explanatory
variables.
©International Monetary Fund. Not for Redistribution

C
ha
pte
r4
Glo
bal Sp
illove
rs 8
3
TABLE 4.5.
Determinants of Lending Rates1,2
Domestic Factors External Factors
Policy Rate Reserve Money Gap Lending Interest
Rate (�1)
Equity
Prices (�1)
VIX Federal Funds Rate US Term Premium
Indonesia 0.062514* �0.0000005 0.955839* 0.002044 �0.014678 �0.011645
0.072285 �0.0000066 0.01471*** 0.674774* 0.829765*
�0.011667 �0.000002 �0.000707* 0.005535 0.277657* 0.16202**
Malaysia 0.025667 0.0000012 0.912929* �0.00141*** 0.032964* 0.027321**
0.029859 0.0000133* 0.009545* 0.383984* 0.243941*
0.540194* 0.000004 �0.001056* 0.000506 0.206565* 0.189615*
Philippines 0.198824** �0.0000002 0.73675* 0.008107 0.059109 0.152256**
0.832216* �0.00000247* 0.027624* 0.189371** 0.627367*
0.337952* �0.000001 �0.000486* 0.014131** 0.161869** 0.05785
Singapore 0.000107 �0.0000008* 0.982296* 0.000065 0.000525 0.001203
0.004795 �0.0000006 0.001331* �0.00896* 0.000812
0.003364 �0.0000005 0.00003* 0.001496* �0.00692* 0.006025*
Thailand 0.051432* 0.000246 0.976985* �0.000205 �0.03145* �0.008097
0.167468* �0.000223 �0.010757*** �0.49984* �0.636922*
0.016985 0.000284 0.002209* 0.019712* �0.130755* �0.173794*
Source: IMF staff estimates.
Note: NEER = nominal effective exchange rate; VIX = Chicago Board Options Exchange Volatility Index.
*p < 0.01; **p < 0.05; ***p < 0.10.1For Singapore, NEER month-over-month growth was used for the variable “policy rate.” 2The coefficients reflect the marginal increase in interest rates, in percent, of a 1 percentage point rise in the explanatory variables.
©International Monetary Fund. Not for Redistribution

84 THE ASEAN WAY: SUSTAINING GROWTH AND STABILITY
Thailand.17 Lending rates are also affected by lagged equity prices, which are a
proxy for net worth of firms and reflect balance sheet or financial accelerator
effects affecting the cost of bank credit. However, the domestic policy rate and
liquidity conditions (measured by the deviation of reserve money from a
Hodrick-Prescott trend) also matter, affirming the important role of domestic
monetary policy and liquidity management in influencing credit cycles.
WHAT LIES AHEAD? SPILLOVERS FROM ALTERNATIVE GLOBAL SCENARIOS
Global policy uncertainties are currently elevated, and global shocks could have
large spillovers on the ASEAN-5 and emerging markets in general in the period
ahead. For instance, faster-than-expected monetary policy normalization in the
United States could tighten global financial conditions and trigger reversals in
capital flows to emerging market economies, along with US dollar appreciation
(Obstfeld 2017). Moreover, despite a decline in election risks, policy uncertainty
could well rise further, reflecting, for example, difficult-to-predict US fiscal poli-
cies (Obstfeld 2017). In China, failure to address financial stability risks and curb
excessive credit growth could result in an unwanted, abrupt growth slowdown,
with adverse spillovers to other countries through trade, commodity price, and
confidence channels.
This section uses a four-region version of the IMF’s Global Integrated
Monetary and Fiscal Model—consisting of China, the Philippines, the United
States, and the rest of the world—to quantify potential spillover effects to the
Philippines informed by the empirical analyses in the previous sections.18 The
simulations are based on three alternative scenarios that illustrate the global out-
look under the realization of different downside risks: (1) a faster-than-expected
pace of US monetary policy normalization that leads to an unexpected tightening
of global financial conditions, (2) an unproductive US fiscal expansion, and (3) a
funding shock in China that leads to lower-than-expected growth in China over
the medium term.
Faster Monetary Policy Normalization in the United States
In this scenario, faster-paced monetary policy normalization in the United States,
including through a gradual reduction in the Federal Reserve’s securities holdings,
causes a greater-than-expected tightening of global financial conditions. As dis-
cussed in IMF 2014c, this unexpected tightening could be triggered by market
misperceptions about the speed of future monetary policy normalization in the
United States. The US term premium rises by 20 basis points in 2018 and 2019,
17The increase in provisioning rates by the Bank of Thailand and tightening of banks’ lending stan-
dards, probably related to rising household leverage, may explain the different results for Thailand.18See Anderson and others 2013 for simulation properties of the Global Integrated Monetary
and Fiscal Model.
©International Monetary Fund. Not for Redistribution

Chapter4 Global Spillovers 85
and by 15 basis points in the subsequent two years (Bonis, Ihrig, and Wei 2017).
This increase in the US term premium, in turn, raises the term premiums in other
countries, consistent with the historical correlation for this type of shock.
Furthermore, sovereign bond yields in the Philippines increase temporarily in
2018 (based on the estimates in Table 4.3) as investors become more reluctant to
hold bonds issued by emerging markets.
Results: As financial conditions unexpectedly tighten, US real GDP falls by
0.5 percent in 2018 and 0.7 percent in 2019 (Figure 4.5). The Federal Reserve
responds to market fears quickly by easing its monetary stance relative to the
baseline, which helps contain the rise in US short-term interest rates. The adverse
spillover to the Philippines could be significant, with real GDP falling by close to
1 percent in 2018 and 2019. The increases in the sovereign risk premium and the
term premium raise the real interest rate and the external financing premium for
leveraged firms, leading to weaker investment. The increase in the user cost of
capital also reduces firm profitability and dividend payments to households and
lowers production and labor demand, leading to weaker consumption. In
response to weaker domestic private demand and the resulting moderate decline
in inflation, the authorities lower the nominal policy interest rate and increase
government spending. Improvement in the trade balance, which reflects mainly
lower imports and a weaker currency, partially offsets the output loss.
Unproductive US Fiscal Expansion
In this scenario, the United States embarks on a four-year debt-financed fiscal
expansion (2018–21) through a combination of reduced taxes on labor and cor-
porate income and increased infrastructure spending (IMF 2017c).19 After four
years, the US government adjusts its policy to stabilize the long-term
government-debt-to-GDP ratio. During the first two years, households and firms
take the fiscal stimulus as temporary in nature and behave accordingly. While
US monetary policy responds endogenously to the change in demand, the rest of
the world—except China and the Philippines—keeps policy rates at the effective
lower bound. The infrastructure spending is assumed to be unproductive, leading
to higher US inflation and faster normalization of the US term premium than
with productive infrastructure spending. Labor tax cuts go mostly to
wealthy households.
Results: During the fiscal expansion period, US real GDP rises by about
0.5 percent, and US monetary policy tightens in response to higher domestic
demand and inflation (Figure 4.6). Real US interest rates also rise, and the US
dollar appreciates in real effective terms. The US fiscal expansion affects the
Philippine economy through the interest rate and the trade channels. The net
19This scenario is based on the “unproductive” infrastructure spending scenario in Scenario Box 1
of the April 2017 World Economic Outlook (IMF 2017c). The latter, however, used the IMF’s G20
model for simulation. The estimation results here and in the World Economic Outlook are qualita-
tively similar, although the magnitude is generally smaller in this simulation.
©International Monetary Fund. Not for Redistribution
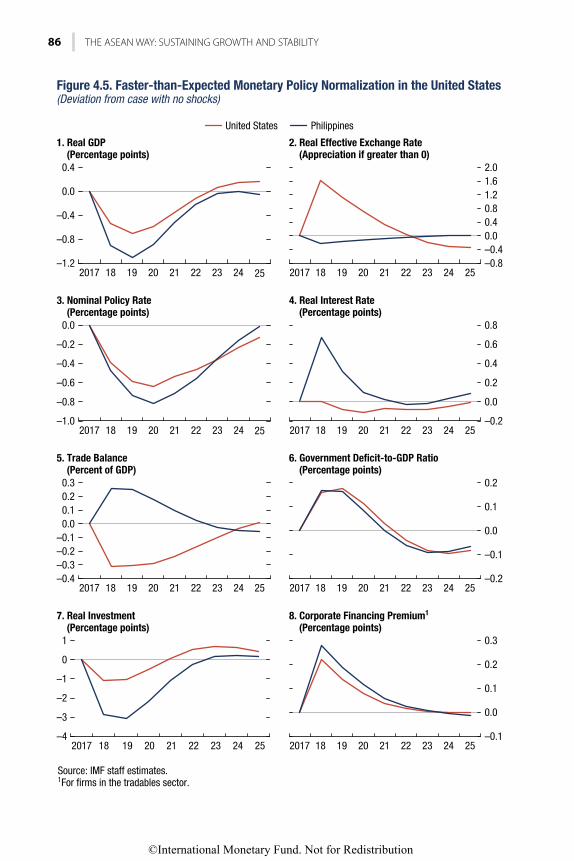
86 THE ASEAN WAY: SUSTAINING GROWTH AND STABILITY
United States Philippines
Source: IMF staff estimates.1
Figure 4.5. Faster-than-Expected Monetary Policy Normalization in the United States(Deviation from case with no shocks)
1. Real GDP (Percentage points)
2. Real Effective Exchange Rate (Appreciation if greater than 0)
4. Real Interest Rate (Percentage points)
(Percentage points)
8. Corporate Financing Premium1
(Percentage points)
3. Nominal Policy Rate (Percentage points)
5. Trade Balance (Percent of GDP)
7. Real Investment (Percentage points)
–1.2
0.4
–0.8
–0.4
0.0
2017 18 19 20 21 22 23 24 25 2017 18 19 20 21 22 23 24 25
2017 18 19 20 21 22 23 24 25
–0.8
2.0
–0.4
0.0
0.4
0.8
1.2
1.6
–1.0
0.0
–0.8
–0.6
–0.4
–0.2
2017 18 19 20 21 22 23 24 25–0.2
0.8
0.0
0.2
0.4
0.6
–0.4
0.3
0.1
0.2
–0.3
–0.2
–0.1
0.0
2017 18 19 20 21 22 23 24 25–0.2
0.2
–0.1
0.0
0.1
–4
1
–3
–2
–1
0
2017 18 19 20 21 22 23 24 25–0.1
0.3
0.0
0.1
0.2
2017 18 19 20 21 22 23 24 25
2017 18 19 20 21 22 23 24 25
©International Monetary Fund. Not for Redistribution
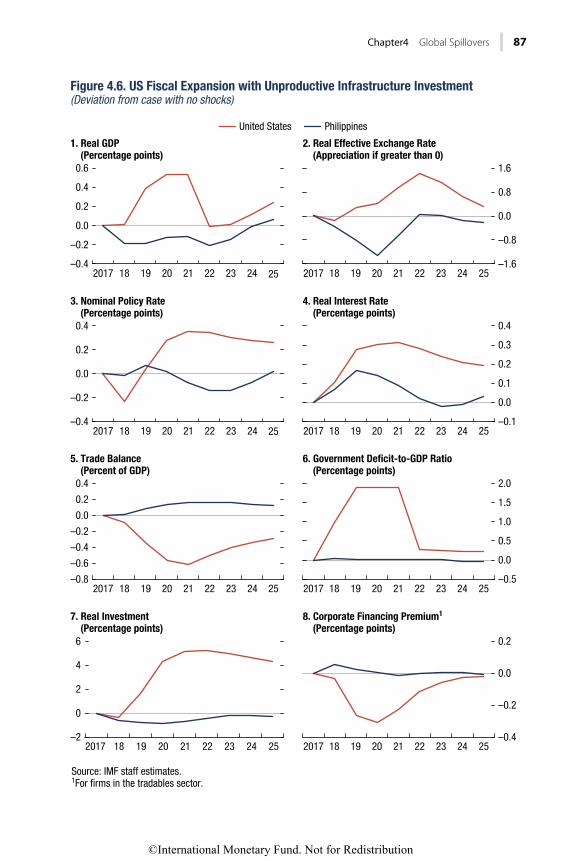
Chapter4 Global Spillovers 87
United States Philippines
–0.1
0.0
0.1
0.2
0.3
0.4
–0.5
0.0
0.5
1.0
1.5
2.0
–0.4
–0.2
0.0
0.2
0.4
0.6
–0.8
–0.6
–0.4
–0.2
0.0
0.2
0.4
–0.4
–0.2
0.0
0.2
0.4
–2
0
2
4
6
Source: IMF staff estimates.1
Figure 4.6. US Fiscal Expansion with Unproductive Infrastructure Investment(Deviation from case with no shocks)
1. Real GDP (Percentage points)
2. Real Effective Exchange Rate (Appreciation if greater than 0)
4. Real Interest Rate (Percentage points)
(Percentage points)
8. Corporate Financing Premium1
(Percentage points)
3. Nominal Policy Rate (Percentage points)
5. Trade Balance (Percent of GDP)
7. Real Investment (Percentage points)
2017 18 19 20 21 22 23 24 25 2017 18 19 20 21 22 23 24 25
2017 18 19 20 21 22 23 24 25
–1.6
1.6
–0.8
0.0
0.8
2017 18 19 20 21 22 23 24 25
2017 18 19 20 21 22 23 24 25
2017 18 19 20 21 22 23 24 25–0.4
0.2
–0.2
0.0
2017 18 19 20 21 22 23 24 25
2017 18 19 20 21 22 23 24 25
©International Monetary Fund. Not for Redistribution

88 THE ASEAN WAY: SUSTAINING GROWTH AND STABILITY
spillover impact on Philippine GDP is negative (about 0.2 percent) in the short
term because global financial conditions tighten more than enough to offset the
expected positive gains in trade.
Funding Shock and Lower Growth Path in China
In this scenario, China follows a lower growth path over the medium term owing
to a temporary but persistent funding shock. The shock could be triggered by
system-wide turbulence in the Chinese wholesale funding market or a run on
short-term asset management products issued by nonbank financial institutions,
as described in IMF 2017d. Under this scenario, real GDP growth falls about
2.5 percentage points below the baseline in 2018 and 2019, and remains below
the baseline over the medium term. Furthermore, sovereign risk premiums rise in
2018, by 100 basis points in China and by 25 basis points in other economies,
excluding the United States.
Results: Notwithstanding the significant output decline in China, the estimat-
ed spillovers to the Philippines are relatively moderate (Figure 4.7). Real GDP
declines by about 0.6 percent in 2018 and 2019. The external financing premium
for Philippine firms rises about 15 basis points in 2018. The currency remains
broadly stable in real effective terms, but depreciates by almost 1 percent against
the US dollar in real terms.
CONCLUSION
The rising sensitivity of domestic financial conditions in the ASEAN-5 countries
to global financial factors is a key macro-financial transmission channel for exter-
nal shocks. In the ASEAN-5 economies, two key macro-financial channels trans-
mit global financial shocks: one is related to the VIX and affects largely capital
flows and asset prices and the other is linked to US interest rates and affects
mainly monetary and credit conditions.
The estimated macro-financial transmission of US interest rate and VIX
shocks suggests a significant and pervasive impact of global financial factors on
ASEAN-5 business cycle fluctuations, transmitted partly through capital flows.
The global shocks tend to be amplified by asset prices (“financial accelerator”
effects) and credit friction, with domestic short-term rates one of many factors
driving business cycles. The susceptibility of asset prices to global factors, partic-
ularly via the interest rate structure of the economy, raises the prospect that
financial globalization has weakened monetary autonomy in the ASEAN-5
despite the greater exchange rate flexibility observed since the Asian financial
crisis. Real economy factors, such as external demand from the United States and
more recently China, are also important, but global financial shocks tend to
dominate growth dynamics in the ASEAN-5.
The extensive global spillovers to the ASEAN-5 are likely to pose new chal-
lenges. Global policy uncertainty is high, and several global policy scenarios,
©International Monetary Fund. Not for Redistribution

Chapter4 Global Spillovers 89
China Philippines
Source: IMF staff estimates.1
Figure 4.7. Lower Growth in China(Deviation from case with no shocks)
1. Real GDP (Percentage points)
2. Real Effective Exchange Rate (Appreciation if greater than 0)
4. Real Interest Rate (Percentage points)
(Percentage points)
8. Corporate Financing Premium1
(Percentage points)
3. Nominal Policy Rate (Percentage points)
5. Trade Balance (Percent of GDP)
7. Real Investment (Percentage points)
2017 18 19 20 21 22 23 24 25 2017 18 19 20 21 22 23 24 25
2017 18 19 20 21 22 23 24 252017 18 19 20 21 22 23 24 25
2017 18 19 20 21 22 23 24 25
2017 18 19 20 21 22 23 24 25
2017 18 19 20 21 22 23 24 25
2017 18 19 20 21 22 23 24 25
–1.2
1.6
–0.8
–0.4
0.0
0.4
0.8
1.2
–0.2
1.0
0.0
0.2
0.4
0.6
0.8
–0.6
1.2
–0.4–0.20.00.20.40.60.81.0
–0.5
3.0
0.0
0.5
1.0
1.5
2.0
2.5
–3.0
0.5
–2.5
–2.0
–1.5
–1.0
–0.5
0.0
–0.6
1.2
–0.4–0.2
0.00.20.40.60.81.0
–10
2
–2
0
–8
–6
–4
–0.8
–0.4
0.0
0.4
0.8
1.2
–1.2
1.6
©International Monetary Fund. Not for Redistribution

90 THE ASEAN WAY: SUSTAINING GROWTH AND STABILITY
particularly those emanating from China and the United States, could spill over
significantly to emerging markets based on historical experience. Illustrative
model-based scenarios show that faster-than-anticipated monetary policy normal-
ization in the United States or an abrupt growth slowdown in China would hit
the ASEAN-5 economies hard through lower external demand and higher financ-
ing costs, warranting a policy response.
REFERENCES
Adler, Gustavo, and Camilo E. Tovar. 2012. “Riding Global Financial Waves: The Economic Impact of Global Financial Shocks on Emerging Market Economies.” IMF Working Paper 12/188, International Monetary Fund, Washington, DC.
Adrian, Tobias, and Nellie Liang. 2016. “Monetary Policy, Financial Conditions, and Financial Stability.” Staff Report 690, Federal Reserve Bank of New York.
Ahmed, Shaghil, and Andrei Zlate. 2013. “Capital Flows to Emerging Market Economies: A Brave New World?” Journal of International Money and Finance 48 Part B (November): 221–48.
Akinci, Ozge. 2013. “Global Financial Conditions, Country Spreads and Macroeconomic Fluctuations in Emerging Countries.” International Finance Discussion Paper 1085, Board of Governors of the Federal Reserve System, Washington, DC.
Anderson, David, Benjamin L. Hunt, Mika Kortelainen, Michael Kumhof, Douglas Laxton, Dirk V. Muir, Susanna Mursula, and Stephen Snudden. 2013. “Getting to Know GIMF: The Simulation Properties of the Global Integrated Monetary and Fiscal Model.” IMF Working Paper 13/55, International Monetary Fund, Washington, DC.
Bonis, Brian, Jane Ihrig, and Min Wei. 2017. “The Effect of the Federal Reserve’s Securities Holdings on Longer-Term Interest Rates.” FEDS Notes, April 20. https:/ / doi .org/ 10 .17016/ 2380 -7172 .1977.
Chen, Jiaqin, Tommaso Mancini-Griffoli, and Ratna Sahay. 2014. “Spillover from United States Monetary Policy on Emerging Markets: Different This Time?” IMF Working Paper 12/240, International Monetary Fund, Washington, DC.
Diebold, F. X., and K. Yilmaz. 2014. “On the Network Topology of Variance Decompositions: Measuring the Connectedness of Financial Firms.” Journal of Econometrics 182:119–34.
Eichengreen, Barry, and Poonam Gupta. 2014. “Tapering Talk: The Impact of Expectations of Reduced Federal Reserve Security Purchases on Emerging Markets.” Policy Research Working Paper 6754, World Bank, Washington, DC.
Houssa, Romain, Jolan Mohimont, and Chris Otrok. 2013. “Credit Shocks and Macroeconomic Fluctuations in Emerging Markets.” Working Paper 4281, CESifo Group, Munich.
International Monetary Fund (IMF). 2014a. “On the Receiving End? External Conditions and Emerging Market Growth before, during, and after the Global Financial Crisis.” In World Economic Outlook, Washington, DC, April.
———. 2014b. “How Do Changes in the Investor Base and Financial Deepening Affect Emerging Market Economies?” In Global Financial Stability Report, Washington, DC, April.
———. 2014c. “IMF Multilateral Policy Issues Report—2014 Spillover Report.” IMF Policy Paper, Washington, DC.
———. 2015. “Financial Spillovers in Asia: Evidence from Equity Markets.” In Regional Economic Outlook Update, Asia and Pacific, Washington, DC, October.
———. 2016a. “Financial Conditions in Asia and the Role of External Factors.” In Regional Economic Outlook Update, Asia and Pacific, Washington, DC, October.
———. 2016b. “The Growing Importance of Financial Spillovers from Emerging Market Economies.” In Global Financial Stability Report, Washington, DC, April.
———. 2017a. “Are Countries Losing Control of Domestic Financial Conditions?” In Global Financial Stability Report, Washington, DC, April.
©International Monetary Fund. Not for Redistribution

Chapter4 Global Spillovers 91
———. 2017b. “Roads Less Traveled: Growth in Emerging Market and Developing Economies in a Complicated External Environment.” In World Economic Outlook, Washington, DC, April.
———. 2017c. World Economic Outlook: Gaining Momentum?, Washington, DC, April. ———. 2017d, People’s Republic of China—Staff Report for the 2017 Article IV Consultation,
IMF Staff Country Report 17/247, Washington, DC.Koepke, Robin. 2015. “What Drives Capital Flows to Emerging Markets? A Survey of the
Empirical Literature.” Working Paper, Institute of International Finance, Washington, DC.Krippner, Leo. 2014. Documentation for United States Measures of Monetary Policy. Wellington:
Reserve Bank of New Zealand.Litterman, Robert B. 1986. “Forecasting with Bayesian Vector Autoregressions: Five Years of
Experience.” Journal of Business and Economic Statistics 4 (1): 25–38.Miranda-Agrippino, Silvia, and Hélène Rey. 2015. “World Asset Markets and the Global
Financial Cycle.” NBER Working Paper 21722, National Bureau of Economic Research, Cambridge, MA.
Nier, Erlend, Tahsin Saadi Sedik, and Tomas Mondino. 2014. “Gross Private Capital Flows to Emerging Markets: Can the Global Financial Cycle Be Tamed?” IMF Working Paper 14/196, International Monetary Fund, Washington, DC.
Obstfeld, Maurice. 2017. “A Firming Recovery.” IMFBlog, July 24. https:/ / blogs .imf .org/ 2017/ 07/ 23/ a -firming -recovery/ .
Österholm, Pär, and Jeromin Zettelmeyer. 2007. “The Effect of External Conditions on Growth in Latin America.” IMF Working Paper 07/176, International Monetary Fund, Washington, DC.
Peiris, Shanaka Jayanath. 2013. “Foreign Participation in Local Currency Bond Markets of Emerging Economies.” Journal of International Commerce, Economics and Policy 4 (3): 1‒15.
Rey, Hélène. 2013. “Dilemma Not Trilemma: The Global Financial Cycle and Monetary Policy Independence.” Paper presented at the 25th Jackson Hole Symposium, Wyoming, August 21–23.
———. 2016. “International Channels of Transmission of Monetary Policy and the Mundellian Trilemma.” NBER Working Paper 21852, National Bureau of Economic Research, Cambridge, MA.
Ricci, Luca, and Wei Shi. 2016. “Trilemma or Dilemma: Inspecting the Heterogeneous Response of Local Currency Interest Rates to Foreign Rate.” IMF Working Paper 16/47, International Monetary Fund, Washington, DC.
Utlaut, Johannes, and Björn van Roye. 2010. “The Effects of External Shocks on Business Cycles in Emerging Asia: A Bayesian VAR Model.” Working Paper 1668, Kiel Institute for the World Economy, Kiel, Germany.
Yilmaz, K. 2010. “Return and Volatility Spillovers among the East Asian Equity Markets.” Journal of Asian Economics 21 (3): 304–13.
©International Monetary Fund. Not for Redistribution

This page intentionally left blank
©International Monetary Fund. Not for Redistribution

93
Monetary and Exchange Rate Policy Responses
CHAPTER 5
INTRODUCTIONManaging the global financial cycle is a key challenge for Association of Southeast Asian Nations–5 (ASEAN-5) monetary frameworks. The results presented in Chapter 4 suggest there is a global financial cycle emanating from changes in US monetary policy and global risk aversion that drives domestic financial con-ditions and business cycles in the ASEAN-5 economies. This discovery calls into question the traditional “trilemma” view of the independence of monetary policy with a flexible exchange rate because a flexible exchange rate alone is unable to fully insulate economies from the global financial cycle when the capital account is highly open and financial flows are driven by monetary conditions in the United States (Rey 2013). The domestic monetary policy response to changing financial conditions and the degree of monetary autonomy retained in such an environment are an open question (Edwards 2015; Obstfeld 2015). Although the observed co-movement of interest rates across countries could be the result of limited monetary autonomy, it could alternatively reflect the behavior of fully independent central banks that react to synchronized and interdependent eco-nomic cycles. This chapter revisits this question by estimating monetary policy reaction functions, or Taylor rules, and the degree of monetary autonomy in the ASEAN-5.
Volatile capital flows can complicate macroeconomic management. Greater exchange rate flexibility helped the ASEAN-5 retain a degree of monetary policy autonomy, but asset prices and credit conditions were susceptible to global finan-cial factors and volatile capital flows. To lean against the wind of capital inflows, policymakers have relied on, among other tools, macroprudential and micropru-dential measures, capital flow management measures, countercyclical fiscal policy, and foreign exchange market intervention (IMF 2012). The effects of many of these policies—let alone their desirability—remain open to debate in the litera-ture (Blanchard, Adler, and de Carvalho Filho 2015). While progress on financial sector reforms and microprudential supervision has helped mitigate financial
This chapter was prepared by Hoe Ee Khor, Shanaka J. Peiris, Mia Agcaoili, Ding Ding, Jaime Guajardo, and Rui Mano.
©International Monetary Fund. Not for Redistribution

94 THE ASEAN WAY: SUSTAINING GROWTH AND STABILITY
stability risks (see Chapter 3), ASEAN-5 central banks also broadened the policy
toolkit to include macroprudential policies to address financial stability risks at
the systemic and sectoral levels (see Chapter 6 and IMF 2015a). This chapter
takes a closer look at the rationale for foreign exchange market intervention—in
combination with other policies—in the ASEAN-5 in response to the global
financial cycle, following a number of studies on emerging market economies (see
Benes and others 2013; BIS 2013; Escudé 2013; Ostry, Ghosh, and Chamon
2012). In this respect, the chapter seeks to contribute to the literature on the
optimal combination of policies used by emerging market economies to manage
external shocks (IMF forthcoming).
The policy responses to capital outflow episodes have drawn on lessons from
past crises. The global financial crisis was a clear reminder of the risks of sudden
stops of capital inflows. The chapter also outlines the policy responses to the
postcrisis capital outflow episodes in the ASEAN-5. These economies used a wide
range of policy tools to supplement monetary policy when addressing market
pressures and their economic impact, based on the lessons from the Asian finan-
cial crisis of the late 1990s.
MONETARY POLICY RESPONSE
Estimates of Taylor rule reaction functions are used to gauge monetary policy
responses and drivers (see Figure 5.1). The standard Taylor rule uses the output
gap and inflation (or deviation from its target) and policy interest rate settings to
estimate the policy reaction function (Taylor 1993). For Singapore, the rule is
modified to reflect the country’s use of the nominal effective exchange rate as the
main monetary policy instrument (see, for example, McCallum 2006; Parrado
2004; MAS 2013). Augmentation of the Taylor rule to an open-economy setting
permits analysis of the relevance of other variables, such as the exchange rate and
global uncertainty, in monetary policy settings in the ASEAN- 5 economies
(Clarida, Galí, and Gertler 2001; Taylor 2001; Svensson 1999). This chapter uses
a reduced form generalized method of moments estimation approach following
the literature on the estimation of Taylor rules (Clarida, Galí, and Gertler 1998;
Mohanty and Klau 2005).
The Taylor rule estimations provide valuable insights into policy directions.
The lagged dependent variable plays a large role in all ASEAN-5 economies,
indicating a strong preference for interest rate smoothing, except in Singapore,
which may be attributed to Singapore’s use of the nominal effective exchange rate
as its main policy instrument instead of interest rates. The analysis confirms the
strong role of actual or expected headline inflation, or both, in guiding policy rate
settings in all countries. Thailand, an inflation-targeting regime, stands out for its
stronger response to core inflation; the inflation-targeting framework for many
years focused on core inflation developments. On the other hand, the response to
output developments among the ASEAN-5 appears to be more subdued or diffi-
cult to distinguish from their concern for inflation.
©International Monetary Fund. Not for Redistribution

Chapter 5 Monetary and Exchange Rate Policy Responses 95
IDN MYS PHL SGP THA IDN MYS PHL SGP THA IDN MYS PHL SGP THA
Lagged policyrate
IDN MYS PHL SGP THA IDN MYS PHL SGP THA IDN MYS PHL SGP THA
Lagged policyrate
IDN MYS PHL SGP THA IDN MYS PHL SGP THA IDN MYS PHL SGP THA
Lagged policyrate
©International Monetary Fund. Not for Redistribution

96 THE ASEAN WAY: SUSTAINING GROWTH AND STABILITY
Nontraditional factors also play a role in the ASEAN-5 economies (Figure
5.2). Previous studies have found the exchange rate to have an impact on mone-
tary policy decisions in emerging market economies with inflation-targeting
regimes (Ostry, Ghosh, and Chamon 2012; Mohanty and Klau 2005).1 The
coefficient estimates are statistically significant and negative in some countries
and specifications, but the marginal impact is very small, of only a few basis
points, suggesting the real exchange rate played only a small role in affecting the
policy interest rate in the ASEAN-5 countries. In Indonesia and the Philippines,
the results indicate some resistance to raising policy interest rates when the real
exchange rate is appreciating, perhaps out of concern that it may attract further
capital inflows. The results for Malaysia and Thailand are generally not statistical-
ly and economically significant. Looking at the possible role of global shocks, a
dummy variable for the global financial crisis is strongly negative. The Chicago
Board Options Exchange Volatility Index (VIX) was also found to be significantly
1At a theoretical level, De Paoli (2009) shows that in the presence of terms-of-trade externalities,
the central bank’s loss function in a small open economy may also include the real exchange rate.
Mod
el 1
Mod
el 2
Mod
el 3
Mod
el 1
Mod
el 2
Mod
el 3
Mod
el 1
Mod
el 2
Mod
el 3
Mod
el 1
Mod
el 2
Mod
el 3
Indonesia Malaysia Philippines Thailand
Source: IMF staff estimates.Note: Estimates were generated by running Taylor-type rules, augmented with nontraditional factors as follows: Model 1 includes the real effective exchange rate,
are represented by the red dots, while the range represents ±1 standard deviation.
–0.05
–0.04
–0.03
–0.02
–0.01
0.00
0.01
0.02
©International Monetary Fund. Not for Redistribution

Chapter 5 Monetary and Exchange Rate Policy Responses 97
negative in most countries, as the policymakers attempted to cushion their econ-
omies from spikes in global risk aversion.
The role of US interest rates and degree of monetary autonomy are explored in
more detail given the finding of US interest rate spillovers on domestic financial
conditions.2 Higher US interest rates are generally associated with higher policy and
market rates in the ASEAN- 5 countries (see Chapter 4), in line with studies of other
emerging markets.3 This relationship calls into question the prediction of the clas-
sical trilemma that floating exchange rates enable open economies to implement an
independent monetary policy (Rey 2014; Hofmann and Takáts 2015). Although
the observed co-movement of interest rates across countries could be due to limited
monetary autonomy, it could alternatively reflect the behavior of fully independent
central banks that react to synchronized and interdependent economic cycles
(Caceres, Carrière-Swallow, and Gruss 2016). Whether these spillovers constitute
evidence of impaired monetary autonomy will depend crucially on whether the
policy decision was consistent with domestic developments or was above and
beyond what can be explained by the pursuit of domestic objectives.
DEGREE OF MONETARY AUTONOMY IN THE ASEAN-5
The degree of monetary policy autonomy in the ASEAN-5 is estimated by a
two-step approach, building on the Taylor rule estimates of the previous section
following Caceres, Carrière-Swallow, and Gruss (2016) (see Annex 5.1).
Autonomy-impairing spillovers correspond to those movements in domestic
interest rates that are triggered by foreign shocks but are not aligned with domes-
tic monetary objectives. The first stage of the regression approach estimates tradi-
tional Taylor rules, as in the previous section, as aligned with central banks’ ulti-
mate goal of maintaining price stability while fostering economic growth. The
exercise then obtains the residuals from the first-stage regression that are
unaligned with the objectives of monetary policy and then measures how much
of the movement of these residuals is attributable to US interest rates.4
The regression results for the ASEAN-5 show that policy rates are susceptible
to global monetary shocks, controlling for the interdependence of economic
cycles. The effective federal funds rate and shadow federal funds rate were found
to be significant factors for monetary policy movements in all of the ASEAN-5
economies (Table 5.1). Indonesia and the Philippines were the most responsive.
The deeper bond markets of Malaysia and Thailand were less affected, whereas
Singapore was more sensitive, reflecting its exchange-rate-based inflation-targeting
2In most settings, the theoretical literature has argued that the foreign monetary policy rate should
not be included as an additional argument in the central bank’s policy function (Woodford 2007).3The concept of monetary autonomy is intimately related to the notion that interest rates “spill
over” from large to small open economies or from reserve currency economies to non–reserve
currency economies.4The estimations considered various interest rates of reserve currency economies but report the
results for US interest rates because they were the most robust factors.
©International Monetary Fund. Not for Redistribution

98 THE ASEAN WAY: SUSTAINING GROWTH AND STABILITY
regime and highly open capital account. Finally, 10-year US Treasury bond rates
were also found to be significant factors for the Philippines and Indonesia.
The dynamic interactions of domestic and external factors can provide further
insights into policy responses. The single-equation regression approach above
does not take into account the potential feedback effects of shocks to monetary
policy rates on domestic macroeconomic factors. It also assumes contemporane-
ous relationships and does not fully capture inertial effects. To accommodate the
dynamic relationships, the regression models are extended to structural vector
autoregression (SVAR) models, following the methodology of Caceres,
Carrière-Swallow, and Gruss (2016). The analysis imposes block exogeneity on
global factors such that domestic conditions may only affect global factors with a
lag, and only global factors may affect domestic factors contemporaneously.
The ASEAN-5 enjoy varying degrees of monetary autonomy, with policy rates
continuing to respond largely to local factors despite significant spillovers to domes-
tic interest rates.5 The two-stage SVAR impulse response functions show that
Singapore’s domestic short-term interest rates are the most susceptible to movements
in external monetary and financial markets, which is to be expected, as the
trade-weighted nominal effective exchange rate nominal anchor and highly open
capital account provide little autonomy for setting domestic interest rates (Figure 5.3).
The Philippines and Indonesia also exhibited heightened sensitivity to the federal
funds rate and US 10-year sovereign yield, respectively. Malaysia and Thailand
showed less sensitivity to US interest rates. The variance decompositions showed a
similar pattern but highlighted that policy rates continued to be determined largely
by domestic factors, with most of the variance attributed to the countries’ own
5Many studies have found that even if floaters enjoy more autonomy than peggers, the
pass-through of international to domestic interest rates remains significant in both groups (some
examples include Frankel, Schmukler, and Servén 2004; and Edwards 2015).
TABLE 5.1.
Regression Estimates: US Monetary Policy Spillover to Domestic Policy Rates
Effective Federal
Funds Rate
VIX
Index
Treasury Bond
Yields
Indonesia 0.31*** 0.00 0.07**
(0.04) (0.01) (0.03)
Malaysia 0.04*** 0.00 0.00
(0.01) (0) (0.01)
Philippines 0.43*** �0.04*** 0.50***
(0.04) (0.01) (0.07)
Singapore 0.21*** �0.05*** 0.03
(0.06) (0.02) (0.1)
Thailand 0.13*** �0.02** 0.06
(0.03) (0.01) (0.05)
Source: IMF staff estimates.
Note: Standard errors are in parentheses.
P denotes the p-value as the probability of obtaining a result equal to or more extreme than observed. VIX = Chicago Board
Options Exchange Volatility Index.
*p � 0.1; **p � 0.05; ***p � 0.01.
©International Monetary Fund. Not for Redistribution

Chapter 5 Monetary and Exchange Rate Policy Responses 99
innovations or interest rate smoothing (Figure 5.4). However, US interest rates
explain a significant share of the variance of policy rates not attributed to domestic
factors. In addition, the share of variance of short-term market rates in the ASEAN-5
appears to be more susceptible to and driven by US interest rates, indicating lower
de facto monetary autonomy than implied by policy rates in some instances.
Beyond the impact on the policy rates, changes in external conditions signifi-
cantly affect domestic financial conditions and constrain monetary policy effective-
ness. Chapter 4 showed that global financial factors have a significant and pervasive
impact on the domestic economies, partly transmitted through capital flows and
domestic financial conditions. This investigation follows the approach of IMF 2014
to analyze the role of external factors in driving business cycles in the ASEAN-5,
extended to encompass the monetary transmission mechanism as in Chapter 4. The
impulse response function of monetary policy shocks in the ASEAN-5 shows sig-
nificant impacts on real GDP and inflation, but with a significant lag. Policy rates’
ability to dampen the volatility of growth is much weaker than that of inflation in
the ASEAN-5, which perhaps explains in part the weaker response to output devel-
opments in the Taylor rule estimates reported earlier. However, the variance decom-
positions show that monetary policy and domestic shocks do not explain variations
of business cycle fluctuations as much as external factors, which highlights the
importance of understanding global spillovers and the effectiveness of policy
SGP PHL THA MYS IDN
Source: IMF staff estimates.
1. Effective Federal Funds Rate (Standardized)
0.00
0.02
0.04
0.06
0.08
0.10
0.12
0.14
0.16
0.18
SGP PHL IDN MYS THA
2. Shadow Federal Funds Rate (Standardized)
0
0.02
0.04
0.06
0.08
0.1
0.12
0.14
0.16
0.18
SGP IDN THA PHL MYS
3. US 10-Year Government Bond Yields
0.00
0.02
0.04
0.06
0.08
0.10
0.12
0.14
0.16
0.18
Figure 5.3. Twelve-Month Cumulative Response of Domestic Policy Rates to US Policy Rates and Other Global Factors
©International Monetary Fund. Not for Redistribution

100 THE ASEAN WAY: SUSTAINING GROWTH AND STABILITY
combinations (see IMF, forthcoming). This understanding, in turn, is based on how
key macroeconomic aggregates and financial prices (mainly interest rates, exchange
rates, and domestic financing conditions) respond to the external factors.
Effectiveness is thus intertwined with macroeconomic and other policy transmis-
sion channels and any potential interactions between these policies. Global com-
modity prices, proxied by country-specific terms-of-trade changes, also have a sig-
nificant impact, particularly on inflation dynamics in the ASEAN-5, further
reducing the efficacy of monetary policy in influencing inflation.
EXTERNAL ADJUSTMENT TO CAPITAL FLOWS IN THE ASEAN-5
Global financial cycles have also complicated external policymaking in the
ASEAN-5 economies. These economies experienced a surge in gross capital inflows
in the period of low volatility (as measured by the VIX) before the global financial
crisis and in the period of unconventional monetary policies in advanced economies
after the crisis (Figure 5.5). As noted in IMF 2013, there are two ways in which
countries can adjust to a surge in gross capital inflows: financial adjustment through
MYS PHL THA SGP IDN
EFFR
(sta
ndar
dize
d)U
S 10
Y go
v't y
ield
EFFR
(sta
ndar
dize
d)U
S 10
Y go
v't y
ield
EFFR
(sta
ndar
dize
d)U
S 10
Y go
v't y
ield
EFFR
(sta
ndar
dize
d)U
S 10
Y go
v't y
ield
EFFR
(sta
ndar
dize
d)U
S 10
Y go
v't y
ield
Source: IMF staff estimates.
EFFR = effective federal funds rate; 10Y = 10-year.
0.0
0.5
1.0
1.5
2.0
2.5
3.0
3.5
4.0
4.5
5.0
THA IDN SGP MYS PHL
0.0
1.0
2.0
3.0
4.0
5.0
6.0
7.0
0.0
0.5
1.0
1.5
2.0
2.5
3.0
3.5
4.0
4.5
5.0
1. Percentage of Policy Rate Residual Variance Explained by Standardized Effective Federal Funds Rate
2. Percentage of Policy Rate Residuals Explained by US 10-Year Sovereign Bond Yields
3. Percentage of Money Market Rate Residual Variance Explained by Foreign Factors
Figure 5.4. Variance Decomposition of the Two-Stage Vector Autoregression
Indonesia
Malaysia
Philippines
Singapore
Thailand
©International Monetary Fund. Not for Redistribution

Chapter 5 Monetary and Exchange Rate Policy Responses 101
Reserves accumulation
–8
8
–6
–4
–2
0
2
4
6
Mar
-200
0M
ar-0
1M
ar-0
2M
ar-0
3M
ar-0
4M
ar-0
5M
ar-0
6M
ar-0
7M
ar-0
8M
ar-0
9M
ar-1
0M
ar-1
1M
ar-1
2M
ar-1
3M
ar-1
4M
ar-1
5M
ar-1
6
Mar
-200
0M
ar-0
1M
ar-0
2M
ar-0
3M
ar-0
4M
ar-0
5M
ar-0
6M
ar-0
7M
ar-0
8M
ar-0
9M
ar-1
0M
ar-1
1M
ar-1
2M
ar-1
3M
ar-1
4M
ar-1
5M
ar-1
6
0
–60
30
–50
–40
–30
–20
–10
10
20
Mar
-200
0M
ar-0
1M
ar-0
2M
ar-0
3M
ar-0
4M
ar-0
5M
ar-0
6M
ar-0
7M
ar-0
8M
ar-0
9M
ar-1
0M
ar-1
1M
ar-1
2M
ar-1
3M
ar-1
4M
ar-1
5M
ar-1
6
Mar
-200
0M
ar-0
1M
ar-0
2M
ar-0
3M
ar-0
4M
ar-0
5M
ar-0
6M
ar-0
7M
ar-0
8M
ar-0
9M
ar-1
0M
ar-1
1M
ar-1
2M
ar-1
3M
ar-1
4M
ar-1
5M
ar-1
6
–200
200
–150
–100
–50
0
50
100
150
–20
20
–15
–10
–5
0
5
10
15
16
–16
–12
–8
–4
0
4
8
12
1. Indonesia: Balance of Payments(Percent of GDP; four-quarter moving average)
2. Malaysia: Balance of Payments(Percent of GDP; four-quarter moving average)
3. Philippines: Balance of Payments(Percent of GDP; four-quarter moving average)
Mar
-200
0M
ar-0
1M
ar-0
2M
ar-0
3M
ar-0
4M
ar-0
5M
ar-0
6M
ar-0
7M
ar-0
8M
ar-0
9M
ar-1
0M
ar-1
1M
ar-1
2M
ar-1
3M
ar-1
4M
ar-1
5M
ar-1
6
Sources: Country authorities; and IMF staff estimates.
5. Thailand: Balance of Payments(Percent of GDP; four-quarter moving average)
4. Singapore: Balance of Payments(Percent of GDP; four-quarter moving average)
©International Monetary Fund. Not for Redistribution

102 THE ASEAN WAY: SUSTAINING GROWTH AND STABILITY
increases in resident capital outflows or reserves accumulation, or real adjustment
through an appreciation of the exchange rate and a larger current account deficit.
Before the global financial crisis, all ASEAN-5 economies adjusted through the
financial channel, with resident capital outflows rising in tandem with foreign cap-
ital inflows. But the effect was not sufficient to offset the massive influx of foreign
exchange because these economies were also running current account surpluses.
Thus, central banks complemented resident capital outflows with reserves accumu-
lation through foreign exchange market intervention to avoid an excessive appreci-
ation of their exchange rates. This policy response was in line with the goal of
rebuilding reserve buffers after the Asian financial crisis. Reserve levels were below
or at the lower end of the IMF’s reserve adequacy metric range early in the first
decade of the 2000s, but were brought to comfortable levels by 2007 (Figure 5.6).
The policy trade-off for the ASEAN-5 economies was more severe after the
global financial crisis. The surge in foreign capital inflows after the crisis as a result
of the unconventional monetary policies in advanced economies was not offset by
similar outflows from domestic residents, except in Singapore, a financial center,
and to some extent in Malaysia where capital markets were deeper. To avoid a
deterioration in current account balances (real adjustment), central banks stepped
up reserves accumulation, with mostly one-sided foreign exchange market inter-
vention, particularly in Indonesia, the Philippines, and Thailand, and to some
degree in Malaysia. This additional accumulation of reserves was not motivated
Metric lower bound
Metric upper bound
Indonesia
Malaysia
Philippines
Thailand
0
200
1. ASEAN-5: Gross International Reserves(Billions of US dollars)
2. ASEAN-5: Gross International Reserves(Percent of the IMF’s Reserve Adequacy Metric)
Sources: Country authorities and IMF staff estimates.
0
50
100
150
200
250
300
350
20
40
60
80
100
120
140
160
180
1997 2000 02 04 06 08 10 12 14 16 2000 02 04 06 08 10 12 14 16
Indonesia
MalaysiaPhilippinesThailand
Figure 5.6. ASEAN-5: International Reserves and Adequacy Metric
©International Monetary Fund. Not for Redistribution

Chapter 5 Monetary and Exchange Rate Policy Responses 103
purely by precautionary motives, given that reserve buffers were already at com-
fortable levels. Moreover, Indonesia also experienced a real adjustment, with its
current account balance moving from surplus to deficit in 2012. Reserves
remained within the adequacy range in Indonesia and Malaysia, and well above
this level in the Philippines and Thailand.6 The large accumulation of reserves and
partial sterilization in some instances resulted in a persistent liquidity overhang and
low domestic borrowing costs, which fueled credit growth and asset price inflation.
Countries were reluctant to tighten monetary policy as they were concerned that
doing so could attract even more capital inflows. Instead, they relied on macropru-
dential policies, but their effectiveness was limited in countries with financial
supervisory gaps, in which tighter prudential measures on banks could divert
financial intermediation to the less regulated nonbank sector (see Chapter 6).
Nonresident capital inflows and reserves accumulation have eased since 2013,
with foreign exchange market intervention becoming two sided and more sym-
metric. The ASEAN-5 economies’ foreign reserves have stabilized or fallen follow-
ing the taper tantrum episode in mid-2013. Nonresident capital inflows have
moderated or turned negative as US monetary policy has gradually normalized.
All ASEAN-5 economies, except Indonesia, experienced net capital outflows,
which sometimes surpassed the current account surplus, leading to more
two-sided foreign exchange market interventions. Indonesia’s current account
balance has remained in deficit, and the country has continued to receive net
capital inflows. But these inflows were not always sufficient to cover the current
account deficit, thus also leading to two-sided foreign exchange market interven-
tions. During the recent episodes of large capital outflows, the ASEAN-5 econo-
mies have relied more on currency depreciation than on reserves drawdown than
they had in previous outflow episodes (Figure 5.7). Reserves were drawn down,
in some cases below the IMF’s reserve adequacy metric range (Indonesia and
Malaysia), but have remained above this range in the Philippines and Thailand.
Foreign Exchange Intervention and Costs of Holding Reserves
The experiences of the ASEAN-5 economies in managing capital inflows indicate
that the move to a more flexible exchange rate regime was gradual (IMF 2016a).
The ASEAN-5 economies accumulated foreign reserves for precautionary reasons
between the Asian financial crisis and the global financial crisis and in response
to large capital inflows after the global crisis. In both cases foreign exchange mar-
ket interventions were generally one-sided, although central banks let their cur-
rencies partially appreciate while leaning against the wind. Since 2013, these
economies have stopped accumulating reserves, and foreign exchange market
intervention has become two sided and more symmetric. Exchange rates have
fluctuated more freely, serving as effective shock absorbers. Greater exchange rate
flexibility may also have mitigated the slowdown in capital inflows, as shown in
6Note that Malaysia’s exchange rate regime was reclassified to “floating” with effect from Septem-
ber 26, 2016, and the reserve adequacy level adjusted accordingly.
©International Monetary Fund. Not for Redistribution

104 THE ASEAN WAY: SUSTAINING GROWTH AND STABILITY
IMF 2016b, where more flexible exchange rate regimes lower the share of the
total variance in capital inflows explained by common global factors.
Despite the extensive use of foreign exchange market intervention, the
ASEAN-5 economies are not among the heaviest interveners, except for
Singapore. Adler, Lisack, and Mano (2015) built an indicator of the degree of
foreign exchange market intervention for 52 economies using monthly data
during 1996–2013 (see Figure 5.8). The indicator is defined as the standard
deviation of the central bank’s net foreign asset position divided by the sum of
that standard deviation and the standard deviation of the nominal exchange rate.
A higher value indicates more foreign exchange market intervention. Among the
ASEAN-5 economies, Indonesia has the lowest degree of intervention, compara-
ble to that of some advanced economies. The Philippines and Thailand follow,
with slightly higher degrees of foreign exchange market intervention. Malaysia is
near the median of the sample, while Singapore has a very high degree of inter-
vention, comparable to that of China, consistent with its exchange rate–based
monetary policy framework. However, this indicator does not measure whether
foreign exchange market intervention has been one or two sided and thus should
not be interpreted as a measure of exchange rate flexibility.
Studies have found a significant and persistent effect of foreign exchange
market intervention on the exchange rate level, validating the view that the move
to exchange rate flexibility in the ASEAN-5 economies has been gradual. Adler,
Dec. 05–Dec. 07 Sep. 08–Jun. 09 Dec. 09–Apr. 13 Apr. 13–Dec. 16
Sources: Bloomberg L.P.; and IMF staff estimates.
Figure 5.7. Changes in Exchange Rate and Foreign Reserves(Percent)
–40 –30 –20 –10 0 10 20 30 40–40
100
–20
0
20
40
60
80
Cha
nge
in in
tern
atio
nal r
eser
ves
Change in exchange rate versus US dollar
Indonesia
Malaysia
Philippines
Singapore
Thailand
Indonesia
Malaysia
Philippines
Singapore
Thailand
Indonesia
Malaysia
Philippines
Singapore
Thailand
Indonesia
Malaysia
Philippines
Singapore Thailand
©International Monetary Fund. Not for Redistribution

Chapter 5 Monetary and Exchange Rate Policy Responses 105
Lisack, and Mano (2015) investigate the impact of foreign exchange market
intervention on exchange rate levels using an instrumental-variables panel
approach for 52 economies based on monthly data during 1996–2013. They
find that intervention affects the exchange rate in a persistent manner. A pur-
chase of foreign currency equivalent to 1 percent of GDP causes the nominal
exchange rate to depreciate by 1.7 to 2.0 percent, with a half-life cycle of
between 12 and 23 months. These findings suggest that the persistent one-sided
foreign exchange market intervention by the ASEAN-5 economies before the
global financial crisis and during 2010–12 kept their currencies weaker than
they would have been otherwise. Since 2013, however, interventions have been
two sided and more symmetric, suggesting that although exchange rate fluctua-
tions have been smoothed, the average level of the exchange rate has not neces-
sarily been affected.
The ASEAN-5 central banks have generally sterilized their foreign exchange
market interventions to avoid inflation pressure arising from reserve inflows (IMF
2016a). The intensity of sterilization in the ASEAN-5 economies is estimated
following the approach of Aizenman and Glick (2008), regressing the central
bank’s annual change in net domestic assets (NDA) on the annual change in net
Figure 5.8. Degree of Exchange Rate Management
0.0
1.0
0.1
0.2
0.3
0.4
0.5
0.6
0.7
0.8
0.9
Can
ada
Sout
h Af
rica
Bra
zil
Col
ombi
aIn
done
sia
Japa
nM
exic
oU
nite
d Ki
ngdo
mTu
rkey
Aust
ralia
Pola
ndKe
nya
Bul
garia
New
Zea
land
Chi
leIn
dia
Ukr
aine
Cze
ch R
ep.
Swed
enPa
ragu
ayIs
rael
Phili
ppin
esKo
rea
Cro
atia
Paki
stan
Den
mar
kH
unga
ryTh
aila
ndN
orw
ayR
oman
iaR
ussi
aM
alay
sia
Arge
ntin
aU
rugu
ayPe
ruAr
men
iaLi
thua
nia
Mol
dova
Gua
tem
ala
Egyp
tC
osta
Ric
aB
otsw
ana
Kaza
khst
anVi
etna
mSr
i Lan
kaSw
itzer
land
Nig
eria
Liby
aH
ondu
ras
Sing
apor
eC
hina
Bol
ivia
Nic
arag
uaLe
bano
nH
ong
Kong
SAR
Saud
i Ara
bia
Uni
ted
Arab
Em
irate
sQ
atar
Source: IMF staff calculations.
j = , in which NFA and S denote the standard deviations of changes inj j
NFAj
NFA + Sj j
net foreign assets and in the nominal exchange rate, respectively. The last six bars correspond to countries with de jurepegs for most of the sample.
©International Monetary Fund. Not for Redistribution

106 THE ASEAN WAY: SUSTAINING GROWTH AND STABILITY
foreign assets (NFA), both scaled according to the level of the reserve money stock
12 months earlier (RM (−12)), as follows:
ΔNDA / RM ( − 12 ) = α + βΔNFA / RM ( − 12 ) + ε .
The regression is estimated using 1-month extended and 60-month rolling
windows. The coefficient measures the intensity of sterilization, with = –1
representing full sterilization of reserve changes, = 0 implying no sterilization,
and −1 < < 0 indicating partial sterilization. Average sterilization coefficients in
the ASEAN-5 economies have remained close to = –1 in the post–Asian finan-
cial crisis period (Figure 5.9; Table 5.2). In general, the ASEAN-5 countries have
attempted to fully sterilize their foreign exchange market intervention even
during the period of exceptionally easy monetary policy in advanced economies
(albeit with temporary periods of partial sterilization in Indonesia, Malaysia, and
the Philippines), when the buildup of reserves was especially strong and steriliza-
tion may have attracted greater capital inflows.
Foreign exchange market intervention and reserve holdings may be costly, and
their benefits need to be weighed against their costs. Adler and Mano (2016)
estimate the marginal cost of intervention (per US dollar) and the total cost of
rolling over reserve positions, both ex post and ex ante, for 73 economies during
2002–13. Ex post costs consider domestic and external interest rates as well as
actual realization of the exchange rate. These costs have been large because of
sizable deviations from uncovered interest rate parity and elevated foreign reserve
holdings. Although ex post costs measure the actual cost of foreign exchange
market intervention and reserve holdings, they are not relevant for policymaking
because ex post exchange rate realization is unknown at the time policy decisions
are made. Instead, the authors use ex ante costs estimated with survey- and
model-based exchange rate expectations. Their estimated ex ante costs are lower
than the ex post costs, but they are still sizable, with marginal costs of foreign
exchange market intervention ranging between 2 and 5.5 percent per US dollar,
and the total cost of holding reserves hovering between 0.2 and 0.7 percent of
GDP a year. The average ex ante total cost of holding foreign reserves for
Indonesia, the Philippines, Thailand, Malaysia, and Singapore are 0.6, 0.7, 0.9,
1.0, and 1.3 percent of GDP a year, respectively (Figure 5.10). The total cost for
the median emerging market economy, in comparison, is 0.5 percent of GDP a
year. Thus, the cost of holding foreign exchange reserves in the ASEAN-5 coun-
tries is on the high side of the sample, likely because of their large international
reserve holdings.
Cost-benefit analysis of reserve holdings requires a richer framework. Some
studies have analyzed the benefits and costs of holding reserves and have calculat-
ed the optimal level of reserves for emerging market economies. For example, to
address this question, Jeanne and Rancière (2011) calibrated a small open econ-
omy model in which reserves allow the country to smooth domestic absorption
in response to sudden stops in capital flows, but yield a lower return than the
interest rate on the country’s long-term debt. Plausible calibrations of the model
justify reserves of the order of magnitude observed in many economies. However,
©International Monetary Fund. Not for Redistribution

Chapter 5 Monetary and Exchange Rate Policy Responses 107
GFC Taper tantrum
GFC Taper tantrum
GFC Taper tantrum
GFC Taper tantrum
GFC Taper tantrum
1. Indonesia 2. Malaysia
3. Philippines
5. Thailand
4. Singapore
Source: IMF staff estimates.Note: Red line = 1-month extended window; blue line = 60-month rolling window for Indonesia, Malaysia, the Philippines, and Thailand, and 80-month rolling window for Singapore. Sample period for Indonesia, the Philippines, and Thailand: monthly data for 2001–15; for Malaysia and Singapore: monthly
–1.05
–0.60
–1.3
–0.6
–1.2
–1.1
–1
–0.9
–0.8
–0.7
–1.00
–0.95
–0.90
–0.85
–0.80
–0.75
–0.70
–0.65
–1.3
–0.4
–0.5
–0.6
–1.2
–1.1
–1.0
–0.9
–0.8
–0.7
–1.0002
–1.0000
–0.9998
–0.9996
–0.9994
–0.9992
–1.0004
–0.9990
2005 06 07 08 09 10 11 12 13 14 15 2005 06 07 08 09 10 11 12 13 14 15
2005 06 07 08 09 10 11 12 13 14 15
2005 06 07 08 09 10 11 12 13 14 15
2005 06 07 08 09 10 11 12 13 14 15–1.06
–0.90
–1.04
–1.02
–1.00
–0.98
–0.96
–0.94
–0.92
©International Monetary Fund. Not for Redistribution

108 THE ASEAN WAY: SUSTAINING GROWTH AND STABILITY
reserves in Asia are larger than those implied by a motive to insure against sudden
stops in capital flows. Similarly, Calvo, Izquierdo, and Kung (2013) use an empir-
ical model to address this question. The benefits of holding reserve buffers are a
lower risk of sudden stops in capital flows, while the cost is the spread of public
sector bonds over the interest earned from reserve holdings. The model finds that
reserve holdings in Latin America were the closest to the model-based optimal Pe
ru
–1
3
0
1
2
Ex ante average, range across methods1
Ex ante average, average across methods2
Ex post average3
Uni
ted
King
dom
Japa
n
Aust
ralia
Swed
en
New
Zea
land
Switz
erla
nd
Lith
uani
a
Om
an
Chi
le
Sri L
anka
Mex
ico
Nor
way
Sout
h Af
rica
Nep
al
Tuni
sia
Egyp
t
Mor
occo
Arge
ntin
a
Cro
atia
Pola
nd
Indo
nesi
a
Arm
enia
Icel
and
Bel
ize
Viet
nam
Phili
ppin
es
Bol
ivia
Hun
gary
Moz
ambi
que
Rom
ania
Ukr
aine
Mal
aysi
a
Rus
sia
Saud
i Ara
bia
Sing
apor
e
Can
ada
Dom
inic
an R
ep.
Paki
stan
Qat
ar
Uni
ted
Arab
Em
irate
s
Kuw
ait
Den
mar
k
Bah
rain
Col
ombi
a
Geo
rgia
Rw
anda
Cze
ch R
ep.
Mad
agas
car
Para
guay
Gua
tem
ala
Turk
ey
Isra
el
Guy
ana
Bul
garia
Cos
ta R
ica
Mau
ritiu
s
Alba
nia
Hon
dura
s
Bra
zil
Kore
a
Surin
ame
Uru
guay
Indi
a
Jam
aica
Kaza
khst
an
Thai
land
Jord
an
Mol
dova
Hon
g Ko
ng S
AR
Chi
na
Alge
riaLe
bano
n
Source: IMF staff estimates.1Range between the minimum and maximum estimated ex ante country average across different methods.2Average (across methods) of ex-ante measures.3Ex post country average.
Figure 5.10. Average Ex Ante Total Cost of Foreign Exchange Market Intervention, 2002–13(Percent of GDP)
TABLE 5.2.
Sterilization Coefficient
Pre-GFC GFC Post-GFC Taper Tantrum
Indonesia �0.957 �0.901 �0.838 �0.824
Malaysia �0.933 �0.914 �0.871 �0.839
Philippines �0.806 �0.709 �0.765 �0.833
Singapore �0.989 �0.981 �1.000 �1.004
Thailand �1.000 �1.000 �1.000 �1.000
Source: IMF staff estimates.
Note: Average sterilization coefficient using one-month extended window in the following periods: pre-GFC (starting
January 2005 or onward data available up to August 2008), GFC (September 2008 to March 2009), post-GFC (April 2009 to
April 2013), taper tantrum (May 2013 to December 2013). GFC = global financial crisis.
©International Monetary Fund. Not for Redistribution
Chapter 5 Monetary and Exchange Rate Policy Responses 109
levels, while reserves in eastern Europe were lower than the optimal levels and
those in Asia higher. This outcome is consistent with the findings of Adler and
Mano (2016), who find that the costs of rolling over reserve holdings in Asia are
larger than for those in other regions—mainly because of the larger size of their
reserves holdings—and argue that countries with high credit ratings, such as the
ASEAN-5, could therefore lower their foreign exchange reserves and costs of
sterilization (Domanski, Kohlscheen, and Moreno 2016).
Two-Target–Two-Instrument Approach Applied to the ASEAN-5
In some circumstances, a two-target–two-instrument monetary policy framework
may be consistent with a symmetrical approach to managing the global financial
cycle. Under such a framework, foreign exchange market intervention together
with movements in the policy interest rate are designed to achieve exchange rate
and inflation objectives (Benes and others 2013; Escudé 2013; IMF, forthcoming;
Ostry, Ghosh, and Chamon 2012). In particular, when the exchange rate
becomes too strong or too weak, competitiveness or balance sheet concerns would
lead to foreign exchange market intervention to influence exchange rate move-
ments. Such intervention can be sustained but needs to be two sided, as recently
observed in the ASEAN-5 countries. Such a regime is not without risks, especially
to the extent that frequent intervention may undermine the clarity and credibility
of the monetary policy framework, although good communication and enhanced
transparency can help to clarify the objectives. A related issue is the consistency
of the overall policy mix and the need to ensure that objectives are congruent and
that foreign exchange market intervention does not substitute for other needed
policy changes (IMF 2012).
The interaction of a Taylor rule with foreign exchange market intervention is
studied in a standard monetary model used by many central banks. To study the
effectiveness of intervention in leaning against the wind of the global financial
cycle, this section explores the rationale for its use in combination with a standard
Taylor rule–type monetary policy function in a modified Forecasting and Policy
Analysis System (FPAS) model (Berg, Karam, and Laxton 2006). The IMF’s
FPAS model involves a core macro structure consisting of a number of behavioral
equations, based on conventional links familiar to most macro modelers and
policymakers. Following the literature on the effectiveness of foreign exchange
market intervention in emerging market economies (for example, Blanchard,
Adler, and de Carvalho Filho 2015; Ostry, Ghosh, and Chamon 2012), the stan-
dard FPAS model is modified by introducing foreign exchange market interven-
tion as an additional tool for the central bank; through intervention, the central
bank can affect the exchange rate, which, in turn, will affect output and inflation
gaps. The modified FPAS model is consistent with a stripped-down version of
Escudé’s (2013) dynamic stochastic general equilibrium model in which the
author compares two policy regimes: a pure float in which the central bank fol-
lows only its Taylor rule and a combination of interest rate policy based on a
©International Monetary Fund. Not for Redistribution

110 THE ASEAN WAY: SUSTAINING GROWTH AND STABILITY
Taylor rule and market intervention, a so-called managed float regime. For sim-
plicity, this chapter assumes that the amount of foreign exchange market inter-
vention, defined as the net purchase of foreign currencies, is a function of the
deviation of the real exchange rate from its long-term average and the speed of
appreciation or depreciation. In other words, the larger the gap or the faster the
rate of appreciation or depreciation of the home currency, the larger the foreign
exchange market intervention. To evaluate the impact of intervention on
exchange rates, this analysis follows Adler, Lisack, and Mano (2015) by expressing
the exchange rate as a function of foreign exchange market intervention and using
this function to replace the uncovered interest rate parity equation in the FPAS
model, as in Escudé 2013.
A modified FPAS model is a better fit for the data for the Philippines and
Thailand and thus illustrates the potential trade-offs associated with using for-
eign exchange market intervention to manage the global financial cycle in the
ASEAN-5 context. The model is estimated using Bayesian techniques based on
prior distributions for the parameters from previous studies, including those on
the effectiveness of foreign exchange market intervention. Quarterly data from
the early 2000s (the starting point varies depending on data availability) are
used for the Philippines and Thailand. For foreign exchange market interven-
tion, the exercise follows the literature by using quarterly changes in foreign
exchange reserves as a proxy for intervention. The results suggest that the mod-
ified FPAS model incorporating foreign exchange market intervention fits the
data better for the Philippines and Thailand than the standard FPAS model
does (Table 5.3).
The benefits of inflation targeting coupled with intervention are apparent. In
the face of a capital outflow shock (due to higher global interest rates or risk
premiums), inflation targeting without foreign exchange market intervention
implies raising the policy interest rate more than in the case of intervention, sim-
ilar to Escudé 2013. This forces central banks to tolerate a more depreciated
currency (and, conversely, with positive shocks, a more appreciated one), lowering
welfare relative to the central bank’s objective of keeping the exchange rate close
to its fundamental value. Consequently, foreign exchange market intervention
can help to manage extreme external pressure, especially if the country has sub-
stantial exchange rate pass-through effects or currency mismatches (which would
exacerbate balance sheet risks following a currency depreciation). For the
Philippines and Thailand, the modified FPAS model shows that foreign exchange
market intervention can also help reduce output and inflation gaps when the
economy is facing a capital outflow shock given its influence on the exchange rate,
in line with the findings of Adler, Lisack, and Mano (2015) and Escudé (2013)
(Figure 5.11). These results provide the rationale for the use of foreign exchange
market intervention as a tool for macroeconomic management in the
ASEAN-5 economies.
The use of foreign exchange market intervention for other types of shocks and
interactions with policies other than Taylor rule–type monetary rules requires
further research. Whether foreign exchange market intervention is optimal in the
©International Monetary Fund. Not for Redistribution

Chapter 5 Monetary and Exchange Rate Policy Responses 111
presence of an array of shocks is debatable. Escudé (2013) shows that the degree
of smoothing depends critically on the nature of the shock given that intervention
has a far greater impact on economic developments in the case of an external
financing shock than for a demand shock. Benes and others (2013) also show the
importance of balance sheet considerations in assessing the impact and efficacy of
foreign exchange market intervention in response to external shocks. Anand,
Delloro, and Peiris (2014 and Chai-anant, Pongsaparn, and Tansuwanarat (2008)
show the potential benefits of more unconventional monetary policies in the
Philippines and Thailand, respectively, that may interact with foreign exchange
market intervention. More generally, the more extensive use of macroprudential
policies in the ASEAN-5 (see Chapter 6) suggests that foreign exchange market
TABLE 5.3.
Estimation Results of the Modified FPAS Model with Foreign Exchange Intervention
Philippines: Root Mean-Squared Errors
FPAS Model Modified Model
1 Quarter
ahead
4 Quarters
ahead
8 Quarters
ahead
1 Quarter
ahead
4 Quarters
ahead
8 Quarters
ahead
YGAP 0.41 1.07 0.95 0.42 1.01 0.75
PIE 2.24 3.71 3.97 1.93 3.11 3.00
RS 1.75 2.53 3.79 1.70 2.17 2.92
REER 2.67 3.11 2.94 2.46 2.60 3.13
Ratio (Modified/FPAS)
1 Quarter
ahead
4 Quarters
ahead
8 Quarters
ahead
YGAP 1.02 0.95 0.79
PIE 0.86 0.84 0.75
RS 0.97 0.86 0.77
REER 0.92 0.83 1.07
Thailand: Root Mean-Squared Errors
FPAS Model Modified Model
1 Quarter
ahead
4 Quarters
ahead
8 Quarters
ahead
1 quarter
ahead
4 Quarters
ahead
8 Quarters
ahead
YGAP 1.87 1.23 1.08 1.83 1.19 1.00
PIE 0.69 1.53 0.89 0.70 1.47 0.88
RS 0.19 0.61 0.86 0.21 0.64 0.84
REER 0.28 2.15 3.26 0.27 2.14 2.77
Ratio (Modified/FPAS)
1 Quarter
ahead
4 Quarters
ahead
8 Quarters
ahead
YGAP 0.98 0.97 0.93
PIE 1.02 0.96 0.99
RS 1.08 1.05 0.97
REER 0.94 0.99 0.85
Source: IMF staff estimates.
Note: FPAS � Forecasting and Policy Analysis System; PIE � quarterly rate of inflation; REER � real effective exchange rate;
RS � policy interest rate; YGAP � output gap.
©International Monetary Fund. Not for Redistribution

112 THE ASEAN WAY: SUSTAINING GROWTH AND STABILITY
intervention could be evaluated in richer models with macroprudential policies to
get a better sense of their desirability in combination with other macro policies
(see Chapter 9; Chen and Laseen, forthcoming; Harmanta and others 2015;
Ghilardi and Peiris 2016).
POLICY RESPONSES TO CAPITAL OUTFLOW EPISODES
ASEAN-5 economies used a wide range of policy tools—including fiscal mea-
sures, macroprudential policies, capital flow management measures, foreign
exchange market intervention, and provision of liquidity to money markets—to
supplement monetary policy to address market pressure and its economic impacts
(Figure 5.12; Table 5.4). In particular, while all countries raised their policy rates
during the Asian financial crisis to support their external positions, they eased
their policy rates following the global financial crisis to support growth
Figure 5.11. Impact of Foreign Exchange Intervention
1. Philippines: Output Gap
3. Thailand: Output Gap
–0.35
0.00
–0.25
–0.15
–0.05
–0.30
–0.20
–0.10
70 806050403020100–1.4
0.00
–0.2
–0.8
–0.4
–1.0
–0.6
–1.2
70 806050403020100
–0.6
0.2
–0.4
–0.2
0.0
70 806050403020100–1
0.5
–0.5
0.0
70 806050403020100
©International Monetary Fund. Not for Redistribution

Chapter 5 Monetary and Exchange Rate Policy Responses 113
(Figure 5.12). By comparison, only Indonesia raised its policy rates during the
taper tantrum to support its external position; Malaysia and the Philippines tight-
ened modestly in consideration of domestic stability. Singapore and Thailand
gradually eased their monetary policy stances during 2011‒12, reflecting the
weakening economic outlook. During the turbulent summer of 2015, policy rates
were left unchanged in all ASEAN-5 economies because policymakers had to
weigh concern about capital flow reversals—largely confined to portfolio equity
flows—against worries about slowing economic activity. However, Indonesia did
not begin easing monetary policy to support domestic demand until January 2016.
Various responses were observed across countries and episodes depending on
country circumstances (Table 5.4). During the global financial crisis, Indonesia,
Malaysia, and the Philippines lowered banks’ reserve requirements and expanded
liquidity provision measures to preserve orderly money market conditions.
Moreover, all ASEAN-5 economies expanded deposit insurance. Fiscal stimulus
packages were also implemented to support growth. In contrast, during the taper
tantrum episode, Indonesia—the ASEAN-5 country under the most pressure—
had to prioritize stability over supporting economic activity. Reserve requirements
and the loan-to-value ratio were tightened to contain credit growth, while the
exchange rate and long-term bond yields were allowed to move freely after an
initial period of containment. Fiscal policy was also tightened, with an average
Indonesia Malaysia Philippines Thailand
Singapore, NEER year-over-year percent change (right scale)Ja
n-20
07Ju
n-07
Nov
-07
Apr-
08Se
p-08
Feb-
09Ju
l-09
Dec
-09
May
-10
Oct
-10
Mar
-11
Aug-
11Ja
n-12
Jun-
12N
ov-1
2Ap
r-13
Sep-
13Fe
b-14
Jul-
14D
ec-1
4M
ay-1
5O
ct-1
5M
ar-1
6Au
g-16
Jan-
17Ju
n-17
Sources: Haver Analytics; and IMF staff estimates.Note: NEER = nominal effective exchange rate.
1
2
3
4
5
–5
–3
–1
1
3
5
7
9
11
13
15
6
7
8
9
10
11
Figure 5.12. ASEAN-5: Policy Interest Rates(Percent)
©International Monetary Fund. Not for Redistribution

1
14
TH
E ASEA
N W
AY
: SUSTA
ININ
G G
RO
WTH
AN
D STA
BILIT
YTABLE 5.4.
Policy Tools Used during the Global Financial Crisis and Taper Tantrum
Indonesia Malaysia Philippines Singapore Thailand
GFCTaper
TantrumSummer
2015 GFCTaper
TantrumSummer
2015 GFCTaper
TantrumSummer
2015 GFCTaper
TantrumSummer
2015 GFCTaper
TantrumSummer
2015
Policy Rate1 Lowered Raised Unchanged Lowered Unchanged Unchanged Lowered Unchanged Unchanged Lowered Lowered Unchanged
Exchange Rate Corridor Band1 Recentered
to validate
a weaker
currency1
Unchanged Unchanged
Exchange Rate Depreciation Yes Yes Yes Yes Yes Yes
Drawdown of Reserves Yes
Macroprudential Policy Tightened LTV
for motor
vehicles and
residential
properties
Imposed limit
on mortgage
term, maximum
tenure of
financing for
personal use
Restricted motor
vehicle and public
housing loans,
measures of
property loans;
imposed limits
on total debt
servicing ratio
Reserve Requirements Lowered Raised Lowered Lowered
Capital Flow Measures Shortened mini-
mum holding
period for cen-
tral bank bills
Imposed limits
on banks’ NDF
exposures
Foreign Exchange Interventions Yes Yes Yes Yes Yes Yes Yes
Liquidity Provision Measures Yes Yes Yes Yes
Expansion of Deposit Insurance
Coverage
Yes Yes Yes Yes Yes
Expansion of Eligible Collateral
for Short-Term Financing
Yes
Loan Guarantees Yes
Fiscal Policy Expansive Reduced fuel
subsidies
Expansive Expansive Expansive Expansive
Other Measures Swap arrange-
ments with
other countries;
contingent loans
Sources: IMF, ASEAN-5 countries’ staff reports for their Article IV consultations.Note: GFC � global financial crisis; LTV � loan-to-value ratio; NDF � nondeliverable forward.1Unlike the other ASEAN-5 countries, Singapore does not use the policy rate as the main monetary policy instrument. Instead, it uses the exchange rates corridor band.
©International Monetary Fund. Not for Redistribution

Chapter 5 Monetary and Exchange Rate Policy Responses 115
33 percent increase in subsidized fuel prices, to address external and fiscal imbal-
ances. Conversely, the minimum holding period for central bank bills was short-
ened to increase their liquidity and attract more foreign inflows. During the tur-
bulent summer months of 2015, reserve requirements were left unchanged, but
were reduced in December in Indonesia and in February in Malaysia to provide
liquidity to the money markets.
Foreign reserves were used as a buffer, coupled with greater exchange rate
flexibility, to help cushion the economy and avoid disorderly market conditions.
All ASEAN-5 currencies came under severe pressure and depreciated significantly
during the global financial crisis, allowing the exchange rate to act as a shock
absorber (Figure 5.13). Net capital outflows during the taper tantrum were not as
large as during the global financial crisis, but the markets monitored the strength
of the countries’ macroeconomic fundamentals more closely. Indonesia, in partic-
ular, faced severe pressure because of its twin deficits, which prompted more
foreign exchange market intervention to avoid disorderly market conditions
(Figure 5.14) (IMF 2016a). Moral suasion in the foreign exchange market and
reduced purchases of government securities by Bank Indonesia were also used to
IDN
RMB devaluation, reservesRMB devaluation (change in net forwardposition, Aug. 15–Jan. 16)
Taper tantrum (change in reserves, May 13–Nov. 13)
Taper tantrum (change in net forward position,May 13–Nov. 13)
GFC (change in reserves, Sep. 08–Mar. 09)GFC (change in net forward position,Sep. 08–Mar. 09)
Sources: Haver Analytics; IMF, International Reserves and Foreign Currency Liquidity Database; and IMF staff estimates.
1. Reserves Adequacy 2. Changes in Foreign Reserves and Net Forward Positions (Percent of GDP)
0–80 –60 –40 –20
Indo
nesi
a
Mal
aysi
a
Phili
ppin
es
Sing
apor
e
Thai
land
Change in reserves(percent, 2012–16)
0 20 40 60 80 100
Rese
rves
(pe
rcen
t of
res
erve
s ad
equa
cy m
etric
, 20
16)
50
100
150
200
250
300
350
–20–18–16–14–12–10–8–6–4–20246
MYS
PHLTHA
ALB
ARM
BLR
BIH
BRA BGR
CHLCHN
CRI
HRV
ECUEGY
SLV
GTM
HUN
INDIRQ
JAM
KAZ
LVA
LTU
MKD
MUS
MEX
MDA
MAR
PAK
PAN
PRY
PER
RUS
SRB
SYC
ZAF
TUN
TUR
UKR
URY
©International Monetary Fund. Not for Redistribution

116 THE ASEAN WAY: SUSTAINING GROWTH AND STABILITY
manage price adjustments; transparency of market interventions was increased
and communication with market participants enhanced. During the summer
2015 turbulence, all ASEAN-5 economies suffered from financial market volatil-
ity, particularly in equity markets. However, the foreign reserves drawdown was
most pronounced in Indonesia and Malaysia, the two commodity exporters that
were most affected by the commodity price collapse, requiring an external adjust-
ment to smooth the external shock, with reserves falling close to the IMF’s reserve
adequacy metric. Overall, greater exchange rate flexibility helped smooth “exces-
sive” volatility and preserve orderly market conditions during the turmoil.7
7Exchange rate volatility or overshooting a level consistent with macroeconomic fundamen-
tals does not constitute disorderly market conditions per se, but only to the extent that adverse
shocks are amplified.
Bid-ask spread Volatility (right scale)
Direct investmentPortfolio investment
Other investment
US election
Renminbi devaluation
Taper tantrum
US election
Renminbi devaluation
Taper tantrum
Sources: Country authorities; Haver Analytics; IMF, Balance of Payments Statistics; and IMF staff calculations.Note: Malaysia’s other investment only covers
investments.
Sources: Bloomberg Finance L.P.; and IMF staff calculations.Note: Volatility is the annualized standard deviation of daily exchange rate percent changes.
(Percent of GDP) (Percent)
0.0
0.5
1.0
1.5
2.0
2.5
3.0
3.5
4.0
4.5
5.0
–30
–20
–10
0
10
20
30
40
0.0
0.2
0.4
0.6
0.8
1.0
1.2
1.4
2005
:Q1
06:Q
1
07:Q
1
08:Q
1
09:Q
1
10:Q
1
11:Q
1
12:Q
1
13:Q
1
14:Q
1
15:Q
1
16:Q
1
17:Q
1
Jan-
2005
Jan-
06Ja
n-07
Jan-
08Ja
n-09
Jan-
10Ja
n-11
Jan-
12Ja
n-13
Jan-
14Ja
n-15
Jan-
16Ja
n-17
©International Monetary Fund. Not for Redistribution

Chapter 5 Monetary and Exchange Rate Policy Responses 117
CONCLUSIONS
The sensitivity of emerging market asset prices and capital flows to global factors
is well recognized, and the pervasive global spillovers to domestic interest rates
and credit conditions highlight the susceptibility of the main monetary transmis-
sion channel in the ASEAN -5. This calls into question the traditional “trilemma”
view of the independence of monetary policy with flexible exchange rates because
flexible rates alone cannot fully insulate economies from the global financial cycle
when the capital account is highly open. The estimates of monetary policy reac-
tion functions, or Taylor rules, suggest that ASEAN-5 monetary authorities
respond predominantly to domestic stability considerations but external consid-
erations also play a role. Policy rates are susceptible to global monetary shocks,
controlling for the interdependence of economic cycles, and the degree of mone-
tary policy autonomy varies across the ASEAN-5, with monetary transmission
influenced by global financial and commodity price shocks.
In some circumstances, foreign exchange market intervention may be motivat-
ed by the desire to mitigate capital flow shocks. ASEAN-5 countries accumulated
foreign exchange reserves to strengthen their external positions and build reserve
buffers to enhance their resilience, partly based on their experience during the
Asian financial crisis and the global financial crisis. However, the degree of
reserves accumulation in some ASEAN-5 countries may have exceeded levels
deemed necessary for precautionary purposes. It may also have been motivated by
the objective of smoothing exchange rate fluctuations or volatility, without target-
ing a particular exchange rate level (see Chapter 2). Combining foreign exchange
market intervention with a standard Taylor rule–type monetary policy function
estimated for the ASEAN-5 indicates that it could help reduce business cycle
fluctuations in response to capital flow shocks in some circumstances. In particu-
lar, during periods of excessive currency volatility, the exchange rate can stop
operating as a shock absorber and may become a shock amplifier, operating
through balance sheet concerns. However, the benefits of intervention, such as
dampening shocks, should also be weighed against sterilization costs and their
potential to undermine the credibility of the policy framework, particularly when
foreign exchange market intervention becomes too frequent and market condi-
tions are not disorderly.
The susceptibility of ASEAN-5 capital flows to global financial factors
heightens the risk of a sudden stop and a reversal in capital flows, which can
have large macroeconomic consequences on emerging markets. Foreign
exchange market interventions were generally one-sided before the global finan-
cial crisis—as these economies were rebuilding reserve buffers for precautionary
reasons—and in the wake of the crisis, when they were struggling to mitigate
the liquidity impact of large capital inflows triggered by the exceptionally easy
monetary policies in advanced economies. However, intervention became two
sided and more symmetric, and exchange rates more flexible, after the taper
tantrum episode in 2013. Moreover, the ASEAN-5 economies have relied more
on currency depreciation than on reserve depletion during recent episodes of
©International Monetary Fund. Not for Redistribution
118 THE ASEAN WAY: SUSTAINING GROWTH AND STABILITY
large capital outflows than during previous outflow episodes. A key aspect of
the policy responses was the timely use of policy combinations to mitigate dis-
orderly market conditions and severe economic fallout, taking into account
macro-financial linkages, which holds lessons for other emerging market econ-
omies and future challenges.
Frameworks for the conduct of monetary policy are likely to evolve further
under the “new normal” (Bayoumi and others 2014). The normalization of
US monetary policy should provide greater scope for monetary policy indepen-
dence in the ASEAN-5 economies given the limited impact of conventional and
unconventional monetary policy in other jurisdictions. Additional intermediate
objectives (such as financial and external stability) will play a greater role in the
future than they have in the past (Bayoumi and other 2014). When possible,
these objectives should be targeted with additional instruments (for exam-
ple, macroprudential policies and foreign exchange intervention). The use of
intervention in the ASEAN-5 economies is a case in point, but new challenges
may arise if, for example, reserve buffers fall below critical levels and if nonfinan-
cial shocks dominate in the future.
ANNEX 5.1. METHODOLOGY
Two-Step Regression Approach to Assessing Monetary Autonomy
The first stage of the approach measures the degree to which domestic monetary
policy is affected by domestic macroeconomic conditions by estimating the fol-
lowing regression model:
int i,t = α
i + ̂ β
1,i ( gdp
i,t ) + ̂ β
2,i ( inf
i,t ) + ε
i,t , (A5.1.1)
in which int i,t is the domestic interest rate of country i at time t and domestic
macroeconomic conditions are represented by gdp i,t , and inf
i,t , which are
one-year-ahead expectations of real GDP growth and headline inflation of coun-
try i at time t , respectively.
The second stage of the methodology then aims to determine the extent to
which the dynamics of foreign monetary policy affect movements in domestic
interest rates that are not accounted for by domestic macroeconomic conditions.
Building on the regression models estimated in the first stage, the exercise takes
the residuals of the regression models for each country, then regresses them
against foreign monetary policy rates to measure how much of the movement of
domestic policy rates not explained by domestic macroeconomic factors is
explained by external factors:
ε i,t = γ
i + δ
i ( int
t * ) + ϵ
i,t , (A5.1.2)
in which ε i,t is the error term at time t from the regression model for country i
i,t ,
and int t * is the level of the base country indicator at time t . In this study, four base
or reserve currency country indicators were tested. To estimate the explicit effect
©International Monetary Fund. Not for Redistribution

Chapter 5 Monetary and Exchange Rate Policy Responses 119
of policy rates in the United States, the residuals were regressed against the effec-
tive federal funds rate. However, because the Federal Reserve implemented
unconventional monetary policies and the US policy rate reached its lower bound
(thus, there was no longer any movement in the series), alternative regression
models using the shadow federal funds rate were used to capture the “theoretical
movement” of interest rates. Regression models using US 10-year Treasury bond
yields were also estimated because, although policy rates move only at the direc-
tion of the monetary authorities, movements in the economy attributable to the
effects of the policy rates are said to be mirrored in bond yield data.
Structural Vector Autoregression with Block Exogeneity (SVARX)
To measure the dynamic relationships between domestic macroeconomic factors,
a vector autoregression model was also estimated. As in the regression models, the
SVARX models are estimated in two stages.
For the first stage, a Taylor-type rule is used that models the dynamic relation-
ship between domestic interest rates and domestic macroeconomic conditions:
[ gdp
inf
int
]
t
= A 0 + ∑
j = 1 p A
j [
gdp
inf
int
]
t − j
+ [ e gdp
e inf
e int
]
t
. (A5.1.3)
To eliminate possible contemporaneous correlation between the error terms,
the residuals from the domestic interest rate are regressed on the residuals from
GDP and inflation expectations:
e ˆ int = α + β 1 e ˆ gdp + β
2 e ˆ inf + u
t i . (A5.1.4)
By following this approach the analysis eliminates the systemic policy response
of monetary policy to domestic macroeconomic shocks, and we are able to extract
the part of the domestic interest rates that is unexplained by movements in
domestic variables. This residual is used for the second stage, wherein we try to
quantify the degree to which these residuals are influenced by foreign shocks.
Note that in this study, assumptions on the exogeneity of foreign factors were
imposed such that domestic factors do not affect foreign factors contemporane-
ously, but can affect them with a lag. On the other hand, foreign factors are
assumed to affect domestic factors contemporaneously.
[ int *
u ˆ
t i ]
t
= B 0 + ∑
j=1 p B
j [
int *
u ˆ t i ]
t − j
+ [ v int * v i
] t
(A5.1.5)
REFERENCES
Adler, G., N. Lisack, and R. Mano. 2015. “Unveiling the Effects of Foreign Exchange Intervention: A Panel Approach.” IMF Working Paper 15/130, International Monetary Fund, Washington, DC.
©International Monetary Fund. Not for Redistribution

120 THE ASEAN WAY: SUSTAINING GROWTH AND STABILITY
Adler, G., and R. Mano. 2016. “The Cost of Foreign Exchange Intervention; Concepts and Measurement.” IMF Working Paper 16/89, International Monetary Fund, Washington, DC.
Aizenman, J., and R. Glick. 2008. “Sterilization, Monetary Policy, and Global Financial Integration.” NBER Working Paper 13902, National Bureau of Economic Research, Cambridge, MA.
Anand, R., V. Delloro, and S. J. Peiris. 2014. “A Credit and Banking Model for Emerging Markets and an Application to the Philippines.” Proceedings of the 2014 BSP International Research Conference, Issue No. 2. Manila: Bangko Sentral ng Pilipinas.
Bank for International Settlements (BIS). 2013. “Market Volatility and Foreign Exchange Intervention in EMEs: What Has Changed?” BIS Paper 73, Bank for International Settlements, Basel.
Bayoumi, T., G. Dell’Ariccia, K. F. Habermeier, T. Mancini Griffoli, and F. Valencia. 2014. “Monetary Policy in the New Normal.” IMF Discussion Note 14/3, International Monetary Fund, Washington, DC.
Benes, J., A. Berg, R. Portillo, and D. Vavra. 2013. “Modeling Sterilized Interventions and Balance Sheet Effects of Monetary Policy in a New-Keynesian Framework.” IMF Working Paper 13/11, International Monetary Fund, Washington, DC.
Berg, A., P. Karam, and D. Laxton. 2006. “A Practical Model-Based Approach to Monetary Policy Analysis: Overview.” IMF Working Paper 06/080, International Monetary Fund, Washington, DC.
Blanchard, O., G. Adler, and I. de Carvalho Filho. 2015. “Can Foreign Exchange Intervention Stem Exchange Rate Pressures from Global Capital Flow Shocks?” IMF Working Paper 15/159, International Monetary Fund, Washington, DC.
Caceres, C., Y. Carrière-Swallow, and B. Gruss. 2016. “Global Financial Conditions and Monetary Policy Autonomy.” IMF Working Paper 16/108, International Monetary Fund, Washington, DC.
Calvo, G., A. Izquierdo, and R. L. Kung. 2013. “Optimal Holdings of International Reserves: Self-Insurance against Sudden Stops.” Monetaria 1 (1): 1 –35.
Chai-anant, C., R. Pongsaparn, and K. Tansuwanarat. 2008. “Role of Exchange Rate in Monetary Policy under Inflation Targeting: A Case Study for Thailand.” BOT Discussion Paper 09/2008, Bank of Thailand, Bangkok.
Clarida, R., J. Galí, and M. Gertler. 1998. “Monetary Policy Rules in Practice: Some International Evidence.” European Economic Review 42 (6): 1033–67.
———. 2001. “Optimal Monetary Policy in Open versus Closed Economies: An Integrated Approach.” American Economic Review 91 (2): 248–52.
Domanski, D., E. Kohlscheen, and R. Moreno. 2016. “Foreign Exchange Market Intervention in EMEs: What Has Changed?” BIS Quarterly Review, September.
Chen, J., and S. Laseen. Forthcoming. “External Shocks and the Design of Macroprudential Policy at the Zero Lower Bound.” IMF Working Paper, International Monetary Fund, Washington, DC.
De Paoli, B. 2009. “Monetary Policy and Welfare in a Small Open Economy.” Journal of International Economics 77 (1): 11–22.
Edwards, S. 2015. “Monetary Policy Independence under Flexible Exchange Rates: An Illusion?” World Economy 38: 773–87.
Escudé, G. 2013. “A DSGE Model for a SOE with Systematic Interest and Foreign Exchange Policies in Which Policymakers Exploit the Risk Premium for Stabilization Purposes.” Economics: The Open-Access, Open-Assessment E-Journal 7: 1–110.
Frankel, J., S. L. Schmukler, and L. Servén. 2004. “Global Transmission of Interest Rates: Monetary Independence and Currency Regime.” Journal of International Money and Finance 23 (5): 701–33.
Ghilardi, M. F., and S. J. Peiris. 2016. “Capital Flows, Financial Intermediation and Macroprudential Policies.” Open Economies Review 27 (4): 721–46.
©International Monetary Fund. Not for Redistribution

Chapter 5 Monetary and Exchange Rate Policy Responses 121
Harmanta, Nur M., Adhi Purwanto, Aditya Rachmanto, and Fajar Oktiyanto. 2015. “Monetary and Macroprudential Policy Mix under Financial Frictions Mechanism with DSGE Model: Lessons from Indonesian Experience.” Proceedings of the 2014 BSP International Research Conference, Issue No. 2 (Manila: Bangko Sentral ng Pilipinas).
Hofmann, B., and E. Takáts. 2015. “International Monetary Spillovers.” BIS Quarterly Review, September.
Jeanne, O., and R. Rancière. 2011. ’’The Optimal Level of International Reserves for Emerging Market Countries: A New Formula and Some Applications.’’ Economic Journal 121 (555): 905–30.
International Monetary Fund (IMF). 2012. “The Liberalization and Management of Capital Flows—An Institutional View.” IMF Policy Paper, Washington, DC. http:/ / www .imf .org/ external/ np/ pp/ eng/ 2012/ 111412 .pdf.
———. 2013. “The Yin and Yang of Capital Flow Management: Balancing Capital Inflows with Capital Outflows.” In World Economic Outlook, Washington, DC, October.
———. 2014. “On the Receiving End? External Conditions and Emerging Market Growth before, during, and after the Global Financial Crisis.” In World Economic Outlook, Washington, DC, April.
———. 2015a. “Monetary Policy and Financial Stability.” IMF Policy Paper, Washington, DC. www .imf .org/ external/ np/ pp/ eng/ 2015/ 082815a .pdf.
———. 2016a. “ASEAN-5 Cluster Report: Evolution of the Monetary Policy Frameworks in the ASEAN-5.” Washington, DC.
———. 2016b. “Understanding the Slowdown in Capital Flows to Emerging Markets.” In World Economic Outlook, Washington, DC, April.
———. Forthcoming. “Managing External Volatility” Policy Frameworks in Non–Reserve Currency Countries.” Draft Strategy and Policy Review Departmental Paper, Washington, DC.
McCallum, B. 2006. “Singapore’s Exchange Rate Centered Monetary Policy Regime and Its Relevance for China.” MAS Staff Paper 43, Monetary Authority of Singapore.
Mohanty, M. S., and M. Klau. 2005. “Monetary Policy Rules in Emerging Market Economies: Issues and Evidence.” In Monetary Policy and Macroeconomic Stabilization in Latin America, 205–45. New York: Springer.
Monetary Authority of Singapore (MAS). 2013. Macroeconomic Review 12 (1).Obstfeld, M. 2015. “Trilemmas and Tradeoffs: Living with Financial Globalization.” In Global
Liquidity, Spillovers to Emerging Markets and Policy Responses, edited by C. Raddatz, D. Saravia, and J. Ventura, 13–78. Santiago: Central Bank of Chile.
Ostry, J., A. Ghosh, and M. Chamon. 2012. “Two Targets, Two Instruments: Monetary and Exchange Rate Policies in Emerging Market Economies.” IMF Staff Discussion Note 12/01, International Monetary Fund, Washington, DC.
Parrado, E. 2004. “Singapore’s Unique Monetary Policy: How Does It Work?” IMF Working Paper 04/10, International Monetary Fund, Washington, DC.
Rey, H. 2013. “Dilemma Not Trilemma: The Global Financial Cycle and Monetary Policy Independence.” Paper presented at the 25th Jackson Hole Symposium, Jackson Hole, WY, August.
———. 2014. “The International Credit Channel and Monetary Policy Autonomy.” Mundell Fleming Lecture, International Monetary Fund, Washington, DC.
Svensson, L. E. O. 1999. “Inflation Targeting as a Monetary Policy Rule.” Journal of Monetary Economics 43 (3): 607–54.
Taylor, J. 1993. “Discretion versus Policy Rules in Practice.” Carnegie-Rochester Conference Series on Public Policy 39: 319–41.
———. 2001. “The Role of the Exchange Rate in Monetary-Policy Rules.” American Economic Review 91 (2): 263–67.
Woodford, M. 2007. “Globalization and Monetary Control.” In International Dimensions of Monetary Policy, 13–77. Cambridge, MA: National Bureau of Economic Research.
©International Monetary Fund. Not for Redistribution

This page intentionally left blank
©International Monetary Fund. Not for Redistribution

123
Macroprudential Policies
CHAPTER 6
The use of macroprudential tools to limit systemic financial risk has grown over
the past two decades. The Association of Southeast Asian Nations–5 (ASEAN-5)
economies have been well ahead of other regions in realizing the value of macro-
prudential policies for financial stability. However, prudential policy frameworks
are still a work in progress, and the ASEAN-5 are striving to develop and build
appropriate institutional underpinnings for such policies.
This chapter looks at what macroprudential policies are and why their use has
grown in the ASEAN-5. It then analyzes the impact of such policies on maintain-
ing financial stability and whether these tools, if used more preemptively, could
have helped prevent the financial excesses during the Asian financial crisis.
Chapter 8, in turn, examines macroprudential policy frameworks and the policy
agenda ahead to ensure that financial stability is maintained over the medium term.
The increased use of macroprudential policies in the ASEAN-5 since the Asian
financial crisis has reduced the incidence of credit boom-bust cycles and their
impact on asset prices. Event studies show that macroprudential tools have been
an effective policy instrument for moderating credit growth. Since the Asian
financial crisis, macroprudential policies have also complemented monetary pol-
icy and enhanced the monetary transmission mechanism by altering bank loan
profitability. Indeed, the greater use of prudential tools in the ASEAN-5 has been
mirrored by more prudent bank balance sheet management.
Although their efficacy has been demonstrated, the argument for using macro-
prudential policies to mitigate financial vulnerability is further strengthened by the
macroeconomic history of the ASEAN-5. Credit and real cycles in these countries
have operated at different frequencies, and inflation has not been a reliable indicator
of financial excess. The ASEAN-5 have demonstrated since 2000 that dedicated
macroprudential policies can help achieve the financial stability objective because
policies can be better tailored to financial risks. These countries’ experience with
macroprudential policies thus hold lessons for other advanced and emerging market
economies beginning to explore macro-financial policymaking.
WHY MACROPRUDENTIAL POLICIES?
The increasing use of macroprudential tools for safeguarding financial stability over
the past decade stems from a greater understanding of the limits of monetary policy.
These limits include the realization that real and financial cycles operate at different
frequencies, that supply-side developments have constrained monetary policy, that
This chapter was prepared by Sohrab Rafiq under the guidance of Shanaka J. Peiris.
©International Monetary Fund. Not for Redistribution

124 THE ASEAN WAY: SUSTAINING GROWTH AND STABILITY
external factors have gained importance for domestic financial conditions, and that
monetary policy is too blunt an instrument for dealing with asset price bubbles.
The financial sector is inherently procyclical and can amplify the real cycle.
This amplification occurs through price and quantity channels. Bank lending is
procyclical because liabilities tend to increase by more than assets during a
credit boom, thus raising leverage. Moreover, because financial conditions are
positively correlated with overall economic activity, price-based market risk
indicators tend to be procyclical. An examination of the risks to financial sta-
bility arising from excessive procyclicality highlights several coordination issues
among policymakers.
The duration and amplitude of the financial cycle are not the same as those of
the real cycle, which in real time could lead monetary policymakers astray (Borio
2012). Drehmann, Borio, and Tsatsaronis (2012) note that the financial cycle
operates at a much lower frequency than the traditional business cycle, while
Borio and Lowe (2002, 2004) show that widespread financial distress typically
arises from the unwinding of financial imbalances that build up while disguised
by benign economic conditions characterized by stable and low inflation.
Since 1960, the duration of the average business cycle has been smaller than
the average credit cycle in the ASEAN-5 (Table 6.1). It is these patterns that cause
coordination difficulties for monetary policy and potentially lure a central bank
into a looser monetary policy stance than would otherwise be warranted. This
concept can also be illustrated by a simple scatterplot of the credit gap, which is
one measure of the financial cycle and is defined as the difference between the
credit-to-GDP ratio and its long-term trend, and inflation. If inflation is a reliable
indicator of excessive financial leverage, there should be a positive relationship
between inflation and the size of the credit gap. However, the data for the
ASEAN-5 countries show a weak relationship between the financial cycle and
inflation (Figure 6.1), and this relationship has generally weakened since the early
2000s. Taken together, these findings parallel the idea that financial and real
cycles operate at different frequencies (Borio 2012). For this reason, monetary
policy may not be an efficient tool for calming the credit cycle if it is expected to
moderate business and inflation cycles at the same time. Moreover, multiple
objectives may overburden monetary policy, creating an expectation gap between
what the central bank can achieve and what it can deliver. Therefore, moderating
TABLE 6.1.
Average Length of Credit and Business Cycles in the ASEAN-5 (1960–2016) (Years)
Business Cycle Credit Cycle
Indonesia 6.9 9.6
Malaysia 3.6 6.4
Philippines 4.1 4.9
Singapore 4.5 5.4
Thailand 5.4 7.8
Source: IMF staff calculations.
Note: The average length of business and credit cycles is calculated using annual data and a Bayesian Markov chain regression.
The business cycle is captured using GDP growth rates.
©International Monetary Fund. Not for Redistribution

Chapter 6 Macroprudential Policies 125
real and financial cycles calls for complementary sets of monetary and macropru-
dential policies. Chapter 9 illustrates the benefits of such complementary policies
for addressing both price and financial stability.
Positive supply-side developments in the ASEAN-5 since 2000 have con-
strained monetary policy flexibility, raising the risk of larger and more prevalent
financial booms. These supply-side developments linked to increased global trade
and financial integration have contributed to higher growth potential and hence
the scope for credit and asset price booms. At the same time, they have put down-
ward pressure on inflation, which, in turn, constrains the room for monetary
policy tightening (Juselius and others 2016). As discussed in Chapter 2, most
ASEAN-5 countries give preeminence to inflation in guiding monetary policy
interest rates. As inflation has declined, monetary policy rates have fallen, which,
1960–971999–2016
1980–971999–2016
1960–971999–2016
1960–971999–2016
(Percent)
1. Malaysia (Percent)
–10 –5 0 5 10 15 –10 –5 0 5 10 15
Credit gap Credit gap
–202468
101214161820
–5
0
5
10
15
20
25
30
(Percent)
(Percent)
–15 –5–10 0 5 10 –10 –5 0 5 10
Credit gap Credit gap
0
5
10
15
20
25
0
10
20
30
40
50
60
4. Philippines (Percent)
©International Monetary Fund. Not for Redistribution

126 THE ASEAN WAY: SUSTAINING GROWTH AND STABILITY
in turn, has depressed natural interest rates across the region. The natural rate, a
convenient benchmark against which to measure the policy rate, is an unobserv-
able equilibrium concept assumed to be determined by real factors. At the heart
of this interpretation are two features: first, the natural rate is defined as the rate
that would prevail if actual output equaled potential output. Second, inflation is
the key signal that output is not at its potential, sustainable level. This view pre-
sumes that over the medium term, monetary policy only passively tracks the
natural rate. Thus, the observed decline in real interest rates is purely a function
of forces beyond the central bank’s control.
Time-varying estimates show a decline in the natural interest rate since 1990
among ASEAN-5 economies.1 The natural rate rose in the high-inflation era of
the 1980s, but declined persistently during the so-called Great Moderation of the
1990s, when global inflation declined. The natural rate stayed low across the
ASEAN-5 during the first decade of the 2000s. Since 2010, the natural rate has
hovered around zero. The decline in the natural rate across the ASEAN-5 mirrors
global financial trends and reflects, in part, the success of ASEAN central banks
in moderating and stabilizing inflation, as documented in Chapters 2 and 7.
Since credit booms have not, historically at least, been accompanied by higher
inflation in the ASEAN-5 (Figure 6.2)—reflecting positive supply-side develop-
ments and improved central bank credibility—a monetary policy focused on
price stability has not needed to tighten beyond the natural rate to restrain a
buildup in financial imbalances. Therefore, where low policy rates are consistent
with low inflation, they may contribute to excessive credit growth and the build-
up of asset bubbles and thereby sow the seeds of financial instability (Juselius and
others 2016). These factors reinforce the need for prudential policies that mitigate
the buildup of financial risk in a low-interest-rate environment.
As a result of increased trade and financial integration, the global financial
cycle has come to play a more important role in determining domestic financial
conditions in the ASEAN-5 (Chapter 4; Rafiq 2016). This external influence may
limit the effectiveness of domestic monetary policy in determining local financial
conditions (Chapter 5; Miranda-Agrippino and Rey 2015).
How important are external credit conditions in Asia for domestic credit con-
ditions in the ASEAN-5? The relative importance of the external credit cycle for
domestic credit growth in the ASEAN-5 is quantified using a dynamic factor
model, following Kose, Otrok, and Whiteman (2003). The framework decom-
poses observable credit growth c i,t , i = 1, . . . , n, t = 1, . . . , T into the sum of
two unobservable components: one that affects all c i,t , that is, the factor f
t , which
captures the Asian credit cycle, and one that is idiosyncratic ( ε i,t ) and specific to
each country i :
1The natural rate cannot be directly observed, and the rate is model dependent. Estimates in this
chapter are drawn using ex post real short-term interest rate data in a local-level model estimated
using a Kalman smoother. Chapter 7, in turn, presents alternative estimates using a time-varying
vector autoregression framework.
©International Monetary Fund. Not for Redistribution

Chapter 6 Macroprudential Policies 127
c i,t = a
i + b
i f
t + ε
i,t . (6.1)
Estimates suggest that a significant share of credit growth in the ASEAN-5 is
linked to credit growth fluctuations in the rest of Asia. Figure 6.3 plots the expo-
sure of domestic credit growth, measured by b i , to the Asian credit cycle, captured
by f t . The results show that about 20–25 percent of the credit growth in Malaysia
and Thailand is linked to credit developments in the rest of the region. The com-
parable estimate for Indonesia is about 30 percent. Because the external environ-
ment in the global banking system is a significant determinant of domestic credit
conditions and, therefore, a source of vulnerability of the economy to financial
excesses, considerations of financial stability cannot be easily separated from the
merits of macroprudential policies.2 This interdependence is recognized in the
2Chapter 10 discusses the benefits and risks of regional financial integration in the ASEAN-5.
Real short-term interest rate Implied natural rate
Figure 6.2. Implied Real Natural Interest Rate Estimates(Percent)
1. Malaysia (Percent)
–61974 80 86 92 98 2004 10 16 1974 80 86 92 98 2004 10 16
–4
–2
0
2
4
6
–10
–5
0
5
10
15
2. Thailand (Percent)
3. Indonesia (Percent)
1974 80 86 92 98 2004 10 16 1974 80 86 92 98 2004 10 16–40
–30
–20
–10
0
10
20
30
–10
–5
0
5
10
20
15
4. Philippines (Percent)
Sources: National authorities’ data; and IMF staff calculations.
©International Monetary Fund. Not for Redistribution

128 THE ASEAN WAY: SUSTAINING GROWTH AND STABILITY
macroprudential policy framework discussed by the international regulatory com-
munity (FSB, IMF, and BIS 2011). Because macroprudential policies are less
constrained than monetary policy, they can better deal with financial stability
issues as a result of shifts in global liquidity.
Finally, despite better understanding of the limitations of monetary policy, a
pre–global financial crisis view that central banks should focus on stabilizing
inflation and output has, in some circles, given way to the postcrisis view that
policymakers should pay attention and eventually respond to developments in
asset markets. However, proposals for monetary policy that leans against the wind
in response to financial conditions’ perceived deviation from fundamentals rely
on the assumption that higher short-term interest rates will be effective in shrink-
ing the size of an emerging financial or asset price bubble. Yet—and despite the
popularity of such proposals—the empirical evidence for such a link is far from
established (Galí and Gambetti 2015; Rigobon and Sack 2003).
The link between stock prices and monetary policy can be established via a
risk-neutral general equilibrium environment, as in Galí 2014. The stock price
( Q ) is decomposed into fundamental ( Q f ) and bubble ( Q b ) components, Q =
Q f + Q b . In a risk-free environment, the fundamental component is defined as the
present discounted value of future dividends
q f = const + ∑ j = 0
∞ Θ j [ (1 − Θ) E t { d
t + k } − E
t { r t + k
} ] . (6.2)
Source: IMF staff calculations.
Hon
g Ko
ngSA
R
Chi
na
Japa
n
Indi
a
Kore
a
Aust
ralia
Mal
aysi
a
Thai
land
Indo
nesi
a
Phili
ppin
es
Sing
apor
e
Lao
P.D
.R.
Viet
nam
Cam
bodi
a
0.0
0.1
0.2
0.3
0.4
0.5
0.6
0.7
Figure 6.3. Variance Decomposition: Asia Credit Factor(Share of variance explained)
©International Monetary Fund. Not for Redistribution

Chapter 6 Macroprudential Policies 129
The response of an asset price to a change in monetary policy can be expressed as
∂ q
t + k ____
∂ ε t m = (1 − γ
t − 1 )
∂ q t + k
f ____
∂ ε t m + γ
t−1 ∂ q
t + k b ____
∂ ε t m , (6.3)
in which γ = Q b ⁄ Q measures the relative size of the bubble component in the
overall asset price. In response to a monetary impulse, the fundamental stock
price can be traced out using
∂ q
t + k f _
∂ ε t m = ∑
j = 0 ∞ Θ j ( 1− Θ )
∂ d t + k + j + 1
f _
∂ ε t m −
∂ r t + k + j
_
∂ ε t m , (6.4)
in which Θ = d / r < 1 and d t is the gross dividend yield, and r
t is the
riskless real rate.
Under the conventional view that monetary policy can be used to prick
asset price bubbles,
∂ r
t + k + j _____
∂ ε t m < 0 and
∂ d t + k + j + 1
f _______
∂ ε t m ≤ 0 ,
which implies that a tightening of monetary policy should cause a decline in the
size of the bubble. Hence, the overall effect on the observed asset price should be
unambiguously negative, independent of the relative size of the bubble. The
response of the bubble component can be backed out via the gap between the
empirical stock price and the fundamental stock price responses ( Q b = ∂ q
t + k f _
∂ ε t m −
∂ q t + k
_
∂ ε t m )
to a tightening in monetary policy.
This proposition can be tested empirically using a vector autoregression
model. The analysis uses monthly Malaysian data for GDP, the GDP deflator, a
commodity price index, dividends, the short-term interest rate, and a stock price
index from January 2004 to December 2016. The focus is on the dynamic
response of stock prices to an exogenous hike in the interest rate. Results show
that monetary policy tightening, characterized by a rise in the short-term interest
rate, has, on average, been associated with an eventual rise in stock prices and a
rise in the bubble component ( Q b ) of asset prices (Figure 6.4). This effect is per-
sistent and statistically significant. This simple finding casts doubt on the view
that monetary policy that leans against the wind, that is, a rise in interest rates,
will help deflate an emerging asset and credit market bubble. Moreover, since
monetary policy has a broad impact on the economy and financial markets and
gets in all the cracks, attempts to raise interest rates to deflate an asset price bubble
are likely to have many unintended side effects, such as increased capital flows.
And, to the extent that it is diverted to the task of reducing risks to financial
stability, monetary policy is not available to help the central bank attain its
near-term objectives of full employment and price stability.
In summary, monetary policy can only do so much, increasing the role of
macroprudential policy to prevent financial excesses and build financial resilience. Evidence for the ASEAN-5 implies that financial stability will not necessarily
materialize as a natural by-product of a so-called appropriate monetary policy
stance. Although the effects of monetary and macroprudential instruments may
overlap, they are not perfect substitutes, and achieving the financial stability
©International Monetary Fund. Not for Redistribution

130 THE ASEAN WAY: SUSTAINING GROWTH AND STABILITY
objective requires dedicated macroprudential policies, which can be better tai-
lored to financial risks, to address specific problems. Well-tailored macropruden-
tial policies can have fewer unintended consequences on other sectors of the
economy and other policy objectives.
WHAT ARE MACROPRUDENTIAL POLICIES?
The primary aim of macroprudential policy is to secure financial stability by
leaning against excess financial conditions. FSB, IMF, and BIS (2011) define
macroprudential policy as “a policy that uses primarily prudential tools to limit
systemic or system-wide financial risk, thereby limiting the incidence of disrup-
tions in the provision of key financial services that can have serious consequences
for the real economy. . . .” Rather than managing the level and composition of
aggregate demand or the business cycle, as monetary policy aims to do, macro-
prudential policy tries to strengthen the financial system’s defenses in the face of
economic and financial shocks.
Financial stability risks can occur in several guises:
• Aggregate weakness: This weakness arises when the financial sector becomes
overexposed to the same risks. Examples include credit (borrower may
default), market (collateral values may decline), or liquidity (assets may be
hard to sell or debts refinanced) risks. Such risks are particularly acute when
Source: IMF staff calculations.
1
Months after interest rate shock
15 29 430
2
4
6
8
10
12
14
Figure 6.4. Malaysia: Response of Bubble Component of Stock Prices to a Rise in Interest Rates(Share of variance explained)
©International Monetary Fund. Not for Redistribution

Chapter 6 Macroprudential Policies 131
credit becomes increasingly tied to the value of asset prices. When asset prices
collapse, lenders become exposed both to market risk, because the value of
assets declines, and to credit risk, because borrowers are less able to repay their
loans. In addition, banks that expand credit by borrowing from wholesale
markets and that rely less on traditional deposits from customers are at risk if
market funding dries up, making it harder to refinance expiring debt.
• Systemic financial risk: Failure of an individual institution can give rise to
systemic risk and cripple the financial system. These spillovers can occur
through several channels: (1) increases in funding costs and runs on other
institutions in the wake of the failure of the systemic institution, (2) direct
exposure to another financial institution, and (3) fire sales of assets by the
stricken institution that cause the value of all similar assets to decline, forc-
ing other institutions to take losses on the assets they hold.
Macroprudential policy makes two active contributions to limit these risks to
the wider economy:
• First, it can preempt aggregate weakness by limiting the buildup of risk,
thereby reducing the occurrence of crises. By building buffers, macropru-
dential policy helps maintain the ability of the financial system to provide
credit to the economy, even under adverse conditions.
• Second, it can reduce systemic vulnerability by increasing the resilience of
the financial system. Macroprudential policies can reduce the procyclical
feedback between asset prices and credit and contain unsustainable increas-
es in leverage and volatile funding.
For a macroprudential policy framework to operate it needs to include a sys-
tem of early warning indicators that signal increased vulnerabilities to financial
stability. Excessive asset growth is at the core of increased financial sector vulner-
abilities. The challenge is knowing when asset growth is “excessive.” Simple rules
of thumb such as the ratio of total credit to GDP are often used. The liabilities
side of banking sector balance sheets also offers clues to financial vulnerabilities.
The ratio of noncore to core liabilities of the banking sector is useful for gauging
the stage of the financial cycle. Monetary aggregates and other banking sector
liability measures may also be usefully developed to track potential vulnerabilities.
Macroprudential tools can be grouped in many ways. The different prudential
tools overlap, and there is no hard-and-fast boundary between monetary and mac-
roprudential measures. One useful way to group the tools is to distinguish between
those that prevent financial excess from building up and those that increase finan-
cial sector resilience. Several macroprudential policy tools are useful for addressing
the buildup of financial vulnerabilities (IMF 2014a; IMF, FSB, and BIS 2016):
• Bank capital–oriented tools can limit loan growth by altering bank incentives. Such tools affect all credit exposures of the banking system and aim primar-
ily to increase resilience, but some of them may also have a moderating
effect on credit in buoyant times. Such policies include credit growth and
sectoral limits and loan-to-value and debt-to-income ratios. Countercyclical
capital buffers and dynamic loan loss provisioning requirements can help
build buffers to absorb losses. A static leverage ratio limit, such as the one
©International Monetary Fund. Not for Redistribution

132 THE ASEAN WAY: SUSTAINING GROWTH AND STABILITY
envisaged in Basel III, can constrain the buildup of excessive leverage in the
context of capital inflows.
• Sectoral tools target specific credit categories to help mitigate systemic risk arising from excessive credit growth. Sectoral capital requirements (risk weights) on
specific loans, such as mortgages, can be raised to induce banks to hold extra
capital and protect against unexpected losses that arise when default rates
increase because of an economic downturn. Constraints on household lend-
ing, such as limits on loan-to-value and debt-service-to-income ratios,
increase resilience to asset price and income shocks and reduce demand for
housing loans. Loan restrictions and guidance on underwriting standards
are often targeted at mortgages but can also be applied to other segments,
including commercial property and loans to the corporate sector (IMF
2014b; IMF, FSB, and BIS 2016).
• Liquidity tools can help contain vulnerabilities related to volatile funding struc-tures. The Basel III liquidity tools—minimum standards for the liquidity
coverage ratio and the net stable funding ratio—can do much to improve
resilience to liquidity shocks. Liquid asset requirements (such as the liquid-
ity coverage ratio) make banks hold more liquid assets, hold fewer illiquid
assets, or lengthen funding maturities, making it less likely that funding
pressure will lead to a fire sale.
To mitigate financial vulnerabilities, macroprudential policy tools should be
designed to fit closely with early warning indicators, and it is unlikely that a single
prudential tool can address the various sources of systemic risk. Policies must be
tailored to specific macroprudential instruments to lessen the vulnerabilities identi-
fied by analysis. The macroprudential toolkit should be broad enough to prevent
boom-bust credit cycles and should include tools to address the interplay between
market and credit risks—such as maximum loan-to-value ratios for home
mortgages—and the buildup of liquidity risks as credit surges. Moreover, macropru-
dential policies could also aim to tackle financial imbalances in individual financial
institutions, which could also deal with the aggregate credit cycle. This method may
be appropriate because bank-specific actions sometimes internalize spillovers that
arise across banks over the credit cycle. Table 6.2 provides a simple schema of mac-
roprudential tools. Table 6.3 provides a more detailed description of these tools.
TABLE 6.2.
Schema of Macroprudential Policies
Preventing Financial Excess Building Financial Resilience
Credit Supply Lending rate ceilings Capital requirements
Leverage caps Dynamic and forward-looking provisioning
Reserve requirements Risk weights
Credit growth limits Reserve requirements
Exposure limits Liquidity requirements
Levy on noncore liabilities
Sectoral limits
Credit Demand Loan-to-value ratios
Debt-service-to-income ratios
Tax policies and incentives
Source: IMF staff calculations.
©International Monetary Fund. Not for Redistribution

Chapter 6 Macroprudential Policies 133
TABLE 6.3.
Macroprudential Policies and Aims
Preventing Financial Excess Building Financial Resilience
Mon
etar
y M
easu
res
Reserve
Requirements
With reserve requirements, banks are
required to hold at least a fraction of their
liabilities as liquid reserves. These are nor-
mally held either as reserve deposits at the
central bank or as vault cash.
Liquidity
Requirements
Liquidity requirements typically take the
form of a minimum ratio for highly liquid
assets, such as government securities and
central bank paper, as a proportion of cer-
tain types of liabilities. These prudential
regulations ensure that banks can with-
stand severe cash outflows under stress.
However, liquidity requirements act simi-
larly to reserve requirements in that they
influence the amount of funds available for
lending to the private sector.
Limits on Credit
Growth
When an economy experiences
rapid credit growth, the central
bank may impose a quantitative
ceiling on the rate of credit growth
per month or year, or a maximum
per-month or per-quarter increase
in lending. Such limits to credit
growth include actions that specify
a quantitative limit on the rate of
credit growth and penalties for
exceeding this limit.
Prud
enti
al M
easu
res
Capital
Requirements
The rise in asset values that accompanies a
boom results in higher capital buffers in
financial institutions, supporting further
lending in the context of an unchanging
benchmark for capital adequacy. During a
bust, the value of this capital can drop pre-
cipitously, possibly even necessitating a cut
in lending. Current capital requirements can
therefore amplify the credit cycle, making a
boom and bust more likely. However, capi-
tal requirements that lean against the credit
or business cycle instead—rise with credit
growth and fall when it contracts—can play
an important role in promoting financial
stability and reducing systemic risk.
Risk-Weighting
Assets
Under Basel I, II, and III, housing loans are
subject to risk weights that differ from
those applied to corporate or sovereign
exposures. Raising the risk weight on
housing loans makes it costlier for banks
to extend them and, at the same time,
banks are induced to build up buffers
against potential losses. Often, risk weights
are differentiated by the actual LTV ratio
for individual loans. For example, the por-
tion of a housing loan’s LTV ratio that
exceeds a certain threshold (for example,
80 percent) may carry a higher risk weight.
(continued)
©International Monetary Fund. Not for Redistribution

134 THE ASEAN WAY: SUSTAINING GROWTH AND STABILITY
TABLE 6.3 (continued)
Macroprudential Policies and Aims
Preventing Financial Excess Building Financial Resilience
Prud
enti
al M
easu
res
Forward-
Looking
Provisioning
Forward-looking provisioning requires the
buildup of a loss-absorbing buffer at the
time the loan is made, sharing similarities
with the countercyclical capital buffer.
However, there is a key difference between
provisioning and equity in accounting
treatment. The forward-looking provision
is not counted as bank capital and hence is
less likely to influence a bank’s business
focus—which targets a specific return on
equity. To the extent the bank uses its cap-
ital as the base for constructing its total
balance sheet, the larger the equity base,
the larger the balance sheet, and hence
the greater its use of debt to finance
assets. During a credit boom, the buildup
of assets using debt financing will contrib-
ute to a buildup of vulnerabilities.
Limits on Credit
Growth
When an economy experiences
rapid credit growth, the central
bank may impose a quantitative
ceiling on the rate of credit
growth per month or year, or a
maximum per-month or per-quar-
ter increase in lending. Such limits
to credit growth include actions
that specify a quantitative limit on
the rate of credit growth and pen-
alties for exceeding this limit.
Leverage Limits Caps on bank leverage can limit
asset growth by tying total assets
to bank equity. The rationale rests
on the role bank capital plays as a
constraint on new lending rather
than the Basel approach of using
bank capital as a buffer against
loss. The main mechanism is the
cost of bank equity, regarded by
banks as more expensive than
short-term debt. By requiring a
larger equity base to fund the
total size of the balance sheet, a
regulator can slow asset growth.
Sectoral Limits Designed to be less blunt than
dynamic capital buffers, sectoral
limits force institutions to add cap-
ital to cover new loans in sectors
that are building up excessive risks.
©International Monetary Fund. Not for Redistribution

Chapter 6 Macroprudential Policies 135
TABLE 6.3 (continued)
Macroprudential Policies and Aims
Preventing Financial Excess Building Financial Resilience
Prud
enti
al M
easu
res
Loan-to-
Deposit Limits
For domestic banks, the
loan-to-deposit ratio cap has two
effects: First, it restrains excessive
asset growth by tying loan growth
to growth in deposits. Second, it
directly affects the growth of
noncore liabilities and hence the
buildup of vulnerabilities that
arise from the liability side of the
balance sheet. In this respect,
there are similarities between the
loan-to-deposit cap and the levy
on noncore liabilities.
Loan-to-Value
and Debt-
Service-to-
Income Limits
Limits on bank lending, such as
caps on LTV and DSTI ratios, may
be a useful complement to tradi-
tional tools for bank supervision.
LTV regulations restrict the
amount of a loan to a maximum
percentage of the value of collat-
eral. DSTI caps operate by limiting
a borrower’s debt service costs to
some fixed percentage of verified
income. The macroprudential
rationale for imposing LTV and
DSTI caps is to limit bank lending
to prevent both the buildup of
noncore liabilities in funding
these loans as well as to lean
against eroding lending standards
associated with rapid asset
growth.
Levy on
Noncore
Liabilities
Excessive asset growth and
greater reliance on noncore liabili-
ties are closely related to systemic
risk and interconnectedness
between banks. In a boom when
credit is growing rapidly, the
growth of bank balance sheets
outstrips available core funding,
and asset growth is mirrored in
the greater cross-exposure across
banks.
Source: IMF staff calculations.
Note: DSTI � debt-service-to-income; LTV � loan-to-value.
©International Monetary Fund. Not for Redistribution

136 THE ASEAN WAY: SUSTAINING GROWTH AND STABILITY
MACROPRUDENTIAL POLICIES IN THE ASEAN-5
This section explores two key questions: how macroprudential policies have
evolved in the ASEAN-5 and whether macroprudential policies have complement-
ed monetary policy. The following section, in turn, analyzes the impact of macro-
prudential policies on credit and asset price cycles and whether such policies could
have dampened some of the adverse fallout from the Asian financial crisis.
How Have Macroprudential Policies Evolved in the ASEAN-5?
Since the Asian crisis, the ASEAN-5 countries have adjusted their policy
frameworks to address financial booms and busts more systematically, embark-
ing on an ambitious and broad-ranging program of economic and financial
sector reforms. The ASEAN-5 have been well ahead of the rest of the world in
recognizing the value of macroprudential policies for financial stability; they
have routinely responded to emerging systemic risks by deploying a variety of
instruments, such as loan-to-value ratios, reserve requirements, limits on cur-
rency and maturity mismatches, and adjustments in risk weights, to contain
excessive financial imbalances. Following the global financial crisis, the
ASEAN-5 financial systems were much healthier than those of many advanced
economies because policymakers across the ASEAN-5 had routinely responded
to emerging systemic risks and preserved financial resilience through a variety
of prudential instruments.
The past 30 years have witnessed a shift in the types of macroprudential tools
used by the ASEAN-5 to safeguard financial stability. A database of macropru-
dential policies by the Bank for International Settlements (BIS 2013) shows a
move away from monetary macroprudential tools to broader prudential instru-
ments for the ASEAN-5 (Figure 6.5). What might explain the shift from mone-
tary to prudential measures over time? First, reserve requirements lost their
importance as monetary policy tools after many ASEAN-5 central banks started
to adopt interest rate policy and inflation targeting.3 Second, there is growing
recognition that financial cycles, such as housing credit and house prices, have
become longer, larger, and less synchronized with real and inflation cycles
(Drehmann, Borio, and Tsatsaronis 2012). In response, policymakers in the
ASEAN-5 increasingly resorted to prudential measures to moderate credit and
asset price cycles. Third, there was a shift toward explicit macroprudential objec-
tives following the Asian financial crisis (Figure 6.6).
Although monetary prudential tools are deployed less often, they have contin-
ued to be used to safeguard financial stability in the face of turbulent economic
events. Monetary prudential tools have been employed in a countercyclical fash-
ion since 2003. Mirroring a loosening in monetary policy rates, in 2008
Indonesia, Malaysia, and the Philippines lowered banks’ reserve requirements and
3See IMF 2016. All the countries have low inflation as an objective of monetary policy, with
some of them (Indonesia, Philippines, Thailand) adopting an inflation-targeting regime.
©International Monetary Fund. Not for Redistribution

Chapter 6 Macroprudential Policies 137
1990–992000–092010–12
Source: Bank for International Settlements data.Note: ASEAN-5 = Indonesia, Malaysia, Philippines, Singapore, Thailand.
Reserverequirements
Liquidityrequirements
Other tools0
5
10
15
20
25
30
35
40
Figure 6.5. Use of Macroprudential Tools across ASEAN-5(Number of policy changes)
Monetary measures Reserve requirements
Source: Bank for International Settlements data.
Jan-
2003
May
-03
Sep-
03Ja
n-04
May
-04
Sep-
04Ja
n-05
May
-05
Sep-
05Ja
n-06
May
-06
Sep-
06Ja
n-07
May
-07
Sep-
07Ja
n-08
May
-08
Sep-
08Ja
n-09
May
-09
Sep-
09Ja
n-10
May
-10
Sep-
10Ja
n-11
May
-11
Sep-
11Ja
n-12
May
-12
–6
–4
–2
0
2
4
6
8
Figure 6.6. ASEAN-5 Macroprudential Policies: Monetary Measures(Index)
©International Monetary Fund. Not for Redistribution

138 THE ASEAN WAY: SUSTAINING GROWTH AND STABILITY
expanded liquidity provision measures to preserve orderly money market condi-
tions. All ASEAN-5 economies expanded depositor insurance guarantees. In
2011, coinciding with a large increase in capital flows, reserve requirements were
tightened. During the taper tantrum in 2013 Indonesia gave stability priority
over supporting economic activity by tightening reserve requirements and
loan-to-value ratios to contain credit growth. During summer 2015, reserve
requirements were left unchanged, but they were reduced in December 2015 in
Indonesia and in February 2016 in Malaysia.
The broadening of the macroprudential toolkit—with greater focus on the real
estate sector and credit-specific domestic prudential tools—was an attempt to
address financial stability risks marked by rising household debt and the real estate
price cycle. The use of housing-related macroprudential tools across the ASEAN-5
has grown significantly since early 2010 (Figure 6.7). Updated policy indices com-
piled by Zhang and Zoli (2014) also show increasing use of macroprudential poli-
cies, particularly housing-related measures, in the ASEAN-5 economies in the wake
of the global financial crisis. Tighter real estate–related macroprudential policies
reflected an attempt to control high real estate loan growth attributed to speculative
activities in Indonesia, Malaysia, the Philippines, and Singapore, and to tame real
estate price inflation in Indonesia and the Philippines. To build financial resilience
in the event of a large correction in asset prices, risk weights, particularly for bank
Real estate taxes Real estate taxes + LTV
Source: Bank for International Settlements data.Note: LTV = loan-to-value ratio.
Jan-
2003
May
-03
Sep-
03Ja
n-04
May
-04
Sep-
04Ja
n-05
May
-05
Sep-
05Ja
n-06
May
-06
Sep-
06Ja
n-07
May
-07
Sep-
07Ja
n-08
May
-08
Sep-
08Ja
n-09
May
-09
Sep-
09Ja
n-10
May
-10
Sep-
10Ja
n-11
May
-11
Sep-
11Ja
n-12
May
-12
–2
0
2
4
8
6
10
12
14
Figure 6.7. ASEAN-5 Macroprudential Policies–Real Estate(Index)
©International Monetary Fund. Not for Redistribution

Chapter 6 Macroprudential Policies 139
assets linked to real estate, rose in Malaysia and Thailand, and loan-to-value ratios
were tightened in Indonesia, Malaysia, and Singapore (Figure 6.8). These policies
were complemented by a rise in stamp duties, particularly in Malaysia and Singapore.
The increased use of macroprudential tools has also mirrored shifts in the
management of bank capital across the ASEAN-5. Capital requirements are a
central part of the macroprudential toolkit, and few issues in the aftermath of the
global financial crisis have been more contentious than the level of bank capital.
Raising capital requirements serves both goals of macroprudential policy: pre-
emption and resilience. Higher bank capital requirements have several benefits
from a financial stability perspective and provide a buffer that absorbs losses—in
principal, bank capital plays a preventive role through greater incentives for better
risk management (Perotti, Ratnovski, and Vlahu 2011).4
Bank capital in the ASEAN-5 has risen progressively since the Asian finan-
cial crisis and comfortably exceeds the Basel I minimum requirement of 8 per-
cent in all countries (Figure 6.9). Prudent policy would dictate that when out-
put and credit gaps are large and positive banks should have larger capital
buffers. As part of Basel III regulatory reform, banks are required to hold a
4Bank capital can limit excesses by increasing shareholders’ so-called skin in the game, which
prevents excessive risk taking, especially under conditions of asymmetric information.
Source: Bank for International Settlements data.Note: LTV = Loan-to-value ratio.
Jan-
2003
May
-03
Sep-
03Ja
n-04
May
-04
Sep-
04Ja
n-05
May
-05
Sep-
05Ja
n-06
May
-06
Sep-
06Ja
n-07
May
-07
Sep-
07Ja
n-08
May
-08
Sep-
08Ja
n-09
May
-09
Sep-
09Ja
n-10
May
-10
Sep-
10Ja
n-11
May
-11
Sep-
11Ja
n-12
May
-12
0
1
2
3
4
5
6
Figure 6.8. ASEAN-5 Macroprudential Policies: Risk Weighting(Index)
©International Monetary Fund. Not for Redistribution

140 THE ASEAN WAY: SUSTAINING GROWTH AND STABILITY
capital conservation buffer.5 While the countercyclical buffer is a relatively new
tool, simulations can be used to illustrate the appropriate level of capital given
the stages of financial and real cycles both before and after the Asian and global
financial crises.6
A countercyclical capital buffer rule would have raised banks’ capital in the
run-up to the Asian financial crisis (Malaysia and Thailand) and the more recent
global financial crisis (Indonesia, Malaysia, Thailand, Singapore) (Figure 6.9).
Although this exercise is purely illustrative and the focus is on the actual level of
bank capital rather than minimum capital requirements, a countercyclical capital
buffer would have lowered bank capital in the aftermath of the Asian financial
5This is specified as 2.5 percent of total risk-weighted assets.6An implied countercyclical capital buffer is calculated using the following equation: Capital
Adequacy = Banks’ Long-Run Capital Adequacy Ratio + 0.5 × Credit Gap + 0.3 × Output Gap.
Capital-adequacy-based rule Actual CAR
Figure 6.9. Implied Countercyclical Capital Adequacy Ratios(Percent)
1. Malaysia
1990 95 2000 05 10 1997 2000 02 04 06 08 10 12 14 16150
5
10
15
20
25
30
0
5
10
15
20
25
3. Indonesia
2. Thailand
4. Singapore
2003 04 05 06 07 08 09 10 11 12 13 14 15 160
5
10
15
20
25
0
2
4
6
8
10
12
14
16
18
20
Sources: World Bank; and authorities’ data.Note: CAR = capital adequacy ratio.
2003 04 05 06 07 08 09 10 11 12 13 14 15 16
©International Monetary Fund. Not for Redistribution

Chapter 6 Macroprudential Policies 141
crisis (Malaysia, Thailand) and following the global crisis (Indonesia, Singapore).
Despite the lack of an explicit countercyclical capital buffer policy rule, capital
adequacy in Malaysia and Thailand since the Asian financial crisis has closely
mirrored the level of capital adequacy implied under such a rule. In other
ASEAN-5 countries, the actual capital ratio has not veered substantially from the
level of capital implied by a simple countercyclical capital buffer rule. This find-
ing suggests that, whether explicitly realized or not in real time, the management
of bank capital has become more macroprudential, adjusting somewhat to excess-
es in real and financial cycles.7
The ASEAN-5 have also taken measures to manage capital inflow and outflow
surges (Figure 6.10). These measures have overlapped with macroprudential
7It has been argued that higher capital ratios are associated with a higher probability of a crisis.
This mechanism suggests that banks raise capital in response to higher-risk lending choices rather
than as a buffer against a potential systemic crisis event in the economy. Such a finding is consistent
with an empirical reverse causality mechanism reported in the data: the more risks the banking
sector takes, the more markets and regulators are going to demand that banks hold higher buffers.
See Jordà and others 2017.
Pre-GFC Post-GFC
Source: Bank for International Settlements data.
Rea
l est
ate
Dire
ctin
vest
men
t
Oth
ertr
ansa
ctio
ns0
5
10
15
20
25
30
35
40
45
Figure 6.10. ASEAN-5 Use of Capital Flow Measures(Number of policy actions)
©International Monetary Fund. Not for Redistribution

142 THE ASEAN WAY: SUSTAINING GROWTH AND STABILITY
policies to address systemic risks at times.8 Capital flows can give rise to financial
stability risks through various channels (IMF 2014a), including increases in
short-term wholesale funding of the banking system, growth in foreign currency
funding of the financial system, contributions of capital inflows to local credit
booms and asset price appreciation, and credit risks from foreign-currency-denominat-
ed loans. A database compiled by the Bank for International Settlements suggests
that Malaysia, the Philippines, and Thailand took advantage of the loosening in the
global financial cycle between 2004 and 2008 to implement measures that liberal-
ized capital inflows and outflows, with an emphasis on bank, bond, and equity
flows, and capital inflows grew significantly. The era following the global financial
crisis also saw some measures to tighten outflows.
HAVE MONETARY POLICY AND MACROPRUDENTIAL POLICIES BEEN COMPLEMENTARY?
Macroprudential policies work most successfully when monetary policy is pulling in
the same direction. Bruno, Shim, and Shin (2015) find that macroprudential policies
are not particularly effective when they lean in a direction opposite to monetary
policy. Effective monetary and macroprudential policies that complement each other
yield better outcomes than monetary—or macroprudential—policy pursued sepa-
rately. Tightening macroprudential policy tools can dampen real economic activity.
However, the authorities can counter these effects by loosening monetary policy at
the margin. Moreover, macroprudential policy can give monetary policy more room
to pursue its primary objective and can help build buffers that can be relaxed in peri-
ods of financial stress, as shown in Chapter 9. Such a policy can help keep monetary
policy transmission open, preserving its effectiveness in the event of financial stress.
Monetary and macroprudential policies in the ASEAN-5 have complemented
each other since the turn of the century. Table 6.4 shows the degree of complemen-
tarity between monetary policy and macroprudential policies for the ASEAN-5,
calculated using a pairwise correlation of various policy cycles—specifically, the
policy rate cycle and the macroprudential policy cycle as represented by cumulative
variables for macroprudential policy tightening or loosening. The correlation
between the monetary policy cycle and the macroprudential policy cycle is positive,
with a slightly stronger outcome for nonmonetary prudential tools.
A link between macroprudential and monetary policies in the ASEAN-5 should
not be surprising given the similarities and complementarities between these types
of policies. Both affect credit demand, albeit in different ways. Monetary policy
works by intertemporal allocation of spending, bringing forward spending from the
future or pushing it into the future. One way to bring spending forward is to lower
interest rates so that economic agents can borrow more sooner. In contrast,
8The policy frameworks for capital flow management measures and macroprudential policy can
overlap (IMF 2012, 2013). Capital flow management measures are designed to limit capital flows
by affecting the scale or composition of these flows. Macroprudential measures are designed to limit
systemic vulnerabilities, including those associated with capital inflows. To the extent that capital
flows are the source of systemic financial risks, the different prudential tools overlap.
©International Monetary Fund. Not for Redistribution

Chapter 6 Macroprudential Policies 143
macroprudential policy works by restraining borrowing. Monetary policy and mac-
roprudential tools also affect risk taking by banks: monetary policy works through
the so-called risk-taking channel, whereas macroprudential regulation affects finan-
cial risk taking by imposing equity constraints. Finally, monetary and prudential
policies affect bank funding costs through the net interest margin.
The ASEAN-5 have progressively altered their monetary policy stances to
complement existing macroprudential measures. This process can be observed by
examining the data during the taper tantrum episode of 2013. All countries raised
their policy rates during the Asian financial crisis to support their external posi-
tions, but eased these rates in the aftermath of the global financial crisis to sup-
port growth (Figure 6.11). Only Indonesia raised policy rates during the taper
TABLE 6.4.
Average Correlation of Monetary and Macroprudential Changes in the ASEAN-5
Policy Rate Change
Policy Rate Change 1
Monetary Prudential Tools 0.21
Nonmonetary Prudential Tools 0.27
Source: IMF staff calculations.
Indonesia Malaysia PhilippinesThailandSingapore, NEER year-over-year change (right scale)
Sources: Haver Analytics; and IMF staff estimates.
Jan-
2007
May
-07
Sep-
07Ja
n-08
May
-08
Sep-
08Ja
n-09
May
-09
Sep-
09Ja
n-10
May
-10
Sep-
10Ja
n-11
May
-11
Sep-
11Ja
n-12
May
-12
Sep-
12Ja
n-13
May
-13
Sep-
13Ja
n-14
May
-14
Sep-
14Ja
n-15
May
-15
Sep-
15Ja
n-16
1
2
3
4
5
6
7
8
9
10
11Taper
tantrumGFC Renminbi
devaluation
–5
–1
3
7
11
15
Figure 6.11. ASEAN-5: Policy Interest Rates(Percent)
©International Monetary Fund. Not for Redistribution

144 THE ASEAN WAY: SUSTAINING GROWTH AND STABILITY
tantrum to support its external position; Malaysia and the Philippines subse-
quently tightened modestly for domestic stability purposes. Singapore and
Thailand gradually eased their monetary policy stances during 2011‒12, reflect-
ing the weakening economic outlook. During the summer 2015 turbulence,
policy rates were left unchanged in all ASEAN-5 economies because policymakers
had to weigh concerns about capital flow reversals that were largely confined to
portfolio equity flows against worries about slowing economic activity. However,
not until January 2016 did Indonesia start loosening monetary policy to support
domestic demand. These episodes demonstrate the increased degree of coordina-
tion between monetary and macroprudential policies in the ASEAN-5, which
eased the burden on monetary policy to lean against unfavorable financial devel-
opments. As a result, the monetary authorities had more flexibility to pursue price
and output stability objectives while preserving the established independence and
credibility of monetary policy (see IMF 2016).
THE MACROECONOMIC IMPACT OF MACROPRUDENTIAL POLICIES IN THE ASEAN-5
Empirical evidence supports the effectiveness of macroprudential tools for
building resilience (IMF, FSB, and BIS 2016). Studies of macroprudential tools’
potential to reduce the procyclicality of credit or contain excessive credit growth
find sizable economic effects. However, the strength of the effects depends on
capital market openness and financial market development (for example, Lim and
others 2011; Cerutti, Claessens, and Laeven 2017). Strength also differs across
tools: loan restrictions and borrower eligibility tools (such as loan-to-value and
debt-service-to-income ratios) affect credit more, based on their historical calibra-
tion, than capital or liquidity tools (for example, Akinci and Olmstead-Rumsey
2015). On the other hand, borrower-based tools are generally found to have
measurable effects on credit. Tools that impose limits based on borrower income,
such as debt-service-to-income ratios, do more to contain increases in credit than
limits based on asset prices (such as loan-to-value ratios).
Canonical correlations and model simulations using data for the ASEAN-5
suggest that more active use of macroprudential policies has resulted in less risk
taking and a decline in boom-bust cycles. Three methodologies for calculating the
credit gap identify credit booms before the Asian financial crisis in all ASEAN-5
economies (see Table 6.5). Except in the case of Singapore, none of the method-
ologies show that the ASEAN-5 economies experienced credit booms in the
run-up to the global financial crisis or thereafter. In addition, for Singapore, the
first two approaches should receive more weight given the country’s high GDP
ratio as a result of its role as a financial center.
Greater use of macroprudential measures since the Asian financial crisis has
coincided with lower risk taking by banks and less reliance on noncore funding.
The ratio of total credit to broad money is a useful signal of the stage of the
financial cycle: an increase implies greater dependence on noncore bank liabilities
to finance credit expansion (see Borio and Zhou 2008; Shin and Shin 2011).
©International Monetary Fund. Not for Redistribution

C
ha
pte
r 6
Macro
pru
de
ntial Po
licies
14
5
TABLE 6.5.
Heat Map on the Evidence of Credit Booms1–4
Pre-AFC (1996–97) Pre-GFC (2007–08) Post-GFC/UMP (2009–2012) Post-Taper Tantrum (2013–15)
M&T D&O GFSR M&T D&O GFSR M&T D&O GFSR M&T D&O GFSR
Indonesia 0.09 �0.98 �0.53 �0.30 5.22 1.18 �0.29 3.76 0.89 �0.29 3.65 1.06
Malaysia 0.05 16.58 20.87 �0.23 1.38 1.22 �0.19 2.66 2.73 �0.17 2.27 2.59
Philippines 0.10 20.98 8.95 �0.36 2.14 0.58 �0.35 2.96 0.86 �0.24 7.51 2.57
Singapore �0.02 7.89 6.90 �0.12 11.16 9.25 �0.12 3.98 3.84 �0.04 4.43 5.06
Thailand 0.07 12.27 17.26 �0.25 1.60 1.40 �0.22 4.83 4.74 �0.17 3.49 4.05
Source: IMF (2016).
Note: AFC = Asian financial crisis; D&O = Dell’Ariccia and others 2012; GFC = global financial crisis; GFSR = IMF, Global Financial Stability Report, September 2011; M&T = Mendoza and Terrones 2008; UMP = unconven-
tional monetary policy.1Shades of green indicate lower threshold/early warning of credit boom; shades of red indicate that credit is above upper threshold/evidence of a credit boom.2Figures under M&T refer to the deviations of log real credit per capita from its Hodrick-Prescott trend times 1.75 the trend’s standard deviation. The deviations are averaged for the subperiods identified. Positive fig-
ures shaded in red indicate evidence of a credit boom.3Figures under D&O refer to the average growth of credit-to-GDP ratio for the subperiods identified. Figures shaded in green and red show ratio above the lower cutoff at 10 percent ratio and upper threshold at 20
percent ratio.4Figures under the IMF’s GFSR refer to the annual change in credit-to-GDP ratio in percentage points, averaged for the subperiods identified. Figures shaded in green and red identify change in credit-to-GDP ratio
above 3 percentage points and 5 percentage points, respectively.
©International Monetary Fund. Not for Redistribution

146 THE ASEAN WAY: SUSTAINING GROWTH AND STABILITY
Broad money signals changes in the size of the banking sector’s aggregate balance
sheet. It implicitly conveys the degree of risk taking in the economy along with
information on the vulnerability of the financial system to a reversal of available
funding. The ratio of credit to broad money—exceeding 100 percent—rose
sharply in the years preceding the Asian financial crisis (Figure 6.12) for
Indonesia, Malaysia, the Philippines, and Thailand, implying that this rapid cred-
it growth was increasingly financed by noncore sources. Following the crisis, as
banks shrank their balance sheets, the ratio of credit to broad money declined to
less than 100 percent for Indonesia, the Philippines, and Thailand by 2001. The
ratio has remained flat for Malaysia, the Philippines, and Thailand since then,
despite the global asset price boom and the global financial crisis.
Greater use of prudential tools has also led to more prudent bank balance sheet
management and is reflected in acyclical bank leverage. Gourinchas and Obstfeld
(2012) report leverage as a consistent and significant predictor of a financial crisis
because bank leverage is typically procyclical, with aggregate consequences for the
financial system via aggregate volatility and the price of risk (Adrian and Shin
2009). A rise in asset prices strengthens bank balance sheets and—without adjust-
ing asset holdings—leads to a decline in their leverage; banks that hold surplus
capital find ways to employ that surplus, leading to a rise in bank leverage.
ThailandMalaysiaPhilippines
Indonesia
Sources: Authorities’ data; and IMF staff calculations.
Jan-
1989
Jul-
94
Jan-
2000
Jul-
05
Jan-
11
Jul-
160
20
40
60
80
100
120
140
160
Figure 6.12. Ratio of Credit to Broad Money
©International Monetary Fund. Not for Redistribution

Chapter 6 Macroprudential Policies 147
Figure 6.13 shows that bank leverage for Indonesia, Malaysia, Singapore, and
Thailand was not procyclical, but rather appears to have been acyclical for much
of the asset price boom period of the 2000s. Data for Malaysia show that in the
year before the Asian financial crisis, on average, every unit of capital was associ-
ated with an 11 percent increase in credit growth. This rate declined to about
7.5 percent by 2010 and has stayed relatively flat since then despite strong capital
inflows. A similar pattern is also observed for Thailand, with bank leverage
declining in Indonesia and Singapore since 2010.
These developments in the ASEAN-5 are not only consistent with their greater
use of aggregate and sectoral macroprudential policies, but also with their efficacy
in moderating credit and asset price cycles since the Asian financial crisis. By
means of an event study, Figures 6.14 and 6.15 illustrate dynamic estimates using
local projections drawn from a robust panel regression model linking credit
growth and various macroprudential policy tools: bank capital, reserve require-
ments, loan-to-value ratio, property taxes, and risk-weighted assets.9 These tools
operate differently on credit demand and loan supply. The dynamic responses
show that, on average across the ASEAN-5, macroprudential measures have had
an effective impact on the credit cycle (Figure 6.14). Changes in loan-to-value
limits and reserve requirements appear, with a lag, to have the largest impact on
9See Jordà 2005 for an explanation of the local projection method.
ThailandMalaysia
SingaporeIndonesia
Sources: Authorities’ data; and IMF staff calculations.
1990 94 98 2002 06 10 140
2
4
6
8
10
12
14
16
Figure 6.13. Bank Leverage(Unit of bank capital)
©International Monetary Fund. Not for Redistribution

148 THE ASEAN WAY: SUSTAINING GROWTH AND STABILITY
the credit cycle. This outcome is perhaps not surprising, since loan-to-value limits
work directly to limit credit demand. Dynamic estimates also show that real
estate–specific measures, such as raising real estate–related taxes or tightening the
loan-to-value ratio, help reduce real estate price inflation (Figure 6.15). The
lagged effect of some prudential measures on credit and asset prices suggests that
macroprudential policies need to be forward looking to preempt financial excess-
es. Taken at face value, the empirical evidence indicates that, on average, macro-
prudential measures effectively dampened the procyclicality of credit and asset
price growth in the ASEAN-5 since the Asian financial crisis.10
10The confounding effect of the endogeneity of the policies should be kept in mind when inter-
preting the results. The introduction of macroprudential policies often reflects the external environ-
ment and the perception that surges in bank or bond capital flows may lead to destabilizing capital
outflows in any subsequent reversal. To the extent that new macroprudential policies happen only
after a period of discussion within the government, central bank, and other public authorities (such
as financial regulators), the introduction of such policies often coincides with the late stages of the
boom. To the extent that the boom subsides under its own weight, the introduction of the macro-
prudential policy and the subsequent slowdown of capital flows and credit growth would be a coin-
cidence, not a causal effect. Thus, the results reported herein should be taken with some caution.
House taxes
Reserve requirements
Risk weighting
Loan-to-value ratio
Bank capital
Sources: Authorities’ data; and IMF staff calculations.
–2.0
–1.5
–1.0
–0.5
0.0
0.5
1.0
1.5
1 6 11
Months after a tightening inmacroprudential policies
16 21
Figure 6.14. Response of Credit Growth to Macroprudential Measures(Percent)
Loan-to-value ratio(right scale)Real estate taxes
Sources: Authorities’ data; and IMF staff calculations.
–0.70
–0.60
–0.50
–0.40
–0.30
–0.20
–0.10
0.00
–0.3
–0.3
–0.2
–0.2
–0.1
–0.1
0.0
1 6 11 16 21
Months after a tightening inmacroprudential policies
Figure 6.15. Response of Real Estate Prices to Macroprudential Measures(Percent)
©International Monetary Fund. Not for Redistribution

Chapter 6 Macroprudential Policies 149
Macroprudential policies in the ASEAN-5 have also enhanced the monetary
policy transmission mechanism. Macroprudential policy can affect the transmis-
sion mechanism because the interest rate margin is a function of the compensa-
tion taken by banks for items such as administrative costs, capital costs, risk
premiums, and the banks’ profit margins. Nondynamic macroprudential instru-
ments, such as increased capital or reserve requirements, affect the net interest
margin because they tend to increase banks’ costs, which, to a certain extent, are
passed on to customers in the form of an increased interest margin. The rule for
regulation through the bank lending interest rate equation, which describes the
relationship between monetary policy and macroprudential policy, is
expressed as follows:
i t lending = i
t + δ
t ( z
t ) . (6.5)
Equation (6.5) expresses banks’ lending rate as a function of the policy interest
rate and the interest margin ( δ t ). The interest margin is influenced by regulation
( z t ), which is itself determined by non-time-varying regulations ( z ¯ ), the credit gap,
and the output gap (Ingves, Apel, and Lenntorp 2010; Shin 2011).
Model simulations suggest that the impact of macroprudential policies on the
monetary transmission mechanism via the banking system has grown since the
2000s. From estimating equation (6.5), which links macroprudential policies and
the net interest margin, dynamic responses are extracted using local projection
methods that show that a tightening in macroprudential policies leads to a rise in
the net interest margin (Figure 6.16). The impact of tightening macroprudential
regulations on banks’ net interest margin has grown for the ASEAN-5 since the
Asian financial crisis. The influence of macroprudential policies on financial
intermediaries in the ASEAN-5 has grown, reflecting their more aggressive use,
improved credibility, and increased financial deepening since the Asian crisis, all
of which have increased the sensitivity of the financial system to policy changes.
Policy simulations suggest that a modest prudential intervention would have
helped curtail the pre–Asian financial crisis credit and asset price booms in
Malaysia and Thailand. Given the lessons learned since the crisis, the question is
whether macroprudential tools, if deployed more aggressively and preemptively
in the years leading up to the crisis, could have done more to preserve financial
stability during 1996–99. Given limited data availability for the other countries,
a counterfactual experiment is performed for Malaysia and the Philippines by
simulating a set of modest macroprudential policy interventions in the years
preceding the Asian financial crisis.11 The responses of credit growth and asset
prices are then traced out based on these modest macroprudential policy
11It is worth noting that such simulations may suffer from the Lucas critique, which predicts
that the coefficients of a macroeconometric model will change when there is a change in policy
actions. However, without quarreling with the logic of the Lucas critique, Leeper and Zha (2003)
have shown that “modest” policy interventions are unlikely to bias the results, since policy changes
tend to be small and do not resemble the once-and-for-all changes in policy rules that underlie the
Lucas critique.
©International Monetary Fund. Not for Redistribution
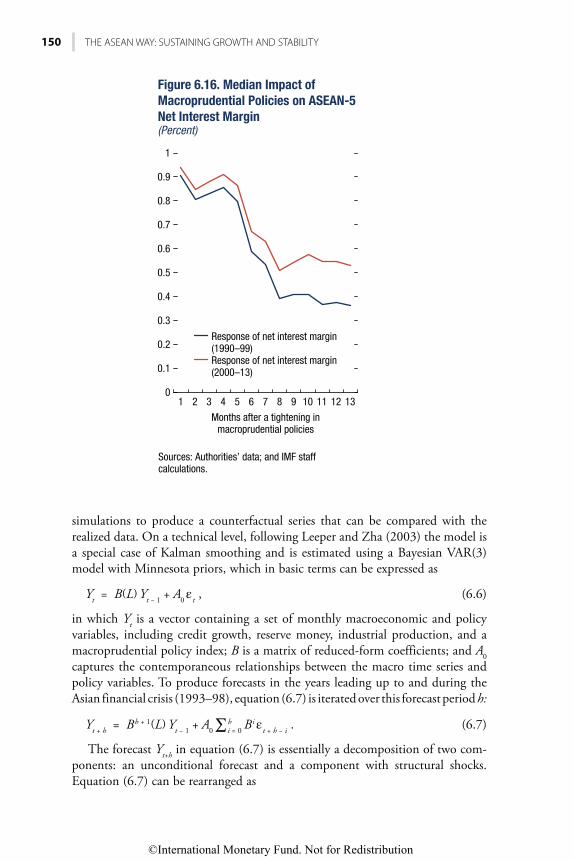
150 THE ASEAN WAY: SUSTAINING GROWTH AND STABILITY
simulations to produce a counterfactual series that can be compared with the
realized data. On a technical level, following Leeper and Zha (2003) the model is
a special case of Kalman smoothing and is estimated using a Bayesian VAR(3)
model with Minnesota priors, which in basic terms can be expressed as
Y t = B (L) Y
t − 1 + A
0 ε
t , (6.6)
in which Y t is a vector containing a set of monthly macroeconomic and policy
variables, including credit growth, reserve money, industrial production, and a
macroprudential policy index; B is a matrix of reduced-form coefficients; and A 0
captures the contemporaneous relationships between the macro time series and
policy variables. To produce forecasts in the years leading up to and during the
Asian financial crisis (1993–98), equation (6.7) is iterated over this forecast period h:
Y t + h
= B h + 1 (L) Y t − 1
+ A 0 ∑
i = 0 h B i ε
t + h − i . (6.7)
The forecast Y t+h
in equation (6.7) is essentially a decomposition of two com-
ponents: an unconditional forecast and a component with structural shocks.
Equation (6.7) can be rearranged as
Response of net interest margin(1990–99)Response of net interest margin(2000–13)
Sources: Authorities’ data; and IMF staff calculations.
1 2 3 4 5 6 7 8 9 10 11 12 13
Months after a tightening inmacroprudential policies
0
0.1
0.2
0.3
0.4
0.5
0.6
0.7
0.8
0.9
1
Figure 6.16. Median Impact of Macroprudential Policies on ASEAN-5 Net Interest Margin(Percent)
©International Monetary Fund. Not for Redistribution

Chapter 6 Macroprudential Policies 151
Y t + h
− B h + 1 (L) Y t − 1
= A 0 ∑
i = 0 h B i ε
t + h − i . (6.8)
Policy simulations show that a more aggressive macroprudential policy stance
in the years leading up to the Asian financial crisis would have helped moderate
credit and asset price cycles. The simulation assumes that the macroprudential
index for Malaysia, constructed from the Bank for International Settlements
macroprudential database, would be progressively tightened throughout 1995
until mid-1996. Figure 6.17 reports the actual time series, the out-of-sample
forecasts conditional on a tightening in the macroprudential policy index, and
68 percent probability bands for the forecasts. The estimates for Malaysia show
that credit growth, allowed to expand at a brisk pace of between 11 and 15 per-
cent from 1995 to early 1997 under the policy scenario, would have grown more
slowly than the level realized during this time; actual private sector credit growth
averaged about 30 percent between the middle of 1995 and early 1997. In gen-
eral, these findings illustrate that macroprudential policies would have been use-
ful in containing systemic vulnerabilities.
Although the use of macroprudential policy tools has grown, prudential policy
frameworks remain a work in progress, and the ASEAN-5 are striving to develop
and build appropriate institutional underpinnings for such policies. Although the
Error bands
Private sector credit growth
Prudential policy simulationforecast
Error bandsPrivate sectorcredit growth
Prudentialpolicysimulationforecast
Source: IMF staff calculations.
–30
–20
–10
0
10
20
30
40
50
60
–10
0
10
20
30
40
1990
:01
91:0
6
92:1
1
94:0
4
1990
:01
92:1
0
95:0
7
98:0
4
95:0
9
97:0
2
98:0
7
Figure 6.17. Macroprudential Policy Simulations on Credit Growth before and after the Asian Financial Crisis
1. Malaysia: Macroprudential Policy Experiment: Credit Growth
2. Philippines: Macroprudential Policy Experiment: Credit Growth
©International Monetary Fund. Not for Redistribution

152 THE ASEAN WAY: SUSTAINING GROWTH AND STABILITY
ASEAN-5 remain much more capable of weathering external shocks than when
the Asian financial crisis struck, the taper tantrum turmoil exposed several vulner-
abilities policymakers had not fully recognized. There is concern about policy-
makers’ ability to provide detailed advice on macroprudential policies—
considering information gaps—and there is still only limited experience with the
instruments. Moreover, further evolution of monetary policy frameworks is likely
in the “new normal” (Bayoumi and others 2014). Part III of the book delves into
the challenges ahead for upgrading policy frameworks for price and financial
stability in the ASEAN-5.
CONCLUSIONS
The ASEAN-5 economies have been well ahead of other regions in realizing the
value of macroprudential policies for supporting financial stability. The more
active use of macroprudential policies by the ASEAN-5 since the Asian financial
crisis is a sign that policymakers across the region have not been lulled into com-
placency by apparent macroeconomic stability. They recognize that financial
imbalances can materialize during periods of economic tranquility and benign
inflation pressure. Structural financial risks have grown as ASEAN-5 credit cycles
have become increasingly influenced by external conditions, while a low (natural)
interest rate environment over the past decade resulting from persistent low infla-
tion and supply-side improvements has increased the probability of excessive
credit growth and the buildup of asset bubbles. Evidence for the ASEAN-5
implies that financial stability will not necessarily materialize as a natural
by-product of a so-called appropriate monetary policy stance. With this in mind,
macroprudential policies have been effective in stemming the buildup of financial
risks. Event studies for the ASEAN-5 show that macroprudential tools have been
useful in containing systemic vulnerabilities and procyclical dynamics between
asset prices and credit over the past two decades. Macroprudential policies have
also complemented monetary policy and enhanced the monetary transmission
mechanism via the bank lending channel. The greater use of prudential tools has
been mirrored by a lower incidence of credit booms and more prudent bank
balance sheet management since 2000.
Macroprudential policies alone cannot prevent financial crises. The findings in
the chapter imply that central banks have strong incentives to pursue macropru-
dential policies to safeguard financial stability. However, effective measures are
also needed to ensure that macroprudential policy does not become overbur-
dened. These measures must be complemented by strong macroeconomic policies
to build a stable environment conducive to a healthy financial system.
Policymakers should be mindful that macroprudential policy is not free of costs
and that there may be trade-offs between the stability and the efficiency of finan-
cial systems. For instance, when policymakers impose high capital and liquidity
requirements on financial institutions, they may enhance the stability of the sys-
tem, but they also drive up the price of credit. Balancing benefits and costs of
macroprudential policies will often require difficult judgments. For
©International Monetary Fund. Not for Redistribution

Chapter 6 Macroprudential Policies 153
macroprudential policy to contribute to financial stability and social welfare, its
objectives need to be defined clearly and in a manner that can form the basis of
a strong accountability framework.
REFERENCES
Adrian. T., and H. S. Shin. 2009. “Prices and Quantities in the Monetary Policy Transmission Mechanism.” Staff Reports 396, Federal Reserve Bank of New York.
Akinci, Ozge, and Jane Olmstead-Rumsey. 2015. “How Effective Are Macroprudential Policies? An Empirical Investigation.” International Finance Discussion Paper 1136, Washington, DC.
Borio, C. 2012. “The Financial Cycle and Macroeconomics: What Have We Learnt?” BIS Working Paper 395, Bank for International Settlements, Basel.
Bayoumi, T., G. Dell’Ariccia, K. Habermeier, T. Mancini-Griffoli, and F. Valencia. 2014. “Monetary Policy in the New Normal.” IMF Staff Discussion Note SDN/14/3, International Monetary Fund, Washington, DC.
Borio, C., and P. Lowe. 2002. “Asset Prices, Financial and Monetary Stability: Exploring the Nexus.” Unpublished, Bank for International Settlements, Basel.
———. 2004. “Securing Sustainable Price Stability: Should Credit Come Back from the Wilderness?” BIS Working Paper 157, Bank for International Settlements, Basel.
Borio, C., and H. Zhou. 2008. “Capital Regulation, Risk Taking and Monetary Policy: A Missing Link in the Transmission Mechanism.” BIS Working Paper 268, Bank for International Settlements, Basel.
Bruno, V., I. Shim, and H. S. Shin. 2015. “Effectiveness of Macroprudential and Capital Flow Measures in Asia and the Pacific.” In Cross-Border Financial Linkages: Challenges for Monetary Policy and Financial Stability, BIS Paper 82: 185–92, Bank for International Settlements, Basel.
Cerutti, Eugenio, Stijn Claessens, and Luc Laeven. 2017. “The Use and Effectiveness of Macroprudential Policies: New Evidence.” Journal of Financial Stability 28: 203–24.
Drehmann, M., C. Borio, and K. Tsatsaronis. 2012. “Characterising the Financial Cycle: Don’t Lose Sight of the Medium Term!” BIS Working Paper 380, Bank for International Settlements, Basel.
Financial Stability Board (FSB), International Monetary Fund (IMF), and Bank for International Settlements (BIS). 2011. “Macroprudential Policy Tools and Frameworks.” Update to G20 Finance Ministers and Central Bank Governors. Basel.
Galí, J. 2014. “Monetary Policy and Rational Asset Price Bubbles.” American Economic Review 104 (3): 721–51.
———, and L. Gambetti. 2015. “The Effects of Monetary Policy on Stock Market Bubbles: Some Evidence.” American Economic Journal: Macroeconomics 7 (1): 233–57.
Gourinchas, P., and M. Obstfeld. 2012. “Stories of the Twentieth Century for the Twenty-First.” American Economic Journal: Macroeconomics 4 (1): 226–65.
Ingves, S., M. Apel, and E. Lenntorp. 2010. “Monetary Policy and Financial Stability—Some Future Challenges.” Sveriges Riksbank Economic Review 2/2010.
International Monetary Fund (IMF). 2011. Global Financial Stability Report: Grappling with Crisis Legacies. Washington, DC, September.
———. 2012. “The Liberalization and Management of Capital Flows—An Institutional View.” IMF Policy Paper, Washington, DC.
———. 2013. “Key Aspects of Macroprudential Policy.” IMF Policy Paper, Washington, DC.———. 2014a. “Staff Guidance Note on Macroprudential Policy.” Washington, DC.———. 2014b. “Staff Guidance Note on Macroprudential Policy—Detailed Guidance on Instru-
ments.” Washington, DC.———. 2016. “ASEAN-5 Cluster Report: Evolution of Monetary Policy Frameworks.” IMF
Country Report 16/176, Washington, DC.
©International Monetary Fund. Not for Redistribution

154 THE ASEAN WAY: SUSTAINING GROWTH AND STABILITY
———, Financial Stability Board (FSB), and Bank for International Settlements (BIS). 2016. “Elements of Effective Macroprudential Policies: Lessons from International Experience.” Washington, DC.
Jordà, Ò. 2005. “Estimation and Inference of Impulse Responses by Local Projections.” American Economic Review 95 (1): 161–82.
———, B. Richter, M. Schularick, and A. M. Taylor. 2017. “Bank Capital Redux: Solvency, Liquidity, and Crisis.” CEPR Discussion Paper 11934. Centre for Economic Policy Research, London.
Juselius, M., C. Borio, P. Disyatat, and M. Drehmann. 2016. “Monetary Policy, the Financial Cycle and Ultra-Low Interest Rates.” BIS Working Paper 569, Bank for International Settlements, Basel.
Kose, M. A., C. Otrok, and C. H. Whiteman. 2003. “International Business Cycles: World, Region, and Country-Specific Factors.” American Economic Review, 93 (4): 1216–1239.
Leeper, E. M., and T. Zha. 2003. “Modest Policy Interventions.” Journal of Monetary Economics 50 (8): 1673–700.
Lim, C., F. Columba, A. Costa, P. Kongsamut, A. Otani, M. Saiyid, T. Wezel, and X. Wu. 2011. “Macroprudential Policy: What Instruments and How to Use Them? Lessons from Country Experiences.” IMF Working Paper 11/238, International Monetary Fund, Washington, DC.
Miranda-Agrippino, S., and H. Rey. 2015. “World Asset Markets and the Global Financial Cycle.” NBER Working Paper 21722, National Bureau of Economic Research, Cambridge, MA.
Perotti, E., L. Ratnovski, and R. Vlahu. 2011. “Capital Regulation and Tail Risk.” IMF Working Paper 11/188, International Monetary Fund, Washington, DC.
Rafiq, S. 2016. “When China Sneezes, Does ASEAN Catch a Cold?” IMF Working Paper 16/214, International Monetary Fund, Washington, DC.
Rigobon, R., and B. Sack. 2003. “Measuring the Reaction of Monetary Policy to the Stock Market.” Quarterly Journal of Economics 118 (2): 639–69.
Shim, I., B. Bogdanova, J. Shek, and A. Subeltye. 2013. “Database for Policy Actions on Housing Markets.” BIS Quarterly Review (September).
Shin, S., and K. Shi. 2011. “Procyclicality and Monetary Aggregates.” NBER Working Paper 16836, National Bureau of Economic Research, Cambridge, MA.
Zhang, L., and E. Zoli. 2014. “Leaning against the Wind: Macroprudential Policy in Asia.” IMF Working Paper 14/22, International Monetary Fund, Washington, DC.
©International Monetary Fund. Not for Redistribution

PART III
Challenges Ahead
©International Monetary Fund. Not for Redistribution

This page intentionally left blank
©International Monetary Fund. Not for Redistribution

157
Monetary Policy in the New Normal
CHAPTER 7
INTRODUCTION
Monetary policy frameworks in members of the Association of Southeast
Nations–5 (ASEAN-5) economies have improved significantly since the Asian
financial crisis. As elaborated in Chapter 2, the clarification of price stability
objectives, including the adoption of explicit inflation targets in some countries,
and the strengthening of central bank operations and transparency have been
major milestones in the evolution of monetary policy frameworks. The transition
to more consistent forward-looking frameworks allowed ASEAN-5 economies to
withstand the global financial crisis well, as well as the commodity price cycle and
the low-inflation environment of recent years.
A decade after the global financial crisis, the global macroeconomic and
financial landscape continues to be influenced by its legacies. ASEAN-5 coun-
tries faced a protracted period during which most advanced economies’ expan-
sionary monetary policies were not well aligned with domestic economic condi-
tions in emerging market economies. Moreover, the new normal global land-
scape is expected to exhibit gradual normalization of monetary policy in
advanced economies. However, an inflation surprise could suddenly tighten
global financial conditions and prompt capital flow volatility. This global envi-
ronment will further test ASEAN-5 monetary policy frameworks in
the coming years.
This chapter focuses on the challenges posed by the new normal for ASEAN-5
monetary policy frameworks. The chapter first takes stock of the evolution of
inflation dynamics in the region during the past two decades. The analysis pro-
vides a basic framework for assessing challenges and areas for improvement in the
design and implementation of monetary policy. The chapter then presents the
current global debate on the role of monetary policy in the new normal and dis-
cusses the implications for ASEAN-5 economies.
DRIVERS OF ASEAN-5 INFLATION DYNAMICS
The gradual improvement in monetary policy frameworks since the Asian finan-
cial crisis has resulted in lower average inflation rates in the ASEAN-5, both for
This chapter was prepared by Juan Angel Garcia Morales in collaboration with Geraldine
Dany-Knedlik, Aubrey Poon, and Umang Rawat, under the guidance of Ana Corbacho.
©International Monetary Fund. Not for Redistribution

158 THE ASEAN WAY: SUSTAINING GROWTH AND STABILITY
headline and for core measures (excluding food and energy; Figures 7.1 and 7.2).
The decline in inflation was particularly noticeable after the global financial crisis.
Several factors explain the differences in inflation performance among the
ASEAN-5 countries, from the degree of development in their monetary policy
frameworks and economic structures to the fact that the region comprises both
oil producers and heavy oil importers whose inflation is strongly exposed to oil
price fluctuations.
One of the legacies of the global financial crisis has been protracted low infla-
tion. Technical innovation in extraction and production has triggered a signifi-
cant structural change in the oil and gas sector, which, coupled with low demand
pressure, may lead to commodity prices that remain below historical averages
(Baumeister and Kilian 2016). The persistent below-target inflation in some large
advanced economies (euro area, Japan) and the significant slack in the industrial
sector in some large economies (IMF 2016) may also attenuate inflation pressure
in the coming years.
Assessing potential changes in inflation dynamics is therefore fundamental to the
formulation of monetary policy. For example, to what extent can low commodity
prices and economic slack explain recent inflation dynamics? Have long-term infla-
tion expectations remained well anchored since the global financial crisis? This
section provides some quantitative evidence to answer these questions.
IndonesiaMalaysiaPhilippines
SingaporeThailand
Sources: Haver Analytics; and IMF staff calculations. Note: ASEAN-5 = Indonesia, Malaysia, Philippines, Singapore, Thailand.
–5
0
5
10
15
20
2000 02 04 06 08 10 12 14 16
(Percent)
IndonesiaMalaysiaPhilippines
SingaporeThailand
Sources: Haver Analytics; and IMF staff calculations.
–2
0
2
4
6
8
10
2005 07 09 11 13 15 17
(Percent)
©International Monetary Fund. Not for Redistribution

Chapter 7 Monetary Policy in the New Normal 159
The empirical approach relies on the estimation of a Phillips curve at the
country level, building on the hybrid New Keynesian Phillips curve specifica-
tion in Galí and Gertler 1999, among others. The benchmark specification
is as follows:
π t = β
t 1 π ¯ t + (1 − β
t 1 ) π
t − 1 MA4 + β
t 2 y ̃
t − 1 + β
t 3 π
t IM + ε
t , (7.1)
in which π t is headline consumer price inflation, π ¯ t denotes long-term inflation
expectations, π t − 1
MA4 is the moving average of inflation over the preceding four
quarters, y ̃ t − 1
is economic slack measured by the output gap, π t IM is inflation—
imported goods and services in local currency (that is, including the impact of
exchange rates)—and ε t is the estimation error and is assumed to be a Gaussian
white noise process (see Dany-Knedlik and Garcia 2018 for further details).
In terms of economic interpretation, the coefficient β t 1 determines the extent
to which inflation is driven by long-term expectations; that is, its forward-looking
component, in contrast to the influence of lagged inflation, captured by (1 − β t 1 ).
The coefficient β t 2 determines the impact of cyclical economic activity on infla-
tion; that is, the slope of the Phillips curve. The effect of import (and oil) price
inflation is captured by β t 3 . To identify changes in inflation dynamics over time—
for instance, resulting from the evolution of monetary policy regimes or changes
in the global environment, coefficients are allowed to vary over time, along the
lines of IMF 2013 and 2016 and Blanchard, Cerutti, and Summers 2015.
Measures of long-term expectations are a crucial element of the empirical
investigation. All central banks, including those of the ASEAN-5, regularly mon-
itor inflation expectations, either through surveys or by extracting expectations
from available financial instruments.1 Survey inflation expectations are a widely
used measure of the private sector’s (long-term) inflation expectations. They are
easy to collect and readily available for many countries. However, since the begin-
ning of the global financial crisis, survey-based measures of inflation expectations
have become increasingly disconnected from actual inflation dynamics, particu-
larly in many advanced economies afflicted by significant disinflation pressure.
Market-based indicators also have some important shortcomings.2
To establish a benchmark measure for long-term inflation, this section uses novel
estimates of trend inflation for ASEAN-5 economies (Garcia and Poon, forthcoming;
Figure 7.3). The qualitative results on the drivers of inflation dynamics are
1Surveys are a traditional source of information on long-term inflation expectations; they have
been available several times a year for many countries over several decades. With the issuance
of inflation-linked bonds in many advanced economies and in emerging markets, the so-called
break-even inflation rate (BEIR)—the yield spread between comparable conventional bonds and
inflation-linked bonds—has also become a crucial indicator of inflation expectations.2BEIRs often provide more timely information on investors’ inflation expectations than
survey-based expectations. Yet, in addition to expected inflation, BEIRs may incorporate other
factors, notably inflation risk and liquidity risk premiums, and are better interpreted as the overall
inflation compensation requested by investors to hold nominal assets than as a pure measure of
expected inflation. Among the ASEAN-5 countries, BEIRs are available only for Thailand.
©International Monetary Fund. Not for Redistribution

160 THE ASEAN WAY: SUSTAINING GROWTH AND STABILITY
nonetheless similar to those that use Consensus Economics survey expectations
(Figure 7.4; see also IMF 2016). Conceptually, trend inflation is the rate of inflation
expected to prevail once the effects of temporary shocks in the observed inflation rate
dissipate. Trend inflation is therefore a natural measure of future inflation, and the
level of inflation expectations in the private sector should hold.
Empirical estimates of trend inflation in the ASEAN-5 countries confirm
some important weaknesses in long-term inflation expectations from surveys
(Figure 7.5). Compared with trend inflation measures, survey measures of infla-
tion expectations for ASEAN-5 economies do have a quantitatively important
level bias,3 in line with recent findings for the United States (Chan, Clark, and
Koop 2015) and the euro area (Garcia and Poon, 2018). Recent literature sug-
gests that these biases are the result of informational rigidities (Coibion and
Gorodnichenko 2015; Mertens and Nason 2015).4 Specifically, although they
3For a detailed discussion of the relationship between trend inflation and survey measures in
ASEAN-5 economies across additional dimensions, see Garcia and Poon, forthcoming-a.4Coibion and Gorodnichenko (2015) provide regression evidence that survey forecasts’ departure
from full rationality may be related to information rigidities leading to a sluggish adjustment in
(US) survey expectations. Such an interpretation is consistent with findings for euro area surveys.
Mertens and Nason (2015) model inflation and survey expectations jointly, allowing the strength
of the information rigidities to vary over time using an additional latent state and incorporating
autoregressive dynamics and trend inflation.
MalaysiaIndonesiaPhilippinesThailand
1995 99 2003 07 11 15
Sources: Garcia and Poon, forthcoming-a; and Consensus Economics forecasts.
0
1
2
3
4
5
6
7
8
9
(Percent)
ThailandIndonesiaMalaysia
SingaporePhilippines
Sources: Garcia and Poon, forthcoming-a; and Consensus Economics forecasts.
0
1
2
3
4
5
6
7
8
9
Figure 7.4. Consensus Long-Term
(Percent)
1995 99 2003 07 11 15 17
©International Monetary Fund. Not for Redistribution

Chapter 7 Monetary Policy in the New Normal 161
exhibit some significant fluctuation over time, survey measures tend to be well
above the level implied by long-term trend inflation, even when accounting for
standard estimation uncertainty. Furthermore, survey measures also appear to be
quite disconnected from official targets in the inflation-targeting ASEAN-5 cen-
tral banks (Indonesia, Philippines, Thailand).
Since the Asian financial crisis, inflation expectations have gradually become
the most important driver of inflation dynamics across ASEAN-5 countries. This
evidence is consistent with the conclusions reached in Chapter 2, confirming the
forward-looking orientation of ASEAN-5 monetary policy frameworks. To illus-
trate the contributions of the different inflation drivers across the ASEAN-5,
Figure 7.6 shows the median contribution of long-term expectations (that is,
forward-looking dynamics), economic slack (measured by the output gap),
non-oil import price inflation, and oil price inflation across countries and over
Consensus 6–10 year
Consensus 6–10 year
Consensus 6–10 year
Consensus 6–10 year
(Percent)
1. Indonesia 2. Malaysia
1996 98 2000 02 04 06 08 10 12 14 16
1996 98 2000 02 04 06 08 10 12 14 16
1996 98 2000 02 04 06 08 10 12 14 16
1996 98 2000 02 04 06 08 10 12 14 16
1.0
1.5
2.0
2.5
3.0
3.5
4.0
4.5
5.0
4. Thailand
1.5
2.0
2.5
3.0
3.5
4.0
4.5
5.0
5.5
1.5
2.0
2.5
3.0
3.5
4.0
4.5
5.0
5.5
3
4
5
6
7
8
9
©International Monetary Fund. Not for Redistribution

162 THE ASEAN WAY: SUSTAINING GROWTH AND STABILITY
time.5 By 2016, inflation expectations explained, on average, 60 percent of infla-
tion dynamics in the region, well above economic slack, non-oil import price
inflation, and oil price inflation, with each of these drivers explaining only about
10 percent. This result implies a substantial increase in the forward-looking com-
ponent in inflation dynamics in ASEAN-5 countries since the Asian financial
crisis, from about 40 percent between 1996 and 2001 to more than 65 percent
thereafter. Close alignment of long-term inflation trends and inflation expecta-
tions with the central bank inflation target makes inflation dynamics more for-
ward looking. This is critical to increasing the resilience of actual inflation to
temporary shocks; for instance, from subdued commodity oil prices. In recent
years, however, the decline in the contribution of inflation expectations during
two challenging episodes for monetary policy; that is, the global financial crisis
and the recent disinflation period, is also noticeable.
5To focus on the contributions of the main drivers in the rest of the section, the estimated impact
of inflation persistence in equation (7.1) is replaced by iterating over the other factors (see also IMF
2016). To sharpen the discussion, particularly of the disinflation episode during 2014–16, the contribu-
tion of import price inflation is decomposed into non-oil import price inflation and oil price inflation
by means of a regression on oil price inflation over a rolling window ordinary least squares estimation.
Forward-looking dynamics Output gap
Source: World Bank, Global Financial Development Database.Note: For additional details see Dany-Knedlik and Garcia, forthcoming. The model is estimated
20
30
40
50
60
70
80
90
100
(Percent)
1996 98 2000 02 04 06 08 10 12 14 16
©International Monetary Fund. Not for Redistribution

Chapter 7 Monetary Policy in the New Normal 163
The quantitative impact of economic slack on inflation dynamics has declined
across ASEAN-5 countries since the Asian financial crisis. This outcome suggests
a flattening of the Phillips curve, as has been the case in many inflation-targeting
and advanced economies over the past two decades (IMF 2016). Although the
contribution of the output gap has been steadily declining and has remained
relatively limited overall, its role strengthened around times of economic crisis,
particularly around the time of the global financial crisis. Considering that the
ASEAN-5 countries weathered the global crisis somewhat better than many
advanced economies, the impact of the output gap around crisis periods points to
potential specific effects, and maybe nonlinearities, that may not have been fully
captured by the time-varying coefficients used. The results, however, match
empirical findings of a muted impact of economic activity on inflation dynamics
in advanced economies during the global crisis (Watson 2014, among others).
This may have important implications for monetary policy in ASEAN-5 econo-
mies. For example, countries such as Singapore and Thailand—particularly
affected by disinflation pressure triggered by low oil prices since 2014 and still
facing below-target inflation—may be experiencing a recovery in inflation during
the ongoing improvement in economic activity that is weaker than in the past.
The euro area and Japan also provide examples of unusually weak responses of
inflation to an acceleration in economic growth.
The quantitative importance of oil and non-oil import price inflation has also
declined during the past two decades. Over the entire sample, these two compo-
nents explained almost 20 percent of average inflation across the ASEAN-5
region. Their contributions have, however, fluctuated significantly. Both oil and
non-oil import price inflation were major drivers of inflation during the Asian
financial crisis, but their relevance has diminished substantially since then.
Moreover, in the first part of the sample, 1996 to 2006, their contributions were
highly correlated. In the second part of the sample, in contrast, they exhibited
little correlation. These differences seem to reflect the higher degree of exchange
rate flexibility now prevailing in the region compared with the late 1990s and
early 2000s, leading to a lower impact from exchange rate adjustments in import
inflation and a larger effect of global market prices.
The evolution of ASEAN-5 inflation dynamics reflects important structural
changes since the Asian financial crisis. Differences between inflation dynamics
with and without time variation in parameters help gauge the quantitative impor-
tance of those structural changes. Figure 7.7 reports the percentage contribution
of the main inflation drivers discussed above that would have been unaccounted
for using a constant-parameter model. The most important change to account for
is the contribution of forward-looking dynamics, particularly during the 2000s,
until the start of the global financial crisis, and during the most recent disinflation
episode since 2014. Both episodes illustrate that capturing improvements in the
ASEAN-5 monetary policy frameworks leads to larger contributions from infla-
tion expectations to overall inflation dynamics, which, in the latter period, have
provided substantially greater stability to inflation. Time variation in the slope
parameter of the Phillips curve was most relevant during the Asian crisis, but was
©International Monetary Fund. Not for Redistribution

164 THE ASEAN WAY: SUSTAINING GROWTH AND STABILITY
also influential during the expansion ahead of the global crisis. This evidence
corroborates the importance of output gap contributions when actual economic
activity deviates significantly from potential, in any direction. In addition, when-
ever time parameter variation is ignored, external influences arising from non-oil
and oil import price contributions may tend to be underestimated.
The main insights are as follows:
• The rise in forward-looking inflation dynamics between the Asian and global
financial crises was broadly shared among the ASEAN-5. However, interquartile
and quartile ranges suggest some heterogeneity, likely capturing the different
speeds of improvement in monetary frameworks. Since the global crisis there has
been a slight decrease in both the median and the dispersion across countries,
Figure 7.7. Contributions from Time-Varying Parameters(Percent)
1. Forward-Looking Dynamics 2. Economic Slack (Output gap)
1996 98 2000 02 04 06 08 10 12 14 16 1996 98 2000 02 04 06 08 10 12 14 16
1996 98 2000 02 04 06 08 10 12 14 161996 98 2000 02 04 06 08 10 12 14 16
–20
–15
–10
–5
0
5
10
15
20
–15
–10
–5
0
5
10
–20
–15
–10
–5
0
5
10
15
20
25
30
–35
–30
–25
–20
–15
–10
–5
0
5
10
15
Source: Authors’ estimates.
©International Monetary Fund. Not for Redistribution

Chapter 7 Monetary Policy in the New Normal 165
suggesting more similar challenges for monetary policy. (There is still a negative
skew that reflects mainly Thailand’s position at the low end of the distribution.)
• The impact of economic slack on inflation dynamics has been much more
stable (although still low) over time and across countries, with narrow inter-
quartile ranges. The large number of extreme values reflects simply the
higher impact when the output gap is large, which, in turn, confirms that
business cycles are relatively synchronized across ASEAN-5 countries.
• Country dispersion in the contributions of non-oil and oil import price
inflation is more significant and reflects both differences in the evolution of
the underlying variables and the quantitative differences of estimated
parameters across countries. The decline in non-oil contributions over time
seems to be strongly shared across countries. For oil price contributions, the
decline is quite natural given that the ASEAN-5 country group includes
both heavy oil importers (Thailand) and oil producers (Indonesia, Malaysia).
CHALLENGES AHEADMonetary policy frameworks across the globe are likely to continue evolving in
coming years. Significant uncertainty surrounds the key characteristics of future
1996–2001 2002–08 2009–13 2014–16
Source: Authors’ estimates.
estimates that are 1.5 times the interquartile range) are represented by .
Countries
–1
2
1
0
3
4
5
6
7
8
–5
–2
–3
–4
–1
0
1
2
3
4
–3
–2
1
0
–1
2
3
4
5
6
7
–2
–0.5
–1
–1.5
0
0.5
1
1.5
2
2.5
©International Monetary Fund. Not for Redistribution

166 THE ASEAN WAY: SUSTAINING GROWTH AND STABILITY
Forward-looking Economic slack (output gap) Oil priceNon-oil import prices Residual
(Percent)
2001 02 03 04 05 06 07 08 09 10 11 12 13 14 15 16–10
–5
0
5
10
15
20
25
–6
–4
–2
0
2
4
6
8
10
–6
–4
–2
0
2
4
6
8
10
12
14
–10
–5
0
5
10
15
Source: Authors’ estimates.
–8
–6
–4
–2
0
2
4
6
8
10
12
1996 98 2000 02 04 06 08 10 12 14 161996 98 2000 02 04 06 08 10 12 14 16
1996 98 2000 02 04 06 08 10 12 14 16
1998 2000 02 04 06 08 10 12 14 16
©International Monetary Fund. Not for Redistribution

Chapter 7 Monetary Policy in the New Normal 167
monetary policy regimes, but some general aspects have already become the focus
of significant attention in recent years. For example, the new normal global envi-
ronment is likely to exhibit low natural interest rates that may constrain monetary
policy space and pose a significant challenge for monetary policy to deliver
healthy inflation levels. There also seems to be ample consensus that central banks
are likely to communicate more actively than they did before the global financial
crisis (Blinder and others 2016)6 and that strongly anchored long-term inflation
expectations may be even more important in such an environment. Yet there is
still no consensus on the usefulness of some of the unconventional monetary
policies introduced during the global financial crisis in the regular conduct of
monetary policy or their application to emerging markets.
In addition, central banks may also be tasked with broader mandates, such as
financial stability, and may need to use macroprudential tools more extensively.
The formal interaction between standard objectives (price and output stability)
and financial stability considerations in the implementation of monetary policy,
however, remains an area of important debate in both academic and policy circles.
Current conditions and the outlook facing the ASEAN-5 economies matter for
the challenges they face and the implications for monetary policy frameworks. On the
one hand, countries such as Singapore and Thailand seem to have been more severely
affected by the declines in oil and commodity prices since 2014 and experienced a
protracted period of very low (or even negative inflation) (Figure 7.10). On the other
hand, although inflation has also experienced some volatility in Indonesia, Malaysia,
and the Philippines since 2014, it has remained well in positive territory, and in most
cases fairly close to central bank inflation targets. The rest of this section discusses
issues that may become more relevant for the ASEAN-5 countries in the near future.
Adjusting to the New Normal Global Environment
Monetary policymaking in the ASEAN-5 will likely continue to be influenced by
the global macroeconomic and financial environment that emerged from the
global financial crisis in many advanced economies. This section elaborates on
three aspects of that new normal global landscape: (1) the normalization of mon-
etary policy in the advanced economies, (2) the factors behind an inflationless
economic recovery from the global crisis, and (3) low natural rates of interest.
As the recovery from the global crisis gains a firmer footing, some advanced
economy central banks—most notably the US Federal Reserve—have started
normalization following the extraordinary monetary stimulus. As shown in
Chapter 4, US monetary policy and the global financial cycle have had important
6Blinder and others (2016) collected the views of central bank governors and academics by means
of two independent surveys conducted between February and May 2016. Their results were based
on 55 replies from central banks from 16 advanced economies, 32 Bank for International Settle-
ments members, 20 inflation-targeting countries, and 12 countries hit by the financial crisis. The
second survey yielded 159 replies from academic economists from the relevant research programs of
the National Bureau of Economic Research and the Centre for Economic Policy Research.
©International Monetary Fund. Not for Redistribution

168 THE ASEAN WAY: SUSTAINING GROWTH AND STABILITY
spillovers on financial conditions in ASEAN-5 countries. In the current circum-
stances, however, the impact of higher US interest rates on global financial mar-
kets may be more uncertain. First, the normalization of US monetary policy
interest rates implies decoupling of the US monetary policy stance from that of
advanced economies that may need to remain accommodative longer. Moreover,
although there is broad consensus that normalization of US policy rates is in
general good news for the global economy, the pace of implementation is more
controversial. Given the uncertainty surrounding the economic outlook, the pace
of normalization of US monetary policy will also be subject to uncertainty. With
(Percent)
1. Indonesia 2. Malaysia
–3
–2
–1
0
1
2
3
4
5
6
–4
–2
0
2
4
6
8
10
3. Philippines 4. Thailand
–3
Jan-
2014
Apr-
14Ju
n-14
Oct
-14
Jan-
15Ap
r-15
Jul-
15O
ct-1
5Ja
n-16
Apr-
16Ju
l-16
Oct
-16
Jan-
17Ap
r-17
Jul-
17O
ct-1
7
Jan-
2014
Apr
-14
Jun-
14O
ct-1
4Ja
n-15
Apr
-15
Jul-
15O
ct-1
5Ja
n-16
Apr
-16
Jul-
16O
ct-1
6Ja
n-17
Apr
-17
Jul-
17O
ct-1
7
Jan-
2014
Apr
-14
Jun-
14O
ct-1
4Ja
n-15
Apr
-15
Jul-
15O
ct-1
5Ja
n-16
Apr
-16
Jul-
16O
ct-1
6Ja
n-17
Apr
-17
Jul-
17O
ct-1
7
Jan-
2014
Apr-
14Ju
n-14
Oct
-14
Jan-
15Ap
r-15
Jul-
15O
ct-1
5Ja
n-16
Apr-
16Ju
l-16
Oct
-16
Jan-
17Ap
r-17
Jul-
17O
ct-1
7
–2
–1
0
1
2
3
–1
0
1
2
3
4
5
6
Sources: Authorities’ data; and authors’ calculations.
Food Core Headline
©International Monetary Fund. Not for Redistribution

Chapter 7 Monetary Policy in the New Normal 169
the gradual move to flexible exchange rates and the buildup of buffers, the
ASEAN-5 countries are well prepared to face global financial volatility if there is
a bumpy exit from unconventional monetary policies in advanced economies.
Considering the inflationless recovery in most countries in recent years, the
shape of the Phillips curve, a benchmark framework for the analysis of inflation
dynamics in most central banks, has been the subject of much debate. Although
recent empirical evidence suggests a flattening of the Phillips curve (for example,
Blanchard, Cerutti, and Summers 2015; Ball and Mazumder 2011; Kiley 2015),
the focus of those analyses was mainly the surprisingly high inflation observed
during the early stages of the global financial crisis in many advanced economies.
This high inflation was often justified by the strong anchoring of inflation expecta-
tions and the presence of “shadow economic slack” (an unusual divergence between
unemployment and overall labor market slack). Yet the low inflation in advanced
economies during the ongoing economic recovery in recent years has further sup-
ported the presence of a weaker link between growth and inflation, at least temporarily.
For ASEAN-5 economies, the evidence presented in the section “Drivers of
Asean-5 Inflation Dynamics” is also broadly consistent with the main findings for
advanced economies. The strong role of long-term inflation expectations and
their anchoring and the relatively low quantitative impact of economic slack on
inflation dynamics, except during major recessions, are two key pieces of evidence
with which to assess the region’s outlook for inflation. For example, ASEAN-5
countries particularly afflicted by low inflation (Singapore, Thailand) have also
experienced relatively weak inflation dynamics in recent years despite an improve-
ment in growth, in line with the experience of many advanced economies.
There is increasing evidence of a decline in natural real rates worldwide (from
about 4 percent in the late 1990s to close to zero in recent years). Against this
backdrop the surge in research on the level of interest rates is not surprising
because the natural real rate has important implications for monetary policy (for
example, Yellen 2015). The natural real interest rate is usually defined as a real
interest rate consistent with an economy’s achievement of both potential output
and price stability. In other words, it is the interest rate at which real GDP equals
potential GDP and the inflation rate equals the inflation target. Recent estimates
corroborate a dramatic decline in natural interest rates in Europe, the United
Kingdom, and the United States since the start of the global financial crisis.7 In
Asia, natural rates have also fallen in advanced economies (Australia, Japan,
Korea), while in ASEAN-5 countries and other emerging markets they have
remained relatively stable (Figure 7.11).
7See, among others, Laubach and Williams 2003, 2016; and Lubik and Matthes 2015. Results
are generally model based, using either semistructural time series and filtering methods or formal
(dynamic stochastic general equilibrium) macroeconomic models to examine the relationship
between the equilibrium real interest rate and its possible determinants. Regardless of the specific
methodology used, a common finding in these studies is that the equilibrium real interest rate has
declined in recent years to a level not seen in decades.
©International Monetary Fund. Not for Redistribution

170 THE ASEAN WAY: SUSTAINING GROWTH AND STABILITY
Further research is needed to understand the reasons behind the lower natural
rates. Global supply and demand for funds, shifting demographics, slower trend
productivity and economic growth, emerging markets’ search for large reserves of
safe assets, and a more general global savings glut have been proposed as possible
causes (Council of Economic Advisers 2015; Rachel and Smith 2015; Caballero,
Farhi, and Gourinchas 2016). Most of these causes bear little relationship to
monetary policy, at least in the short term. Nevertheless, they reflect global trends
that seem likely to be part of the new normal, particularly in advanced economies.
And in a widely integrated economic and financial world, they are likely to affect
monetary policymaking in other countries as well.
Evidence on the evolution of natural real rates in ASEAN-5 countries is mixed.
Natural real rates in Indonesia, Malaysia, and Singapore have remained relatively
stable. In contrast, the Philippines has experienced a significant decline in natural
rates during the past two decades. In all those cases, the estimated level of the
natural real rates remains somewhat higher than those for most advanced econo-
mies in recent years. Thailand seems to be in a different position, with a per-
sistently lower natural rate than the other ASEAN-5 countries and, with the
exception of Japan, than even most advanced economies.
A lower natural rate of interest has important implications for optimal imple-
mentation of monetary policy. A decline in natural real rates that turns out to be
1990–99 2000–07 2014–16
Source: IMF staff calculations using the methodology in Lubik and Matthes 2015.
Phili
ppin
es
Sing
apor
e
Mal
aysi
a
Indo
nesi
a
Aust
ralia
Kore
a
Japa
n
Uni
ted
King
dom
Uni
ted
Stat
es
Thai
land
0.0
0.5
1.0
1.5
2.0
2.5
3.0
3.5
4.0
Figure 7.11. Selected Economies: Real Natural Interest Rates(Percentage points)
©International Monetary Fund. Not for Redistribution

Chapter 7 Monetary Policy in the New Normal 171
permanent, or at least highly persistent, as evidence suggests, would affect the
appropriate stance of monetary policy. A central bank that fails to acknowledge a
lower natural rate may set nominal policy rates too high, risking inflation rates
that run below the inflation objective over time. Moreover, measurement of the
natural rate of interest, similar to potential output, remains subject to significant
uncertainty. Against this backdrop simple monetary policy rules—for example,
those in which the first difference of the policy rate is a function of the deviation
of inflation from its objective and the first difference of the output gap—can serve
as broad guidance and perform well (Orphanides and Williams 2002).
Central banks in ASEAN-5 economies have not been constrained by the zero
lower bound on their policy rates. However, in economies with very low natural real
interest rates and low inflation, the possibility of a zero lower bound has become
more likely, even from small shocks to economic activity. A numerical example
based on a stylized monetary policy framework comprising a standard Taylor rule
and a Phillips curve (as equation (7.1)) can illustrate this point. In Indonesia, given
current inflation expectations and the natural real rate, real GDP growth would
have to deteriorate to –0.15 percent for the nominal policy rate to hit the zero lower
bound. In Thailand, facing lower inflation expectations and natural real rates, it
would take a much smaller growth shock. Real GDP growth could fall to just 2 per-
cent for the nominal policy rate to hit the zero lower bound. Such a difference of
more than 2 full percentage points of real GDP growth gives significantly greater
room for conventional monetary policy to operate and mitigate output losses.
Moreover, any decline in inflation expectations would further increase the probabil-
ity of the zero lower bound and the associated costs to economic activity. Kiley and
Roberts (2017) study the frequency and potential costs of effective zero bound
episodes in economic models. They advocate raising inflation targets and pursuing
a very accommodative monetary policy stance to steer inflation above target when-
ever possible and gain additional space for monetary policy in the future.
Upgrading Monetary Policy Frameworks
In the new normal global environment, monetary policy frameworks in ASEAN-5
countries will likely need to continue adapting to uncertain and volatile economic
and financial conditions. This section elaborates on three crucial challenges for
ASEAN-5 monetary policy frameworks for the period ahead: (1) enhancing com-
munication and transparency, (2) strengthening the monitoring of long-term
inflation expectations, and (3) in countries that may face recurrent episodes of
low (and below-target) inflation, considering unconventional monetary policies,
higher inflation targets, and synergies with other policies.
Enhancing communication and transparency
Effective central bank communication is essential for managing inflation expecta-
tions and their impact on inflation dynamics. As economic structures and the
monetary policy regime evolve over time, effective communication about the cen-
tral bank’s objectives and strategy and the rationale for its decisions, along with the
©International Monetary Fund. Not for Redistribution

172 THE ASEAN WAY: SUSTAINING GROWTH AND STABILITY
macroeconomic outlook, become critical for guiding private sector expectations and
enhancing monetary policy effectiveness (for example, Blinder and others 2008).
ASEAN-5 central banks’ transparency has increased significantly over the past
two decades, but there is scope for improvement. To strengthen monetary policy
independence after the Asian financial crisis, all ASEAN-5 countries increased
their exchange rate flexibility and made significant improvements in their operat-
ing frameworks, definition of policy objectives, and communication. Establishing
price stability as a primary objective and explaining monetary policy decisions in
publicly available reports are currently regular features across ASEAN-5 central
banks. Indonesia, the Philippines, and Thailand—the flexible inflation-targeting
countries among the ASEAN-5—also established explicit medium-term inflation
targets. Indeed, an index of central bank transparency shows that from low scores
of between 2 and 4 points in 1998, the transparency of ASEAN-5 central banks
improved substantially (Indonesia, Philippines, and Thailand up to 9–10 points
and Malaysia and Singapore 5–6 points in 2014; Dincer and Eichengreen 2014;
Figure 7.12).8 However, those improvements coincided with a global trend
8It is important to note that Malaysia and Singapore are somewhat penalized in the index for
not having an official figure for their inflation target even though their central bank mandates stress
price stability.
Top 5 Indonesia Malaysia Philippines Singapore Thailand
1998 2000 02 04 06 08 10 12 14
Source: Dincer and Eichengreen 2014. Note: Top 5 = the top 5 central banks in the ranking: central banks of the Czech Republic, Hungary, Israel, New Zealand, and Sweden.
Economic (3): information used for monetary policy decisions (data, model, central bank forecast)
Policy (3): disclosure of decisions (prompt announcement, explanations, forward guidance)
of goals, explanation of decisions’ contribution to goals).
0
2
4
6
8
10
12
14
16
Figure 7.12. ASEAN-5 Central Banks: Dincer-Eichengreen Central Bank Transparency Index
©International Monetary Fund. Not for Redistribution

Chapter 7 Monetary Policy in the New Normal 173
among central banks, and compared with the top five central banks in the rank-
ing, there is generally still room for improvement in transparency.
Central bank transparency scores and the degree of forward-looking inflation
dynamics are strongly linked in ASEAN-5 countries. From a theoretical point of
view, effective communication and transparency by the central bank should suc-
cessfully align public long-term expectations with the inflation target and ensure
a substantial degree of forward-looking behavior in price setting and inflation
dynamics. The empirical results discussed in the previous section provide strong
support for these theoretical considerations: both the time-varying estimates of
the forward-looking coefficient, t 1, and the overall time-varying contribution of
long-term inflation expectations, t 1� –t, have been positively related to the evolu-
tion of the Dincer-Eichengreen transparency score for each country (see
Figures 7.13 and 7.14).
Looking ahead, the challenge for effective communication by ASEAN-5 cen-
tral banks lies in the quality of information. Transparency about the responses to
a rapidly evolving macroeconomic environment and the uncertainty surrounding
the economic outlook, both at the domestic and the global level, as well as the
necessary adjustments in monetary policy frameworks to cope with them, are
likely to be fundamental parts of effective central bank communication.
0 2 4 6
DE central bank transparency index, ASEAN-5
8 10 12
Sources: Dincer and Eichengreen 2014; and Dany-Knedlik and Garcia, forthcoming.Note: DE = Dincer-Eichengreen.
0.0
0.2
0.4
0.6
0.8
1.0
0 20
2
4
6
8
10
12
4 6
DE central bank transparency index, ASEAN-5
8 10 12
Sources: Dincer and Eichengreen 2014; and Dany-Knedlik and Garcia, forthcoming.Note: DE = Dincer-Eichengreen.
Con
trib
utio
n of
forw
ard-
look
ing
dyna
mic
s
Figure 7.14. Contribution of Forward-Looking Dynamics and Central Bank Transparency
©International Monetary Fund. Not for Redistribution

174 THE ASEAN WAY: SUSTAINING GROWTH AND STABILITY
Strengthening the monitoring of long-term inflation expectations
Improving the monitoring of long-term inflation expectations should be a top
priority in the research agenda of ASEAN-5 central banks. The presence of a
systematic discrepancy between survey expectations and inflation targets sug-
gests that there is scope for strengthening the anchoring of inflation expecta-
tions in the region. Adding trend inflation estimates, such as those shown ear-
lier in this chapter, to the regular tools that central banks use can inform
monetary policymaking decisions, provide reliable information about long-term
inflation trends, and help cross-check survey expectations. Trend inflation esti-
mates have been more aligned with the inflation targets announced by the
ASEAN-5 central banks, particularly in Indonesia. In the Philippines, trend
inflation has been below target since 2014, but it is now on a gradual return
path to the 3 percent target level. In contrast, in Thailand, trend inflation has
been on a slow downward path since 2014, which may pose a more serious
challenge for monetary policy. The analysis of trend inflation should help better
assess the stance of monetary policy in these economies.
The evolution of trend inflation and the uncertainty surrounding the esti-
mates also provide some important insights about the anchoring of inflation and
the challenges for central bank communication. For example, trend inflation in
Malaysia since 2005 has been significantly more variable than in Thailand and
Indonesia. This difference may have occurred because Thailand and Indonesia
adopted explicit targets for inflation, helping reduce uncertainty about long-term
inflation trends. The evidence in the earlier part of this chapter, however, shows
that Bank Negara Malaysia has nonetheless conducted its monetary policy effec-
tively since 2005. Hence, trend inflation estimates may provide insights helpful
to monetary policy regardless of the specific regime in place.
There is also scope for using the information from survey measures of inflation
expectations more systematically. The level of long-term inflation expectations is
just one dimension of their anchoring. For example, the degree of disagreement (the standard deviation of the point forecast among the survey participants) also
provides information: if inflation expectations are well anchored around a given
level—the central bank’s midpoint target—all survey panelists’ expectations
should be very close to that value, and the discrepancy among panelists should be
relatively limited. For ASEAN-5 economies, evidence from Consensus Forecasts
suggests substantial disagreement among survey panelists—for example, on aver-
age, well above that for other successful inflation-targeting countries in the Asia
and Pacific region, such as New Zealand (Figure 7.15).
Policy responses against protracted periods of low inflation
The global financial crisis triggered significant changes in the practice of mone-
tary policy. Many advanced economies faced serious disinflation pressure, cut
policy rates to the zero lower bound or negative territory, and adopted unconven-
tional monetary policies. Most of the policies adopted in advanced economies
were introduced to improve financial and economic conditions rather than as a
©International Monetary Fund. Not for Redistribution

Chapter 7 Monetary Policy in the New Normal 175
planned modification to existing monetary policy frameworks. As a reference,
Table 7.1 provides a taxonomy of unconventional monetary policies. Whether the
changes in the practice of monetary policy, motivated primarily by the financial
crisis, will be temporary or permanent is uncertain at this point (Blinder
and others 2016).
The unconventional monetary policies adopted by various central banks
were understandably chosen to take into account the characteristics of each
country’s monetary policy transmission channels. In addition, the effectiveness
of monetary policy in general, but of unconventional monetary policies in par-
ticular, depends strongly on the characteristics of the financial market and the
financial sector structure through which they operate. For example, the impact
of credit-easing policies depends on the conditions under which economic
agents obtain financing (that is, the proportion of loan- versus market-based
financing, degree of securitization, and so on). These considerations are import-
ant to bear in mind when assessing the potential application of unconventional
monetary policies in other countries. Reliable quantitative evidence to assess the
potential usefulness of unconventional monetary policies remains scarce; there-
fore, there is no consensus on their usefulness for the regular conduct of
monetary policy.
Most available evidence on the usefulness of unconventional monetary policies
focuses on situations in which the zero lower bound became a binding constraint
for monetary policy. The introduction of unconventional monetary policies in
Thailand Korea Indonesia MalaysiaPhilippines Singapore New Zealand
Apr-
2007
Oct
-07
Apr-
08O
ct-0
8Ap
r-09
Oct
-09
Apr-
10O
ct-1
0Ap
r-11
Oct
-11
Apr-
12O
ct-1
2Ap
r-13
Oct
-13
Apr-
14Ju
l-14
Oct
-14
Jan-
15Ap
r-15
Jul-
15O
ct-1
5Ja
n-16
Apr-
16Ju
l-16
Oct
-16
Jan-
17Ap
r-17
Source: Consensus Forecasts.
0.0
0.5
1.0
1.5
2.0
2.5
©International Monetary Fund. Not for Redistribution

176 THE ASEAN WAY: SUSTAINING GROWTH AND STABILITY
many advanced economies followed the full use of space for conventional mone-
tary policy. Hence, this evidence offers only indirect guidance for assessing wheth-
er unconventional policies should be used even when there is still room for con-
ventional monetary policy. Recent research (for example, Quint and Rabanal
2017) finds that the benefits of unconventional monetary policies depend criti-
cally on the types of economic shocks hitting the economy. There are generally
significant benefits in the presence of severe financial shocks, but only negligible
benefits in the face of more traditional business cycle (supply and demand)
shocks. Moreover, some recent research points to significant risks from unconven-
tional monetary policies in emerging markets: in an analysis of a large panel of
emerging market and developing economies, Jácome, Saadi Sedik, and Ziegenbein
(forthcoming) show that credit easing may lead to large currency appreciation
and substantially lower growth.
A higher inflation target could be a potential preemptive measure to raise infla-
tion expectations and regain monetary policy space. Since average nominal interest
rates would reflect the sum of real rates and expected inflation, raising the inflation
target may help compensate for the lower (natural) real rate and raise inflation
expectations. This approach could provide enough space to offset deflationary
shocks and close output gaps (for example, Blanchard, Dell’Ariccia, and Mauro
2010). For the new target to be credible, however, its revision should be implement-
ed through a comprehensive review process with clear and transparent communica-
tion to the public. Such a revision should be based on expected future real interest
rates, the amplitude and nature of the shocks that are likely to hit the economy, and
the necessary policy space to reduce the risk of recurrent low-inflation and deflation
episodes. In those circumstances, setting a higher inflation target would not
TABLE 7.1.
Overview of Unconventional Policy Measures Adopted since the Global Financial Crisis
Type of Measure Formulation
A. Interest rate policy Setting policy rates and signaling future path to influence market
expectations
Negative Interest Rates Policy/deposit rates below zero
Forward Guidance on Interest
Rates
Central bank communicates on future policy rates
Expansion of Liquidity-
Providing Facilities
Fixed-tender auctions, expansion of eligible collateral, etc.
B. Balance sheet policies Adjusting the size and/or composition of the central bank’s balance
sheet through purchases of financial assets
Quantitative Easing and
Forward Guidance on the
Central Bank Balance Sheet
Purchases of government debt and communication
Credit Easing Modifying the discount window facility
Expansion of collateral/counterparties in liquidity operations
Purchases of commercial paper, asset-backed securities, and corpo-
rate bonds
Bank Reserves Policy Money market operations to enlarge monetary base
C. Exchange rate policies Introducing an exchange rate floor
Interventions in the foreign exchange market
Source: IMF staff estimates.
©International Monetary Fund. Not for Redistribution

Chapter 7 Monetary Policy in the New Normal 177
threaten the central bank’s credibility but reinforce it. Indeed, when supported by
strong policy action to achieve the new (higher) target and clear communication of
the central bank’s resolve, raising the inflation target can strengthen the monetary
policy transmission mechanism through the expectations channel (see “Drivers of
ASEAN-5 Inflation Dynamics” earlier in this chapter).
When space for countercyclical monetary policy is limited, backstopping
monetary policy with other expansionary policies can also help avoid entrenched
low inflation. Where appropriate, a broader strategy that entails the mutually
supportive use of monetary, fiscal, and structural policies would be optimal
(Gaspar, Obstfeld, and Sahay 2016). Nonmonetary macroeconomic stimulus, of
course, would need to be credible and sustainable. Otherwise, it can also under-
mine monetary policy.
Fiscal stimulus amid low inflation and low interest rates can be particularly
powerful. In such an environment, fiscal multipliers (that is, the impact of fiscal
stimulus on growth) are likely larger compared with an environment in which
monetary policy may need to counteract the fiscal push to avoid inflation pres-
sure.9 To be effective, fiscal stimulus must be embedded in a framework that
credibly ensures long-term sustainability and adequately manages fiscal risk.
Moreover, a credible commitment to and an enduring practice of inflation target-
ing would allow monetary policy to reinforce fiscal policy. Box 7.1 presents a
simulation for Thailand of the improved macroeconomic outcomes achieved by
reinforcing fiscal and monetary stimulus to counteract low-inflation risks.
To the extent that the decline in natural real interest rates can be traced back
to a decline in potential growth, structural reforms that strengthen economic
potential can also be instrumental to rebuild monetary policy space. Structural
reforms could have contractionary effects in the short term, while sectoral adjust-
ments take place gradually. Yet, supported by measured monetary policy accom-
modation, they can increase potential output and growth. Appropriate
demand-management measures can offset the negative short-term effects of
structural reforms on the economy, thereby reducing the costs of productive
structural reforms as well as social opposition from segments of the population
that may be adversely affected.
Synergies between Monetary and Financial Stability Policies
The global financial crisis triggered a debate over whether monetary policy should
focus primarily on price stability or also target financial stability. Before the global
financial crisis, the prevailing view was that monetary policy should have one
main (in many cases overriding) objective, price stability, and one instrument,
9When the economy is near full employment or overheating, the central bank would normally
have to raise its policy interest rate in response to a fiscal expansion in defense of its inflation
objective, crowding out private spending and dampening the multiplier effect (Auerbach and
Gorodnichenko 2012).
©International Monetary Fund. Not for Redistribution

178 THE ASEAN WAY: SUSTAINING GROWTH AND STABILITY
Macroeconomic simulations offer some quantitative evidence of the potential impact of joint
fiscal and monetary stimulus within a stylized New Keynesian model calibrated for the Thai
economy (see Clinton and others 2015 for details on the model). In Figure 7.1.1, a baseline
scenario (blue lines) assumes a constant monetary policy rate and a cumulative fiscal stimulus
of 1 percent of GDP over three years. The alternative scenario (red lines) incorporates
PublicPrivate
2.0
Year
1
Year
2
Year
3
Year
4
Year
5
Year
6
Year
7
Year
1
Year
2
Year
3
Year
4
Year
5
Year
6
Year
7
2.5
3.0
–0.5
0.5
1.5
2.5
3.5
4.5
3.5
4.0
4.5
Figure 7.1.1. Potential Impact of Joint Monetary and Fiscal Stimulus: Thailand
1. Growth(Percent, year over year) (Percent, year over year)
Year
1
Year
2
Year
3
Year
4
Year
5
Year
6
Year
7
Year
1
Year
2
Year
3
Year
4
Year
5
Year
6
Year
7
0.0
0.2
0.4
0.6
0.8
1.0
1.2
1.4
1.6
35
38
41
44
47
50
3. Change in Investment from Baseline(Percent of GDP)
4. Public Debt(Percent of GDP)
Year
1
Year
2
Year
3
Year
4
Year
5
Year
1
Year
2
Year
3
Year
4
Year
5
Year
6
Year
7
0.0
0.5
1.0
1.5
2.0
2.5
–0.2
0.0
0.2
0.4
0.6
0.8
1.0
1.2
5. Monetary Policy Rate (Percent, year over year)
6. Size of Fiscal Stimulus (Percent of GDP)
Source: IMF staff calculations.
Box 7.1. Combining Monetary and Fiscal Stimulus in a Low-Inflation
Environment
©International Monetary Fund. Not for Redistribution

Chapter 7 Monetary Policy in the New Normal 179
usually a short-term policy interest rate.10 That paradigm had been widely suc-
cessful over the previous three decades in most advanced and emerging market
economies. Yet severe financial and economic crises have forced reconsideration
of the role of financial market imbalances and asset price developments in the
design and implementation of monetary policy.
The case for a stronger role for financial stability considerations in monetary
policy has intensified in recent years. In an extreme version of the precrisis view,
monetary policy should react to asset-price movements only to the extent that
they affect inflation (and output) and only if it can effectively clean up the mess
after a bubble bursts. The global financial crisis, however, showed that severe
financial imbalances could grow under relatively stable inflation and output gaps.
Moreover, the Great Recession that followed the global crisis showed that those
financial imbalances entail significant macrorelevant costs, which argues for mon-
etary policy that proactively mitigates the risk of a crisis rather than simply clean-
ing up afterward, a lean versus clean view.
Whether monetary policy should be used for financial stability purposes
remains highly controversial. Although there is agreement that policy should aim
to avert financial (and economic) crises—not simply deal with the implications
once a crisis occurs—whether and to what extent monetary policy should be
altered to contain financial stability risks, let alone whether financial stability
should be an explicit mandate for the central bank, is far less clear. Indeed, even
among central bank policymakers and senior officials there have been voices
strongly advocating for explicit financial stability mandates (for example, Olsen
2015) and against (for example, Svensson 2014, 2016). Others represent a more
balanced view (for example, Yellen 2014). Detailed discussions on the policy
trade-offs can be found in Smets 2014 and Stein 2014, among others.
10The theoretical foundation for that policy framework is deeply rooted in New Keynesian
models whose mainstream setting is a closed economy with nominal rigidities as the main, or only,
friction and often without a financial sector. In this kind of model, the so-called divine coincidence
(Blanchard and Galí 2007) through which stable inflation also kept output around its efficient
level holds. In the presence of financial and other friction, however, a trade-off can emerge between
stabilizing output around its efficient level and stabilizing inflation (Woodford 2003).
Box 7.1. Combining Monetary and Fiscal Stimulus in a Low-Inflation
Environment (continued)
(1) monetary easing, (2) additional public investment of a cumulative 1 percent of GDP
sustained over the medium term, and (3) a phased increase in the value-added tax rate to
8.5 percent once the output gap closes. The alternative scenario, with joint monetary-fiscal
stimulus, helps inflation reach the midpoint inflation target (2.5 percent) with a substantial
improvement in the balance of risks; private investment crowds in, and the value-added tax
hike stabilizes public debt.
©International Monetary Fund. Not for Redistribution

180 THE ASEAN WAY: SUSTAINING GROWTH AND STABILITY
The benefits of financial stability considerations influencing monetary policy
decisions should be carefully evaluated against potential costs. A
leaning-against-the-wind policy, for example, to tame rapid credit growth and
mitigate financial risks can imply tighter monetary policy (a higher interest rate)
than justified by standard flexible inflation targeting. That policy would therefore
entail costs from lower output and inflation in the short to medium term.
Benefits would materialize mainly in the medium term, as financial risks are
mitigated, the probability of a crisis is reduced, and the losses associated with a
crisis, should one occur, are attenuated. Two questions are of fundamental interest
in the debate: first, is there a case for leaning against the wind in the presence of
financial imbalances? Second, should leaning against the wind invoke a quantita-
tively important deviation of policy rates from those implied by standard inflation
targeting? Answering those questions requires the use of a dynamic quantitative
macroeconomic model and counterfactual scenarios.
Available evidence suggests that even if the benefits of leaning-against-the-wind
policies could outweigh the costs, the optimal deviation of policy rates from those
implied by more standard (inflation–output gap) decision rules would be quanti-
tatively small. On the one hand, Gambacorta and Signoretti (2014) and Filardo
and Rungcharoenkitkul (2016) have argued that the benefits of leaning-
against-the-wind policies outweigh any costs. Overall results from (mainly closed
economy) New Keynesian models with financial frictions support the view that,
absent other tools, monetary policy should adopt financial stability as a new
intermediate target (Curdia and Woodford 2009; Woodford 2012; Ajello and
others 2016). On the other hand, other research finds that the costs generally
outweigh the benefits (for example, Svensson 2016). In addition, severe difficul-
ties with identifying bubbles and the potential dangers and costs of influencing
asset prices ex ante are often mentioned. Specific results are, to a large extent,
driven by the features of the model, and further work is needed before more
robust conclusions can be reached.
As discussed in Chapter 2, most ASEAN-5 countries have given preeminence
to inflation in guiding monetary policy. As inflation has declined, both globally
and in ASEAN-5 countries, monetary policy rates have also fallen, and in some
cases even to historical lows. Low rates can contribute to excessive credit growth
and the buildup of asset bubbles and thereby sow the seeds of financial instability,
but prudential policies can mitigate the buildup of financial risks in a
low-interest-rate environment (see also Chapter 6).
The case for leaning against the wind may be even weaker in small open econ-
omies. In such economies, financial stability concerns are more likely to arise
from capital flows reflecting external financial conditions and the global financial
cycle. For example, strong capital flows may exacerbate search-for-yield behavior,
put upward pressure on domestic asset prices, and compress financial spreads
(Sahay and others 2014). In those circumstances, financial stability consider-
ations that would put pressure on the central bank to raise policy interest rates (or
keep them at a level that is higher than warranted based solely on price stability
considerations) may turn out to be counterproductive and exacerbate instability
©International Monetary Fund. Not for Redistribution

Chapter 7 Monetary Policy in the New Normal 181
by attracting further capital inflows. Menna and Tobal (2017) provide quantita-
tive evidence in support of this mechanism by extending the framework of Ajello
and others (2016) to an open economy setting.
Tensions between price and financial stability mandates may also weaken the
credibility of the central bank and the effectiveness of monetary policy. Monetary
policy credibility and effectiveness in targeting inflation largely stem from trans-
parency, predictability, and observable success, which are key underpinnings of
the standard monetary policy framework. Interest rate decisions guided by finan-
cial stability concerns, in contrast, would have to be justified in reference to
potential future events that are difficult to forecast, or even to define precisely.
Thus, the possible trade-offs with respect to central bank transparency and pre-
dictability should be considered, and effective communication could become
more challenging. Moreover, if, because of financial stability concerns, monetary
policy is calibrated to allow inflation to remain below target for longer than oth-
erwise desirable, there could be risks of destabilizing inflation expectations, lead-
ing to higher real rates and thereby penalizing growth and investment.
Macroprudential policy tools can help alleviate tensions between monetary
and financial stability objectives.11 Discrepancies between monetary and financial
stability mandates stem from attempts to achieve two different objectives with a
single policy instrument, the policy rate. Using macroprudential tools to curb
systemic risks may, however, ease those tensions. Indeed, in theory, targeted mac-
roprudential measures to address specific sectors and risks can be more efficient
and have fewer undesirable effects than economy-wide measures like the interest
rate. As discussed in Chapter 6, ASEAN-5 economies have increasingly used
macroprudential tools, especially housing-related and sectoral measures, to
address financial stability concerns.
Moreover, Chapters 8 and 9 further elaborate on the future agenda necessary
to strengthen macroprudential frameworks and exploit synergies between mone-
tary and macroprudential policies to achieve price and financial stability objec-
tives. The analysis in Chapter 9 shows that the combination of macroprudential
tools and monetary policy can produce better results in terms of growth, infla-
tion, and financial stability than simply leaning against the wind through the use
of monetary policy to temper credit growth.
11Macroprudential policy has been defined as the use of primarily prudential tools to limit sys-
temic risk—that is, the risk of disruption to the provision of financial services as a result of impair-
ment of all or parts of the financial system—and can cause serious negative consequences for the
real economy (for further details see, for example, IMF 2015). It includes a range of instruments,
such as measures to address sector-specific risks (for example, loan-to-value and debt-to-income
ratios), countercyclical capital requirements, dynamic provisions, reserve requirements, liquidity
tools, and measures to effect foreign-currency-based or residency-based financial transactions.
©International Monetary Fund. Not for Redistribution

182 THE ASEAN WAY: SUSTAINING GROWTH AND STABILITY
CONCLUSION
Monetary policy frameworks in ASEAN-5 economies have improved significantly
since the Asian financial crisis and have worked well over the past decade and
during the global crisis. Yet they are likely to be tested further by the global envi-
ronment in coming years. There is still substantial uncertainty about the potential
changes in monetary policy frameworks worldwide, and consensus on a new
paradigm has yet to be reached.
Potential further refinements in monetary policy frameworks may well not be
symmetric across ASEAN-5 countries. Differences in inflation performance
vis-à-vis central bank targets over recent years and financial sector vulnerabilities
may call for different responses to the global challenges brought about by the new
normal. Yet all ASEAN-5 economies are in a position to continue to adapt their
monetary policy frameworks, particularly through enhanced communication and
better monitoring of inflation expectations.
REFERENCES
Ajello, A., T. Laubach, D. Lopez-Salido, and T. Nakata. 2016. “Financial Stability and Optimal Interest-Rate Policy.” FRB Working Paper 2016–067, Federal Reserve Board, Washington, DC.
Auerbach, A. J., and Y. Gorodnichenko. 2012. “Measuring the Output Responses to Fiscal Policy.” American Economic Journal: Economic Policy 4 (2): 1–27.
Ball, L., and S. Mazumder. 2011. “Inflation Dynamics and the Great Recession.” IMF Working Paper 11/121, International Monetary Fund, Washington, DC.
Baumeister, C., and L. Kilian. 2016. “Forty Years of Oil Price Fluctuations: Why the Price of Oil May Still Surprise Us.” Journal of Economic Perspectives 30 (1): 139–60.
Blanchard, O., E. Cerutti, and L. Summers. 2015. “Inflation and Activity–Two Explorations and Their Monetary Policy Implications.” NBER Working Paper 21726, National Bureau of Economic Research, Cambridge, MA.
Blanchard, O., G. Dell’Ariccia, and P. Mauro. 2010. “Rethinking Macroeconomic Policy.” Journal of Money, Credit and Banking 42 (s1): 199–215.
Blanchard, O., and J. Galí. 2007. “Real Wage Rigidities and the New Keynesian Model.” Journal of Money, Credit and Banking 39 (10): 36–65.
Blinder, A., M. Ehrmann, J. de Haan, and D.-J. Jansen. 2016. “Necessity as the Mother of Invention: Monetary Policy after the Crisis.” NBER Working Paper 22735, National Bureau of Economic Research, Cambridge, MA.
Blinder, A. S., M. Ehrmann, M. Fratzscher, J. de Haan, and D. Jansen. 2008. “Central Bank Communication and Monetary Policy: A Survey of Theory and Evidence.” Journal of Economic Literature 46 (4): 910–45.
Caballero, R. J., E. Farhi, and P.-O. Gourinchas. 2016. “Safe Asset Scarcity and Aggregate Demand.” American Economic Review 106 (5): 513–18.
Chan, J., T. Clark, and G. Koop. 2015. “A New Model of Inflation, Trend Inflation, and Long-Run Inflation Expectations.” Federal Reserve Bank of Cleveland Working Paper, Cleveland, OH.
Clinton, K., C. Freedman, M. Juillard, O. Kamenik, D. Laxton, and H. Wang. 2015. “Inflation-Forecast Targeting: Applying the Principle of Transparency.” IMF Working Paper 15/132, International Monetary Fund, Washington, DC.
Coibion, O., and Y. Gorodnichenko. 2015. “Information Rigidity and the Expectations Formation Process: A Simple Framework and New Facts.” American Economic Review 105 (8): 2644–78.
Council of Economic Advisers. 2015. “Long-Term Interest Rates: A Survey.” Washington, DC.
©International Monetary Fund. Not for Redistribution

Chapter 7 Monetary Policy in the New Normal 183
Curdia, V., and M. Woodford. 2009. “Credit Spreads and Monetary Policy.” Journal of Money, Credit and Banking 42 (S1): 3–35.
Dany-Knedlik, G., and J. A. Garcia. 2018. “Monetary Policy and Inflation Dynamics in ASEAN-5 Economies since the Asian Financial Crisis.” IMF Working Paper 18/147. International Monetary Fund, Washington, DC.
Dincer, N. N., and B. Eichengreen. 2014. “Central Bank Transparency and Independence: Updates and New Measures.” International Journal of Central Banking 10 (1): 189–259.
Filardo, A., and P. Rungcharoenkitkul. 2016. “The Quantitative Case for Leaning against the Wind.” BIS Working Paper 594, Bank for International Settlements, Basel.
Galí, J., and M. Gertler. 1999. “Inflation Dynamics: A Structural Econometric Analysis.” Journal of Monetary Economics 44 (2): 195–222.
Gambacorta, L., and F. M. Signoretti. 2014. “Should Monetary Policy Lean against the Wind?” Journal of Economic Dynamics and Control 43 (2014): 146–74.
Garcia, J. Angel, and A. Poon. Forthcoming-a. “What Does Trend Inflation Estimation Tell Us about Inflation in Asia?” IMF Working Paper, International Monetary Fund, Washington, DC.
———. “Trend Inflation and Inflation Compensation.” IMF Working Paper 18/154. International Monetary Fund, Washington, DC.
Gaspar, V., M. Obstfeld, and R. Sahay. 2016. “Macroeconomic Management When Policy Space Is Constrained: A Comprehensive, Consistent, and Coordinated Approach to Economic Policy.” IMF Staff Discussion Note, International Monetary Fund, Washington, DC.
International Monetary Fund (IMF). 2013. “The Dog That Didn’t Bark: Has Inflation Been Muzzled or Was It Just Sleeping?” World Economic Outlook, Chapter 3, Washington, DC, April.
———. 2015. “Monetary Policy and Financial Stability.” IMF Staff Report, Washington, DC.———. 2016. “Global Disinflation in an Era of Constrained Monetary Policy.” World Economic
Outlook, Chapter 3, Washington, DC, October.Jácome, L., T. Saadi Sedik, and A. Ziegenbein. Forthcoming. “Is Credit Easing Viable in
Emerging and Developing Economies?” IMF Working Paper, International Monetary Fund, Washington, DC.
Kiley, M. 2015. “Low Inflation in the United States: A Summary of Recent Research.” FEDS Notes, November 23. Board of Governors of the Federal Reserve System, Washington, DC.
———, and J. Roberts. 2017. “Monetary Policy in a Low Interest Rate World.” Brookings Papers on Economic Activity (Spring): 317–96.
Laubach, T., and J. C. Williams. 2003. “Measuring the Natural Rate of Interest.” Review of Economics and Statistics 85 (4): 1063–70.
———. 2016. “Measuring the Natural Rate of Interest Redux.” Finance and Economics Discussion Series 2016–11, Federal Reserve System, Washington, DC.
Lubik, T. A., and C. Matthes. 2015. “Calculating the Natural Rate of Interest: A Comparison of Two Alternative Approaches.” Economic Brief, Federal Reserve Bank of Richmond, October.
Menna, L., and M. Tobal. 2017. “Financial and Price Stability: The Role of the Interest Rate.” Unpublished, Banco de Mexico.
Mertens, E., and J. Nason. 2015. “Time-Varying Stickiness in Professional Inflation Forecasts.” http:/ / www .elmarmertens .com.
Olsen, Ø. 2015. “Integrating Financial Stability and Monetary Policy Analysis.” Speech at the Systemic Risk Centre, London, April.
Orphanides, A., and J. C. Williams. 2002. “Robust Monetary Policy Rules with Unknown Natural Rates.” Brookings Papers on Economic Activity 2:63–145.
Quint, D., and P. Rabanal. 2017. “Should Unconventional Monetary Policies Become Conventional?” IMF Working Paper 17/85, International Monetary Fund, Washington, DC.
Rachel, L., and T. Smith. 2015. “Secular Drivers of the Global Real Interest Rate.” Staff Working Paper 571, Bank of England, London.
Sahay, R., V. B. Arora, A. V. Arvanatis, H. Faruqee, P. N’Diaye, and T. Mancini-Griffoli. 2014. “Emerging Market Volatility: Lessons from the Taper Tantrum.” IMF Staff Discussion Note, International Monetary Fund, Washington, DC.
©International Monetary Fund. Not for Redistribution

184 THE ASEAN WAY: SUSTAINING GROWTH AND STABILITY
Smets, F. 2014. “Financial Stability and Monetary Policy: How Closely Interlinked?” International Journal of Central Banking 10 (2): 263–300.
Stein, J. C. 2014. “Incorporating Financial Stability Considerations into a Monetary Policy Framework.” Speech given at the International Research Forum on Monetary Policy, Washington, DC, March 21.
Svensson, L. 2014. “Inflation Targeting and ‘Leaning against the Wind.’ ’’ International Journal of Central Banking 10 (2): 103–14.
———, L. E. O. 2016. “Cost-Benefit Analysis of Leaning against the Wind: Are Costs Larger Also with Less Effective Macroprudential Policy?” NBER Working Paper 21902, National Bureau of Economic Research, Cambridge, MA.
Watson, M. 2014. “Inflation Persistence, the NAIRU, and the Great Recession.” American Economic Review. 104 (5): 31–6.
Woodford, M. 2003. Interest and Prices. Princeton, NJ: Princeton University Press.———. 2012. “Inflation Targeting and Financial Stability.” NBER Working Paper 17967,
National Bureau of Economic Research, Cambridge, MA.Yellen, J. L. 2014. “Monetary Policy and Financial Stability.” Speech given at the 2014 Michel
Camdessus Central Banking Lecture, International Monetary Fund, Washington, DC, July 2.———. 2015. “Normalizing Monetary Policy: Prospects and Perspectives.” Remarks at the
conference on “The New Normal Monetary Policy,” Federal Reserve Bank of San Francisco, March 27.
©International Monetary Fund. Not for Redistribution
185
Systemic Risks and Financial Stability Frameworks
CHAPTER 8
INTRODUCTION
Association of Southeast Asian Nations–5 (ASEAN-5) financial systems were
resilient during the global financial crisis. Although capital outflows and the
slowdown in economic activity were comparable to what occurred during the
Asian financial crisis, domestic financial stability was preserved. The Asian finan-
cial crisis triggered important upgrades in regulatory and supervisory frameworks
(discussed in Chapter 3) that helped the ASEAN-5 weather the crisis.
However, some financial vulnerabilities have been rising since the global finan-
cial crisis. Although credit growth was moderate between the Asian and global
financial crises, it accelerated significantly following the global crisis, after which
corporate debt also increased steadily. And in some countries, household debt is
substantial. Moreover, the high degree of interconnectivity within the financial
sector and between the financial sector and the real sector, while unavoidable in
a financial deepening process, could be an emerging vulnerability. Finally, the fast
pace of new financial technologies coming on board could bring benefits but also
risks to ASEAN-5 financial systems.
This chapter analyzes those vulnerabilities and future challenges and discuss-
es a policy agenda for strengthening financial stability frameworks in the
ASEAN-5. The first part of the chapter analyzes systemic risks in ASEAN-5
domestic financial systems along both time and structural dimensions.1 The
chapter first zooms in on recent credit trends to determine whether there were
credit booms, given that booms are usually associated with financial instability.
Then, it examines interconnectivity within the financial system and between
the financial system and the real sector. The focus next turns to the corporate
sector, since corporate vulnerabilities were at the root of the Asian financial
crisis and since leverage has risen since the global crisis. The final major part of
the chapter discusses the challenges and policy agenda ahead for strengthening
This chapter was prepared by Pablo Lopez Murphy, Julian Chow, David Grigorian, and
Sohrab Rafiq, under the guidance of Ana Corbacho.1Chapter 10 examines financial integration from a cross-border perspective.
©International Monetary Fund. Not for Redistribution

186 THE ASEAN WAY: SUSTAINING GROWTH AND STABILITY
financial stability frameworks in the region, spanning the three core pillars of
microprudential regulation, macroprudential policy, and crisis management
and resolution.
CREDIT TRENDS
A key dimension of systemic risk is related to the evolution and dynamics of
credit growth over time. Periods during which credit to the private sector rises fast
are often linked to systemic risks and financial instability. During a credit boom
the expansion of lending can be so abrupt that the quality of the investment
projects financed becomes compromised. This process may ultimately damage
lenders’ balance sheets and trigger a financial crisis.
Ample empirical evidence indicates that credit overexpansion and banking
crises are related. Demirgüç-Kunt and Detragiache (1997), for example, show
that private credit is a significant determinant of banking crises. Mendoza and
Terrones (2008) develop a method for identifying credit boom episodes in a sam-
ple of 48 industrial and emerging market economies during 1960–2006. They
find that credit booms are usually a key component of financial crisis episodes.
However, not all credit booms end up in financial crises.
Credit to the private sector in the ASEAN-5 economies grew rapidly in the
aftermath of the global financial crisis in a context of exceptionally accommoda-
tive monetary policy worldwide. The growth rate of real credit to the private
sector rose by more than 5 percentage points, on average, between 2000–09 and
2010–12, but has fallen in most economies since 2013 as global financial condi-
tions tightened after the taper tantrum episode (Figure 8.1). This recent episode
of fast credit growth in ASEAN-5 economies resembles, to some extent, the epi-
sode that was observed in the early 1990s, when growth of credit to the private
sector picked up sharply amid expansionary monetary policies globally.
A comparison of the two episodes is presented below through the lens of the
literature on credit booms. The objective is to investigate whether there is evi-
dence of credit booms in the ASEAN-5 economies following the global financial
crisis. There is no single criterion with which to identify credit booms in the lit-
erature, so four different approaches from previous studies are used.
The first approach is based on Mendoza and Terrones (2008) and looks at
deviations of real credit per capita from its Hodrick-Prescott trend, identifying
credit booms when that deviation is larger than 1.75 times its standard deviation.
The analysis uses data for credit to the private sector, inflation, and population
during 1980–2016, complemented with IMF projections for 2017‒18. Using
this approach, credit booms are identified in the period preceding the Asian
financial crisis in all ASEAN-5 economies except Singapore (Figure 8.2).
However, no credit booms are picked up after the global financial crisis in any of
the ASEAN-5 economies—most of the acceleration in credit growth is attributed
to trend growth rather than to deviations from trend.
The second approach is that of Dell’Ariccia and others (2012), which looks at
deviations of the credit-to-GDP ratio from a rolling backward-looking cubic
©International Monetary Fund. Not for Redistribution

Chapter 8 Systemic Risks and Financial Stability Frameworks 187
trend. A credit boom is identified when either of the following two conditions is
satisfied: (1) the deviation from trend is greater than 1.5 times its standard devi-
ation and the annual growth rate of the credit-to-GDP ratio exceeds 10 percent,
or (2) the annual growth rate of the credit-to-GDP ratio exceeds 20 percent.
Under this approach, evidence of credit booms is detected in the period before
the Asian financial crisis in all ASEAN-5 economies (Figure 8.3). However, there
are no credit booms after the global financial crisis in any of the ASEAN-5 econ-
omies: the credit-to-GDP ratio remained close to trend, and the growth differen-
tial between credit and GDP stayed below the 20 percent threshold, although
above the 10 percent cutoff in some cases.
The third approach is that of Chapter 3 of the IMF’s Global Financial Stability Report of September 2011, which finds that increases in the credit-to-GDP ratio
of more than 3 percentage points, year over year, could serve as an early warning
of credit booms, with increases of more than 5 percentage points indicating more
severe credit booms. This approach indicates severe credit booms in all ASEAN-5
economies in the period before the Asian financial crisis, with changes in the
credit-to-GDP ratio exceeding the 5 percent threshold by a wide margin
(Figure 8.4). After the global crisis, there are no severe credit booms in Indonesia
and the Philippines, but there are in the other economies. Malaysia’s credit-to-GDP
ratio rose by more than 5 percent in 2011–13, Thailand’s in 2011 and 2013, and
Singapore’s in 2011–13 and 2016.
Sources: Country authorities; and IMF staff estimates.
Indonesia Malaysia Philippines Singapore
2000
–09
10–1
2
13–1
6
2000
–09
10–1
2
13–1
6
2000
–09
10–1
2
13–1
6
2000
–09
10–1
2
13–1
6
2000
–09
10–1
2
13–1
6
Thailand
–2
0
2
4
6
8
10
12
14
16
18
Figure 8.1. Growth in Real Credit to the Private Sector
©International Monetary Fund. Not for Redistribution

188 THE ASEAN WAY: SUSTAINING GROWTH AND STABILITY
Figure 8.2. Deviation from Trend in Real Credit to the Private Sector per Capita
1. Indonesia 2. Malaysia
1980 82 84 86 88 90 92 94 96 98
2000 02 04 06 08 10 12 14 16
1980 82 84 86 88 90 92 94 96 98
2000 02 04 06 08 10 12 14 16
4.5
5.0
5.5
6.0
6.5
7.0
7.5
4.5
5.0
5.5
6.0
6.5
7.0
7.5
8.0
8.5
3. Philippines 4. Singapore
1980 82 84 86 88 90 92 94 96 98
2000 02 04 06 08 10 12 14 16
1980 82 84 86 88 90 92 94 96 98
2000 02 04 06 08 10 12 14 16
4.5
5.0
5.5
6.0
6.5
7.0
3.5
4.0
4.5
5.0
5.5
6.0
5. Thailand
1980 82 84 86 88 90 92 94 96 98
2000 02 04 06 08 10 12 14 16
4.5
5.0
5.5
6.0
6.5
7.0
7.5
8.0
Source: IMF staff estimates using the methodology of Mendoza and Terrones (2008).Note: HP = Hodrick-Prescott; SD = standard deviation.
Log real credit per capita HP trend HP trend + 1.75 SD
©International Monetary Fund. Not for Redistribution

Chapter 8 Systemic Risks and Financial Stability Frameworks 189
Credit to GDPCubic trendTrend + 1.5 SD
Credit-GDP growth differential10 percent threshold20 percent threshold
1980 82 84 86 88 90 92 94 96 98
2000 02 04 06 08 10 12 14 16
–30
–20
–10
0
10
20
30
40
5. Philippines: Deviation of Credit to GDP from Trend
1980 82 84 86 88 90 92 94 96 98
2000 02 04 06 08 10 12 14 16
10
15
20
25
30
35
40
45
50
55
60
Credit to GDPCubic trendTrend + 1.5 SD
Credit to GDPCubic trendTrend + 1.5 SD
Credit-GDP growth differential10 percent threshold20 percent threshold
Credit-GDP growth differential10 percent threshold20 percent threshold
Figure 8.3. Deviation from Trend and Growth of Credit to GDP
1. Indonesia: Deviation of Credit to GDP from Trend
1980 82 84 86 88 90 92 94 96 98
2000 02 04 06 08 10 12 14 16
1980 82 84 86 88 90 92 94 96 98
2000 02 04 06 08 10 12 14 16
–30
–20
–10
0
10
20
30
40
1980 82 84 86 88 90 92 94 96 98
2000 02 04 06 08 10 12 14 16
–30
–20
–10
0
10
20
30
50
40
60
51015202530354045505560
3. Malaysia: Deviation of Credit to GDP from Trend
1980 82 84 86 88 90 92 94 96 98
2000 02 04 06 08 10 12 14 16
40
60
80
100
120
140
160
2. Indonesia: Growth Rate of Credit Net of Growth Rate of GDP
4. Malaysia: Growth Rate of Credit Net of Growth Rate of GDP
6. Philippines: Growth Rate of Credit Net of Growth Rate of GDP
©International Monetary Fund. Not for Redistribution

190 THE ASEAN WAY: SUSTAINING GROWTH AND STABILITY
The last approach builds on Bank for International Settlements methodolo-
gy. Drehmann, Borio, and Tsatsaronis (2012) argue that financial cycles last
longer than economic cycles, and thus propose to examine the credit gap,
defined as the deviation of the credit-to-GDP ratio from a Hodrick-Prescott
trend with a very high smoothing parameter (an almost linear trend). A credit
boom is identified when the deviation from trend exceeds 10 percentage points.
Applying this methodology to credit to the private sector shows large credit gaps
(above the 10 percent threshold) in all ASEAN-5 economies in the years before
the Asian financial crisis (Figure 8.5). However, there is no evidence of credit
booms in the period following the global crisis, except in Singapore, where the
deviation of the credit-to-GDP ratio from trend exceeded the 10 percent cutoff
in 2014 and 2016.
Credit to GDPBackward cubic trendTrend + 1.5 SD
Credit to GDPBackward cubic trendTrend + 1.5 SD
Credit-GDP growth differential10 percent threshold20 percent threshold
Credit-GDP growth differential10 percent threshold20 percent threshold
1980 82 84 86 88 90 92 94 96 98
2000 02 04 06 08 10 12 14 16
–20
–10
0
10
20
30
1980 82 84 86 88 90 92 94 96 98
2000 02 04 06 08 10 12 14 16
–20
–10
0
10
20
30
7. Singapore: Deviation of Credit to GDP from Trend
Figure 8.3 (continued)
1980 82 84 86 88 90 92 94 96 98
2000 02 04 06 08 10 12 14 16
60
70
80
90
100
110
120
130
140
150
9. Thailand: Deviation of Credit to GDP from Trend
1980 82 84 86 88 90 92 94 96 98
2000 02 04 06 08 10 12 14 16
30
50
70
90
110
130
150
170
190
Source: IMF staff estimates using the methodology of Dell’Ariccia and others (2012).Note: SD = standard deviation.
8. Singapore: Growth Rate of Credit Net of Growth Rate of GDP
10. Thailand: Growth Rate of Credit Net of Growth Rate of GDP
©International Monetary Fund. Not for Redistribution
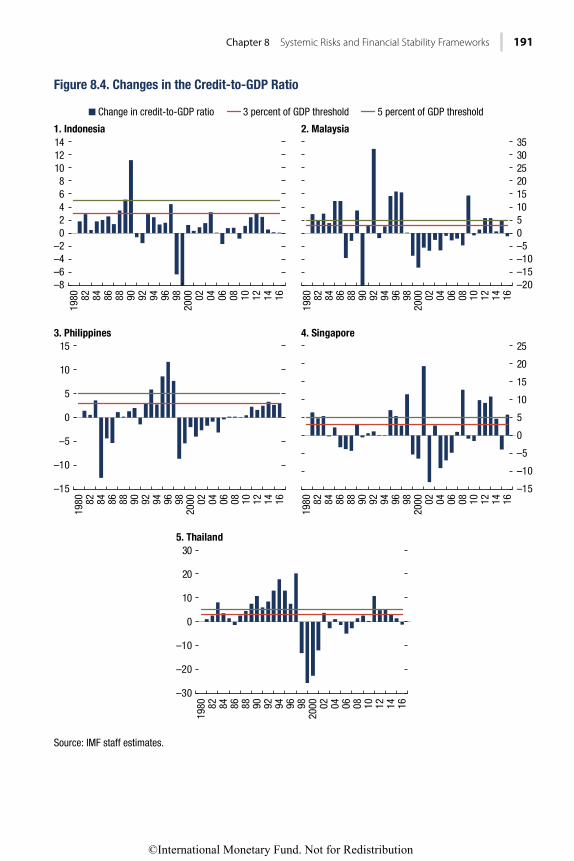
Chapter 8 Systemic Risks and Financial Stability Frameworks 191
Change in credit-to-GDP ratio 3 percent of GDP threshold 5 percent of GDP threshold
Figure 8.4. Changes in the Credit-to-GDP Ratio
1. Indonesia 2. Malaysia
1980 82 84 86 88 90 92 94 96 98
2000 02 04 06 08 10 12 14 16
1980 82 84 86 88 90 92 94 96 98
2000 02 04 06 08 10 12 14 16
–20–15–10–505101520253035
–8–6–4–2
02468
101214
3. Philippines 4. Singapore
1980 82 84 86 88 90 92 94 96 98
2000 02 04 06 08 10 12 14 16
1980 82 84 86 88 90 92 94 96 98
2000 02 04 06 08 10 12 14 16
–15
–10
–5
0
5
10
15
20
25
–15
–10
–5
0
5
10
15
5. Thailand
1980 82 84 86 88 90 92 94 96 98
2000 02 04 06 08 10 12 14 16
–30
–20
–10
0
10
20
30
Source: IMF staff estimates.
©International Monetary Fund. Not for Redistribution

192 THE ASEAN WAY: SUSTAINING GROWTH AND STABILITY
Figure 8.5. Deviation from Trend in the Ratio of Credit to the Private Sector to GDP
1. Indonesia 2. Malaysia
1980 82 84 86 88 90 92 94 96 98
2000 02 04 06 08 10 12 14 16
1980 82 84 86 88 90 92 94 96 98
2000 02 04 06 08 10 12 14 16
1980 82 84 86 88 90 92 94 96 98
2000 02 04 06 08 10 12 14 16
40
60
80
100
120
140
160
5
10
15
20
25
30
35
40
45
50
55
3. Philippines 4. Singapore
1980 82 84 86 88 90 92 94 96 98
2000 02 04 06 08 10 12 14 16
60
70
80
90
100
110
120
130
140
10
15
20
25
30
35
40
45
50
55
60
5. Thailand
1980 82 84 86 88 90 92 94 96 98
2000 02 04 06 08 10 12 14 16
0
20
40
60
80
100
120
140
160
180
Source: IMF staff estimates using Bank for International Settlements (BIS) methodology.
Credit to GDP BIS trend BIS trend + 5 percent BIS trend + 10 percent
©International Monetary Fund. Not for Redistribution

Chapter 8 Systemic Risks and Financial Stability Frameworks 193
Overall, the evidence suggests that systemic risks on the time dimension have
been contained in the ASEAN-5 since the global financial crisis. Using four dif-
ferent approaches, there is evidence of credit booms in the period before the Asian
financial crisis in all ASEAN-5 economies, but little evidence of credit booms
after the global crisis. All approaches suggest that Indonesia and the Philippines
did not experience credit booms after the global financial crisis. However, the
Global Financial Stability Report approach based on the change in the
credit-to-GDP ratio suggests that Malaysia, Singapore, and Thailand may have
experienced credit booms at some point during 2011–13, while the Bank for
International Settlements approach finds evidence of credit booms in Singapore
in 2014 and 2016. There is no evidence of credit booms in any of these three
countries after the global financial crisis using the remaining two approaches.
More weight should be given to the approaches that use deviations from trend
analysis because the credit-to-GDP ratios of Malaysia, Singapore, and Thailand
are much larger than those of Indonesia and the Philippines, which makes it more
likely that the changes in credit-to-GDP ratios exceed the thresholds.
FINANCIAL INTERCONNECTIVITY
Interconnectivity refers to relationships among economic agents that arise as a
result of financial transactions and legal arrangements. In a highly interconnected
financial system, distress in one entity can be transmitted to other entities in the
network, and bank stresses or failures are more likely to occur at the same time.
Understanding the nature of these relationships is essential for tracking the
buildup of systemic risk along a structural dimension, identifying the fault lines
along which financial shocks may propagate, and enhancing macroprudential
surveillance and risk management. Leitner (2005), Gai and Kapadia (2010),
Caballero and Simsek (2013), and Minoiu and Reyes (2011) argue that highly
complex networks can increase the likelihood of contagion risk when there is
financial friction. Peltonen, Rancan, and Sarlin (2015) show that early-warning
models augmented with interconnectivity measures outperform traditional mod-
els for out-of-sample predictions of recent banking crises in Europe.
Financial interconnectivity has increased significantly in the ASEAN-5 in recent
years. A continued search for higher returns (given low global interest rates) has
changed the mix of assets and liabilities, which, in turn, has changed the nature and
intensity of interconnection among financial institutions and economic agents. The
remainder of this section examines links between banks on one side and sovereign,
nonbank financial institutions and households on the other in ASEAN-5 countries.
In turn, the section “Vulnerabilities in the Nonfinancial Corporate Sector” focuses
on the links between banks and nonfinancial corporations.
Interconnectivity between Banks and the Sovereign
Banks are exposed to sovereign risk via holdings of government securities and
loans extended to public sector bodies. Sovereign risk can be transferred to banks
through two main channels: (1) on the asset side, via valuation losses on bank
©International Monetary Fund. Not for Redistribution

194 THE ASEAN WAY: SUSTAINING GROWTH AND STABILITY
holdings of sovereign securities (direct sovereign risk) and (2) on the liability side,
through an increase in bank funding costs caused by repricing of risk and credit
rating downgrades (indirect sovereign risk). In Indonesia, the share of govern-
ment securities in banks’ assets has declined from 35 percent in 2001 to less than
10 percent since 2011 (Figure 8.6, panel 1). In the other ASEAN-5 countries it
remained broadly constant and lower than 15 percent. So the exposure of banks
to governments is contained. Banks are also exposed to the sovereign on the lia-
bility side because many governments (or government-related agencies) have bank
deposits that they could potentially withdraw in a fiscal crisis. Such withdrawal
could have a significant effect on banks’ liquidity.
Public debt levels in ASEAN-5 countries are moderate, and so are the associ-
ated risks (Table 8.1). Overall, banks’ holdings of sovereign debt in the ASEAN-5
has either declined or remained low in recent years, and sovereign credit default
swap spreads (which measure the risk of a sovereign default) have been com-
pressed (Figure 8.6, panel 2). Singapore’s high level of public debt is a conse-
quence of efforts to develop bond markets, with gross debt fully covered by
financial assets. Malaysia is the only country in which public debt is higher than
the average for emerging market and developing economies. However, sovereign
yields are relatively low, and the public debt ratio is projected to be on a declining
path. Holdings of public debt by domestic banks are generally higher than those
of the average emerging market and developing economy, but a limited fraction
of total public debt. Although its overall debt is manageable, the Philippines has
the largest stock of foreign-currency-denominated debt, and therefore has a high-
er exposure to foreign exchange risk.
IndonesiaMalaysiaPhilippinesSingaporeThailand
IndonesiaMalaysiaPhilippinesThailand
Source: Bloomberg Finance L.P.
0
100
200
300
400
500
600
700
800
0
5
10
15
20
25
30
35
40
Figure 8.6. Risks from the Sovereign to the Banks
Sources: Country authorities; Haver Analytics; and IMF staff calculations.
Dec
-200
1
Dec
-11
Apr-
05
Apr-
10
Apr-
15
Feb-
06
Feb-
11
Feb-
16
Dec
-06
Dec
-16
Oct
-02
Oct
-12
Oct
-17
Oct
-07
Aug-
03
Aug-
08
Aug-
13Au
g-14
Jun-
04
Jun-
09
Oct
-200
1
Apr-
04
Dec
-05
Oct
-06
Apr-
09Fe
b-10
Oct
-11
Apr-
14
Oct
-16
Feb-
15D
ec-1
5
Dec
-10
Feb-
05
Aug-
12
Aug-
07
Aug-
02
Aug-
17
Jun-
08
Jun-
03
Jun-
13
1. Share of Government Securities in Banks’ Assets(Percent)
2. Credit Default Swap Spreads(Basis points)
©International Monetary Fund. Not for Redistribution

Chapter 8 Systemic Risks and Financial Stability Frameworks 195
Similarly, sovereigns are exposed to risk from banks’ instability. Poor bank perfor-
mance may require public assistance or funding, thus further increasing the debt
burden of the sovereign. As discussed in Chapter 3, banks’ balance sheets in the
ASEAN-5 remain strong, and nonperforming loan ratios are contained (Figure 8.7,
panel 1), suggesting lower exposure of governments to banks. Moody’s Analytics
market-based expected default frequency data for ASEAN-5 banking systems, which
measure the probability that banks will default over the next year, also show relatively
modest risks (Figure 8.7, panel 2). Financial stability risks are further mitigated by
the presence of developed microprudential frameworks (aimed at securing the order-
ly functioning of banks and preventing banking crises), macroprudential frameworks
(aimed at containing systemic risk), and bank resolution regimes (which facilitate
early intervention and limit the liability of governments during banking crises).
Interconnectivity among Banks
Banks can be interconnected directly via bilateral transactions, financial service
links, or financial infrastructure links. The greater the degree of interconnectivity
between banks, the greater the likelihood that financial stress in one bank could
trigger spillovers of financial stress to other banks, thereby increasing systemic risks.
Interconnectedness can also be indirect: for example, fire sales by a distressed bank
may lead to a fall in asset prices and associated mark-to-market losses for other banks.
There are several ways to measure bank interconnectivity. One measure is the
share of interbank loans as a proportion of total bank assets (Figure 8.8, panel 1).
Interbank assets and liabilities in Singapore are predominantly limited to nonres-
ident banks, reducing the potential for contagion within the network of the three
local banks. In Malaysia, where bank penetration is high, the interbank connec-
tions are deep among the conventional banks, while interbank borrowing and
lending between the Islamic banks is very thin. In Indonesia, the interbank mar-
ket is thin and segmented, with banks relying largely on household deposits for
TABLE 8.1.
Selected indicators of Sovereign Risk
Indonesia Malaysia Philippines Singapore Thailand Median EM
Credit by Banks to the Sovereign,
2015 (percent of GDP)1
6 16 15 27 15 9
Public Debt, 2016 (percent of GDP) 28 56 34 112 42 44
Ten-Year Sovereign Yield, End-
June 2017 (percent)
6.8 3.9 5.1 2.1 2.5 5.3
Share of Foreign Currency Public
Debt, 2016 (percent)
38 . . . 38 . . . 5 35
Share of Public Debt Held by
Nonresidents, 2016 (percent)
59 35 30 . . . 12 35
Primary Balance Gap, 2017
(percent of GDP)2
�0.1 �0.6 �2.2 �3.4 0.0 0.1
Sources: Bloomberg Finance L. P.; World Bank, Global Financial Development Database; and IMF, Fiscal Monitor, April 2017.
Note: EM = emerging market.1Includes credit to state-owned enterprises.2Change in the primary balance to stabilize the debt-to-GDP ratio at the 2016 level.
©International Monetary Fund. Not for Redistribution

196 THE ASEAN WAY: SUSTAINING GROWTH AND STABILITY
funding. In addition, smaller banks do not generally access the interbank market,
limiting their direct interconnectedness with the rest of the sector. The situation
is largely similar in the Philippines, where the interbank market is very shallow
and direct bank exposures to other banks are small. In Thailand the share of
interbank loans has almost tripled since 2001 (Figure 8.8).
Market-based measures of bank interconnectivity indicate rising risks during
times of market stress. Connectivity among large banks within countries and across
the ASEAN-5 can be assessed by techniques developed by Diebold and Yilmaz
(2014) using bank-level equity prices. The connectivity index quantifies the contri-
bution of shocks from one bank’s asset returns and volatilities to another’s at different
times based on dynamic variance decompositions from vector autoregressions. The
time-varying interconnectivity index for the largest banks in the ASEAN-5 shows
rising susceptibility to propagation of distress from one bank in the region to anoth-
er, particularly during times of market stress (Figure 8.8, panel 2). The more fre-
quent spikes in the interconnectivity index among ASEAN-5 banks since the global
financial crisis could indicate greater systemic risks in the region, requiring a greater
focus on monitoring risks stemming from financial institution interconnectivity.
Interconnectivity between Banks and Nonbank Financial Institutions
Interconnectivity between banks and nonbank financial institutions can take
various forms. They often have common ownership links (by belonging to a
financial conglomerate or owning stakes in each other) and maintain significant
Indonesia MalaysiaPhilippines SingaporeThailand
Thailand SingaporeMalaysia IndonesiaPhilippines
Source: Moody’s.Note: EDF = expected default frequency.
0.0
0.5
1.0
1.5
2.0
2.5
Jan-
2008
Jan-
09
Jan-
10
Jan-
11
Jan-
12
Jan-
13
Jan-
14
Jan-
15
Jan-
16
Jan-
17
2007
:Q1
08:Q
1
09:Q
1
10:Q
1
11:Q
1
12:Q
1
13:Q
1
14:Q
1
15:Q
1
16:Q
1
17:Q
1
0.0
1.0
2.0
3.0
4.0
5.0
6.0
7.0
8.0
9.0
Figure 8.7. Risks from the Banks to the Sovereign
Sources: Country authorities; Haver Analytics; and IMF staff calculations.
1. Nonperforming Loans(Percent of gross loans)
2. ASEAN-5: Banking Sector 1-Year EDFs
©International Monetary Fund. Not for Redistribution

Chapter 8 Systemic Risks and Financial Stability Frameworks 197
financial links in the form of deposits and common market exposures. Moreover,
some nonbank financial institutions play a critical role in the funding strategies
of banks, while banks have provided explicit and implicit guarantees of their
affiliated banks’ net asset values. Over time, the distinction between banks and
some nonbanks has become blurred, but there is one key difference: nonbank
financial institutions are typically subject to lighter prudential, regulatory, and
reporting standards than banks. While the rapid development of nonbank finan-
cial institutions could reflect progress toward a more diversified financial system,
it could also go hand in hand with financial stability risks.
Nonbank financial institutions in the ASEAN-5 have grown, albeit at different
rates (Figure 8.9). Singapore’s nonbank sector is nearly half the size of the banking
system, and most nonbank players (except wealth management institutions) have
limited links with local banks and are unlikely to pose a systemic risk. Strong
performance of global and regional equities in recent years provided the wealth
management sector—the largest nonbank player in Singapore—a boost, spurring
higher sales of unit trusts and other investment products. Local banks have been
a key factor behind the wealth management sector’s growth and have been its
main beneficiary. The size of nonbank financial institutions in other ASEAN-5
countries is modest, suggesting that, all else equal, there is less risk of lower sta-
bility as a result of interconnection with banks.
Interconnectivity between Banks and Households
Banks are connected with households through both the asset and liability sides of
their balance sheets. On the asset side, the exposure takes the form of various
Indonesia Malaysia PhilippinesSingapore Thailand
0
2
4
6
8
10
12
14
0
10
20
30
40
50
60
70
80
90
Figure 8.8. Risks between Banks
Sources: Country authorities; Haver Analytics; and IMF staff calculations.
Dec
-200
1
Dec
-06
Dec
-11
Oct
-02
Oct
-07
Aug-
03
Aug-
08
Jun-
04
Jun-
09
Apr-
05
Apr-
10
Feb-
06
Feb-
11
Dec
-16
Oct
-12
Oct
-17
Aug-
13Ju
n-14
Apr-
15Fe
b-16
1. Interbank Exposure(Percent of banks’ total assets)
2. Interconnectivity among Large ASEAN-5 Banks(Index)
Jan-
16
Jan-
15
Jan-
14
Jan-
13
Jan-
12
Jan-
11
Jan-
10
Jan-
09
Jan-
08
Jan-
07
Jan-
06
Jan-
05
Jan-
04
Jan-
2003
Jan-
17
©International Monetary Fund. Not for Redistribution

198 THE ASEAN WAY: SUSTAINING GROWTH AND STABILITY
2002 04 06 08 10 12 14 16
2002 04 06 08 10 12 14 16
2002 04 06 08 10 12 14 16
2002 04 06 08 10 12 14 16
2002 04 06 08 10 12 14 16
1. Indonesia 2. Malaysia
15
16
17
18
19
20
21
22
23
24
15
16
17
18
19
20
21
22
23
24
45
50
55
60
65
70
75
80
85
90
95
5
7
9
11
13
15
17
19
3. Philippines 4. Singapore
5. Thailand
Sources: National authorities; Financial Stability Board database; and IMF staff calculations.
30
50
70
90
110
130
150
170
190
210
230
Figure 8.9. Assets of Nonbank Financial Institutions(Percent of GDP)
©International Monetary Fund. Not for Redistribution

Chapter 8 Systemic Risks and Financial Stability Frameworks 199
types of loans extended by banks to households. On the liability side, households’
claims on banks can take the form of deposits and equity. Although the aggregate
net exposure of banks to the household sector provides useful guidance for the
riskiness of the link between banks and households, the disparities in income and
debt-servicing capacity between household groups, as well as maturity mismatch-
es between assets and liabilities, requires a more granular view and prudent mac-
roprudential oversight.
Among the ASEAN-5, household-debt-to-GDP ratios are high in Malaysia,
Singapore, and Thailand, but significantly lower in Indonesia and the Philippines
(Figure 8.10).
• Having stabilized recently, the household debt level in Singapore is about
60 percent of GDP. Recent macroprudential measures have slowed the
growth of household debt and helped build households’ financial buffers
and reduce the risk for banks and nonbank lenders (see Chapter 6
and IMF 2017d).
• Household indebtedness in Malaysia is higher (at nearly 90 percent of
GDP). However, risks are mitigated by high levels of financial assets, exceed-
ing 180 percent of GDP as of the end of 2015 (IMF 2017c).
• Household debt in Thailand peaked at about 80 percent of GDP in 2015.
On a net basis, both banks and nonbanks are borrowers from households
(Figure 8.11 and Table 8.2). However, in recent years, banks’ net liabilities
to households have declined, a result of a massive increase in banks’ gross
2012 2013 2014 2015 2016
Source: CEIC Data.
Indonesia Malaysia Philippines Singapore Thailand0
10
20
30
40
50
60
70
80
90
100
Figure 8.10. Household Debt(Percent of GDP)
©International Monetary Fund. Not for Redistribution

200 THE ASEAN WAY: SUSTAINING GROWTH AND STABILITY
Bank NBFI
Sources: Country authorities; and IMF staff calculations.
Figure 8.11. Thailand: Bank and Nonbank Financial Institution Exposure to Households (Percent of GDP)
(Bank and NBFI claims on households) (Bank and NBFI liabilities to households)
2007
45
2
74
27
72
11
88
46
2015
TABLE 8.2.
Thailand: Balance Sheet Analysis Matrix—Intersectoral Net Positions(Percent of GDP)
Government1 Central Bank Banks2 NBFIs3 NFCs HHs ROW
2007Government1 �6.7 �4.4 4.9 0.3 4.1 1.2
Central Bank 6.7 9.8 4.1 1.2 1.5 �32.5
Banks2 4.4 �9.8 2.0 �21.4 29.3 1.5
NBFIs3 �4.9 �4.1 �2.0 �17.8 25.2 �2.4
NFCs4 �0.3 �1.2 21.4 17.8 20.7
HHs �4.1 �1.5 �29.3 �25.2 0.0
ROW �1.2 32.5 �1.5 2.4 �20.7 0.0
2015Government1 �5.1 �0.8 7.9 0.3 1.7 4.7
Central Bank 5.1 19.9 5.2 0.7 0.1 �42.1
Banks2 0.8 �19.9 5.8 �14.1 16.9 9.8
NBFIs3 �7.9 �5.2 �5.8 �18.6 35.5 �2.5
NFCs4 �0.3 �0.7 14.1 18.6 16.9
HHs �1.7 �0.1 �16.9 �35.5 0.0
ROW �4.7 42.1 �9.8 2.5 �16.9 0.0
Sources: Bank of Thailand; and IMF staff calculations.
Note: HHs � households; NBFIs � nonbank financial institutions; NFCs � nonfinancial corporations; ROW � rest of world.1Includes central government and local governments.2Includes all depository corporations excluding the Bank of Thailand.3Includes all other financial corporations.4NFCs Includes state-owned enterprises.
©International Monetary Fund. Not for Redistribution

Chapter 8 Systemic Risks and Financial Stability Frameworks 201
claims on households, while nonbanks’ net liabilities have increased, shifting
much of the risk associated with high household debt to banks’ balance
sheets. The higher household debt with nonbank financial institutions
could represent an increase in systemic liquidity risk because the shorter
maturity of nonbank products results in maturity mismatches (IMF 2017e).
• In Indonesia, banks are also net borrowers from households, which reduces
the potential loan losses on that segment of banks’ portfolios.
• Household debt is still less than 15 percent of GDP in the Philippines,
taking into account housing-related mortgages from government financial
institutions not covered in the financial system surveys. However, bank
credit to households has been expanding rapidly since 2010, and close mon-
itoring of credit standards is warranted, particularly given shadow banking
by real estate developers and informal financial institutions in the
Philippines that may mask the true level of household leverage (IMF 2015).
VULNERABILITIES IN THE NONFINANCIAL CORPORATE SECTOR
Recent Trends in Corporate Debt
Corporate debt in the ASEAN-5 has increased faster than GDP since the global
financial crisis.2 It rose from 77 percent of GDP in 2010 to 102 percent in 2016 in
Malaysia, from 155 to 166 percent in Singapore, from 24 to 31 percent in Indonesia,
from 25 to 30 percent in the Philippines, and from 64 to 68 percent in Thailand
(Figure 8.12, panel 1).3 The increase in debt was on account of rapid growth in both
bond issuance and bank loans. In particular, corporate bond issuance nearly tripled
during this period, driven by an increase in domestic and foreign currency bonds.
Higher debt led to rising leverage in the corporate sector, although leverage
ratios are still low compared with what they were during the Asian financial crisis
(Figure 8.12, panel 2). At the same time, corporate profitability had weakened
amid moderation in regional economic growth in recent years (Figure 8.12, panel
3). As a result, average debt-servicing capacity appears to be weakening despite
remaining resilient (Figure 8.12, panel 4). Although most bonds have matured,
some countries have a relatively large number that are maturing in the next two
years (Figure 8.12, panel 5).
The ability to refinance short-term debt and the adequacy of internal cash
buffers to meet these debt obligations along with operational costs are important.
For most countries, cash buffers are adequate. However, median ratios of cash and
cash equivalents to short-term debt seem relatively low in Indonesia and Thailand
(Figure 8.12, panel 6). It is worth noting that low cash levels may reflect better
reinvestment opportunities in some of these countries. However, cyclical global
2See Chapter 3 for corporate restructuring and deleveraging since the Asian financial crisis.3Bloomberg Finance L.P.’s coverage of nonfinancial corporations comprises publicly listed entities
with published balance sheet information.
©International Monetary Fund. Not for Redistribution

202 THE ASEAN WAY: SUSTAINING GROWTH AND STABILITY
Indonesia MalaysiaPhilippines SingaporeThailand
IndonesiaMalaysiaPhilippinesSingaporeThailand
GDP growth(average, % year over year)
External debt Domestic bondsBank loans Total debt 2010
Indonesia MalaysiaPhilippines SingaporeThailand
20165-year average
Foreign currencyLocal currency
Philippines Indonesia Thailand Malaysia 2010 11 12 13 14 15 16Singapore10
15
20
25
30
35
40
45
50
55
Korea (1996)
Thailand (1996)
0
20
40
60
80
100
120
140
160
180
Source: Bloomberg Finance L.P., Financial Soundness Indicators, Quarterly External Debt Statistics.
Source: IMF Corporate Vulnerability Utility (CVU).
Sources: IMF CVU; and IMF, World Economic Outlook database.
Source: IMF CVU.
Corporate debt has increased in recent years ... ... prompting leverage ratios to rise.
1
2
3
4
5
6
7
8
9
10
2
3
4
5
6
7
8
9
... leading to weaker debt-servicing capacity.
2010 11 12 13 14 15 16 2010 11 12 13 14 15 16
Malaysia Philippines Singapore Thailand Indonesia MalaysiaPhilippines SingaporeThailand
Regional average
Indonesia20
40
60
80
100
120
140
0
10
20
30
40
50
60
Source: Bloomberg Finance L.P. Source: Bloomberg Finance L.P.
Near-term bond maturities are high for some countries ... ... while their cash buffers appear low.
©International Monetary Fund. Not for Redistribution

Chapter 8 Systemic Risks and Financial Stability Frameworks 203
headwinds, especially during periods of dislocation in global capital markets, can
amplify rollover risks and affect firms’ short-term refinancing needs. Moreover,
higher risk premiums lead to higher borrowing costs and lower earnings.
Corporate Vulnerabilities
An increase in global trade protectionism measures could significantly affect exports
and corporate earnings in emerging market economies, including ASEAN-5 coun-
tries. Historically, world trade and corporate returns on assets are positively associ-
ated (Figure 8.13). In 2009, global trade declined close to 25 percent year over year,
driven by protectionist measures, in addition to the sharp contraction in global
demand in the aftermath of the global financial crisis and reduced access to credit
to finance trade. Recently, the number of discriminatory trade measures has been
on the rise again. Further increases in trade protectionism, including retaliations,
could disrupt global trade and jeopardize corporate earnings. At the same time,
cyclical headwinds associated with volatility in global financial markets could lead
to exchange rate depreciation and higher risk premiums and borrowing costs. A
combination of these factors could increase corporate sector risks.
One way to quantitatively assess corporate vulnerabilities is to examine
debt-service capacity and the share of debt at risk. Using firm-level data for about
2,600 companies from the Bloomberg database, the interest coverage ratio for each
firm is computed by dividing earnings before interest and taxes by interest expenses
in 2016. The share of debt at risk is the sum of the debt of all firms with an interest
coverage ratio lower than 1 divided by the sum of the debt of all firms.
To examine the sensitivity of firms to shocks, an illustrative sensitivity analysis
of the firms’ balance sheets based on publicly available information is undertaken
using the following three shocks:
Number of discriminatory trade measuresChange in world trade (% change, left scale)Change in median global ROA(% change, left scale)
1991 93 95 97 99 2001 03 05 07 09 11 13 15
Sources: Global Trade Alert; IMF, Corporate Vulnerability Utility; and World Trade Organization.Note: ROA = return on assets.
–40
–30
–20
–10
0
10
20
30
40
50
60
Figure 8.13. World Trade, Global Corporate Return on Assets, and Discriminatory Trade Measures
–500
–300
–100
100
300
500
700
©International Monetary Fund. Not for Redistribution

204 THE ASEAN WAY: SUSTAINING GROWTH AND STABILITY
• Firms’ earnings decline by ¾ standard deviation, based on regression analy-
sis that shows that a 25 percent decline in global trade leads to a ¾ standard
deviation deterioration in corporate return on assets in emerging market
economies. Implicit in this assumption is that global trade will decline by
the same order of magnitude as in 2009.
• The exchange rate depreciates by 15 percent against the US dollar, derived
from Fibonacci retracement of the US Dollar Index from 2000 to June
2017, which suggests potential US dollar appreciation by another 15 percent.4
• Interest expenses increase by 20 percent, based on the average of the largest
increase in emerging market economies during 2008–16.
The results suggest that corporate debt at risk could increase significantly in
some ASEAN-5 countries, though it would remain at low levels overall (Figure 8.14).
To an extent, the level of debt at risk will depend on the magnitude of foreign
exchange hedging from natural hedges (export and foreign currency earnings) and
derivative hedges. In this exercise, the median ratios of foreign sales to total sales are
used as a proxy for natural hedges. It is worth noting that although foreign exchange
derivative hedging instruments and markets are more developed now than during
the Asian financial crisis, some of these instruments are complex. For example,
4Fibonacci retracement is a popular technical analysis tool that shows the possible price-level
movements of an underlying asset (foreign exchange in this case). It takes two extreme points
(usually a major peak and a trough), computes the distance between them, and, using some key
Fibonacci ratios, identifies a range for price movements.
Increase (no. of hedges minus 2016)2016Natural hedgesNo hedgesNatural and 50% foreignexchange hedges
Sources: Bloomberg Finance L.P.; IMF, Corporate Vulnerability Utility; and IMF staff calculations.
0
2
4
6
8
10
12
14
Figure 8.14. Debt at Risk(Percent of total debt)
Philippines Indonesia Singapore Malaysia Thailand
©International Monetary Fund. Not for Redistribution

Chapter 8 Systemic Risks and Financial Stability Frameworks 205
some currency hedges terminate when exchange rates depreciate beyond certain
“knock-out” thresholds, thus rendering the hedges worthless. Moreover, firms are
exposed to liquidity and rollover risks when these contracts expire.
Interconnectivity with Banks
Weaknesses in the corporate sector could put pressure on banks’ asset quality
through increases in nonperforming loans. The ability of banks to withstand
these shocks will depend on the size of their buffers, comprising Tier 1 capital and
provisions (Figure 8.15). Since 2010, the banking sector’s Tier 1 capital ratios
2016 2010 2013
2016Natural hedges
Natural and 50% foreignexchange hedgesNo hedges
Indonesia Malaysia PhilippinesSingapore Thailand
2016 Natural hedges
No hedgesNatural and 50% foreign exchange hedges
Figure 8.15. The Banking Sector
1. Tier 1 Capital Ratio(Percent)
2. Provisions-to-Nonperforming-Loans Ratio(Percent)
2010 11 12 13 14 15 1620
30
40
50
60
70
80
90
8
10
12
14
16
18
20
22
Source: IMF staff calculations. Sources: IMF, Financial Soundness Indicators; and IMF staff calculations.
Source: IMF, Financial Soundness Indicators.
Bank capital had been increasing ... ... but provisioning had weakened somewhat.
Malaysia PhilippinesSingapore Thailand Indonesia
3. Gross Nonperforming Loan Ratio(Percent)
4. Loss-Absorbing Buffers (Percent)
8
10
12
14
16
18
20
1.0
1.5
2.0
2.5
3.0
3.5
4.0
4.5
5.0
Defaults of corporate debt at risk will erode asset quality ... ... leading to a decline in bank buffers, although they remain strong by Basel III standards.
Malaysia MalaysiaPhilippines PhilippinesSingapore SingaporeThailand ThailandIndonesia Indonesia
Basel III minimum Tier 1 ratio +conservation buffer
Source: IMF, Financial Soundness Indicators.
©International Monetary Fund. Not for Redistribution

206 THE ASEAN WAY: SUSTAINING GROWTH AND STABILITY
have been rising in the region. Nonetheless, provision coverage has weakened
somewhat in recent years in a number of countries, as shown by the decline in the
ratio of bank provisions to nonperforming loans.
Assuming in a stress scenario that all the corporate debt at risk owed to banks
defaults, sensitivity analysis suggests that gross nonperforming loan ratios could
increase 0.4–2.8 percentage points. This would erode banks’ loss-absorbing buf-
fers by 0.4–3.5 percentage points. However, banks’ capital ratios would remain
strong when benchmarked against Basel III’s minimum capital requirements.
The reduction in bank capital could lead to weaker credit growth, though,
because banks tend to de-risk when their capital ratios fall to limit losses and meet
regulatory requirements. In emerging market economies, a 1 percentage point
decline in banks’ capital-to-assets ratio could lead to as much as a 4.6 percentage
point reduction in loan growth. In turn, the decline in bank credit could weaken
economic growth. Previous studies have found the sensitivity of GDP growth to
bank credit growth ranging from 0 to 0.4, depending on the extent of credit
deepening and economic circumstances. Within the ASEAN-5 region, bank cred-
it growth has already slowed compared with average growth rates, except in the
Philippines (Figure 8.1).
CHALLENGES AND POLICY AGENDA AHEAD
The global financial crisis propelled a wave of reforms in financial sector regula-
tion across the world. Existing financial regulations were considered too weak,
and a multilateral reform effort kicked off with the goal of making financial sys-
tems worldwide more resilient to shocks. The Basel III agreement reached in
2011 was a major achievement toward enhancing regulatory standards for capital
and liquidity requirements. It also included special capital requirements for global
systemically important financial institutions. Some final elements of the Basel III
reforms, aiming to improve the credibility of the bank capital framework, were
agreed to only in late 2017.
An important lesson from the global financial crisis is that traditional micro-
prudential regulation is not sufficient to secure the stability of the financial system
as a whole. A broader macroprudential approach is needed to mitigate systemic
risks and safeguard financial systems. Moreover, the global financial crisis exposed
the limitations of crisis management and resolution frameworks, particularly
when systemic institutions operating on a large and cross-border basis are involved.
Microprudential regulation focuses on the financial soundness of an individual
financial entity, while macroprudential regulation focuses on the financial sound-
ness of the whole system. Yet, even with strong micro- and macroprudential
regulation in place, some financial institutions may eventually fail. Against this
backdrop, sound crisis management frameworks are essential to contain the risks
to taxpayers. The international standards on how banks should be restructured or
closed are known as the Key Attributes of Effective Resolution Regimes for
Financial Institutions, elaborated by the Financial Stability Board.
©International Monetary Fund. Not for Redistribution

Chapter 8 Systemic Risks and Financial Stability Frameworks 207
The rest of this chapter outlines challenges and the policy agenda ahead for
strengthening financial stability frameworks in ASEAN-5 countries. It first delves
into current issues in financial sector regulation from a microprudential perspec-
tive and then elaborates on next steps for upgrading macroprudential frameworks
and crisis management and resolution regimes. The last subsection discusses the
potential benefits and risks of new financial technologies such as cryptocurrencies.
Financial Sector Regulation
Basel III is a comprehensive set of voluntary capital and liquidity requirements,
developed by the Basel Committee on Banking Supervision, that aims to
strengthen banking sectors. These requirements were agreed to by the committee
in 2011 and were scheduled for gradual adoption during 2013–27. They call on
banks to have (1) more and better capital to absorb shocks and (2) more liquid
assets to weather liquidity shocks.
An important challenge in the implementation of the Basel III standards is to
ensure that they are reasonable for each financial system and each financial insti-
tution. Adrian and Narain (2017) argue that the Basel III standards were a
response to the global financial crisis and hence naturally focus on global system-
ically important financial institutions. This suggests that there is a need for pro-
portionality in the application of the standards for less complex financial systems
and institutions.
ASEAN-5 countries made significant strides in strengthening microprudential
regulations after the Asian financial crisis. The main challenge ahead is to adopt
Basel III standards but also to tailor the rules to the sophistication of the financial
sector and financial institutions of each country. ASEAN-5 economies are at
different stages in this process:
• Indonesia implemented new capital and liquidity rules in line with Basel III.
New rules for systemically important banks were approved in March 2016.
A liquidity coverage ratio was established in December 2015. Large banks
(banks with core capital of at least 30 trillion rupiah) and foreign branch
offices were required to have an liquidity coverage ratio of at least 70 percent
at the end of 2015. Midsize banks (banks with core capital between 5 tril-
lion and 30 trillion rupiah) and foreign banks have had a 70 percent liquid-
ity coverage ratio since July 2016.
• Malaysia adopted new capital rules in January 2013. Global standards relat-
ed to capital conservation and countercyclical capital buffers were met in
2016, and the bank leverage ratio has been in effect since January 2018, in
line with the global timeline. A minimum liquidity coverage ratio of 60 per-
cent came into force in mid-2015 and will be stepped up gradually to
100 percent by January 2019.
• In the Philippines, commercial banks have stricter capital requirements than
mandated under Basel III. Local regulations stipulate a 6 percent ratio for
common equity Tier 1 capital, compared with 4.5 percent under Basel III;
a 7.5 percent ratio for Tier 1 capital (6 percent under Basel III); and a
©International Monetary Fund. Not for Redistribution

208 THE ASEAN WAY: SUSTAINING GROWTH AND STABILITY
10 percent ratio for total capital (8 percent under Basel III). The authorities
also introduced a 2.5 percent capital conservation buffer at the start of
2014, five years ahead of the Basel III schedule. In 2015, the authorities set
a leverage ratio of 5 percent for local banks.
• In Singapore, capital requirements for banks are higher than those estab-
lished by Basel III, and their adoption has been front-loaded. The introduc-
tion of the capital conservation buffer follows the same phase-in schedule as
Basel III. The liquidity coverage ratio was introduced in January 2015. The
minimum requirement started at 60 percent and is scheduled to rise in equal
annual steps to reach 100 percent by January 2019.
• In Thailand, Basel III capital rules have been in force since January 2013.
The Bank of Thailand issued seven notifications regarding the Basel III
capital framework to require Thai banks to maintain a minimum common
equity ratio of 4.5 percent, Tier 1 ratio of 6 percent, and total capital ratio
of 8.5 percent. In 2017, the Bank of Thailand also identified systemically
important banks required to hold a capital buffer above the minimum
requirements. In 2016, the Band of Thailand began to phase in the liquid-
ity coverage ratio requirement at 60 percent for all commercial banks; it will
reach 100 percent in 2020.
Macroprudential Frameworks
ASEAN-5 countries have been at the frontier in the implementation of macro-
prudential policies, especially those applicable to specific sectors of the economy
(see Chapter 6). Still, although the use of macroprudential tools has grown, an
important agenda to upgrade and fully develop macroprudential frameworks lies
ahead. Perhaps the most important challenge in the ASEAN-5 is to enhance the
ability to identify and monitor emerging systemic risks in a structural dimension,
especially with the expansion of nonbank financial institutions (see the “Financial
Interconnectivity” section). Macroprudential policies remain hampered by data
and institutional gaps. Moreover, the experience and evidence on the use of mac-
roprudential tools continue to evolve worldwide.
ASEAN-5 institutional frameworks for macroprudential policies follow a wide
range of models (Box 8.1). The IMF (2011b) classifies macroprudential institutions
using five key dimensions, leading to seven distinct models (Table 8.3). The dimen-
sions are (1) the degree of institutional integration between central bank and finan-
cial regulatory policy functions, (2) ownership of the macroprudential mandate, (3)
the role of the government, (4) the degree to which there is organizational separa-
tion of decision-making and control over instruments, and (5) whether there is a
coordinating committee that, while not itself charged with the macroprudential
mandate, helps coordinate several bodies. The ASEAN-5 countries sit in either
model 1 or 4, characterized by partial or full central bank independence, with own-
ership of macroprudential policies mainly with the central bank.
Recognizing the numerous approaches, the IMF (2014) establishes some cri-
teria for assessing the strengths and weaknesses of macroprudential frameworks:
©International Monetary Fund. Not for Redistribution

Chapter 8 Systemic Risks and Financial Stability Frameworks 209
The ASEAN-5 have used a mixture of institutional arrangements to implement macropru-
dential policies.
Indonesia: The central bank formally began conducting macroprudential surveillance
of the Indonesian financial system in 2003. A law passed in 2011 established the Indonesian
Financial Services Authority, which is independent and enumerates microprudential pow-
ers. The law also assigned responsibility for macroprudential regulation and supervision to
the central bank. Overall, financial stability is in the hands of Financial System Stability
Forum, coordinated by the minister of finance. The forum is responsible for monitoring and
assessing financial stability, making policy recommendations, and facilitating information
exchange among government agencies and, in crisis situations, with crisis management.
Malaysia: Under the Central Bank of Malaysia Act 2009, the bank has been given a
financial stability mandate and broad powers to ensure financial stability. In addition to
powers to regulate and supervise financial institutions and specific markets under its pur-
view, the bank can invoke powers over financial institutions beyond its regulatory reach
and make recommendations to any other supervisory authority. Governance for these lat-
ter powers is provided by the Financial Stability Executive Committee, chaired by the gov-
ernor and comprising one deputy governor and three to five other members appointed by
the finance minister—which includes a Treasury representative in practice.
Philippines: Responsibility for financial stability is shared among different agencies:
the Bangko Sentral ng Pilipinas (BSP) has responsibility for, among other things, monetary
policy and banking sector stability; the Securities and Exchange Commission is responsible
for market conduct and consumer protection; the Insurance Commission, a government
agency under the Department of Finance, regulates and supervises life and non–life insur-
ance companies. The Financial Stability Committee, chaired by the central bank governor,
was set up in 2010 to develop an overarching approach to systemic risk monitoring. The
BSP has been promoting the exchange of financial stability issues in the framework of the
high-level Financial Stability Coordination Council since 2011.
Thailand: Thailand currently has no law explicitly defining financial stability or assign-
ing the mandate of financial stability to any institution. In practice, dating back to 2004, the
Bank of Thailand’s mandate as spelled out in its law, “maintaining monetary stability, finan-
cial institutions system stability and payment stability,” broadly supports its activities as the
lead financial stability framework agency. At the national level the central bank’s role is
limited by the existence of other regulators. The Securities and Exchange Commission and
the Office of Insurance Commission have narrower mandates. Nevertheless, these areas
have important links with banks and the broader financial system. The establishment of the
Financial Stability Unit housed in the Bank of Thailand in 2016 has facilitated information
sharing, monitoring, and coordination among regulators.
Singapore: The Monetary Authority of Singapore (MAS) is responsible for conducting
macroprudential policy. The MAS is both a central bank and an integrated financial supervisor
overseeing all financial institutions and is mandated with promoting financial stability. Under
the current institutional arrangement, the deputy prime minister and minister of finance
serves as the chairman of the board of the MAS and presides over the board-level chairman’s
meeting, where microprudential and macroprudential policies, as well as monetary policy,
are determined. At the level of the chairman’s meeting, the MAS holds meetings with the
Ministry of Finance to discuss macroeconomic and financial stability issues and seek agree-
ment on policies that can have broad ramifications. The role of the chairman’s meeting in
macroprudential policy is supported by the MAS Management Financial Stability Committee,
chaired by the MAS managing director and comprising other MAS senior managers. It coor-
dinates policies aimed at maintaining financial stability as well as the stability of asset and
consumer prices and collaborates with all relevant government agencies.
Box 8.1. Macroprudential Institutional Arrangements in the
ASEAN-5
©International Monetary Fund. Not for Redistribution

2
10
TH
E ASEA
N W
AY
: SUSTA
ININ
G G
RO
WTH
AN
D STA
BILIT
Y
TABLE 8.3.
Models of Macroprudential Institutions
Features of the Model Model 1 Model 2 Model 3 Model 4 Model 5 Model 6 Model 7
Degree of Institutional Integration
of Central Bank and Supervisory
Agencies
Full Partial Partial Partial None None None
Ownership of Macroprudential
Policy and Financial Stability
Mandate
Central bank Committee related
to central bank
Independent
committee
Central bank Multiple
agencies
Multiple
agencies
Multiple
agencies
Role of Ministry of Finance,
Treasury, Government
Active Passive Active None Passive Active None
Separation of Policy Decisions and
Control over Instruments
No In some areas Yes In some areas No No No
Existence of Separate Body
Coordinating across Policies
No No No No Yes Yes No
Examples of Specific Model Singapore,
Malaysia,
Czech Republic,
Ireland
Romania,
United Kingdom,
Cambodia
Brazil, France,
United States
Thailand,
Philippines,
Indonesia,
Hong Kong SAR,
Lao P.D.R.,
Netherlands
Australia Canada,
Vietnam
Iceland, Japan,
Korea, Peru,
Switzerland
Source: IMF (2011b).
©International Monetary Fund. Not for Redistribution

Chapter 8 Systemic Risks and Financial Stability Frameworks 211
• Analysis: The central bank should have an important role within the frame-
work reflecting its experience in monitoring macro-financial developments
and conducting risk assessment.
• Monitoring: The framework should provide for the effective monitoring and
identification of systemic risk, which require, among other things, assured
access by agencies to all relevant information.
• Organization: It must be clear where the mandate and powers reside for the
timely and effective use of macroprudential policy once concerns about
systemic risk have been identified.
• Prudential policies: Since macroprudential policy relies on the use of micro-
prudential tools, the framework must facilitate a very high level of coordi-
nation across agencies and provide adequate respect for their policy autonomy.
This framework provides for effective identification, analysis, and monitoring
of systemic risk and timely and effective use of macroprudential policy tools, and
it avoids coordination problems when addressing systemic risk to reduce gaps and
overlaps (Figure 8.16).
Within their current arrangements, all ASEAN-5 countries have scope to close
gaps in their macroprudential frameworks. Challenges and priorities ahead
include the following:
• Data and surveillance: The surveillance of cross-border financial flows needs
to be enhanced to derive a comprehensive picture of the deeper network of
interconnections and spillovers across countries. Each country also needs to
continue identifying and closing data gaps. In Indonesia, the general frame-
Access to relevant information
Uses existing resources and expertise
Strong mandate and powers
Ability and willingness to act
Accountability
Reduces gaps and overlaps
Preserves the autonomy of separate policy functions
Source: IMF 2011b.
©International Monetary Fund. Not for Redistribution

212 THE ASEAN WAY: SUSTAINING GROWTH AND STABILITY
work that underpins information sharing between agencies is adequate,
although there are some practical difficulties, particularly related to data
collection and validation. In the Philippines, a financial stability coordina-
tion council was created in 2014 to address informational and regulatory
gaps among the financial regulators. In Thailand, there is significant scope
to gather and analyze granular data on balance sheet exposures and intercon-
nectedness, as well as to develop macro stress-testing tools.
• Policy tools: Upgrading the macroprudential framework requires advancing
the agenda on analytical frameworks for assessing systemic stability, devel-
oping new instruments, and advancing the work on interactions between
macroprudential and other policy instruments. The authorities should select
a set of macroprudential instruments that can help address the key potential
sources and dimensions of systemic risk. Since the manifestations of system-
ic risk may be country specific, the set of desirable tools will vary from
country to country. In general, ASEAN-5 countries have been prominent
users of sectoral macroprudential tools, including for the housing sector.
More recently, some countries (for example, Indonesia, Philippines,
Thailand) have added capital surcharges for domestic systemically import-
ant banks to their toolkits. On the time dimension of systemic risk, many
ASEAN-5 countries have implemented capital adequacy ratios in a counter-
cyclical manner on a de facto basis (see Chapter 6). However, only Indonesia
and Malaysia have rules-based countercyclical capital buffer requirements.
• Communication: Macroprudential policy cannot rely on rules but must be
based on a continuous assessment of evolving risks (IMF 2014); therefore,
ASEAN-5 authorities should communicate openly on macroprudential policy. Clear communication of policy intentions can improve transmission of mac-
roprudential action, both when measures are taken and when they are relaxed.
Communication can also promote public understanding of the need for mac-
roprudential measures, counter biases in favor of inaction, and enhance legit-
imacy and accountability of macroprudential policy. Clear communication
can be achieved by setting out and maintaining a policy strategy, periodically
publishing risk assessments, and publishing the records of policy meetings.
• Coordination: Interagency coordination needs to be improved, and clarity
about roles, responsibilities, and powers is key to ensuring effective and time-
ly decisions. Since macroprudential policy relies on the use of microprudential
tools, the framework must facilitate a very high level of coordination across
agencies and provide adequate respect for each agency’s policy autonomy.
Crisis Management
Contingency planning is a critical element of crisis preparedness that lays out
responsibilities and implementation arrangements for early intervention and res-
olution measures. Advanced preparation covering the way in which difficult
decisions will be made and coordinated among institutions if a broad-based
financial crisis gets underway can help promote an effective response to a crisis.
©International Monetary Fund. Not for Redistribution

Chapter 8 Systemic Risks and Financial Stability Frameworks 213
Although early intervention is likely to restore financial soundness in most
financial distress situations, there will be occasions when such intervention is not
possible and some form of resolution will be required. The procedure for resolv-
ing banks must swiftly protect systemic functions and reassure depositors.
Ordinary insolvency proceedings normally cannot guarantee this result, which is
why most countries already have special administrative (out-of-court) procedures
for handling bank resolution.
An effective resolution framework has clear mandates for resolution, provides
independence and adequate legal protection for supervisors, and grants appropri-
ate resolution powers to the resolution authority. The Key Attributes of Effective
Resolution Regimes for Financial Institutions adopted by the Financial Stability
Board is the new, nonbinding international standard. The attributes specify essen-
tial features that should be part of the resolution framework to make resolution
feasible without severe systemic disruption and without exposing taxpayers to loss.
In all ASEAN-5 countries, there is scope for improving coordina-
tion mechanisms:
• In Indonesia, the responsibilities of each agency have been further clarified
in the Prevention and Resolution of Financial System Crisis Law, enacted in
2016. However, the legal protection of staff and agencies involved in bank
resolution could be strengthened.
• In Malaysia, the Deposit Insurance Corporation is the resolution authority
for its member institutions, while the central bank is the resolution author-
ity for other financial entities. The Deposit Insurance Corporation’s resolu-
tion powers could be strengthened; it currently must seek High Court
approval for some measures.
• In the Philippines, weaknesses in resolution-related legal powers and protec-
tion remain. For example, the central bank’s authority to place a bank in
receivership or suspend shareholder rights, even when a bank’s failure is
imminent, is very limited.
• In Singapore, crisis management and resolution agreements are generally
strong, but could be further enhanced. The resolution regime does not
accord any preference to deposit liabilities held at foreign branches of local
banks, which could encourage ring-fencing measures in host jurisdictions
and discourage cooperative approaches.
• In Thailand, although the central bank has de facto responsibility for bank
resolution, much of the legal authority rests with the Cabinet. The Ministry
of Finance is still in charge of granting, suspending, and revoking licenses;
approving mergers and acquisitions; and liquidating problem assets.
Cryptocurrencies
Cryptocurrencies challenge the paradigm of state-supported fiat currencies and
the dominant role that central banks and conventional financial institutions have
played in the operation of the financial system (IMF 2016). They are issued
©International Monetary Fund. Not for Redistribution

214 THE ASEAN WAY: SUSTAINING GROWTH AND STABILITY
without the backing of a state and allow for direct peer-to-peer transactions and
eliminate the need for central clearinghouses. They have the potential to deepen
financial inclusion by offering secure and lower-cost payment options.
Cryptocurrencies also pose serious risks because they can facilitate money
laundering, terrorism financing, tax evasion, and other illegal activities. They
could eventually entail risks to financial stability if their use becomes widespread.
ASEAN-5 countries have adopted a variety of regulatory responses for dealing
with cryptocurrencies:
• The central bank of Indonesia issued a statement in 2014 saying that
Bitcoin and other virtual currencies are not legitimate payment instruments
and may not be used for payment in Indonesia. That statement was affirmed
in January 2018. The central bank prohibits all payment system operators
and financial technology from processing transactions using vir-
tual currencies.
• The central bank of Malaysia issued a statement in 2014 saying that
although it did not recognize Bitcoin as legal tender, the central bank would
not impose prudential or consumer conduct regulations on cryptocurrency
exchangers. In December 2017, the central bank announced that cryptocur-
rency exchangers would be designated as reporting entities under anti–
money laundering laws.
• The central bank of the Philippines adopted a cautious approach to crypto-
currencies. In June 2014, it released a warning regarding the proliferation of
virtual currencies in the Philippines, citing that without authorities regulat-
ing these platforms, no institution could provide consumers protection and
insurance in the event of financial losses. In February 2017, the central bank
issued guidelines for cryptocurrency registration, operations management,
and reporting requirements.
• The central bank of Singapore indicated that it would not regulate crypto-
currencies but plans to stay watchful of the risks posed by the technology.
The emphasis is more on the risks associated with activities surrounding
cryptocurrencies.
• The central bank of Thailand has repeatedly warned consumers and inves-
tors that cryptocurrencies are just electronic data with no intrinsic worth,
whose value can vary rapidly based on market conditions. The central bank
remains concerned about the general public’s potential lack of understand-
ing on the subject. From a legal standpoint, regulations in place do not
explicitly address the use of digital currencies.
The international standard-setter in the area of anti–money laundering and
combating the financing of terrorism (AML/CFT) is the Financial Action Task
Force (FATF). In 2015, it adopted guidance for the application of the AML/CFT
standard in the area of virtual currency. The FATF has issued specific guidance
for countries to impose customer due diligence obligations and other AML/CFT
preventive measures on virtual currency service providers (IMF 2017a).
©International Monetary Fund. Not for Redistribution

Chapter 8 Systemic Risks and Financial Stability Frameworks 215
CONCLUSION
Sustaining financial stability will require continuous efforts in ASEAN-5 coun-
tries. Financial systems are much more resilient today than during the Asian
financial crisis. The global financial crisis and the taper tantrum in 2013 were two
“stress tests” that were passed without much trouble. But financial systems should
always aim to be ready for the next stress episode.
Credit growth in ASEAN-5 countries accelerated significantly after the global
financial crisis. However, there is no clear evidence of credit booms in any of these
countries. It should be underscored that not all credit booms end in financial
crisis. Often credit booms emerge in the context of a financial deepening process.
High interconnectivity within financial systems and between financial systems
and the rest of the economy highlight how financial distress in one sector of the
economy can spill over to other sectors. Closely monitoring financial links across
sectors is essential to ring-fence the propagation of adverse shocks.
Policymakers should carefully monitor and contain the rapid growth of corpo-
rate leverage using a combination of macro- and microprudential policies. In
particular, there is a need to guard against a buildup of leverage and accumulation
of unhedged foreign currency liabilities, as well as to monitor corporate liquidity
and debt maturity to ensure sound debt-servicing capacity. Where necessary,
preemptive measures such as debt rescheduling, capital requirements, and non–
core asset disposal should be undertaken, particularly for highly leveraged corpo-
rations with low interest coverage ratios.
Household debt is high in some ASEAN-5 countries, entailing both macro-
economic and financial stability risks. Those risks could be contained with
demand-side measures (such as limits on debt-service-to-income and loan-to-value
ratios) and supply-side measures (such as limits on banks’ credit growth, loan
contract restrictions, and loan loss provisions).
Because they can smooth credit cycles, macroprudential policies are a key
pillar for containing the dangers of rapid credit growth. Financial system regula-
tion and supervision and crisis management frameworks are other key pillars for
resilience. The Basel III standards should be a benchmark that all countries aspire
to meet. Similarly, the Key Attributes for Effective Resolution of Financial
Institutions are the relevant metric for resolution frameworks. Regulatory frame-
works for cryptocurrencies are still evolving, but they should balance containing
risk against promoting innovation.
REFERENCESAdrian, T., and A. Narain. 2017. “Safe and Sound.” Finance & Development 54 (3): 14–17.Caballero, R. J., and A. Simsek. 2013. “Fire Sales in a Model of Complexity.” Journal of Finance
68 (6): 2549–587.Dell’Ariccia, G., D. Igan, L. Laeven, H. Tong, B. Bakker, and J. Vandenbussche. 2012. “Policies
for Macrofinancial Stability: How to Deal with Credit Booms?” IMF Staff Discussion Note 12/06, International Monetary Fund, Washington, DC.
Demirgüç-Kunt, A., and E. Detragiache. 1997. “The Determinants of Banking Crises in Developing and Developed Countries.” IMF Staff Papers 45 (1): 81–109.
©International Monetary Fund. Not for Redistribution

216 THE ASEAN WAY: SUSTAINING GROWTH AND STABILITY
Diebold, Francis X., and Kamil Yilmaz. 2014. “On the Network Topology of Variance Decompositions: Measuring the Connectedness of Financial Firms.” Journal of Econometrics 182 (1): 119–34. http:/ / www .ssc .upenn .edu/ ~fdiebold/ NoHesitations/ DY2014 .pdf.
Drehmann, M., C. Borio, and K. Tsatsaronis. 2012. “Characterising the Financial Cycle: Don’t Lose Sight of the Medium Term!” BIS Working Paper 380, Bank for International Settlements, Basel.
Gai, P., and S. Kapadia. 2010. “Contagion in Financial Networks.” Bank of England Working Paper 383, London.
International Monetary Fund (IMF). 2009. “Thailand: Financial Sector Stability Assessment.” IMF Country Report 09/147, Washington, DC.
———. 2010. “Philippines: Financial Sector Stability Assessment Update.” IMF Country Report 10/90, Washington, DC.
———. 2011a. Global Financial Stability Report, Chapter 3, Washington, DC, September.———. 2011b. “Macroprudential Policy: An Organizing Framework.” Washington, DC,
September.———. 2013a. “Malaysia: Financial Sector Stability Assessment.” IMF Country Report 13/52,
Washington, DC.———. 2013b. “Singapore: Financial Sector Stability Assessment.” IMF Country Report
13/325, Washington, DC.———. 2014. “Staff Guidance Note on Macroprudential Policy.” Washington, DC.———. 2015. “Philippines—Selected Issues.” IMF Country Report 15/247, Washington, DC.———. 2016. “Virtual Currencies and Beyond: Initial Considerations.” IMF Staff Discussion
Note 16/03, Washington, DC.———. 2017a. “Fintech and Financial Services: Initial Considerations.” IMF Staff Discussion
Note 17/05, Washington, DC.———. 2017b. “Indonesia: Financial Sector Stability Assessment.” IMF Country Report
17/152, Washington, DC.———. 2017c. “Malaysia: 2017 Article IV Consultation.” IMF Country Report 17/101,
Washington, DC.———. 2017d. “Singapore: 2017 Article IV Consultation.” IMF Country Report 17/240,
Washington, DC.———. 2017e. “Thailand: 2017 Article IV Consultation.” IMF Country Report 17/136,
Washington, DC.Leitner, Y. 2005. “Financial Networks: Contagion, Commitment, and Private Sector Bailouts.”
Journal of Finance 60 (6): 2925–953.Mendoza, E., and M. Terrones. 2008. “An Anatomy of Credit Booms: Evidence from Macro
Aggregates and Micro Data.” IMF Working Paper 08/226, International Monetary Fund, Washington, DC.
Minoiu, C., and J. A. Reyes. 2013. “A Network Analysis of Global Banking: 1978–2010.” Journal of Financial Stability 9 (2): 168–84.
Peltonen, T., M. Rancan, and P. Sarlin. 2015. “Interconnectedness of the Banking Sector as a Vulnerability to Crises.” European Central Bank Working Paper 1866, European Central Bank, Frankfurt.
©International Monetary Fund. Not for Redistribution

217
MACROECONOMIC POLICY SYNERGIES FOR SUSTAINED GROWTH
CHAPTER 9
INTRODUCTION
Managing boom-and-bust cycles in the presence of global spillovers remains a key
policy challenge for Association of Southeast Asian Nations–5 (ASEAN-5)
authorities. Recessions that follow a bust can lead to both temporary and perma-
nent output losses. Moreover, these losses are magnified in the presence of finan-
cial downturns. At the same time, setting the base for sustained growth not only
increases economic opportunities in the longer term but also contributes to sta-
bility in the short term by reducing the burden from past debt accumulation and
other financial risks.
Countercyclical monetary policy can play a key role in managing boom-and-
bust cycles, but on its own its effectiveness can sometimes be diminished. For
example, in low inflation–low natural rate environments, the zero lower bound
on nominal interest rates can become binding, limiting monetary policy’s ability
to deliver on inflation targets. In addition, lack of synchrony between financial
and real cycles can make it difficult to manage both cycles with a single instru-
ment (the policy rate). Moreover, setting the basis for sustained growth frequent-
ly requires appropriately tailored structural policies that stimulate the main
drivers of potential growth over the medium term. In this context, exploiting
synergies between monetary, macroprudential, and fiscal policies can bring pow-
erful benefits to managing business cycle fluctuations, preserving financial sta-
bility, and sustaining long-term growth.
Guarding both macroeconomic and financial stability usually requires gearing
different policy tools toward different objectives: First, macro policies that are
effective in managing the business cycle may not be as effective in managing the
financial cycle. Second, the business and the financial cycles typically have differ-
ent lengths and amplitudes, as documented in Chapter 6. Countries may find
themselves experiencing a financial boom (bust) during a business cycle bust
(boom). As a result, managing the business and financial cycles may require care-
ful calibration of macro-stabilization policies along with macroprudential policies.
This chapter was prepared by Manrique Saenz, Ana Corbacho, and Shanaka J. Peiris, in collabo-
ration with Ichiro Fukunaga, Dirk Muir, and Sohrab Rafiq.
©International Monetary Fund. Not for Redistribution

218 THE ASEAN WAY: SUSTAINING GROWTH AND STABILITY
Although monetary policy is tasked directly with price and output stability
objectives, fiscal policy can also play a key role. Fiscal policy may be an effective
tool for managing business cycles and supporting aggregate demand during a
recession. Moreover, fiscal stimulus in the form of productive spending on phys-
ical and human capital can also support potential growth over the medium to
long term, helping overcome some of the possible permanent losses following a
recession. Well-designed fiscal policy is important for short-term growth as well
as for long-term productivity.
This chapter elaborates on macroeconomic policy synergies for managing
economic cycles and sustaining growth. In particular, it analyzes the scope for
macroprudential and fiscal policy to aid in overcoming some of the challenges
faced by monetary policy in ASEAN-5 economies in the current global environ-
ment. The chapter first documents the output costs of boom-and-bust cycles in
ASEAN-5 countries. It then presents model-based simulations of the possible
synergies between monetary policy and macroprudential policies in smoothing
business and financial cycles. It continues with a focus on the interactions
between monetary and fiscal policy as stabilization tools. The final section offers
concluding remarks.
RECESSIONS AND OUTPUT LOSSES IN ASEAN-5 COUNTRIES
Crises and even recessions can lead to permanent output losses, according to the
literature, especially when they accompany financial instability. Using a panel of
190 countries, Cerra and Saxena (2008) document the persistence of large output
losses associated with financial (as well as political) crises. In addition, Cerra and
Saxena (2017) find that all types of recessions, on average, lead to permanent
output losses. These results contrast with the more traditional view that recessions
have only a temporary impact on output, based on the view that output will
return to its trend once full employment of resources is reestablished.
In line with the results from Cerra and Saxena (2008), novel estimates for
ASEAN-5 economies presented in this chapter also suggest that, following a
recession, growth has tended to rebound, but not strongly enough to fully restore
output to its precrisis trend.1 Figure 9.1 shows the impulse response of a “typical”
ASEAN growth recovery following a recession. The results show that after about
6 months, growth bounces back, with positive growth for about nine quarters
following an economic downturn. However, the response of real GDP growth
implies that the growth bounce-back is not directly proportional to the output
loss. Figure 9.2 illustrates the effect of the typical recession on real GDP. The
1Annex 9.1 presents vector autoregression estimates for ASEAN-5 countries for the period
1996–2017, using Pesaran’s panel mean group estimator to generate the impulse response for a
typical ASEAN country when hit by a recession.
©International Monetary Fund. Not for Redistribution

Chapter 9 Macroeconomic Policy Synergies for Sustained Growth 219
estimates imply that recessions have tended, at least over the sample period in
question (1996–2016), to have had hysteresis effects on the level of real GDP.2
These findings reinforce the need for countercyclical fiscal and monetary pol-
icies to mitigate economic downturns or prevent them from having long-term
adverse effects on economic growth.
SYNERGIES BETWEEN MONETARY AND MACROPRUDENTIAL POLICIES
The global financial crisis brought into greater focus both the need for macroeco-
nomic policy to include financial stability among its objectives and the debate on
whether financial stability should be a mandate of monetary policy. Although the
crisis reinforced the importance of well-anchored inflation expectations and
long-term price stability, it also challenged the notion that price stability is suffi-
cient for macroeconomic stability. Confronted with a severe financial and eco-
nomic crisis, central banks and researchers have been called to reconsider the role
2The Asian financial crisis of the late 1990s and the 2008–09 global financial crisis were certainly
big shocks during the sample period, and the results likely reflect the impact of these two events to
a large extent.
–1.0
–0.8
–0.4
–0.6
–0.2
0.0
0.2
0.4
0.6
Figure 9.1. Typical Response of ASEAN Real GDP Growth to a Recession, January 1996–January 2017
35 4030252015105
Perc
ent
Months
Source: IMF staff calculations.
–3.0
–2.5
–1.5
–2.0
–1.0
–0.5
0.0
0.5
Figure 9.2. Response of ASEAN-Level Real GDP
373125191371
Months
Perc
ent o
f GD
P
Source: IMF staff calculations.
©International Monetary Fund. Not for Redistribution

220 THE ASEAN WAY: SUSTAINING GROWTH AND STABILITY
of financial sector and asset price imbalances in the design and implementation
of monetary policy.3
Figure 9.3 illustrates the trade-offs involved when monetary policy is used for
financial stability purposes and the circumstances that alleviate or augment them.
Traditional monetary policy focuses on targeting inflation and output. In the
absence of growing financial risks, this focus allows the authorities to pursue
inflation and output targets in the medium term with no financial stability con-
cerns. However, such policy could also lead to growing financial risk and expected
losses from a crisis in the medium term, in which case a monetary policy that also
targets financial stability by “leaning against the wind” could be beneficial. This
result will depend on the effectiveness of the interest rate in lowering financial
risks and the expected losses from a crisis in the medium term. This benefit would
need to be compared with the cost from short-term deviations from inflation and
output targets and the corresponding welfare losses over the forecast period.
Absent other tools, results from mainly closed-economy New Keynesian
dynamic stochastic general equilibrium models support the case for leaning
against the wind (Curdia and Woodford 2009; Woodford 2012; Ajello and others
2016). However, the implied deviations from more standard inflation-output gap
decision rules are quantitatively small in these linear models (Gambacorta and
3There have been voices strongly advocating in favor (for example, Olsen 2015) and against (for
example, Svensson 2014) such a role for monetary policy, while others portray a more balanced
view (for example, Yellen 2014). Detailed discussions can be found in Smets (2014), Stein (2014),
and Svensson (2014), among others.
Source: IMF 2015.
Figure 9.3. To Lean or Not to Lean, Such Are the Trade-Offs
Targets (output,
Monetary
response
Lean against
©International Monetary Fund. Not for Redistribution

Chapter 9 Macroeconomic Policy Synergies for Sustained Growth 221
Signoretti 2014; Filardo and Rungcharoenkitkul 2016). Moreover, the case for
leaning against the wind is even weaker in small open economies, where the
impact of such policy on international capital flows may exacerbate macroeco-
nomic and financial stability concerns (Sahay and others 2014; Menna
and Tobal 2017).
Macroprudential policy tools can help alleviate tensions between monetary
and financial stability objectives.4 First, divergences between monetary and finan-
cial stability mandates stem, to a large extent, from attempts to achieve two dif-
ferent objectives with a single policy instrument, the monetary policy rate. This
is particularly relevant given that, as shown in Chapter 6, the real and financial
cycles are not always synchronized. Using macroprudential tools to curb systemic
risks may ease those tensions. Ghilardi and Peiris (2016), for example, show that
monetary and macroprudential policy coordination can enhance the policy effec-
tiveness in attenuating the real and financial cycles. Second, macroprudential
policies can also be more effective than interest rate policy in dampening the
financial cycle at a lower cost to output. Moreover, financial stability risks come
in all shapes and forms. And while macroprudential tools can be customized to
address specific risks, movements in the monetary policy rate would have a mac-
roeconomic impact.
For the ASEAN-5, empirical estimates prepared in this chapter show that
macroprudential policies have been effective in taming the financial cycle without
significantly affecting the real business cycle. Using a Bayesian vector autoregres-
sion, Figure 9.4 (and Annex 9.2) presents the response of credit and output
growth to a shock in the macroprudential policy stance in the ASEAN-5 econo-
mies. Results suggest that for several countries credit growth is significantly more
sensitive to macroprudential policies than is real GDP growth, especially in
Malaysia, the Philippines, and Thailand over the medium term.
Nevertheless, macroprudential tools remain relatively new and untested, and
their implementation faces challenges. Macroprudential tools are prone to cir-
cumvention and political economy problems (IMF 2012) and may be difficult to
adjust depending on institutional settings. Also, financial stability has multiple
dimensions and many potential policy indicators and targets. Moreover, bubbles
and the imminence of a systemic crisis are difficult to identify in real time, and
policy needs to strike a balance between guarding against financial risks and
allowing for healthy financial activity (IMF 2014a).5 In sum, the effects of
4Macroprudential policy has been defined as “the use of primarily prudential tools to limit
systemic risk, that is the risk of disruptions to the provision of financial services that is caused by
an impairment of all or parts of the financial system, and can cause serious negative consequences
for the real economy” (IMF 2014b). It includes a range of instruments, such as measures to address
sector-specific risks (for example, loan-to-value and debt-to-income ratios), countercyclical capital
requirements, dynamic provisions, reserve requirements, liquidity tools, and measures to affect
foreign-currency-based or residency-based financial transactions.5Difficulties in identifying financial risks hinder the use of monetary policy to attenuate the
financial cycle as well.
©International Monetary Fund. Not for Redistribution

222 THE ASEAN WAY: SUSTAINING GROWTH AND STABILITY
0 20 400 20 40
1. Thailand 2. Malaysia
–0.6
–0.4
–0.2
0.0
0.2
–1.0
–0.5
0.0
0.5
0 20 400 20 40–1.0
–0.5
0.0
0.5
–0.4
–0.2
0.2
0.0
0.4
0 20 40–1.5
–1.0
–0.5
0.0
0.5
3. Singapore 4. Philippines
5. Indonesia
Figure 9.4. Median Response of Credit and Real GDP Growth to a Tightening in Macroprudential Policy
Source: IMF staff calculations.
CreditReal GDP
Perc
ent
Months
Perc
ent
Perc
ent
Months
Months Months
Months
Perc
ent c
hang
e
Perc
ent c
hang
ePe
rcen
t cha
nge
©International Monetary Fund. Not for Redistribution

Chapter 9 Macroeconomic Policy Synergies for Sustained Growth 223
macroprudential policies on financial markets and economic outcomes and the
interactions with monetary policy need to be investigated further.
The rest of this section explores how synergies between monetary and macro-
prudential policies in the ASEAN-5 countries can achieve better macro outcomes.
Model-based simulations for the Philippines and Thailand are presented to ana-
lyze whether the use of countercyclical macroprudential policies can complement
the ability of monetary policy to target inflation while containing financial stabil-
ity risks in the face of shocks. Then, outcomes for level and volatility of inflation,
consumption, investment, and private credit are compared under the different
monetary and macroprudential policy reaction functions.
The focus is on excessive leverage in the private sector as the key source of
financial instability. Private sector debt has been increasing as a percentage of
GDP among ASEAN-5 economies since the global financial crisis (Figure 9.5),
and increasing evidence indicates that the buildup of private sector debt is harm-
ful for growth. Schularick and Taylor (2012) show that credit growth is a power-
ful predictor of financial crises, and Jordà, Schularick, and Taylor (2013) show
that more-credit-intensive expansions tend to be followed by deeper recessions (in
financial crises or otherwise) and slower recoveries. The composition of private
Credit to NFCs Credit to households
Sources: Bank for International Settlements; Dealogic; Haver Analytics; national authorities; and IMF staff calculations.
2008
2013
2016
2008
2013
2016
2008
2013
2016
2008
2013
2016
Indonesia MalaysiaThailand
0
20
40
60
80
100
120
140
160
Figure 9.5. Asia: Private Sector Debt(Percent of GDP)
©International Monetary Fund. Not for Redistribution
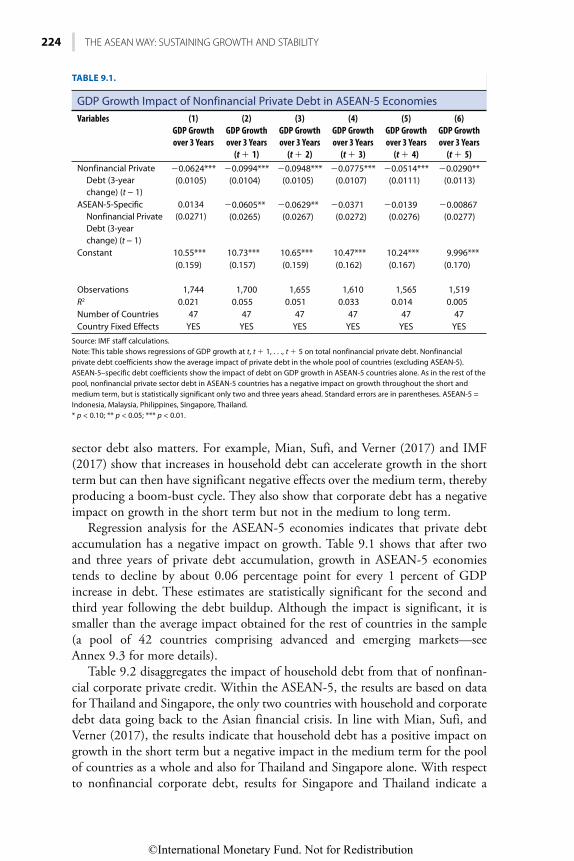
224 THE ASEAN WAY: SUSTAINING GROWTH AND STABILITY
sector debt also matters. For example, Mian, Sufi, and Verner (2017) and IMF
(2017) show that increases in household debt can accelerate growth in the short
term but can then have significant negative effects over the medium term, thereby
producing a boom-bust cycle. They also show that corporate debt has a negative
impact on growth in the short term but not in the medium to long term.
Regression analysis for the ASEAN-5 economies indicates that private debt
accumulation has a negative impact on growth. Table 9.1 shows that after two
and three years of private debt accumulation, growth in ASEAN-5 economies
tends to decline by about 0.06 percentage point for every 1 percent of GDP
increase in debt. These estimates are statistically significant for the second and
third year following the debt buildup. Although the impact is significant, it is
smaller than the average impact obtained for the rest of countries in the sample
(a pool of 42 countries comprising advanced and emerging markets—see
Annex 9.3 for more details).
Table 9.2 disaggregates the impact of household debt from that of nonfinan-
cial corporate private credit. Within the ASEAN-5, the results are based on data
for Thailand and Singapore, the only two countries with household and corporate
debt data going back to the Asian financial crisis. In line with Mian, Sufi, and
Verner (2017), the results indicate that household debt has a positive impact on
growth in the short term but a negative impact in the medium term for the pool
of countries as a whole and also for Thailand and Singapore alone. With respect
to nonfinancial corporate debt, results for Singapore and Thailand indicate a
TABLE 9.1.
GDP Growth Impact of Nonfinancial Private Debt in ASEAN-5 Economies
Variables (1)
GDP Growth
over 3 Years
(2)
GDP Growth
over 3 Years
(t � 1)
(3)
GDP Growth
over 3 Years
(t � 2)
(4)
GDP Growth
over 3 Years
(t � 3)
(5)
GDP Growth
over 3 Years
(t � 4)
(6)
GDP Growth
over 3 Years
(t � 5)
Nonfinancial Private
Debt (3-year
change) (t − 1)
�0.0624***
(0.0105)
�0.0994***
(0.0104)
�0.0948***
(0.0105)
�0.0775***
(0.0107)
�0.0514***
(0.0111)
�0.0290**
(0.0113)
ASEAN-5-Specific
Nonfinancial Private
Debt (3-year
change) (t − 1)
0.0134
(0.0271)
�0.0605**
(0.0265)
�0.0629**
(0.0267)
�0.0371
(0.0272)
�0.0139
(0.0276)
�0.00867
(0.0277)
Constant 10.55*** 10.73*** 10.65*** 10.47*** 10.24*** 9.996***
(0.159) (0.157) (0.159) (0.162) (0.167) (0.170)
Observations 1,744 1,700 1,655 1,610 1,565 1,519
R2 0.021 0.055 0.051 0.033 0.014 0.005
Number of Countries 47 47 47 47 47 47
Country Fixed Effects YES YES YES YES YES YES
Source: IMF staff calculations.
Note: This table shows regressions of GDP growth at t, t � 1, . . ., t � 5 on total nonfinancial private debt. Nonfinancial
private debt coefficients show the average impact of private debt in the whole pool of countries (excluding ASEAN-5).
ASEAN-5–specific debt coefficients show the impact of debt on GDP growth in ASEAN-5 countries alone. As in the rest of the
pool, nonfinancial private sector debt in ASEAN-5 countries has a negative impact on growth throughout the short and
medium term, but is statistically significant only two and three years ahead. Standard errors are in parentheses. ASEAN-5 =
Indonesia, Malaysia, Philippines, Singapore, Thailand.
* p < 0.10; ** p < 0.05; *** p < 0.01.
©International Monetary Fund. Not for Redistribution

Chapter 9 Macroeconomic Policy Synergies for Sustained Growth 225
negative impact on growth in the shorter term (one or two years ahead) that is
stronger than the average impact for the other countries in the sample.
Model Description
The framework of Anand, Delloro, and Peiris (2014) is extended to incorporate
a household borrowing, housing and macroprudential policies. It is based on a
New Keynesian dynamic stochastic general equilibrium model for small open
economies with price rigidities and financial friction. Figure 9.6 depicts the rela-
tionships between agents in this economy.
• There are two types of households, patient (with a lower intertemporal
discount rate) and impatient, which both derive utility from consumption,
leisure, and housing. In equilibrium, the patient households save part of
their income, which is invested in domestic bank deposits and foreign
bonds. Impatient households end up borrowing to consume and
purchase houses.
• Entrepreneurs borrow from domestic banks and from abroad to purchase
capital. They also hire labor and produce goods that are then sold to retailers
TABLE 9.2.
GDP Growth Impact of Debt in Thailand and Singapore versus Other Countries
Variables (1)
GDP Growth
over 3 Years
(2)
GDP Growth
over 3 Years
(t � 1)
(3)
GDP Growth
over 3 Years
(t � 2)
(4)
GDP Growth
over 3 Years
(t � 3)
(5)
GDP Growth
over 3 Years
(t � 4)
(6)
GDP Growth
over 3 Years
(t � 5)
Household Debt (3-year
change) (t − 1)
0.0481
(0.0332)
�0.0497
(0.0343)
�0.216***
(0.0357)
�0.361***
(0.0372)
�0.425***
(0.0395)
�0.394***
(0.0409)
Thailand- or Singapore-
Specific Household
Debt (3-year change)
0.457**
(0.195)
0.358*
(0.199)
0.0446
(0.201)
�0.481**
(0.203)
�0.559***
(0.211)
�0.294
(0.232)
Corporate Debt (3-year
change) (t − 1)
�0.0857***
(0.0141)
�0.109***
(0.0138)
�0.0700***
(0.0139)
�0.0235*
(0.0139)
0.0139
(0.0142)
0.0396***
(0.0143)
Thailand- or Singapore-
Specific Corporate Debt
(3-year change) (t − 1)
�0.295***
(0.0841)
�0.348***
(0.0876)
�0.239***
(0.0905)
�0.0151
(0.0907)
0.0630
(0.0915)
0.0206
(0.0972)
Constant 8.906***
(0.211)
9.195***
(0.213)
9.604***
(0.221)
9.991***
(0.230)
10.11***
(0.242)
9.769***
(0.250)
Observations 1,111 1,064 1,017 970 923 876
R2 0.045 0.087 0.094 0.122 0.130 0.105
Number of Countries 47 47 47 47 47 45
Country Fixed Effects YES YES YES YES YES YES
Source: IMF staff calculations.
Note: This table shows regressions of GDP growth at t, t � 1, . . ., t � 5 on household and corporate debt. Household and
corporate debt coefficients show the average impact of household and corporate debt in the whole pool of countries
(excluding Singapore and Thailand). Thailand- or Singapore-specific debt coefficients show the impact of debt on GDP
growth in Thailand and Singapore alone. As in other countries, household debt in Thailand and Singapore has a negative
impact on growth over the medium term (four and five years ahead). The impact in the short term is positive. As in other
countries, private corporate debt in Thailand and Singapore has a statistically significant negative impact on GDP growth in
the short term but not in the medium term. The average results for all countries are in line with those presented in Mian,
Sufi, and Verner 2017. Standard errors are in parentheses.
* p < 0.10; ** p < 0.05; *** p < 0.01.
©International Monetary Fund. Not for Redistribution

226 THE ASEAN WAY: SUSTAINING GROWTH AND STABILITY
who subsequently sell to consumers, capital producers, and foreign markets
in a monopolistically competitive environment.
• Banks can lend to the government, entrepreneurs, or households. Interest
rates are sticky because banks face increasing marginal costs associated with
changes in interest rates. At the same time, bank borrowing is subject to
macroprudential measures.
Government policies are described by two policy reaction functions: one for
the monetary policy interest rate that follows a Taylor rule and one for macropru-
dential policy measures. The simulations look at two different macroprudential
tools. In Thailand, with a high household-debt-to-GDP ratio, the focus is on the
impact of a countercyclical loan-to-value ceiling that restricts lending to house-
holds to a certain proportion of the value of their houses. In the Philippines,
where more concern is placed on rapid bank credit growth and rising corporate
debt, the focus is on the impact of a countercyclical capital adequacy ratio (or
countercyclical capital buffer, an extension of the Basel III capital conservation
buffer), which restricts overall bank borrowing.
Simulations for Thailand: Adding a Countercyclical Loan-to-Value Ratio
For Thailand, the model is calibrated to assess the impact of a temporary positive
shock on the demand for housing. The starting conditions mirror the current
juncture: inflation is below target and there is a small negative output gap, but
Deposits
Source: IMF staff.Note: DSGE = dynamic stochastic general equilibrium.
Figure 9.6. Structure of the DSGE Model
Central bank
Loans
Policy rateWholesale bank Fiscal agent
Retailers EntrepreneursIntermediate
goods
Borrowing
Capital producers
Rest of world
Savings bank Lending bank
DepositsLoans
Patient households Impatient households
Exports
Deposits
Labor Wages Loans
Capital
Consumption
Investment
©International Monetary Fund. Not for Redistribution

Chapter 9 Macroeconomic Policy Synergies for Sustained Growth 227
household debt and house prices are relatively high. In this context, lowering the
monetary policy rate to improve the inflation and growth outlook could fuel
further imbalances in the housing sector. In turn, further accumulation of house-
hold debt could produce a negative feedback loop on growth.
The response of the economy to this shock is examined under two variants of
the Taylor rule and two variants of the macroprudential policy rule. The two
variants of the Taylor rule are as follows:
1. Standard Taylor rule—focused on inflation and output gaps
i = α 1 · inflation gap + α
2 · output gap, (9.1)
in which i is the policy interest rate, inflation gap is the difference between actual
inflation and the target, and output gap is the difference between actual and
potential output.
2. Modified Taylor rule—focused on inflation, output, and credit gaps
i = α 1 · inflation gap + α
2 · output gap + α
3 · credit gap, (9.2)
in which credit gap is the difference between the actual stock of household credit
and the steady-state level.
The two variants for the macroprudential policy measure are as follows:
1. Constant macroprudential policy measures: The loan-to-value ceiling applied
to household credit and the minimum capital adequacy ratio applied to bank
credit are kept constant.
2. Countercyclical loan-to-value ratios: The loan-to-value ceiling applied to
household credit decreases as the stock of household loans increases relative to
the steady-state value.
These variants in policy functions yield four possible scenarios:
1. Standard Taylor rule + constant macroprudential measures
2. Modified Taylor rule + constant macroprudential measure
3. Standard Taylor rule + countercyclical macroprudential measure
4. Modified Taylor rule + countercyclical macroprudential measure
In the simulations the authorities can use monetary policy, macroprudential
policy, or both to respond to the impact of the housing demand shock. The policy
reaction functions follow the four possible scenarios described above. A first set
of results compares outcomes when monetary policy is the only instrument avail-
able for tackling both macroeconomic and financial imbalances. Macroprudential
policy is passive with a constant loan-to-value ratio that does not react to signals
of growing financial imbalance in the housing sector.
• In scenario 1 (dark blue line, Figure 9.7), with monetary policy following a
standard Taylor rule and a constant loan-to-value ratio, a positive shock to
the demand for housing leads to an increase in house prices and in the level
for housing loans in the economy. Inflation increases and output falls slight-
ly on impact, but then they converge to the steady state on a cyclical path.
©International Monetary Fund. Not for Redistribution

228 THE ASEAN WAY: SUSTAINING GROWTH AND STABILITY
The authorities respond with an initial increase in the nominal and real
policy rates, then reduce them in subsequent quarters.
• In scenario 2 (red line, Figure 9.7), where the authorities are concerned about
a buildup in household loans, but use interest rates as the single instrument
(modified Taylor rule and constant loan-to-value scenario), the increase in
household loans is significantly mitigated, while output and inflation drop.
Interestingly, the paths of the nominal interest rates are below those under
scenario 1. The threat of an increase in the real rate in response to higher
housing loans reduces the equilibrium demand for housing loans and goods.
This actually preempts the need for nominal and real rates to be raised above
those in scenario 1, except on impact, when the real rate is now higher.
Standard Taylor + constant LTV
1 2 3 4 5 6 7 8 9 10 11 12 1 2 3 4 5 6 7 8 9 10 11 12
1. Nominal Interest Rate(Percentage points, deviation from steady state)
2. Housing Loans(Percentage points, deviation from steady state)
–2.0
0.0
2.0
4.0
6.0
8.0
10.0
12.0
–0.4
–0.3
–0.2
–0.1
0.0
0.1
0.2
0.3
1 2 3 4 5 6 7 8 9 10 11 12 1 2 3 4 5 6 7 8 9 10 11 12
(Percentage points, deviation from steady state)4. Output
(Percentage points, deviation from steady state)
–0.5
–0.4
–0.3
–0.2
–0.1
0.0
0.1
0.2
–1.0
–0.8
–0.6
–0.4
–0.2
0.0
0.2
Figure 9.7. Response to Positive Shock on Demand for Housing
©International Monetary Fund. Not for Redistribution
Chapter 9 Macroeconomic Policy Synergies for Sustained Growth 229
These two scenarios illustrate the trade-off faced by the authorities when try-
ing to target both household debt and inflation using the policy interest rate as
the only instrument. When the cycles for household debt and inflation are not
synchronized, achieving the inflation target requires letting go of the household
debt target. Conversely, moderating the household debt increase requires letting
go of the inflation target. Moreover, incorporating household debt concerns in
the Taylor rule leads to even lower nominal rates over the medium term, thereby
increasing the likelihood of hitting the zero lower bound given the current
low-interest-rate environment.
A second set of results looks at the benefits of introducing a countercyclical
loan-to-value ratio into the authorities’ toolbox.
• In scenario 3 (green line, Figure 9.7), with a standard Taylor rule and a
countercyclical loan-to-value ratio, the loan-to-value ceiling is tightened in
response to an increase in household debt, and the impact of the housing
demand shock on household debt is mitigated. In turn, interest rate policy
remains focused on inflation and output, delivering on macroeconomic
stability. Some downward adjustment in nominal rates takes place, but
much less than in scenario 2.
• In scenario 4 (light blue line, Figure 9.7), with a modified Taylor rule and a
countercyclical loan-to-value ratio, the imbalance in the housing sector is
addressed, but inflation and output are still lower than in scenario 3.
Considering all scenarios together, results suggest that the separation principle
holds. Better outcomes in growth, inflation, and financial stability can be
achieved with monetary policy focused on its traditional targets of inflation and
output and macroprudential policy targeting the specific source of financial insta-
bility. Asking monetary policy to do too much (that is, to also target financial
stability) comes at the cost of suboptimal inflation and growth. Moreover, in a
low inflation–low interest rate environment, it may increase the risk of hitting the
zero lower bound.
Critical in these results is that both interest rate and macroprudential poli-
cies are effective in achieving their respective targets. In this model, macropru-
dential policy does not suffer from leakages, and interest rate policy transmis-
sion operates smoothly. Also, countercyclical loan-to-value ratios and interest
rates under the modified Taylor rule are assumed to react immediately and
strongly to dynamics in household loans. Implementation lags or weaker trans-
mission in either macroprudential or monetary policy could potentially affect
the conclusion on the size of the gains from the separation principle or even its
superiority.6 For example, alternative simulations7 in which the interest rate
6For example, in Thailand, nonbank financial institutions play a significant role in household
credit, and the reach of macroprudential instruments is more limited in this sector. In addition,
the supervision of banks and nonbanks is carried out by different institutions, which could present
coordination challenges when implementing a countercyclical macroprudential policy.7Available on request from the authors.
©International Monetary Fund. Not for Redistribution

230 THE ASEAN WAY: SUSTAINING GROWTH AND STABILITY
transmission mechanism is diminished by a flatter Phillips curve (one in which
the impact of the output gap on inflation is much lower) yield smaller trade-offs
between scenarios 1 and 2.8 As a result, it is still optimal to use macroprudential
policy to contain housing credit growth while focusing the policy rate only on
inflation and output gaps, but the gains are smaller. Other simulations also
show that, in cases in which the ability to adjust macroprudential tools is very
limited or the macroprudential tools applied are too blunt and affect credit well
beyond vulnerable sectors, the separation principle is sometimes an
inferior option.
An Application to the Philippines: A Countercyclical Capital Buffer
In the Philippines, the model is first calibrated to assess the impact of a nega-
tive interest rate shock. Historic low real interest rates since the global financial
crisis have fueled rapid bank credit growth, raising financial stability risks.
Household debt is relatively low compared with corporate debt, and bank credit
is concentrated in lending to businesses, particularly large conglomerates
(Figure 9.8). External borrowing by businesses has also risen since the global
financial crisis and, as a result, the corporate sector in the Philippines is also
exposed to global financing conditions. Hence, a key policy challenge is manag-
ing rising bank credit and corporate leverage while sustaining robust
growth momentum.
The simulations focus on the synergies between monetary policy and a coun-
tercyclical macroprudential tool, in particular, a countercyclical capital buffer, in
response to a decline in interest rates. Such a buffer could potentially help miti-
gate a credit boom in a very-low-interest-rate environment such as that of the
Philippines over the past decade or so. Exploiting synergies between monetary
and macroprudential policies may also help insulate the economy from global
financial volatility that would raise the external financing premium.
Figure 9.9 presents the response to a negative shock to the domestic interest
rate under different macroprudential policy reaction functions. Scenario 1 (blue
line) plots the results from a standard Taylor rule for the policy rate (similar to
that specified for Thailand) with a constant capital ratio, while scenario 2 (red
line) plots the results from a standard Taylor rule with a countercyclical capital
buffer. The use of a countercyclical buffer yields better results; that is, it tempers
the rise in bank credit and real estate prices by mandating that banks hold more
capital, thereby discouraging a reduction in the lending rate. Consumption does
not rise as much as in scenario 1, so there is a welfare cost, but consumption is
still higher than it was before the shock. In summary, the countercyclical buffer
8In this case, the increase in household credit in response to the positive housing demand shock
would be smaller under scenario 1, but the drop in inflation and output when leaning against the
wind (scenario 2) would also be smaller.
©International Monetary Fund. Not for Redistribution
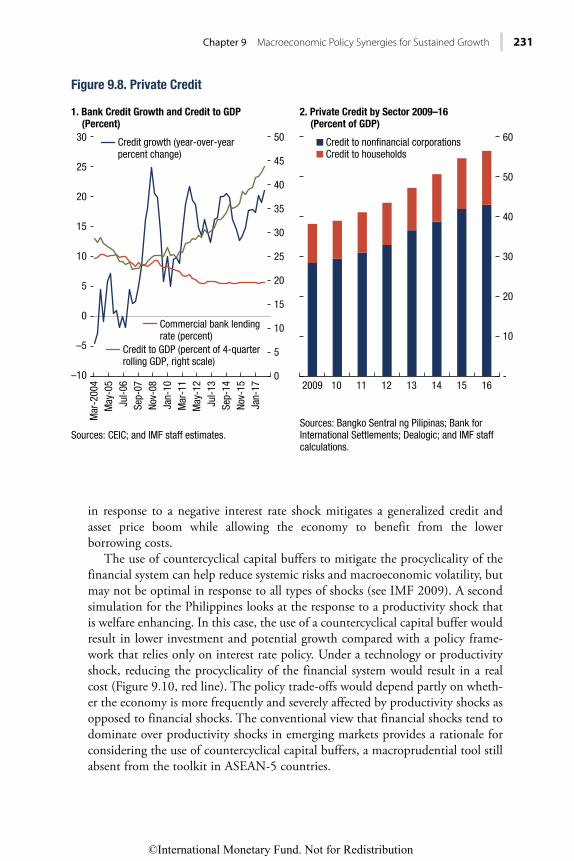
Chapter 9 Macroeconomic Policy Synergies for Sustained Growth 231
in response to a negative interest rate shock mitigates a generalized credit and
asset price boom while allowing the economy to benefit from the lower
borrowing costs.
The use of countercyclical capital buffers to mitigate the procyclicality of the
financial system can help reduce systemic risks and macroeconomic volatility, but
may not be optimal in response to all types of shocks (see IMF 2009). A second
simulation for the Philippines looks at the response to a productivity shock that
is welfare enhancing. In this case, the use of a countercyclical capital buffer would
result in lower investment and potential growth compared with a policy frame-
work that relies only on interest rate policy. Under a technology or productivity
shock, reducing the procyclicality of the financial system would result in a real
cost (Figure 9.10, red line). The policy trade-offs would depend partly on wheth-
er the economy is more frequently and severely affected by productivity shocks as
opposed to financial shocks. The conventional view that financial shocks tend to
dominate over productivity shocks in emerging markets provides a rationale for
considering the use of countercyclical capital buffers, a macroprudential tool still
absent from the toolkit in ASEAN-5 countries.
Credit growth (year-over-yearpercent change)
Commercial bank lendingrate (percent)
Credit to GDP (percent of 4-quarterrolling GDP, right scale)
Credit to households
Sources: CEIC; and IMF staff estimates.Sources: Bangko Sentral ng Pilipinas; Bank for International Settlements; Dealogic; and IMF staff calculations.
0
5
10
15
20
25
30
35
40
45
50
Mar
-200
4
May
-05
Jul-
06
Sep-
07
Nov
-08
Jan-
10
Mar
-11
May
-12
Jul-
13
Sep-
14
Nov
-15
Jan-
17 2009 10 11 12 13 14 15 16-
10
20
30
40
50
60
–10
–5
0
5
10
15
20
25
30
Figure 9.8. Private Credit
1. Bank Credit Growth and Credit to GDP(Percent)
2. Private Credit by Sector 2009–16(Percent of GDP)
©International Monetary Fund. Not for Redistribution

232 THE ASEAN WAY: SUSTAINING GROWTH AND STABILITY
SYNERGIES BETWEEN MONETARY AND FISCAL POLICY
As discussed in the previous section, low interest rates since the global financial
crisis have spawned challenges for monetary policy and financial stability in the
ASEAN-5 economies. Historically low global interest rates have spilled over to
domestic interest rates (see Chapter 4). In some countries, the resulting easy
financing conditions have amplified domestic financial cycles, resulting in elevat-
ed household debt, corporate debt, or both, even when inflation pressure has
remained subdued (Chapter 7). Diverging business and financial cycles have put
to the test the calibration of monetary policy and possible synergies with macro-
prudential policies.
Standard Taylor rule + constant capital buffer Standard Taylor rule + countercyclical capital buffer
1 2 3 4 5 6
Quarters Quarters
Quarters Quarters
7 8 9 10 11 12 1 2 3 4 5 6 7 8 9 10 11 12
1. Policy Rate(Percentage points, deviation from steady state)
2. Lending Rate(Percentage points, deviation from steady state)
–1.0
–0.8
–0.6
–0.4
–0.2
0.0
0.2
0.4
–2.0
–1.5
–1.0
–0.5
0.0
0.5
1 2 3 4 5 6 7 8 9 10 11 12 1 2 3 4 5 6 7 8 9 10 11 12
3. House Prices(Percentage points, deviation from steady state)
4. Consumption(Percentage points, deviation from steady state)
0.0
0.1
0.2
0.3
0.4
0.5
0.6
0.7
0.8
–1.0
–0.5
0.0
0.5
1.0
1.5
2.0
2.5
3.0
Source: Author simulations.
Figure 9.9. Response to a Negative Domestic Policy Rate Shock
©International Monetary Fund. Not for Redistribution

Chapter 9 Macroeconomic Policy Synergies for Sustained Growth 233
Yet the same environment that has put monetary policy to the test has likely
made fiscal policy all the more powerful as a tool for stabilizing the business cycle.
In countries with economic slack and low inflation, fiscal stimulus can stimulate
aggregate demand, reducing the burden on countercyclical monetary policy and
any potential trade-offs with financial stability. In contrast, in countries with
robust growth and inflation, fiscal stimulus and the spur to domestic demand
may need to be compensated for by monetary policy tightening. In this case, fiscal
and monetary policy may work at cross-purposes rather than in sync.
The use of fiscal policy to stabilize the cycle, however, is not free of challenges.
Changes in fiscal policy frequently require legislative changes and are often
opposed by well-organized groups whose interests would be harmed. Even if such
Standard Taylor rule + constant capital buffer Standard Taylor rule + countercyclical capital buffer
1 2 3 4 5 6
Quarters Quarters
Quarters Quarters
7 8 9 10 11 12 1 2 3 4 5 6 7 8 9 10 11 12
1. Output(Percentage points, deviation from steady state)
2. Lending Interest Rate(Percentage points, deviation from steady state)
–0.14
–0.12
–0.10
–0.08
–0.06
–0.04
–0.02
0.00
0.0
0.2
0.4
0.6
0.8
1.0
1.2
1 2 3 4 5 6 7 8 9 10 11 12 1 2 3 4 5 6 7 8 9 10 11 12
3. Corporate Loans(Percentage points, deviation from steady state)
4. Investment(Percentage points, deviation from steady state)
0.0
0.1
0.2
0.3
0.4
0.5
0.6
0.7
0.8
0.0
0.2
0.4
0.6
0.8
1.0
1.2
Source: Author simulations.
Figure 9.10. Response to a Positive Technology Shock
©International Monetary Fund. Not for Redistribution

234 THE ASEAN WAY: SUSTAINING GROWTH AND STABILITY
changes are approved, implementation is often cumbersome and subject to
delays. These hurdles help explain why fiscal policy in most emerging markets has
been found to be procyclical over the past few decades (Ilzetzki and Vegh 2008).
Coordination with monetary authorities can also be challenging, given the
importance of a central bank that is independent and that is regarded as such.
This section looks at the conditions under which exploiting synergies between
monetary and fiscal policies may improve macroeconomic outcomes. In particu-
lar, it analyzes the impact of fiscal stimulus from public investment in infrastruc-
ture under different reactions of monetary policy as well as different government
financing strategies. Although development needs vary across ASEAN-5 coun-
tries, many face common challenges from infrastructure gaps. There is scope to
increase the quality of infrastructure to catch up with regional leaders such as
Singapore (Figure 9.11). Better infrastructure could also help increase total factor
productivity where there is currently a significant gap with respect to advanced
economies (Figure 9.12).
Model Description
The simulations are based on the APDMOD, a module of the IMF’s Flexible
System of Global Models.9 This is a semistructural model of the global economy,
with individual blocks for 16 Asian countries and 8 additional regions to repre-
sent the rest of the world. The model has a rich fiscal sector with seven possible
instruments, including spending on consumption, infrastructure, or transfers;
lump sum taxation on households; and distortionary taxation on consumption,
labor, and capital. Only some households hold debt as a source of wealth, which
allows them to smooth consumption in the face of shocks or policy changes.
Other households cannot save effectively and live off only their current income.
These non-Ricardian properties allow fiscal policy to have a powerful role in the
long term, not just the short term. Monetary policy is assumed to follow an
inflation-targeting regime. With its rich fiscal sector, this model is well suited to
simulate the impact of different fiscal policies under different financing scenarios.10
Simulations
This first set of results illustrates an expansion of 1 percent of GDP in infrastruc-
ture investment every year over a period of five years for all ASEAN-5 countries.
All of the infrastructure push is implemented through traditional public invest-
ment financed by lower government transfers to households in a budget-neutral
9See Andrle and others (2015) for a detailed description and Corbacho and others (forthcoming)
for a recent application to Asian economies.10Its results, however, are not directly comparable with those obtained in the previous section,
where the model used had a more sophisticated financial sector (but a very simple fiscal sector)
and where policies simulated included a monetary and macroprudential policy component but no
fiscal component.
©International Monetary Fund. Not for Redistribution

Chapter 9 Macroeconomic Policy Synergies for Sustained Growth 235
Sources: IMF, World Economic Outlook database; World Economic Forum; and IMF staff calculations.Note: Figure uses International Organization for Standardization country codes. EMEUR = emerging Europe; LAC = Latin America and the Caribbean.
EMEU
RLA
C
Adv.
oth
er
VNM
PHL
MYS
MN
GLN
KIN
DID
NH
KMBG
D
THA
SGP
KOR
HKG
CH
N
JPN
0
1
2
3
4
5
6
7
Figure 9.11. Indicator of Quality of Infrastructure(Index, 1–7; 7 = best)
China IndiaJapan Korea
PhilippinesLatin America
Eastern Europe
ASEAN-4EMDEs
Sources: Penn World Table 9.0; and IMF staff calculations.Note: All TFP is weighted by PPP. EMDEs include Bangladesh, Bhutan, Cambodia, Fiji, Lao P.D.R., Myanmar, Nepal, Sri Lanka, and Vietnam. EMDEs = emerging market and developing economies; PPP = purchasing power parity; TFP = total factor productivity.
0
10
20
30
40
50
60
70
80
90
100
Figure 9.12. Total Factor Productivity(At current PPP; United States = 1)
2001 02 03 04 05 06 07 08 09 10 11 12 13 14
©International Monetary Fund. Not for Redistribution

236 THE ASEAN WAY: SUSTAINING GROWTH AND STABILITY
manner. In turn, monetary policy follows a standard Taylor rule, with the interest
rate path set to close inflation and output gaps over the forecast horizon.
The simulations show that the total 5 percentage point increase in infrastruc-
ture investment leads to an increase in real GDP within the range of 0.8–1.2 per-
centage points in ASEAN-5 countries over five years (Figure 9.13, panel 1), with
growth increasing by 0.16–0.24 percentage point a year, on average. Infrastructure
investment raises growth in the short term, but it also has a lasting impact on
growth through higher productivity. In these baseline simulations, the impact of
additional infrastructure spending on growth is partly dampened by two factors:
(1) the reaction of monetary policy, with an increase in real interest rates of up to
0.3–0.5 basis point at their maximum (Figure 9.13, panel 2); and (2)
budget-neutral financing through lower transfers. Both factors crowd out private
domestic demand, and the resulting impact of fiscal stimulus on inflation is
relatively small.
However, a legacy of the global financial crisis has been subdued inflation
pressure on a global scale, which has affected some ASEAN-5 countries in a sig-
nificant way (see Chapter 7). In countries facing persistently low inflation, central
banks have plenty of room for inflation to rise before breaching their targets.
These central banks could follow a policy of monetary accommodation in the
short term, which would lead to real interest rates noticeably lower than those
that would prevail if monetary policy worked to offset the inflationary impact of
the fiscal stimulus. Such a strategy could be justified to prevent a low-growth,
low-inflation trap and mitigate the risks of hitting the zero lower bound. The
1. Impact of Infrastructure Investmenton Real GDP(Baseline scenario, percent)
2. Impact of Infrastructure Investmenton Real Interest Rate(Baseline scenario, percent)
Source: IMF staff calculations.
Figure 9.13. Impact of Infrastructure Investment on ASEAN-5 Countries
0
0.1
0.2
0.3
0.4
0.6
0.5
0 1 2
Years
3 4 5 0 1 2
Years
3 4 5
Perc
ent
0.0
0.2
0.4
0.6
0.8
1.2
1.4
1.0
Perc
ent
Indonesia Malaysia Philippines SingaporeThailand
©International Monetary Fund. Not for Redistribution

Chapter 9 Macroeconomic Policy Synergies for Sustained Growth 237
combination of fiscal and monetary stimulus would allow inflation to converge
to target from above (that is, some temporary overshooting),11 and the impact on
real activity would be larger. Moreover, the longer the period of monetary accom-
modation, the greater the gain from fiscal stimulus because the private sector
would expect inflation to be more responsive, further reducing the real interest rate.
A second set of results illustrates the payoff from exploiting synergies between
fiscal and monetary policy in a low-inflation, low-interest-rate environment.
Figure 9.14 shows simulations calibrated for Singapore and Thailand. Consider
first the baseline scenario with the infrastructure push financed through lower
general transfers and monetary policy working to offset the inflationary impact
(Figure 9.14, blue line). If the central bank instead chose to accommodate the
stimulus over the five years, there would be a significant increase in the fiscal
multiplier. Over a five-year horizon, the impact on real GDP more than doubles
to 2.4–2.6 percentage points with monetary accommodation, while prices
increase by about 1.5 percentage points in cumulative terms (Figure 9.14,
red line).
Yet fiscal policy can still do more. Low interest rates also imply cheap financing
costs for the government. If the government were to use debt financing rather
than a budget-neutral strategy, the size of the multiplier would increase further.
Monetary accommodation with debt financing (Figure 9.14, light blue line) leads
to an additional 0.5 percentage point increase in real GDP and a 0.4 percentage
point increase in prices over a five-year period. Real GDP and growth increase for
two reasons: first, there is no cut in transfers to households, and second, the real
interest rate is lower. Both factors provide greater support to private domestic
demand, amplifying the initial impact of fiscal stimulus on growth and inflation.
Through their positive impact on nominal GDP, over the short and medium
term joint public investment and monetary accommodation policies can also help
preserve fiscal space. Financing the scaled-up investment with debt and without
monetary accommodation (Figure 9.14, green line) leads to a significant increase
in the debt-to-GDP ratio (about 5 percentage points in Singapore and 4 percent-
age points in Thailand) as the fiscal primary deficit increases. In contrast, in
Thailand, allowing for monetary accommodation significantly reduces the debt
buildup to less than 1 percent of GDP because the growth-adjusted real interest
rate that applies to its old debt stock drops significantly. In Singapore, the impact
of lower real interest rates on debt accumulation is negligible given that its initial
stock of net debt is close to zero. A case can be made for debt financing in coun-
tries with low inflation and low interest rates, as long as the medium-term debt
profile remains sustainable and the sovereign risk premium is contained.
For countries where monetary accommodation and debt financing are not
appropriate, increasing the efficiency of public investment would be a way to raise
11Similar results can be obtained under a scenario in which monetary policy, rather than a stan-
dard linear Taylor rule, follows a policy reaction function that minimizes a quadratic loss function
of inflation and output gaps.
©International Monetary Fund. Not for Redistribution

238 THE ASEAN WAY: SUSTAINING GROWTH AND STABILITY
Budget neutral without monetary accommodation Budget neutral with monetary accommodation
1. Singapore: Impact of InfrastructureInvestment on Real GDP(Alternative scenarios, percent)
2. Thailand: Impact of InfrastrucutreInvestment on Real GDP(Alternative scenarios, percent)
Source: IMF staff calculations.
Figure 9.14. Impact of Infrastructure Investment under Alternative Scenarios
0
1
2
3
4
0 1 2Years
3 4 5 0 1 2Years
3 4 50.0
0.5
1.0
1.5
2.0
2.5
3.0
Perc
ent
3. Singapore: Impact of Infrastructure
(Alternative scenarios, percent)
4. Thailand: Impact of Infrastructure
(Alternative scenarios, percent)
0 1 2Years
3 4 5 0 1 2Years
3 4–1.0
0.0
1.0
2.0
3.0
50.0
0.5
1.0
1.5
2.0
Perc
ent
5. Singapore: Impact of InfrastructureInvestment on Public Debt(Alternative scenarios, percent)
6. Thailand: Impact of InfrastructureInvestment on Public Debt(Alternative scenarios, percent)
0 1 2Years
3 4 5 0 1 2Years
3 4–5
0
5
5–2
0
2
4
6
Perc
ent
Perc
ent
Perc
ent
Perc
ent
©International Monetary Fund. Not for Redistribution

Chapter 9 Macroeconomic Policy Synergies for Sustained Growth 239
the multiplier. Figure 9.15 shows the impact of high-efficiency investment in
Indonesia, a country with more limited fiscal space and inflation currently within
the target range. A budget-neutral scale-up in investment, with no monetary
accommodation, would allow for nearly 0.8 percentage point in additional real
GDP over five years at the current average investment efficiency level. In contrast,
new investment with efficiency levels comparable to those of Singapore (a coun-
try at the investment efficiency frontier within the region) would raise the impact
on real GDP by another 0.2 percentage point.
CONCLUSION
Exploiting synergies between monetary, macroprudential, and fiscal policies can
be beneficial for guarding the economy against fluctuations along the real and
financial cycles. Recessions have been seen to have permanent impacts on GDP,
including in the ASEAN-5, and both household and corporate debt accumula-
tion could have a significantly negative impact on growth a few years down the
road. At the same time, the business and financial cycles have different amplitudes
and durations in ASEAN-5 countries (just as in many other countries); therefore,
a single policy instrument is insufficient for smoothing out both cycles.
Source: IMF staff calculations.
Figure 9.15. Indonesia: Impact of High-
Real GDP
0.0
Years
0 1 2 3 4 5
0.2
0.4
0.6
Perc
ent
0.8
1.0
1.2
©International Monetary Fund. Not for Redistribution

240 THE ASEAN WAY: SUSTAINING GROWTH AND STABILITY
In this context, macroprudential policies can play an important role in com-
plementing countercyclical monetary policy. Model simulations show that a
strategy based on countercyclical loan-to-value ratios and a Taylor rule focused on
price and output stability yields better results than a lean-against-the-wind mon-
etary policy rule when there is a shock to the demand for housing. This result is
robust to a relative flattening in the Philips curve. Countercyclical capital buffers
could also help mitigate the procyclicality of the financial system and reduce
systemic risks with minimal real costs in response to a wide array of shocks.
Fiscal policy can complement monetary policy in smoothing out the cycle
while supporting medium- and long-term growth. Infrastructure investment can
lead to significant increases in real GDP. When coupled with monetary accom-
modation, the investment multiplier doubles. When financed through debt and
coupled with monetary accommodation, the investment multiplier can even tri-
ple. These policy options are particularly attractive for countries with persistently
low inflation. The additional growth also allows these countries to protect their
fiscal space even in scenarios in which the investment scale-up is financed with
debt. For countries with more limited fiscal space and high inflation, a focus on
high-efficiency investment is likely to be the best option for achieving a higher
multiplier effect.
ANNEX 9.1: THE LONG-TERM IMPACT OF RECESSIONS
This annex examines whether recessions (no matter how long or deep) affect
long-term trend real GDP. Following DeLong and Summers (1988) and Beaudry
and Koop (1989), the current depth of a recession (denoted CDRt) is defined as
the gap between the current level of output and the economy’s historical maxi-
mum level, that is:
CDR t = max { Y
t − j }
j ≥ 0 − Y
t . (A9.1.1)
The values taken by the CDR variable over the period 1996 through 2017 are
measured using real quarterly GDP data for Indonesia, Malaysia, the Philippines,
and Thailand. As an example, Annex Figure 9.1.1 shows the CDRt indicator for
Thailand. The impacts of the Asian financial crisis and the global financial crisis
episodes stand out in the figure and are likely to be important drivers of the
results for all ASEAN-5 countries.
Using Pesaran’s panel mean group estimator, the response of real GDP can be
drawn as follows:
Φ (L) Δ Y t = Drift + {Ω (L) − 1} CDR
t + Θ ( L ) ε
t . (A9.1.2)
Results:Figure 9.1 presents the impulse response function of the “typical” ASEAN
country following an economic recession. The model shows that, after about 15
months, growth bounces back, with positive growth for about 9 months
©International Monetary Fund. Not for Redistribution

Chapter 9 Macroeconomic Policy Synergies for Sustained Growth 241
following an economic downturn. However, the response of real GDP growth
implies that the growth bounce-back is not directly proportional to the output
loss, as would be predicted by the natural rate theory (which essentially states that
output fluctuates around a fixed trend and, therefore, booms help predict busts).
This can be illustrated by looking at the response in Figure 9.2, which illus-
trates the level effect of the typical recession on real GDP. The estimates imply
that recessions have tended, at least over the sample period in question, to have
had hysteresis effects on the level of real GDP.
These findings reinforce the need for countercyclical fiscal and monetary pol-
icies to prevent economic downturns from having long-term adverse effects on
economic growth.
ANNEX 9.2. IMPACT OF MACROPRUDENTIAL POLICY ON THE FINANCIAL AND REAL CYCLES
To consider the impact of macroprudential policies on the financial and real
cycles, a Bayesian panel vector autoregression model is estimated for ASEAN-5
countries. The specification uses accounts for cross-sectional heterogeneity and
can be expressed in basic terms as follows:
y ct = ∑
l − 1 L Β
cl y
c ( t − l ) + Δ
c w
t + Γ
c z
ct + u
ct , (A9.2.1)
in which c = 1, . . . ,5 denotes the country; l = 1,...,L denotes the number of lags;
yct is a vector of n endogenous variables; w
t is a vector of W exogenous variables
that are common across the ASEAN-5 countries; and zct
includes country-specific
constant terms. Individual country results can be drawn from the panel by
extracting the individual country coefficients assumed to be drawn from a normal
Mar-1996 Mar-2000 Mar-04 Mar-08 Mar-12 Mar-16
Source: IMF staff calculations.
0
1
3
4
7
2
5
6
8
Annex Figure 9.1.1. Thailand: Depth of Recession(Percent)
©International Monetary Fund. Not for Redistribution

242 THE ASEAN WAY: SUSTAINING GROWTH AND STABILITY
distribution with a common mean and a variance c, which may be
country-specific:
p ( β c | β ¯ , Λ
c ) = N ( β ¯ , Λ
c ) . (A9.2.2)
The final assumption pertains to c, the variance of
c around the common
mean. The model sets these parameters with respect to the uncertainty about
these variances and how heterogeneous these countries are. In the vector autore-
gression for country c, the coefficient of the variable k (in which k = 1, . . . ,K run
over lags of endogenous variables and common exogenous controls) in equation
n has a variance equal to
var ( β c (k, n) ) = λ
σ ˆ cn 2 ___
σ ˆ ck 2 . (A9.2.3)
Since some of the country coefficients (c) are large and some small, each
country coefficient’s variance is scaled by a factor that adjusts for the size of the
country coefficient .
The model contains an index of macroprudential policy, real GDP growth (as
a measure of the real cycle), credit growth (as a measure of the financial cycle),
and the stock price to capture asset price dynamics. The data run from 2000 to
2012 at a monthly frequency. The ASEAN panel results show the following, as
illustrated in Figure 9.4:
• The response functions show that a tightening of macroprudential policy
leads to a statistically significant decline in credit growth (red lines). The
impact on the real cycle of a tightening in macroprudential policy is much
smaller and less persistent, with the response becoming progressively more
statistically insignificant at conventional levels over the medium to long term.
• A joint cumulative equality test on the null hypothesis that the responses of
real and financial cycles to a tightening in macroprudential policies are the
same can be rejected at the 10 percent significance level, based on a p-value
of 0.06 from a chi-squared distribution.
• One could construe these findings as being consistent with the idea that real
and financial cycles operate at different frequencies and, therefore, their
responses to different policy instruments (such as macroprudential policy)
are likely to differ. These estimates for the ASEAN-5 imply that the eco-
nomic adjustment to a tightening in macroprudential policy falls principal-
ly on the financial—as opposed to the real—cycle.
ANNEX 9.3. MEDIUM-TERM IMPACT OF PRIVATE DEBT ON GROWTH
This annex examines the impact of a buildup in private sector debt on current
and future GDP growth with a focus on Singapore and Thailand (the only two
ASEAN-5 countries with sufficiently long household and corporate debt series).
©International Monetary Fund. Not for Redistribution

Chapter 9 Macroeconomic Policy Synergies for Sustained Growth 243
The methodology follows Mian, Sufi, and Verner (2017) and uses the Bank for
International Settlements database on nonfinancial credit, which allows for an
irregular panel of 47 countries spanning 1990 to 2016 for the longest series.
The regression analysis intends to explain the cumulative growth in country i’s real GDP over three years ( Δ
3 y
i,t + k )12 as a function of the buildup over three years
in private sector debt13 ( Δ 3 d
i,t − 1 s ). The regression is run for k = 0, . . . ,5.
Using fixed effects, a panel regression is run for the entire pool of countries,
allowing for one set of coefficients for ASEAN-5 and another set of coefficients
for the rest of the countries in the pool.
The first set of regressions (Table 9.1) looks at the impact of private sector debt
(household plus corporate debt) on growth. Accumulations of private sector debt
in ASEAN-5 countries between years t − 4 and t − 1 have an initially positive but
statistically insignificant impact on growth accumulated over the three years to t, but this impact turns negative and significant in years t + 1 and t + 2.
The second set of regressions (Table 9.2) looks at the impact of household and
corporate debt on growth. Accumulation of household debt in Singapore and
Thailand (the only ASEAN-5 countries with sufficiently long series for household
and corporate debt) has a positive and significant impact on growth two and three
years ahead, whereas the impact turns negative and significant four and five years
ahead. This result is similar to the one obtained for the other countries in the
pool, although the positive effect in the first two years is significantly higher in
Singapore and Thailand, and the negative impact starts one year earlier. The
accumulation of household debt produces a boom-bust pattern in growth in
Singapore and Thailand.
In contrast, the accumulation of corporate debt in Singapore and Thailand has
a negative and significant impact starting just one year ahead and through the
medium term. The impact of corporate debt on growth in Singapore and
Thailand is significantly stronger (in statistical and economic terms) than in the
rest of the countries in the pool.
ANNEX 9.4. DSGE MODEL TO SIMULATE SYNERGIES BETWEEN MONETARY AND MACROPRUDENTIAL POLICIES
The Model Economy
The open economy dynamic stochastic general equilibrium (DSGE) model of
Anand, Delloro, and Peiris (2014) is extended to incorporate household
12Cumulative growth in GDP as of t + k is calculated as the percent change in growth between
year t + k − 3 and t + k.13Changes in private sector debt are calculated as the change in the ratio of debt to GDP over
years t − 4 to t − 1.
©International Monetary Fund. Not for Redistribution

244 THE ASEAN WAY: SUSTAINING GROWTH AND STABILITY
borrowing, housing, and macroprudential policies. The sectoral breakdown and
model structure is as follow:
(1) Households
The economy is populated by two groups of households (patient P and impatient
I ) as well as entrepreneurs (E ). Each group of households is assumed to be com-
posed of a unit mass of identical and infinitely lived households indexed by j . The
key difference between the two groups is the degree of impatience: the discount
factor of patient household ( β P ) is higher than that of impatient households ( β
I ).
The heterogeneity in discount factors determines the direction of financial flows
in equilibrium: patient households purchase a positive amount of deposits and do
not borrow, while impatient households (as well as entrepreneurs) borrow a pos-
itive amount of loans.
(1.1) Patient Households
The representative patient household j maximizes expected lifetime utility
𝔼 0 ∑
t = 0
∞
β P t [
(1 − b) ( C t P (j) − b C
t − 1 P ) 1 − σ ________________
1 − σ + ϕ
h e
t h ( h
t P (j) ) 1 − σ
h __________
1 − σ h −
ϕ n L
t P ( j ) 1 + ϕ _______
1 + ϕ ]
in which C t − 1
P is lagged aggregate consumption and b ∈ (0,1) is a parameter that
determines the degree of habit persistence. e t h represents a shock to the housing
demand. The maximization is subject to the following budget constraint:
C t P (j) + q
t h ( h
t P (j) − h
t − 1 P (j) ) + D
t (j) + ϵ
t B
t + 1 f (j) = w
t P L
t P (j) + ϵ
t (
1 + i t − 1
d _____ π
t ) D
t − 1 (j)
+ ϵ t (
1 + i t − 1
f _____
π t * ) B
t f (j) + ∫
0 1 π
t r (s) ds + ∫
0 1 (1 − w b ) π
t − 1 B (i) di ,
wherein resources are spent on consumption C t P (j ) , housing investment ( h
t P (j ) −
h t − 1
P (j ) ) at price q t h , making new deposits D
t (j ) , and purchases of foreign-currency-
denominated bonds B t + 1
f (j ) that can be priced in domestic currency using the real
exchange rate ϵ t . Domestic and international inflation factors (1 plus the inflation
rate) are denoted by π t and π
t * , respectively. Sources of income include real wage
earnings w t P , interest earnings on previous period holdings of foreign bonds (at a
rate i t f ) and deposits (at a rate i
t d ), and profits from retail firms and banks, denoted
by π t r (s) and π
t B (i ) , respectively. Dividends from banks are set to be a fraction
(1 − w b ) of bank profits. Patient households are assumed to own retail firms,
indexed by s , and banks, indexed by i . The first-order conditions of the optimi-
zation problem are given by
λ t P = (1 − b) ( C
t P (j ) − b C
t − 1 P ) −σ (A9.4.1)
ϕ h e
t h ( h
t P (j ) ) − σ
h − λ
t P q
t h + β
P 𝔼
t [ λ
t + 1 P q
t + 1 h ] = 0 (A9.4.2)
λ t P w
t P = ϕ
n ( 1 − b ) L
t P (j ) ϕ (A9.4.3)
©International Monetary Fund. Not for Redistribution

Chapter 9 Macroeconomic Policy Synergies for Sustained Growth 245
λ t P = β
P 𝔼
t [ λ
t + 1 P (
1 + i t d ___ π
t + 1 ) ] (A9.4.4)
λ t P = β
P 𝔼
t [ λ
t + 1 P (
1 + i t f ____
π t + 1
* ) (
ϵ t + 1
___ ϵ
t ) ] , (A9.4.5)
in which λ t P is the Lagrange multiplier on the budget constraint.
Combining equations (4) and (5) gives the uncovered interest parity condition.
𝔼 t (
ϵ t + 1
___ ϵ
t ) = 𝔼
t [
1 + i t d ___
1 + i t f π
t + 1 * ___ π
t + 1 ] .
(1.2) Impatient Households
The representative impatient household j maximizes expected lifetime utility
𝔼 0 ∑
t = 0
∞
β I t [
(1 − b) ( C t I (j) − b C
t − 1 I ) 1 − σ ________________
1 − σ + ϕ
h e
t h ( h
t I (j) ) 1 − σ
h __________
1 − σ h −
ϕ n L
t I ( j ) 1 + ϕ _______
1 + ϕ ]
subject to its budget constraint
C t I (j ) + q
t h ( h
t I (j ) − h
t − 1 I (j ) ) − (
1 + i t − 1
lH _____ π
t − 1 ) B
t − 1 H (j ) = w
t I L
t I (j ) + B
t H (j ) ,
wherein resources are spent on consumption C t I , housing investment ( h
t P − h
t − 1 P ) ,
and gross reimbursement of borrowing B t − 1
H with a net interest rate of
i t − 1
lH . Impatient households are assumed to borrow exclusively from domestic
banks (foreign borrowing is prohibitively costly). In addition, impatient house-
holds face a borrowing constraint: a fraction m of the expected value of their
housing stock must guarantee repayment of debt and interest.
(1 + i t lH ) B
t H (j ) = m
t 𝔼
t [ π
t + 1 q
t + 1 h h
t I (j ) ] .
The first-order conditions of the optimization problem are given by
λ t I = (1 − b) ( C
t I (j ) − b C
t − 1 I ) −σ (A9.4.6)
ϕ h e
t h ( h
t I (j ) ) − σ
h − λ
t I q
t h + β
I 𝔼
t [ λ
t + 1 I q
t + 1 h ] − s
t m
t 𝔼
t [ π
t + 1 q
t + 1 h ] =0 (A9.4.7)
λ t I w
t I = ϕ
n ( 1 − b ) L
t I ϕ (A9.4.8)
λ t I = β
I 𝔼
t [ λ
t + 1 I (
1 + i t lH ____ π
t + 1 ) ] + s
t (1 + i
t lH ) , (A9.4.9)
in which λ t P and s
t are Lagrange multipliers on the budget constraint and the
borrowing constraint, respectively.
(1.3) Aggregation
The aggregated consumption bundle C t ≡ C
t P + C
t I consists of domestically pro-
duced goods C H,t
and imported foreign goods C F,t
, and is given by a CES
aggregator function
C t = [ γ
1 __ ϑ __ ( C H,t
) ϑ − 1 ____ ϑ + (1 − γ)
1 __ ϑ ( C F,t
) ϑ − 1 ____ ϑ ]
ϑ ____ ϑ − 1
,
©International Monetary Fund. Not for Redistribution

246 THE ASEAN WAY: SUSTAINING GROWTH AND STABILITY
in which ϑ is the elasticity of substitution between domestic and foreign goods
and γ refers to the home bias. Each group of households minimizes consumption
expenditure P t C
t = P
H,t C
H,t + P
F,t C
F,t . The demand function for domestic and
imported consumption goods, as well as the consumer price index are given by
the following expressions:
C H,t
= γ ( P
H,t ___
P t )
−ϑ
C t (A9.4.10)
C F,t
= (1 − γ) ( P
F,t ___
P t )
−ϑ
C t (A9.4.11)
P t = γ ( P
H,t ) 1 − ϑ + (1 − γ) ( P
F,t ) 1 − ϑ . (A9.4.12)
(1.4) Deposit and Loan Demand
Patient households determine how much to deposit in retail banks by maximizing
the interest payments from deposits
∫ 0 1 i
t d ( i ) D
t ( i ) di
subject to the deposit and deposit rate aggregator functions, respectively given by
D t = [ ∫
0 1 D
t ( i )
1 + ε d _____ ε d
di] ε d _____ 1 + ε d
i t d = [ ∫
0 1 i
t d ( i ) 1 + ε d di]
1 _____ 1 + ε d
.
The first-order condition gives the i th retail bank’s deposit demand function:
D t (i) = [
i t d ( i )
___ i t d ]
ε d
D t . (A9.4.13)
Similarly, impatient households decide how many loans to take out by mini-
mizing interest payments from loans:
∫ 0 1 i
t lH ( i ) B
t H ( i ) di
subject to analogous loan and lending rate aggregator functions. Similarly to the
deposit demand of patient households, loan demand by impatient households
will take a functional form of
B t H (i) = [
i t lH ( i )
____ i t lH ]
− ε lH
B t H . (A9.4.14)
(2) Entrepreneurs
Entrepreneurs purchase capital K t + 1
for the next time period at price q t . They
finance capital acquisition partly through their net worth n t and partly through
borrowing. Total borrowing B t E of the entrepreneur satisfies the following balance
sheet identity:
©International Monetary Fund. Not for Redistribution

Chapter 9 Macroeconomic Policy Synergies for Sustained Growth 247
B t E = q
t K
t − n
t . (A9.4.15)
A proportion of total borrowing L t d = ω ¯ B
t E comes from domestic banks at a
nominal rate of i t lE , and the remaining proportion L
t f = (1 − ω ¯ ) B
t E comes from
foreign borrowing. We assume that the rate charged for foreign borrowing is the
same for foreign-currency-denominated bonds held by patient households. The
real costs of domestic and foreign loans are respectively given by
ω ¯ 𝔼 t [
1 + i t lE ____ π
t + 1 ]
(1 − ω ¯ ) 𝔼 t [
1 + i t f ____
π t *
ϵ t + 1
___ ϵ
t ] .
Entrepreneurs decide how many domestic loans to take out by minimizing
interest payments from those loans:
∫ 0 1 i
t lE ( i ) L
t d ( i ) di
subject to analogous loan and lending rate aggregator functions. Similarly to
impatient households, loan demand by entrepreneurs will take a functional form of
L t d (i) = [
i t lE ( i )
____ i t lE ]
− ε lE
L t d . (A9.4.16)
We assume that there exists an agency problem between foreign banks and
entrepreneurs, which makes foreign external finance more expensive than internal
funds. The entrepreneur’s marginal external financing cost 𝔼 t f
t + 1 is given by
𝔼 t f
t + 1 = (1 + Γ
t ) [ϖ 𝔼
t [
1 + i t l ____ π
t + 1 ] + Θ (
n t + 1
_____
q t K
t + 1 ) (1 − ϖ) 𝔼
t [
1 + i t f ____
π t + 1
*
ϵ t + 1
___ ϵ
t ] ] , (A9.4.17)
in which Γ t is a shock to the cost of borrowing. We specify the external
finance premium as
Θ ( n
t + 1 _____
q t K
t + 1 ) = (
n t + 1
_____
q t K
t + 1 )
−η . (A9.4.18)
At the end of the period, entrepreneurs lease their undepreciated capital to
capital goods producers. The expected marginal real return on capital yields the
expected gross return
𝔼 t R
t + 1 k = 𝔼
t [
r t + 1
k + (1 − δ) q t + 1
___________ q
t ] . (A9.4.19)
The optimal loan contract condition between banks and entrepre-
neurs is given by
𝔼 t f
t + 1 = (1 + Γ
t ) Θ (
n t + 1
_____
q t K
t + 1 ) [ϖ 𝔼
t (
1 + i t l ____ π
t + 1 ) + (1 − ϖ) 𝔼
t (
1 + i t f ____
π t *
ϵ t + 1
___ ϵ
t ) ] , (A9.4.20)
which states that the marginal return of capital should equal its marginal cost.
The net worth of an individual entrepreneur V t is given by
©International Monetary Fund. Not for Redistribution

248 THE ASEAN WAY: SUSTAINING GROWTH AND STABILITY
V t = R
t k q
t − 1 K
t − f
t B
t E . (A9.4.21)
We assume that a proportion v of entrepreneurs survive until the next period.
A fraction 1 − v of entrepreneurs exits the economy and is similarly replaced by
new entrepreneurs. We further assume that the new entrepreneurs receive an
exogenous transfer H from the exiting entrepreneurs. The transfer of resources is
necessary to ensure that all entrepreneurs have sufficient funds to borrow and
settle their loans. Aggregate entrepreneurial net worth evolves according to
n t = ν V
t + (1 − ν) H − ε
t n , (A9.4.22)
in which ε t n is a zero mean independent and identically distributed
shock to net worth.
Entrepreneurs exiting the economy consume and transfer some funds to new
entrepreneurs. Thus, the consumption of entrepreneurs, denoted by C t e , is given by
C t e = (1 − ν) ( V
t − H ) . (A9.4.23)
(3) Capital Producers
Capital producers combine the existing capital stock leased from entrepreneurs
to transform gross investment I t into new capital. We assume that the production
of new capital entails quadratic adjustment costs. Capital accumulation in the
economy is given by a linear technology:
K t + 1
= (1 − δ) K t + ς
I,t + 1 I
t + 1 −
ζ __
2 (
I t + 1
___
K t − δ)
2
K t , (A9.4.24)
in which ς I,t
is a shock to the marginal efficiency of investment. Gross investment
consists of domestic and foreign final goods, denoted respectively as I H,t
and I F,t
.
We further assume that it has the same aggregation function as the con-
sumption bundle.
I t = [ γ
1 __ ϑ ( I H,t
) ϑ − 1 ____ ϑ + (1 − γ) ( I
F,t )
ϑ − 1 ____ ϑ ] ϑ ____ ϑ − 1
.
Minimizing the capital producers’ investment expenditure P t I
t = P
H,t I
H,t + P
F,t
I F,t
gives the demand function for domestic and imported investment
goods, respectively,
I H,t
= γ ( P
H,t ___
P t )
−ϑ
I t (A9.4.25)
I F,t
= (1 − γ) ( P
F,t ___
P t )
−ϑ
I t . (A9.4.26)
Capital-producing firms seek to maximize expected profits:
𝔼 t [ q
t [ ς
I,t I
t −
ζ __
2 (
I t __
K t − δ)
2
K t ] − I
t ] .
The first-order condition gives the capital supply equation:
q t [ ς
I,t − ζ (
I t ____
K t − 1
− δ) ] = 1 . (A9.4.27)
©International Monetary Fund. Not for Redistribution

Chapter 9 Macroeconomic Policy Synergies for Sustained Growth 249
(4) Wholesale Sector
The wholesale sector in the economy is assumed to be a perfectly competitive
market. It is composed of the economy’s entrepreneurs, who combine labor pro-
vided by each group of households and capital purchased from capital-producing
firms, in order to produce wholesale goods Y t through a constant return to scale
(CRS) Cobb-Douglas production function.
Y t = θ
t K
t − 1 ψ [ ( L
t P ) μ ( L
t I ) 1 − μ ] 1 − ψ , (A9.4.28)
in which θ t is a shock to total factor productivity. Entrepreneurs determine how
much labor and capital to employ by maximizing profits subject to the pro-
duction function
w t P = μ (1 − ψ) m c
t Y
t __
L t P (A9.4.29)
w t I = (1 − μ) (1 − ψ) m c
t Y
t __
L t I (A9.4.30)
r t k = ψm c
t
Y t ____
K t − 1
, (A9.4.31)
in which m c t is the real marginal cost of production.
(5) Retail Sector
The retail sector of the economy is assumed to be monopolistically competitive
and is composed of a continuum of retailers with a unit mass. Retailers purchase
wholesale goods, and differentiate them at no cost, to produce domestic goods Q t d
and export goods Q t x . Final domestic goods from the retail sector is a composite
of individual retail goods
Q t d = [ ∫
0 1 Q
t d ( s )
v − 1 ____ v ds] v ____ v − 1
with a corresponding demand function facing each retailer
Q t d (s) = [
P H,t
( s ) _____
P H,t
]
−v
Q t d .
For simplicity, we assume that the aggregate export demand function is given by
Q t x = (
P X,t
___
P t * )
− ϑ x
Y t * , (A9.4.32)
in which variables with asterisks indicate their exogenous counterpart. We also
assume that the law of one price holds in the export market, so that P x,t
= e t P
H,t .
To incorporate nominal rigidity in the model, we assume that in each period,
only a fraction 1 − α of firms can change their prices. All other firms can only
index their prices to the previous price set. Retailers seek to maximize
expected profits
𝔼 t ∑
t = 0
∞
(αβ) s λ t + s
[ ( P
H,t + s _____
P t + s
)
1 − v
Y t + s
− m c t + s
( P
H,t + s _____
P t + s
)
−v
Y t + s
] , (A9.4.33)
©International Monetary Fund. Not for Redistribution
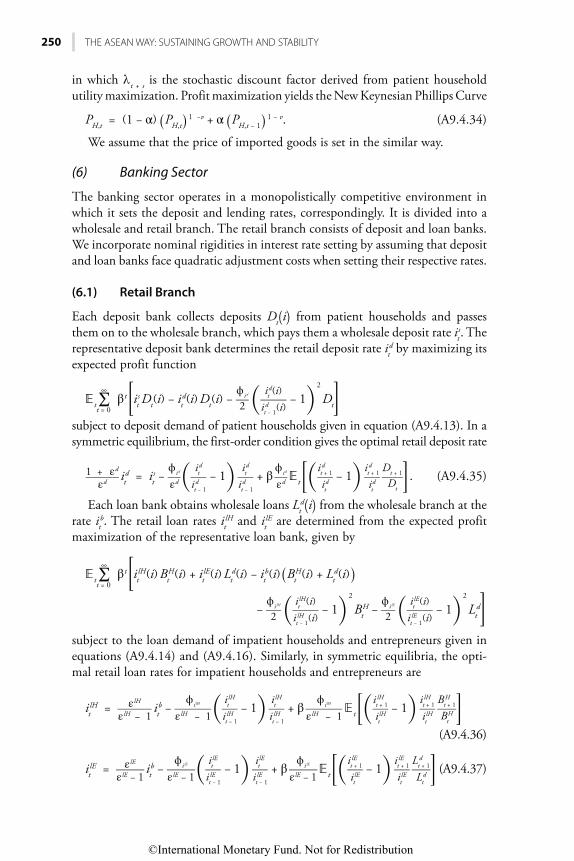
250 THE ASEAN WAY: SUSTAINING GROWTH AND STABILITY
in which λ t + s
is the stochastic discount factor derived from patient household
utility maximization. Profit maximization yields the New Keynesian Phillips Curve
P H,t
= (1 − α) ( P H,t
) 1 −v + α ( P H,t − 1
) 1 − v . (A9.4.34)
We assume that the price of imported goods is set in the similar way.
(6) Banking Sector
The banking sector operates in a monopolistically competitive environment in
which it sets the deposit and lending rates, correspondingly. It is divided into a
wholesale and retail branch. The retail branch consists of deposit and loan banks.
We incorporate nominal rigidities in interest rate setting by assuming that deposit
and loan banks face quadratic adjustment costs when setting their respective rates.
(6.1) Retail Branch
Each deposit bank collects deposits D t ( i ) from patient households and passes
them on to the wholesale branch, which pays them a wholesale deposit rate i t s . The
representative deposit bank determines the retail deposit rate i t d by maximizing its
expected profit function
𝔼 t ∑
t = 0
∞
β t [ i t s D
t (i) − i
t d (i) D
t (i) −
ϕ i d __
2 (
i t d (i) _____
i t − 1
d (i) − 1)
2
D t ]
subject to deposit demand of patient households given in equation (A9.4.13). In a
symmetric equilibrium, the first-order condition gives the optimal retail deposit rate
1 + ε d _____ ε d
i t d = i
t s −
ϕ i d __
ε d (
i t d ___
i t − 1
d − 1)
i t d ___
i t − 1
d + β
ϕ i d __
ε d 𝔼
t [ (
i t + 1
d ___
i t d − 1)
i t + 1
d ___
i t d
D t + 1
____
D t ] . (A9.4.35)
Each loan bank obtains wholesale loans L t d ( i ) from the wholesale branch at the
rate i t b . The retail loan rates i
t lH and i
t lE are determined from the expected profit
maximization of the representative loan bank, given by
𝔼 t ∑
t = 0
∞
β t [ i t lH (i) B
t H (i) + i
t lE (i) L
t d (i) − i
t b (i) ( B
t H (i) + L
t d (i) )
− ϕ
i lH ___
2 (
i t lH (i)
_____ i t − 1
lH (i) − 1)
2
B t H −
ϕ i lE __
2 (
i t lE (i) _____
i t − 1
lE (i) − 1)
2
L t d ]
subject to the loan demand of impatient households and entrepreneurs given in
equations (A9.4.14) and (A9.4.16). Similarly, in symmetric equilibria, the opti-
mal retail loan rates for impatient households and entrepreneurs are
i t lH = ε lH _____
ε lH − 1 i
t b −
ϕ i lH
_____
ε lH − 1 (
i t lH ___
i t − 1
lH − 1)
i t lH ___
i t − 1
lH + β
ϕ i lH
_____
ε lH − 1 𝔼
t [ (
i t + 1
lH ___
i t lH − 1)
i t + 1
lH ___
i t lH B
t + 1 H ____
B t H ]
(A9.4.36)
i t lE = ε lE ____
ε lE − 1 i
t b −
ϕ i lE ____
ε lE − 1 (
i t lE ___
i t − 1
lE − 1)
i t lE ___
i t − 1
lE + β
ϕ i lE ____
ε lE − 1 𝔼
t [ (
i t + 1
lE ___
i t lE − 1)
i t + 1
lE ___
i t lE L
t + 1 d ____
L t d ] (A9.4.37)
©International Monetary Fund. Not for Redistribution

Chapter 9 Macroeconomic Policy Synergies for Sustained Growth 251
(6.2) Wholesale Branch
The wholesale branch takes the deposits from the deposit bank. We assume that
the wholesale branch meets the cash reserve ratio (CRR) and the statutory liquid-
ity ratio (SLR) imposed by the central bank. The latter can be thought of as an
exogenously determined share of deposits in government securities. The central
bank varies these requirements to control credit supply by changing the availabil-
ity of resources with which the banks can make loans. Let α t s and α
t d denote the
CRR and SLR, respectively. The wholesale branch keeps α t s D
t ( i ) in the form of
cash, and α t d D
t ( i ) in the form of government securities, which earns an
interest of i t t .
The wholesale branch combines bank capital Z t ( i ) with the remaining deposit
(1 − α t s − α
t d ) D
t ( i ) to make wholesale loans B
t H ( i ) and L
t d ( i ) . Since the wholesale
branch can finance its loans using either deposits or bank capital, it must obey the
balance sheet identity, given by
(1 − α t s − α
t d ) D
t + Z
t = B
t H + L
t d . (A9.4.38)
We assume that there exists an exogenously given capital-to-assets (leverage)
ratio κ t for banks. The bank pays a quadratic cost whenever the capital-to-asset
ratio moves away from κ t . This modeling choice gives bank capital a key role in
providing the conditions of credit supply.
Bank capital is accumulated each period out of retained earnings according to
Z t = (1 − δ b ) Z
t − 1 + ω b Π
t − 1 B − ε
t B , (A9.4.39)
in which 1 − ω b summarizes the dividend policy of the bank, δ b measures the
resources used in managing bank capital and conducting overall banking activity,
and ε t B is a mean zero shock to the bank capital. The dividend policy is assumed
to be exogenously fixed, so that bank capital is not a choice variable for the bank.
The problem for the wholesale branch is to choose loans and deposits so as to
maximize profits subject to the balance sheet identity:
𝔼 t ∑
t = 0
∞
β t [ i t b ( B
t H (i) + L
t d (i) ) − i
t t (i) α
t d D
t (i) − i
t s D
t (i) − Z
t (i)
− ϕ
z __
2 (
Z t ( i ) _________
B t H (i) + L
t d ( i )
− κ t )
2
Z t ( i ) ] .
The solution yields an optimality condition that links the spread between
wholesale loan and deposit rates to the degree of the bank’s leverage position.
i t b =
i t s ______
1 − α t s − α
t d − ϕ
z (
Z t (i) ________
B t H (i) + L
t d (i)
− κ t ) (
Z t (i) ________
B t H (i) + L
t d (i)
) 2
− α
t d ______
1 − α t s − α
t d i
t t . (A9.4.40)
We assume that banks can invest excess liquidity in the special deposit account
(SDA) facility of the central bank, from which they are remunerated at rate i t SDA .
Assuming that there exists no arbitrage between the SDA facility and the deposit
market, we have i t s = i
t SDA . In addition, invoking the policy rate–SDA rate iden-
tity implies that i t SDA = i
t . After imposing a symmetric equilibrium, we have
©International Monetary Fund. Not for Redistribution

252 THE ASEAN WAY: SUSTAINING GROWTH AND STABILITY
i t b =
i t ________
1 − α t s − α
t d − ϕ
z (
Z t ______
B t H + L
t d − κ
t ) (
Z t ______
B t H + L
t d )
2
− α
t d ________
1 − α t s − α
t d i
t t ,
which links the wholesale loan rate to the central bank policy rate and Treasury
bill rate, as well as to the leverage of the banking sector. Overall, profits of banks
are the sum of earnings from the wholesale and retail branches. After deleting
intragroup transactions, bank profit is given by
Π t B = i
t lH B
t H + i
t lE L
t d + i
t t α
t d D
t − i
t d D
t −
ϕ i lH
___
2 (
i t lH ___
i t − 1
lH − 1)
2
B t H −
ϕ i lE __
2 (
i t lE ___
i t − 1
lE − 1)
2
L t d −
ϕ i d __
2 (
i t d ___
i t − 1
d − 1)
2
D t −
ϕ z __
2 (
Z t ______
B t H + L
t d − κ
t )
2
Z t . (A9.4.41)
(7) Public Sector
Government spending and the government security rate are assumed to be deter-
mined exogenously. The central bank sets the policy rate using a Taylor-type rule
i t = γ
i i
t − 1 + (1 − γ
i ) i + γ
π ( π
t − π) + γ
Y ( Y
t − Y) + ε
t i , (A9.4.42)
while it sets the cash reserve ratio and statutory liquidity ratio according to
α t s = (1 − ρ αs
) α s + ρ αs α
t − 1 s + γ
π ( π
t − π) + γ
Y ( Y
t − Y) + ε
t αs (A9.4.43)
α t d = (1 − ρ αd
) α d + ρ αd α
t − 1 d + ε
t αd . (A9.4.44)
The central bank exercises macroprudential regulation on the banking sector
by setting the capital adequacy ratio requirement using the following rule:
κ t = (1 − ρ κ ) κ + (1 − ρ κ ) χ κ ( B
t H + L
t d − B H − L) + ρ κ κ
t − 1 . (A9.4.45)
This macroprudential policy rule is analogous to the Basel III countercyclical
capital buffer—the capital requirement of banks is increased when economic
conditions are good and relaxed during downturns. Similarly, we assume that
the loan-to-value ratio for impatient households is determined by the
following rule:
m t = (1 − ρ
m ) m + (1 − ρ
m ) ( B
t H − B H ) + ρ
m m
t−1 . (A9.4.46)
(8) Market Clearing Conditions
Households, exiting entrepreneurs, capital producers, government, and the rest of
the world buy final goods from retailers. The economy-wide resource con-
straint is given by
Y t = Q
t d + Q
t x , (A9.4.47)
in which Q t d = C
H,t + C
H,t e + I
H,t + G
t . The national income accounting equa-
tion is given by
ZZ t = C
t + C
t e + I
t + (
P H,t
___
P t ) G
t + (
P X,t
___
P t * ) ϵ
t Q
t x − (
P F,t
___
P t ) Q
t m . (A9.4.48)
©International Monetary Fund. Not for Redistribution

Chapter 9 Macroeconomic Policy Synergies for Sustained Growth 253
Note that the aggregated housing stock is fixed: h = h t P + h
t I ; therefore, hous-
ing investment is not included in the aggregate demand. The model allows for
nonzero holdings of foreign-currency-denominated bonds by patient households
and foreign-currency-denominated debt by entrepreneurs. The balance of pay-
ments equation is
( P
X,t ___
P t * ) ϵ
t Q
t x − (
P F,t
___
P t ) Q
t m + i
t f ( B
t f + L
t f ) = ( B
t + 1 f + L
t + 1 f ) − ( B
t f + L
t f ) , (A9.4.49)
in which the left side of the equation is the current account, and the right side is
the capital account. In order to close the small open economy model, we specify
a foreign debt elastic risk premium whereby holders of foreign debt are assumed
to face an interest rate that is increasing the country’s net foreign debt:
1 + i t f = (1 + i
t * ) − χ [ ( B
t f + L
t f ) − ( B f + L f ) ] , (A9.4.50)
in which χ is the degree of capital mobility.
(9) Specification of the Stochastic Processes
The model includes 13 structural shocks: shocks to technology ( θ t ) , investment
efficiency ( ς I,t
) , and housing demand ( e t h ) ; two financial shocks to the entrepre-
neur’s cost of borrowing ( Γ t ) and net worth ( ε
t n ) ; a shock to bank capital ( ε
t B ) ; two
foreign shocks to the world interest rate ( i t * ) and foreign demand ( Y
t * ) ; a govern-
ment spending shock ( G t ) ; a shock to the CRR ( α
t s ) ; a shock to the SLR ( α
t d ) ; a
shock to the Treasury bill rate ( i t t ) ; and a shock to monetary policy ( ε
t i ) . Aside
from the monetary policy shock and net worth shock, which are zero mean inde-
pendent and identically distributed shocks with standard deviations σ i and σ
nw ,
respectively, the other structural shocks follow an AR(1) process of the form
x t = (1 − ρ
x ) x + ρ
x x
t − 1 + ε
t x ,
in which x t = { θ
t , ς
I,t , e
t h , Γ
t , i
t * , Y
t * , G
t , α
t s , α
t d , i
t t } , x ≥ 0 is the steady state of x
t ,
ρ x ∈ (− 1,1) , and ε
t x is normally distributed with a zero mean and a standard
deviation σ xt .
REFERENCES
Ajello, A., T. Laubach, D. Lopez-Salido, and T. Nakata. 2016. “Financial Stability and Optimal Interest-Rate Policy.” FRB Working Paper 2016–067, Federal Reserve Board, Washington, DC.
Anand, R., V. Delloro, and S. J. Peiris. 2014. “A Credit and Banking Model for Emerging Markets and an Application to the Philippines.” Proceedings of the 2014 BSP International Research Conference, Issue 2. Manila: Bangko Sentral ng Pilipinas.
Andrle, M., P. Blagrave, P. Espaillat, K. Honjo, B. Hunt, M. Kortelainen, R. Lalonde, and others. 2015. “The Flexible System of Global Models—FSGM.” IMF Working Paper 15/64, International Monetary Fund, Washington, DC.
Beaudry, P., and G. Koop. 1989. “Do Recessions Permanently Change Output?” Journal of Monetary Economics 31:149–63.
©International Monetary Fund. Not for Redistribution

254 THE ASEAN WAY: SUSTAINING GROWTH AND STABILITY
DeLong, J. B., and L. H. Summers. 1988. “How Does Macroeconomic Policy Affect Output?” Brookings Papers on Economic Activity 2 (Fall): 433–80.
Cerra, V., and S. C. Saxena. 2008. “Growth Dynamics: The Myth of Economic Recovery.” American Economic Review 98 (1): 439–57.
———. 2017. “Booms, Crises, and Recoveries: A New Paradigm of the Business Cycle and Its Policy Implications.” IMF Working Paper 17/250, International Monetary Fund, Washington, DC.
Corbacho, A., D. Muir, M. Nozaki, and E. Zoli. Forthcoming. “The New Mediocre in Asia: What Can Fiscal Policy Do?” International Monetary Fund, Washington, DC.
Curdia, V., and M. Woodford. 2009. “Credit Spreads and Monetary Policy.” Journal of Money, Credit and Banking 42 (S1): 3–35.
Filardo, A., and P. Rungcharoenkitkul. 2016. “The Quantitative Case for Leaning against the Wind.” BIS Working Paper 594, Bank for International Settlements, Basel.
Gambacorta, L., and F. M. Signoretti. 2014. “Should Monetary Policy Lean against the Wind?” Journal of Economic Dynamics and Control 43 (June): 146–74.
Ghilardi, M. F., and S. J. Peiris. 2016. “Capital Flows, Financial Intermediation and Macroprudential Policies.” Open Economies Review 27 (4): 721–46.
Ilzetzki, E., and C. Vegh. 2008. “Procyclical Fiscal Policy in Developing Countries: Truth or Fiction.” NBER Working Paper 14191, National Bureau of Economic Research, Cambridge, MA.
International Monetary Fund (IMF). 2009. Global Financial Stability Report: Navigating the Financial Challenges Ahead. Washington, DC, October.
———. 2012. “The Interaction of Monetary and Macroprudential Policies.” Policy Papers, Washington, DC.
———. 2014a. “Monetary Policy in the New Normal.” IMF Staff Discussion Note, Washington, DC.
———. 2014b. “Staff Guidance Note on Macroprudential Policy.” Washington, DC.———. 2015. “Monetary Policy and Financial Stability.” IMF Policy Paper, Washington, DC.
www .imf .org/ external/ np/ pp/ eng/ 2015/ 082815a .pdf.———. 2017. “Household Debt and Financial Stability.” Chapter 2 in Global Financial
Stability Report. Washington, DC, October.Jordà, Ò., M. Schularick, and A. Taylor. 2013. “When Credit Bites Back.” Journal of Money,
Credit and Banking 45 (s2): 3–28.Menna, L., and M. Tobal. 2017.“Financial and Price Stability: The Role of the Interest Rate.”
Unpublished, Banco de Mexico.Mian, A., A. Sufi, and E. Verner. 2017. “Household Debt and Business Cycles Worldwide.”
Quarterly Journal of Economics 132 (4): 1755–817.Olsen, Ø. 2015. “Integrating Financial Stability and Monetary Policy Analysis.” Speech given
at the Systemic Risk Centre, London School of Economics, London, April 27.Sahay, R., V. B. Arora, A. Arvanatis, H. Faruqee, P. N’Diaye, and T. Mancini-Griffoli. 2014.
“Emerging Market Volatility: Lessons from The Taper Tantrum.” IMF Staff Discussion Note, Washington, DC.
Schularick, M., and A. Taylor. 2012. “Credit Booms Gone Bust: Monetary Policy, Leverage Cycles, and Financial Crises, 1870–2008.” American Economic Review 102 (2): 1029–1061.
Smets, F. 2014. “Financial Stability and Monetary Policy: How Closely Interlinked?” International Journal of Central Banking 10 (2): 263–300.
Stein, J. C. 2014. “Incorporating Financial Stability Considerations into a Monetary Policy Framework.” Speech given at the International Research Forum on Monetary Policy, Washington, DC, March 21.
Svensson, L. E. O. 2014. “Inflation Targeting and ’Leaning against the Wind’.” International Journal of Central Banking 10 (2): 103–14.
©International Monetary Fund. Not for Redistribution

Chapter 9 Macroeconomic Policy Synergies for Sustained Growth 255
———. 2016. “Cost-Benefit Analysis of Leaning against the Wind: Are Costs Larger Also with Less Effective Macroprudential Policy?” NBER Working Paper 21902, National Bureau of Economic Research, Cambridge, MA.
Woodford, M. 2012. “Inflation Targeting and Financial Stability.” NBER Working Paper 17967, National Bureau of Economic Research, Cambridge, MA.
Yellen, J. L. 2014. “Monetary Policy and Financial Stability.” Speech given at the 2014 Michel Camdessus Central Banking Lecture, International Monetary Fund, Washington, DC, July.
©International Monetary Fund. Not for Redistribution

This page intentionally left blank
©International Monetary Fund. Not for Redistribution

257
The Future of ASEAN-5 Financial Integration
CHAPTER 10
INTRODUCTION
Regional financial integration is prominent on the agenda of Association of
Southeast Asian Nations–5 (ASEAN-5) policymakers. The experience of the
Asian financial crisis demonstrated the importance of a resilient financial system
for managing volatile capital flows. It also spurred regional financial integration
and cooperation. In the face of the financial crisis, national mechanisms to stem
the spread of financial panic proved inadequate or ineffective. These countries
have since taken steps to exploit regional economies of scale to make financial
systems more efficient to cope with external shocks.
Recent years have witnessed substantial progress in regional economic integra-
tion among the ASEAN-5, and more broadly among all ASEAN economies. As
a major milestone on the integration agenda, the ASEAN Economic Community
(AEC) came into being in 2015. The AEC Blueprint had been the key vehicle for
achieving the free flow of goods, services, investment, and skilled labor, as well as
a freer flow of capital within the region. Its successful implementation led to the
creation of the AEC five years earlier than the initially planned date of 2020. A
successor blueprint, the AEC Blueprint 2025, lays out a 10-year vision for region-
al economic integration.
Financial integration is a critical component of this broader regional economic
integration agenda. Recognizing that financial integration complements trade
flows, in 2011 ASEAN leaders adopted a financial integration framework, envis-
aging a more integrated financial region by 2020. Subsequently, in the AEC
Blueprint 2025, the leaders have outlined the move toward financial liberalization
and freer capital flow for the next decade.
Against this backdrop, this chapter addresses three questions: (1) What is the
current status of financial integration in the ASEAN-5 countries? (2) What are
the key drivers of financial integration? and (3) What are the benefits and costs?
This chapter is structured as follows: After the second section takes stock of
the current status of financial integration in ASEAN-5 economies, the third
This chapter was prepared by Khristine L. Racoma, Yiqun Wu and Xiaohui Sharon Wu, under
the guidance of Ana Corbacho.
©International Monetary Fund. Not for Redistribution
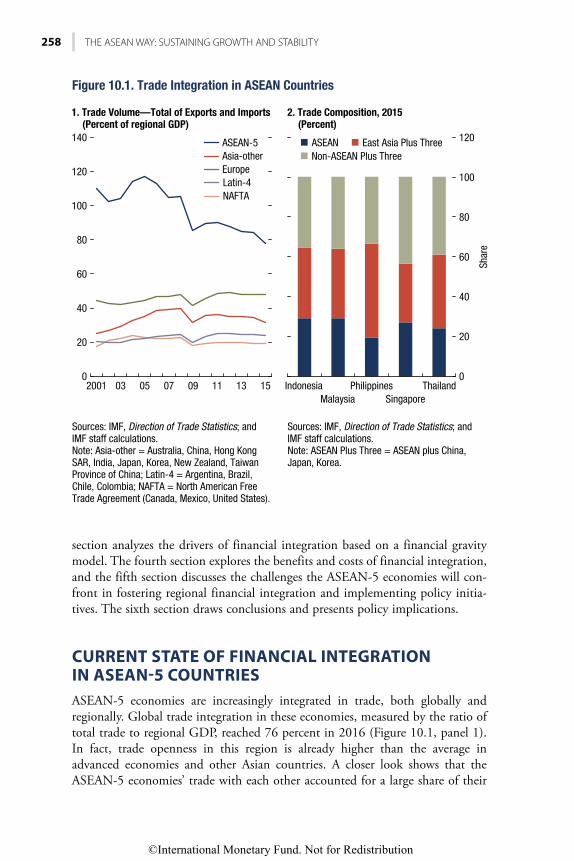
258 THE ASEAN WAY: SUSTAINING GROWTH AND STABILITY
section analyzes the drivers of financial integration based on a financial gravity
model. The fourth section explores the benefits and costs of financial integration,
and the fifth section discusses the challenges the ASEAN-5 economies will con-
front in fostering regional financial integration and implementing policy initia-
tives. The sixth section draws conclusions and presents policy implications.
CURRENT STATE OF FINANCIAL INTEGRATION IN ASEAN-5 COUNTRIES
ASEAN-5 economies are increasingly integrated in trade, both globally and
regionally. Global trade integration in these economies, measured by the ratio of
total trade to regional GDP, reached 76 percent in 2016 (Figure 10.1, panel 1).
In fact, trade openness in this region is already higher than the average in
advanced economies and other Asian countries. A closer look shows that the
ASEAN-5 economies’ trade with each other accounted for a large share of their
ASEAN-5Asia-other
Europe
Latin-4NAFTA
ASEAN East Asia Plus Three
Non-ASEAN Plus Three
Sources: IMF, Direction of Trade Statistics; and IMF staff calculations. Note: Asia-other = Australia, China, Hong Kong SAR, India, Japan, Korea, New Zealand, Taiwan Province of China; Latin-4 = Argentina, Brazil, Chile, Colombia; NAFTA = North American Free Trade Agreement (Canada, Mexico, United States).
IndonesiaMalaysia
PhilippinesSingapore
Thailand
Sources: IMF, Direction of Trade Statistics; and IMF staff calculations.Note: ASEAN Plus Three = ASEAN plus China, Japan, Korea.
2001 03 05 07 09 11 13 15
Shar
e
0
20
40
60
80
100
120
0
20
40
60
80
100
120
140
1. Trade Volume—Total of Exports and Imports(Percent of regional GDP)
2. Trade Composition, 2015(Percent)
Figure 10.1. Trade Integration in ASEAN Countries
©International Monetary Fund. Not for Redistribution

Chapter 10 The Future of ASEAN-5 Financial Integration 259
total trade. In 2015, about 60 percent of trade in ASEAN-5 countries was trans-
acted within ASEAN Plus Three economies (Figure 10.1, panel 2).1 Intraregional
trade has benefited from trade liberalization across the region (almost all goods in
the region are now traded at zero tariff ) and from participation in glob-
al value chains.
Financial integration in ASEAN-5 economies has also risen, partly driven by
trade. Figure 10.2 shows that ASEAN-5 overall financial integration, measured by
the sum of cross-border asset and liability holdings, is quite high, lagging only
that of Europe. But if financial centers such as Singapore are excluded from the
sample, the overall financial integration level for the rest of the ASEAN-5 coun-
tries ranks quite low, lagging all regions except Latin America.
Given a lack of data to track all financial flows, financial integration is exam-
ined based on data from portfolio flows. Data from bank flows are used as a
1The Plus Three economies are China, Japan, and Korea.
ASEAN-5 Asia-other Europe
Latin-4 NAFTA
Sources: IMF, Balance of Payments Statistics; and IMF staff calculations.Note: ASEAN-5 = Indonesia, Malaysia, Philippines, Singapore, Thailand; Asia-other = Australia, China, Hong Kong SAR, India, Japan, Korea, New Zealand, Taiwan Province of China; Latin-4 = Argentina, Brazil, Chile, Colombia; NAFTA = North American Free Trade Agreement (Canada, Mexico, United States).
0
100
200
300
400
500
600
700
800
900
Figure 10.2. International Investment Position(Sum of assets and liabilities, percent of
2001 03 05 07 09 11 13 15
©International Monetary Fund. Not for Redistribution
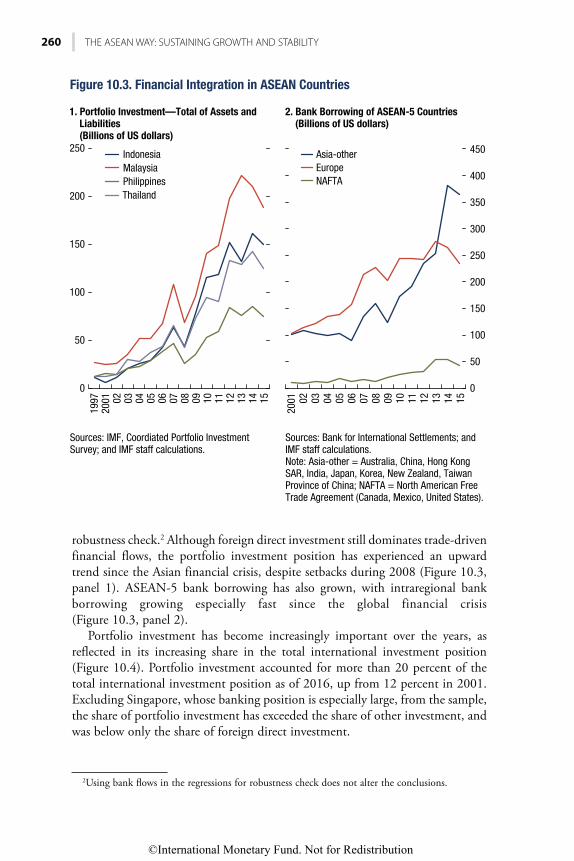
260 THE ASEAN WAY: SUSTAINING GROWTH AND STABILITY
robustness check.2 Although foreign direct investment still dominates trade-driven
financial flows, the portfolio investment position has experienced an upward
trend since the Asian financial crisis, despite setbacks during 2008 (Figure 10.3,
panel 1). ASEAN-5 bank borrowing has also grown, with intraregional bank
borrowing growing especially fast since the global financial crisis
(Figure 10.3, panel 2).
Portfolio investment has become increasingly important over the years, as
reflected in its increasing share in the total international investment position
(Figure 10.4). Portfolio investment accounted for more than 20 percent of the
total international investment position as of 2016, up from 12 percent in 2001.
Excluding Singapore, whose banking position is especially large, from the sample,
the share of portfolio investment has exceeded the share of other investment, and
was below only the share of foreign direct investment.
2Using bank flows in the regressions for robustness check does not alter the conclusions.
Asia-otherEurope
NAFTA
Indonesia
Malaysia
Philippines
Thailand
Sources: IMF, Coordiated Portfolio Investment Survey; and IMF staff calculations.
Sources: Bank for International Settlements; and IMF staff calculations.Note: Asia-other = Australia, China, Hong Kong SAR, India, Japan, Korea, New Zealand, Taiwan Province of China; NAFTA = North American Free Trade Agreement (Canada, Mexico, United States).
1997
2001 02 03 04 05 06 07 08 09 10 11 12 13 14 15
2001 02 03 04 05 06 07 08 09 10 11
0
50
100
0
50
100
150
200
250
150
200
250
300
350
400
450
12 13 14 15
Figure 10.3. Financial Integration in ASEAN Countries
1. Portfolio Investment—Total of Assets and Liabilities (Billions of US dollars)
2. Bank Borrowing of ASEAN-5 Countries (Billions of US dollars)
©International Monetary Fund. Not for Redistribution

Chapter 10 The Future of ASEAN-5 Financial Integration 261
However, the degree and pace of financial integration in ASEAN are not com-
mensurate with those of trade integration. This discrepancy can be illustrated by
comparing the intensity scores for trade and portfolio investment.3 Trade intensi-
ty of the ASEAN-5 economies during 2001–15 was higher than in all other
regions (Figure 10.5, panel 1). In contrast, their portfolio investment intensity
was lower than the world average, and in fact was only about one-third of their
trade intensity (Figure 10.5, panel 2).
Financial integration in ASEAN-5 is lagging when using other metrics.
Although the portfolio investment position (sum of assets and liabilities) was
about 60 percent of GDP in 2015, this ratio would drop to about 20 percent if
Singapore were excluded—which is much lower than that of Europe or North
American Free Trade Agreement partners (Figure 10.6, panel 1). The share of
3The trade intensity score is calculated as a country’s share in global trade as a proportion of its
GDP share. Portfolio investment intensity score is calculated as a country’s share in the world’s
portfolio assets and liabilities as a proportion of its GDP share. The intensity score formula is
intensity it =
( f it ⁄ ∑
i=1 n f
it ) _______
( GDP it
⁄ ∑
i=1 n GDP
it ) , in which f
it is the sum of imports and exports or the sum of portfolio
investment assets and liabilities for country i at time t; n is the number of countries in the sample.
Foreign direct investment Portfolio investment Other investment Reserve assets
Sources: IMF, Balance of Payments Statistics; and IMF staff calculations.
2001 03 05 07 09 11 13 15 2001 03 05 07 09 11 13 15
Perc
ent
Perc
ent
0
10
20
30
40
50
60
70
80
90
100
0
10
20
30
40
50
60
70
80
90
100
Figure 10.4. Composition of International Investment Position (Total Assets and Liabilities)
1. Composition of International InvestmentPosition (Total of assets and liabilities)(ASEAN-5 excluding Singapore)
2. Composition of International InvestmentPosition (Total of assets and liabilities)(ASEAN-5)
©International Monetary Fund. Not for Redistribution

262 THE ASEAN WAY: SUSTAINING GROWTH AND STABILITY
intraregional portfolio investment is also relatively low in the ASEAN-5 econo-
mies if portfolio asset composition is considered (Figure 10.6, panel 2).
DRIVERS OF REGIONAL FINANCIAL INTEGRATION
The drivers of financial integration in ASEAN countries are examined using a
financial gravity model based on cross-border portfolio investment.4 In addition
to standard gravity factors, the model analyzes the role of regulatory and institu-
tional quality as well as capital control measures.5 Empirical evidence suggests
that lower regulatory and institutional quality, as well as restrictions on
cross-border capital flows, negatively affect regional financial integration.
Gravity models of trade predict that bilateral trade flows will be proportional
to market size and inversely proportional to distance between trading partners.
4Alternative financial integration measures such as banking positions are used in
robustness checks.5See Fernández and others (2015).
Sources: IMF, Coordinated Portfolio Investment Survey; IMF, Direction of Trade Statistics; and IMF staff calculations.Note: Asia-other = Australia, China, Hong Kong SAR, India, Japan, Korea, New Zealand, Taiwan Province of China; Latin America = Argentina, Brazil, Chile, Colombia; NAFTA = North American Free Trade Agreement (Canada, Mexico, United States).
0 1 2 3 4 5 6 7 8 0.0 0.5 1.0 1.5 2.0 2.5 3.0
Indonesia
Philippines
Thailand
Malaysia
Singapore
ASEAN-5
Asia-other
Europe
Latin America
NAFTA
World
Indonesia
Thailand
Philippines
Malaysia
Singapore
ASEAN-5
Asia-other
Europe
Latin America
NAFTA
World
Reg
ion
Cou
ntry
Reg
ion
Cou
ntry
Figure 10.5. Trade and Portfolio Investment Intensity
1. Trade Intensity (Average 2001–15)
2. Portfolio Investment Intensity (Average 2001–15)
©International Monetary Fund. Not for Redistribution

Chapter 10 The Future of ASEAN-5 Financial Integration 263
The gravity relationship arises when trade costs and barriers increase with dis-
tance. Similarly, gravity models of asset trade (for example, Portes and Rey 2001)
show that distance, which proxies for information asymmetry, has a negative
impact on bilateral asset trade flows. Countries with geographic proximity usually
have more knowledge and a better understanding of each other due to the ease of
interaction; this is especially important for information-intensive finan-
cial investment.
The baseline gravity equation includes indicators for market size and infor-
mation asymmetry. Two additional variables, bilateral trade volume and a com-
mon language indicator, are used as a proxy for information asymmetry. The
analysis is based on a panel of 45 economies from 1990 to 2015, consisting of
ASEAN economies together with representative advanced and emerging
market economies.
ASEAN Plus ThreeNon-ASEAN Plus ThreeASEAN-5 Asia-other
Europe Latin-4NAFTA
Sources: IMF, Coordinated Portfolio Investment Survey; and IMF staff calculations.Note: Asia-other = Australia, China, Hong Kong SAR, India, Japan, Korea, New Zealand, Taiwan Province of China; Latin-4 = Argentina, Brazil, Chile, Colombia; NAFTA = North American Free Trade Agreement (Canada, Mexico, United States).
IndonesiaMalaysia
PhilippinesSingapore
Thailand
Sources: IMF, Coordinated Portfolio Investment Survey; and IMF staff calculations. Note: ASEAN Plus Three = ASEAN 10 countries plus China, Japan, and Korea.
0.0
0.1
0.2
0.3
0.4
0.5
0.6
0.7
0.8
0.9
1.0
0
20
40
60
80
100
120
140
160
Figure 10.6. Portfolio Investment
1. Portfolio Investment—Total Assets andLiabilities(Percent of regional GDP)
2. Portfolio Asset Composition(Percent, as of year-end 2015)
2001 03 05 07 09 11 13 15
©International Monetary Fund. Not for Redistribution

264 THE ASEAN WAY: SUSTAINING GROWTH AND STABILITY
The estimates point to the following findings (Table 10.1):6
• Bilateral financial integration increases with trade integration. The trade coef-
ficient shows that when bilateral trade volume increases by 10 percent,
financial holdings increase by more than 4 percent. The results are especial-
ly strong for banking position. These findings are consistent with the styl-
ized facts discussed in the previous section: financial integration has gone
hand in hand with trade integration.
• Financial integration increases with market size and common language ties. Larger market size leads to higher demand for assets and higher asset prices
and, in turn, to a greater number of endogenous assets. Estimates also sug-
gest that closer language ties lower transaction costs and foster integration.
• Financial integration decreases with distance between countries. Countries with
geographical proximity tend to be more integrated financially.
The results suggest that institutional quality matters for regional financial inte-
gration. To examine the role of institutional quality,7 a wide range of institutional
indicators are added to the baseline gravity model. They include governance quality;
ease of doing business; and political, economic, and financial risks. The coefficients
6The results are robust when banking positions are used as the measure of financial integration.7Institutional quality is found to be an important factor affecting trade in financial assets. See
Papaioannou (2009) for a literature review. Ananchotikul, Piao, and Zoli (2015) find that the lack
of regulatory harmonization has a more negative effect on intra-Asia investment.
TABLE 10.1.
Baseline Gravity Model
�1
Portfolio
Assets
�2
Portfolio Assets and
Liabilities
GDP Borrower 0.83*** 0.77***
�0.07 �0.07
GDP Lender 0.11 0.70***
�0.09 �0.08
Distance �0.51*** �0.39***
�0.03 �0.02
Trade 0.45*** 0.42***
�0.02 �0.02
Common Language 0.19*** 0.28***
�0.04 �0.04
Constant �12.35*** �19.95***
�3.23 �2.69
Year Effect Yes Yes
Borrower Effect Yes Yes
Lender Effect Yes Yes
Observations 18,554 17,732
Adjusted R2 0.825 0.83
Source: IMF staff calculations.
Note: Standard errors are in parentheses.
* p � 0.10; ** p � 0.05; *** p � 0.01.
©International Monetary Fund. Not for Redistribution

Chapter 10 The Future of ASEAN-5 Financial Integration 265
of all indicators are found to be positive and statistically significant, indicating that
good institutional quality, including good governance and a business-friendly envi-
ronment, is linked to greater financial integration (Table 10.2).
Improvements in institutional quality promote regional financial integration.
Figure 10.7 shows the positive relationship between the rule-of-law index,8 as a
proxy for institutional quality, and intra-ASEAN financial integration. A reasonable
explanation is that, while global investors are likely to have broader and stable rela-
tionships with high-quality clients, regional investors are more vulnerable to poor
institutions, and thus benefit more from an improvement in institutional quality. It
should be noted, however, that the results for ASEAN-5 economies show a high
8This index, taken from the World Bank’s Worldwide Governance Indicators database, reflects a
country’s progress in enhancing law and enforcement and building a trustworthy society. Results
are similar when other institutional-quality indicators are used. The results also hold when a lagged
rule-of-law index and instrumental variable (latitude, fractionalization of language and religion) are
used to account for the possible endogeneity of institutional quality.
TABLE 10.2.
Drivers of Financial Integration—Institutional Quality
�1
Portfolio
Assets
�2
Portfolio Assets and
Liabilities
GDP Borrower 0.78*** 0.83***
�0.02 �0.02
GDP Lender 0.69*** 0.80***
�0.02 �0.02
Distance �0.88*** �0.89***
�0.02 �0.02
Trade 0.05** �0.03
�0.02 �0.02
Common Language 0.94*** 0.97***
�0.05 �0.04
Rule-of-Law Borrower 0.86*** 1.53***
�0.02 �0.02
Intra-ASEAN Dummy 1.14*** 0.85***
�0.12 �0.11
Intra-ASEAN Dummy
Rule-of-Law Borrower
0.42*** 0.71***
�0.1 �0.1
Rule-of-Law Lender 2.49*** 1.47***
�0.03 �0.02
Intra-ASEAN Dummy
Rule-of-Law Lender
�0.02 0.52***
�0.11 �0.1
Constant �17.09*** �18.01***
�0.67 �0.59
Year Effects Yes Yes
Observations 15,788 15,491
Adjusted R2 0.636 0.662
Source: IMF staff calculations.
Note: Standard errors are in parentheses.
* p � 0.10; ** p � 0.05; *** p � 0.01.
©International Monetary Fund. Not for Redistribution

266 THE ASEAN WAY: SUSTAINING GROWTH AND STABILITY
degree of heterogeneity. The positive effect of the rule-of-law index appears most
significant for Thailand, the Philippines, and Singapore.
Finally, restrictions on capital flows undermine financial integration
(Table 10.3). When the baseline gravity model is augmented with capital con-
trol measures from Fernández and others (2015), estimates show that in both
equity and debt securities markets, controls restricting nonresidents’ purchase
of dometic securities or restricting residents’ purchase of foreign securities have
a significant negative impact on portfolio investment. These results confirm
that capital controls are a barrier to trade in financial assets, similar to tariffs
and quotas that impede trade of goods and services. Therefore, with continuing
efforts toward liberalizing capital accounts, financial integration of ASEAN
economies is set to further improve.
THE BENEFITS AND COSTS OF FINANCIAL INTEGRATION IN ASEAN-5 COUNTRIES
There are several potential advantages to financial integration. Financial integration
allows consumption smoothing, risk sharing, and risk diversification. It can
strengthen sources of growth in recipient countries, including through imports of
capital for capital-scarce economies and technology spillover through foreign direct
Average intra-ASEAN-5
0
2
6
8
Figure 10.7. Institutional Quality and Intraregional Financial Integration, ASEAN-5 Average
05 07 09
©International Monetary Fund. Not for Redistribution

Chapter 10 The Future of ASEAN-5 Financial Integration 267
investment. It can increase access to finance for the poor and enhance financial
inclusion. It can discipline policymakers and prevent them from adopting unsound
polices that have undesirable market consequences (Kose and others 2009).
Regional financial integration could have extra benefits. Better economies of
scale would make financial systems within the region more efficient. By growing
and deepening local financial markets, financial integration helps develop a
twin-engine financial system and reduces excessive reliance on banks in a
bank-centric system. Regional financial integration can also help alleviate coun-
tries’ reliance on financial centers; this funding diversification is shown to have
had a buffering effect against global shocks such as the 2013 taper tantrum (Park
and Shin 2016). Moreover, regional financial integration provides incentives for
regional cooperation and enhancement of multilateral safety nets (Kim, Lee, and
Shin 2006; Park and Shin 2016).
TABLE 10.3.
Drivers of Financial Integration—Capital Controls
�1
Equity Market1
�2
Bond Market1
�3
Money Market1
GDP Borrower 0.70*** 0.80*** 0.72***
�0.05 �0.05 �0.05
GDP Lender 0.21*** 0.21*** 0.20***
�0.05 �0.05 �0.05
Distance �0.54*** �0.62*** �0.57***
�0.09 �0.09 �0.09
Trade 0.51*** 0.49*** 0.52***
�0.04 �0.04 �0.04
Common Language 1.54*** 1.44*** 1.36***
�0.09 �0.09 �0.09
Real per Capita GDP Borrower 0.64*** 0.65*** 0.48***
�0.07 �0.07 �0.07
Real per Capita GDP Lender 1.90*** 1.85*** 2.01***
�0.08 �0.08 �0.08
Nonresident Purchase
Control Borrower
�0.05 �0.41*** �0.70***
�0.1 �0.1 �0.1
Resident Issuance
Control Borrower
0.13 0.41*** 0.32**
�0.12 �0.16 �0.13
Resident Purchase
Control Lender
�0.80*** �1.46*** �1.40***
�0.12 �0.14 �0.13
Nonresident Issuance
Control Lender
�0.88*** �0.09 0.22**
�0.11 �0.11 �0.1
Constant �37.10*** �37.34*** �36.21***
�2.16 �2.03 �1.94
Year Effect Yes Yes Yes
Observations 3,925 3,694 3,954
Adjusted R2 0.589 0.595 0.588
Source: IMF staff calculations.
Note: Standard errors are in parentheses.
* p � 0.10; ** p � 0.05; *** p � 0.01.1Dependent variable: portfolio asset holding.
©International Monetary Fund. Not for Redistribution

268 THE ASEAN WAY: SUSTAINING GROWTH AND STABILITY
Regional financial integration would help ASEAN countries better weather
external shocks and spillovers. This was particularly propitious when banks in
advanced economies, weakened by the global financial crisis and constrained by
tighter financial regulations, began retreating to their home bases. Based on dif-
ferent approaches, results suggest the following:9
• The investment position within the ASEAN Plus Three economies10 was
less affected by liquidity conditions in the United States and Europe. This
finding is based on US security broker-dealer sector leverage as an indicator
for the US liquidity cycle, and the change in Europe’s M2 money stock for
the European liquidity cycle (Tables 10.4 and 10.5).11
9These results are in line with Park and Shin (2016).10The results are robust when the region is restricted to ASEAN (although less significant) or
ASEAN-5 countries, and with or without Singapore.11Adrian, Etula, and Muir (2011) propose US security broker-dealer sector leverage
(assets-to-equity) as a better liquidity measure because it is market oriented and reflects timely
TABLE 10.4.
Benefits of Financial Integration—US Liquidity Condition
�1
Portfolio
Assets
�2
Portfolio Assets and
Liabilities
GDP Borrower 0.31*** 0.17*
�0.09 �0.09
GDP Lender �0.03 0.25***
�0.1 �0.09
Distance �0.47*** �0.34***
�0.03 �0.02
Trade 0.43*** 0.40***
�0.02 �0.02
Real per Capita GDP Borrower 1.55*** 1.26***
�0.19 �0.19
Real per Capita GDP Lender 0.78*** 1.06***
�0.22 �0.21
Common Language 0.23*** 0.33***
�0.04 �0.04
US Broker-Dealer Sector Leverage 0.35*** 0.16***
�0.06 �0.05
Intra-ASEAN�3 Dummy 3.46*** 3.23***
�0.74 �0.67
Intra-ASEAN�3 Dummy
US Broker-Dealer Sector Leverage
�0.93*** �0.82***
�0.24 �0.22
Constant �14.23*** �20.05***
�1.51 �1.32
Borrower Effect Yes Yes
Lender Effect Yes Yes
Observations 18,554 17,732
Adjusted R2 0.825 0.83
Source: IMF staff calculations.
Note: Standard errors are in parentheses.
* p � 0.10; ** p � 0.05; *** p � 0.01.
©International Monetary Fund. Not for Redistribution

Chapter 10 The Future of ASEAN-5 Financial Integration 269
• Regional investors were less likely to join global investors in pulling out of
investments during the global financial crisis (Figure 10.8).
• To test whether intraregional capital flows (capital flows to ASEAN-5 coun-
tries from ASEAN Plus Three countries) are more resilient to global shocks
than capital flows from outside the region, we compared the impulse
responses of the two aggregate flows to global shocks such as changes in the
VIX.12 Figure 10.9 shows that when there is a shock in the VIX, intraregional
underlying market conditions. Bruno and Shin (2013) use this leverage as their preferred global
liquidity indicator. Our results using the Chicago Board Options Exchange Volatility Index (VIX)
are similar although less significant, whereas using US and EU credit-to-GDP growth as liquidity
indicators also yields similar results.12Figure 10.9 shows the average of the impulse responses derived from structural vector
autoregressions (SVARs) for each ASEAN-5 economy. In the SVAR there are three variables in the
following order: a global factor (VIX), average real growth in ASEAN-5 economies, and capital
inflows to the country under consideration. An aggregate approach using a similar SVAR with the
TABLE 10.5.
Benefits of Financial Integration—EU Liquidity Condition
�1
Portfolio
Assets
�2
Portfolio Assets and
Liabilities
GDP Borrower 0.38*** 0.19**
�0.09 �0.09
GDP Lender 0.04 0.27***
�0.1 �0.09
Distance �0.47*** �0.35***
�0.03 �0.02
Trade 0.43*** 0.40***
�0.02 �0.02
Real per Capita GDP Borrower 1.39*** 1.22***
�0.19 �0.19
Real per Capita GDP Lender 0.56*** 1.01***
�0.21 -0.2
Common Language 0.23*** 0.33***
�0.04 �0.04
EU M2 Growth 0.03*** 0.02***
0 0
Intra-ASEAN�3 Dummy 1.10*** 1.17***
�0.14 �0.13
Intra-ASEAN�3 Dummy EU M2
Growth
�0.10*** �0.09***
�0.02 �0.02
Constant �13.68*** �20.09***
�1.52 �1.32
Borrower Effect Yes Yes
Lender Effect Yes Yes
Observations 18,554 17,732
Adjusted R2 0.825 0.83
Source: IMF staff calculations.
Note: Standard errors are in parentheses.
* p � 0.10; ** p � 0.05; *** p � 0.01.
©International Monetary Fund. Not for Redistribution

270 THE ASEAN WAY: SUSTAINING GROWTH AND STABILITY
portfolio inflows respond less negatively than capital flows from outside.
This suggests that intraregional capital flows are less likely to reverse or
experience a sudden stop at times of global financial volatility.
• There is also evidence that the influence of global shocks on regional equity
markets is declining. We use a spillover index developed by Diebold and
Yilmaz (2014) to analyze the interdependence of asset returns and volatili-
ties in the ASEAN-5, China, and the United States. The index quantifies the
contribution of shocks from one country’s asset returns and volatilities to
another’s at different points in time. The time-varying spillover index is
obtained as the generalized impulse responses, which are derived using two
lags in the vector autoregression estimation and a 150-day rolling window.
The results show that ASEAN-5 equity markets are affected more by one
another than by the United States, whose influence is declining
(Figure 10.10), partly due to greater regional financial integration. This
average capital inflows to each ASEAN-5 economy yields similar results. Both intraregional and
interregional capital flow data are from the IMF Coordinated Portfolio Investment Survey data set
from 2002 to 2015.
ASEAN Plus Three investorsNon-ASEAN Plus Three investors
ASEAN investorsNon-ASEAN Plus Three investors
Sources: IMF, Coordinated Portfolio Investment Survey; and IMF staff calculations.Note: ASEAN Plus Three = ASEAN-5 plus China, Japan, Korea.
Indo
nesi
a
Mal
aysi
a
Phili
ppin
es
Sing
apor
e
Thai
land
Viet
nam
Indo
nesi
a
Mal
aysi
a
Phili
ppin
es
Sing
apor
e
Thai
land
Viet
nam
–50
–40
–30
–20
–10
0
–60
–50
–40
–30
–20
–10
0
©International Monetary Fund. Not for Redistribution

Chapter 10 The Future of ASEAN-5 Financial Integration 271
suggests that compared with the past, these markets are likely to be more
resilient in the face of global events.13
Regional financial integration can also play an important role in facilitating
economic rebalancing. ASEAN economies are salient examples of the Lucas par-
adox (Lucas 1990). Despite substantial development potential and large infra-
structure needs, these economies were all net capital exporters with high current
account surpluses, averaging about 2 percent of GDP a year during 2009–16.
The current account imbalance is affected by structural factors. The current
account imbalance is a mirror image of the savings-investment gap; the desirable
savings-to-investment level, in turn, is affected by structural factors that are deter-
mined or influenced by the financial system.14 Financial integration can play an
important role in affecting such levels. It would lessen the need to rely on coun-
tries’ own funds and improve access to financial services, and thus provide a net
boost to consumption and investment.
13Our findings that the ASEAN-5 equity markets were less influenced by the US market were
similar to those of Guimarães-Filho and Hong (2017), but we found a less influence from China’s
equity markets than Guimarães-Filho and Hong did.14Financial markets are, in essence, the arrangements for processing information in networks of
savers and investors (Gochoco-Bautista and Remolona 2012).
Intraregional
Interregional
Source: IMF staff calculations.
–18
–16
–14
–12
–10
–8
–6
–4
–2
0
2
4
Figure 10.9. Impulse Response of Capital Flows to a Shock in the VIX
0 1 2 3 4
©International Monetary Fund. Not for Redistribution
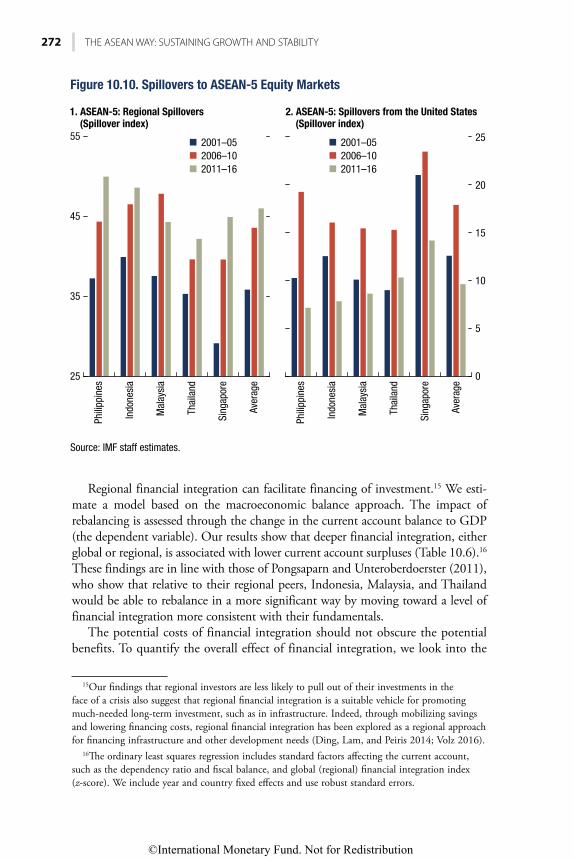
272 THE ASEAN WAY: SUSTAINING GROWTH AND STABILITY
Regional financial integration can facilitate financing of investment.15 We esti-
mate a model based on the macroeconomic balance approach. The impact of
rebalancing is assessed through the change in the current account balance to GDP
(the dependent variable). Our results show that deeper financial integration, either
global or regional, is associated with lower current account surpluses (Table 10.6).16
These findings are in line with those of Pongsaparn and Unteroberdoerster (2011),
who show that relative to their regional peers, Indonesia, Malaysia, and Thailand
would be able to rebalance in a more significant way by moving toward a level of
financial integration more consistent with their fundamentals.
The potential costs of financial integration should not obscure the potential
benefits. To quantify the overall effect of financial integration, we look into the
15Our findings that regional investors are less likely to pull out of their investments in the
face of a crisis also suggest that regional financial integration is a suitable vehicle for promoting
much-needed long-term investment, such as in infrastructure. Indeed, through mobilizing savings
and lowering financing costs, regional financial integration has been explored as a regional approach
for financing infrastructure and other development needs (Ding, Lam, and Peiris 2014; Volz 2016).16The ordinary least squares regression includes standard factors affecting the current account,
such as the dependency ratio and fiscal balance, and global (regional) financial integration index
(z-score). We include year and country fixed effects and use robust standard errors.
2001–052006–102011–16
2001–052006–102011–16
Source: IMF staff estimates.
Phili
ppin
es
Indo
nesi
a
Mal
aysi
a
Thai
land
Sing
apor
e
Aver
age
Phili
ppin
es
Indo
nesi
a
Mal
aysi
a
Thai
land
Sing
apor
e
Aver
age
25
35
45
55
0
5
10
15
20
25
Figure 10.10. Spillovers to ASEAN-5 Equity Markets
1. ASEAN-5: Regional Spillovers (Spillover index)
2. ASEAN-5: Spillovers from the United States (Spillover index)
©International Monetary Fund. Not for Redistribution

Chapter 10 The Future of ASEAN-5 Financial Integration 273
relationship between financial integration and economic growth, applying the
framework of Eyraud, Singh, and Sutton (2017). We include standard control
variables such as trade openness and population growth in our regression, with
real GDP growth as the dependent variable. Considering financial integration
might be affected by economic growth, we use instrumental variables (IV) meth-
ods as well. The instruments used are one-period lag of the financial integration
variable and capital control measures from Fernández and others (2015).
Our results show a positive and statistically significant association between
global financial integration and economic growth.17 In similar estimations for
regional integration, a positive but statistically weaker association is found
between regional financial integration and economic growth (Table 10.7).18
17Global (regional) financial integration in Table 10.7 refers to the global (regional) financial
integration index (z-score) calculated from portfolio investment data. Using z-scores calculated from
foreign direct investment data has similar results. Singapore is not included in this exercise; the
results are less significant with Singapore, perhaps because of Singapore’s status as a financial center
and its higher stage of development.18Columns (1)–(3) evaluate the effect of global financial integration, and columns (4)–(6)
show the results for intraregional financial integration. Columns (1) and (4) use ordinary least
squares estimation with time fixed effects. To correct for possible endogeneity, columns (2) and
TABLE 10.6.
Benefits of Financial Integration—Rebalancing
�1
Global
�2
Regional
�3
Both
Dependency Ratio 0.32*** 0.33*** 0.33***
�0.1 �0.1 �0.1
Fiscal Balance �0.09 �0.09* �0.09*
�0.05 �0.05 �0.05
Real GDP Growth 0.05 0.05 0.05
�0.07 �0.07 �0.07
Global Financial Integration �2.77*** �0.84
�0.72 �2.12
Opening Balance of Net Foreign Assets �0.00** �0.00** �0.00**
0 0 0
Population Growth 0.02 0.09 0.07
�0.57 �0.55 �0.56
Oil Income 0.96*** 0.97*** 0.97***
�0.2 �0.2 �0.2
Regional Financial Integration �2.95*** �2.15
�0.71 �2.16
Constant �1.35 �6.39 �4.48
�5.04 �5.39 �5.91
Year Effect Yes Yes Yes
Lender Effect Yes Yes Yes
Observations 597 597 597
Adjusted R2 0.908 0.909 0.908
Source: IMF staff calculations.
Note: Standard errors are in parentheses.
* p � 0.10; ** p � 0.05; *** p � 0.01.
©International Monetary Fund. Not for Redistribution

274 THE ASEAN WAY: SUSTAINING GROWTH AND STABILITY
However, financial integration does not necessarily guarantee net benefits if
sound institutional and policy frameworks are not in place.19
FOSTERING FINANCIAL INTEGRATION IN THE ASEAN-5: CHALLENGES AND POLICY INITIATIVES
In 2016, all ASEAN countries endorsed the strategic action plans for ASEAN
Financial Integration 2025. Building on key milestones in the AEC Blueprint
2015, the financial sector integration vision for 2025 encompasses three strategic
objectives: financial integration, financial inclusion, and financial stability; and
three crosscutting areas: capital account liberalization, payment and settlement
(5) use two-stage least squares estimation, and columns (3) and (6) use the instrumental variable–
generalized method of moments method. The instruments used are a one-period lag of the financial
integration variable and capital control measures from Fernández and others (2015).19For a fuller treatment on the risks and challenges of financial integration, see Obstfeld and
Taylor (2004), and Barro and Lee (2011).
TABLE 10.7.
Benefits of Financial Integration—Economic Growth
�1 �2 �3 �4 �5 �6
Trade Openness �0.79 �1.14* �1.17 �1.03 �0.69 �0.99
�0.72 �0.66 �0.83 �0.76 �0.58 �0.76
Real GDP per Capita �2.39*** �1.99*** �2.12*** �2.53*** �1.23*** �1.53***
�0.44 �0.41 �0.46 �0.48 �0.41 �0.47
GDP Share of Investment �0.11 1.63 1.39 �0.42 1.73* 1.64
�1 �1.01 �1.04 �1.02 �1.05 �1.06
GDP Share of Government
Spending
3.00** 3.75*** 3.72*** 3.07** 2.70** 3.00**
�1.2 �1.02 �1.29 �1.25 �1.06 �1.21
Population Growth 0.51 0.42 0.69 0.16 0.56 0.69
�0.6 �0.59 �0.63 �0.61 �0.55 �0.61
Inflation Rate 0.10*** 0.16*** 0.17*** 0.11*** 0.16*** 0.18***
�0.03 �0.05 �0.05 �0.03 �0.06 �0.05
Political Risk Index 0.04 0.04 0.04 0.07 0.05 0.06
�0.05 �0.05 �0.05 �0.05 �0.04 �0.05
Global Financial
Integration
0.09 0.32** 0.31**
�0.1 �0.13 �0.15
Regional Financial
Integration
0.13 0.06 0.11
�0.12 �0.14 �0.14
Constant 27.63*** 28.04*** 28.34*** 28.95*** 19.49*** 21.54***
�4.58 �4 �4.67 �5.22 �5.12 �5.11
Year Effect Yes No No Yes No No
Observations 98 84 84 91 74 74
Adjusted R2 0.609 0.44 0.447 0.59 0.28 0.288
Source: IMF staff calculations.
Note: Standard errors are in parentheses.
* p � 0.10; ** p � 0.05; *** p � 0.01.
©International Monetary Fund. Not for Redistribution

Chapter 10 The Future of ASEAN-5 Financial Integration 275
systems, and capacity building (ASEAN 2015). The ASEAN financial integration
framework focuses on banking, insurance, and capital market development initia-
tives, which are underpinned by a payment and settlement system that fosters
interoperability and efficiency in cross-border payments (Table 10.8).
However, the ASEAN region is one of the world’s most diverse. Substantial
challenges are present in fostering two key components of regional financial inte-
gration: financial sector liberalization and capital account liberalization.
Financial Sector Liberalization
Varying paces of financial liberalization and divergent regulatory frameworks
among these economies have led to fragmentation, severely inhibiting regional
financial integration.
• Varying paces of financial liberalization: The financial systems across ASEAN
economies are at very different stages of development. Banks in these coun-
tries are generally small by global standards. Most countries still have frag-
mented banking systems composed of many small financial institutions
with weak financial profiles.
• Substantial differences in regulatory frameworks and standards: Differences in
investor protection, ability to resolve commercial disputes, and bankruptcy
procedures appear more pronounced within the ASEAN than in other
regions (Figure 10.11). Such differences could complicate cross-border
TABLE 10.8.
ASEAN Financial Integration Framework
Key Milestones in AEC 2015 End Goal in 2025
• Assessed and monitored developments in the
openness of the CAL regime in ASEAN;
established and conducted Policy Dialogue
Mechanisms and capacity-building programs
to support CAL.
• Substantial liberalization in ASEAN member
states’ capital accounts.
• Strengthened policy dialogue and information
exchange mechanism on capital flow statistics
and capital flow measures among AMS.
• Created enabling environment for regional
integration; facilitated the establishment of
ASEAN Trading Link; and supported bond
market development.
• Interconnected ASEAN stock markets.
• Deep and liquid ASEAN capital markets.
• Improved access to capital markets.
• Greater private sector engagement to understand
their insights into ASEAN financial markets.
• Increased cross-border collective investment
schemes in ASEAN.
• Negotiated, signed, and implemented
packages of financial services liberalization
commitments.
• More integrated financial services sector through
enhanced financial liberalization among AMS.
• Approved the ASEAN Banking Integration
Framework (ABIF); established the ABIF
Guidelines; completed the signing of a Heads
of Agreement between Bank Negara Malaysia
and Bank Indonesia.
• Greater role of qualified ASEAN banks in
facilitating intra-ASEAN trade and investment.
• Greater coherence of banking regulations for all
AMS to support financial integration.
• Greater regional strength in the banking sector
and market confidence.
Source: Association of Southeast Asian Nations (ASEAN).
Note: AEC � ASEAN Economic Community; AMS � ASEAN Member States; CAL � capital account liberalization.
©International Monetary Fund. Not for Redistribution

276 THE ASEAN WAY: SUSTAINING GROWTH AND STABILITY
mergers. As shown in the previous analysis, institutional and regulatory
differences would hinder further regional financial integration.
Capital Account Liberalization
Except for Singapore, ASEAN economies have less open capital accounts com-
pared with emerging markets in other regions (Almekinders and others 2015).
The findings in the “Drivers of Regional Financial Integration” section in this
chapter show that relaxing restrictions on cross-border capital movements sup-
ports regional financial integration.
Important regional initiatives are promoting financial integration in the
ASEAN region. The focus has been on translating the AEC Blueprint 2025 into
strategic action plans and work programs.
• Capital market development: There has been progress in building capacity
and infrastructure to develop and integrate the ASEAN capital markets. In
Malaysia, Singapore, and Thailand, concrete measures have been put in
place to harmonize disclosure requirements and broaden market links. The
measures include a single gateway to all three exchanges that allows investors
Note: ASEAN-other = Brunei, Cambodia, Laos, Myanmar, Vietnam; Asia-other = Australia, China, Hong Kong SAR, India, Japan, Korea, New Zealand, Taiwan Province of China; Latin-4 = Argentina, Brazil, Chile, Colombia; NAFTA = North American Free Trade Agreement (Canada, Mexico, United States).Source: World Bank, Worldwide Governance Indicators; and IMF staff calculation.
ASEA
N-5
ASEA
N-o
ther
Asia
-oth
er
Euro
pe
NAF
TA
Latin
-4
ASEA
N-5
ASEA
N-o
ther
Asia
-oth
er
Euro
pe
NAF
TA
Latin
-4
–1.0
–0.5
0.0
0.5
1.0
1.5
–0.8
–0.4
0.0
0.4
0.8
1.2
1.6
Figure 10.11. Comparison of Regulatory Indices
1. Rule-of-Law Index 2. Regulatory Quality Index
©International Monetary Fund. Not for Redistribution

Chapter 10 The Future of ASEAN-5 Financial Integration 277
in one country to buy shares in the other two markets through local stock-
brokers, fully harmonized prospectus disclosure requirements that allow
issuers to tap all three markets with a single set of prospectuses, and a mutu-
al recognition framework that provides fund managers with a streamlined
authorization process for the cross-border offering of funds.
• Banking integration: The ASEAN Banking Integration Framework has been
adopted to achieve multilateral liberalization in the banking sector by 2020.
Major banks in Malaysia and Singapore have been the most active in
expanding regionally. Thai banks are also expanding, focusing more on the
Greater Mekong region. Many bilateral agreements have been signed.
• Capital account liberalization: The strategic action plan encourages countries
to allow greater flows of capital inside the region to facilitate cross-border
investment and lending while imposing adequate safeguards.
• Payment and settlement systems, and financial services liberalization: Various
initiatives are underway for harmonizing payment and settlement systems,
with the aim of eventually facilitating payments across the region and
removing restrictions on intraregional provision of financial services.
Substantial progress has been made in setting up regional institutions to
enhance regional cooperation in capacity building, regional financing arrange-
ments, and regional surveillance (Almekinders and others 2015).
• Regional financing arrangements: In recent years the regional safety net has
been substantially enhanced. A multilateral currency swap arrangement
among the ASEAN Plus Three countries (Chiang Mai Initiative
Multilateralization, or CMIM) was established in March 2010, and a crisis
prevention facility (the CMIM Precautionary Line) has been introduced.
• Surveillance and monitoring system: An independent regional macroeconom-
ic surveillance unit—the ASEAN+3 Macroeconomic Research Office—has
been in operation since 2011, and was converted to an international orga-
nization in 2016. The office seeks to strengthen cooperative relationships
with major existing international financial organizations.
Managing Risks from Capital Flows
It is important to recognize that financial integration and greater exposure to
international capital markets can also pose challenges and risks. Capital flows,
including those intermediated through the banking system, can amplify domestic
economic and financial cycles. Harnessing the benefit of financial integration
hence requires strong policy frameworks and institutions to safeguard macroeco-
nomic and financial stability.
Macroeconomic policies, including exchange rate flexibility, need to play a key
role in the management of risks associated with capital flows. A flexible exchange
rate can be a critical shock absorber in the event of capital inflow surges.
Macroprudential policies, in support of sound macroeconomic policies and
strong financial supervision and regulation, can increase countries’ resilience to
©International Monetary Fund. Not for Redistribution

278 THE ASEAN WAY: SUSTAINING GROWTH AND STABILITY
external shocks associated with capital flows, helping contain the buildup of sys-
temic vulnerabilities over time. Capital flow management measures can play a
role under certain circumstances in responding to an inflow surge, provided they
are temporary and not used to substitute for warranted macroeconomic adjust-
ment (IMF 2012, 2017).
CONCLUSIONS
Financial integration of ASEAN economies should be pursued as a critical com-
ponent of financial development. This chapter shows that regional financial
integration in ASEAN economies not only fails to live up to their trade integra-
tion, it also lags financial integration with countries outside the region. When
looking into the drivers of financial integration, the analysis finds that improving
regulatory and institutional quality and reducing restrictions on capital flows can
promote regional financial integration. The chapter also provides empirical evi-
dence that regional financial integration helps ASEAN countries better weather
global shocks, fosters economic rebalancing, and is associated with higher eco-
nomic growth. However, the discussion also underscores the risks and challenges
associated with financial integration.
When advancing financial integration, it is crucial to harness the gains while
minimizing the risks. Close attention must be paid to financial stability. Opening
up financial markets requires, first, stronger domestic financial systems and better
macroeconomic fundamentals and, at the regional level, enhanced information
sharing, stepped-up surveillance and crisis management, and a cross-country
safety net. A gradual approach would therefore be appropriate for promoting
regional financial integration.
REFERENCES
Adrian, T., E. Etula, and T. Muir. 2014. “Financial Intermediaries and the Cross-Section of Asset Returns.” Journal of Finance LXIX: 2557–596.
Almekinders, G., S. Fukuda, A. Mourmouras, J. Zhou, and Y. Zhou. 2015. “ASEAN Financial Integration.” IMF Working Paper 15/34, International Monetary Fund, Washington, DC.
Ananchotikul, N., S. Piao, and E. Zoli. 2015. “Drivers of Financial Integration—Implications for Asia.” IMF Working Paper 15/160, International Monetary Fund, Washington, DC.
Association of Southeast Asian Nations (ASEAN). 2015. ASEAN Economic Community Blueprint 2025. Jakarta: ASEAN Secretariat.
Barro, R., and J.W. Lee. 2011. Costs and Benefits of Economic Integration in Asia. New York: Oxford University Press (Manila: Asian Development Bank).
Bruno, V., and H. S. Shin. 2015. “Capital Flows and the Risk-Taking Channel of Monetary Policy.” Journal of Monetary Economics 71:119–32.
Diebold, F. X., and K. Yilmaz. 2014. “On the Network Topology of Variance Decompositions: Measuring the Connectedness of Financial Firms.” Journal of Econometrics 182:119–34.
Ding, D., W. R. Lam, and S. J. Peiris. 2014. “Future of Asia’s Finance: How Can It Meet Challenges of Demographic Change and Infrastructure Needs?” IMF Working Paper 14/126, International Monetary Fund, Washington, DC.
©International Monetary Fund. Not for Redistribution

Chapter 10 The Future of ASEAN-5 Financial Integration 279
Eyraud, L., D. Singh, and B. W. Sutton. 2017. “Benefits of Global and Regional Financial Integration in Latin America.” IMF Working Paper 17/01, International Monetary Fund, Washington, DC.
Fernández, A., Klein, M., Rebucci, A., Schindler, M., and Uribe, M., 2015. “Capital Control Measures: A New Dataset.” IMF Working Paper 15/80, International Monetary Fund, Washington, DC.
Gochoco Bautista, M. S., and E. M. Remolona. 2012. “Going Regional: How to Deepen ASEAN’s Financial Markets.” ADB Working Paper, Asian Development Bank, Manila.
Guimarães-Filho, R. and G. Hong. 2017. “Dynamic Connectedness of Asian Equity Markets.” IMF Working Paper 16/57, International Monetary Fund, Washington, DC.
International Monetary Fund (IMF). 2012. “The Liberalization and Management of Capital Flows—An Institutional View.” IMF Policy Paper, Washington, DC.
———. 2017. “Increasing Resilience to Large and Volatile Capital Flows: The Role of Macroprudential Policies.” IMF Policy Paper, Washington, DC.
Kim, S., J.-W. Lee, and K. Shin. 2006. “Regional and Global Financial Integration in East Asia.” ADB Working Paper, Asian Development Bank, Manila.
Kose, M. A., E. S. Prasad, K. Rogoff, and S.-J. Wei. 2009. “Financial Globalization: A Reappraisal.” IMF Staff Papers 56 (1): 8–62.
Lucas, R. E. 1990. “Why Doesn’t Capital Flow from Rich to Poor Countries?” American Economic Review 80 (2): 92–6.
Obstfeld, M., and A. M. Taylor. 2004. Global Capital Markets: Integration, Crisis, and Growth. Cambridge: Cambridge University Press.
Papaioannou, E. 2009. “What Drives International Financial Flows? Politics, Institutions and Other Determinants.” Journal of Development Economics 88 (2): 269–81.
Park, D., and K. Shin. 2016. “Financial Integration in Asset and Liability Holdings in East Asia.” Emerging Markets Finance and Trade 52 (3): 539–56.
Pongsaparn, R., and O. Unteroberdoerster. 2011. “Financial Integration and Rebalancing in Asia.” IMF Working Paper 11/243, Washington, DC.
Portes, R., and H. Rey. 2001. “The Determinants of Cross-Border Equity Flows.” Journal of International Economics 65 (2): 269–96.
Volz, U. 2016. “Regional Financial Integration in East Asia against the Backdrop of Recent European Experiences.” International Economic Journal 30 (2): 272–93.
©International Monetary Fund. Not for Redistribution

This page intentionally left blank
©International Monetary Fund. Not for Redistribution

281
A
Access, to financial system, 54, 55f
Accountability
by central banks, 16
macroprudential policy and, 7
Adler, G., 104–5, 106, 109, 110
Adrian, T., 207, 268n11
AEC. See Asian Economic Community
Aggregate Rational Inflation-Targeting
Model, 22
Ahmed, Shaghil, 67n1
Aizenman, J. M., 2, 24, 37–42, 38f, 41f,
105–6
Ajello, A., 181
AML/CFT. See Anti-money laundering
and combating the financing of
terrorism
Ananchotikul, N., 264n7
Anand, R., 111, 225, 243–44
Annual Report on Exchange Arrangements
and Exchange Restrictions
(AREAER), 27
Anti-money laundering and combating
the financing of terrorism (AML/
CFT), 214
APDMOD, 234
AREAER. See Annual Report on Exchange
Arrangements and Exchange
Restrictions
ASEAN-5. See specific topics
ASEAN Plus Three, 259, 259n1, 269
regional financing arrangements of,
277
Asian Bond Market Initiative, 47–48
Asian Economic Community (AEC),
257, 274
Asian financial crisis
bank balance sheet and, 62
bond markets after, 47–48
capital requirements and, 139–40
central banks and, 24
credit growth in, 147, 148–51, 186
credit in, 144–46
financial system and, 45, 45n2, 46–50
financial system regulation after,
46–47, 46n3
GFC and, 24–27, 42
inflation after, 161–62
macroprudential policy in, 148–51, 151f
major reforms since, 46–50
monetary policy in, 15–16
nonperforming loans in, 45
policy rate in, 112–13, 113f, 143
price cycles in, 151
Asset-management companies, 50
Asset prices
balance sheets and, 146
credit and, 6–7
impulse response functions and, 77
inflation of, 103
monetary policy and, 129
principal component analysis and, 68
VIX and, 4, 74
Association of Southeastern Nations-5
(ASEAN-5). See specific topics
B
Balance sheets. See Bank balance sheets
Bangko Sentral ng Pilipinas (BSP), 16,
17, 209
financial system regulation by, 47
inflation forecasting by, 22
interest rate corridor system of, 22
Bank balance sheets, 7, 60f
Asian financial crisis and, 62
asset prices and, 146
impulse response functions and, 77
structural risk in, 60
Bank credit
global shocks and, 75–77
local currencies and, 79–80
macroprudential policy and, 7
principal component analysis and, 68
Bank for Agriculture and Agriculture
Cooperatives, 58
Bank for International Settlements (BIS),
136, 190, 243
on macroprudential policy, 130
Index
©International Monetary Fund. Not for Redistribution

282 Index
Bank Indonesia (BI), 16, 17
Aggregate Rational Inflation-Targeting
Model of, 22
financial system regulation by, 46–47
foreign exchange and, 115–16
Banking Integration Framework, 277
Bank Negara Malaysia (BNM), 16
exchange rates by, 18
financial system regulation by, 47
monetary policy of, 174
price stability by, 18
short-term interest rate and, 18
Bank of Thailand (BOT), 16, 57, 208,
209
financial system regulation by, 47
Macroeconomic Model of, 22
money supply of, 17n4
provisioning rates of, 84n17
supervision by, 58
Bankruptcy laws, 49
Banks
conglomerates of, 57
corporations and, 205–6, 205f
DSGE and, 250–52
fund assets of, 53f
global shocks and, 82–84, 83t
household debt and, 197–201, 199f,
200f, 200t
interest rates of, 82–84, 83t
leverage of, 60, 146–47, 147f
shadow, 4, 51, 52, 53f
See also Capital requirements; Central
banks; Nonperforming loans;
Reserve requirements
Basel core principles, 3, 46
Basel I, 139
Basel III, 9, 207, 208
capital requirements for, 139–40
countercyclical capital buffer, 252
liquidity and, 132
Baseline gravity model, for trade, 263–64,
264t
Bayesian vector autoregression (VAR), 4,
74, 150, 221
Beaudry, P., 240
Benes, J., 111
BI. See Bank Indonesia
BIS. See Bank for International
Settlements
Bitcoin, 214
Blanchard, O., 159
Blinder, A., 167n6
Bloomberg Finance L.P.’s, 201n3, 203
BNM. See Bank Negara Malaysia
Bond markets
access to, 54, 55f
after Asian financial crisis, 47–48
foreign exchange and, 3
global yields from, 5f
in local currencies, 47–48, 49f
Boom-and-bust cycles
countercyclical monetary policy in, 217
global spillovers with, 217
household debt and, 243
spillovers in, 9
Borio, C., 124, 190
BOT. See Bank of Thailand
Break-even inflation rate (BEIR),
159nn1–2
Broad money, 146, 146f
Bruno, V., 142, 268n11
BSP. See Bangko Sentral ng Pilipinas
Business cycles, 73–80
average length of, 124–25, 124t
external factors and, 99
fiscal policy for, 218
foreign exchange market and, 6
macroprudential policy for, 217
C
Caceres, C., 97, 98
Calvo, G., 108
Capital accounts
liberalization of, 276–77
openness of, impossible trinity and, 2,
37–42, 38f, 41f
Capital buffer
countercyclical, 140–41, 140f, 140n6,
230–31, 231f, 232f, 252
requirements for, 141n7
for shocks, 60
Capital conversion buffer, 208
Capital flows, 10
central banks and, 101
domestic financial factors and, 78f–79f
equity prices and, 79
external factors for, 100–112, 101f,
102f
©International Monetary Fund. Not for Redistribution

Index 283
external shocks on, 278
in financial cycles, 100
financial stability and, 142
foreign exchange and, 103–9, 104f,
115f
GFC and, 101–2
global financial factors and, 78f–79f
global shocks and, 77–79
institutional quality and, 266
macroprudential policy and, 142n8,
148n10
management of, 141–42, 141f
monetary policy for, 103
monetary policy response to, 112–16,
113f, 114t, 115f, 116f
risk management of, 277–78
in taper tantrum, 103
VIX and, 4, 74, 269n12, 271f
volatility of, 93–94
Capital gains tax, 48
Capital-oriented tools, for
macroprudential policy, 131–32
Capital producers, DSGE and, 248
Capital requirements, 208
Asian financial crisis and, 139–40
GFC and, 139
macroprudential policy for, 133t
Carrière-Swallow, Y., 97, 98
Cash reserve ratio (CRR), 251
CDRAC. See Corporate Debt
Restructuring Advisory Committee
CDRC. See Corporate Debt
Restructuring Committee
Central Bank of Malaysia Act 2009, 209
Central banks, 16n2
accountability by, 16
Asian financial crisis and, 24
capital flows and, 101
conglomerates and, 56
cryptocurrencies and, 213–14
foreign exchange and, 24, 105–6
fund assets of, 53f
governance structure of, 17t
inflation and, 8, 18, 126, 159, 167
interest rates of, 22–24, 23f
liquidity of, 24
macroprudential policy of, 7, 94
monetary policy of, 15–16, 175
natural real interest rate and, 171
operational autonomy of, 16
transparency of, 16, 24, 25f, 171–73,
172f, 173f
See also Policy rate
Cerra, V., 218
Cerutti, E., 159
Cervantes, R., 58
Chai-anant, C., 111
Chiang Mai Initiative Multilateralization
(CMIM), 10–11
regional financing arrangements of,
277
Chicago Board Options Volatility Index
(VIX), 268n11
asset prices and, 4, 74
capital flows and, 4, 74, 269n12, 271f
global risk aversion and, 74, 75, 80,
96–97
monetary policy and, 67
principal component analysis and, 68
China
in ASEAN Plus Three, 259, 259n1
Asian Bond Market Initiative and, 47
equity markets of, 271n13
external demand from, 67, 75, 90
financial stability in, 84
funding shock in, 84, 88
GDP growth in, 88, 89f
growth slowdown in, 5
real GDP growth in, 88
terms-of-trade growth in, 74
Chinn, M., 2, 24, 37–42, 38f, 41f
Cihak, M., 47, 58
Claessens S., 50
CMIM. See Chiang Mai Initiative
Multilateralization
Coefficient of variation, for exchange rate
volatility, 28–30, 29t
Coibion, O., 160n4
Commodity prices
cycles, 2
inflation and, 32f
terms-of-trade and, 100f
Common equity ratio, 208
Conglomerates
credit for, 230
in financial system, 55–57
Connected lending, regulations for, 46
Contingency planning, 212–13
©International Monetary Fund. Not for Redistribution

284 Index
Coordinated Portfolio Investment Survey,
of IMF, 269n12
Core inflation, 18, 21f, 94, 158, 158f
Corporate Debt Restructuring Advisory
Committee (CDRAC), 49
Corporate Debt Restructuring
Committee (CDRC), 49
Corporations
Asian financial crisis and, 48–50
banks and, 205–6, 205f
debt of, 201–6, 202f–5f
exchange rates and, 204
interest rates and, 204
leverage of, 8, 201
out-of-court workouts for, 3, 49–50
restructuring of, 48–50
shocks to, 203–4
systemic risk of, 201–6, 202f–5f
Countercyclical capital buffer, 140–41,
140f, 140n6, 230–31, 231f, 232f, 252
Countercyclical loan-to-value ratio,
226–30
macroprudential policy and, 229n6
Countercyclical monetary policy, 9
in boom-and-bust cycles, 217
inflation and, 177
Country Financial Stability Maps, 58,
60–61, 61f
Credit
in Asian financial crisis, 144–46
asset prices and, 6–7
broad money and, 146, 146f
for conglomerates, 230
in financial cycles, 144
macroprudential policy for, 132t, 222f
See also Bank credit
Credit cycles, 123
average length of, 124t
credit growth in, 126–27
LTV and, 147–48
macroprudential policy and, 9
prudential measures for, 136, 138
reserve requirements and, 147–48
Credit growth
in Asian financial crisis, 147, 148–51,
186
after GFC, 8, 187, 230
interest rates and, 230
leaning-against-the-wind for, 180
LTV and, 138
macroprudential policy for, 133t, 134t,
147, 148f, 151f
systemic risk of, 186–93, 187f–92f
Credit shocks, 73–80
Credit-to-GDP ratio, 186–87, 189f–92f,
190, 193
Crisis management, 212–13
See also Asian financial crisis; Global
financial crisis
CRR. See Cash reserve ratio
Cryptocurrency, 213–14
Currency
cryptocurrency, 213–14
depreciation, 80
foreign currency exposure, regulations
for, 46
swap arrangement, 10
See also Local currency; Reserve
currency; United States dollar
D
Danaharta, 50
Dao, T., 27n10
Debt financing, by government, 237
Debt service-to-income (DSTI), 135t
De facto capital account openness index,
39–40, 40f, 41f
De facto exchange rates, 28f, 30
De jure capital account openness index,
39
De jure exchange rates, 28f
Dell’Ariccia, G., 186–87
Delloro, V., 111, 225, 243–44
DeLong, J. B., 240
Demirgüç-Kunt, A., 54, 186
De Paoli, B., 96n1
Deposit Insurance Corporation, 213
Deposit rates
global shocks and, 82, 82t
policy rate and, 22
Deposit-to-loan ratio, 59
Detragiache, E., 186
Diebold, F. X., 67n3, 270
Divine coincidence, 179n10
Dollar. See United States dollar
Domestic financial factors, 68n5
capital flows and, 78f–79f
external shocks and, 76f–77f
©International Monetary Fund. Not for Redistribution

Index 285
global financial factors and, 68,
69f–70f, 71t, 126
global shocks and, 72f–73f
local currencies and, 79–80
SVARX and, 119
Drehmann, M., 124, 190
DSGE. See Dynamic stochastic general
equilibrium
DSTI. See Debt service-to-income
Dynamic stochastic general equilibrium
(DSGE), 22, 225
banks and, 250–52
capital producers and, 248
entrepreneurs and, 246–48
government and, 252
households and, 244–46
for leaning-against-the-wind, 220–21
macroprudential policy and, 243–53
market clearing conditions for, 252–53
monetary policy and, 243–53
retail sector and, 249–50
shocks in, 253
structure of, 226f
wholesale sector and, 249
E
Economic cycles
financial cycles and, 190
interest rates and, 93
policy rate and, 5
Effective federal funds rate (EFFR), 100f
Efficiency, of financial system, 54–55,
56f
EFFR. See Effective federal funds rate
Emerging Market Government Bond
Index (EMBIG), 75, 80
Entrepreneurs, 225–26
DSGE and, 246–48
Equilibrium real interest rate, 169n7
Equity markets
financial system integration of, 271,
271n13
spillovers in, 270–71, 272f
Equity prices
global financial factors and, 79
global risk aversion and, 80
interest rates and, 84
Escudé, G., 109–10, 111
Etula, E., 268n11
Europe
liquidity in, 269, 270t
reserve holdings in, 108–9
Exchange rates
by BNM, 18
coefficient of variation for, 28–30, 29t
corporations and, 204
de facto, 28f, 30
de jure, 28f
foreign exchange and, 104–5, 105f,
109–12
free floats of, 27
in GFC, 5
greater flexibility of, 24–30
impossible trinity and, 2, 37–42, 38f,
41f
monetary policy response and, 93–119
reserve buffers and, 115–16
shocks and, 5–6
stability of, 2, 37–42, 38f, 41f
with US dollar, 106
volatility of, 28–30, 29t, 116, 116n6
See also Nominal effective exchange
rate; Peg exchange rates; Real
exchange rate
External blocks, 74
External demand
from China, 67, 75, 90
from US, 67, 75, 90
External factors, 73–80
business cycle and, 99
for capital flows, 100–112, 101f, 102f
SVARX and, 119
External shocks
on capital flows, 278
domestic financial factors and, 76f–77f
impulse response function and, 77–80
VAR for, 74
External stability, 16, 16n3
Eyraud, L., 273
F
FATF. See Financial Action Task Force
Federal funds rate, 80n14, 98
policy rate and, 100f
twelve-month cumulative response to,
99f
Felman, J., 48
Feyen, E., 54
©International Monetary Fund. Not for Redistribution

286 Index
Fibonacci retracement, 204n4
Filardo, A., 180
Financial Action Task Force (FATF), 214
Financial cycles
capital flows in, 100
credit in, 144
economic cycles and, 190
inflation and, 124–25, 125f
macroprudential policy for, 217, 221,
241–42
recognition of, 136
Financial depth, 50–54, 51f–53f
Financial risk, 4
in institutional quality, 264
monetary policy and, 221, 221n5
See also Macro-financial risk
Financial soundness indicators, 59–60,
60t
Financial stability, 58–61, 61f
capital flows and, 142
in China, 84
macroprudential policy for, 123–24,
128, 130–32, 221
monetary policy for, 177–81, 220, 220f
systemic risk and, 185–215
Financial Stability Board (FSB), 52, 213
on macroprudential policy, 130
Financial system
access to, 54, 55f
Asian financial crisis and, 45, 45n2,
46–50
conglomerates in, 55–57
efficiency of, 54–55, 56f
financial depth of, 50–54, 51f, –53f
financial soundness indicators for,
59–60, 60t
in GFC, 45
government ownership of, 57–58
interconnectivity of, 193–201
liberalization of, 275–76, 276f
macro-financial risk for, 60–61, 61f
macroprudential policy for, 58
net interest margins of, 54, 56f
present condition of, 50–58
resilience of, 45–63
z-scores for, 58–59, 59f
Financial system integration
benefits and costs of, 266–74, 268t,
269t, 270f–72f, 273t, 274t
challenges and policy initiatives of,
274–78, 275t, 276f
current state of, 258–62, 258f–62f
drivers of, 262, 267t
of equity markets, 271, 271n13
framework for, 275, 275t
future of, 257–78
global, 273, 273nn17–18
institutional quality and, 264–66,
264n7, 265t, 266f
with portfolios and trade, 10, 10f,
261–62, 262f
rebalancing with, 10, 271–72, 273f
trade baseline gravity model and,
263–64, 264t
Financial system regulation, 3, 9
after Asian financial crisis, 46–47, 46n3
after GFC, 206
systemic risk and, 207–8
Fiscal expansion, in US, 85–88, 87f
Fiscal policy
for business cycles, 218
monetary policy and, 9, 232–39
Fiscal stimulus
inflation and, 177–79, 178f, 237
for infrastructure investment, 234–39,
235f, 236f, 238f
monetary policy and, 233
real GDP growth and, 237
Fit-and-proper rules, 46
Flexible System of Global Models, of
IMF, 234
Forecasting and Policy Analysis System
(FPAS), 109–10, 111t
Foreign currency exposure, regulations
for, 46
Foreign direct investment, 260
z-scores from, 273n17
Foreign exchange
BI and, 115–16
bond markets and, 3
business cycle and, 6
capital flows and, 103–9, 104f, 115f
central banks and, 24, 105–6
ex ante total cost of, 106, 108f
exchange rates and, 104–5, 105f, 109–12
FPAS for, 109–10, 111t
hedging instruments for, 48, 204
inflation and, 110
©International Monetary Fund. Not for Redistribution
Index 287
leaning-against-the-wind and, 103, 109
macroprudential policy for, 111–12
reserve holdings of, 106–9
share of liabilities in total liabilities, 59
share of loans to total loans in, 59
sterilization of, 103, 105–6, 107f, 108t
Forward-looking
GFC and, 2
inflation and, 8f
macroprudential policy, 134t, 148
monetary policy, 15–16, 18, 24, 161
FPAS. See Forecasting and Policy Analysis
System
Free floaters
of exchange rates, 27
peg exchange rates and, 98n5
FSB. See Financial Stability Board
Full employment, inflation and, 177n9
Fund assets of, 53f
Funding shock, in China, 84, 88
G
Galí, J., 128, 159
Gambacorta, L., 180
Garcia Morales, Juan Angel, 7
GDP growth, 2f
in China, 88, 89f
credit growth and, 231f
as domestic financial condition, 74
inflation and, 30, 31f
portfolio investment and, 270f
private sector debt and, 224, 224f, 225t
real cycle and, 241
See also Real GDP growth
Gertler, M., 159
GFC. See Global financial crisis
Ghilardi, M. F., 221
Glick, R., 105–6
Global financial crisis (GFC), 3–4
Asian financial crisis and, 24–27, 42
bank reserve requirements in, 113–15
capital flows and, 101–2
capital requirements and, 139
credit growth after, 8, 187, 230
exchange rates in, 5
financial system in, 45
financial system regulation after, 206
forward-looking and, 2
Great Recession after, 179
inflation after, 32, 158, 164–65, 236–37
macroeconomic policies in, 219–20
macro-financial risk since, 60
monetary policy and, 5, 176f
policy rate in, 143f
systemic risk after, 193
Global financial factors
capital flows and, 78f–79f
domestic financial factors and, 68,
69f–70f, 71t, 126
equity prices and, 79
short-term interest rates and, 75
Global financial integration, 273,
273nn17–18
Global Financial Stability Map, 61, 61f
Global Financial Stability Report (IMF),
187, 193
Global Integrated Monetary and Fiscal
Model, of IMF, 84
Global interest rates
principal component analysis and, 68
US interest rates and, 68n6
Global Projection Model, of IMF, 22
Global risk aversion, 67n1
equity prices and, 80
VIX and, 74, 75, 80, 96–97
Global shocks
bank credit and, 75–77
bank interest rates and, 82–84, 83t
capital flows and, 77–79
deposit rates and, 82, 82t
domestic financial factors and, 72f–73f
financial system integration and, 267
real exchange rate and, 75
sovereign bond yields and, 80–82, 81t
See also Taper tantrum
Global spillovers, 67–90
with boom-and-bust cycles, 217
future of, 84–88
Gorodnichenko, Y., 160n4
Gourinchas, P., 146
Government
debt financing by, 237
DSGE and, 252
ownership of financial system, 57–58
Government bonds, 69f, 71t, 78f
global shocks and, 80–82, 81t
taper tantrum and, 80
yields of, 79
©International Monetary Fund. Not for Redistribution

288 Index
Government Savings Bank, 58
Gravity models, of trade, 262–63
Great Moderation, 126
Great Recession, 179
Gruss, B., 97, 98
Guimarães-Filho, R., 271n13
H
Headline inflation, 18, 20f, 21f, 32, 118,
158, 158f, 168f
Hodrick-Prescott trend, 84, 190
Hoe Ee Khor, 2
Hong, G., 271n13
Household debt, 6, 8
banks and, 197–201, 199f, 200f, 200t
boom-and-bust cycles and, 243
countercyclical LTV and, 227
inflation and, 229, 230n8
leaning-against-the-wind and, 230n8
Taylor rule and, 229
Household debt-to-GDP ratio, 226
Households
DSGE and, 244–46
financial interconnectivity and, 193,
197–201
Housing demand, positive shock on, 228,
228f
I
IMF. See International Monetary Fund
Impatient households, 245
Impossible trinity, 2, 37–42, 38f, 41f
Impulse response function, 68n7
external shocks and, 77–80
of monetary policy, 99
India, 47
Indonesia. See Bank Indonesia; specific
topics
Indonesian Bank Restructuring agency, 50
Indonesian Financial Services Authority,
209
Inflation, 3f
actual and targeted, 20f–21f
after Asian financial crisis, 161–62
of asset prices, 103
BEIR, 159nn1–2
central banks and, 8, 18, 126, 159,
167
challenges for, 165–81
commodity prices and, 32f
contributions from time-varying
parameters, 164f
contributions to, 8f
core, 18, 21f, 94, 158, 158f
countercyclical LTV and, 226–27
countercyclical monetary policy and,
177
drivers of, 157–65, 162f, 162n5, 165f,
166f
financial cycle and, 124–25, 125f
fiscal stimulus and, 177–79, 237
forecasting of, 22
foreign exchange and, 110
forward-looking and, 8f
full employment and, 177n9
GDP growth and, 30, 31f
after GFC, 32, 158, 164–65, 236–37
headline, 18, 20f, 21f, 32, 118, 158,
158f, 168f
household debt and, 229, 230n8
impulse response function and, 99
intermediate target for, 18, 18n7
macroprudential policy and, 7
medium-term objectives for, 18, 18n5
monetary policy and, 2, 7–8, 16–17,
125–26, 157–65, 220, 237
natural interest rate and, 126
natural real interest rate and, 169–71,
169n7, 170f
output gap and, 159, 163, 165, 230
shocks and, 30–32, 30n11, 31f
surveys for, 160, 160n4
Taylor rule for, 94, 95f, 227
in US, 85
volatility of, 166
See also Long-term inflation
Infrastructure investment, fiscal stimulus
for, 234–39, 235f, 236f, 238f, 239f
Institutional quality, 264–66, 264n7,
265t, 266f
Instrumental variables (IV), 273
Insurance companies, 51, 52f, 53f
Integration. See Financial system
integration
Interconnectivity, of financial system,
193–201
Interest rates
of banks, 82–84, 83t
©International Monetary Fund. Not for Redistribution

Index 289
of central banks, 22–24, 23f
corporations and, 204
corridor system, of BSP, 22
credit growth and, 230
economic cycles and, 93
equity prices and, 84
hedging instruments for, 48
monetary policy for, 226
natural, 126, 126n1, 127f
natural real, 169–71, 169n7, 170f
nominal, 228, 228f
parity of, 106
policy rate shocks and, 230, 232f
spillovers to, 80–84, 98
stock price and, 129, 130f
in US, 4, 67, 68, 74n10, 75, 97, 97n4
See also Global interest rates; Policy
rate; Short-term interest rates
Internal blocks, 74
International Monetary Fund (IMF)
AREAER of, 27
Coordinated Portfolio Investment
Survey of, 269n12
Flexible System of Global Models of, 234
Global Financial Stability Report of,
187, 193
Global Integrated Monetary and Fiscal
Model of, 84
Global Projection Model of, 22
on macroprudential policy, 130
reserve adequacy metric of, 101, 116
Ito, H., 2, 24, 37–42, 38f, 41f
IV. See Instrumental variables
Izquierdo, A., 108
J
Jácome, L., 176
Jakarta Initiative Task Force (JITF), 49
Japan
in ASEAN Plus Three, 259, 259n1
Asian Bond Market Initiative and, 47
Jeanne, O., 106
JITF. See Jakarta Initiative Task Force
Jordà, Ò., 223
JPMorgan, 75, 80
K
Kalman smoothing, 126n1, 150, 162f
Kawai, M., 37
Key Attributes for Effective Resolution of
Financial Institutions, 9
for crisis management, 213
Kiley, M., 171
Klapper, L., 54
Klyuev, V., 27n10
Koepke, Robin, 67n1
Koop, G., 240
Korea, in ASEAN Plus Three, 259,
259n1
Kose, M. A., 126
Krung Thai Bank, 58
Kung, R. L., 108
L
Laeven, L., 45nn1–2
Lagged dependent variable, Taylor rule
and, 94
Leaning-against-the-wind
for credit growth, 180
DSGE for, 220–21
foreign exchange and, 103, 109
household debt and, 230n8
Leeper, E. M., 149n11
Leverage
of banks, 60, 146–47, 147f
of corporations, 8, 201
macroprudential policy for, 134t
Levine, R., 54
Lindgren, C., 46n3
Liquidity, 2–3
of central banks, 24
coverage ratio, 208
in Europe, 269, 270t
macroprudential policy for, 132, 133t,
137f
regulations for, 46
SLR, 251
of stock markets, 55
in US, 269, 269t
Lisack, N., 104–5, 110
Litterman, Robert B., 75n12
Loan-to-deposits, 135t
Loan-to-value (LTV), 6–7
countercyclical, 226–30
credit cycle and, 147–48
credit growth and, 138
in GFC, 113
macroprudential policy for, 135t
©International Monetary Fund. Not for Redistribution

290 Index
Local currency
bank credit and, 79–80
bond markets in, 47–48, 49f
domestic financial factors and, 79–80
principal component analysis and, 68
Long-term inflation, 158–62, 159n1,
160f, 161f
expectations for, 174, 175f
Lopez Murphy, Pablo, 3, 8
Lowe, P., 124
LTV. See Loan-to-value
Lucas critique, 149n11
Lucas paradox, 271
M
Macroeconomic Model, of BOT, 22
Macroeconomic policies
in GFC, 219–20
macroprudential policy and, 144–52
for sustained growth, 217–53
Macroeconomic Research Office, 11
Macro-financial risk, 4, 60–61, 61f
Macroprudential policy, 6–7, 6f, 123–53
aims of, 133t–35t
in Asian financial crisis, 148–51, 151f
for business cycles, 217
capital flows and, 142n8, 148n10
capital-oriented tools for, 131–32
of central banks, 94
countercyclical LTV and, 227, 229n6
for credit, 132t, 222f
credit cycles and, 9
for credit growth, 147, 148f, 151f
defined, 221n4
DSGE and, 243–53
evolution of, 136–42, 137f–41f
for financial cycles, 217, 221, 241–42
for financial stability, 123–24, 128,
130–32, 181, 221
for financial system, 58
for foreign exchange, 111–12
forward-looking, 134t, 148
frameworks for, 208–12, 210t, 211f
for liquidity, 132, 133t, 137f
macroeconomic policies and, 144–52
monetary policy and, 9, 142–52, 143f,
143t, 145t, 146f–48f, 150f, 151f,
181, 219–31
for net interest margins, 149, 150f
on real cycle, 241–42
for real estate, 138, 138f, 148, 148f
real GDP growth and, 222f
schema of, 132t
sectoral tools for, 132
for shocks, 9
for systemic risk, 181, 181n11, 208–
12, 210t, 211f
tools for, 131–32
Malaysia. See Bank Negara Malaysia;
specific topics
Managed float regime, 110
Mano, R., 104–5, 106, 109, 110
MAS. See Monetary Authority of Singapore
Medium-Term Macroeconometric Model,
for BSP, 22
Melecky, M., 48
Mendoza, E., 186
Menna, L., 181
Mertens, E., 160n4
Mian, A., 224, 243
Microprudential regulation, 59, 93–94,
206–7, 209, 211
Miranda-Agrippino, Silvia, 68
MMS. See Monetary Model of Singapore
Modified Taylor rule, 227–29, 228f
Mondino, Tomas, 67n1
Monetary Authority of Singapore (MAS),
16, 209
financial system regulation by, 47
MMS for, 22
Monetary Model of Singapore (MMS),
for MAS, 22
Monetary policy
in Asian financial crisis, 15–16
asset prices and, 129
autonomy of, 2, 37–42, 38f, 41f,
97–100, 118–19
of BNM, 174
in boom-and-bust cycles, 9
for capital flows, 103
of central banks, 15–16, 175
DSGE and, 243–53
financial risk and, 221, 221n5
for financial stability, 177–81, 220,
220f
fiscal policy and, 9, 232–39
fiscal stimulus and, 233
forward-looking, 161
©International Monetary Fund. Not for Redistribution

Index 291
frameworks for, 15–42, 34t–36t
GFC and, 5, 174–75, 176f
impossible trinity and, 2, 37–42, 38f, 41f
impulse response function of, 99
inflation and, 2, 7–8, 16–17, 125–26,
157–65, 220, 237
for interest rate, 226
macroprudential policy and, 7, 9,
142–52, 143f, 143t, 145t, 146f–48f,
150f, 151f, 219–31
natural real interest rate and, 170–71
in new normal, 157–82
performance of, 30–32, 31f, 32f
shocks of, 67n2
stock price and, 128–29
two target-two-instrument, 109–12
of US, 4–5, 80n14, 84–85, 86f, 97,
98t, 166–69
VIX and, 67
See also Countercyclical monetary
policy
Monetary policy response
to capital flows, 112–16, 113f, 114t,
115f, 116f
exchange rates and, 93–119
SVARX and, 119
Money laundering, with cryptocurrencies,
214
Money supply, of BOT, 17n4
Muir, T., 268n11
Multiple Equation Model, for BSP, 22
N
Narain, A., 207
Nason, J., 160n4
Natural interest rate, 126, 126n1, 127f
Natural real interest rate, 169–71, 169n7,
170f
NDA. See Net domestic assets
NEER. See Nominal effective exchange rate
Net domestic assets (NDA), 105–6
Net foreign assets (NFA), 105–6
Net interest margins, 54, 56f
macroprudential policy for, 149, 150f
New Keynesian, 220, 225
divine coincidence, 179n10
fiscal stimulus, 178
Phillips curve, 159
NFA. See Net foreign assets
Nier, Erlend, 67n1
Nominal effective exchange rate (NEER),
18, 19, 19f
Taylor rule and, 94
Nominal interest rate, 228, 228f
Nonperforming loans, 205–6, 205f
in Asian financial crisis, 45
leverage and, 60
O
Obstfeld, M., 146
Open capital markets, 2
Ordinary least squares regression, 82n16,
162n5, 272n16
Otrok, C., 126
Out-of-court workouts, for corporations,
3, 49–50
Output gap
countercyclical LTV and, 226
inflation and, 159, 163, 165, 230
Taylor rule for, 94, 95f, 227
Output volatility, 2
Overfitting, with VAR, 75n12
P
Patient households, 244–45
Peg exchange rates, 25
free floaters and, 98n5
US and, 27n10
Peiris, Shanaka J., 5, 111, 221, 225, 243–44
Pension funds, 51, 52f, 53f
Pesaran’s panel mean group estimator,
218n1, 240
Philippines. See Bangko Sentral ng
Pilipinas; specific topics
Phillips curve, 7, 9
for inflation, 159, 163, 169
for interest rate, 229–30
Piao, S., 264n7
Policy rate, 94, 97n2, 177n9
in Asian financial crisis, 112–13, 113f,
143
deposit rates and, 22
economic cycles and, 5
federal funds rate and, 100f
in GFC, 143f
household debt and inflation and, 229
natural interest rate and, 126
NEER and, 143f
©International Monetary Fund. Not for Redistribution

292 Index
real GDP growth and, 171
shock, 230, 232f
in taper tantrum, 113, 143–44
Taylor rule for, 252
in US, 97, 98t, 119, 168
Pongsaparn, R., 111, 271
Podpiera, A., 48
Podpiera, R., 47
Population growth, 273
Portfolio investment, 260, 261f, 263f
GDP growth and, 270f
trade integration with, 10, 10f, 261–
62, 262f
Price cycles, 2, 6, 136
in Asian financial crisis, 151
macroprudential measures for, 138, 147
Price stability, 7, 16, 17
by BNM, 18
Principal component analysis, 68, 70t, 71t
Private sector debt, 223, 223f
GDP growth and, 224, 224f, 225t
medium-term impact of, 242–43
See also Household debt
Provisioning rates, of BOT, 84n17
R
Rafiq , Sohrab, 6
Rancière, R., 106
Real cycle, 123, 124
Asian financial crisis and, 140
GFC and, 140
macroprudential policy on, 241–42
Real estate
housing demand in, 228, 228f
macroprudential policy for, 138, 138f,
148, 148f
taxes on, 6–7
Real exchange rate
global shocks and, 75
US dollar and, 74
Real GDP growth
in China, 88
fiscal stimulus and, 237
impulse response function and, 99
macroprudential policy and, 222f
policy rate and, 171
in recessions, 218–19, 219f, 240–41,
241f
of US, 74, 85
Real natural interest rate. See Natural real
interest rate
Rebalancing, with financial system
integration, 10, 271–72, 273f
Recessions
long-term impact of, 240–41, 241f
real GDP growth in, 218–19, 219f,
240–41, 241f
See also Asian financial crisis; Global
financial crisis
Regional financing arrangements, 277
Regulation. See Financial system regulation
Reserve adequacy metric, of IMF, 101, 116
Reserve buffers, 5–6
exchange rates and, 115–16
Reserve currency, 80
US interest rates and, 97n4
Reserve holdings
in Europe, 108–9
of foreign exchange, 106–9
Reserve requirements, 113–15
credit cycle and, 147–48
macroprudential policy for, 133t, 137f,
138
Retail sector, DSGE and, 249–50
Rey, Hélène, 67, 67n2, 68
Ricci, Luca, 82, 82n16
Risk. See Financial risk; Global risk
aversion; Structural risk; Systemic risk
Risk-weighting assets, 133t, 139f
Roberts, J., 171
Rule-of-law index, 265–66, 265n8
Rungcharoenkitkul, P., 180
S
Saadi Sedik, T., 176
Saenz, Manrique, 9
Safety nets, 10
financial system integration and, 267
Saxena, S. C., 218
Schularick, M., 223
SDA. See Special deposit account
Sectoral tools, for macroprudential policy,
132
Sedik, Tahsin Saadi, 67n1
Shadow banks, 4, 51, 52, 53f
Shadow short rate, 80n14
Shi, Wei, 82, 82n16
Shim, I., 142
©International Monetary Fund. Not for Redistribution

Index 293
Shin, H. S., 142, 268n11
Shocks
capital buffer for, 60
to corporations, 203–4
credit, 73–80
in DSGE, 253
exchange rates and, 5–6
funding, 84, 88
on housing demand, 228, 228f
inflation and, 30–32, 30n11, 31f
macroprudential policy for, 9
of monetary policy, 67n2
policy rate, 230, 232f
technology, 231, 233f
See also Asian financial crisis; External
shocks; Global financial crisis;
Global shocks
Short-term interest rates
BNM and, 18
global financial factors and, 75
Signoretti, F. M., 180
Singapore. See specific topics
Singh, D., 273
Single Equation Model, 98
for BSP, 22
SLR. See Statutory liquidity ratio
Smets, F., 179
Special deposit account (SDA), 251
Spillovers, 4–5
in boom-and-bust cycles, 9
in equity markets, 270–71, 272f
in Global Financial Stability Map, 61
to interest rates, 80–84, 98
See also Global spillovers
Standard Taylor rule, 227–29, 228f
for policy rate shock, 230, 232f
for technology shock, 233
Statutory liquidity ratio (SLR), 251
Stein, J. C., 179
Sterilization, of foreign exchange, 103,
105–6, 107f, 108t
Stock markets, 52–54, 53f
access to, 54, 55f
liquidity of, 55
turnover ratio for, 55, 55n4, 56f
volatility of, 61, 62f
Stock price
interest rates and, 129, 130f
monetary policy and, 128–29
Structural risk, in bank balance sheet, 60
Structural vector autoregression (SVAR),
98, 269n12
Structural vector autoregression with
block exogeneity (SVARX), 119
Sufi, A., 224, 243
Summers, L., 159, 240
Surveillance and monitoring systems, 277
Sutton, B. W., 273
SVAR. See Structural vector
autoregression
SVARX. See Structural vector
autoregression with block exogeneity
Systemic risk
of corporations, 201–6, 202f–5f
of credit growth, 186–93, 187f–92f
with crisis management, 212–13
with cryptocurrencies, 213–14
financial stability and, 185–215
financial system regulation and, 207–8
after GFC, 193
macroprudential policy for, 181,
181n11, 208–12, 210t, 211f
T
Tansuwanarat, K., 111
Taper tantrum, 152
capital flows in, 103
financial system integration and, 267
government bonds and, 80
monetary policy autonomy and, 39
policy rate in, 113, 143–44
Taxes, on real estate, 6–7
Taylor, A., 223
Taylor rule, 5, 93
countercyclical LTV and, 227
for foreign exchange, 109
FPAS and, 109–10, 111t
household debt and, 229
for inflation, 227
for monetary policy autonomy, 97
for monetary policy interest rate, 226
for output gap, 94, 95f, 227
for policy rate, 252
SVARX and, 119
See also Standard Taylor rule
Technology shock, 231, 233f
10-year Treasury bond, US, 68nn6–7, 74,
74n10, 98, 100f, 119
©International Monetary Fund. Not for Redistribution

294 Index
Terms-of-trade
in China, 74
commodity prices and, 100f
Terrones, M., 186
Terrorism, cryptocurrencies and, 214
Thai Asset Management Corporation, 50
Thailand. See Bank of Thailand; specific
topics
Tobal, M., 181
Trade
baseline gravity model for, 263–64,
264t
gravity models of, 262–63
intensity score, 261, 261n3
openness, 273
portfolio investment with, 10, 10f,
261–62, 262f
See also Terms-of-trade
Transparency, of central banks, 16, 24,
25f, 171–73, 172f, 173f
Trend inflation, 174
Trilemma triangles, 24, 26f, 27, 93
Tsatsaronis, K., 124, 190
Turnover ratio, for stock markets, 55,
55n4, 56f
Two target-two-instrument monetary
policy, 109–12
U
Uncertainty, 5, 8
of global spillovers, 84
for inflation, 161
for trend inflation, 174
of US monetary policy, 168
United States (US)
external demand from, 67, 75, 90
financial system integration and, 268t
fiscal expansion in, 85–88, 87f
inflation in, 85
interest rates in, 18, 67, 68, 74n10, 75,
97, 97n4
liquidity in, 269, 269t
monetary policy of, 4–5, 80n14, 84–
85, 86f, 97, 98t, 166–69
monetary policy shocks of, 67n2
peg exchange rates and, 27n10
policy rate in, 97, 98t, 119, 168
real GDP growth of, 74, 85
reserve currency and, 97n4
10-year Treasury bond, 68nn6–7, 74,
74n10, 98, 100f, 119
United States (US) dollar
appreciation of, 84
China and, 88
exchange rates with, 106
real exchange rate and, 74
Unteroberdoerster, O., 271
US. See United States
V
Valencia, F., 45nn1–2
Vector autoregression (VAR), 68, 68n7
Bayesian, 4, 74, 150, 221
for external shocks, 74
overfitting with, 75n12
SVAR, 98, 269n12
SVARX, 119
Verner, E., 224, 243
VIX. See Chicago Board Options
Volatility Index
Volatility, 93–94
of exchange rates, 28–30, 29t, 116,
116n6
of inflation, 166
output, 2
of stock markets, 61, 62f
See also Chicago Board Options
Volatility Index
W
Whiteman, C. H., 126
Wholesale sector, DSGE and, 249
World Bank, 265n8
Worldwide Governance Indicators, 265n8
Wu, Ryan, 9–10
Y
Yilmaz, K., 67n3, 270
Z
Zha, T., 149n11
Zhang, L., 138
Ziegenbein, A., 176
Zlate, Andrei, 67n1
Zoli, E., 138, 264n7
z-scores
for financial system, 58–59, 59f
from foreign direct investment, 273n17
©International Monetary Fund. Not for Redistribution
