the asean economic integration and foreign direct ... · the asean economic integration and foreign...
TRANSCRIPT

The ASEAN Economic Integration and Foreign Direct Investment:
A Case Study of Japan’s FDI on the Automotive Industry
Prepared by Suteera Sitong1
Visiting Scholar, Policy Research Institute, Ministry of Finance, Japan
The author is an Economist at the Fiscal Policy Office, Thailand, and acknowledges financial support for this research from the Policy Research Institute, Ministry of Finance, Japan .
1 The views expressed are those of the author and do not represent the views of the Policy Research Institute or Fiscal Policy Office.

Abstract
This paper documents research on foreign direct investment of the Japanese multinational corporations (MNCs) in ASEAN. The author studies the case of the automotive industry in ASEAN since this industry shares the largest direct investment value in several countries in the region. Apart from documenting research, the in-depth interviews with the strategic players in the automotive industry were conducted to provide an understanding of the automotive industry. The finding is that the current form of economic integration is likely to continue to attract FDI of the Japanese automotive companies into ASEAN. The existing fragmentation in the automotive production has a positive relationship with the direct investment of Japan.
Introduction
Southeast Asia has become the world’s most important foreign direct investment (FDI) region. The inward FDI has been significantly increasing. FDI over the Gross Domestic Product (GDP) in the past two decades increased from 20.6 percent in 1995 to 69.9 percent in 2015 (Table 1). Compared to other regions of the world, it has the highest ratio at 69.9 percent, reflecting an increasing role of FDI to the economic development in the region. ASEAN formed its first economic integration as ASEAN Free Trade Area (AFTA) in 1993 to bring tariffs on goods originating in ASEAN down to facilitate regional trade. Then in 2015 it has transformed into ASEAN Economic Community (AEC) to create a single market and production base to attract more FDI inflows. A single market applies a tariff rate of 0 percent for all ASEAN Member States (AMSs) across borders, and the free flow of goods, services, investment, capital and skilled labor. Table 1 : Asian Destinations of FDI Inflows as a Percentage of Gross Domestic Product (percent)
FDI stock 1995 2013 2014 2015 East Asia 21.0 22.2 22.5 23.2 Southeast Asia 20.6 63.6 67.6 69.9 South Asia 2.5 11.4 11.7 12.6 West Asia 5.3 19.5 21.1 23.6 Developing economies 13.0 26.4 26.9 28.5 World 11.2 31.9 31.8 33.6
Source : ASEAN Foreign Direct Investment Statistics Database as of 5 October 2016 (Data is compiled from submission of ASEAN Central Banks and National Statistical Offices through the ASEAN Working Group on International Investment Statistics (WGIIS).
ASEAN, European Union, Japan, and the USA ranked the highest share of economies in FDI inflows to ASEAN, respectively. Some part of intra-ASEAN FDI is not indigenous but comes from foreign Multinational Enterprises (MNEs) (e.g., from Japan and the United States) operating regional headquarters or the subsidiaries and they turn invest in other AMSs on behalf of the parent companies (ASEAN Secretariat, 2016). The transformation to AEC attracting business has been in the interest of the business sector as can be seen from investor views from company surveys and several studies. The 2017 ASEAN Business Outlook Survey of the U.S. Chamber of Commerce reports that about 87 percent of respondents from the U.S. companies expect the level of trade and investment in ASEAN to increase over the next five years. In addition, the EU-ASEAN Business Council Business Sentiment Survey 2015 reports that investors view ASEAN as a bright spot for future investment and development of their businesses. Besides, the JETRO FY 2015 Survey on the International Operations of Japanese Firms reports that 73 percent of the 895 Japanese firms plan to expand in ASEAN, a percentage significantly

higher than in other locations. However, there are questions about the impact of this regional integration on FDI and how the inward FDI into ASEAN will change overtime. This paper aims to answer the above questions by surveying research on FDI and the economic integration including the experience of the European Union’s single market. The case of FDI of Japanese companies’ inflows in the ASEAN’s automotive industry will be studied to explain the potential impact of the FDI inflows as the FDI of Japanese companies into this industry has the highest share in the manufacturing sector in ASEAN. The in-depth interviews with relevant stakeholders were conducted to provide an understanding about the current situation of the automotive industry and the firms’ production strategy. Reviews of Literature
According to the International Monetary Fund (IMF), FDI is an investment made to acquire a lasting interest in enterprises operating outside of the economy of the direct investor with an effective voice in the management of the enterprise. Equity capital that is provided by the direct investor either directly or through other enterprises related to the investor, the reinvestment of earnings and the provision of long-term and short-term intra-company loans can be classified as FDI. OECD (2008) defines FDI as a cross-border, long-term investment made by a resident in one economy, the direct investor, with the objective of establishing a lasting interest in an enterprise, the direct investment enterprise, that is resident in another economy. UNCTAD (2009) provides two key elements in the definition of FDI: (1) an investment made by a resident of one economy in another economy, with a lasting interest, and (2) the investor has a significant degree of influence on the management of the enterprise. IMF’s Glossary of Foreign Direct Investment Terms and Definitions describes that scope of FDI to include the subsidiaries, associates, and branches of the direct investor, in which the foreign investor owns 10 percent ownership or more of the voting power.2 Although the criterion of 10 percent is set, some countries do not apply this threshold for defining FDI. 3 Bank of Japan explains the Direct Investment based on the BPM5 issued by the IMF as all transactions (investment) between direct investors and direct investment enterprises, including acquisition of equity capital, reinvested earnings, and lending/borrowing of funds, with 10 percent of ownership or more4. However, data from 2014 onward applied the IMF’s sixth edition of the Balance of Payments and International Investment Position Manual (BPM6) which defines direct investment as “a category of cross-border investment associated with a resident (DI) in one economy having control or a significant degree of influence on the management of an enterprise (DIE) that is resident in another economy.” 5
In terms of types of FDI, OECD determined based upon the purpose of direct investment. There are mainly four types of operations that qualify as FDI: (1) purchase/sale of existing equity in the form of mergers and acquisitions (M&A); (2) greenfield investments which refers to new investments; (3) extension of capital (additional new investments); and (4) financial restructuring which refers to investment for debt repayment or loss reduction. The two basic types mostly raised in various issues
2 https://www.imf.org/external/np/sta/di/glossary.pdf 3 Wong and Adams (2002) find that some countries apply other criterion. For example, FDI in China and Malaysia refers to the companies in which foreign investors hold more than 25 percent and 50 percent, respectively. 4 Bank of Japan, Explanation of “Balance of Payments Statistics (Data Based on the BPM5)”. Available at https://www.boj.or.jp/en/statistics/outline/exp/exbs02.htm/ 5 Bank of Japan, Explanation of “Balance of Payments Statistics (Data Based on the BPM6)”. Available at https://www.boj.or.jp/en/statistics/outline/exp/exbpsm6.htm/

are M&A and greenfield investments. In addition, FDI across sectors can be classified into vertical FDI and horizontal FDI. The former refers to FDI where the firms operating the same activities in many countries while the latter refers to the firms where the firms operate a different stage of production in different countries.
The well-known theory related to the MNE is the theory of international production of Dunning (1979). He used ownership, locational, and specific variables to explain the industrial pattern and international production in several countries in 1970. Three eclectic approaches are to determine the ownership advantages, location advantages, and internalization advantages.
Some literature explains the factors determining FDI in ASEAN. Overall, the determinants of FDI inflows to ASEAN indicate the cost of production, especially the labor cost. Koojaroenprasit (2015) explored the determinants of FDI inflows for ASEAN 6 (Indonesia, Malaysia, the Philippines, Singapore, Vietnam and Thailand) and employed a random effects model using the panel data set from 1997-2012. The results found that real GDP per capita and an increase in R&D have a significant positive impact on FDI inflows. Conversely, a higher corporate tax rate and higher labor cost lowered FDI inflows. Okapanom, T. and Sricharoen, T. (2016) study twenty countries investing in Thailand and find that the factors affecting FDI include 1) previous year GDP growth rate, 2) government expenditure, 3) export value, and 4) import value. FDI has a positive relationship with previous year GDP growth rate, average minimum income, and domestic inflation while having a negative relationship with government expenditure and taxation.
According to AEC Blueprint, AEC is the establishment of a single market and production base to facilitate businesses’ movement of factors of production within ASEAN. A single market lifts the barriers of the movement of goods, services, investment, capital, and skilled labor across borders. As ASEAN Single Market is the main outcome of the economic integration in AEC, it is worth looking at the experience of European Union and FDI. There are several studies on the impact of single market of European Union on the FDI inflows in EU. Galgua and Sekkat (2004) study the impact of the Single Market Program on FDI inflows to Europe by conducting the study at the sector level. They find the potential explanations that the impact of the Single Market Program differs across countries and sectors. They also find that the industrial specialization story may not be the right answer to differences across countries, but the functioning of institutions.
Yannopoulos (1990) studies the effects of the single market on the pattern of Japanese Investment. He assesses the extent that Japanese firms can take advantage by looking at the comparative advantage in innovative activity. Using a measure of revealed technological advantage of Dunning and Cantwell (1989), he finds the pattern in location advantage and the ownership advantage. Firstly, the changes in the location advantages of EU markets lead to the trend of investment more in manufacturing, especially in motor vehicles. The pattern of automakers’ operation in the European Community was that they consider the single market as the established one, and choose to locate production sites that offer the most advantageous cost for each production process. For example, Nissan has located its financial and regional headquarters in the Netherlands, distribution center in Belgium, passenger car production in Britain, and commercial vehicles division in Spain. Toyota is likely to have the same pattern. Secondly, the strong ownership advantages by Japanese in electronics and motor vehicles come from a success in organizing contractual networks. These networks bring several groups of small producers to supply sourcing and sub-contracting services to the large firms.

Globalization has transformed the world by introducing a new way to lower cost of production for the global firms. Baldwin (2012) described globalization as two unbundlings. The first and second unbundlings were the results of the stream or transport revolution and the Information and Communication Technology (ICT) revolution, respectively. The former unbundling improved the poor transportation and allowed the production and consumption to separate in the 1830s. The cheaper cost of transportation made it feasible to produce on a large scale resulting in profitability from the economies of scale and comparative advantage gained from the said separation. The second unbundling began when the technology advancement, such as internet, results in reducing cost which enables the coordination in international production and leads to the fragmentation. Fragmentation refers to separating an integrated production process into more components or fragments with the use of the service sector (Arndt and Kierzkowski, 2001). This global pattern of production as the effect of globalization has changed the fragmentation process from within nations in the past into vertically integrated production among countries. The fragmentation production across national borders has been enabled with the cost reduction from the transportation and telecommunications technologies, liberalization of international trade in services, convergence of legal and regulatory systems, and an increase in establishment freedom (Arndt and Kierzkowski, 2001). The international fragmentation separates the integrated production process into each stage allowing a gain from specialization in each country’s stage of production. The theory of fragmentation of production is mainly focused on the geography and this is the new type of international trade.
Figure 1 : The International Fragmentation Production
Fragmentation Production Processes
Fragmentation
Source : Kimura, 2005
In the literature, the international production networks are mostly located where there are gaps in the stage of development. Kimura (2006) observed the transactions of machinery parts and components and found the active back-and-forth transactions among countries with different development stages and income levels.
The pattern of the modern international production has been more complex as many production sites participate in the global production. This has created a more complex global supply chain. However,
PB
PB PB
PB
PB
Large integrated factory
PB = Production Blocks
SL = Service Links
SL
SL SL
SL SL

there is an attempt to indicate the value of the global supply chain. OECD (2012) described that the concept of Global Value Chain (GVC) was introduced in the 2000s for capturing the world’s international fragmentation of production. It also examined the position of countries in the international production network by developing indicators to give a more accurate picture of GVCs position in six industries. These six industries include agriculture and food products, chemicals, electrical and computing machinery, motor vehicles, business services and financial services.
An Overview of Inward FDI in ASEAN
ASEAN’s Inward FDI The Association of Southeast Asian Nations (ASEAN) comprises ten nations. It can be divided into two groups; the ASEAN 6 - Brunei, Indonesia, Malaysia, Philippines, Singapore, Thailand – and the so called CLMV countries – Cambodia, Lao PDR, Myanmar and Vietnam. Rapid economic growth of several ASEAN members since the 1970s has attracted direct investment to ASEAN members. ASEAN took the first step in economic integration as ASEAN Free Trade Area (AFTA) in 1993. The FDI inflows to AMSs have seen development since 1993 (Figure 3). The ASEAN Framework Agreement on Services (AFAS) was signed and implemented in 1995. However, FDI started to deteriorate in 1998, a year after the 1997 Asian financial crisis which erupted in Thailand and spilled over to the AMSs in the region. Thailand, Malaysia, Philippines, and Indonesia had been adversely affected by the crisis. In 1998, ASEAN attempted to establish the ASEAN Investment Area to attract the direct investment flows to the region by signing the Framework Agreement on ASEAN Investment Area (AIA). From the literature, China became one of the fastest growing economies with an average economic growth of 9.5 percent in the 1980s (Shang-Jin Wei, 73). Then, Chinese economy boosted after China’s accession to the World Trade Organization in 2001. With the rise of China in the 1990s, the concern of FDI redirection from ASEAN to China was one of the major driving forces behind the ASEAN leaders’ decision in 2003 to establish an AEC in 2020 (see INTAL, 2015). The decision for establishing AEC in 2003 attracted FDI inflows and resulted in an increasing FDI in 2003 and a few year after that. The development of ASEAN economic integration appeared in 2007 as the AEC Blueprint was approved and the establishment of the AEC was accelerated to 2015. However, a year after, the shock of the 2008 financial crisis decreased FDI inflows in 2008 and 2009. ASEAN Trade in Goods Agreement (ATIGA), aiming to achieve the free flow of goods in ASEAN, was signed to replace AFTA’s Common Effective Preferential Tariff Scheme (CEPT) in 2010. This made ASEAN 6 including Brunei, Indonesia, Malaysia, Philippines, Singapore, and Thailand eliminate intra-ASEAN import duties on 99.65 percent of their tariff lines, while CLMV reduced their import duties to 0-5 percent on 98.86 percent of their tariff lines. Another important agreement, ASEAN Comprehensive Investment Agreement (ACIA), was implemented in 2012 while the FDI started to further grow in the same year and remain at the same level until the year 2015. FDI has started to grow dramatically since 2010 and reached $0.12 trillion in 2015.

Figure 2 : Foreign Direct Investment : Inward FDI Stocks, Annual, 1970-2015 (Millions USD)
Source : UNCTADstat
Several ASEAN countries adopt the export-led growth strategy. That is, the countries accelerate the export sector in the export-led growth model. At the same time, ASEAN countries also promote the export sector by liberalizing FDI to ease the direct investment of foreigners. Five countries in ASEAN including Indonesia, Philippines, Malaysia, Singapore, and Thailand succeed in attracting FDI. It is noted that in the case of Philippines the inward FDI amount was smaller than the others since foreign investors were not welcome (Diaconu L., 2014). Government in these countries encourages export-oriented FDI by employing a policy to ease the regulation on foreign investment. The statistical information, during the period of 1980-2015, in table 2 shows that Singapore attracts half of ASEAN’s FDI in the recent year. This followed by Indonesia, Thailand, and Malaysia with the share of 8.3 - 14.0 percent.
Table 2 : Average of FDI Inward Stock by Country, 1980-2015 (Millions USD)
1980-1999 1990-1999 2000-2009 2010-2015
Inward FDI % share Inward FDI % share Inward FDI % share Inward FDI % share
Brunei 17 0.1% 1,005 0.7% 3,131 0.6% 5,528 0.4%
Cambodia 38 0.1% 535 0.4% 2,642 0.5% 9,594 0.6%
Indonesia6 5,753 20.0% 20,123 14.1% 45,020 9.2% 206,762 14.0%
Lao PDR 2 0.0% 233 0.2% 888 0.2% 2,992 0.2%
Malaysia 6,489 22.6% 28,426 19.9% 53,502 10.9% 123,135 8.3%
Myanmar 10 0.0% 1,583 1.1% 5,985 1.2% 16,848 1.1%
Philippines 2,342 8.2% 6,878 4.8% 15,689 3.2% 42,763 2.9%
Singapore 11,672 40.7% 61,807 43.2% 274,628 55.9% 826,906 55.8%
Thailand 2,347 8.2% 16,794 11.7% 64,309 13.1% 168,958 11.4%
Vietnam 41 0.1% 5,764 4.0% 25,708 5.2% 78,332 5.3%
Total 28,711 100% 143,148 100.0% 491,502 100.0% 1,481,817 100.0% Source : UNCTADstat

In a recent year, ASEAN, EU, and Japan were the sources with the highest share in FDI inflows to ASEAN (Figure 3). The higher share of intra-ASEAN FDI also comes from the strategy non-ASEAN MNEs adopt to set up a local company and use it to invest in another country within the region.
Figure 3 : Top Ten Sources of Foreign Direct Investment Net Inflows in ASEAN in 2015
Source : ASEAN Stats Database
The FDI inflows to ASEAN classified by sector in 2014-2015 show that financial and insurance, manufacturing, wholesale and retail trade sectors are the three most important recipients of FDI. FDI in financial and insurance, and in wholesale and retail trade declined while FDI in manufacturing increased by 62 percent in 2015 (Table 3). Analyzing FDI flows to three economic industries: primary, manufacturing, and services, there was a decline in the services industry, but an increase in manufacturing industries (ASEAN Secretariat, 2016). The highest share industries are service, manufacturing, and primary industries, which comprise 60 percent, 24 percent, and 12 percent of the total FDI inflows.

Table 3 : FDI Inflows by Industry, 2014-2015 (Millions of Dollars)
Industry 2014 2015 2014
(% yoy) 2015
(% yoy) 1. Primary 12,894 14,713 6 14
Mining and quarrying 7,660 7789 -5 2 Agriculture, forestry, and fishing 4,716 4,971 102 5 Electricity, gas, steam and air conditioning supply 429 1,983 -64 362 Water supply, sewerage, waste management and remediation 89 -30 -85 -1342. Manufacturing 18,012 29,099 -53 623. Services 94,874 73,081 34 -23
Financial and Insurance 45,642 39,324 65 -14 Wholesale and retail trade, repair of motor vehicles and motor cycles 20,527 11,157 22 -46 Real estate 10,088 9,242 6.6 -8 Other services 11,224 6,151 7 -45 Transportation and storage 2,743 3,282 -2 20 Information and communication 1,298 1,826 -28 41 Construction 1,779 997 161 -44 Accommodation and food service 199 471 838 136 Professional, scientific and technical 898 247 117 -72 Human health and social work 209 134 61 -36 Education 53 2 -20 -97 Arts, entertainment and recreation -36 -14 -116 -60Unspecified 4,215 3,927 32 -7Total 129,995 120,819 4 -7
Source : ASEAN Stats Database
The FDI is on a net basis, and computed as follows: Net FDI = Equity + Net Inter-company Loans + Reinvested Earnings. The net basis concept implies that the following should be deducted from the FDI gross flows: (1) reverse investment (made by a foreign affiliate in a host country to its parent company/direct investor; (2) loans given by a foreign affiliate to its parent company; and (3) repayments of intra-company loans (paid by a foreign affiliate to its parent company). As such, FDI net inflows can be negative.
As ASEAN, EU, and Japan have recently been the top three sources of FDI inflows, it is necessary to analyze their inflows classified by sector in each region. Firstly, ASEAN shared the highest FDI inflows in 2015 at 18.4 percent of the total flows, with 26 percent in manufacturing sector, 20 percent in agriculture, forestry, and fishing sector, and 18 percent in financial and insurance sector. Secondly, EU was in second place at 16.7 percent of the total flows and invested 43 percent in other services sector, 23 percent in wholesale and retail trade sector, and 14 percent in manufacturing sector. Finally, Japan’s FDI comprised 14.5 percent of the total inflow and flows 49 percent, 16 percent, and 13 percent to manufacturing sector, financial and insurance sector, and wholesale and retail trade, respectively. In the broad picture, FDI mainly flowed to manufacturing sector, financial and insurance sector, and wholesale and retail trade sector. ASEAN and Japan’s FDI concentrate on manufacturing (Table 4).

Table 4 : Top Five Industries of FDI Inflows in 2015
World ASEAN 33% Financial and Insurance 26% Manufacturing 24% Manufacturing 20% Agriculture, forestry, and fishing 9% Wholesale and retail trade 18% Financial and Insurance 8% Real estate 14% Real estate 6% Mining and quarrying 6% Information and communication
EU Japan 43% Other services 49% Manufacturing 23% Wholesale and retail trade 16% Financial and Insurance 14% Manufacturing 13% Wholesale and retail trade 8% Mining and quarrying 10% Other services 3% Financial and Insurance 5% Mining and quarrying
Source: ASEAN Stats Database
Among the world’s FDI flows to ASEAN, service industry received FDI most from EU, manufacturing industry received FDI most from Japan, and primary industry received FDI most from ASEAN (Figure 4). Comparing to the previous year, the 2015 service industry’s FDI flows from the world, ASEAN and EU declined, but that from Japan increased. FDI flows from the world, EU, and Japan to manufacturing industry saw a rise in 2015 while that from ASEAN adversely saw a drop. As for the primary industry, the FDI flows from the world, ASEAN, and Japan improved in 2015, but that from EU deteriorated. In short, the world’s FDI to ASEAN shows an improvement in manufacturing and primary industries. The FDI to manufacturing industry from the world, EU, and Japan, started to increase dramatically in 2013, the year after ACIA was implemented (Figure 4).
Analyzing the inward FDI of each AMS, the inward FDI is grouped into three periods; the period before the Blueprint in 2004-2007, the period of the Blueprint implementation in 2008-2011, and the period after ACIA came into force in 2012-2015. The average growth of the inward FDI in the 2012-2015 period that ACIA was implemented shows a positive growth in CLMV, Philippines, and Thailand. Some AMSs, which are Lao PDR, Philippines, Thailand, and Vietnam, experienced a continuous growth from the previous period. Others AMSs faced a decline in the level of inward FDI growth. The growth of inward FDI to Cambodia and Singapore has continuously dropped since the period of the Blueprint implemented in 2008-2011. Note that Myanmar undertook political reforms in 2011-2015, embarking on policy reforms of foreign investment laws resulting in the huge increase of inward FDI (Allchin, 2011).

Figure 4: World’s FDI Flows to ASEAN, by Industry in 2015 (Millions of Dollars)
Source : ASEAN Stats Database
Figure 5: FDI Flows to ASEAN, by Industry in 2012-2015 (Millions of Dollars)

Source : ASEAN Stats Database
Recent Trend of Intra-ASEAN FDI
The FDI in ASEAN can generally be viewed into two sources of FDI. The first one is FDI from extra-ASEAN region, such as the direct investment in a form of Multi National Enterprises (MNEs). The second type refers to the FDI from intra-ASEAN region, which is mostly the local companies and the subsidiaries of the extra-MNEs located in any AMC.
Intra-ASEAN was the major source of FDI in 2015, followed by EU, Japan, USA, and China. Singapore was the largest recipient of FDI inflows and the main source of intra-FDI. However, most of these FDI flows to other AMSs were through equity financing. In the same year, ASEAN attracted US$ 121 billion of FDI, and 62.1 percent was in the services sector, followed by 24.2 percent in manufacturing sector. In terms of trade, the intra-ASEAN trade became the largest share of ASEAN’s total trade in 2015, followed by China, Japan, EU, and USA, respectively. The allocation of FDI among sectors varies among countries.

Most FDI inflows to Singapore, Indonesia, and Philippines are more in services sector while FDI inflows to Thailand, Malaysia, and Vietnam are more in manufacturing sector.
The figures in Table 5 show that extra-ASEAN FDI has remained the important source of most of the inward FDI in ASEAN, for both ASEAN 6 and CLMV. However, the trend of intra-ASEAN FDI has increased over time in both ASEAN 6 and CLMV, while that of extra-ASEAN FDI has declined. Intra-ASEAN region also increased its role in CLMV. It is based on classification into ASEAN 6 and CLMV, on average. Extra-ASEAN FDI inflows accounted for around 83 percent of the total FDI inflows, while FDI inflows from intra-ASEAN accounted for around 17 percent of the total FDI inflows. The figures show that Intra-ASEAN FDI has been playing a greater role on CLMV than extra-ASEAN FDI does. This also reflects the case of indirect investment by extra-ASEAN FDI that sometimes starts by entering in one nation such as in Singapore and then starts to invest in CLMV.
Table 5 : ASEAN Destinations of FDI Inflows Classified by Group (% of total FDI inflows)
Intra-ASEAN Inflows Average of 2013-2015 2013 2014 2015 ASEAN 6 15.8 14.2 16.5 16.6 CLMV 26.0 27.7 21.4 28.9 ASEAN 17.0 15.7 17.0 18.4
Extra-ASEAN Inflows Average of 2013-2015 2013 2014 2015 ASEAN 6 84.2 85.8 83.5 83.4 CLMV 74.0 72.3 78.6 71.1 ASEAN 83.0 84.3 83.0 81.6
Source : ASEAN Foreign Direct Investment Statistics Database as of 5 October 2016 (Data is compiled from submission ofASEAN Central Banks and National Statistical Offices through the ASEAN Working Group on International Investment Statistics (WGIIS). Note : ASEAN 6 consists of Brunei Darussalam, Indonesia, Malaysia, Philippines, Singapore and Thailand, while CLMV comprises Cambodia, Lao PDR, Myanmar and Viet Nam.
Scrutinizing the FDI inflows classified by country, extra-ASEAN FDI was not the major inward FDI in Myanmar, Indonesia, and Brunei. Extra-ASEAN FDI and Intra-ASEAN FDI in 2015 flowed to Myanmar around 20 percent and 80 percent, respectively. At the same time, Indonesia and Brunei also have seen a higher share of intra-ASEAN FDI at around 60 and 50 percent, respectively. FDI inflows into CLMV and ASEAN in the recent year show that both extra-ASEAN FDI and intra-ASEAN FDI tended to invest more in CLMV (Figure 7), with a slowdown of the extra-ASEAN FDI into ASEAN 6.
Figure 1
FDI inflows, iItra- and extra-ASEAN in 2015 (% of total
Figure 7
FDI Inflows, Intra- and Extra-ASEAN in 2013 – 2015
(USD million)
Figure 6
FDI Inflows, Intra- and Extra-ASEAN in 2015
(% of total FDI inflows)

Source : ASEAN Foreign Direct Investment Statistics Database as of 5 October 2016 (Data is compiled from submission of ASEAN Central Banks and National Statistical Offices through the ASEAN Working Group on International Investment Statistics (WGIIS).
The ASEAN investment report 2016 views that an increase in intraregional investment and the share of FDI in ASEAN come from both foreign MNEs expanding investments in ASEAN host countries, and also ASEAN companies expanding and making new investments in the region as well. Some foreign MNEs (e.g., from Japan and the United States) operate regional headquarters or subsidiaries and they in turn invest in other AMSs on behalf of the parent companies (ASEAN Secretariat, 2016). The investors are not indigenous companies in this case (ASEAN Secretariat and UNCTAD 2015). In addition, the form of intra-ASEAN FDI financing new investment is intracompany loans and equity capital from regional headquarters in one AMS to another AMS (ASEAN Secretariat, 2016).
A Case Study of Automotive Industry
In this section, the impact of the economic integration of ASEAN will be discussed by using a case study of the automotive industry in the region. The development of ASEAN economic integration as AEC shows a positive impact on the automotive industry.
Japan’s Outward FDI into ASEAN
The FDI of Japanese companies has played an important role in the economic development of Southeast Asia for about three decades. Japanese multinational companies have been expanding the local production in ASEAN and China. As for ASEAN, the position of Japan’s FDI classified by country and industry indicates that Japan’s FDI in manufacturing sector of 22,899 USD million, or 57 percent of Japan’s total FDI in ASEAN plays a leading role in 2016. FDI into transportation equipment is the largest sector in the manufacturing sector, with 22,899 USD million or 25 percent of Japan’s total FDI in manufacturing sector. Regarding the transportation equipment,7 the assembly of components into finished vehicles is included in this transportation equipment as well. Thailand is the largest FDI recipient in terms of manufacturing sector with 34,131 USD million or a 36.8 percent share of the total manufacturing sector FDI and almost one third flows to transportation equipment. This reflects that transportation equipment industry attracts Japan’s FDI inflows to the greatest extent. On the other hand, Singapore is the largest FDI recipient as 23,934 USD million or 33.9 percent of the total non-manufacturing sector flows to finance and insurance industry. Overall, based on data in 2016, Thailand is ranked the highest FDI recipient in ASEAN. (Table 6)
Table 6 : Japan’s Outward Direct Investment Position by Country and Industry, 2016
(Unit: USD million)
7 It is noted that International Labour Organization (ILO) explains transportation equipment manufacturing sector as the manufacture of aircraft and other aerospace equipment, railroad equipment, motor vehicles and auto parts, motorcycles and bicycles, and the building, repairing and breaking of ships.

Thailand Singapore Indonesia Vietnam Malaysia Philippines Others8 ASEAN
Manufacturing (Total) 34,131 15,715 16,486 9,523 7,714 8,325 626 92,520
Transportation equipment 10,543 1,358 7,320 1,588 875 1,179 37 22,899
Food 756 5,360 745 402 255 1,734 93 9,346
Iron, non-ferrous&metals 4,323 312 1,569 1,101 740 1,550 47 9,641
Chemicals&pharmaceuticals 2,564 3,279 2,051 866 1,823 302 167 11,053
General machinery 2,836 567 958 977 812 70 9 6,230
Electric machinery 6,908 1,738 900 1,218 1,606 2,621 126 15,116
Other manufacturing 6,201 3,101 2,943 3,372 1,603 868 147 18,235
Non-Manufacturing (Total) 19,430 23,934 10,210 5,128 4,954 5,352 1,565 70,573
Finance and insurance 14,476 0 6,220 3,487 1,829 1,366 920 28,299
Wholesale and retail 3,235 10,854 820 514 600 609 89 16,722
Transportation 330 3,933 337 97 51 43 23 4,814
Communications - 2,798 107 47 829 - - 5,334
Real estate 102 1,722 870 557 89 170 293 3,803
Mining - 749 94 1,308 - - 2,406
Other services 1,286 4,628 1,855 426 1,555 3,163 - 11,601
Total 53,561 39,649 26,696 14,651 12,668 13,677 2,191 163,093
Source : Prepared by JETRO Bangkok from Ministry of Finance Balance of Payments Statistics and Bank of Japan foreign exchange rates at the end of 2016 (1 USD = 117.1 Yen) for the President’s speech on 24 June 2017, Bangkok.
Considering the role of FDI in ASEAN, Japan’s FDI plays an important role in several countries across ASEAN in 2015. Based on data from the ASEAN Secretariat, Japan’s outward FDI in 2015 comprises 52.8 percent of Thailand’s total FDI inflows, 26.3 percent of Indonesia’s total FDI inflows, and 22.3 percent of Malaysia’s total FDI inflows. (Figure 8)
Figure 8 : ASEAN’s FDI Inflows by Country, 2015
8 It is noted that the position of these countries are not available; Cambodia (total 1,184 million), Myanmar (total 883 million), Brunei (total 187 million) and Lao PDR (total 882 million).

Source : Asian Secretariat Statistics
CLMV was successful in attracting FDI. Apart from the attracting factors of production, companies in CLMV enjoy export privileges for developing countries such as GSP from the EU. The data of JETRO’s 2017 survey on business conditions shows the interest of Japanese business in emerging countries such as Myanmar, Cambodia, and Vietnam.
Current position of the automotive industry
According to the International Organization of Motor Vehicle Manufacturers (OICA), the world’s automotive production has been continually increasing since 1999. The share of car production and commercial vehicle production is 76 percent and 24 percent, respectively. ASEAN plays an important
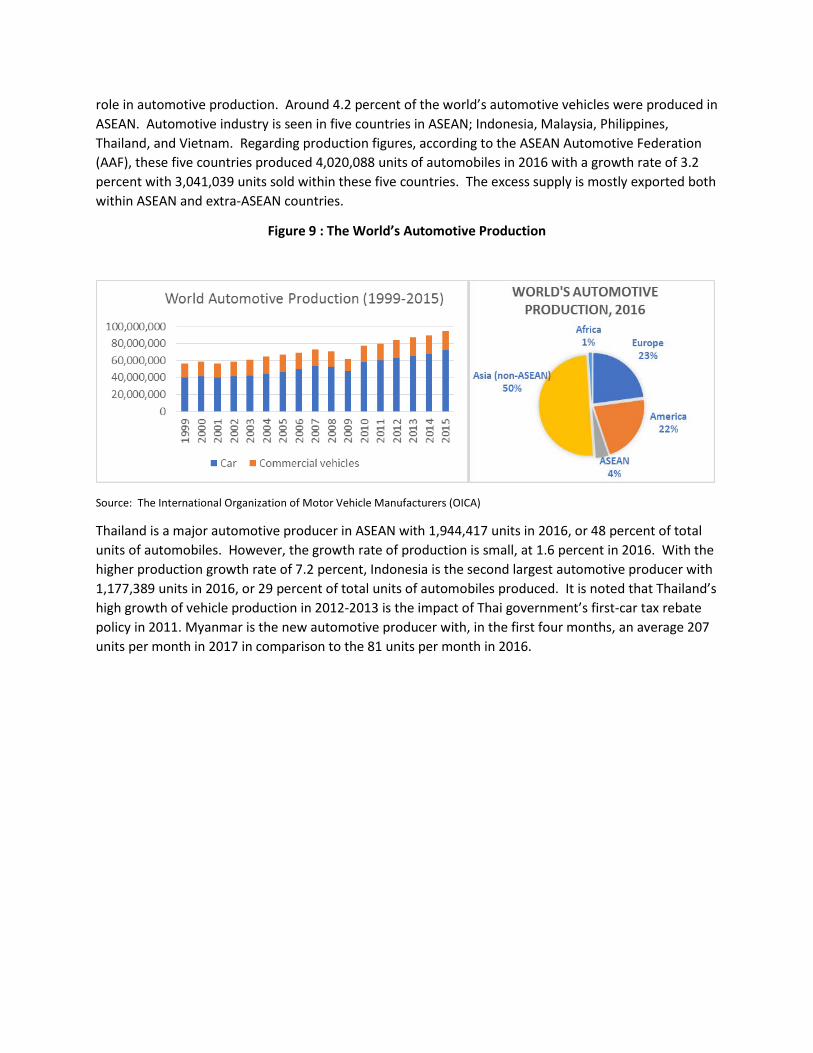
role in automotive production. Around 4.2 percent of the world’s automotive vehicles were produced in ASEAN. Automotive industry is seen in five countries in ASEAN; Indonesia, Malaysia, Philippines, Thailand, and Vietnam. Regarding production figures, according to the ASEAN Automotive Federation (AAF), these five countries produced 4,020,088 units of automobiles in 2016 with a growth rate of 3.2 percent with 3,041,039 units sold within these five countries. The excess supply is mostly exported both within ASEAN and extra-ASEAN countries.
Figure 9 : The World’s Automotive Production
Source: The International Organization of Motor Vehicle Manufacturers (OICA)
Thailand is a major automotive producer in ASEAN with 1,944,417 units in 2016, or 48 percent of total units of automobiles. However, the growth rate of production is small, at 1.6 percent in 2016. With the higher production growth rate of 7.2 percent, Indonesia is the second largest automotive producer with 1,177,389 units in 2016, or 29 percent of total units of automobiles produced. It is noted that Thailand’s high growth of vehicle production in 2012-2013 is the impact of Thai government’s first-car tax rebate policy in 2011. Myanmar is the new automotive producer with, in the first four months, an average 207 units per month in 2017 in comparison to the 81 units per month in 2016.

Source: ASEAN Automotive Federation (AAF)
Regarding sales figures, Indonesia is the largest market with sales of 3,041,039 units in 2016. Indonesia has taken the leading role instead of Thailand since 2014. A high growth of sales in Indonesia is caused by two factors; the Indonesian government’s low-cost green car (LCGC) promotion policy which creates new demand for cars, and an increasing automotive production in Indonesia instead of importing from ASEAN countries (Kobayashi, 2014). AAF reports the first four months’ sales of 479 units in 2017, increasing from that of 294 units in 2016.
Figure 11 : ASEAN’s Automotive Sales, 2010-2016
Source: ASEAN Automotive Federation (AAF)
The units of automobiles that exceed the local sales are normally exported to third countries, mostly to neighboring ASEAN countries. Considering the excess units in 2010-2016, the positive units indicate that Thailand is the largest base of production for export, followed by Indonesia which started in 2014. Conversely, the negative amounts imply the import of automobiles as demand is higher than the local supply. Although there is an automotive industry in Malaysia, Vietnam, and Philippines, these four countries imported vehicles.
Figure 10 : ASEAN’s Automotive Production, 2010-2016

Figure 12 : ASEAN’s Supply Excess, 2010-2016
Source: ASEAN Automotive Federation (AAF)
In the literature, Kobayashi (2014) describes that Thailand and Indonesia are the strategic assembly bases for Japanese and American OEMs and the bases for automobile research and development; for example, Nissan uses Thailand as an export base to ASEAN, Europe, Japan, and Australia. (Table 5.1)
Table 5.1 Thailand and Indonesia as Strategic Assembly Bases for Japanese OEMs
Thailand Indonesia Manufacturers Export Destinations Manufacturers Export Destinations Toyota Toyota’s Intelligent International
Multi-Purpose Vehicle (IMV) project produces vehicles that are mainly exported within ASEAN and the Middle East.
Toyota Toyota’s Intelligent International Multi-Purpose Vehicle (IMV) project produces vehicles that are mainly exported within ASEAN and the Middle East.
Honda The Accord is shipped to ASEAN markets and Australia. Brio is produced to fulfill the criteria for the Thai eco-car standard.
Honda Brio Satya (LCGC policy) is produced for the domestic market. Freed is exported to Thailand and Malaysia.
Nissan Nissan uses Thailand as a strategic export base especially for the March and Almera, which are exported to ASEAN, Europe, Japan, and Australia.
Nissan Produces the Livina MPV and the Juke SUV in Indonesia.
Mitsubishi Triton is exported to the world except in North America, while the Mirage is exported globally.
Daihatsu MPV Xenia and Avanza are exported to ASEAN, South Africa, and some countries in the Middle East. Agya (LCGC policy) is exported to Philippines.
Mazda Mazda2 and Mazda3 are produced in Thailand for the domestic and ASEAN markets. BT-50 pickup truck is sold domestically, ASEAN, and Australia.
Suzuki Suzuki uses Indonesia as its strategic base to produce Swift, the Grand Vitara SUV, and the MPV Ertiga for the ASEAN market.
Isuzu D-Max pickup trucks are exported toASEAN, Australia, Europe, and Africa.
Source: concluded from Kobayashi, Hideo (2014), Current State and Issue of the Automobile and Auto Parts Industries in ASEAN. Research Institute Auto Parts Industries, Waseda University.

5.2 ASEAN’s Automotive Industry
Automotive industry consists of the automobile original equipment manufacturers (OEMs) and the supplier industry. There are about 30,000 parts of a single car. Some parts are made by the assembler, and others are made by suppliers with a lot of research and development (Totoya, 2017).
The automotive production in ASEAN uses the intra-regional parts supply. The automotive production in Thailand, Indonesia, and Malaysia are among the world’s automotive producers. In this automotive industry, the fragmentation of production has already taken place for decades (De Backer, K. and S. Miroudot, 2013). They find that the GVCs are very prominent in this industry since the length index or the index of the number of production stages is above 2.5, given the index for a final industry without production stages equals 1, confirms the importance of vertical linkages between the automotive industry and other industries. Besides, the length index explains the number of production stages by classifying into two categories; Domestic, and International stage of production. The finding is that, in 2008, Thailand, Singapore, Cambodia, and Vietnam have greater vertical linkage with the international production abroad than Malaysia and Philippines. The reasons for the lower level of vertical linkage are that Malaysia has its own national car, Proton, and the automotive industry in Philippines was not encouraged to produce locally and imported vehicles instead of producing locally.
Figure 13 : World’s Automotive Production Ranking, 2015
Source: The International Organization of Motor Vehicle Manufacturers (OICA)
The value chain of motor vehicles mainly consists of the automobile original equipment manufacturers (OEMs) and the supplier industry. At the top are the large automotive manufacturers, or assemblers, or the OEMs. The lower level is the tier one or the first-tier suppliers, the parts suppliers who associate with the lower level suppliers, produce automotive parts, and directly sell them to the OEMs. For example, Thailand has approximately 18 assemblers, 709 tier-1 suppliers, and 1,700 tier-2 and tier-3 suppliers.

Figure 5.2 Structure of Thailand’s Automotive Industry Supply Chain
Source: Adjusted from Thai Autoparts Manufacturers Association, 2014
As assemblers apply the strategy of operation on a global scale, this means when assemblers invest in a new location, the suppliers in the supply chain appear to invest nearby the plant at the same time. In the literature, De Backer, K. and S. Miroudot (2013) refer to the literature of Sturgeon and Florida (2004) that the suppliers have increasingly developed into global suppliers since lead firms increasingly demand that their largest suppliers have a global presence and system design as a precondition to being considered as a source for a complex part or subsystem.
According to the survey report on overseas business operation by Japanese manufacturing companies, 82.9 percent of 114 companies in the automotive industry report that they manage the procurement of the parts supply over the next three years by increasing the procurement rate in the country that the company is located in, reflecting a strong local procurement intention.
Economic integration and the automotive industry
The economic policy in ASEAN has changed step by step beginning with the first economic integration policy of AFTA with the five member countries. The second step is the entry of the AEC in 2015 which has been operated by liberalizing the factors of production and removing intra tariffs to integrate all member states’ markets into a single market and a single production. The tariff-free area among ASEAN states results in reducing the local producer’s cost and indirectly attracts foreign investors to invest within the region. In the literature, Dunning (1981) explains the economic integration results in two advantages; the location-specific advantages of countries in the trading bloc, and the ownership specific advantages across international firms. These advantages in ASEAN attract inward FDI into ASEAN region.
In the interviewing of Japanese assembling companies, the author asked representatives whether the companies adopt the fragmentation production strategy in ASEAN region. Observing the answer from them, the findings are that not all assemblers can operate the fragmentation of production. This depends on the size of the assemblers. In case of a small assembler, the company positions itself as an assembler and does not invest in the production of automotive parts and components. It tends to rely on suppliers who produce the automotive parts supply. The FDI strategy is to invest in the new location and encourage the supplier to invest in the same or nearby location. However, as for the large assembling company, the company separates each production stage in a different country. As a result, the automotive parts such as CKD kit are delivered from one country to another country.
18 Assemblers
Tier 1 : foreign majority 54% Thai majority 23% Thai 23% (709 companies)
Tier 2,3 : Local Suppliers (1,700 companies)

Automakers invest in ASEAN with the main objective to serve the local market. The exceeding supply is managed to export to the other markets, especially neighboring countries. Thailand, Indonesia, and Philippines are considered the supply base for assemblers while Thailand, Indonesia, Philippines, and Myanmar are known as the base of export to third countries in ASEAN (JBIC, 2016).9
With the greater market of the consumer in ASEAN, the automakers expand their market by setting up the plants in emerging economies in ASEAN to serve a local market. The automotive parts suppliers, especially tier 1 suppliers, are encouraged by the assembler to set up nearby the assembler’s new plant. However, in these countries, the supply chain of automotive industry in the beginning may not be ready due to several reasons. For example, insufficient infrastructure such as road or port which increases the risk of production to take a longer time, the quality control, and human resources which may not fit the requirement of the automaker and parts suppliers.
Automakers also have a strategy of shipping the complete knocked down (CKD) from one country to another country. This method allows the assembler to control the quality of production in the new location, minimize the cost of shipping freight, and manage capacity of the production within ASEAN region. For example, an automaker in Japan exported CKD kit to assemble in an ASEAN state. In the literature of Kobayashi (2014), Kobayashi found that Honda and Nissan set up plants in Vietnam but they operated through CKD assembly while Corolla, Camry, and Vios were only produced from CKD kits in Vietnam due to a quality issue.10 CKD kit is a complete kit for assembling a car. This means the complete parts of a car are imported/exported to be assembled in a country destination. This strategy is applied since the CKD is more efficient as the space is used more efficiently than by shipping the assembled vehicle.
Conclusion
As for the location advantage, economic integration in ASEAN eliminating the tariff among member countries has encouraged automotive producers to integrate their production sites in several countries to gain from the economies of scale. Automotive companies in ASEAN are likely to relocate to the location that can minimize the cost of production. Therefore, the labor-intensive suppliers are anticipated to gradually relocate to CLMV to benefit from the labor costs. At the same time, the assemblers take the ownership advantages by creating a good relationship with the suppliers producing the vehicle parts.
9 In responding to the question of the reasons for countries as promising, the results of the JBIC FY 2016 survey on overseas business operations by Japanese manufacturing companies show that 33, 20, and 10 companies agree that Thailand, Indonesia, and Philippines are the supply base for assemblers while 38, 33, 9, and 3 companies place Thailand, Indonesia, Philippines, and Myanmar as the base of export to third countries. In case of Thailand, half of 38 companies are 10 Kobayashi, Hideo (2014), Automobile and Auto Parts Industries in ASEAN: Current State and Issue. Research Institute Auto Parts Industries, Waseda University, page 8.

References
Ando, M. and Kimura, F. (2005) “The Formation of International Production and Distribution Networks in East Asia,” in Ito, T. and Rose, A., eds. “International Trade.” NBER-EAST Asia Seminar on Economics, Vol. 14, Chicago, University of Chicago Press, 177-213.
Dunning, J.H. (1979). “Toward an Eclectic Theory of International Production: Some Empirical Tests”. Journal of International Business Studies. 11(1): 9-31.
Dunning, J.H., (2013), International Production and the Multinational Enterprise, New York, Routledge. (first published in 1981)
Yu Ching Wong and Charles Adams (2002), Trends in Global and Regional Foreign Direct Investment Flows. Regional Office for Asia and the Pacific International Monetary Fund. Available at: https://www.imf.org/external/pubs/ft/seminar/2002/fdi/eng/pdf/wong.pdf
Shang-Jin Wei (1995), The Open Door Policy and China’s Rapid Growth: Evidence from City-Level Data. The National Bureau of Economic Research. Available at: http://www.nber.org/chapters/c8545
Research Institute Auto Parts Industries, Waseda University (2014), Automotive and Auto-components Industries in ASEAN: Current State and Issues. ERIA Research Project Report 2013-7. Available at: http://www.eria.org/publications/research_project_reports/FY2013/No.7.html
Kobayashi, Hideo (2014), Current State and Issue of the Automobile and Auto Parts Industries in ASEAN. Research Institute Auto Parts Industries, Waseda University.
Veloso F. and Kumar R. (2002), The Automotive Supply Chain: Global Trends and Asian Perspectives. ERD Working Paper No.3. Asian Development Bank. Available at: https://www.adb.org/sites/default/files/publication/28439/wp003.pdf
De Backer, K. and S. Miroudot (2013), “Mapping Global Value Chains”, OECD Trade Policy Papers, No.159, OECD Publishing, Paris. Available at: http://dx.doi.org/10.1787/5k3v1trgnbr4-en
Japan Bank for International Cooperation (2016), Survey Report on Overseas Business Operations by Japanese Manufacturing Companies. Research Division, Policy and Strategy Office for Financial Operations.
Japanese Chamber of Commerce (2017), Survey on Business Sentiment of Japanese Corporations in Thailand for the 2nd half of 2016, Bangkok. Available at : https://www.jetro.go.jp/ext_images/thailand/e_survey/pdf/jccaut16eng.pdf
Diaconu, L. (Maxim) (2014), The Foreign Direct Investments in Southeast Asia during the Last Two Decades. Procedia Economics and Finance 15 (2014) 903 – 908.
Okapanom, Thaniya and Sricharoen, Thitiwan. (2016). Factors Affecting Foreign Direct Investment in Thailand. Journal of Business, Economics, and Communications, Naresuan University, 11(2), 75-88.
Yannopoulos, George N. (1990). The Effects of the Single Market on the Pattern of Japanese Investment. National Institute Economic Review, No. 134 (November 1990). pp. 93-98. Available at : http://www.jstor.org/stable/23875980

Yannopoulos, George N. (1990). Foreign Direct Investment and European Integration: The Evidence from the Formative Years of the European Community.