the application of smart piping and instrumentation diagrams · pdf file ·...
TRANSCRIPT
1
The Application of Smart Piping and Instrumentation Diagrams
A Major Qualifying Project Report submitted to the faculty of
Worcester Polytechnic Institute in partial fulfillment of the requirements
for the Degree of Bachelor of Science
Submitted by:
Anthony Kassas
Alexander Gikas
Submitted on April 26, 2017
This report represents work of WPI undergraduate students submitted to the faculty as evidence of a degree requirement. WPI routinely publishes these reports on its web site without editorial or peer
review. For more information about the projects program at WPI, see http://www.wpi.edu/Academics/Projects .
Approved by:
Prof. Stephen J. Kmiotek, PhD

2
Abstract
Piping and instrumentation diagrams (P&IDs) are a universal language spoken in the process
engineering industry. They are the framework of engineering design, outlining process piping,
unit operations, control systems, utility management, and the functioning relationship between
them within a given engineering facility. Intelligent piping and instrumentation diagrams have
been created to ensure efficiency and organization in design processes through the
incorporation of a back-end database of CAD drawings. In addition, intelligent piping and
instrumentation diagrams promote consistency amongst instrumentation and piping
denotations within the process field. We worked alongside DPS Engineering to incorporate
intelligent P&IDs into the design of a small scale biodiesel transesterification process. To
evaluate the potential application of intelligent P&IDs, we utilized the pilot unit operations
laboratory in WPI’s Goddard Hall. Through professional opinion as well as from our experience,
we determined that intelligent P&IDs are an efficient organization tool for large scale projects;
however, for small processes, such as the regarded biodiesel reactor, they are unnecessary.

3
Acknowledgements
We would like to thank the following people and organizations for their contributions:
DPS Engineering
Mike Hanson
Tim Foley
WPI
Professor Stephen Kmiotek
Professor William Clark

4
Acronyms and Nomenclature
CAD - Computer-Aided Design
HS - Hand Switch
ISA - International Society of Automation
KOH - Potassium Hydroxide
LC - Level Control
P&ID - Piping and Instrumentation Diagram
PFD - Process Flow Diagram
PTFE - Polytetrafluoroethylene
SEC - Speed Element Control
TAC - True Adaptive Control
TCU -Temperature Control Unit
TE - Temperature Element
TEC - Temperature Element Control
TT - Temperature Transmitter
WE - Weight Element
WT - Weight Transmitter

5
Table of Contents
Abstract ........................................................................................................................................................ 2
Acknowledgements ...................................................................................................................................... 3
Acronyms and Nomenclature ...................................................................................................................... 4
Table of Figures ............................................................................................................................................ 7
Introduction .................................................................................................................................................. 8
1.0.1 Overview .......................................................................................................................................... 8
1.02 Project Objectives ............................................................................................................................. 9
Background ................................................................................................................................................... 9
2.0.1 Computer-Aided Design ................................................................................................................... 9
2.0.2 Piping and Instrumentation Diagrams ........................................................................................... 10
2.0.3 Process Flow Diagrams versus Piping Instrumentation Diagrams ................................................. 12
2.0.4 Intelligent Piping and Instrumentation Diagrams .......................................................................... 12
2.0.5 Biodiesel Production ...................................................................................................................... 12
2.0.6 The Biodiesel Unit Operation ......................................................................................................... 13
Research Questions and Methodology ..................................................................................................... 15
3.0.1 Project Objectives and Goals ......................................................................................................... 15
3.0.2 Project Objective Number One ...................................................................................................... 16
3.0.3 Project Objective Number Two ...................................................................................................... 17
3.0.4 Project Objective Number Three ................................................................................................... 17
3.0.5 Project Objective Number Four ..................................................................................................... 19
Results and Discussion ............................................................................................................................... 20
4.0.1 Project Objective Number One ...................................................................................................... 20
4.0.2 Project Objective Number Two ...................................................................................................... 23
4.0.3 Project Objective Number Three ................................................................................................... 26
4.0.4 Project Objective Number Four ..................................................................................................... 27
Conclusions ................................................................................................................................................. 28
Recommendations ..................................................................................................................................... 29
5.0.1 Recommendations for Intelligent P&ID Program Creators ............................................................ 29
5.0.2 Recommendations for Future Projects and Studies ...................................................................... 30

6
Bibliography................................................................................................................................................ 32
Appendices ................................................................................................................................................. 34
Appendix A – Smart P&ID Revisions ....................................................................................................... 34
Appendix B – Equipment List – Database Quantities .............................................................................. 39
Appendix C – Instrument List – Database Quantities ............................................................................. 42
Appendix D – Line List – Database Quantities ....................................................................................... 43
Appendix E – Professional Interviews ..................................................................................................... 45

7
Table of Figures
Figure One – Biodiesel Transesterification Process .................................................................................. 13
Figure Two – Process Flow Diagram .......................................................................................................... 21
Figure Three – Piping and Instrumentation Diagram ................................................................................ 22
Figure Four – Smart Piping and Instrumentation Diagram, Part 1 ........................................................... 23
Figure Five – Smart Piping and Instrumentation Diagram, Part 2 ............................................................ 24
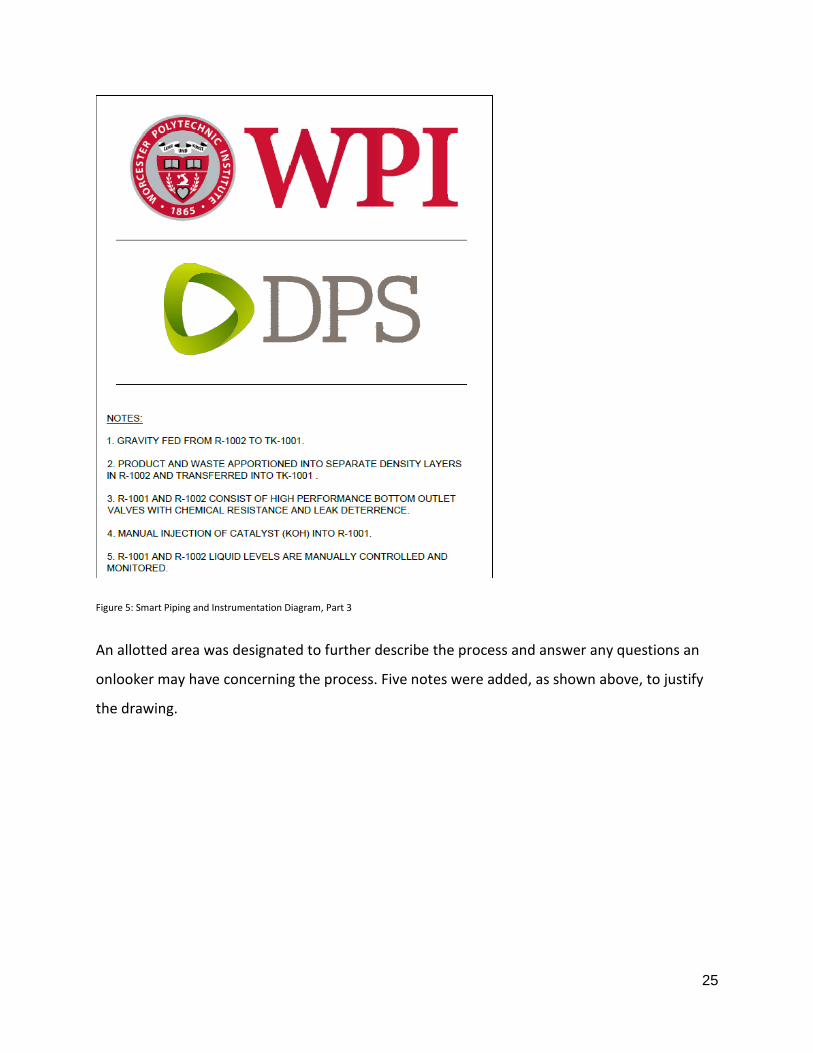
Figure Six – Smart Piping and Instrumentation Diagram, Part 3 .............................................................. 25
Figure Seven – Database Equipment List .................................................................................................. 26
Figure Eight – Process Flow Diagram ......................................................................................................... 34
Figure Nine – P&ID ..................................................................................................................................... 35
Figure Ten – Smart P&ID Revision A .......................................................................................................... 36
Figure Eleven – Smart P&ID Revision B ..................................................................................................... 37
Figure Twelve – Smart P&ID Revision C .................................................................................................... 38
Figure Thirteen – Database Equipment List, Part 1 ................................................................................... 39
Figure Fourteen – Database Equipment List, Part 2. ................................................................................. 40
Figure Fifteen – Database Equipment List, Part 3 ..................................................................................... 41
Figure Sixteen – Database Instrument List ................................................................................................ 42
Figure Seventeen – Database Line List, Part 1........................................................................................... 43
Figure Eighteen – Database Line List, Part 2 ............................................................................................. 44

8
Introduction
1.0.1 Overview
Piping and instrumentation diagrams (P&ID) are rudimentary in chemical engineering process
design works. As a fundamental blueprint to each and every chemical plant and process, piping
and instrumentation diagrams offer a simplistic view on heavily quantified engineering
developments, bridging the gap between process consultant engineers and construction
entities. P&IDs are regarded as a flow pattern, outlining the line, valve, equipment, and
instrument specifications aid engineers in developing full scale processes of all sorts. The
conceptualization of intricate processes is enhanced through the capabilities of P&IDs,
including, but not limited to:
Enumerating unit operation capabilities and framework
Maintenance of piping, instrumentation, unit operations, and valves.
Utility tracking
Controls engineering
Uniformity among design engineers
Installation methods
Piping and instrumentation diagrams are standardized by the International Society of
Automation Standard S5.1 (ISA) with respect to general formatting and process diagram
symbols. There, however, lies an inherent problem with the formulation of piping and
instrumentation diagrams. Each AutoCAD designer utilizes a unique method in their
construction of process schematics, resulting in an ununiformed series of P&ID pages of large
scale processes. An entity taking on a project of greater magnitude with several tens of pages of
P&IDs cannot properly level the playing field without providing edits upon edits of material.
Changes to process dynamics and operations must then be reflected in the agreeing Microsoft
Excel database of specifications. Process edits are not reflected universally under current
software restrictions. This evolving problem is most evident under grander scale processes. This
9
project seeks to explore the capabilities of intelligent piping and instrumentation diagrams, the
efficiency of the technology, and the scale-up potential related to the related software. A
biodiesel transesterification process was studied in order to discern the plausibility of these
objectives.
1.02 Project Objectives
The goal of this project was to work alongside DPS Engineering to determine the applicability of
intelligent P&IDs into process engineering on small and large scales. Our major objectives were
to:
1. Create an operation piping and instrumentation diagram that accurately depicts the
biodiesel transesterification operation in the Unit Operation Laboratory of Goddard Hall.
2. Replicate the piping and instrumentation diagram in CADWorx. Retrieve Excel database
of equipment lists and specifications.
3. Determine the plausibility of scale up with regards to the biodiesel transesterification
operation and other Smart P&ID implemented projects utilizing CADWorx and
professional opinion.
4. Assess the efficiency of Intelligent P&ID technology.
We hope that intelligent P&IDs will prove to be a helpful tool in process engineering and that it
becomes a universally used program to better the industry.
Background
2.0.1 Computer-Aided Design
Computer-Aided Design (CAD) is a software program that was released in the 1960s with the
intention to assist in the creation, modification, analysis and optimization in range of industries.
1 Utilized by architects, engineers, and artist, Computer-Aided Design enables an author to
conceptually create an accurate 2-D vector based or 3-D solid based representation of a
technical drawing. CAD replaces drafting by hand with computer simulated drawing with 1 Market Business News – What is Computer-Aided Design or CAD

10
greater precision. CAD is used to design houses, cars, unique products, and piping and
instrumentation diagrams. 2 AutoCAD is the predominant CAD platform used by operating
facilities for piping and instrumentation diagrams.
2.0.2 Piping and Instrumentation Diagrams
Piping and instrumentation diagrams are the framework of engineering design, outlining the
process piping, unit operations, control systems, utility management, and the functioning
relationship between them within a given engineering facility. A piping and instrumentation
diagram portrays unique symbol representation of components and instruments along with
their functions and locations on a multipage document, employed for troubleshooting and
monitoring processes. P&IDs portray a layout scheme used by members of development teams
to accurately assess construction processes, maintenance guidelines, and the fundamental
blueprints of how a process may start up, operate, and shutdown. P&IDs are often considered
to be a liaison between equipment manufacturing and process construction and operation. By
the definition provided by Lucid Chart, “P&IDs play an essential role in the process engineering
world to show interconnectivity. P&IDs are invaluable documents to keep on hand, whether
they’re used to streamline an existing process, replace a piece of equipment, or guide the
design and implementation of a new facility.” 3 The unique attributes credited to the P&ID
enable engineers and others involved in the process to responsibly attend to the process and
understand the rudimentary dynamics of it.
Piping and instrumentation diagrams include all controlled locks, mechanical equipment, and
unit and unique piping labels. Flow directions are depicted to allow examiners to conceptualize
process pathways from storage vessels in the commencement of a chemical or biological
process, to product and waste vessels downstream. The intended physical sequence of the
equipment is displayed through the provided flow direction indicators. 4 Omitted from piping
and instrumentation diagrams are specificities of equipment and their usage, along with proper
2 AutoDesk – CAD Software 3 Lucid – What are Piping and Instrumentation Diagrams? 4 Engineering ToolBox – P&IDs

11
scaling, to an extent. Piping size and identification are noted, yet piping length is omitted in
most situations. Scaling between different unit operations and piping length are factors of
safety and accessibility analyses, separate of piping and instrumentation diagrams. Piping and
instrumentation diagrams are physically implemented as depicted on the diagram; e.g.., a valve
should be correctly rotated based on its positioning on the P&ID; a storage vessel should be
correctly aligned based on the positioning of the P&ID and a piping inlet into a unit operation
should not be constructed in an outlet. “It is noted that the P&IDs are to be suitable for a take-
off of the valves, reducers, branches, and instruments, but not for the take-off of piping and
elbows” 5 With that being said, P&IDs cannot be “relied on as real models” due to their lack of
geometric and scaling accuracy. 6 P&IDs often vary in design from creator to creator due to the
lack of universal guideline. It is also customary to avoid the flow qualifications and extended
disclaimers regarding the process in such a diagram.
The usage of piping and instrumentation diagrams can assure safety protocol is being followed
via operation guidelines, as well as assure costs of maintenance and construction. By
developing a standard operation guideline, a community of process employees can rightfully
adhere to provided rule parameters. P&IDs can yield an accurate feel of pricing with the
planning of all piping and unit operations. Despite inherent inconsistencies, piping and
instrumentation diagrams deliver measures of operation security, proper usage, as well as strict
maintenance and construction policy.
2.0.3 Process Flow Diagrams versus Piping and Instrumentation Diagrams
Piping and instrumentation diagrams diverge from process flow diagrams (PFD) through many
facets. Provided by the International Society of Automation, “[A process flow diagram is a]
drawing the shows the general process flow between major pieces of equipment of a plant and
the expected operating conditions at the target production rate.” 7 Containing supplementary
detail, P&IDs are considered to be a more advanced step into the design process, whereas PFDs
are referred to as a bird’s eye view. Process flow diagrams show the interconnectivity of main
5 Unica Instrument Engineer’s Handbook – Process Measurement and Analysis 6 Lucid – What are Piping and Instrumentation Diagrams? 7 ISA – Control and Field Instrumentation Documentation

12
equipment operations, yet omit detail further, as opposed to P&IDs. In addition, PFDs do not
include ISA symbols, but are the evolution of most P&ID schematics.
2.0.4 Intelligent Piping and Instrumentation Diagrams
In 1985 Intergraph introduced the first SmartPlant P&ID systems. 8 Intelligent P&IDs, or Smart
P&IDs, are data driven CAD drawings with a back-end database. This database bridges other
applications, which populate information and extract them from the drawings. It also allows the
designer to manage the P&ID while focusing on the plant asset rather than the document
representation. The information stored with each intelligent P&ID consists of the minimum
required attributes for design, analysis, procurement, and maintenance. 9 The inputs are
retrieved from process flow sheets, instrumentation schematics, equipment data sheets, valve
and instrumentation specification sheets, and piping material specifications. It can be provided
in the form of drawings and documents. A variety of software allows for visual representation
of a given P&ID, as AutoCAD would provide, yet enables interactivity. Identification, physical
properties, process responsibilities, utilities, current statuses, and miscellaneous information
can be accessed through to touch of the computer mouse of the corresponding portion of the
P&ID. Quoted from the producers of SmartPlant P&IDs, Intergraph describes the software as a
means to “help you develop and manage your P&IDs with a focus on the plant asset...helping
you save money without compromising design quality or integrity.” 10 The hopeful outcome of
intelligent P&IDs is that it will save money, time, and reduce risk for the longevity of the
construction and operation of the process.
2.0.5 Biodiesel Production
As energy demands increase, and fossil fuels are limited, research is directed towards
alternative renewable fuels. Biodiesel is a favorable liquid biofuel alternative because it is made
8 Intergraph News – SmartPlant Enterprise 9 All About CAD Conversion – What are Intelligent P&IDs 10 Intergraph News – SmartPlant Enterprise

13
from renewable resources, vegetable oil and methanol, and has lower emissions. 11 It is less
toxic than table salt and biodegrades as fast as sugar. Produced domestically with natural
resources, its use decreases universal dependence on imported fuel and contributes to
economic development. The increase of research on reducing biodiesel production costs has
strengthened the industry, making it a strong competitor of petroleum based fuels.
The production of biodiesel fuel is a multi-reaction process involving complex set of conditions
and controls. A preliminary step to biodiesel production is the chemical process known as
transesterification, where glycerol is separated from oil with the use of methanol and a base
catalyst (KOH). The process leaves behind two products consisting of methyl esters and
glycerol. Vegetable oil has an extremely high viscosity so it is not the most efficient when
burned, however transesterification converts the vegetable oil to biodiesel molecules that have
similar properties to petroleum diesel fuel. Due to the great molecular similarities, this
alternative fuel has a chance of fulfilling the demands that diesel engine makes of its fuel. The
scope of this reporting of the biodiesel production process is limited to the transesterification
reaction noted above for the sake of creating an intelligent P&ID system.
Figure 1: Biodiesel Transesterification Process
Above is the chemical reaction for the production of biodiesel from vegetable oil using
methanol. Ethanol is an available substitute for methanol. When utilized, three methanol or
11 Biodiesel Basics – Biodiesel.org

14
ethanol molecules react with triglyceride to form three molecules of ethyl esters. These methyl
or ethyl esters are the biodiesel products sought.
2.0.6 The Biodiesel Unit Operation
The piping and instrumentation diagram generated replicates the biodiesel production unit
operation within the Worcester Polytechnic Institute, Goddard Hall second floor unit operations
laboratory. The diagram was computer emulated on AutoCAD to retrieve a schematic of the
entire process.
The biodiesel production process of interest encompasses a 500 milliliter Globe Chemical
Reactor, with a glass jacket, used as a catalyst preparation reactor. The production unit
operations follow to a 500 milliliter Globe Chemical Reactor, with a glass jacket, used as a
process reactor. Each reactor contains a pitched polytetrafluoroethylene (PTFE) blade propeller
for mixing purposes as well as a spring loaded valve which provides leak free sealing. The
reactors are connected via 3
16” ChemDurance Bio tubing, from the preparatory reactor lower
manual valve to the top of the process reactor. Each reactor has a respective temperature
element (TE) and temperature transmitter (TT). Connected to each jacketed reactor is a
condenser loop. The 1
2” rubber tubing of the condenser loop carries sewer water to each Huber
MiniStat temperature regulator from the jacket of each reactor and back to the jacket in order
to respectively control the designated process temperature. This process is regulated by the
temperature control unit (TCU) self-optimizing temperature element control (TEC) with a
temperature error stability rate of ± 0.02 degrees Celsius. Heating capacity of the condenser
reaches 1.5 kW and cooling capacity ranges from 0.42 to 0.05 kW.
The stored process materials are held within 2000 milliliter Nalgene Erlenmeyer Polypropylene
Flasks. These stored process materials include methanol, ethano0l and vegetable oil. It is, again,
worth noting that either methanol or ethanol is used during the process, not in conjunction.
The potassium hydroxide (KOH) catalyst is manually inputted into the catalyst preparation
reactor with the methanol or ethanol. The vegetable oil mixes with the catalytic reactor mixture

15
in the process reactor. Generic weigh scales are used to track the weight of each stored process
material (aside from the catalyst) to regulate the input into the corresponding reactor.
Regulation is completed by means of gravimetric dosing from the feed vessels on electronic
balances, utilizing a weight element (WE) and a weight transmitter (WT). Stored materials are
transferred from their respective flask to the designated reactor by 3
16” ChemDurance Bio
tubing.
Watson Marlow SCI 323 peristaltic pumps transfer the contents of each piece of ChemDurance
Bio tubing to their obligated location. There are three peristaltic pumps located in the unit
operation: one for the feed pumping of methanol or ethanol, one for the feed pumping of
vegetable oil, and one for the transfer of contents from the catalytic reactor to the process
reactor. Each pump is associated with a speed element control (SEC) and a hand switch (HS). An
equivalent 3
16” piece of ChemDurance Bio tubing is attached to the manual spring valve at the
bottom of the process reactor, in which a mixture of glycerol and biodiesel are gravimetrically
transferred to and separated in a Justrite Polyethylene 5 Gallon Quick-Disconnect Disposal
Safety Can.
Research Questions and Methodology
3.0.1 Project Objectives and Goals
The goal of our project was to work alongside DPS Engineering to determine if incorporating
intelligent P&IDs in process engineering is efficient and scalable. In order to accomplish this
goal we pursued four objectives:
1. Create an operation piping and instrumentation diagram that accurately depicts the
biodiesel transesterification operation in the Unit Operation Laboratory of Goddard
Hall.
2. Replicate the piping and instrumentation diagram in CADWorx. Retrieve Excel database
of equipment lists and specifications.

16
3. Determine the plausibility of scale up with regards to the biodiesel transesterification
operation and other Intelligent P&ID implemented projects utilizing CADWorx and
professional opinion.
4. Assess the efficiency of Intelligent P&ID technology.
In this section, elaboration on these objectives and explanations regarding the necessary
process to complete these objectives will be discussed.
3.0.2 Project Objective Number One
Objective One: Create an operation piping and instrumentation diagram, in AutoCAD, that
accurately depicts the biodiesel transesterification operation in the Unit Operation Laboratory
of Goddard Hall.
Preliminary Research
The preliminary research conducted prior to the production of the process and instrumentation
diagram of the biodiesel transesterification process began with the familiarization with
AutoCAD. As two novice CAD operators, adaptation to the program proved difficult, with plenty
of hours of introductory practice being conducted. A thorough examination of features of the
Goddard Laboratory biodiesel pilot plant was conducted. A rough PFD was conceptualized and
sketched in order to further understand flow patterns and the major pieces of equipment.
Tubing and equipment models and serial numbers were taken into account to determine exact
specifications of the entire process. Additionally, piping and instrumentation diagrams consist
of several different detailed figures representing unit operations of a given operation. Without
licenses to obtain premade instruments, we had to examine pre-existing and industry
standardized P&ID symbols for unit operations.
Method
The piping and instrumentation diagram was completed in AutoCAD. Many drafts were made,
due to uncertainty of various pieces of equipment. Re-creation of representational unit
operations as our own was conducted via our AutoCAD drawings. Once the major operations

17
such as reactors, heat exchangers, pumps, and valves were drawn, we then connected them by
piping. Level and temperature controls were followed by the piping in order to place them in a
more comprehensible manner. Arrows were also added to provide a direction in the process
flow. Finally, we labeled the equipment with proper nomenclature to elaborate on the sizing
and material of piping, as well as differentiate the duplicate instruments.
Limitations and Obstacles
Not all information regarding the piping was at our exposure. Even with research, the exact
make and size of the condenser loop tubing was not apparent due to a language barrier of the
producer and us. With consulting from Professor William Clark, an estimate of the piping
diameter and material was completed of said tubing line.
We were exposed to many different alternate standardized drawings of specific instruments
when completing prior research. There is no one method in drawing a peristaltic pump;
however there are abundant alternatives. The drawings we made were based off of the
resemblance to the actual equipment.
3.0.3 Project Objective Number Two
Objective Two: Replicate the piping and instrumentation diagram in CADWorx. Retrieve Excel
database of equipment lists and specifications.
Preliminary Research
Prior to utilizing CADWorx, there had to be a strong understanding of the program itself. DPS
provided us with a manual on operating and maneuvering through CADWorx. In order to
successfully complete this step, with the least amount of hiccups and errors, many questions
were asked. Approximately twenty hours were spent reading the manual, and speaking to
employees about instruction and applicable tips. Background research on the equipment
specifications was also completed in order to maximize the advantage of intelligent P&IDs.

18
Method
The P&ID produced in AutoCAD was first uploaded through CADWorx. Once it was displayed,
edits had to be made in order for the program to better understand the functions of the
process. Equipment was made intelligent by highlighting and including specifications, which are
included at the bottom on the modified intelligent P&ID. The P&ID was transferred to a
database called Schema DBO. Schema DBO is used to organize projects and information
regarding the intelligent P&IDs. Once the process was filtered out, we found four lists that were
systematically organized. An equipment list, instrument list, valve list, and line list were all
produced.
Limitations and Obstacles
This objective most complicated and led to providing us with many limitations and obstacles.
The P&ID did not smoothly transfer over to CADWorx, due to the lack of recognition.
Equipment, instruments, valves, and lines were altered manually in a similar manner to
AutoCAD.
The specifications that we provided the program with may have slight differences than that of
the process in Goddard Hall. We were limited on data regarding the exact models and
companies who produce the equipment. Educated guesses were made to fill the slots of the
unknown specs. Although we did not want to make guesses about the equipment, it would
have defeated the purpose of applying intelligent P&ID to not include specs.
The transition from the database to the Excel sheets was not fluent. Information given in the
specs was forcibly rearranged in CADWorx to make it apparent in the bottom corner of the
P&ID. Due to this alteration, the information provided in the Excel sheets was jumbled. Manual
changes had to be made to move the proper specifications to the corresponding equipment.
Needless to say, this was a timely and tedious problem to fix.
3.0.4 Project Objective Number Three
19
Objective Three: Determine the plausibility of scale up with regards to the biodiesel
transesterification operation and other Intelligent P&ID implemented projects utilizing
CADWorx and professional opinion.
Preliminary Research
The intelligent P&ID manual provided by DPS was our means of prior research on scalability
possibilities.
Method
The manual provided no information regarding scaling up a project, such as the biodiesel
process. In order to determine the feasibility the next approach was to seek assistance from
someone who uses this program on a daily basis. After a series of conversations and interviews
it was easy to determining that intelligent P&IDs do not scale processes directly. Quoted by our
sponsor advisor, Michael Hanson, “Scale-up would require manual manipulation of the data.
This can be done easily in Excel (i.e. increase size of line and equipment) then upload the
scaled-up parameters to the database” 12 Smart P&IDs can help make additions to projects
which are already programmed through CADWorx. With information already provided in the
database, adding to the process can be easily done.
Limitations and Obstacles
Few limitations and obstacles were included in this step. The purpose of intelligent P&IDs is not
to scale up a project, and there is no way to do so through the program.
3.0.5 Project Objective Number Four
Objective Four: Assess the efficiency of Intelligent P&ID technology.
Preliminary Research
Minimal preliminary research was done to determine the efficiency of Smart P&IDs. Word of
mouth in industry and through relative internship experiences gave light to this regarded study.
Intelligent P&IDs have proven to be a time saving tool according to industry leaders. With little
12 Interview – Michael Hanson – DPS Engineering

20
knowledge of the program, DPS process engineers recommended the idea of completing a
project on the innovative program.
Method
Through our experience, as well DPS employees’ experiences, we evaluated the efficiency of
Smart P&IDs by comparing how our project would have differed if conducted without the use of
Smart P&IDs. Variables that were considered were time, error, and software preference and
comfortability. In order to obtain a full range of perspectives we had multiple industry
participants complete a survey.
Limitations and Obstacles
A greater population of process engineers could have been interviewed on the topic of Smart
P&IDs. A wider range of firms could have been examined in their experiences with Smart P&ID
software. If our project consisted of a greater timeline, it would have been possible to time a
series of Smart P&IDs implemented projects and assess error. Instead, only one process design
was completed. CADWorx had a large learning curve, which prevented us from optimizing the
benefits. Given more experience prior to completing the project would have allowed us to
develop stronger, more informed opinions regarding Smart P&IDs. Mastery of such an intricate
software tool takes years upon years.
Results and Discussion
4.0.1 Project Objective One
Objective 1: Create an operation piping and instrumentation diagram that accurately depicts
the biodiesel transesterification operation in the Unit Operation Laboratory of Goddard Hall.
As a preliminary step to a piping and instrumentation diagram, a process flow diagram was
created to better understand the biodiesel transesterification process at hand. The process flow
diagram consists of three vessels, notated as V-1, V-2, and V-2 in rectangular formations which
contain reaction substituents. V-4 is also denoted at the end of the process as the collection
tank. In addition, three pumps were found in the process, and notated similarly by P-1, P-2, and

21
P3, transporting reactants and reaction mixtures to their appropriate places. Two reactors,
central to the process are symbolized by R-1 and R-2. As mentioned prior, R-1’s purpose was a
catalytic prepatory reactor while R-2 served the purpose of the process reactor. The biodiesel
transesterification process process flow diagram is as follows:
Figure 2: Process Flow Diagram
Subsequent to the process flow diagram was the creation of a piping and instrumentation
diagram illustrated below. Straight lines were comparable to solvent and sewer lines while
dashed lines signified instrumentation connections. As an early revision, condensers were
illustrated to represent the temperature control units of the process. In addition, the vessels of
the P&ID were shown as half-filled circles which were later amended to better visualize the
process dynamics and unit operations involved. True adaptive controls (TAC) were found to be
the temperature regulation system of each reactor, while a level control (LC) was drawn to
signify the measurement means between the feed and pump interaction. After better
comprehension and discussion with Professor Clarke and Professor Kmiotek occurred, these
controls were expanded upon in later P&ID revisions within CADWorx software. These revisions

22
are viewable in Appendix A. Line labels were written in the form of X”-SVC-ET:SQ-LS. X denoted
the piping diameter. SVC represented the service, or type of fluid carried by the line. ET
denoted the unit operation of origin, while SQ was a unique line number given to each pipe. LS
represented the abbreviated material structure of the line. Pumps and reactors were drawn to
most closely replicate the process units through the deliberate adhesion of a jacket to each
reactor, and the unique mechanics of peristaltic pumps.
Figure 3: Piping and Instrumentation Diagram

23
4.0.2 Project Objective Two
Objective 2: Replicate the piping and instrumentation diagram in CADWorx. Retrieve Excel
database of equipment lists and specifications.
Figure 4: Smart Piping and Instrumentation Diagram, Part 1
Revision D of the Smart P&ID included several additions to the maiden piping and
instrumentation diagram shown above. Each reactor (R-1001 and R-1002) consists of injection
nozzles at the top of each, R-1001 consisting of a manual injection point for the KOH catalyst.
Each reactor, in addition, underwent an instrumentation change. Temperature elements and
temperature transmitter were added to instrumentation lines which are in conjunction with the
adapted temperature control units. Each temperature control unit consists of a temperature
element control which is in direct signal to the reactor instrumentation. The line name template
was changed out of simplification reasoning, following the form X”-SVC-MAT-#, where X
represents the line diameter, SVC the fluid service, MAT the line material, and # represents the
unique line number. Each reactant set up was changed to incorporate an appropriate weigh
scale and a bottle symbol as representation of the Erlenmeyer flask in the biodiesel
transesterification process. Each weigh scale has a corresponding weight element and weight

24
transmitter to suitably apportion the correct amount of reactant to each reactor. Pump
instrumentation consists of a speed element control and a hand switch. The product line was
moved to better depict the gravity feed into the product tank (TK-1001).
Figure 5: Smart Piping and Instrumentation Diagram, Part 2
Coupled with the Smart P&ID is a visible data sheet incorporated directly onto the P&ID. The
data sheet shows inputted values of equipment description, material, capacity, pressure,
temperature, manufacturer/model, and electrical supply. Said specifications were researched
to the best of our ability and inputted via smart tagging of each unit operation.
25
Figure 5: Smart Piping and Instrumentation Diagram, Part 3
An allotted area was designated to further describe the process and answer any questions an
onlooker may have concerning the process. Five notes were added, as shown above, to justify
the drawing.
26
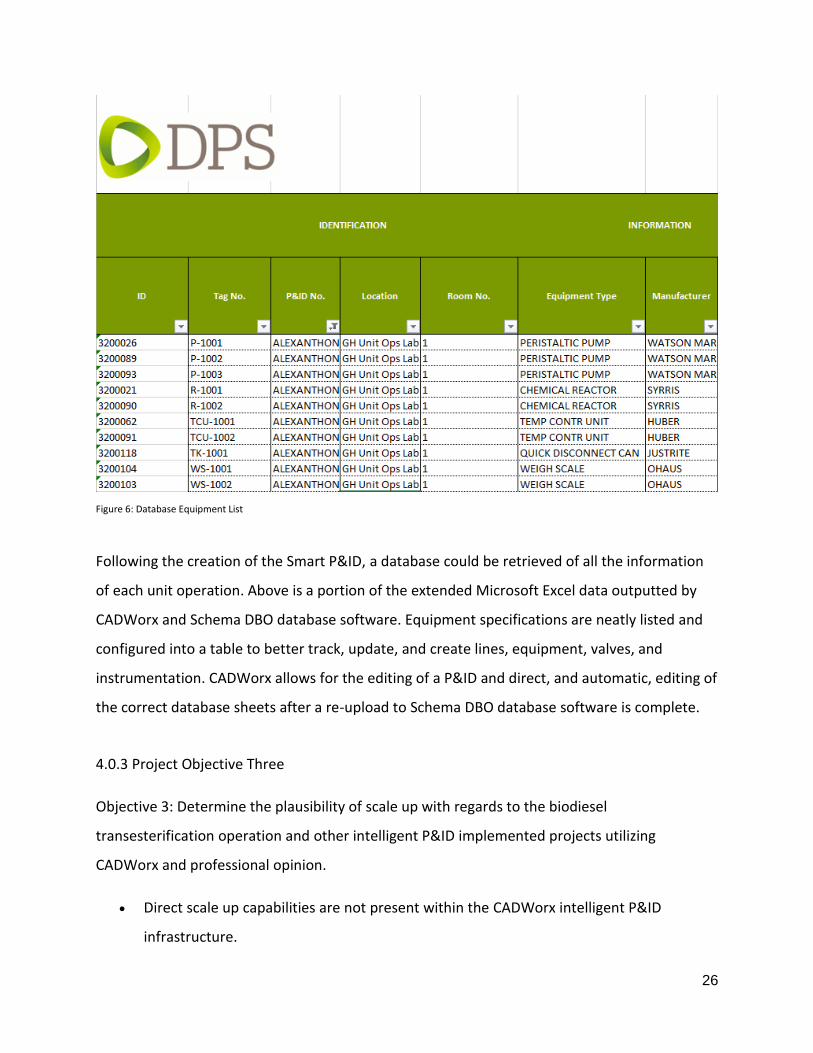
Figure 6: Database Equipment List
Following the creation of the Smart P&ID, a database could be retrieved of all the information
of each unit operation. Above is a portion of the extended Microsoft Excel data outputted by
CADWorx and Schema DBO database software. Equipment specifications are neatly listed and
configured into a table to better track, update, and create lines, equipment, valves, and
instrumentation. CADWorx allows for the editing of a P&ID and direct, and automatic, editing of
the correct database sheets after a re-upload to Schema DBO database software is complete.
4.0.3 Project Objective Three
Objective 3: Determine the plausibility of scale up with regards to the biodiesel
transesterification operation and other intelligent P&ID implemented projects utilizing
CADWorx and professional opinion.
• Direct scale up capabilities are not present within the CADWorx intelligent P&ID
infrastructure.

27
• Additions to projects can be completed easily.
After experimenting with CADWorx and reading through DPS’s user manual, we determined
that scaling up a project is technically feasible with the program, yet there is no clear method of
doing so. The program does allow additions to be made to the process easily, but there is no
option present to upscale or downscale the whole entire process. Smart P&IDs are tool to make
designing a process easier in the industry, but not necessarily scaling to a greater size. Typically
a P&ID is designed and then built following the drawing. In our study, the biodiesel
transesterification process was built already, and then we used AutoCAD and CADWorx to
replicate it into a P&ID. Because we worked backwards from a typical engineering firm’s
experience, we expected the program to offer benefits that are not quite necessary, such as
scaling up, to a typical engineering firm.
4.0.4 Project Objective Four
Objective 4: Assess the efficiency of Intelligent P&ID technology.
• Intelligent P&ID technology is effective on large scale processes and operations through
uniformity.
• Intelligent P&ID systems often are considered excessive for processes such as pilot
plants as observed in this study.
• Efficiency of the technology improves as project scale increases and a greater number of
CAD operators are involved.
After experimenting with Smart P&IDs and interviewing experienced process engineers we
determined that CADWorx is efficient given the proper context. Integrating Smart P&IDs into a
company can be difficult, as it has a large learning curve. Information must be put in prior to

28
using the program in order for it to be specialized to the company it is complying with. Once
this is completed, and operators understand how to use the program, it becomes more
efficient. As the project becomes larger, and more CAD operators are involved, more time is
saved. Many CAD operators prefer this program because it forces them all to work in a uniform
sequence. Less risk is involved with Smart P&IDs because of how the information transitions
between the drawing and Excel files. Employees are less worried about making mistake when
changes to the process need to be made.
On a smaller scale process, such as the biodiesel transesterification pilot process, Smart P&IDs
are not worth spending the time to integrate. Since we already had a basic understanding of
AutoCAD and Microsoft Excel, a one page process was not intense. Instead we spent most of
our time to learn how to use the Smart options within CADWorx. If the process was much
larger, then it would have been more efficient. If we already knew how to operate CADWorx
prior to this project, then it probably would have taken around the same time as creating a
regular P&ID and Microsoft Excel sheets.
Conclusions
Smart P&IDs are useful to process engineering consulting firms for many reasons. The
capabilities of Smart P&IDs are as follows:
1. Customize attribute blocks (instruments, IO, valves, lines, equipment, etc.) following ISA standard.
2. Insert attribute blocks to P&ID AutoCAD drawings.
3. Save AutoCAD files to DXF (Drawing Exchange Format) file format. It’s a text compatible format that can be edited by Word, Text editor, etc.
4. Run visual basic program to import attribute data from DXF file into Access database. Another VB program can export attribute data. It’s bi-directional.
5. Customize Access database queries, macros, forms, reports, etc. to generate all the reports. These were used in Schema DBO database software.
6. Export/Import data between database and Excel spreadsheets as required.
29
As a research investigation, we found that Smart P&IDs have a unique place in industry,
providing efficiency and uniformity across projects of all sizes. We found that Smart P&IDs are,
indeed, more efficient in larger scale processes through this uniformity factor. Keeping a team
of AutoCAD designers on a similar track provides risk depression along with the unique
interactivity between database and P&ID. Smart P&IDs are a promising piece of technology
with growing popularity which has a tremendous opportunity to craft a great imprint on the
process engineering industry.
Recommendations
5.0.1 Recommendations for Intelligent P&ID program creators
CADWorx software provided the fundamental application of tying a piping and instrumentation
diagram into a database in a simplistic form, eliminating the necessity of manual entry. Our
project group sought to experiment with the capabilities of CADWorx software in scaling
process up or down in size. Upon inspection of the software capabilities, it was apparent that
addition of unit operations within a P&ID drawing was simple in nature and allowed an easy
transition into database held specifications of the operations. Yet, a direct operation enabling
scalability was not present in the infrastructure of the software. Pilot plants are abundant in
industry in order to assess a project before the investment of a full scale comes into play. The
software capability to bring these pilot plants to full scale and beyond would prove useful. We
recommend the implication of this ability into CADWorx and other intelligent piping and
instrumentation diagram software to better the process development field.
The database associated with unit operation specifications within CADWorx was customizable.
Any desired specifications of the entire process could be made visible if specified, up to a
certain amount. For example, in our study of the biodiesel transesterification process, the first
catalytic preparatory reactor (R-1001) was made of PTFE, better known as
polytetrafluoroethylene. Our group was forced to list this specification as PTFE under the
condition that the chemical compound’s nomenclature could not fit in the table in the bottom
right hand corner of the intelligent P&ID. In addition, CADWorx only allowed for the
specification of equipment description, material, size, pressure, temperature, manufacturer,

30
and electrical supply. The limit on unit operation specifications proved inadequate when trying
data entering for the biodiesel transesterification process. Both reactors (R-1001 and R-1002)
were, as a result, underspecified in the table in the bottom left hand corner of the intelligent
P&ID. We recommend that CADWorx and other content creators make the visible specifications
further customizable by increasing the data entry length and including the option of what
specifications you would like to show for each piece of equipment instead of having to pick a
concrete set of specifications that you must enter for each unit. Again, the specificities of the
process are by far the most important portion of the software, and should not be hindered as
explained.
5.0.2 Recommendations for Future Projects and Studies
Intelligent piping and instrumentation diagrams are not used as frequently as they could be.
Projects have the potential to be completed in a more efficient manner if companies utilized
this program. It would be more appealing to process firms if there were statistics which stated
the amount of time that would be saved if intelligent P&IDs were implemented. We
recommend that a future team determines statistical data on how much time is saved when
implementing this technology into a process design project. A cost analysis could also be done
to show how much money will be saved from a decrease in hours and employees invested into
a project.
Once it was evaluated that our biodiesel pilot plant was too small to utilize Smart P&IDs
properly, the question arose inquiring the optimum process size deeming Smart P&IDs useful,
and exactly where that line is drawn. This would be insightful for process firms to determine
whether or not to consider using Smart P&ID software.
Multiple Smart P&ID programs have been created by different companies. Two others besides
CADWorx are SmartPlant P&ID and OpenPlant P&ID. With little knowledge regarding these
programs, it would be of value to research and study the differences between their capabilities.
Perhaps one is more useful with certain process types over others. Determining the proper
application for each program would help the industry choose the right application for their
contracted projects.

31
Whether or not the assistance of Smart P&IDs is used, mistakes are made in industry. One
major advantage of Smart P&IDs is to reduce time spent manually accumulating Excel sheets of
equipment, instruments, valves, and lines. With one less step in the design process, fewer
errors are theoretically made. A future study could determine the percent error in Microsoft
Excel documentation when using regular P&IDs versus Smart P&IDs. This statistic would also
appeal to companies when advertising the product.

32
Bibliography
1. "Biodiesel Basics." Biodiesel.org. N.p., n.d. Web. 24 Apr. 2017.
http://biodiesel.org/what-is-biodiesel/biodiesel-basics
2. "CAD Software | 2D And 3D Computer-Aided Design | Autodesk." Autodesk 2D and 3D
Design and Engineering Software. N.p., n.d. Web. 24 Apr. 2017.
http://www.autodesk.com/solutions/cad-software
3. Cam, Cad. "All About CAD Conversion." What Are Intelligent P&IDs and Their Advantages?
N.p., n.d. Web. 24 Apr. 2017.
http://info.cadcam.org/blog/what-are-intelligent-pids-and-their-advantages
4. Cook, Robert. "Codes, Tags and Labels-Interpreting Piping and Instrumentation Diagrams."
American Institute of Chemical Engineers. AICHE, 27 Oct. 2010. Web. 24 Apr. 2017.
https://www.aiche.org/chenected/2010/10/codes-tags-and-labels-interpreting-piping-and-
instrumentation-diagrams
5. "Control and Field Instrumentation Documentation - Chapter 7." The International Society of
Automation. ISA, n.d. Web. 24 Apr. 2017.
https://www.isa.org/pdfs/news/chapter7-control-loop/
6. Liptak, Bela G. "Process Measurement and Analysis - Chapter 1." Universidad Del Cauca. N.p.,
n.d. Web. 24 Apr. 2017.
ftp.unicauca.edu.co/Facultades/FIET/DEIC/Materias/Instrumentacion%20Industrial/Instrument
_Engineers__Handbook_-
_Process_Measurement_and_Analysis/Instrument%20Engineers'%20Handbook%20-
%20Process%20Measurement%20and%20Analysis/1083ch1_1.pdf

33
7. "P&ID - Piping and Instrumentation Diagram." The Engineering ToolBox. N.p., n.d. Web. 24
Apr. 2017.
http://www.engineeringtoolbox.com/p-id-piping-instrumentation-diagram-d_466.html
8. "What Are Piping & Instrumentation Diagrams." Lucidchart. Lucid Software Inc, 20 Mar. 2017.
Web. 24 Apr. 2017.
https://www.lucidchart.com/pages/p-and-id
9. "Smart P&ID Questionnaire." Interview by Alexander Gikas and Anthony Kassas. Michael
Hanson. DPS Engineering, 15 Mar. 2017.
10. "Smart P&ID Questionnaire." Interview by Alexander Gikas and Anthony Kassas. Stan Jih.
Vanderweil, 18 Apr. 2017.
11. "Smart P&ID Questionnaire." Interview by Alexander Gikas and Anthony Kassas. Tim Foley.
DPS Engineering, 07 Feb. 2017.
12. "SmartPlant® Enterprise." Intergraph News. Intergraph Corporation Part of Hexagon, n.d.
Web. 24 Apr. 2017.
http://www.intergraph.com/products/ppm/smartplant/
13. "What Is Computer-aided Design or CAD? Definition and Meaning." Market Business News.
N.p., 01 Feb. 2017. Web. 24 Apr. 2017.
http://marketbusinessnews.com/financial-glossary/computer-aided-design-cad-definition-
meaning/

34
Appendices
Appendix A: Smart P&ID Revisions
PFD
Figure 7: Process Flow Diagram
35
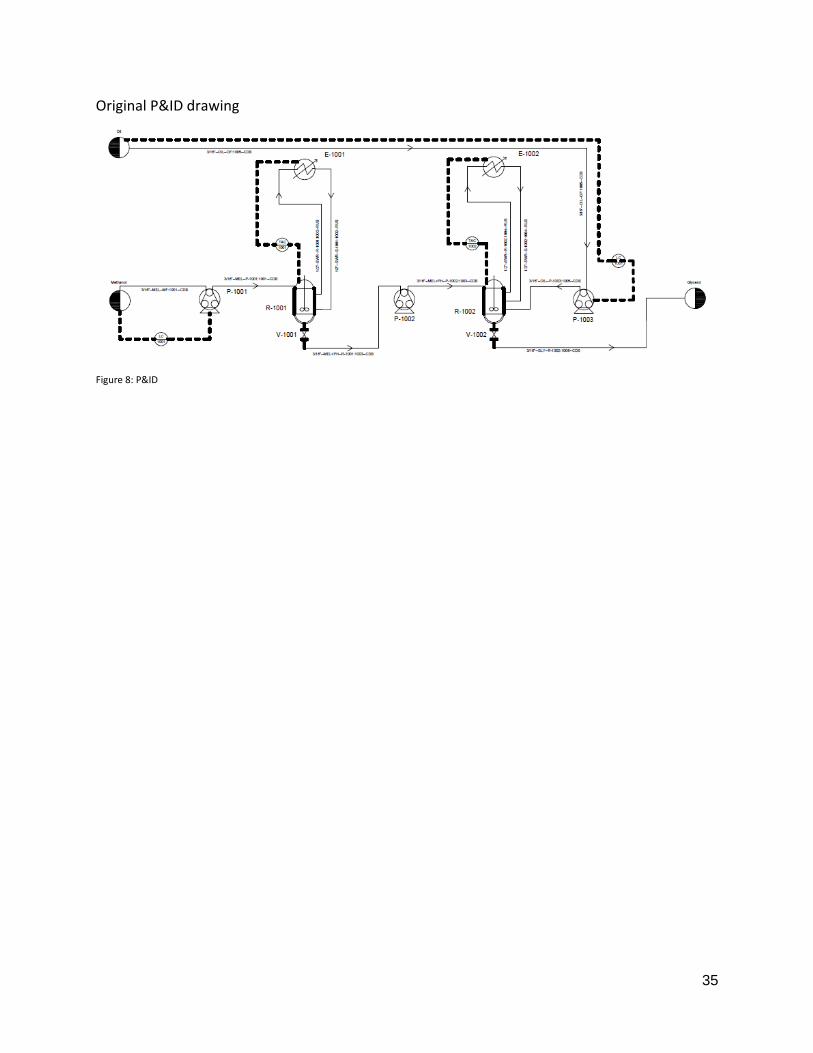
Original P&ID drawing
Figure 8: P&ID

36
Revision A Smart P&ID Drawing
Figure 9: Smart P&ID Revision A

37
Revision B Smart P&ID Drawing
Figure 10: Smart P&ID Revision B

38
Revision C Smart P&ID Drawing
Figure 11: Smart P&ID Revision C

39
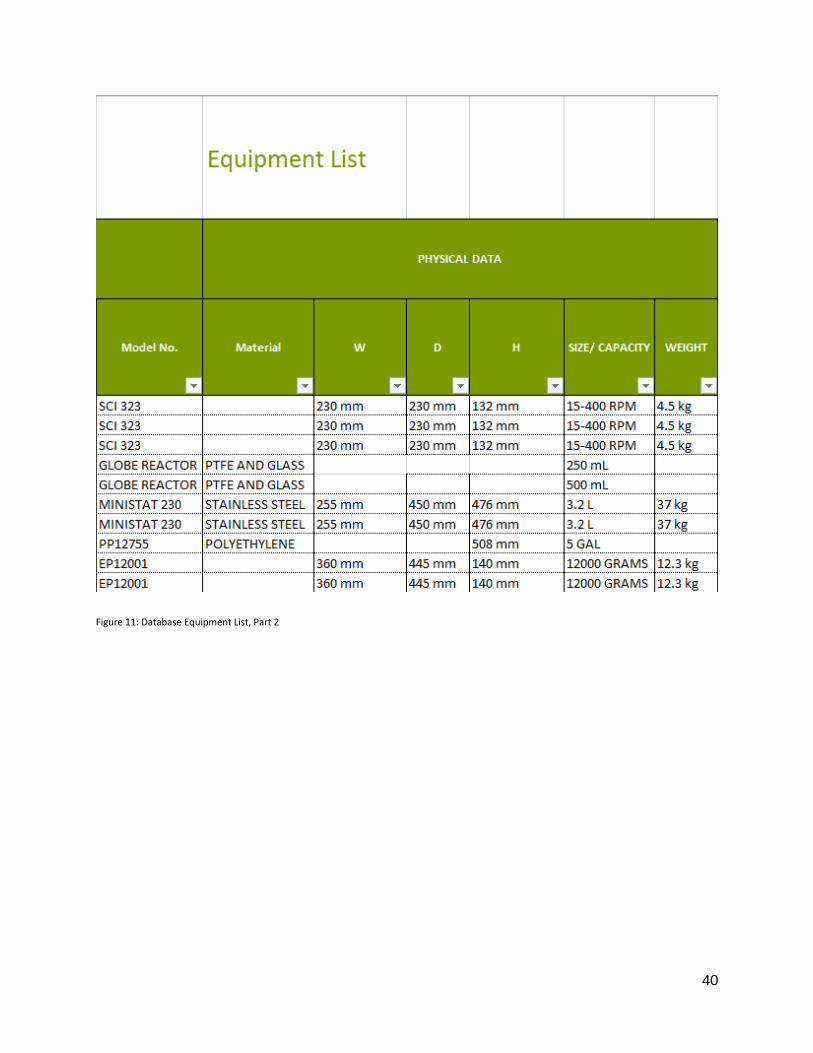
Appendix B: Equipment List – Database Quantities
Figure 12: Database Equipment List, Part 1
40
Figure 11: Database Equipment List, Part 2

41
Figure 12: Database Equipment List, Part 3
42
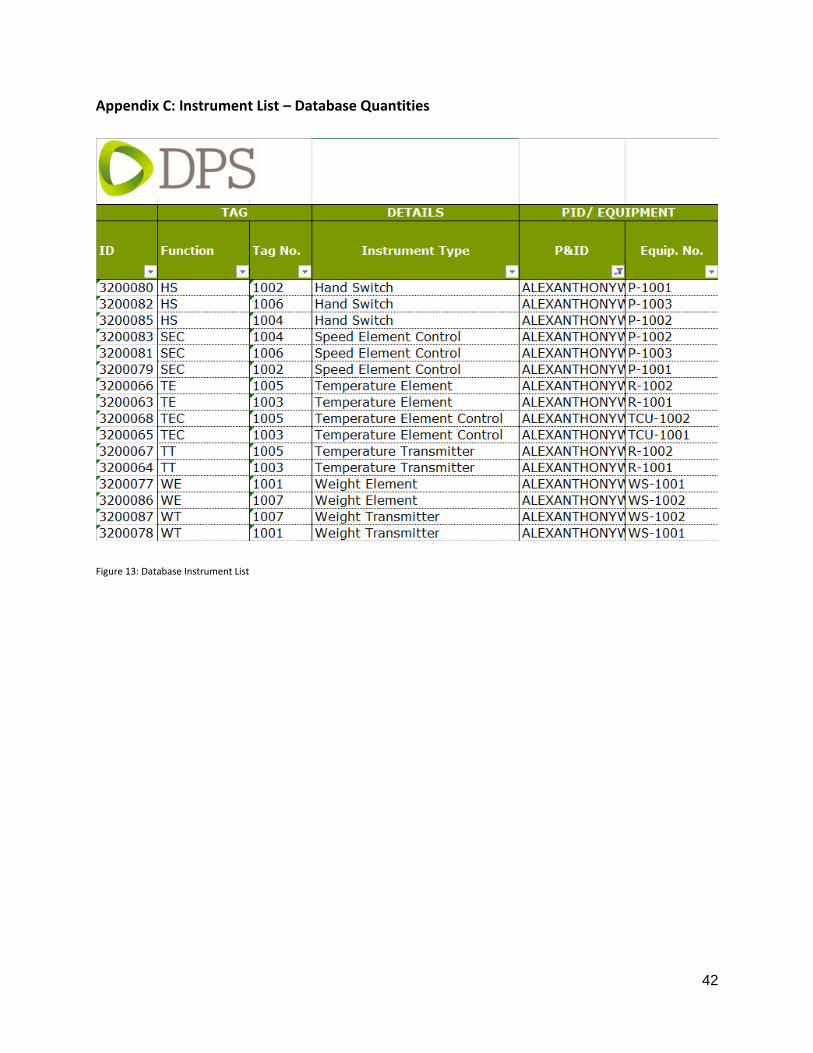
Appendix C: Instrument List – Database Quantities
Figure 13: Database Instrument List

43
Appendix D: Line List – Database Quantities
Figure 14: Database Line List, Part One

44
Figure 15: Database Line List, Part 2

45
Appendix E: Professional Interviews
Interviewee: Michael Hanson, Engineering Principal at DPS Engineering
1. Do you find CADWorx software to be beneficial in terms of efficiency as opposed to AutoCAD
P&ID development without CADWorx?
In general, yes. Being our first project utilizing the Smart P&ID we did have some struggles
initially as we figured out the nuances. But once the CAD operators got familiar with the
software efficiency improved. Efficiency will further improve when Engineers begin uploading
their data via the database program as opposed to the CAD operators typing information in
manually.
2. What are some pros and cons of using Smart P&IDs?
Cons: There is a lot of up front work required to set-up the databases and build the P&ID’s. Like
all software there are bugs and work-arounds required to get things to looks/act just the way
you want it. Efficiently and benefits decrease with project size/scope. If data is wrong in the
database, it is wrong in both the drawings and reports
Pro: Efficiently and benefits increase with project size/scope. Data can be downloaded and
uploaded o project database. List/reports can be automatically generated (downloaded) from
the database. Data can be manipulated in Excel and re-uploaded to the database. Quality is
improved in that there is consistency between the drawings and lists as the data contained in
each are pulled from the same database.
3. Does the infrastructure of the CADWorx software provide the ability to scale-up processes?
Scale-up would require manual manipulation of the data. This can be done easily in Excel (i.e.
increase size of line and equipment) then upload the scaled-up parameters to the database.
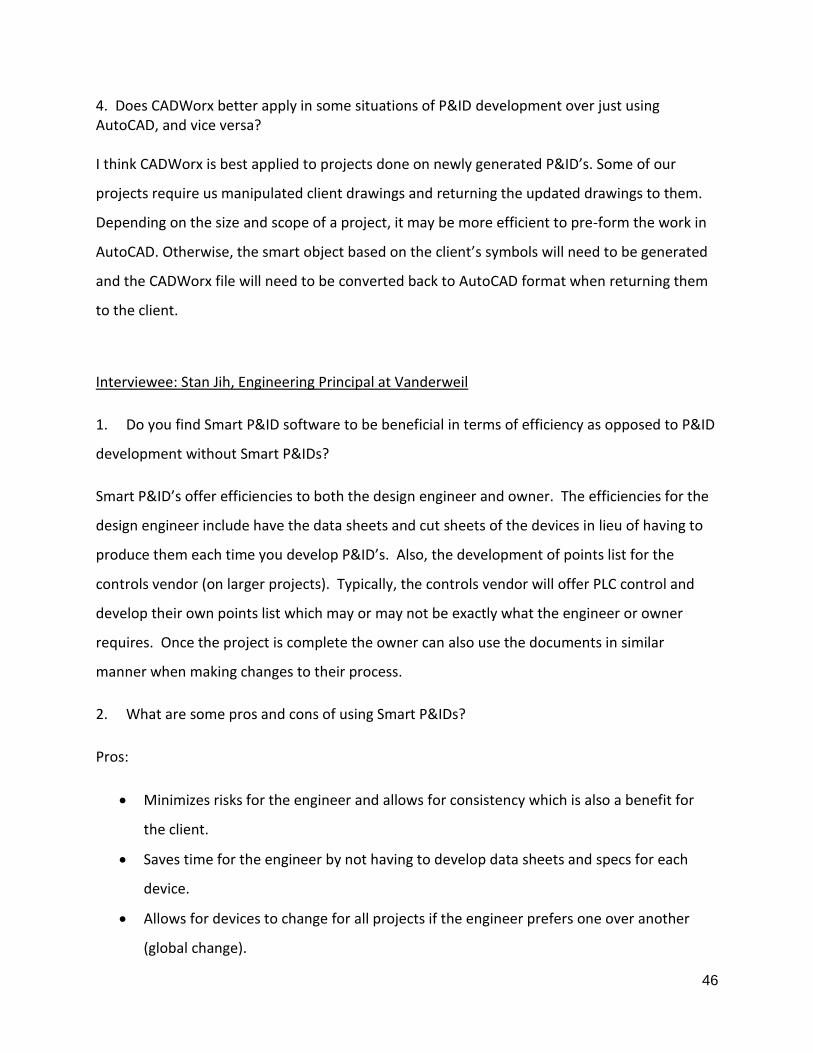
46
4. Does CADWorx better apply in some situations of P&ID development over just using AutoCAD, and vice versa? I think CADWorx is best applied to projects done on newly generated P&ID’s. Some of our
projects require us manipulated client drawings and returning the updated drawings to them.
Depending on the size and scope of a project, it may be more efficient to pre-form the work in
AutoCAD. Otherwise, the smart object based on the client’s symbols will need to be generated
and the CADWorx file will need to be converted back to AutoCAD format when returning them
to the client.
Interviewee: Stan Jih, Engineering Principal at Vanderweil
1. Do you find Smart P&ID software to be beneficial in terms of efficiency as opposed to P&ID
development without Smart P&IDs?
Smart P&ID’s offer efficiencies to both the design engineer and owner. The efficiencies for the
design engineer include have the data sheets and cut sheets of the devices in lieu of having to
produce them each time you develop P&ID’s. Also, the development of points list for the
controls vendor (on larger projects). Typically, the controls vendor will offer PLC control and
develop their own points list which may or may not be exactly what the engineer or owner
requires. Once the project is complete the owner can also use the documents in similar
manner when making changes to their process.
2. What are some pros and cons of using Smart P&IDs?
Pros:
• Minimizes risks for the engineer and allows for consistency which is also a benefit for
the client.
• Saves time for the engineer by not having to develop data sheets and specs for each
device.
• Allows for devices to change for all projects if the engineer prefers one over another
(global change).
47
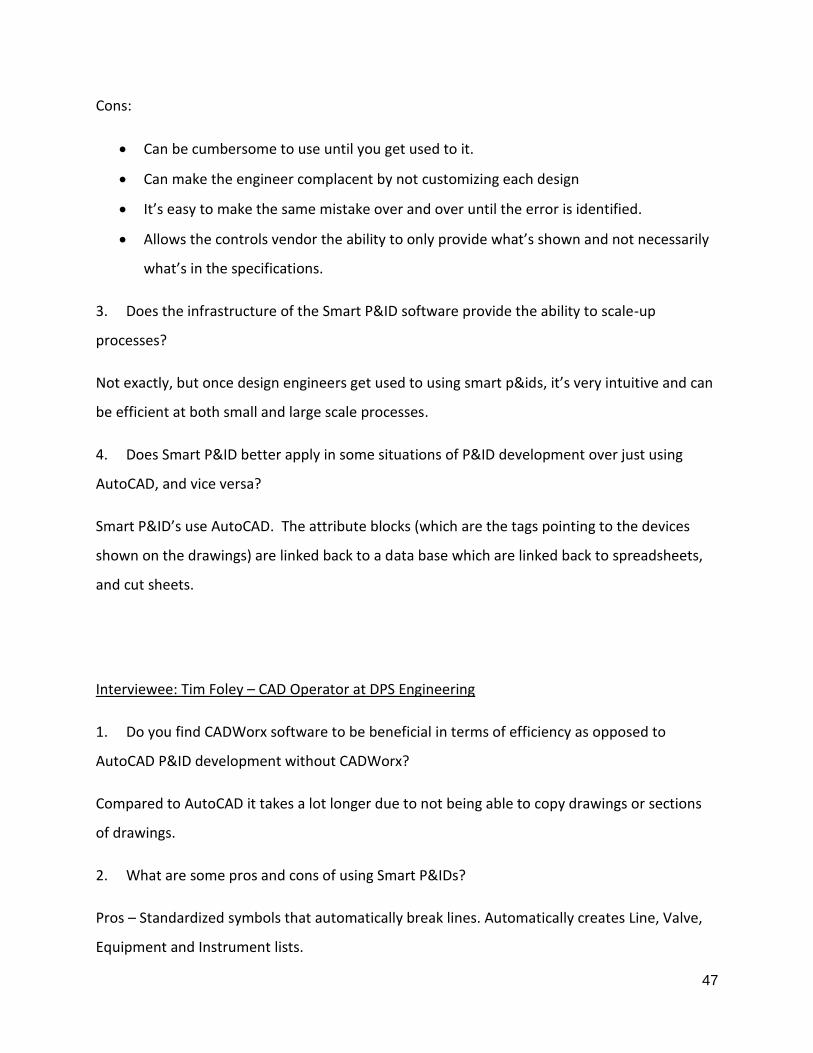
Cons:
• Can be cumbersome to use until you get used to it.
• Can make the engineer complacent by not customizing each design
• It’s easy to make the same mistake over and over until the error is identified.
• Allows the controls vendor the ability to only provide what’s shown and not necessarily
what’s in the specifications.
3. Does the infrastructure of the Smart P&ID software provide the ability to scale-up
processes?
Not exactly, but once design engineers get used to using smart p&ids, it’s very intuitive and can
be efficient at both small and large scale processes.
4. Does Smart P&ID better apply in some situations of P&ID development over just using
AutoCAD, and vice versa?
Smart P&ID’s use AutoCAD. The attribute blocks (which are the tags pointing to the devices
shown on the drawings) are linked back to a data base which are linked back to spreadsheets,
and cut sheets.
Interviewee: Tim Foley – CAD Operator at DPS Engineering
1. Do you find CADWorx software to be beneficial in terms of efficiency as opposed to
AutoCAD P&ID development without CADWorx?
Compared to AutoCAD it takes a lot longer due to not being able to copy drawings or sections
of drawings.
2. What are some pros and cons of using Smart P&IDs?
Pros – Standardized symbols that automatically break lines. Automatically creates Line, Valve,
Equipment and Instrument lists.

48
Cons – Not being able to copy drawings and sections of drawings (need to be re-drawn).
Database items need to be carefully looked at due to hidden attributes within drawings. There
are many glitches that need to be worked out.
3. Does the infrastructure of the CADWorx software provide the ability to scale-up processes?
• You can upgrade to a new phase or revision easily.
• You can convert a regular P&ID to a Smart P&ID with a lot of work.
• You can upgrade the software by creating new symbols but this can be tricky.
• You can add new portions of a P&ID very easily.
4. Does CADWorx better apply in some situations of P&ID development over just using
AutoCAD, and vice versa?
• For larger scaled projects it helps the engineer to work with a database to create and
work with Line, Valve, Equipment and Instrument lists.
• For smaller jobs maybe best to use AutoCAD without a database.