the agriculture sector performance in mozambique … · this paper sets out to analyse and present...
TRANSCRIPT

Revista Galega de Economia/Economic Review of Galicia Vol. 23-4 (2014)
105
THE AGRICULTURE SECTOR PERFORMANCE IN MOZAMBIQUE Sibusiso NHLENGETHWA**, a
Greenwell MATCHAYA* Pius CHILONDA*
ABSTRACT This paper sets out to analyse and present trends in agriculture sector performance in Mozambique for the period 2000 – 2013 (with particular attention paid to the last three to four years of the said period). In the quest to attain this aim the paper empirically focuses on the significance of charting the performance of the sector against the baseline sectoral performance targets enlisted in the PNISA, CAADP Framework and SADC RISDP. There are ten key performance indicators that the paper delves ascertain the performance of the agriculture sector. The performance of this sector is pivotal because in Mozambique the agriculture sector is vital for economic development (contributes more than 20% to the GDP) also in meeting the Millennium Development Goal I (MDG I). The trend analysis led to the following main findings; the growth in agricultural GDP and the annual GDP growth of the country surpassed the CAADP target of 6% annual growth despite the fact that Government of Mozambique has vehemently failed to substantially invest in the agriculture sector to meet the CAADP 10% target of the total budget to agriculture. Agriculture productivity (land and labour productivity) in Mozambique is quite low, it is even lower than the average of the Low-Income countries in the region henceforth, the country has however been struggling to meet the agriculture production performance indicators. This is noted by the country’s failure to meet both the SADC RISDP and Abuja Declaration fertilizer use targets of 50kg/ha and 65kg/ha respectively and the failure to meet the SADC RISDP irrigation target of doubling the area under irrigation to 7%. Consequently the country has failed to meet the SADC RISDP cereal production target of 2000kg/ha. The analysis also depict that the country has failed to meet the SADC RISDP livestock annual growth target of 4%. The implications of these failures have a significant bearing on the country’s battle to offset poverty; the country’s GHI is still alarming and the proportion of the population below the minimum dietary energy consumption is still high (41% on average) whilst the MDG I target stands at 28%. The major deduction from these findings is that there is a need for more concerted efforts in Mozambique to increase and refine agricultural growth investments; this can be carried out efficiently operationalising the PNISA to achieve the PEDSA, SADC RISDP and CAADP objectives.
1. Introduction This paper maps the performance of the agriculture sector in Mozambique for the past fourteen years (with special attention accorded to the last four years (2010-2013). The performance of this sector is charted against the baseline sectoral performance indicators listed in the Programa Nacional de Investimento do Sector Agrário (National programme for agricultural sector investment) also known as PNISA, the Comprehensive Africa Agriculture Development Programme (CAADP) framework, and in the Regional Indicative Strategic Development Plan (RISDP) of the Southern African Development Community (SADC). It is a vital step to gauge the progress made in the sector and further monitor the performance of the sector against these national and regional targets. Since Mozambique subscribes to the CAADP framework, all the set targets should be met in order to enhance
a **Research Officer – Statistics/ReSAKSS-SA and Corresponding Author. International Water Management Institute. Email: [email protected] *International Water Management Institute

Revista Galega de Economia/Economic Review of Galicia Vol. 23-4 (2014)
106
the growth and development of the economy of the country through agriculture and at the same time curtail poverty. This paper seeks to succinctly present several trends on the performance of the agricultural sector in Mozambique. These include the investment of the public sector in agriculture against the 2003 Maputo Declaration target of 10 percent of the national budget, crops and livestock production performance against CAADP targets, land and labour productivity, total agricultural trade performance (agriculture imports and exports and food imports), and poverty trends (Global Hunger Index and proportion of the population below minimum dietary energy consumption). Structure of the Mozambique agriculture sector About 70 percent of Mozambique’s population lives in rural areas and obtains its livelihood from agriculture (Chilonda et al. 2011). The contribution of agriculture to Mozambique’s gross domestic product (GDP) was relatively stable between 2001 and 2010, its share ranging between 24.2 and 25.6 percent annually (Chilonda et al. 2012). With the important investments in mining and natural gas extraction in Mozambique over the past five years, when more recent data on agriculture’s contribution to the economy becomes available, it likely will show a reduction in the share of Mozambique’s economic output made up by agriculture, even though the value of agriculture’s contribution likely will not have declined and possibly increased. This is due to the increased mining-related output in recent years increasing the size of Mozambique’s economy as a whole – the economy as a whole grew by more than 7 percent in both 2011 and 2012. Crop production makes up 78 percent of the total agricultural GDP, while the livestock sub-sector contributed 6 percent. The fisheries and forestry sub-sectors are considered to be part of the agricultural sector, and contributed 7 percent and 9 percent, respectively.1 The main food crops grown are cassava, sweet potato, maize, rice, sorghum, millet, and pulses. Food crops account for 90 percent of total crop production. Cash crops include cotton, tobacco, cashew, coconut, and fruit. The principal livestock produced are cattle, goats and poultry. Most animals are raised under extensive systems making use of local pasture and other feed resources (Rosário 2012). Cotton, tobacco, cashew, and, more recently, sesame are major export crops for Mozambique. Sugar and, to a lesser extent, tea are other industrial agricultural products of significance (Chilonda et al. 2012).
2. Data source and methodology The data used in the analysis to achieve the objectives of this paper was drawn from the ReSAKSS-SA database constituting data collected from the countries under study in 2013 and the World Bank’s Development Indicators (WDI) (World Bank, 2013). The analysis of this paper was carried out at various levels, at country level and regional level for comparative reasons. The results are presented at aggregate level using descriptive statistics for the SADC region and for the three economic groups (SADC excluding South Africa, SADC Middle-Income countries and SADC Low-Income countries). These groups emanate from the World Bank classification of economies based on Gross National Income (GNI). The low income countries are characterised as agriculture based economies although some of these countries have significant mining activities. Conversely, the middle income countries have significant mining sectors and some are small countries with significant tourism sectors. In December 2012, the World Bank classified nine of the fifteen SADC countries as Middle-Income countries, these are namely; Angola, Botswana,
1 In this analytical report, the agricultural production activities of interest are those related to crops and livestock. Fisheries and forestry are only considered when they are part of the aggregate agricultural sector of Mozambique’s economy for statistical or other purposes.

Revista Galega de Economia/Economic Review of Galicia Vol. 23-4 (2014)
107
Lesotho, Mauritius, Namibia, Seychelles, South Africa and Swaziland. The Low-Income countries are Democratic Republic of Congo (DRC), Madagascar, Malawi, Mozambique, Tanzania, Zambia and Zimbabwe.
3. Performance of the agriculture sector In 2012, the agriculture (including forestry and fisheries) sector contributed 24.8 percent of the country’s total economic output (MPD & MF 2013). When we look at trends in the performance of Mozambique’s agriculture sector over the last two decades, as measured by total value added, value added per worker, total cereal production, and cereal yield, the dominant trend is one of growth (see Table 1).
Table 1: Past performance of the agriculture sector in Mozambique’s economy Indicator Name 1990 1995 2000 2005 2010 2012
Agriculture, value added (constant 2005 US$ millions) 868 944 1,122 1,610 2,350 2,780
Agriculture value added per worker (constant 2005 US$) 167 150 158 205 271 307
Cereal production (1,000s of metric tons) 738 1,128 1,587 1,139 2,506 na Cereal yield (kg per hectare) 477 653 868 741 1,006 na Agriculture, value added (annual % growth) 1.1 15.3 -11.8 6.5 5.9 8.8
Source: World Bank Development Indicators (1990 – 2012)
All of the agriculture sub-sectors – crops, livestock, fisheries, and forestry – have shown positive growth in recent years, except for a sharp decline observed in the fisheries sub-sector in 2009 (Figure 1). The crop sub-sector has shown annual growth rates that range roughly from 6 to 12 percent, while the livestock sector registered between 3 and 7.5 percent annual growth (Chilonda et al. 2011).
Figure 1: Annual growth of the sub-sectors in Mozambique’s agriculture sector, 2003-2009
Source: Chilonda et al. 2011
Revista Galega de Economia/Economic Review of Galicia Vol. 23-4 (2014)
108
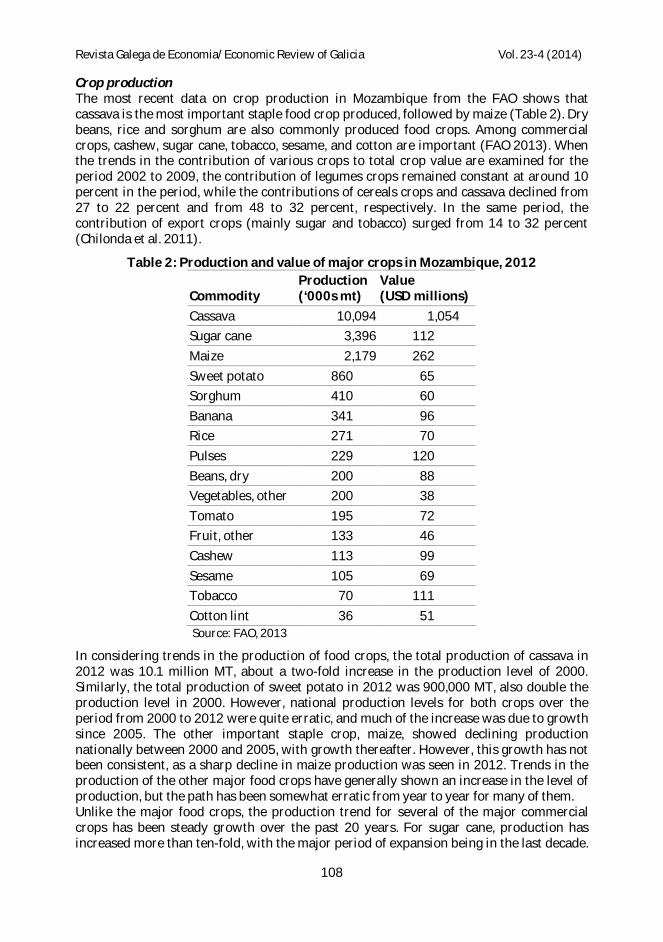
Crop production The most recent data on crop production in Mozambique from the FAO shows that cassava is the most important staple food crop produced, followed by maize (Table 2). Dry beans, rice and sorghum are also commonly produced food crops. Among commercial crops, cashew, sugar cane, tobacco, sesame, and cotton are important (FAO 2013). When the trends in the contribution of various crops to total crop value are examined for the period 2002 to 2009, the contribution of legumes crops remained constant at around 10 percent in the period, while the contributions of cereals crops and cassava declined from 27 to 22 percent and from 48 to 32 percent, respectively. In the same period, the contribution of export crops (mainly sugar and tobacco) surged from 14 to 32 percent (Chilonda et al. 2011).
Table 2: Production and value of major crops in Mozambique, 2012
Commodity Production (‘000s mt)
Value (USD millions)
Cassava 10,094 1,054 Sugar cane 3,396 112 Maize 2,179 262 Sweet potato 860 65 Sorghum 410 60 Banana 341 96 Rice 271 70 Pulses 229 120 Beans, dry 200 88 Vegetables, other 200 38 Tomato 195 72 Fruit, other 133 46 Cashew 113 99 Sesame 105 69 Tobacco 70 111 Cotton lint 36 51
Source: FAO, 2013
In considering trends in the production of food crops, the total production of cassava in 2012 was 10.1 million MT, about a two-fold increase in the production level of 2000. Similarly, the total production of sweet potato in 2012 was 900,000 MT, also double the production level in 2000. However, national production levels for both crops over the period from 2000 to 2012 were quite erratic, and much of the increase was due to growth since 2005. The other important staple crop, maize, showed declining production nationally between 2000 and 2005, with growth thereafter. However, this growth has not been consistent, as a sharp decline in maize production was seen in 2012. Trends in the production of the other major food crops have generally shown an increase in the level of production, but the path has been somewhat erratic from year to year for many of them. Unlike the major food crops, the production trend for several of the major commercial crops has been steady growth over the past 20 years. For sugar cane, production has increased more than ten-fold, with the major period of expansion being in the last decade.

Revista Galega de Economia/Economic Review of Galicia Vol. 23-4 (2014)
109
Similarly, the national annual production of tobacco increased from about 3,000 MT in 1990 to 70,000 MT in 2011. Although not as dramatic, cotton production has also seen a significant increase, particularly since 2000. In order to determine the source of production growth by crop – whether from increases in yields on existing crop land or from simply expanding the area planted to a crop – Chilonda et al. (2011) computed the annual growth in area planted and in total production for the major staple crops for the years 2002 to 2008. Among the major crops, the planted area of maize, which covered 38 percent of the actual area planted in 2008, increased from 1.17 million to 1.96 million hectares between 2002 and 2008, for an average growth rate of 2.3 percent per year. However, maize production increased by only 0.6 percent per year, indicating a slight decline in yields overall. Cassava, which constituted 24 percent of area planted, showed a 0.8 percent annual decline in national production, with almost no increase in the area planted. Beans, planted on 13 percent of the actual area planted in 2008, showed a 4.1 percent per year increase in planted area, while production increased at a slower rate of 1.8 percent per year. This analysis indicates that land productivity declined over the period 2002 to 2008, at least for the major smallholder crops. The growth in crop production in Mozambique has been driven mainly by the expansion of land with very little or no change in output per unit area of land. In Figure , an updated comparison between the growth in production and the expansion of cultivated land for important crops in Mozambique between 2008 and 2012 is made using more recent data from FAOSTAT. Relative to the situation between 2000 and 2008, the situation has not changed much.
Figure 2: Comparison of annual growth in national production and planted area over the period 2008 to 2012, by selected crop
Source: Author’s computation using FAOSTAT 2013
The situation with maize is more or less the same as that of the period between 2002 and 2008, while sorghum is worse as cultivated land area has expanded at a significant rate while there was an overall decline in output. Similarly, for sweet potato, rice, and cashew, average growth in production is less than the growth in land planted to those crops. On the other hand, land productivity seems to be improving for some of the other major crops. For cassava, groundnuts, dry beans, pulses, sesame, and sugar cane, the growth in total production was accompanied with either a reduction of cultivated land or smaller growth in the expansion of land planted to these crops.

Revista Galega de Economia/Economic Review of Galicia Vol. 23-4 (2014)
110
Benson et al. (2013) identified the lack of crucial public goods and services as major constraints in using inorganic fertilizer in Mozambique, in particular, farmers’ limited scientific knowledge and information on the proper agronomic and economics of fertilizer use. Related, access to agricultural extension is very low in Mozambique. In their study on Mozambique’s National Extension Program (PRONEA), Gêmo and Chilonda (2013) identified a range of factors that pertain to conceptualization, implementation, and monitoring and evaluation of PRONEA as causes of its failure. Kondylis and Mueller (2012) also pointed out that several major inefficiencies common in extension networks of developing countries are also seen in Mozambique. Similarly, access to credit services is very low among smallholder farmers (Chilonda et al. 2011). Finance is a multifaceted constraint for Mozambique’s agriculture sector. Even when funds are available to provide to farmers, the effective disbursement of loans to farmers and their subsequent repayment has proven problematic (IFAD 2012a). Conceptually, agricultural transformation is generally considered to involve more intensive production per unit of copped area – that is, higher yields per unit area. However, in the case of Mozambique such an objective is not as pressing as in many other developing countries. While some rural areas of Mozambique are densely populated, the country as a whole still has a considerable amount of uncultivated arable land, even if it may not be of the highest production potential. About 60 percent of the total land area is considered agricultural, that is, under seasonal or permanent crops or under permanent pasture. However, of this agricultural land, less than 10 percent is under seasonal crops (World Bank, 2013). It generally will be less costly for farmers in Mozambique to open new land to cultivation to produce more crops than to invest in yield-enhancing technologies, like fertilizer, on existing land. In 2002, 85 percent of heads of farming households reported that they could obtain more agricultural land in their communities if needed (Walker et al. 2004).
4. Assessing agricultural development achievements under PNISA Programa Nacional de Investimento do Sector Agrário (National programme for agricultural sector investment) referred here as PNISA is investment plan that was made after the country has signed the CAADP compact. This is an action/investment plan that is meant to implement the Plano Estratégico de Desenvolvimento Agrário (Strategy and plan for agricultural development) referred to here as PEDSA. In this section of the analytical paper is where an assessment is provided of what has been achieved in the implementation of the PNISA and where actions should be taken to strengthen implementation. This is done by undertaking a somewhat subjective SWOT analysis of PNISA implementation over the past year (2012/13 financial year). Thereafter, several of the key PNISA and CAADP performance indicators are considered in turn. The aim is to gauge the progress to date under the PNISA which serves to advance Mozambique towards the objectives it has set for itself for agricultural development under the PEDSA and also make substantial headway towards attaining the SADC RISDP and CAADP framework targets. SWOT analysis: To assess progress to date in the implementation of the agricultural development plans of the government of Mozambique a brief Strengths – Weaknesses – Opportunities – Threats (SWOT) analysis is used. In doing so, focus is on the quality of execution and the quality of the monitoring and evaluation systems that are in place to identify and guide any necessary course corrections in PEDSA and PNISA implementation modalities. First we restate the particular definitions of strengths, weaknesses, opportunities, and threats in the context of this analysis:

Revista Galega de Economia/Economic Review of Galicia Vol. 23-4 (2014)
111
Strengths refer to those characteristics of a specific intervention that make it better suited to achieve the desired development objectives than would alternative approaches or interventions – in the case here, achieving the objectives and goals of PEDSA.
Weaknesses are features of interventions that put them at a disadvantage relative to others interventions.
Opportunities are contextual elements that could be used to the advantage of the intervention.
Threats are contextual elements that have a potential to impede the intervention in accomplishing its objectives and goals.
As such, it almost goes without saying that the issues raised in this section, while they are informed by a close examination of agricultural policy-making, priority setting, and program implementation within the context of the PEDSA and CAADP-Mozambique, are by no means definitive. Nonetheless, the SWOT analysis here should assist in making a first step towards defining a more accurate set of strengths, weaknesses, opportunities, and threats that characterize the PNISA implementation process so far.
Strengths Broad Coalition of stakeholders involved
in the CAADP-Mozambique and PNISA development.
Signing the CAADP-Mozambique compact commits stakeholders to work towards the PEDSA
High level political support for the PNISA articulated by the President and Council of Ministers.
The G8 New Alliance for Food Security and Nutrition in Mozambique Cooperation Framework agreement is designed to be supportive of PEDSA and PNISA.
Weaknesses Indications that the CAADP-Mozambique
process and the implementation of the PNISA is primarily a MINAG activity with little support from other stakeholders.
PNISA is very broad in scope. Considerably more prioritization and pruning of programs and sub-programs could have been done. This has ramification on raising the resources needed for implementation,
PNISA is ambitious and is at risk of requiring greater human capacity to implement than is available in rural Mozambique.
Opportunities Considerable will from donors to see
Mozambique achieve some tangible degree of agricultural transformation through the successful implementation of the PNISA.
The significant contributions to the Mozambican economy that are foreseen to be coming out of mining and natural gas exploitation will potentially allow an increase in government financing of PNISA.
The lead-up to the elections in late-2014 may provide a pro-PNISA political environment as those seeking election look for opportunities to demonstrate their commitment to the rural electorate.
Threats Delays in organizing the coordination of
the activities under PNISA will result in a loss of coherence and retard progress towards the PEDSA objectives.
The elections in 2014 may mark a highpoint in political commitment to the PNISA that will be rapidly eroded thereafter as elections promises confront the day to day reality of governing the country.

Revista Galega de Economia/Economic Review of Galicia Vol. 23-4 (2014)
112
Discussion of SWOT analysis In the SWOT analysis presented here, the focus is on the broader political and economic factors that will determine the success of the PNISA implementation. The informational content of the M&E system is not specified in the plan (Uaiene, 2013). As such, beyond the three overall goals on agricultural sector growth, child chronic malnutrition, and hunger noted above, no other indicators are proposed for use in measuring progress under the PNISA in attaining the objectives of the PEDSA. Other indicators and targets are left to be identified at the level of the programs and sub-programs by the agencies involved. This lack of definition of key indicators for M&E is an important deficiency in the design of the PNISA given the centrality of mutual accountability under the CAADP-Mozambique process. Mutual accountability centres on “mutually agreed upon milestones and targets”. These milestones and targets remain to be defined for the PNISA. The development of the PNISA and the roll-out to implementation has been sufficiently successful to keep stakeholders engaged in the process. The PNISA would appear to provide a workable action plan for achieving the objectives of the PEDSA, although considerably more work at refining the action plan is needed before many of its stakeholders will make firm commitments to invest in its operationalization. Much progress has been made over the past three years in defining how Mozambique might achieve the transformation of its agricultural sector. However, it also is clear that any gains that have been made in building commitment to that broad objective could be lost without strategic efforts to accelerate coordinated action under the PNISA. The PNISA is ambitious in scope, but faces a significant gap in financing. An internal prioritization and sequencing of programs and sub-programs should be conducted that will frame results in a better match with available resources. While the focusing exercise is required to address the financing gap, it should be done based on technical evidence of what PNISA activities should be done when, rather than being led in possibly more arbitrary manner by the Ministry of Finance or development partners. CAADP targets for agricultural development Although the CAADP target of the allocation of 10 percent of the national budget for agriculture was discussed in considerably more detail in chapter 5 of this report,
Figure tracks Mozambique’s progress towards meeting the target by presenting the share of the budget and the share actual expenditure allocated to agriculture. The share of the total budget going to agriculture consistently increased in Mozambique over the period 2010 to 2012, while the share of total expenditure going to agriculture has been decreasing. Mozambique has failed to reach the Maputo Declaration target. Despite increasing since 2009, public expenditures in support of agriculture in Mozambique have failed to match in 2011, 2012 and 2013 the Maputo target of 10 percent of the national budget going to agriculture, with an average of 9.8 percent over the period. Considering the traditional, “narrow”, definition of agricultural public expenditure where only agricultural-specific expenditures are counted, we can see that Mozambique has failed to reach the Maputo target for every year over the 2009-2013 period, with a 5.2 percent average. If the government expenditures (general) only are taken into account (excluding external support), Mozambique has also failed to match the Maputo target, with an average of 5 percent over the period. The generic expectation is that an increase in agriculture investment consequently will result in increases the agriculture GDP growth. However the lack of public agriculture investment in the southern Africa region has deterred growth in the sector. Progress towards the CAADP target of 10% allocation to Agriculture can be marked ‘Yellow’.

Revista Galega de Economia/Economic Review of Galicia Vol. 23-4 (2014)
113
Figure 3: Mozambique agriculture budget and expenditure as shares of total
national budget and expenditures, 2010-2014, %
Note: For definitions on coverage of public expenditure under the two definitions see box 1 above.
*Information for 2013 up to the 23 March 2014 update. ** Budgeted data. Source: Own calculation based on official data from e-SISTAFE (see MAFAP, Mozambique). Figure4 depicts the progress made by Mozambique towards achieving the CAADP target of 6 percent agriculture GDP growth in comparison to the performance of other member countries of SADC. While the country has not been meeting the 10 percent public investment target on agriculture, its agriculture GDP has surpassed the 6 percent growth target. This deserves to be further investigated to clarify the sources of the agriculture GDP growth. Progress on this indicator can be considered ‘Green’.
Figure 4: Mozambique, growth in agriculture GDP, 1990-2013
Source: ReSAKSS (2013)
There are two main targets on fertilizer application levels that can be used to assess the performance of Mozambique in this regard – the Abuja Declaration target of 65 kg/ha and the SADC RISDP target of 50kg/ha. Mozambique is amongst the limited users of fertilizer. However, the trend in Figure shows that Mozambique’s agriculture sector is sluggishly increasing its use of fertilizer. However, cereal yields are low in Mozambique. The increase in fertilizer use over the years can be attributed to sugar industry that has taken off recently.

Revista Galega de Economia/Economic Review of Galicia Vol. 23-4 (2014)
114
The average application of fertilizer globally is 98kg/ha, while the PNISA target is 25kg/ha. Mozambique’s current average level of application of fertilizer is even lower that the averages of Low-Income countries in the SADC. However, improvements in cash crop value chains in Mozambique should increase demand for fertilizer. Progress on the fertilizer indicator can be considered ‘Red’.
Figure 5: Fertilizer application rates, average 2003-2013, kg/ha
Source: ReSAKSS (2013)
Chilonda et.al (2007) affirmed that cereals are the most important crops in SADC region, as besides being staple foods, they are also pivotal for trade as well. Maize is the predominant cereal crop in the region. In the past 15 years, Mozambique has failed to reach the SADC RISDP average maize target yield of 2,000 kg/ha (Figure 6). Two of the reasons for this are scanty use of fertilizer and improved seeds and the natural disasters, particularly floods that have plagued the country over the period. Nonetheless, maize yields in Mozambique on average have grown during the period 2000 – 2012. Despite varying average annual yields, the trends depict an overall positive growth in yields. The growth in maize can be attributed to maize being one of the important crops for food security. Therefore the government of Mozambique through MINAG has embarked on food security programs which enhance the production of maize.
Figure 6: Maize yields in Mozambique, 2003 -2012, kg/ha
Source: ReSAKSS (2013)
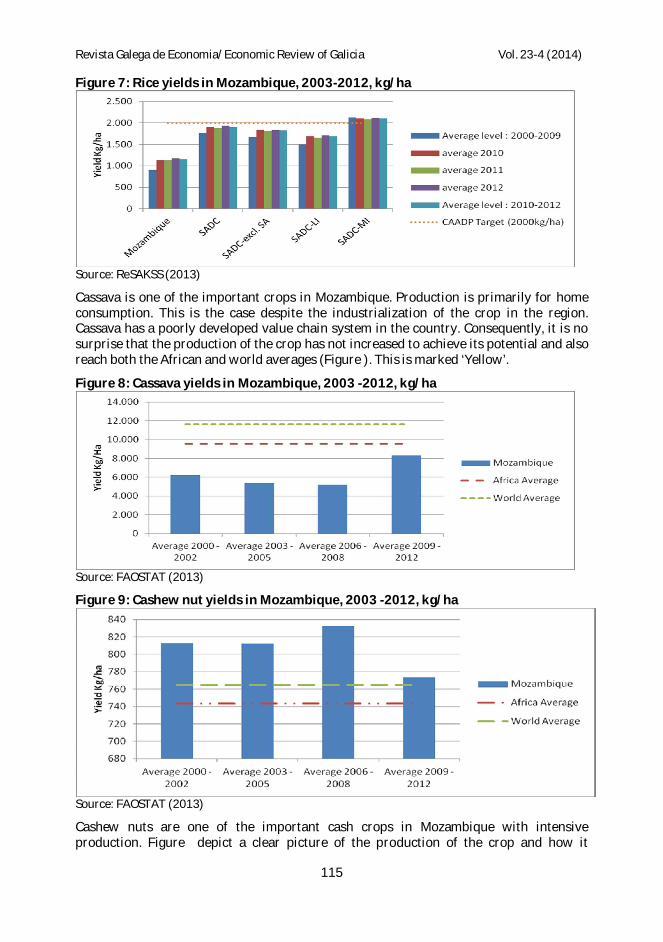
Rice yield have been constantly increasing (Figure 7) but the country still has not met the target 2,000kg/ha rice yield target, despite the notable growth. The country has received significant investment, especially in the central provinces of the country, for the enhancement of rice production. PNISA also puts much emphasis on the increased investment on the production of rice for food security reasons. Progress on Yields for these cereals can best be considered ‘Yellow’.
Revista Galega de Economia/Economic Review of Galicia Vol. 23-4 (2014)
115
Figure 7: Rice yields in Mozambique, 2003-2012, kg/ha
Source: ReSAKSS (2013)
Cassava is one of the important crops in Mozambique. Production is primarily for home consumption. This is the case despite the industrialization of the crop in the region. Cassava has a poorly developed value chain system in the country. Consequently, it is no surprise that the production of the crop has not increased to achieve its potential and also reach both the African and world averages (Figure ). This is marked ‘Yellow’.
Figure 8: Cassava yields in Mozambique, 2003 -2012, kg/ha
Source: FAOSTAT (2013)
Figure 9: Cashew nut yields in Mozambique, 2003 -2012, kg/ha
Source: FAOSTAT (2013)
Cashew nuts are one of the important cash crops in Mozambique with intensive production. Figure depict a clear picture of the production of the crop and how it
Revista Galega de Economia/Economic Review of Galicia Vol. 23-4 (2014)
116
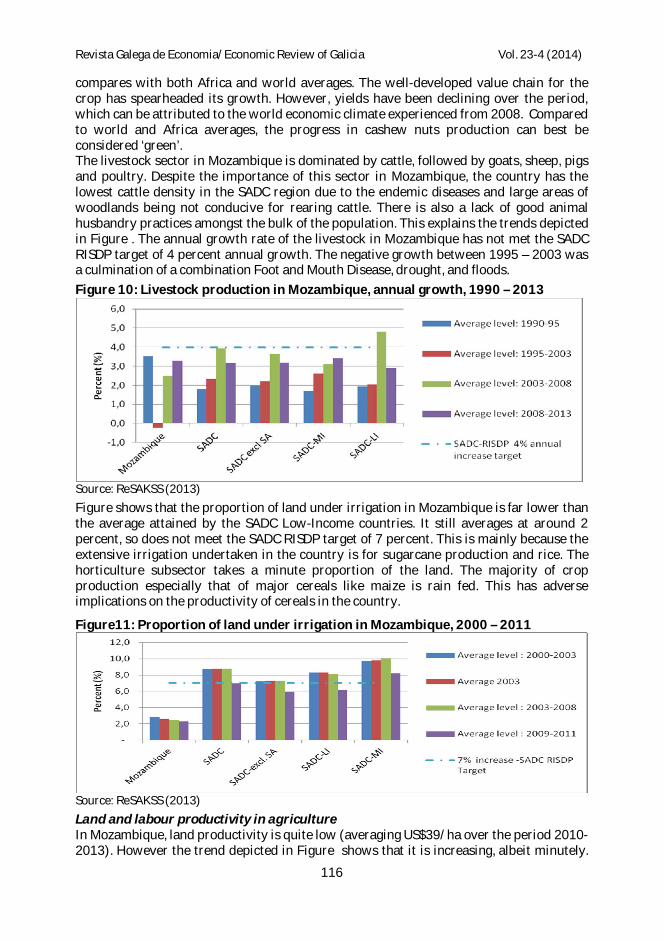
compares with both Africa and world averages. The well-developed value chain for the crop has spearheaded its growth. However, yields have been declining over the period, which can be attributed to the world economic climate experienced from 2008. Compared to world and Africa averages, the progress in cashew nuts production can best be considered ‘green’. The livestock sector in Mozambique is dominated by cattle, followed by goats, sheep, pigs and poultry. Despite the importance of this sector in Mozambique, the country has the lowest cattle density in the SADC region due to the endemic diseases and large areas of woodlands being not conducive for rearing cattle. There is also a lack of good animal husbandry practices amongst the bulk of the population. This explains the trends depicted in Figure . The annual growth rate of the livestock in Mozambique has not met the SADC RISDP target of 4 percent annual growth. The negative growth between 1995 – 2003 was a culmination of a combination Foot and Mouth Disease, drought, and floods. Figure 10: Livestock production in Mozambique, annual growth, 1990 – 2013
Source: ReSAKSS (2013) Figure shows that the proportion of land under irrigation in Mozambique is far lower than the average attained by the SADC Low-Income countries. It still averages at around 2 percent, so does not meet the SADC RISDP target of 7 percent. This is mainly because the extensive irrigation undertaken in the country is for sugarcane production and rice. The horticulture subsector takes a minute proportion of the land. The majority of crop production especially that of major cereals like maize is rain fed. This has adverse implications on the productivity of cereals in the country.
Figure11: Proportion of land under irrigation in Mozambique, 2000 – 2011
Source: ReSAKSS (2013) Land and labour productivity in agriculture In Mozambique, land productivity is quite low (averaging US$39/ha over the period 2010-2013). However the trend depicted in Figure shows that it is increasing, albeit minutely.

Revista Galega de Economia/Economic Review of Galicia Vol. 23-4 (2014)
117
This implies that Mozambique has increased the use of land saving technologies, such as improved seeds and chemical fertilizers. This may be driven by the pressure that is exerted by population growth on the land resources. However, Mozambique has the lowest land productivity amongst the Low-Income countries in the SADC region. Figure 12: Land productivity in Mozambique, 2000 – 2013, US$/ha
Source: ReSAKSS (2013)
Low labour productivity in Mozambique (Figure13), compounded by low land productivity, has a huge bearing in lowering the overall agricultural productivity of the country. Mozambique is amongst the least land and labour productive countries in the region averaging just US$39/ha and US$219/worker compared to the SADC Low-Income countries figures of US$105/ha and US$358/worker. The lack of aggressive investment on improved farm inputs and farm implements and machinery is epitomized by the low fertilizer use.
Figure13: Labour productivity in Mozambique, US$/worker
Source: World Bank (2013)
Agricultural trade performance Prawns contribute a major share to agricultural exports, followed by cotton, cashew and timber. The level of agricultural export has been increasing partly because of the opening of timber markets in China, the sugar protocol with both SADC and EU and the reverberation of the supply chain of banana, pineapple and cotton and cashew nuts. The increase in the investment in these supply chains and maritime products has bought about a big boost to the total agricultural exports. However, Mozambique is still a net importer because the country exports raw materials and intermediate products and then re-imports them as finished products. Mozambique’s trade within SADC partners is dominated by South Africa which receives 75 percent of SADC’s exports. The development of the banana supply chain has played a crucial role in expending trade. On average exports have been increasing at a higher rate than food imports hence the continuous

Revista Galega de Economia/Economic Review of Galicia Vol. 23-4 (2014)
118
decline in the food import-agriculture export ratio. Figure14 shows that the value of the total agriculture exports on average between 2008 and 2013 was US$ 422,683,000 which is considerably below the SADC Low-Income countries’ average in the same period (US$ 576,000,000). This highlights the need for the country to fortify its investment on the most commercially viable agricultural entities and at the same time continue to abate trade barriers with counterparts in the region.
Figure14: Value of total agriculture exports, 1990 – 2013, thousands of US$
Source: ReSAKSS (2013)
Mozambique imports more in value than she earns in foreign currency. This creates a trade deficit which is likely to continue for the foreseeable future because of the value of trade of raw material/primary products in foreign currency is offset by the prices of imported finished products. What also constrains agricultural exports is that the bulk of Mozambique food crops, i.e., cassava, millet, sorghum, sweet potato and yam are essentially non-tradable and have no market beyond the borders of the country. Figure 15: Ratio of agriculture imports to exports in Mozambique, 1990 – 2013
Source: ReSAKSS (2013)
The bulk of primary agricultural imports are rice, wheat and maize, which account for up to 50 percent of the value of imports. Mozambique imports more than 90 percent of its wheat requirements for baking. The capacity to produce wheat locally is still being developed. Figure 15 shows that the ratio of agricultural imports to exports in Mozambique has been decreasing over the period 1990 – 2013. This can be explained by robust attempts to invigorate the supply chains of crops in the country, hence reducing the quantity of re-imports of finished products of exported raw food materials. The ratio has decreased from 6 in the 1990s to below 2 in 2008 – 2013. Maize still features prominently in the agriculture import bill, despite the country being a major exporter of maize in the region.

Revista Galega de Economia/Economic Review of Galicia Vol. 23-4 (2014)
119
This is however consistent with Mozambique’s trade policies to allow exports from the North into Malawi while allowing imports from South Africa into Southern Mozambique. Chicken, sausage, pork and beef are the major meat products imported every year – beef mainly comes from South Africa and Swaziland, while the chicken comes from Brazil.
Development results The share of the contribution of agriculture towards the total GDP of Mozambique has been steadily increasing over the past decade; in 2012 agriculture’s contribution to the total GDP stood at 30%. This therefore emphasizes the growing significance of the sector towards the economic development of the country. This in part explains the influx of investment in the sugar, forestry and banana industries in the country.
Figure 16: GDP of each economic sector in Mozambique, 2000 – 2012, Meticals
Source: ReSAKSS (2013)
The GDP per capita of Mozambique has been steadily increasing over the past two decades. However, it is far lower than the SADC average ( Figure ). This clearly shows that the standard of living in Mozambique is far lower than that enjoyed by most of the rest of the SADC region. At the rate at which the GDP of the country is growing, it will probably take about 35 to 40 years before the country could reach the same standard as the SADC Middle-Income countries. This is by no means a conducive timeframe. Hence, it is advisable for the country to invest to increase the agriculture contribution to the GDP – mainly because approximately 75 percent of the population is dependent on agriculture for their livelihoods. This would in turn reduce poverty and enhance food security.
Figure 17: GDP per capita in Mozambique, 1990-2013, constant 2005 US$
Source: ReSAKSS (2013)

Revista Galega de Economia/Economic Review of Galicia Vol. 23-4 (2014)
120
Mozambique ‘s economy has grown over the past two decades at a rate that eclipses the CAADP target of 6 percent to reach 7.6 percent between 2003-2008. Over the last five years, the average is still high at 6.6 percent (Figure ). This is very good, despite the fact that this growth does not emanate from agriculture per se, but primarily from mining. However, such growth contributes to food security and poverty reduction.
Figure 18: Annual GDP growth rate in Mozambique, 1990-2013, percent
Source: ReSAKSS (2013) There have been no recent cases of extreme hunger in Mozambique that affect the bulk of the population for long periods. However, food reserves have been depleted from time to time, mainly because of natural disasters (droughts and floods). The country has made considerable headway in fortifying food security measures. This has helped in reducing child malnutrition and abated stunted growth in young children. Nevertheless, the Global Hunger Index (Figure ) shows that Mozambique is still ranked between alarming and extremely alarming levels (GHI scores of 20.0-29.9 and 30.0-39.9, respectively). However, the GHI score is decreasing, implying reduced hunger. Figure 19: Global Hunger Index for Mozambique, 1990 – 2013
Source: World Bank (2013) Figure 20: Cereal production per capita in Mozambique, 2000 – 2013, kg/person
Source: World Bank (2013)

Revista Galega de Economia/Economic Review of Galicia Vol. 23-4 (2014)
121
Cereal production per capita is an indicator of the food available from production which can be used to meet the food needs of the population of the country (Figure ). Mozambique has lower averages than the region (112kg/person in 2009-2013). Mozambique needs to produce more than current levels for the country to be rendered food secure and to meet the nutritional intake needs of the population. Figure shows that the proportion of the population with consumption levels below minimum dietary energy consumption requirements has been steadily decreasing since the 1990. It currently stands just below 30 percent of the population. International programs from international donor programs (i.e. World Food Programme) have helped immensely in times of food shortage, while the country’s food security programs have made substantial contribution in lowering these figures.
Figure 21: Population below minimum dietary energy consumption, 1990 – 2013, percent
Source: World Bank (2013)
There is a need for further in-depth analysis to validate the trends that have been portrayed in this section. Our analyses do not establish causal relationships between the indicators, but settled for partial analysis. These partial analyses, though not exhaustive, provide intuitive understanding of what could be expected. It is therefore imperative that further studies be conducted to obtain more conclusive understanding and comprehension of the performance of Mozambique’s agriculture sector and how it might contribute broadly to the development of the country.
Table 3: Summary of performance indicators Traffic light
Mozambique agriculture budget and expenditure as shares of total national budget and expenditures
Yellow
Mozambique, growth in agriculture GDP Green Fertilizer application rates Red Maize yields in Mozambique Yellow Rice yields in Mozambique Yellow Cassava yields in Mozambique Yellow Cashew nut yields in Mozambique Green Livestock production in Mozambique, annual growth Yellow Proportion of land under irrigation in Mozambique Yellow Land productivity in Mozambique Yellow Labor productivity in Mozambique, US$/worker Yellow Annual GDP growth rate in Mozambique, Green Global Hunger Index for Mozambique, Yellow

Revista Galega de Economia/Economic Review of Galicia Vol. 23-4 (2014)
122
5. Conclusions The PNISA provides a workable plan for achieving the objectives of the PEDSA, SADC RISDP and CAADP framework but there is still more work to be done in refining the action plan so that succinct targets are laid out for efficient implementation. Despite the fact that the country has not met most of the CAADP framework and SADC RISDP targets much progress has been made over the past three years in defining how Mozambique might achieve the transformation of its agricultural sector. However, it also is clear that any gains that have been made in building commitment to that broad objective could be lost in the coming months without strategic efforts to accelerate coordinated action under the PNISA. Mozambique needs to get better target agricultural growth enhancing investments in order to increase performance of the sector and consequently curtail poverty in the country. References Benson T., Conguara B. and Mogues T. (2013). The Supply of Inorganic Fertilizers to
Smallholder Farmers in Mozambique. International Food Policy Research Institute (IFPRI). Washington DC, USA.
Chilonda, P. and I. Minde. "Agriculture growth trends in Southern Africa." ReSAKSS Issue Brief No. 1. 2007.
Chilonda, P., Musaba E., Zikhali P. and Manyamba, C., 2012, 2011 Annual Trends and Outlook Report: Agricultural Growth Trends and Outlook for Southern Africa. ReSAKSS
Chilonda, P., Xavier, V., Luciano, L., Gêmo, H., Chamusso A., Zikhali, P., de Sousa R., Faria, A., Govereh, J. and others. (Dec. 2011). Monitoring Agriculture Sector Performance,Growth
FAO(2013).FAOSTAT Statistical Database. http://www.faostat.fao.org. Access: 20/02/2013. Gêmo H. and Chilonda P. (2013). Why Did Mozambique’s Public Extension Halt the
Implementation of the National Agrarian Extension Programme (PRONEA)? International Food Policy Research Institute (IFPRI). Washington DC, USA.
IFAD (2012). The Inernational Fund for Agriculture Development (IFAD) Annual Report. IFAD. Rome, Italy.
Kondylis F. and Mueller V. (2012). “Seeing is Believing?” Evidence from Demonstration Plot Experiment in Mozambique. MSSP Working Paper 1. International Food Policy Research Institute (IFPRI). Washington DC, USA.
MAFAP (2010) “Monitoring and Analysing Food and Agricultural Policies project methodology: concept paper”. Draft paper, www.fao.org/mafap
Rosario C. (2012). Monitoring Mozambique’s Poverty Reduction Strategy PARPA (2006 – 2013). Dep. for Inter. Dev. -UK (DFID) and Chr. Michelesen Institute. Bergen, Norway.
Uaiene R. (2013). Mozambique Policy Analysis and Planning Capacity for Improved Food Security and Nutritional Outcomes (MozCAPAN). Presentation at PARTI Annual Meeting. 14 November 2013. Maputo
Walker B., Holling C., Carpenter S., and Kinzig A. (2004). Reliance Adaptability and Transformability in Social-ecological Systems. Ecology and Society 9 (2) 5.
World Bank (2013). End Extreme Poverty, Promote Shared Prosperity. World Bank Annual Report. Washington DC, USA.
http://www.resakss.org/node/2035 Monitoring Agriculture Sector Performance, Growth and Poverty Trends in Mozambique By Pius Chilonda, Victorino Xavier, Lucia Luciano, Helder Gemo, Adriano Chamusso, Precious Zikhali, Angela Faria, Jones Govereh, Sofia Manussa, Baptista Acubar, Emmanuel Musaba,Luís Osvaldo, Noé Alage, Eulalia Macome, and Anina Manganhela December 2011http://www.resakss.org/sites/default/files/pdfs/MozSAKSS_ATOR_2010.pdf
Revista Galega de Economia/Economic Review of Galicia: https://ideas.repec.org/s/sdo/regaec.html http://www.usc.es/econo/RGE/benvidag.htm