the accounting review vol. 84, no. 4 doi: 10.2308/accr
TRANSCRIPT

1255
THE ACCOUNTING REVIEW American Accounting AssociationVol. 84, No. 4 DOI: 10.2308/accr.2009.84.4.12552009pp. 1255–1280
Internal Audit Quality andEarnings Management
Douglas F. PrawittBrigham Young University
Jason L. SmithUniversity of Nevada, Las Vegas
David A. WoodBrigham Young University
ABSTRACT: Internal auditors perform work that is relevant to their host entities’ finan-cial reporting processes; yet, little research attention has focused on the effects ofinternal auditing on companies’ external financial reporting. Using a unique and pre-viously unavailable data set, we investigate the relation between internal audit function(IAF) quality and earnings management. We measure IAF quality using a compositemeasure comprising six individual components of IAF quality based on SAS No. 65,which guides external auditors in assessing the quality of an IAF with respect to itsrole in financial reporting. Earnings management is measured using two separate prox-ies: (1) abnormal accruals and (2) the propensity to meet or barely beat analysts’ earn-ings forecasts. We find evidence that IAF quality is associated with a moderation in thelevel of earnings management as measured by both proxies.
Keywords: corporate governance; internal audit function; internal audit quality; earningsmanagement; abnormal accruals; analyst forecasts.
Data Availability: Contact the authors. Data provided by the Institute of Internal Au-ditors Research Foundation are subject to restrictions.
We express our thanks to the Institute of Internal Auditors Research Foundation (IIARF) for financial support andaccess to company data on conditions of anonymity and confidentiality. Although financially supported by theIIARF, the views expressed in this paper are those of the authors and do not necessarily represent positionsor opinions of the IIARF or The Institute of Internal Auditors (IIA). We are grateful to Thomson FinancialI /B /E /S for providing data on analysts’ earnings forecasts. We also thank Kris Allee, Ted Christensen, Bill Felix,Steve Glover, Leslie Hodder, Kenny Reynolds, Larry Rittenberg, Darren Roulstone, Nate Stephens, Urton Anderson,Jere Francis (associate editor), two anonymous reviewers, and participants at the 2006 American AccountingAssociation Annual Meeting for their comments and suggestions.
Editor’s note: Accepted by Jere Francis, special editor.
Submitted: July 2007Accepted: December 2008
Published Online: July 2009
1256 Prawitt, Smith, and Wood
The Accounting Review July 2009American Accounting Association
I. INTRODUCTION
According to a model of corporate governance put forth by the Institute of InternalAuditors (IIA), an effective internal audit function (IAF) is one of four corner-stones of corporate governance, along with the audit committee of the board of
directors, executive management, and the external auditor (IIA 2005a).1 Internal auditorsprovide a variety of services within their host organizations, including audits of financialrecords and processes. To date, however, little research has examined how internal auditingmight affect the quality of a company’s external financial reporting. In this paper, weexamine whether a high-quality IAF is associated with lower levels of earnings manage-ment. In so doing, we build on an important stream of research in accounting that examinesthe impact of various components of corporate governance on financial reporting.
Though little rigorous evidence exists, there is good reason to believe that internalauditing plays an important role in external financial reporting. For example, previous re-search has shown that management’s forecasts are more biased when misrepresentation isrelatively difficult to detect (Rogers and Stocken 2005) and that management’s communi-cations are more likely to be biased when they are not verified by a third party (Schwartzand Young 2002). Further, year-end financial audit work by external auditors appears toplay a role in moderating earnings management by minimizing managers’ opportunitiesto manage earnings in the fourth quarter (Brown and Pinello 2007). High-quality internalauditors serve as an additional third-party monitor of management’s actions on a year-roundbasis; thus, we posit that as a company’s IAF improves in quality, it is more likely to serveas a credible detection and deterrent mechanism that moderates earnings management.2
External auditing standards explicitly recognize the potential relevance of internal au-diting to the financial reporting process (AICPA 1997; PCAOB 2007a). In the audit riskmodel, a high-quality IAF can reduce overall control risk, and the work of the IAF can berelied upon to reduce detection risk to the extent that specific indicators of IAF quality arepresent (AICPA 1997; PCAOB 2007a). Recent audit regulation permits and even encouragesexternal auditors to ‘‘use the work of others to a greater extent when the work is performedby sufficiently competent and objective persons’’ (PCAOB 2007b, 13). Consistent with thesearguments, Felix et al. (2001) and Prawitt et al. (2009) find evidence that external auditfees are lower for companies that employ higher-quality IAFs, and Anderson et al. (1993)report an inverse relation between external audit fees and internal audit budgets.
We build on the limited research that examines the role of internal auditing in externalfinancial reporting by providing new evidence about the ability of the IAF to moderateearnings management. We examine the relation between IAF quality and earnings man-agement by combining publicly available data with a unique and previously unavailabledata set from the IIA. Using data from 218 publicly traded companies for fiscal years 2000through 2005 (528 firm-year responses), we test our prediction that a composite measureof IAF quality is negatively associated with two different proxies for earnings management.
We are guided in the formulation of our composite IAF quality measure by externalauditing standards. These standards provide detailed guidance to external auditors in eval-uating the individual components of IAF quality before relying on internal auditors’ work
1 Several other models of corporate governance also include the IAF as an integral part of high-quality corporategovernance (e.g., see Skousen et al. 2005; Hermanson and Rittenberg 2003; Treadway Commission 1987).
2 The earnings management proxies we study do not necessarily reflect GAAP violations. Nevertheless, to theextent management may suffer negative consequences if their accounting choices are determined to be aggressive(e.g., reputational losses, increased scrutiny, reduction in future discretionary choices, etc.), earnings managementis likely to be moderated as the quality of deterrent mechanisms, including internal auditing, increases.

Internal Audit Quality and Earnings Management 1257
The Accounting Review July 2009American Accounting Association
in the course of a financial statement audit (AICPA 1997).3 The specific components thatwe use to create our internal audit quality measure include the average experience of theinternal auditors, the percentage of internal auditors that are professionally certified (CIAor CPA), the amount of time spent training during the year, the relative focus of the IAFon financial audit work, the reporting relation of the head of the IAF, and the size of theIAF relative to its industry. We measure earnings management using two different proxies:(1) the absolute value of abnormal accruals as determined by the performance-adjusted,modified Jones model, and (2) the propensity of companies to meet versus just miss ana-lysts’ consensus earnings forecasts.
We find a significant negative relation between overall IAF quality and absolute ab-normal accruals. An examination of signed abnormal accruals suggests that this relation islargely driven by a moderation of negative abnormal accruals. We also find that companiesthat just miss analysts’ expectations have IAFs that are of significantly higher quality rel-ative to the rest of the sample. These results are robust to the inclusion of proxies forvarious factors that prior research identifies as being associated with abnormal accruals andfor various aspects of corporate governance quality, including the quality of the audit com-mittee, the quality of the external auditor, and management’s relative power (as measuredby Gompers et al.’s [2003] corporate governance index). A supplementary two-stage least-squares analysis provides additional assurance that the results for the abnormal accrualsmodel are not attributable to potential endogeneity concerns. The results of a two-stageleast-squares analysis for the miss/beat analysts’ expectation model are not significant.However, on balance we conclude that the results provide evidence consistent with the ideathat higher-quality IAFs are associated with lower levels of earnings management.
In Section II, we discuss the relevant literature and develop our research expectation.In Section III, we discuss the study’s methodology, followed by a discussion of results inSection IV. We conclude in Section V by discussing the implications of our findings, thelimitations of our study, and areas for future research.
II. LITERATURE REVIEW AND RESEARCH EXPECTATIONAs a result of the highly publicized accounting scandals in recent years, the IAF has
received greater attention as an important contributor to effective corporate governance andquality external financial reporting. For example, Time named internal auditor CynthiaCooper its ‘‘Person of the Year’’ in 2002 for her discovery and reporting of the WorldComfraud (Lacayo and Ripley 2002), and the New York Stock Exchange now requires that alllisted companies maintain an IAF (NYSE 2004). The NASDAQ stock exchange does notrequire listed companies to have an IAF, but does encourage it as a best practice (Harrington2004).
Though regulators and the popular press have only recently begun to recognize theimportance of the IAF with respect to external financial reporting, the IAF has long beenrecognized in the academic literature as a key component of corporate governance with animportant monitoring role (e.g., see Anderson et al. 1993), and models of corporate gov-ernance have long included the IAF (e.g., see Skousen et al. 2005; Hermanson and
3 Specifically, SAS No. 65, The Auditor’s Consideration of the Internal Audit Function in an Audit of FinancialStatements, indicates that external auditors must evaluate an IAF’s competence, objectivity, and work performedbefore relying on the IAF’s work. The standard also suggests specific indicators for evaluating the IAF in eachof these three areas, several of which we include in our composite quality measure (AICPA 1997). PCAOBstandards relating to the external auditor’s reliance on work performed by the internal auditor parallel those ofthe AICPA (PCAOB 2007a).

1258 Prawitt, Smith, and Wood
The Accounting Review July 2009American Accounting Association
Rittenberg 2003; Treadway Commission 1987). As mentioned previously, the IIA modelof corporate governance suggests that the IAF is one of four cornerstones of high-qualitycorporate governance, together with the audit committee, the external auditor, and man-agement. Of these four cornerstones, only management and the IAF typically have day-to-day, year-round dealings with the company. A significant body of empirical accountingresearch suggests that management is often willing to act opportunistically to the detrimentof key stakeholders. The IAF is often the party primarily responsible for the day-to-daymonitoring of management’s actions, including those relating to external financial reporting.
Though the IAF has the potential to significantly influence a company’s external finan-cial reporting, this potential relation has not been subjected to a great deal of rigorousexamination due to the absence of relevant data. We are aware of only one prior effort touse archival data to examine the effect of the IAF on earnings management. Using a sampleof 434 Australian companies, Davidson et al. (2005) find no evidence that the presence(versus absence) of an IAF is associated with a lower level of earnings management.
Expanding on the scope of the Davidson et al. (2005) study is important for severalreasons. First, using the proxy of IAF presence versus absence does not generalize well tomost large- or medium-sized, publicly traded companies in the United States. The require-ments of some stock exchanges, the significant SOX compliance requirements, and theincreased focus on corporate governance have resulted in nearly all large- and medium-sized publicly traded companies in the United States having an IAF of some kind. Withrespect to these companies, the effect of the quality of the IAF on financial reporting is amore relevant question than the effect of the presence of an IAF. Second, the lack ofstatistically significant evidence of an association between the presence of the IAF andearnings management may be attributable to the facts that companies invest in and use theirIAFs quite differently and that IAFs vary widely in quality. A dichotomous variable indi-cating the presence or absence of an IAF cannot account for the significant variation in thenature and focus of the companies’ investments in their IAF and is thus an inherently noisymeasure.
Although extant archival studies provide little evidence concerning the relation betweeninternal auditing and earnings management, experimental studies provide some evidencethat an effective IAF can deter aggressive financial reporting. Schneider and Wilner (1990)find that both internal and external auditing have a deterrent effect on financial reportingirregularities and that the effects of internal auditing are similar to those of external auditing.Asare et al. (2008) demonstrate that internal auditors are sensitive to management’s incen-tive to misreport financial information and that they increase budgeted work hours whenmanagement has a high incentive to misreport. These experimental studies suggest thatinternal auditing can play a role in mitigating aggressive accounting behavior by manage-ment. It is reasonable to expect, however, that the degree of this deterrent effect will dependon the quality of the IAF, which is rooted in the IAF’s competence and in its independencefrom management.
As mentioned previously, research has shown that management is less biased whentheir bias is likely to be perceived by others (e.g., see Rogers and Stocken 2005; Schwartzand Young 2002). Hunton et al. (2006) demonstrate that management is less likely tomanage earnings when there is greater transparency. Brown and Pinello (2007) show thatyear-end financial audit work by external auditors limits managers’ opportunities to manageearnings in the fourth quarter. A high-quality IAF can provide greater transparency in theorganization through monitoring and make it more likely that bias in management’s judg-ments will be detected. Thus, a high-quality IAF focused on improving financial reporting

Internal Audit Quality and Earnings Management 1259
The Accounting Review July 2009American Accounting Association
can serve to detect and deter opportunistic or biased choices. Based on these arguments,our expectation is that a high-quality IAF is associated with less earnings management.
III. METHODOLOGY AND MODEL SPECIFICATIONThe purpose of this study is to test whether IAF quality is negatively associated with
earnings management. Accordingly, we develop a composite measure of internal audit qual-ity from a proprietary archive developed and maintained by the IIA, which contains datarelating to hundreds of different entities and their IAFs. We correlate this measure with twoindependent measures of earnings management: (1) performance-adjusted abnormal accru-als (Kothari et al. 2005) and (2) a measure capturing whether firms beat or miss analysts’forecasts. In the next sections, we discuss the data and our sample, our measures of in-ternal audit quality, the abnormal accrual model, and the beat/miss analysts’ forecastmodel.
Data and SampleThe data we use to measure IAF quality comes from the IIA GAIN database, which is
a compilation of survey responses from chief audit executives (CAEs) associated with IIAmember organizations.4 The IIA does not identify the responding organizations in data thatthey share for benchmarking or research purposes. Therefore, with permission, we per-formed a match of several self-reported fields in the survey with data items in Compustatin order to obtain measures relating to earnings management as well as relevant controlvariables.
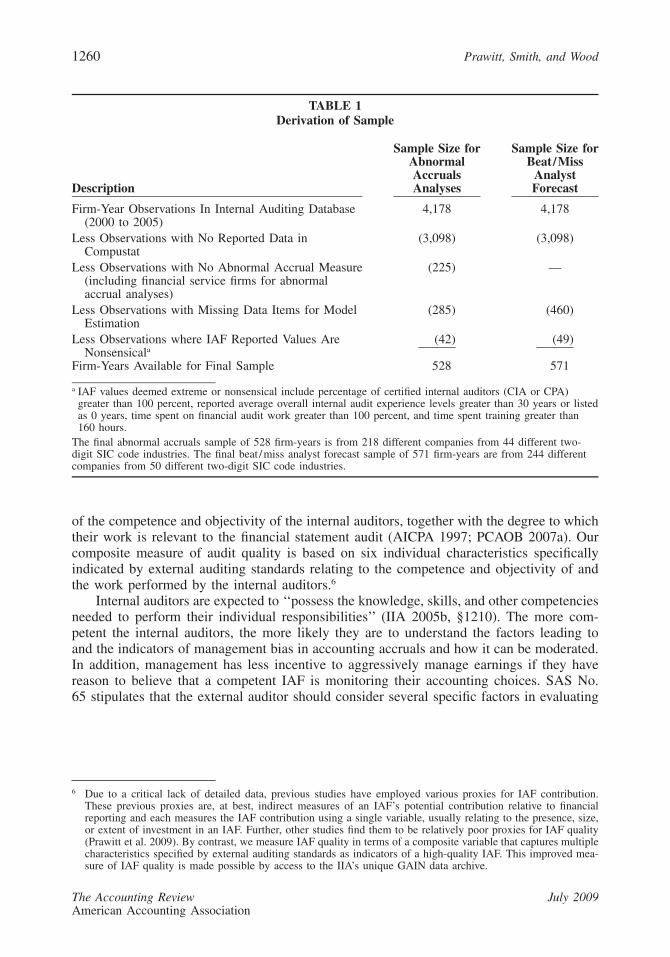
To match the GAIN data with data in Compustat, we matched self-reported total assets,total revenues, and operating industry in the IIA database with similar fields in the Com-pustat database.5 After identifying firms and procuring necessary data from the Compustatand Risk Metrics databases (described in more detail later in the paper), we obtainedsufficient data to estimate our abnormal accrual models for 528 firm-year observations (218unique companies) for fiscal years 2000 to 2005. For purposes of the beat/miss analysts’forecast model, we have 571 firm-year observations (244 unique companies) for the sametime period. Table 1 includes an explanation of how we arrived at our final samples.
Measures of Internal Audit QualityTo test our research expectation, we derive a composite measure of internal audit quality
based on external auditing standards. External auditing standards define IAF quality in terms
4 The GAIN survey is approximately 30 pages long and covers a wide range of institutions (e.g., publicly tradedcompanies, private companies, educational institutions, divisions within companies, and educational and gov-ernmental institutions) and various aspects of internal audit practice. Its primary purpose is to provide bench-marking data to participating firms. A copy of the most recent survey can be found by searching for ‘‘GAINbenchmarking’’ on the IIA’s website (http: / /www.theiia.org). The survey has changed slightly from year to year;however, all of the questions included in this study were unchanged from 2000 to 2005.
5 Every firm-year match in our sample represents a unique combination of assets, revenues, and industry identifiersreported in both the GAIN and Compustat databases. In other words, there were no instances where more thanone firm from Compustat matched the combination of the three identifiers. In addition, the IIA kindly providednames for a subset of firms in the GAIN database, which we were able to use to validate our matching process.Our matches were consistent in every case with the information provided by the IIA.
1260 Prawitt, Smith, and Wood
The Accounting Review July 2009American Accounting Association
TABLE 1Derivation of Sample
Description
Sample Size forAbnormalAccrualsAnalyses
Sample Size forBeat /Miss
AnalystForecast
Firm-Year Observations In Internal Auditing Database(2000 to 2005)
4,178 4,178
Less Observations with No Reported Data inCompustat
(3,098) (3,098)
Less Observations with No Abnormal Accrual Measure(including financial service firms for abnormalaccrual analyses)
(225) —
Less Observations with Missing Data Items for ModelEstimation
(285) (460)
Less Observations where IAF Reported Values AreNonsensicala
(42) (49)
Firm-Years Available for Final Sample 528 571
a IAF values deemed extreme or nonsensical include percentage of certified internal auditors (CIA or CPA)greater than 100 percent, reported average overall internal audit experience levels greater than 30 years or listedas 0 years, time spent on financial audit work greater than 100 percent, and time spent training greater than160 hours.
The final abnormal accruals sample of 528 firm-years is from 218 different companies from 44 different two-digit SIC code industries. The final beat /miss analyst forecast sample of 571 firm-years are from 244 differentcompanies from 50 different two-digit SIC code industries.
of the competence and objectivity of the internal auditors, together with the degree to whichtheir work is relevant to the financial statement audit (AICPA 1997; PCAOB 2007a). Ourcomposite measure of audit quality is based on six individual characteristics specificallyindicated by external auditing standards relating to the competence and objectivity of andthe work performed by the internal auditors.6
Internal auditors are expected to ‘‘possess the knowledge, skills, and other competenciesneeded to perform their individual responsibilities’’ (IIA 2005b, §1210). The more com-petent the internal auditors, the more likely they are to understand the factors leading toand the indicators of management bias in accounting accruals and how it can be moderated.In addition, management has less incentive to aggressively manage earnings if they havereason to believe that a competent IAF is monitoring their accounting choices. SAS No.65 stipulates that the external auditor should consider several specific factors in evaluating
6 Due to a critical lack of detailed data, previous studies have employed various proxies for IAF contribution.These previous proxies are, at best, indirect measures of an IAF’s potential contribution relative to financialreporting and each measures the IAF contribution using a single variable, usually relating to the presence, size,or extent of investment in an IAF. Further, other studies find them to be relatively poor proxies for IAF quality(Prawitt et al. 2009). By contrast, we measure IAF quality in terms of a composite variable that captures multiplecharacteristics specified by external auditing standards as indicators of a high-quality IAF. This improved mea-sure of IAF quality is made possible by access to the IIA’s unique GAIN data archive.

Internal Audit Quality and Earnings Management 1261
The Accounting Review July 2009American Accounting Association
competence, including professional experience, professional certifications, and training(AICPA 1997). We use three variables to proxy for these factors, Experience, Certification,and Training. Experience is the average number of years of internal auditing experience ofthe internal auditors in the IAF. Certification is the percentage of internal auditors in theIAF who have the CIA or CPA certification. Training is the average number of hours oftraining the internal auditors completed during the year.7
SAS No. 65 also requires that the external auditor evaluate the objectivity of a client’sIAF in determining an appropriate level of reliance (AICPA 1997). Objectivity is importantto an internal auditor’s ability to play a significant role in affecting the quality of a com-pany’s financial reporting. The more objective the IAF, the more likely it will be to reportevidence of earnings management should it be discovered. Also, an objective IAF wouldbe less likely to be ‘‘steered away’’ from working in areas in which management wasmanaging earnings through manipulation of accruals. According to SAS No. 65 and relevantIIA standards, the primary organizational aspect of IAF objectivity revolves around thereporting status of the head of the IAF, or chief audit executive (CAE). To proxy forobjectivity, we use CAEAC—a dummy variable indicating whether the head of the IAFreports to the audit committee (CAEAC � 1) or to management (CAEAC � 0).8
Because internal auditing is a relatively unregulated activity, the focus of the IAF varieswidely across organizations. IAFs may perform, among other tasks, financial, operational,fraud, control, compliance, or systems audits as well as internal consulting projects formanagement (e.g., see Anderson 1996; Klinkerman 1996; Thevenin 1997). SAS No. 65requires the external auditor to evaluate the nature of the work performed by the IAF interms of its relevance to financial reporting as it concerns the work of the external auditor.To proxy for the degree of IAF focus on financial work, we include TimeFin, which is thepercentage of internal audit time spent performing financial audits.9
Finally, we include IASize as an overall measure of the entity’s investment in the IAF.IAFs that are relatively well funded should have greater ability to monitor a company’stransactions. The greater the monitoring ability of the IAF, the more able it will be to detectand deter management bias or opportunism. IASize is computed by subtracting the averagedollar amount spent on internal auditing for the industry, divided by the average total assetsof the industry, from the dollar amount spent on internal auditing per company, divided bythe company’s total assets. The result of this calculation is then divided by the average
7 Other factors specified in the standard for the external auditor to evaluate with respect to internal auditorcompetence are: audit policies, programs, and procedures; internal auditors’ performance; quality of workingpaper documentation, reports, and recommendations; practices regarding assignment of internal auditors; andpractices regarding supervision and review. Measures relating to these other factors are not available in the IIA’sGAIN database and are not otherwise publicly available.
8 SAS No. 65 specifies two elements in evaluating an IAF’s objectivity: (1) the organizational status of the internalauditor responsible for the IAF and (2) the policies that the IAF has in place to maintain internal auditors’objectivity with respect to areas audited. The IIA GAIN database has information about the organizational statusof the CAE (i.e., reporting relationship), but does not contain detailed information regarding IAF policies tomaintain objectivity.
9 In practice, the external auditor would also make an assessment of the quality of the work performed by theinternal auditor that is specifically relevant to the external auditor’s opinion. The IIA GAIN database includesdata that is germane to the general nature and quality of the IAF, but does not include quality assessments ofspecific work performed relative to particular engagements.

1262 Prawitt, Smith, and Wood
The Accounting Review July 2009American Accounting Association
dollar amount spent on internal auditing for the industry, divided by the average total assetsof the industry.10
To create an overall, composite measure of internal audit quality, we dichotomize eachvariable by assigning a value of 1 to the variable if it is above the median of our samplefor that variable, and 0 if it is below the sample median.11 We then sum the scores of theindividual quality components to create IAQuality, a composite measure of internal auditquality potentially ranging from 0 to 6. Larger IAQuality scores indicate IAFs that are ofhigher quality.12
Table 2, Panel A presents descriptive statistics relating to IAQuality and the individualquality components used to create IAQuality. Of note in Panel A is the significant variationin IAQuality and in each of the individual components, which are combined to provide anoverall quality measure. The variable ranges from 0 to 5 with first and third quartile scoresof 2 and 3, respectively. Despite the fact that included companies self-select into the IIA’sGAIN database, these descriptive data suggest that IAFs representing a reasonable degreeof variation in quality responded to the survey.
Abnormal Accrual ModelTo measure abnormal accruals, we use the performance-adjusted cross-sectional vari-
ation of the modified Jones model (Dechow et al. 1995) as reported by Kothari et al. (2005).Kothari et al.’s (2005) simulation analysis demonstrates that including an intercept term andadjusting for performance reduces noise and increases the accuracy of the abnormal accrualmeasure. Accordingly, our estimate of abnormal accruals is the residual from the followingregression:
TA 1 �REV � �ARit it it� � � � � �� � � �0 1 2A A Ait�1 it�1 it�1
PPE NIit it� � � � � ε .� � � �3 4 itA Ait�1 it�1
We use the model to separately estimate an abnormal accrual by industry (two-digit SICcode) and year for all firms in Compustat from 2000 to 2005.13 We require ten firm-year
10 In formula form this calculation is as follows:
(Firm $IAF/Firm $TA) � (Ind. $IAF/ Ind. $TA)(Ind. $IAF/ Ind. $TA)
This number is computed for all firms in the GAIN database, regardless of whether these firms could be matchedwith Compustat. Therefore, we used self-reported industry codings from the GAIN database. The GAIN data-base separates companies into 13 different industry groupings including: Agriculture /Mining /Construc-tion, Petroleum, Wholesale /Retail, Chemical /Drug, Manufacturing, Educational Institutions, Transportation,Communications /Telecommunications, Banking /Financial, Utilities /Gas /Electric, Insurance, Services, andGovernment.
11 We assign one point to the IASize quality component if it is positive (above the industry average) and no pointsif it is negative (below the industry average).
12 Previous external audit fee research demonstrates that the external audit fee is significantly lower for firms thathave a high-quality IAF (e.g., see Felix et al. 2001).
13 Consistent with prior research using abnormal accruals as a proxy for earnings management, we exclude financialinstitutions (SIC 6000 to 6900) from our analysis as these companies have special accounting practices thatmake estimating abnormal accruals difficult.

InternalA
uditQ
ualityand
Earnings
Managem
ent1263
The
Accounting
Review
July2009
Am
ericanA
ccountingA
ssociation
TABLE 2Descriptive Statistics and Correlations
Panel A: Descriptive Statistics of Internal Audit Characteristics
Variable Mean Std. Dev. Min P25 Median P75 Max
IAQuality 2.42 1.15 0.00 2.00 2.00 3.00 5.00Experience 6.35 4.18 1.00 3.00 6.00 8.00 28.00Certification 0.59 0.30 0.00 0.40 0.55 0.71 2.00CAEAC 0.69 0.46 0.00 0.00 1.00 1.00 1.00TimeFin 31.79 20.01 0.00 12.00 33.00 48.00 80.00Training 59.21 26.32 0.00 40.00 60.00 80.00 160.00IA Size 0.51 1.27 �0.79 �0.27 0.14 0.78 9.71
Panel B: Descriptive Statistics of Variables Included in Our Models
Variable Mean Std. Dev. Min P25 Median P75 Max
AbnAccr �0.046 0.108 �0.883 �0.083 �0.022 0.013 0.325ACEffectiveness 9.36 2.18 0.00 10.00 10.00 10.00 10.00AuditorSpecialist 0.52 0.50 0.00 0.00 1.00 1.00 1.00Gindex 9.87 2.34 3.00 8.00 10.00 11.00 16.00Assets 21,425 36,478 162 3,589 11,274 26,056 370,782Age 44.66 13.14 14.00 35.00 52.00 54.00 56.00Leverage 0.48 0.14 0.05 0.39 0.48 0.57 1.21Complexity 3.55 2.14 1.00 1.00 3.00 5.00 10.00CFO 2,218 4,022 �3,657 270 828 2,198 33,764SalesGrowth 0.10 0.33 �0.94 �0.01 0.06 0.15 4.62MB 2.68 16.58 �280.44 1.45 2.06 3.47 115.84CFOVolatility 538 877 7 92 223 571 6,409ROA 0.04 0.07 �0.34 0.02 0.04 0.07 0.51Loss 0.15 0.35 0.00 0.00 0.00 0.00 1.00NYSE 0.92 0.27 0.00 1.00 1.00 1.00 1.00
(continued on next page)

1264P
rawitt,
Smith,
andW
ood
The
Accounting
Review
July2009
Am
ericanA
ccountingA
ssociation
TABLE 2 (continued)
Panel C: Spearman and Pearson Correlations (above/below the diagonal, respectively)
Variable (1) (2) (3) (4) (5) (6) (7) (8) (9) (10) (11) (12) (13) (14) 15) (16) (17) (18)
1 AbnAccr — — �0.08 �0.09 �0.16 0.11 �0.07 �0.17 �0.09 0.01 0.04 �0.20 0.30 0.13 0.20 0.06 �0.072 �AbnAccr — — 0.00 0.03 �0.03 0.07 �0.03 �0.08 0.06 0.06 �0.18 �0.20 0.14 0.17 0.00 0.05 0.063 �AbnAccr — — 0.12 0.11 0.17 �0.14 0.08 0.21 0.11 0.03 �0.07 0.22 �0.30 �0.10 �0.22 �0.07 0.114 IAQuality �0.07 �0.04 0.09 �0.08 0.02 0.01 �0.20 �0.03 0.18 0.08 �0.21 �0.01 �0.14 �0.25 �0.09 0.01 0.155 ACEffectiveness �0.04 0.03 0.03 �0.09 0.12 0.00 0.10 0.14 0.01 �0.01 0.07 �0.02 �0.02 0.05 �0.08 0.07 0.036 AuditorSpecialist �0.12 �0.14 0.09 0.02 0.08 �0.15 0.08 0.13 0.09 0.03 0.02 �0.05 �0.04 0.03 �0.05 �0.08 0.177 Gindex 0.03 0.03 �0.03 �0.01 0.06 �0.14 �0.14 0.04 0.03 0.09 �0.10 �0.05 0.01 �0.06 0.04 �0.08 0.058 Assets �0.07 0.06 0.09 �0.20 0.08 0.09 �0.09 0.23 �0.03 0.08 0.84 �0.02 0.18 0.83 0.00 �0.04 0.059 Age �0.16 0.00 0.20 0.07 0.04 0.04 0.08 0.25 0.04 0.18 0.17 �0.03 �0.01 0.12 0.04 �0.12 0.28
10 Leverage 0.01 0.04 �0.03 0.16 0.01 0.10 0.00 �0.03 0.05 �0.07 �0.10 0.00 �0.05 �0.06 �0.19 0.12 0.1911 Complexity 0.00 0.15 0.03 0.07 �0.03 0.03 0.08 0.09 0.22 �0.09 0.03 0.07 �0.02 0.00 �0.04 0.04 0.1012 CFO 0.12 0.07 �0.10 �0.21 0.00 �0.09 �0.13 0.64 0.03 �0.22 0.00 0.00 0.36 0.76 0.26 �0.18 0.0513 SalesGrowth �0.11 �0.02 0.15 0.09 �0.02 0.00 �0.02 0.00 0.00 0.05 0.05 0.00 0.09 �0.10 0.23 �0.24 0.0014 MB �0.15 0.17 0.23 �0.05 0.00 0.08 �0.02 0.07 0.08 �0.09 0.03 0.05 �0.02 0.23 0.52 �0.16 �0.0915 CFOVolatility 0.10 0.17 �0.08 �0.20 0.02 �0.02 �0.14 0.63 0.03 �0.12 �0.01 0.79 �0.03 0.04 0.07 0.07 �0.0116 ROA 0.33 0.05 �0.37 �0.02 �0.07 �0.05 0.03 �0.03 0.02 �0.09 �0.02 0.20 0.12 �0.14 0.03 �0.57 0.0117 Loss 0.00 0.00 �0.01 0.02 0.06 �0.08 �0.08 �0.04 �0.13 0.12 0.03 �0.10 �0.16 0.01 0.07 �0.54 �0.1218 NYSE �0.05 0.03 0.06 0.15 0.02 0.17 0.04 0.09 0.30 0.22 0.09 �0.11 0.02 �0.03 �0.07 0.02 �0.12
Italics indicate p-value � 0.10.Bold indicates p-value � 0.05.Correlations for �AbnAccruals (�AbnAccruals) are the correlations with only those firm-year responses that had abnormal accruals greater or less than zero. Reporteddescriptive statistics and correlations are for the abnormal accrual analysis sample (n � 528). Descriptive statistics are similar for the analyst’s forecast sample.See the Appendix for variable descriptions.

Internal Audit Quality and Earnings Management 1265
The Accounting Review July 2009American Accounting Association
observations per industry to compute the abnormal accrual measure. We use the absolutevalue of the error term, eit, as our measure of abnormal accruals. However, to gain furtherinsights from the data, we also report our results separately for income-increasing andincome-decreasing abnormal accruals (see Hribar and Nichols 2007). As seen in Panel Bof Table 2, AbnAccr (before taking the absolute value) ranges from �0.833 to 0.325 witha mean (median) value of �0.046 (�0.022). Kothari et al. (2005) report a similar mean of�0.03 for all firms in Compustat with sufficient data to estimate abnormal accruals from1963 to 1999. However, the maximum and minimum of our sample fall within the first andthird quartiles reported by Kothari et al. (2005). This suggests that our sample is similar tothe full Compustat population in terms of mean abnormal accruals, but it does not reflectas much variation in abnormal accruals as the Compustat population.
To test the relation between internal audit quality and abnormal accruals, we use thefollowing model:14
AbnAccr � � � � IAQuality � � ACEffectiveness0 1 2
� � AuditorSpecialist � � Gindex � � Assets � � Age3 4 5 6
� � Leverage � � Complexity � � CFO � � SalesGrowth7 8 9 10
� � MB � � CFOVolatility � � ROA � � Loss � � NYSE11 12 13 14 15
� � IndustryDummies � � YearDummies � ε.16–20 21–25
See the Appendix for variable descriptions.The dependent variable, AbnAccr, is the absolute value of the abnormal accrual mea-
sure. We also separate AbnAccr into firm-year responses that are strictly positive(�AbnAccr) or strictly negative (�AbnAccr). To test our research question, we includeIAQuality as an independent variable. As previously explained, this metric proxies for theoverall quality of the IAF; we expect the measure to be negatively associated with AbnAccr.In addition to IAQuality, we include 24 control variables in our model.
Because internal audit is a component of corporate governance, we include three controlvariables to measure the contribution of the other three components of corporate governance(IIA 2005a). The inclusion of a measure for each component of corporate gover-nance increases the likelihood that the coefficient on IAQuality represents the incrementalcontribution of the IAF toward the moderation of earnings management.
Previous research demonstrates that higher-quality audit committees are associated withgreater internal auditor involvement, including larger budgets (Carcello et al. 2005), longermeetings, increased private access to the audit committee, and reviews of audit proposalsand results (Raghunandan et al. 2001). Abbott et al. (2007) find that effective audit com-mittees are more able to discern between the types and providers of outsourced internalaudit services. Other research suggests that more effective audit committees are associatedwith lower levels of earnings management (e.g., see Klein 2002; Xie et al. 2003; Bedard
14 Results are qualitatively similar to those reported when we winsorize or trim the abnormal accrual estimates atthe 1 percent level. Also, because we have multiple observations from the same company, we use cluster-adjustedstandard errors in computing z-statistics and subsequent p-values. The point estimates of the coefficients areunaffected by this procedure.

1266 Prawitt, Smith, and Wood
The Accounting Review July 2009American Accounting Association
et al. 2004). Using a larger sample and controlling for more corporate governance mech-anisms, Larcker et al. (2007) find a mixed relation between proxies for corporate gover-nance, including audit committee measures, and abnormal accruals.15 To control for theeffect the audit committee has on abnormal accruals, we include ACEffectiveness.
We form ACEffectiveness by creating a composite score comprising ten dummy vari-ables suggested by the Blue Ribbon Committee for Audit Committee Effectiveness (BRC1999).16 For each attribute the company possesses, we assign the company one point andthen sum the scores to create ACEffectiveness.17 As in previous research, we expect toobserve a negative coefficient on ACEffectiveness, though the mixed evidence presented byLarcker et al. (2007) casts some doubt on this expectation.
AuditorSpecialist is a dummy variable that indicates whether the external auditor is anindustry specialist auditor.18 We define industry-specialist auditor in a similar fashion toPalmrose (1986); that is, an external audit firm is considered the industry specialist(AuditorSpecialist � 1) if the firm provides within-industry market share 30 percent greaterthan if the audit firms were to split the industry evenly among themselves. We expect toobserve a negative coefficient on AuditorSpecialist.
Finally, to proxy for management’s role in corporate governance, we include Gomperset al.’s (2003) corporate governance measure—Gindex. Gindex is formed by giving anorganization a point for each takeover defense or lack of shareholder rights for 24 differentprovisions. Higher Gindex scores suggest that management has greater power, which sug-gests lower corporate governance quality. Previous research by Bergstresser and Philippon(2006) include Gindex in an abnormal accrual model and find no relation with abnormalaccruals. However, Bergstresser and Philippon (2006) include dummy variables to representvarious levels of Gindex, whereas we include a single continuous variable. We expect toobserve a positive coefficient on the Gindex score.
The remaining control variables are included to control for other factors that mayimpact a company’s abnormal accruals. Dechow and Dichev (2002) find that larger firmshave larger accruals; hence, we control for firm size by including the log of total assets(Assets). We include Age because previous research has shown that accruals change basedon the firm life cycle (Anthony and Ramesh 1992). Prior research has found that highlyleveraged firms are associated with both income-increasing accruals (Press and Weintrop1990) to meet debt covenant restrictions and income-decreasing accruals (DeAngelo et al.1994) to reduce earnings for contractual renegotiations. Because we use the absolute value
15 Larcker et al. (2007) do not consider internal audit characteristics, external audit characteristics, or managementcharacteristics in testing the relation between abnormal accruals and corporate governance, but instead, usingproprietary data, focus on characteristics of the board of directors, stock ownership by executives and boardmembers, stock ownership by institutions, stock ownership by activist holders, debt and preferred stock holdings,compensation mix variables, and anti-takeover devices.
16 The ten questions relate to independence, financial literacy skills, assessing the committee’s charter, fulfillingthe charter, accountability for auditor relations, relation with external auditor, discussion of accounting, disclosureof reviews, and reviewing of quarterly reports. Qualitatively similar results are obtained if we average the tenitems or create a single composite measure using factor analysis. The items are highly correlated and thereforewe do not include all the items individually in the same regression.
17 A possible alternative measure for controlling for audit committee quality is the presence or absence of an auditcommittee. We cannot use this proxy as all but three firm-year responses in our sample indicate presence of anaudit committee.
18 An alternative measure of auditor quality is Big N versus non-Big N auditor. Previous research suggests thatBig N accounting firms tend to be more conservative in their auditing approach than smaller firms (Becker etal. 1998; Francis et al. 1999; Francis and Krishnan 1999); therefore, earnings management is likely to be lowerfor companies audited by a Big N auditor. We do not include a measure for Big N auditor because all but eightfirm-year observations in our sample indicate an audit by a Big N auditor.

Internal Audit Quality and Earnings Management 1267
The Accounting Review July 2009American Accounting Association
of abnormal accruals as our primary dependent measure, we expect Leverage to control forboth effects and therefore to have a negative sign as demonstrated in prior research (Frankelet al. 2002). We include Complexity, which measures the number of operating segments,because managers of companies that have more complex operations may both invest inhigher-quality IAFs and have greater ability to hide earnings management efforts.
To control for the possibility that our results are due to firm growth, we include CFO(Dechow et al. 1996), SalesGrowth (Menon and Williams 2004), and MB (Matsumoto2002). In addition, we follow Dechow and Dichev (2002) in controlling for the volatilityof cash flows by including CFOVolatility. Managers at firms that are struggling have in-creased incentives to manage earnings; therefore, we include ROA and Loss. ROA is com-puted as net income divided by assets, and Loss is a dichotomous variable taking the valueof 1 (0) if net income is below (above) zero for the year. We include NYSE because firmslisted on this exchange are required to have an IAF (NYSE 2004). Finally, we includeIndustryDummies and YearDummies to control for differing levels of abnormal accruals byindustry and year. The five industry dummy variables control for industry at the one-digitSIC level.
Beat/Miss Analysts’ Forecast ModelAn alternative measure of earnings management is whether management attempts to
meet or beat certain earnings thresholds such as analysts’ forecasts (e.g., see Brown andCaylor 2005; Burgstahler and Dichev 1997; DeGeorge et al. 1999). Brown and Caylor(2005) find evidence that meeting or beating analysts’ forecasts was the most importantmetric managers sought to achieve from the mid-1990s to 2002. Thus, as a secondary proxyfor earnings management, we consider whether companies that employ a high-quality (low-quality) IAF are more (less) likely to miss (meet or just exceed) an analysts’ forecasts. Weconsider meeting/beating and missing analysts’ forecasts for annual forecasts because ourdata relating to IAF quality is recorded annually.
We gather our data from Thomson Financial I /B/E/S for 2000 to 2005. Using thesummary file of the I/B/E/S database, we compute whether the company made or missedanalysts’ forecasts for earnings by subtracting the consensus annual earnings forecast fromthe reported consensus forecast closest to the announcement date from actual annual earn-ings. The companies that are most likely to have managed (not managed) earnings are thosethat meet/ just beat (just miss) analysts’ expectations. For our tests, we therefore comparethese firms against each other and against all firms that did not narrowly meet/miss analysts’expectations. To compute which firms just met/missed analyst’s expectations, we dividehow close the firm was to consensus forecast by price at the beginning of the year andthen examine a bin that is within 0.0005 of 0.19 This results in 42 firm-years that missedanalysts’ expectations, 139 firm-years that met or beat analysts’ expectations, and 390 otherfirm-year responses.
We use the following multinomial logistic model20 to test whether companies that justmissed (met) analyst expectations are more (less) likely to have a high-quality IAF:
19 As an alternative to this measure, we create bins without scaling. All firm-years responses that are within $0.02per share (unscaled by differences in share price across observations) of analysts’ expectations (either above orbelow) are separated into bins. The results are qualitatively similar to those reported using this unscaled measure.
20 The multinomial logit model reports all pairwise combinations with respect to three categories of the dependentvariable (i.e., just missed / just beat, just missed /all other, just beat / all other).

1268 Prawitt, Smith, and Wood
The Accounting Review July 2009American Accounting Association
Above � � � � IAQuality � � ACEffectiveness � � AuditorSpecialist0 1 2 3
� � Gindex � � Assets � � Age � � Leverage � � Complexity4 5 6 7 8
� � CFO � � SalesGrowth � � MB � � CFOVolatility9 10 11 12
� � ROA � � Loss � � NYSE � � IndustryDummies13 14 15 16–20
� � YearDummies � ε.21–25
See the Appendix for variable descriptions.The dependent variable Above is an ordinal variable taking the value of 1 if the com-
pany just missed the consensus analysts’ expectation, 2 if the company just met or beatanalysts’ expectations, and 3 in all other scenarios. The variables are defined the same asin the abnormal accrual model. We expect to observe the same signs on the coefficients ofthese variables in this model as in the abnormal accruals model.
IV. RESULTSDescriptive Statistics
Table 2 presents descriptive statistics relating to the components of our compositemeasure of IAF quality and to the variables included in the model using abnormal accrualsas the dependent variable (Panels A and B, respectively). Panel C presents Spearman andPearson correlation data for the variables included in our model. The average experiencein internal auditing for internal audit groups included in our sample is 6.35 years. Theaverage percentage of internal auditors that have a professional certification (CIA or CPA)in our sample is 59 percent. Of the CAEs in our sample, 69 percent report directly to theaudit committee. Internal auditors in our sample spend, on average, 32 percent of their timeperforming work that relates directly to financial reporting and 59 hours per year training.Finally, companies in our sample spend, on average, 51 percent more on the IAF than theindustry average for all GAIN respondents.21
As shown in Panel C of Table 2, of the six correlation pairs among the four governancevariables, three are significant. ACEffectiveness varies positively with AuditorSpecialist, andGindex varies negatively with AuditorSpecialist. Internal audit quality is significantly cor-related, but only modestly, with ACEffectiveness.22
21 The descriptive statistics in Panel A of Table 2 provide further evidence that we capture a broad range of IAFquality, as each individual characteristic varies significantly. This provides some assurance that our results maygeneralize to a larger population of firms despite potential issues relating to self-selection into the GAIN database.
22 There are at least three possible reasons for the relative lack of significant correlations between our measuresand other measures of corporate governance. First, companies may not systematically choose high levels of allcomponents of corporate governance but may instead make different trade-offs among them. Note that the threeother measures of corporate governance also show modest or no intercorrelation. Second, consistent with thestandards of the IIA, most IAFs establish a degree of independence from management as a part of maintainingobjectivity. Many of the specific decisions relating to the quality of an IAF (certification levels of new hires,training, etc.) typically are determined by the CAE, and, thus, it should not be particularly surprising that thesevariables may not move in concert with broader governance choices such as independence of audit committeemembers, quality of external auditor, etc. Third, the measures of corporate governance are likely formative—asopposed to reflective—indicators of a theoretical construct of overall corporate governance quality. For a dis-cussion of the difference between formative and reflective indicators, see Jarvis et al. (2003) and Mackenzie etal. (2005).
Internal Audit Quality and Earnings Management 1269
The Accounting Review July 2009American Accounting Association
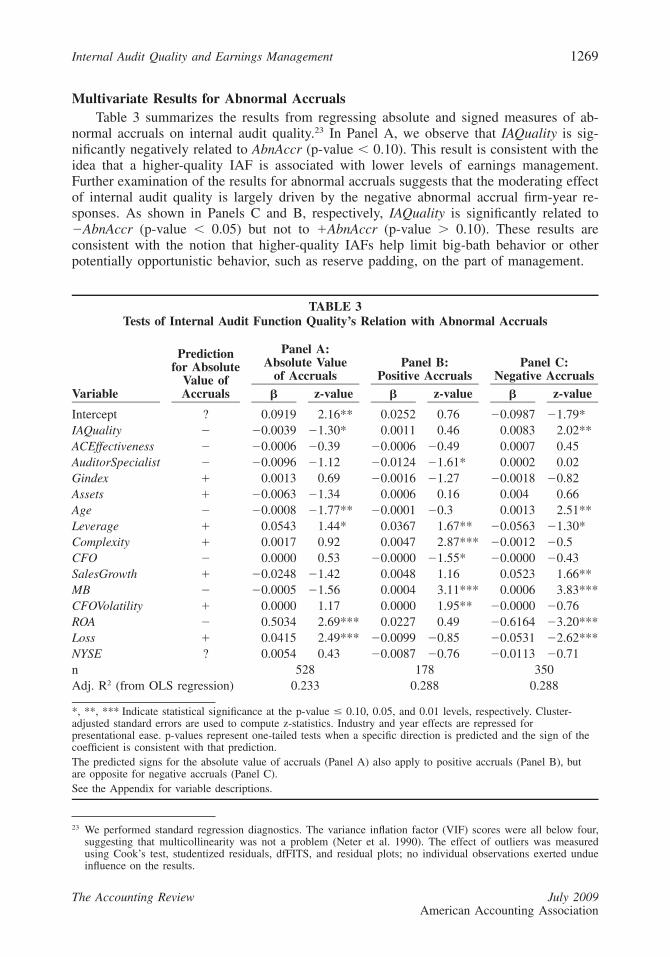
TABLE 3Tests of Internal Audit Function Quality’s Relation with Abnormal Accruals
Variable
Predictionfor Absolute
Value ofAccruals
Panel A:Absolute Value
of Accruals� z-value
Panel B:Positive Accruals
� z-value
Panel C:Negative Accruals
� z-value
Intercept ? 0.0919 2.16** 0.0252 0.76 �0.0987 �1.79*IAQuality � �0.0039 �1.30* 0.0011 0.46 0.0083 2.02**ACEffectiveness � �0.0006 �0.39 �0.0006 �0.49 0.0007 0.45AuditorSpecialist � �0.0096 �1.12 �0.0124 �1.61* 0.0002 0.02Gindex � 0.0013 0.69 �0.0016 �1.27 �0.0018 �0.82Assets � �0.0063 �1.34 0.0006 0.16 0.004 0.66Age � �0.0008 �1.77** �0.0001 �0.3 0.0013 2.51**Leverage � 0.0543 1.44* 0.0367 1.67** �0.0563 �1.30*Complexity � 0.0017 0.92 0.0047 2.87*** �0.0012 �0.5CFO � 0.0000 0.53 �0.0000 �1.55* �0.0000 �0.43SalesGrowth � �0.0248 �1.42 0.0048 1.16 0.0523 1.66**MB � �0.0005 �1.56 0.0004 3.11*** 0.0006 3.83***CFOVolatility � 0.0000 1.17 0.0000 1.95** �0.0000 �0.76ROA � 0.5034 2.69*** 0.0227 0.49 �0.6164 �3.20***Loss � 0.0415 2.49*** �0.0099 �0.85 �0.0531 �2.62***NYSE ? 0.0054 0.43 �0.0087 �0.76 �0.0113 �0.71n 528 178 350Adj. R2 (from OLS regression) 0.233 0.288 0.288
*, **, *** Indicate statistical significance at the p-value � 0.10, 0.05, and 0.01 levels, respectively. Cluster-adjusted standard errors are used to compute z-statistics. Industry and year effects are repressed forpresentational ease. p-values represent one-tailed tests when a specific direction is predicted and the sign of thecoefficient is consistent with that prediction.The predicted signs for the absolute value of accruals (Panel A) also apply to positive accruals (Panel B), butare opposite for negative accruals (Panel C).See the Appendix for variable descriptions.
Multivariate Results for Abnormal AccrualsTable 3 summarizes the results from regressing absolute and signed measures of ab-
normal accruals on internal audit quality.23 In Panel A, we observe that IAQuality is sig-nificantly negatively related to AbnAccr (p-value � 0.10). This result is consistent with theidea that a higher-quality IAF is associated with lower levels of earnings management.Further examination of the results for abnormal accruals suggests that the moderating effectof internal audit quality is largely driven by the negative abnormal accrual firm-year re-sponses. As shown in Panels C and B, respectively, IAQuality is significantly related to�AbnAccr (p-value � 0.05) but not to �AbnAccr (p-value � 0.10). These results areconsistent with the notion that higher-quality IAFs help limit big-bath behavior or otherpotentially opportunistic behavior, such as reserve padding, on the part of management.
23 We performed standard regression diagnostics. The variance inflation factor (VIF) scores were all below four,suggesting that multicollinearity was not a problem (Neter et al. 1990). The effect of outliers was measuredusing Cook’s test, studentized residuals, dfFITS, and residual plots; no individual observations exerted undueinfluence on the results.

1270 Prawitt, Smith, and Wood
The Accounting Review July 2009American Accounting Association
The lack of an association between the IAF and positive abnormal accruals might beattributable to a difference in emphasis between internal and external auditors. Research byFrancis and Krishnan (1999) provides evidence that external auditors are more conservativewith respect to income-increasing than income-decreasing accruals. Kim et al. (2003) findthat higher-quality external auditors (i.e., Big 6 firms) are more effective in deterring/monitoring opportunistic behavior than non-Big 6 external auditors in firms with income-increasing accruals, but that Big 6 external auditors are less effective than non-Big 6 ex-ternal auditors at deterring opportunistic behavior when firms have incentives towardincome-decreasing accruals. Together, this research suggests that the effect of the externalauditors on mitigating earnings management in our data set is likely to be greater withrespect to income-increasing accruals than income-decreasing accruals. The external audi-tor’s influence on income-increasing accruals may thus limit the effect of internal auditingon such accruals. Consistent with this idea, Panel B of Table 3 shows that AuditorSpecialistis significantly negatively related to �AbnAccr (p-value � 0.10) but is not related to�AbnAccr (p-value � 0.10), while IAQuality, as previously discussed, is negatively relatedto �AbnAccr (p-value � 0.05).
The coefficients on two of the three proxies for the other aspects of corporate gover-nance, ACEffectiveness and Gindex, are not statistically significant; however, as discussed,the results for AuditorSpecialist are moderately significant in the direction predicted (p-value � 0.10) for income-increasing accruals. Taken as a whole, these results suggest thatin our sample, internal audit quality plays a more significant role in moderating earningsmanagement than do the other aspects of corporate governance.
Of the control variables included in our model, the coefficients on Age, Loss, andLeverage are significant in the expected direction (p-values � 0.10) and the ROA coefficientis significant in the opposite direction of that predicted. The other control variables are notsignificant at the p-value � 0.10 level.
Results for Meet/Beat versus Miss Analysts’ ForecastAs a secondary measure of earnings management, we test whether IAQuality is asso-
ciated with the propensity to just meet or beat analysts’ consensus forecast. The companiesthat are most likely to have managed earnings are those that meet/ just beat analysts’ ex-pectations. Therefore, as previously explained, we compare these firms against each otherand against all other observations.
Table 4 presents our results comparing the IAF quality of companies that just met orbeat analysts’ expectations to those that just missed analysts’ expectations. We also comparethese two groups to all other companies in the sample to identify differences across theentire sample. Panels A, B, and C of Table 4 present descriptive statistics for the threegroupings of observations used in our multinomial logit model (i.e., just missed/just beat,just missed/all others, just beat/all others). Consistent with our expectations, IAF qualityis highest in the sample of firm-years that just missed forecasts (IAQuality � 2.74) andlowest in the sample of firms that just met the forecast (IAQuality � 2.37).
Panels D, E, and F of Table 4 present the pairwise comparisons of the three groupings.In Panel D, we compare firms that just missed analysts’ expectations to all other firms (i.e.,those that met, beat, or missed by a large margin) in the sample. Panel E shows resultsfrom our comparison of firms that just met or beat analysts’ forecasts with all other firmsin the sample (i.e., those that just missed and those that beat or missed by a large margin).Panel F details the comparison of firms that just missed expectations to those that just metor beat expectations. The results suggest that companies that just missed analysts’ forecastshave significantly higher-quality IAFs compared to all other companies (�2 � 2.75, p-value

InternalA
uditQ
ualityand
Earnings
Managem
ent1271
The
Accounting
Review
July2009
Am
ericanA
ccountingA
ssociation
TABLE 4Tests of Internal Audit Function Quality’s Relation with Beating/Missing Analysts’ Forecasts
Descriptive Statistics Pairwise Comparisons from Multinomial Logit Estimations
Panel A:Missed Forecast
Panel B:All Other Firms
Panel C:Just MadeForecast
Panel D:Missed Compared
to All
Panel E:Just Made
Compared to All
Panel F:Missed
Compared toJust Made
Variable Mean (Std. Dev.) Mean (Std. Dev.) Mean (Std. Dev.) � �2 � �2 � �2
Intercept n � 42 n � 390 n � 139 �5.9456 6.38** �3.0706 5.89** �2.8750 1.34IAQuality 2.74 (1.13) 2.41 (1.16) 2.37 (1.07) 0.2928 2.75** 0.0195 0.03 0.2733 2.05*ACEffectiveness 8.67 (3.26) 9.44 (2.01) 9.43 (1.93) �0.0836 1.39 0.0632 1.20 �0.1468 3.30*AuditorSpecialist 0.64 (0.48) 0.49 (0.5) 0.46 (0.5) 0.5281 1.94* 0.0555 0.06 0.4726 1.37Gindex 9.80 (2.18) 9.76 (2.46) 9.78 (2.2) 0.0123 0.03 0.00767 0.03 0.0046 0.00Assets 9.44 (1.18) 9.20 (1.4) 9.19 (1.34) 0.1782 0.76 0.0843 0.52 0.0939 0.19Age 48.29 (11.38) 43.09 (13.99) 42.05 (14.77) 0.0125 0.48 �0.0023 0.07 0.0148 0.63Leverage 0.48 (0.13) 0.45 (0.17) 0.46 (0.17) 2.0766 2.37* 1.466 4.24** 0.6107 0.19Complexity 4.71 (2.17) 3.37 (2.06) 3.6 (2.17) 0.2811 11.89*** 0.0792 2.30 0.2018 5.27**CFO 2,427 (4,228) 1,838 (3,886) 2,792 (4,408) 0.0000 0.38 0.00014 7.07*** �0.0001 2.15*SalesGrowth 0.15 (0.28) 0.10 (0.37) 0.09 (0.15) �0.0234 0.00 �0.2931 0.36 0.2697 0.20MB 3.82 (5.68) 2.70 (11.9) 2.14 (25.31) 0.0066 0.17 0.000803 0.02 0.0058 0.13CFOVolatility 570.43 (852.73) 581.62 (1,253.19) 533.85 (815.06) �0.0001 0.04 �0.00059 5.50** 0.0005 2.73**ROA 0.05 (0.05) 0.03 (0.06) 0.07 (0.08) 3.4715 0.64 5.8289 6.62*** �2.3574 0.28Loss 0.05 (0.22) 0.17 (0.38) 0.07 (0.26) �1.1968 2.03 �0.4774 1.26 �0.7194 0.64NYSE 0.95 (0.22) 0.93 (0.26) 0.9 (0.3) �0.5515 0.43 �0.2848 0.46 �0.2667 0.09
*, **, *** Indicate statistical significance at the p-value � 0.10, 0.05, and 0.01 levels, respectively.Firm-year responses are categorized as ‘‘Missed Forecast’’ if they missed analysts’ consensus forecast scaled by price at the beginning of the year by less than 0.0005,they are categorized as ‘‘Just Made Forecast’’ if they met the forecast or exceeded it by the consensus forecast scaled by price at the beginning of the year by morethan 0.0005. All other firm-years are categorized as ‘‘All Other Firms.’’p-values represent one-tailed tests when a specific direction is predicted and the sign of the coefficient is consistent with that prediction. Industry and year effects arerepressed for clarity of presentation.See Appendix for variable descriptions.

1272 Prawitt, Smith, and Wood
The Accounting Review July 2009American Accounting Association
� 0.05) and compared to companies that just met/beat analysts’ forecasts (�2 � 2.05, p-value � 0.10). However, firms that just met/beat analysts’ forecasts are not statisticallydifferent from all other firms (�2 � 0.03). Taken as a whole, these results provide evidencethat firms with higher-quality IAFs are more likely to just miss earnings benchmark targets,which is consistent with our expectation that high-quality internal audit functions reduceearnings management.
AuditorSpecialist is significantly higher for companies that missed forecasts comparedto all other companies (�2 � 1.94, p-value � 0.10). There are also differences betweenfirm-year responses in terms of Leverage, Complexity, CFO, CFOVolatility, and ROA. In-terestingly, ACEffectiveness is significantly lower in companies that missed forecasts com-pared to companies that just met their forecasts (�2 � 3.30, p-value � 0.10). We do nothave an explanation for this unexpected result, which might be fruitfully investigated inmore depth by future research.
Sensitivity AnalysesIn this section we describe two additional analyses. The first analysis addresses potential
endogeneity concerns and the second provides information relating to the components usedto construct IAQuality. Endogeneity can be a problem for three different reasons: correlatedomitted variables, measurement error, or simultaneity. We believe the possibility of corre-lated omitted variables is the most serious of these potential concerns, and, thus, includemeasures for the corporate governance mechanisms other than the IAF (i.e., ACEffective-ness, AuditorSpecialist, and Gindex) in our primary analyses. Inclusion of controls for theeffects of the audit committee, the external auditor, and management decreases the likeli-hood that the results for internal audit quality are attributable to correlated omitted variablesrelating to other aspects of corporate governance.
As previously discussed, our measure of overall internal audit quality is derived fromspecific quality components indicated by professional practice standards and is arguably amore precise measure of internal audit quality than those used in prior studies (see Prawittet al. 2009). We do not believe measurement error is of particular concern in this study.
We also do not believe that simultaneity represents a serious threat. We acknowledgethat in most organizations the audit committee sets the budget for the IAF; therefore, theaudit committee (or management) could clearly influence internal audit quality via resourceallocation decisions. However, choices concerning how the IAF invests its resources aretypically made within the IAF by the CAE, and, as such, these more detailed decisionsare not necessarily made simultaneously with overall decisions relating to corporate gov-ernance. Further, if internal audit quality were decided simultaneously with other aspectsof corporate governance, we would expect measures of audit committee quality, externalaudit quality, and management power to vary systematically with IAF quality. Our resultsare not consistent with this explanation (see Table 2, Panel C).
However, we attempt to further mitigate the possibility of threats to validity relating topotential endogeneity concerns using a two-stage least-squares approach.24 In the first stage,we predict internal audit quality using two instrumental variables. These variables are the
24 Identifying appropriate instruments is difficult in conducting a two-stage least squares analysis and findingincorrect instruments can lead to IV estimates that are more biased than simple OLS estimates. We encouragereaders to review Larcker et al. (2008) for an excellent discussion of the potential problems and limitationsassociated with using an instrumental variables approach.

Internal Audit Quality and Earnings Management 1273
The Accounting Review July 2009American Accounting Association
average IAQuality score by industry25 and the amount of inventory relative to assets. Wealso include Assets, Leverage, and Complexity in predicting internal audit quality, given thefindings of Carcello et al. (2005) that these variables predict the size of the internal auditbudget.26 Table 5, Panel B presents the results of this test for the accruals models. Whenwe estimate the two-stage least-squares model, we find that IAQuality is significant in theabsolute abnormal accruals model in the predicted direction (p-value � 0.01; see Panel B,Regression 1). Of note, once we control for endogeneity using our two-stage least-squaresmodel, IAQuality is both significantly positively associated with negative accruals (p-value� 0.01) and negatively associated with positive accruals (p-value � 0.10—see Regressions2 and 3).
Panel C of Table 5 shows the results of the miss/beat analysts’ expectations modelincorporating the two-stage least-squares analysis. In this analysis, the coefficient onIAQuality is not significant. Thus, to the extent the two-stage least-squares procedure issuccessful in controlling for effects of endogeneity in this analysis, the primary resultsrelating to our secondary dependent variable should be interpreted with caution. However,given the limited size of the data set available to us, it should be noted that the lack ofsignificance for these results may be attributable to smaller sample sizes in the various‘‘bins’’ and the relatively low power of two-stage least square designs (see Larcker et al.2008).
Our second supplementary analysis explores the effects of the individual componentsof IAQuality. When we rerun the results for Tables 3 and Table 4 using the individualcomponents of internal audit quality in place of our composite IAQuality measure, we findthat Certification is the only component variable significant in the sample of firms that havenegative abnormal accruals and that Certification is associated with a moderation of neg-ative abnormal accruals (p-value � 0.01). In the positive abnormal accrual sample, IASizeis significantly positive (p-value � 0.01), suggesting that larger IAFs relative to their in-dustry are associated with income-increasing accruals. This unexpected positive relationshipmay arise because IAF size can proxy for the overall demand the company has for auditing(see Anderson et al. 1993; Prawitt et al. 2009). If a company has a greater demand forauditing, then the company may be more difficult to monitor and, therefore, managers maybe able to exercise greater discretion and manage earnings to a greater extent.
In the benchmark tests of Table 4 relating to the meet/beat analyses, we find, as ex-pected, that the group that just missed analysts’ expectations had significantly higher valuesof Certification, CAEAC, and Training (p-value � 0.10) and significantly higher values ofTimeFin than the ‘‘all other firms’’ sample. We also find that the group that just missedanalysts’ expectations had significantly higher values of Certification, CAEAC, TimeFin,and Training than firms that just met or beat the benchmark (p-values � 0.05).
25 Consistent with prior research (e.g., see Erickson et al. 2008), we look to the industry average of our primaryfirm-specific independent variable for use as an instrumental variable. The industry-wide average of IAQualityis likely to be associated with an individual firm’s IAQuality because internal audit practices in one firm arelikely influenced by industry-wide practices. In addition, the industry-wide IAQuality is unlikely to be correlatedwith earnings management because we do not find that earnings management is highly concentrated in a fewindustries. We use self-reported industries in the sample so as to have sufficient sample sizes in each industryto make a meaningful first-stage prediction. Two industry categories had seven and nine firm-year responses,but the rest included at least 24 observations per industry grouping.
26 The results are qualitatively similar if we assume that ACEffectiveness, AuditorSpecialist, and Gindex are ex-ogenous, and we include those variables as predictors of IAQuality in the first stage model.

1274 Prawitt, Smith, and Wood
The Accounting Review July 2009American Accounting Association
TABLE 5Two-Stage Least Squares Test of Internal Audit Function Quality’s Relation with Abnormal
Accruals and Meet/Beat versus Miss Analysts’ Forecasts
Panel A: First Stage Model to Explain Internal Audit Quality
Intercept IndIAQuality InvAssets Assets Leverage Complexity NYSE
Prediction � /� � � � � � �
Coefficient 0.135 1.005 1.172 �0.129 0.466 �0.005 0.444t-value 0.29 9.07*** 1.88** �4.02*** 1.73** �0.27 2.80***
Panel B: Second Stage Model to Test Relation with Abnormal Accruals
Regression 1Absolute Value of
AccrualsRegression 2
Positive AccrualsRegression 3
Negative Accruals
Variable
Predictionfor Absolute
Value ofAccruals � z-value � z-value � z-value
Intercept ? 0.2051 4.12*** 0.0659 1.54 �0.2565 �3.53***IAQualityPrediction � �0.0436 �4.31*** �0.0137 �1.42* 0.0608 4.10***ACEffectiveness � �0.0008 �0.56 �0.0007 �0.46 0.0005 0.31AuditorSpecialist � �0.0051 �0.58 �0.0127 �1.61* �0.0051 �0.41Gindex � 0.0005 0.29 �0.0016 �1.18 �0.0004 �0.2Assets � �0.0135 �2.80*** �0.002 �0.53 0.0154 2.22**Age � �0.0005 �1.17 �0.0000 �0.14 0.0008 1.39Leverage � 0.0779 2.03** 0.0403 1.70** �0.0976 �2.19**Complexity � 0.0029 1.70** 0.0051 2.82*** �0.0028 �1.23CFO � 0.0000 0.28 �0.0000 �1.51 �0.0000 �0.28SalesGrowth � �0.0214 �1.28 0.0054 1.22 0.0449 1.49MB � �0.0005 �1.88* 0.0003 2.97*** 0.0007 3.86***CFOVolatility � 0.0000 1.14 0.0000 1.83** �0.0000 �0.75ROA � 0.4705 2.43*** 0.0088 0.17 �0.5692 �2.80***Loss � 0.0334 1.92** �0.0137 �0.96 �0.043 �2.08**NYSE ? 0.0204 1.64 �0.0018 �0.14 �0.0259 �1.64
Panel C: Second Stage Multinomial Logit Model to Test Relation with Missing/BeatingAnalysts’ Forecasts
Regression 1Missed
Compared to All
Regression 2Just Made
Compared to All
Regression 3Missed Compared
to Just MadeVariable � �2 � �2 � �2
Intercept �6.0174 4.77** �2.7831 3.44* �3.2343 1.23IAQualityPrediction 0.3053 0.33 �0.0910 0.09 0.3964 0.49ACEffectiveness �0.0844 1.46 0.0649 1.25 �0.1493 3.46*AuditorSpecialist 0.5533 2.14* 0.0591 0.07 0.4942 1.50Gindex 0.0133 0.03 0.0047 0.01 0.0085 0.01Assets 0.1884 0.75 0.0693 0.32 0.1191 0.26Age 0.0141 0.60 �0.0021 0.06 0.0162 0.74
(continued on next page)

Internal Audit Quality and Earnings Management 1275
The Accounting Review July 2009American Accounting Association
TABLE 5 (continued)
Regression 1Missed
Compared to All
Regression 2Just Made
Compared to All
Regression 3Missed Compared
to Just MadeVariable � �2 � �2 � �2
Leverage 1.8282 1.83 1.4907 4.36** 0.3375 0.06Complexity 0.2731 11.20*** 0.0822 2.41 0.1909 4.67**CFO 0.0000 0.34 0.0001 6.57** �0.0001 1.99SalesGrowth 0.0303 0.01 �0.2741 0.31 0.3043 0.25MB 0.0070 0.18 0.0006 0.01 0.0063 0.15CFOVolatility �0.0001 0.06 �0.0006 5.53** 0.0005 2.46ROA 3.8212 0.78 5.8034 6.54** �1.9823 0.20Loss �1.0999 1.70 �0.4809 1.29 �0.6190 0.47NYSE �0.5533 0.40 �0.2372 0.30 �0.3161 0.13
*, **, *** Indicate statistical significance at the p-value � 0.10, 0.05, and 0.01 levels, respectively.Panel A is estimated for 571 firm-year responses (the meet /miss forecast sample). Cluster-adjusted standarderrors are used to compute t-statistics in Panel B. In Panel C, firm-year responses are categorized as ‘‘MissedForecast’’ if they missed analysts’ consensus forecast scaled by price at the beginning of the year by less than0.0005. They are categorized as ‘‘Just Made Forecast’’ if they met the forecast or exceeded it by the consensusforecast scaled by price at the beginning of the year by more than 0.0005. All other firm-years are categorizedas ‘‘All Other Firms.’’ Industry and year effects are repressed for presentational ease.p-values represent one-tailed tests when a specific direction is predicted and the sign of the coefficient isconsistent with that prediction.See the Appendix for variable descriptions.
V. CONCLUSIONSThis paper investigates the effects of IAF quality on earnings management. Using a
unique archive of survey responses collected and maintained by the IIA for benchmarkingpurposes, we test our expectation that IAF quality is associated with reduced levels ofearnings management. We derive our measure for overall internal audit quality from au-diting standards that provide guidance to external auditors in assessing the extent to whichthey can rely on the work of the IAF as part of the financial statement audit (AICPA 1997;PCAOB 2007a). We use absolute abnormal accruals from the performance-adjusted modi-fied Jones model and propensity to just meet or beat, versus just miss, analysts’ earningsforecasts as proxies for earnings management.
On balance, the results are consistent with the notion that IAF quality is negativelyassociated with earnings management. In particular, companies with higher-quality IAFsare associated with smaller negative abnormal accruals and are more likely to just missanalysts’ earnings forecasts. From a broader perspective, these results suggest that IAFsplay an important role in the quality of externally reported financial numbers, an essentiallyuntouched but potentially promising area for future research.
The results of this study should prove interesting to several parties. Companies andtheir audit committees should consider the quality of their IAF as defined by externalauditing standards and explore ways of improving the function in light of these findings.Internal audit standard-setters could consider these findings in their deliberations regardingthe potential role of internal auditing in affecting financial numbers that are reported ex-ternally. The SEC, managements of stock exchanges, and other groups interested in cor-porate governance processes may also find it helpful to more explicitly consider the role

1276 Prawitt, Smith, and Wood
The Accounting Review July 2009American Accounting Association
of internal auditing in financial reporting. Finally, auditing standard-setters may find itinformative that our results are supportive of the validity of components of internal auditquality suggested by external auditing standards.
This study has several limitations. First, since the sample was not randomly drawn, theextent to which we can be confident that our results generalize to other companies issomewhat limited. However, it should be noted that this is first time archival data aboutIAFs have been available at this level of detail. Further, descriptive statistics suggest thedata set captures a reasonably broad range of IAF quality. While we believe any self-selection bias would be likely to work against finding evidence for our expectations, futurestudies could test the relations we identify in a broader sample, if such data becomesavailable. Second, due to limitations on data availability, our sample is relatively smallcompared to many archival studies examining earnings management. Future studies coulduse larger sample sizes when and if more data becomes available. Third, the data archivedin the IIA’s GAIN database is collected through a continuing survey. Therefore, despite thefact that response errors are likely to contribute noise rather than bias, the reliability ofthe relations we identify is contingent on the accuracy of the GAIN data. Fourth, the choicea company makes with regard to the quality of its IAF may be endogenous with othercorporate governance decisions. We attempt to mitigate this problem by incorporating prox-ies for other corporate governance variables into our primary analysis and by using alter-native econometric approaches. However, current econometric tools are limited in this re-gard and our results should be interpreted with appropriate caution. Finally, our measuresof earnings management may not adequately capture the underlying construct. While wedo find generally consistent results for two independent proxies for earnings management,future studies may wish to examine whether other proxies for aggressive financial reportingprovide additional insight. For example, at some point sufficient data may become availableto examine whether companies with high-quality IAFs are less likely to experience financialstatement restatements, face SEC action, or to be sued for financial reporting irregularities.
APPENDIXDESCRIPTION OF VARIABLES
Variable Description
Ait�1 � Average total assets (Data6) for estimation portfolio firm i for yeart�1.
AbnAccr � Abnormal accruals is the error term as measured using the equation(absolute value is used in testing):
TA 1 �REV � �ARit it it� � � � � �� � � �0 1 2A A Ait�1 it�1 it�1
PPE NIit it� � � � � e .� � � �3 4 itA Ait�1 it
ACEffectiveness � A composite score of ten dummy variables formed by scoring acompany one point for each Blue-Ribbon Committee for AuditCommittee Effectiveness attribute the company’s audit committeepossesses.
Age � The number of years the company is listed on Compustat.Assets � Total assets (Data6) of a company (natural log used in testing).
(continued on next page)

Internal Audit Quality and Earnings Management 1277
The Accounting Review July 2009American Accounting Association
Variable Description
AuditorSpecialist � A dichotomous variable that indicates whether the external auditoris an industry-specialist auditor or not. We define industry-specialist auditor as a Big N audit firm that provides within-industry market shares 30 percent greater than if the audit firmswere to split the industry evenly among themselves.
CAEAC � A dichotomous variable indicating whether the CAE reports to theaudit committee (� 1) or to a lower-level entity within theorganization (� 0).
Certification � The percent of internal auditors who have the CIA or CPAcertification. (Number of auditors with the CIA or CPAcertification/Total staff in the IAF).
CFO � A companies’ cash flows from operations (Data308).CFOVolatility � The standard deviation of the companies’ CFO for the previous five
years.Complexity � The number of operating segments that the company has.eit � Error term, our measure of abnormal accruals—labeled AbnAccr.Experience � Average number of years of internal audit experience.Gindex � Corporate governance metric computed by Gompers et al. (2003).
For years the metric was not computed (i.e., 2001, 2003, and2005), the average of the metric for the year before and after themissing year was used.
IAQuality � A single composite number measuring the quality of the IAF. Thevariable can range from 0 to 6 with 0 representing lowest qualityand 6 representing highest quality. The score is formed byassigning a value of 1 to scores above the median forExperience, Certification, CAEAC, TimeFin, Training, andIASize, and summing together.
IAQualityPrediction � The predicted value of internal audit quality from regression inTable 5, Panel A.
IASize � The average dollar amount spent on internal auditing for theindustry divided by the average total assets of the industry,subtracted from the dollar amount spent on internal auditing percompany divided by the company’s total assets. This amount isthen divided by the average dollar amount spent on internalauditing for the industry, divided by the average total assets ofthe industry.
IndIAQuality � The average of IAQuality at the two-digit SIC code level.IndustryDummies � Dichotomous variables used to represent different industries at the
one digit SIC code level.InvAssets � Inventory (Data3) divided by total assets (Data6).Leverage � The sum of long-term debt (Data9) and current liabilities (Data5)
for each company divided by total assets (Data6).Loss � A dichotomous variable indicating whether the company
experienced a loss in the previous year (yes � 1, no � 0).MB � A company’s market-to-book ratio (Data24 * Data25/Data216).NIit � Net income (Data172) for estimation portfolio firm i for year t.NYSE � A dichotomous variable indicating whether the company is traded
on the NYSE or not (yes � 1, no � 0).PPEit � Gross property, plant, and equipment (Data7) for estimation
portfolio firm i for year t.
(continued on next page)

1278 Prawitt, Smith, and Wood
The Accounting Review July 2009American Accounting Association
Variable Description
ROA � Return on assets (Data172/Data 6).SalesGrowth � A company’s one-year sales growth (Data12 � Data12 prior
year /Data12 prior year).TAit � Total accruals for estimation portfolio firm i for year t. TAit are
defined as income before extraordinary items (DATA18) minusoperating cash flows (DATA308).
TimeFin � The percentage of time the IAF spends performing financial auditwork.
Training � The average number of training hours internal auditors attendduring the year.
Year Dummies � Dichotomous variables used to represent different years of dataincluded in the analysis.
�REVit � Change in net revenues (Data12) for estimation portfolio firm i foryear t.
�ARit � Change in accounts receivable (Data2) for estimation portfolio firmi for year t.
REFERENCESAbbott, L. J., S. Parker, G. F. Peters, and D. V. Rama. 2007. Corporate governance, audit quality, and
the Sarbanes-Oxley Act: Evidence from internal audit outsourcing. The Accounting Review 82(4): 803–835.
American Institute of Certified Public Accountants (AICPA). 1997. The Auditor’s Consideration ofthe Internal Audit Function in an Audit of Financial Statements. Statement on Auditing Stan-dards No. 65. Available at: http: / /www.aicpa.org/download/members /div/auditstd /AU-00322.PDF.
Anderson, D., J. R. Francis, and D. J. Stokes. 1993. Auditing, directorships, and the demand formonitoring. Journal of Accounting and Public Policy 12 (4): 353–375.
Anderson, R. J. 1996. From critics to coaches. Bank Management 72 (3): 26–32.Anthony, J. H., and K. Ramesh. 1992. Association between accounting performance measures and
stock prices. Journal of Accounting and Economics 15 (2/3): 203–227.Asare, S. K., R. A. Davidson, and A. A. Gramling. 2008. Internal auditors’ evaluation of fraud factors
in planning an audit: The importance of audit committee quality and management incentives.International Journal of Auditing 12 (3): 181–203.
Becker, C. L., M. L. DeFond, J. Jiambalvo, and K. R. Subramanyam. 1998. The effect of audit qualityon earnings management. Contemporary Accounting Research 15 (1): 1–24.
Bedard, J., S. M. Chtourou, and L. Courteau. 2004. The effect of audit committee expertise, inde-pendence, and activity on aggressive earnings management. Auditing: A Journal of Practice &Theory 23 (2): 3.
Bergstresser, D., and T. Philippon. 2006. CEO incentives and earnings management. Journal of Fi-nancial Economics 80 (3): 511–529.
Blue Ribbon Committee (BRC). 1999. Report of the Blue Ribbon Committee on Improving the Ef-fectiveness of Corporate Audit Committees. New York, NY: NYSE and NASD.
Brown, L. D., and M. L. Caylor. 2005. A temporal analysis of quarterly earnings thresholds: Propen-sities and valuation consequences. The Accounting Review 80 (2): 423–440.
———, and A. S. Pinello. 2007. To what extent does the financial reporting process curb earningssurprise games? Journal of Accounting Research 25 (5): 947–981.
Burgstahler, D., and I. Dichev. 1997. Earnings management to avoid earnings decreases and losses.Journal of Accounting and Economics 24 (December): 99–126.
Carcello, J., D. Hermanson, and K. Raghunandan. 2005. Factors associated with U.S. public com-panies’ investment in internal auditing. Accounting Horizons (June): 69–84.

Internal Audit Quality and Earnings Management 1279
The Accounting Review July 2009American Accounting Association
Davidson, R., J. Goodwin-Stewart, and P. Kent. 2005. Internal governance structures and earningsmanagement. Accounting and Finance 45 (2): 241–267.
DeAngelo, H., L. DeAngelo, and D. J. Skinner. 1994. Accounting choice in troubled companies.Journal of Accounting and Economics 17 (1/2): 113–143.
Dechow, P. M., R. Sloan, and A. Sweeney. 1995. Detecting earnings management. The AccountingReview 70 (2): 193–225.
———, ———, and ———. 1996. Causes and consequences of earnings manipulation: An analysisof firms subject to enforcement actions by the SEC. Contemporary Accounting Research 13(1): 1–36.
———, and I. D. Dichev. 2002. The quality of accruals and earnings: The role of accrual estimationerrors. The Accounting Review 77 (4): 35–59.
DeGeorge, F., J. Patel, and R. Zeckhauser. 1999. Earnings management to exceed thresholds. Journalof Business 72 (January): 1–33.
Erickson, M., M. Hanlon, and E. Maydew. 2008. Is there a link between executive equity incentivesand accounting fraud? Journal of Accounting Research 44 (1): 113–143.
Felix, W. L., Jr., A. A. Gramling, and M. J. Maletta. 2001. The contribution of internal audit as adeterminant of external audit fees and factors influencing this contribution. Journal of Account-ing Research 39 (3): 513–534.
Francis, J. R., and J. Krishnan. 1999. Accounting accruals and auditor reporting conservatism. Con-temporary Accounting Research 16 (1): 135–210.
———, E. L. Maydew, and H. C. Sparks. 1999. The role of Big 6 auditors in the credible reportingof accruals. Auditing: A Journal of Practice & Theory 18 (2): 17–34.
Frankel, R. M., M. F. Johnson, and K. K. Nelson. 2002. The relation between auditors’ fees fornonaudit services and earnings management. The Accounting Review 77 (4): 71–105.
Gompers, P., J. Ishii, and A. Metrick. 2003. Corporate governance and equity prices. The QuarterlyJournal of Economics 118 (1): 107.
Harrington, C. 2004. Internal audit’s new role. Journal of Accountancy 198 (3): 65–70.Hermanson, S. R., and L. E. Rittenberg. 2003. Internal audit and organizational governance. In Re-
search Opportunities in Internal Auditing, edited by A. D. Bailey, A. A. Gramling, and S.Ramamoorti. Altamonte Springs, FL: The Institute of Internal Auditors.
Hribar, P., and C. Nichols. 2007. The use of unsigned earnings quality measures in tests of earningsmanagement. Journal of Accounting Research 45 (5): 1017–1053.
Hunton, J. E., R. Libby, and C. L. Mazza. 2006. Financial reporting transparency and earnings man-agement. The Accounting Review 81 (1): 135–157.
Institute of Internal Auditors (IIA). 2005a. Corporate governance. The Institute of Internal AuditorsHomepage. Available at: http: / /www.theiia.org/?doc id�1041.
———. 2005b. International standards for the professional practice of internal auditing. The Instituteof Internal Auditors Homepage. Available at: http: / /www.theiia.org/?doc id�1499.
Jarvis, C. B., S. B. MacKenzie, and P. M. Podsakoff. 2003. Measurement model misspecification inmarketing and consumer research. The Journal of Consumer Research 30: 199–218.
Kim, J., R. Chung, and M. Firth. 2003. Auditor conservatism, asymmetric monitoring, and earningsmanagement. Contemporary Accounting Research 20 (2): 323–359.
Klein, A. 2002. Audit committee, board of director characteristics, and earnings management. Journalof Accounting and Economics 33 (3): 375–400.
Klinkerman, S. 1996. Survey finds radical transformation. Bank Management 72 (3): 30–31.Kothari, S. P., A. J. Leone, and C. E. Wasley. 2005. Performance matched discretionary accrual
measures. Journal of Accounting and Economics 39 (1): 163–197.Lacayo, R., and A. Ripley. 2002. Cynthia Cooper, Coleen Rowley, and Sherron Watkins. Time Mag-
azine. Available at: http: / /aolsvc.timeforkids.kol.aol.com/time/subscriber /personoftheyear /2002/poyintro.html.
Larcker, D. F., S. A. Richardson, and I. Tuna. 2007. Corporate governance, accounting outcomes, andorganizational performance. The Accounting Review 82 (4): 963–1008.

1280 Prawitt, Smith, and Wood
The Accounting Review July 2009American Accounting Association
———, ———, and T. O. Rusticus. 2008. On the use of instrumental variables in accounting research.Working paper, Stanford University and Northwestern University.
MacKenzie, S. B., P. M. Podsakoff, and C. B. Jarvis. 2005. The problem of measurement modelmisspecification in behavioral and organizational research and some recommended solutions.The Journal of Applied Psychology 90 (4): 710–730.
Matsumoto, D. 2002. Management’s incentives to avoid negative earnings surprises. The AccountingReview 77 (3): 483–514.
Menon, K., and D. Williams. 2004. Former audit partners and abnormal accruals. The AccountingReview 79 (4): 1095–1118.
Neter, J., W. Wasserman, and M. H. Kutner. 1990. Applied Linear Statistical Models. 3rd edition.Homewood, IL: Irwin.
New York Stock Exchange (NYSE). 2004. Corporate governance rules. Available at: http: / /www.nyse.com/pdfs/section303A final rules.pdf.
Palmrose, Z-V. 1986. Audit fees and auditor size: Further evidence. Journal of Accounting Research24 (Spring): 97–110.
Prawitt, D. F., N. Y. Sharp, and D. A. Wood. 2009. Does internal audit quality affect the externalaudit fee? An archival validation of experimental results. Working paper, Brigham Young Uni-versity, Texas A&M University, and Brigham Young University.
Press, E. G., and J. B. Weintrop. 1990. Accounting-based constraints in public and private debtagreements. Journal of Accounting and Economics 12 (1–3): 65–95.
Public Company Accounting Oversight Board (PCAOB). 2007a. An Audit of Internal Control overFinancial Reporting that is Integrated with an Audit of Financial Statements. Available at: http:/ /www.pcaobus.org/Rules /Rules of the Board/Auditing Standard 5.pdf.
———. 2007b. An Audit of Internal Control over Financial Reporting that is Integrated with an Auditof Financial Statements (Adopting Release). Available at: http: / /www.pcaobus.org/Rules /Docket 021/2007-06-12 Release No 2007-005A.pdf.
Raghunandan, K., W. J. Read, and D. V. Rama. 2001. Audit committee composition, ‘‘grey directors,’’and interaction with internal auditing. Accounting Horizons 15 (June): 105–118.
Rogers, J. L., and P. C. Stocken. 2005. Credibility of management forecasts. The Accounting Review80 (4): 1233–1260.
Schneider, A., and N. Wilner. 1990. A test of audit deterrent to financial reporting irregularities usingthe randomized response technique. The Accounting Review 65 (3): 668–681.
Schwartz, S. T., and R. A. Young. 2002. A laboratory investigation of verification and reputationformation in a repeated joint investment setting. Contemporary Accounting Research 19 (2):311–342.
Skousen, K. F., S. M. Glover, and D. F. Prawitt. 2005. An Introduction to Corporate Governance andthe SEC. Mason, OH: Thomson South-Western.
Thevenin, S. R. 1997. Teaching an old audit new tricks. The Internal Auditor 54 (5): 58–65.Treadway Commission. 1987. Report of the National Commission on Fraudulent Financial Reporting.
Washington, D.C.: National Commission on Fraudulent Financial Reporting.Xie, B., W. N. Davidson, and P. J. DaDalt. 2003. Earnings management and corporate governance:
The role of the board and the audit committee. Journal of Corporate Finance 9 (3): 295–316.
