the accession of kazakhstan, russia and ukraine to the wto …
TRANSCRIPT
THE ACCESSION OF KAZAKHSTAN, RUSSIA AND UKRAINE TO THE WTO:
WHAT WILL IT MEAN FOR THE WORLD TRADE IN WHEAT?
CATPRN Commissioned Paper 2013-06
September 2013
Saule Burkitbayeva
Department of Bioresource Policy, Business and Economics University of Saskatchewan, Saskatoon
William A. Kerr
Estey Centre for Law and Economics in International Trade Saskatoon, Saskatchewan
http://www.catrade.org
Funding for this project was provided by the Canadian Agricultural Trade Policy and Competitiveness Research Network (CATPRN) which is funded by Agriculture and Agri-Food Canada. The views in this paper are those of the authors and should not be attributed to the funding agencies.
i
Abstract
International trade in wheat accounts for approximately one third of world grain trade and is expected to double by 2050.The KRU (Kazakhstan, Russia and Ukraine) countries account for approximately a quarter of world wheat exports and are collectively considered one of the key wheat exporting regions. The Ukraine became a member of the WTO only in 2008. Russia became an official member of the WTO in 2012 and Kazakhstan is expected to follow Russia and reach an accession deal with WTO members shortly. As a result of WTO accession, all three countries will be entitled to “most favoured nation” (MFN tariffs), and hence, gain improved access to a number of important markets that have been largely inaccessible due to very high tariffs that could be charged on imports from non-WTO countries. World wheat trade liberalization, reflecting the move to the MFN tariff as a result of accession, was simulated using the global simulation model (GSIM). The KRU region’s increased market accessibility as a result of successful accession to the WTO has the potential to foster important re-alignments in world wheat trade flows, prices and changes in welfare among major wheat trading countries. The simulation results suggest that the change to MFN tariffs leads to KRU countries trading more with now freer markets such as Turkey, the EU and China. Major traditional wheat exporters such as Australia, Canada, the EU, and the US do not seem to be negatively impacted to any important degree. Their relative market access conditions, however, erode in Turkish, Middle Eastern, and North African markets with their exports being diverted and broadly distributed among other countries and regions at marginally reduced prices. Trade liberalization is not uniform across regions and, hence, leads to different net welfare changes across countries. Those welfare changes, however, appear to be modest.
Keywords: accession, Kazakhstan, MFN, Russia, tariff reduction, Ukraine, wheat
1
1. Introduction Wheat is one of the world’s major food staples and one of the most traded due to its
inherent storability. World population is expected to increase by 32 percent reaching 9 nine billion by 2050 (US Census Bureau n.d.). In 2010 the world utilized 660 million metric tons (MMT) of wheat and traded 125 MMT. Ceteris paribus, in 2050 the world’s 9 billion people are projected to consume over 880 MMT of wheat (Weigand 2011). International trade will have a crucial role in fulfilling this increase in demand. Developing countries will account for the majority of the predicted population growth. Population growth is the strongest in tropical and subtropical regions where little wheat is grown. The Food and Agriculture Organization of the United Nations (FAO 2003) forecasts that developing countries will experience a significant growth in wheat consumption. Based on forecasts of population, production and consumption, North Africa, the Middle East, Sub-Saharan Africa, Indonesia, the Philippines, Brazil, Mexico, and India will remain the largest importing areas. Domestic production in these countries is projected to increase by 23 percent whereas total consumption is expected to increase by 49 percent (Weigand 2011). According to the FAO (2003), the domestic production of developing countries will only cover approximately 86 percent of their own total need, making them increasingly dependent on imports.
The task of supplying wheat to the rest of the world will be spread among the world’s
major wheat exporters; United States, Canada, Australia, the Black Sea region (Kazakhstan, Russia and Ukraine), the European Union and Argentina. These exporters will experience minimal or even negative population growth towards 2050. Currently, wheat trade accounts for one-third of world grain trade. Weigand (2011) concluded that even with little import demand from China, world wheat trade is likely to double by 2050 reaching a minimum of 240 MMT. The Black Sea region currently accounts for approximately one-quarter of the world’s wheat exports and is considered one of the key wheat exporting areas. The first decade of the 21st century has been characterized by an increasing role of the Black Sea region in the global trade in wheat as these countries emerged from the chaotic period that followed the collapse of the Soviet Union and the end of central planning. Although highly variable, the Black Sea region’s average share of world wheat exports rose from three percent in 1992 to 12 percent in 2010. In comparison, over the same period the average share of world wheat exports declined by ten percent and six percent for United States and Canada respectively (USDA n.d.).
The Black Sea Region’s accession to the WTO creates favourable conditions for its wheat
export potential. The Ukraine became a member of the WTO in 2008. Russia was accepted to the WTO in 2012 Kazakhstan is expected to follow Russia and seal a deal with the WTO members in the near future. As a result of WTO accession, all three countries will be entitled to “most favoured nation” (MFN) tariffs, and, hence, gain improved access to potential markets previously largely inaccessible due to the very high tariffs that can be applied on imports from non-members. For example, in 2010 China’s import duties for wheat for non-members of the WTO were equal to 180 percent, whereas MNF tariffs were equal to 65 percent; for Turkey non-MFN are 130 percent but MFN rates are bound at 65 percent. The potential decrease in tariffs is substantial. The Black Sea region’s increased market accessibility as a result of successful accession to the WTO has the potential to bring about a major re-alignment of world wheat trade flows, prices and changes in welfare among major wheat trading countries.
2
2. The Wheat Industry in KRU
The three major wheat-producing countries of the former Soviet Union − Russia, Ukraine and Kazakhstan − are becoming increasingly prominent in the global wheat trade.1
The Black Sea is the main avenue for accessing world markets for all three countries. Russia and Ukraine have the advantage of having several seaports on the Black Sea. In addition, Russia also possesses the ability to access world markets through ports on the Baltic Sea. Kazakhstan, in contrast, being landlocked has no direct access to the Black Sea.
One reason behind KRU’s increased exports is the rise of grain production in the 2000s after a decline in the early years of transition. The increase in grain production is due to increased yields rather than an expansion of the land being cropped. The KRU utilized less area for grain production in 2011 than in the 1980’s. This could be partially due to the fact that during the Virgin Lands2 campaign, the massive increase in cropland fostered by the policy expanded into areas not really suitable for grain production3
.
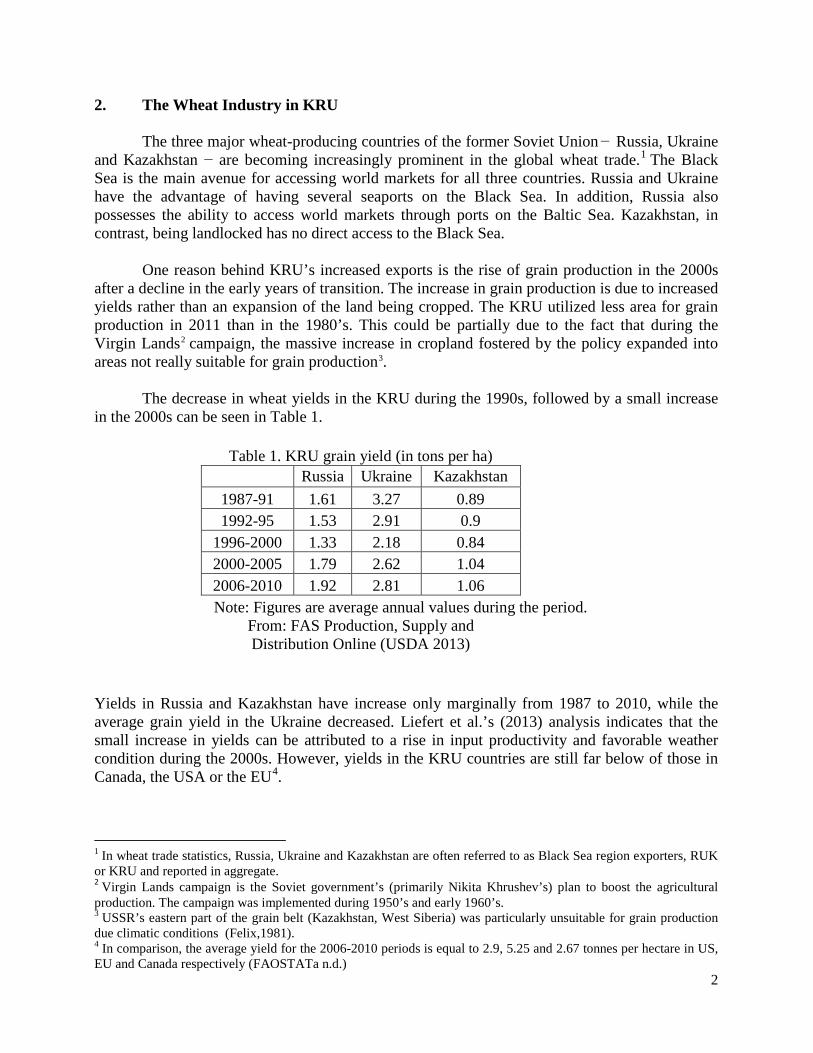
The decrease in wheat yields in the KRU during the 1990s, followed by a small increase in the 2000s can be seen in Table 1.
Table 1. KRU grain yield (in tons per ha)
Russia Ukraine Kazakhstan 1987-91 1.61 3.27 0.89 1992-95 1.53 2.91 0.9 1996-2000 1.33 2.18 0.84 2000-2005 1.79 2.62 1.04 2006-2010 1.92 2.81 1.06 Note: Figures are average annual values during the period.
From: FAS Production, Supply and Distribution Online (USDA 2013)
Yields in Russia and Kazakhstan have increase only marginally from 1987 to 2010, while the average grain yield in the Ukraine decreased. Liefert et al.’s (2013) analysis indicates that the small increase in yields can be attributed to a rise in input productivity and favorable weather condition during the 2000s. However, yields in the KRU countries are still far below of those in Canada, the USA or the EU4
1 In wheat trade statistics, Russia, Ukraine and Kazakhstan are often referred to as Black Sea region exporters, RUK or KRU and reported in aggregate.
.
2 Virgin Lands campaign is the Soviet government’s (primarily Nikita Khrushev’s) plan to boost the agricultural production. The campaign was implemented during 1950’s and early 1960’s. 3 USSR’s eastern part of the grain belt (Kazakhstan, West Siberia) was particularly unsuitable for grain production due climatic conditions (Felix,1981). 4 In comparison, the average yield for the 2006-2010 periods is equal to 2.9, 5.25 and 2.67 tonnes per hectare in US, EU and Canada respectively (FAOSTATa n.d.)

3
In the 2000s, KRU countries become major exporters and were responsible for almost a quarter of the world wheat exports by 2008. Figure 1 clearly demonstrates the growing importance of the KRU countries in international trade.
From: USDA, Foreign Agricultural Services, Production, Supply and Distribution (PS&D) Database (USDA n.d.)
KRU’s export share of world wheat trade increased from only two percent in 1991 to 23 percent in 2008. By 2021, KRU is expected to account for 30 percent of world wheat exports (USDAa n.d.). Ultimately, however, future success will depend on KRU’s ability to overcome some major transition problems and constraints. Russia, Ukraine and Kazakhstan hold significant potential to expand their wheat exports. However, transportation and logistics problems as well as outdated agricultural equipment, input shortages and limited managerial capacity continue to be major issues for KRU. Hence, it is worth keeping in mind that the major findings of the present research are subject to careful interpretation. For example, changes in future projected wheat trade between Kazakhstan and EU might not be achieved due to Kazakhstan’s transportation constraints. All of the KRU countries are still economies in transition and, hence, do not exhibit the same levels of efficiency as can be achieved in modern market economies. Further, their ability to respond to incentives may be inhibited.5
Inadequate grain handling capacities, logistics problems and aging rail infrastructure remain the main constraints faced by wheat producers in Russia. Seventy-seven percent of the grain handling railway wagon fleet is expected to be written-off by 2015 (Baltinfo n.d.).
5 See Burkitbayeva (2013) for a detailed discussion of the potential constraints faced by KRU in exporting wheat.

4
3. International Wheat Trade
As reported above, in 2010 the world utilized 666 MMT of wheat and traded 126 MMT of wheat. Ceteris paribus, in 2050 the world’s 9 billion people are projected to consume over 880 MMT of wheat (Weigand 2011). Based on population growth, wheat production and consumption projections, Weigand (2011) concluded that world wheat trade is likely to double by 2050 reaching a minimum of 240 MMT. Various agricultural outlooks and market analysis reports identify several geographical regions where wheat is an important factor in future production and/or consumption: North America, South America, Central America, EU, rest of the Europe, Middle East, North Africa, Sub Saharan Africa, East Asia, South Asia, South East Asia, the Former Soviet Union and Others.
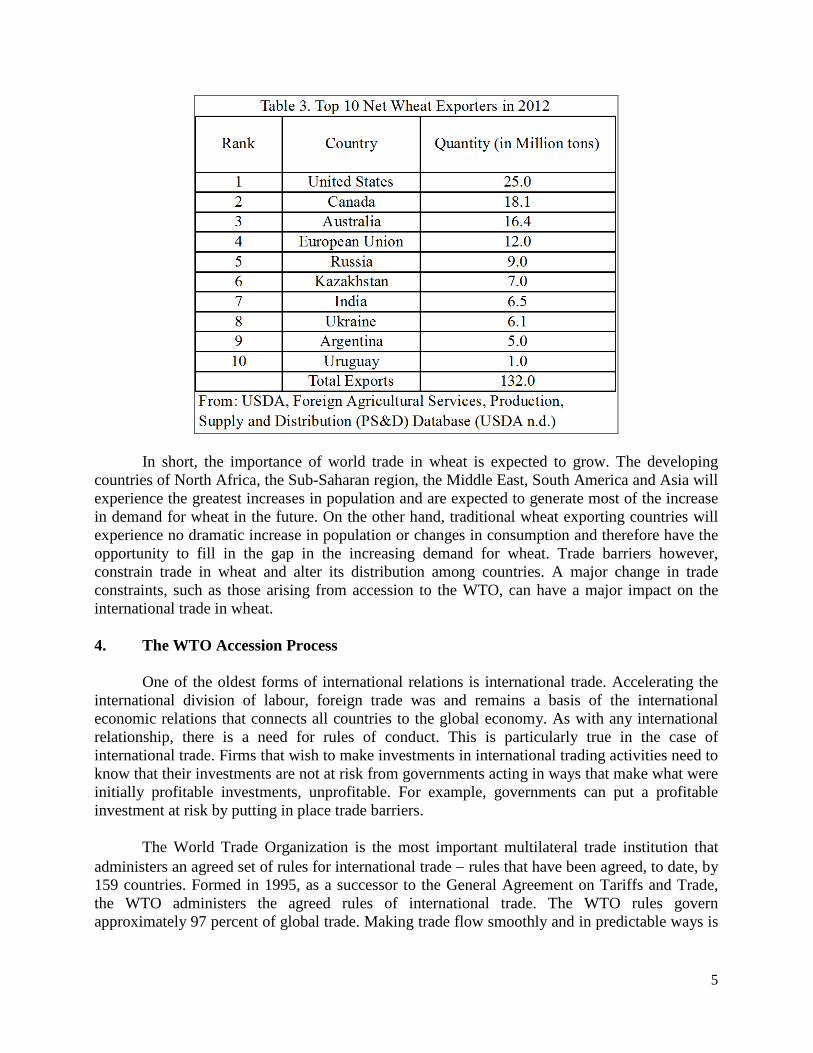
Table 2 provides the list of the top ten wheat importers in the world in 2012.
As can be seen from the Table 2, the top wheat importers are all countries of North Africa, the Middle East, Asia and South America. Table 3 provides a list of top ten wheat exporters. Russia, Ukraine and Kazakhstan are all included in the top ten list of exporters. They are reported separately in Table 3, however combined KRU exports are slightly less than US exports and exceed those of Canada.
5
In short, the importance of world trade in wheat is expected to grow. The developing countries of North Africa, the Sub-Saharan region, the Middle East, South America and Asia will experience the greatest increases in population and are expected to generate most of the increase in demand for wheat in the future. On the other hand, traditional wheat exporting countries will experience no dramatic increase in population or changes in consumption and therefore have the opportunity to fill in the gap in the increasing demand for wheat. Trade barriers however, constrain trade in wheat and alter its distribution among countries. A major change in trade constraints, such as those arising from accession to the WTO, can have a major impact on the international trade in wheat. 4. The WTO Accession Process
One of the oldest forms of international relations is international trade. Accelerating the international division of labour, foreign trade was and remains a basis of the international economic relations that connects all countries to the global economy. As with any international relationship, there is a need for rules of conduct. This is particularly true in the case of international trade. Firms that wish to make investments in international trading activities need to know that their investments are not at risk from governments acting in ways that make what were initially profitable investments, unprofitable. For example, governments can put a profitable investment at risk by putting in place trade barriers.
The World Trade Organization is the most important multilateral trade institution that
administers an agreed set of rules for international trade − rules that have been agreed, to date, by 159 countries. Formed in 1995, as a successor to the General Agreement on Tariffs and Trade, the WTO administers the agreed rules of international trade. The WTO rules govern approximately 97 percent of global trade. Making trade flow smoothly and in predictable ways is

6
at the core of the existence of the WTO trading system. The WTO lists numerous benefits6
There is a considerable difference between tariffs applied to members and non-members of the WTO. Countries are not entitled to MFN tariffs unless they are members of the WTO. Before enjoying the security provided by WTO membership, each country wishing to join the WTO has to go through a five-stage accession process. First, after gaining observer status, the country has to submit a memorandum outlining how its trade and economic policies align, or not, with the WTO’s agreed rules. The memorandum is examined by a Working Party that includes all interested member countries. After a Working Party has made sufficient progress on ensuring the applicant country’s policies align with the rules, countries start bilateral negotiations. Although each interested country negotiates on tariff reductions and other trade inhibiting policies that determine export opportunities for its exporting firms, commitments made in bilateral negotiation will apply equally to all other members following the WTO principle of non-discrimination. The number of bilateral negotiations depends on the number of countries that comprise the Working Party. The third step starts when the applicant’s trade regime is re-examined for compliance with the rules and bilateral talks are complete. The final accession terms are reflected in a formal protocol of accession and tariff schedules. The fifth and final step is the submission of a final package that consists of the protocol and schedules. The final package is presented to the WTO General Council or a Ministerial Conference. The observer is then free to join the organization if two-thirds of the WTO members vote in the affirmative (WTO Information and External Relations Devision 2011).
arising from its existence that collectively promote international development, cooperation and confidence. Confidence in being treated equally and fairly is important for countries, and their firms that wish to invest in international trade activities. Being a member of the system of agreed rules means that a firm is considerably shielded from unfair treatment, sudden protectionist measures or politically motivated trade interventions. Membership means being not discriminated against and being entitled to receive the same trading conditions as every other member of the WTO. Of course, trade disputes will remain, however the WTO trading system with a set of rules and conditions reached by consensus allows the handling trade disputes in a transparent and structured manner. The equality provided by the WTO membership manifests itself through the import tariffs that firms face in foreign markets.
Accession to the WTO promotes the further integration of a country into modern trade relations. The duration of the process of accession to the WTO differs from one case to another depending on the number of bilateral negotiations that have to be completed to achieve consensus. Political matters can also slow the accession process down. For comparison, it took nineteen years of negotiations for Russia to become a member of the WTO but, for example, less than three years for Kyrgyzstan.
After the demise of the Soviet Union and the achievement of independent country status,
Russia, Ukraine and Kazakhstan applied for membership in the World Trade Organization.
6 The ten benefits of joining the WTO: 1. The system helps promote peace; 2. Disputes are handled constructively; 3. Rules make life easier for all; 4. Freer trade cuts the costs of living; 5. It provides more choice of products and qualities; 6. Trade raises incomes; 7. Trade stimulates economic growth; 8. The basic principles make life more efficient; 9. Governments are shielded from lobbying; 10. The system encourages good government (WTO n.d.)
7
Russia was first to express its willingness to join the WTO (GATT7 at the time). In June 1993, Russia submitted the official application to the Secretariat of the GATT. The Working Party chaired by Mr. W. Rossier8 (Switzerland) was established the same year and consisted of 58 members. Subsequently, the Working Party was chaired by two other ambassadors − Kare Bryn (Norway) from 2000 to 2003 and Stefán Jóhannesson (Iceland) from 2003 to 2011. A memorandum on Russia’s Foreign Trade regime was circulated by the Secretariat in 1994. The process proceeded with questions and feedback to Russian authorities. The Working Party’s meetings commenced in 1995. There were, in total, 31 formal Working Party meetings as well as numerous informal ones. The most difficult bilateral negotiations were those with the EU, China, the US and more recently Georgia9
(Babkin et al. 2012). After 2000, the negotiations covered all aspects of Russia’s accession to the WTO including commitments concerning the tariff schedule, market access for goods and services, and agriculture.
Finally, nineteen years of difficult negotiations yielded results. Russia’s accession package, the biggest accession package in the history of the WTO, was approved by the Eighth Ministerial Conference in 2011. On August 22, 2012 Russia notified the WTO Secretariat of the ratification of the package and officially became a member of the WTO.
Among KRU countries, Ukraine was the first to accede the WTO. Ukraine submitted its application to the WTO after Russia, in November 1993. The Working party was established the same year in December. The memorandum on Ukraine’s trade regime was circulated in 1994. Throughout the accession process, Ukraine’s Working party was chaired by three ambassadors; Mr. A. Stoler (US), Mr. S. Marchi (Canada) and Mr. M. Matus (Chile). The process of Ukraine’s accession can be divided into three periods. The first period, 1993-1997, was dedicated to the analysis and monitoring of the economy to determine if it reflected GATT/WTO norms and regulations. The second period, 1998-2003, entailed the process of reformulating and enforcing laws deemed a priority for accession in order to adjust regulations in accordance with the WTO norms. The final stage, 2003-2008, was spent identifying Ukraine’s commitments regarding its membership to the WTO. The 2005-2007 period produced a breakthrough in the negotiation process. During that period Ukraine was able to reach agreement with 52 member states of the WTO and ratify 55 laws in accordance with the WTO norms (Pugachev 2012). In 2008, after 15 years of negotiation, the Ukraine was officially welcomed into the WTO.
The negotiation process for Kazakhstan’s accession to the World Trade Organization started on the 29th of January in 1996, with the submission of the official application to Secretariat of the WTO. In February of the same year, Kazakhstan was assigned status as an “observer” country to the WTO. On April 16, 1996 the General Council of the WTO established a Working Party to examine the application and provide recommendations, including comments on a draft of the Protocol of Admission. Any interested member country could join the Working Party. Members of the Working Party were then encouraged to submit questions on Kazakhstan’s Memorandum on its Foreign Trade regime that was circulated by the Secretariat, on November 11, 1996. The feedback and questions were then transmitted to the Kazakhstan's authorities for further examination and comment. The Memorandum reflected on Kazakhstan’s economy, 7 GATT-General Agreement on Tariffs and Trade was replaced by WTO on January 1, 1995 under the Marrakesh Agreement 8 Different country representatives at the United Nations and other international organizations in Geneva usually chair the WTO working parties. 9 An armed conflict between Georgia and Russia took place in August 2008.
8
economic policies and foreign trade regimes at that time. Government officials acknowledged that Kazakhstan’s key trade legislation met the most important WTO principles and committed Kazakhstan to bringing them in to full compliance with the WTO’s agreed rules. All the ministries of the Kazakhstan Government were urged to ensure full compliance of their legislation with the WTO standards (WTO 1996).
To date, Kazakhstan’s Working Party consists of 43 members and is chaired by H.E. Mr. Hannu Himanen. The Working Party members include the EU and its members as one. Each bilateral negotiation has to finish with a bilateral agreement. Members of the Working Party consist of all the main trading partners of Kazakhstan that belong to the WTO which have expressed a desire to discuss conditions for, and obligations of, the country’s accession to WTO. Kazakh government officials have been releasing statements which anticipated accession each year since 2010. Hence, it is difficult to determine whether Kazakhstan will finally accede to the WTO by the end of 2013, as is planned.
5.0 Modeling Global Wheat Trade
As the subject of interest is the effect of tariff reductions on world wheat trade flows and the resulting welfare changes, the GSIM model of Francois and Hall (2003) was chosen as the most suitable. The GSIM is capable of addressing the issue of trade liberalization on a single industry level and has information requirements that are manageable. It is a static, multi-regional, partial equilibrium, Armington–type product differentiation model that solves for equilibrium prices by satisfying global market clearing conditions; that is, global imports must equal exports. Armington 10
The model estimates the effects of trade liberalization in terms of changes in bilateral trade effects, welfare effects (exporter surplus, importer surplus and change in tariff revenue), price and output changes. The GSIM is flexible, transparent, user friendly and suitable tool to conduct the analysis required for this particular research. It captures the effects of bilateral tariff changes on international commodity trade using minimum data requirements and presents the results in an accessible format.
type product differentiation means that the products originating from different countries are imperfect substitutes. The heterogeneity of the products among countries comes from the different bilaterally imposed tariffs (for example, the US and Russia faced different tariffs imposed by China before Russia’s accession to the WTO). These tariffs determine the relative price of goods. Therefore, a change in tariffs translates into import changes by source. The GSIM requires a bilateral trade matrix at base year world prices, an initial and final matrix of bilateral import tariffs, export supply elasticities, aggregate import demand elasticities and elasticities of substitution. Trade liberalization effects are reflected in terms of bilateral trade changes, welfare effects (exporter surplus, importer surplus and change in tariff revenues), price and change in output. It is a user-friendly spreadsheet model that handles up to 25 regions and is available for public use.
Although fairly recently developed, the GSIM has been applied in wide variety of research projects related to international trade liberalization. Tariff reform studies were carried
10 Armington (1969) proposed a general theory of demand that distinguishes products according to their place of production. The Armington assumption states that products traded internationally are differentiated by the country of origin. The source of differentiation can be different bilaterally applied tariffs between countries.

9
out using GSIM in various specific industries such as milk, wheat, and bananas as well as more aggregated sectors of the economy.
Using the GSIM model, Leudjou (2012) simulates multilateral tariff reduction scenarios for the Cameroon dairy sector. The objective was to assess the impact of trade liberalization on food security in the Cameroon dairy sector, specifically domestic prices and consumer welfare effects. The empirical work was carried out using GSIM model with a total of 23 countries including the major exporters and importers of dairy products along with the Cameroon. Holzner and Peci (2012) studied Kosovo’s potential integration into the European Union (EU) and the resulting trade liberalization effects on Kosovo’s major industries. The estimations were performed for 27 industries at the ISIC 2-digit levels 11. The authors simulated a full trade liberalization scenario between Kosovo and the EU, meaning zero tariff rates were assumed for Kosovo’s imports from the EU.12
A number of trade liberalization case studies based on GSIM were performed by Holzner. Holzner (2008) to measure the effects of a potential accession of the Balkan countries and Turkey to the EU on agricultural trade. The author concluded that agricultural trade liberalization will primarily benefit the accessing countries, while EU members will be affected only to a minor degree. Holzner (2008) also calls for great caution when interpreting the results of the GSIM model. The author refers to the GSIM’s partial equilibrium nature and warns of its inability to capture second round effects or resource reallocation effects in the economy at large. Nevertheless, if model limitations are kept in mind, important implication of trade liberalization can be drawn from the model’s results.
The trade liberalization simulation revealed a net negative welfare effect for Kosovo. Welfare loses were due, for the most part, to losses in tariff revenue. Holzner and Peci (2012) concluded that trade liberalization between Kosovo and the EU will not substantially diversify Kosovo’s export profile.
Worz et al (2007) undertook an analysis of Russia’s WTO accession and its implication for the Russian economy using GSIM. Partial equilibrium modeling was applied to different sectors of the economy separately: agriculture and food, chemicals, metals, textiles and clothing and machinery and vehicles. They concluded that losses associated with greater trade liberalization are rather insignificant for Russia (Worz, et al. 2007).13
5.1 The GSIM Model
GSIM is a partial equilibrium model widely used for an industry level analysis of trade liberalization. The model’s solution set is reduced to the global prices that clear the global market (Francois and Hall 2003). Global equilibrium prices are then used to back solve for national
11 ISIC-The International Standard of Industrial Classification of All Economic Activities developed by UN as a standard way of classifying economic activities. For example: 01-Agriculture, 02-Forestry...17-Textiles, etc. 12 Holzner and Peci (2012) also provide a brief rational behind their chosen elasticity values. Export supply elasticity of 1.5, aggregate import demand elasticity of -1.25 and an elasticity of substitution equal to 5 were adopted from Francois and Hall (2003). An infinite export supply elasticity (9999999) was adopted for the EU and the rest of the world (ROW) to flatten out the supply curve and mimic a small versus large country assumption. Although assumptions regarding the elasticities were simplified, given the available data, identifying “true elasticities” is nearly impossible (Holzner and Peci 2012). The authors also refer to other research to determine alternative values for the elasticities. 13 Further illustrations of the used of the GSIM model for analysis of international trade can be found in Mutambatsere (2006), Vanzetti et al. (2005); Serletis and Fetzer (2008).
10
results. It uses the log-linearized (percentage change) representation of import demand, combined with export-supply equations. The reduced-form system of equations that includes as many equations as there are exporters is then solved for the set of world (exporter) prices. For a detailed description of the model equations refer to Francois and Hall (2003) or Burkitbayeva (2013).
5.2 Data
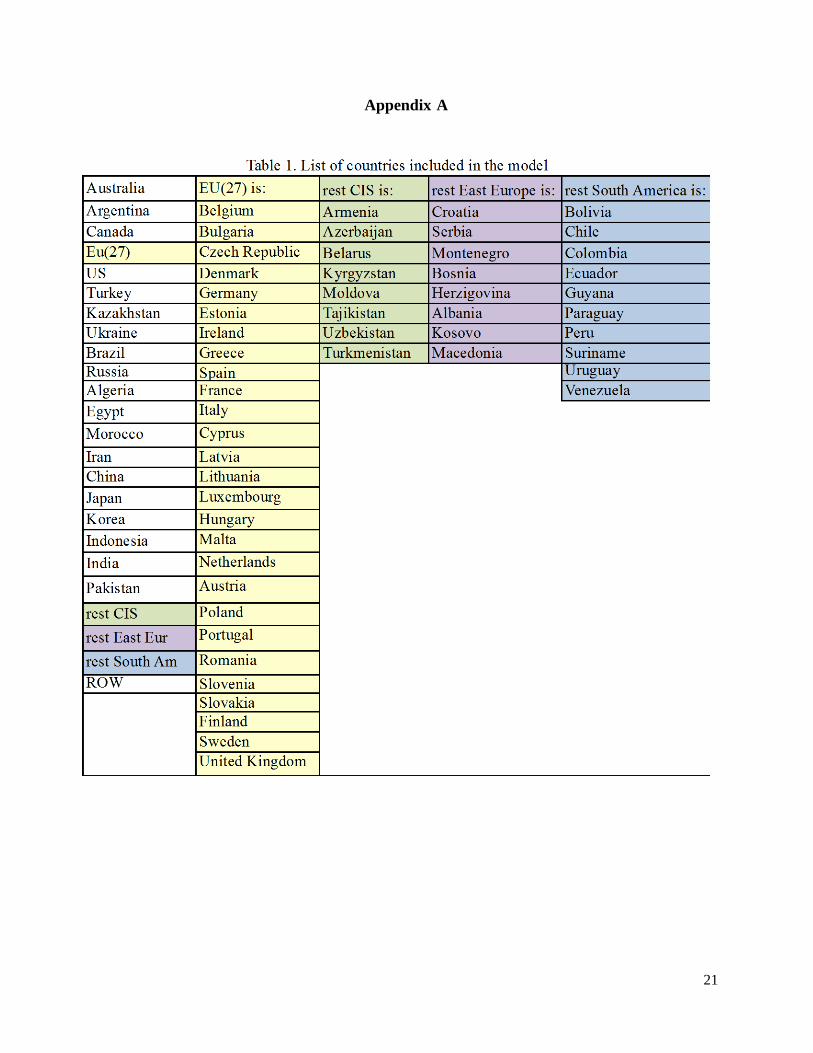
The analysis of the accession to the WTO of Black Sea wheat producers includes a total of 24 regions including major exporting and importing countries for wheat and aggregated regions such as the rest of the world (ROW), the rest of South America, the rest of Eastern Europe and the rest of the Commonwealth Independent States. The data required for the empirical analysis using the GSIM is trade values by the origin and destination, bilateral tariffs, domestic disappearance14
The year 2007 has been chosen as the base year for the analysis. The wheat market in 2007 is of global equilibrium in the market. No major wheat bans occurred in 2007 unlike in the following years that also coincided with the worldwide economic crisis and major spikes in food prices. Also, in 2007 none of the KRU countries had yet joined the WTO. The bilateral trade flow data at the HS
, elasticities of composite demand, supply and substitution. The full list of countries included in the model is reported in Table 1 in the Appendix A. (See Appendix A Table 1).
15 four-digit level that corresponds to wheat and meslin16
Bilateral tariff data comes from numerous sources. The ad valorum
comes from the trade statistics for international development (Trademap n.d.) of the International Trade Center.
17
Aggregate import demand elasticity (𝐸𝑚) values for most of the countries were adopted from Kee, Nicita and Ollareaga (2004). They provide a systematic estimation of import demand elasticities for a broad group of countries at a very disaggregated level. Import demand elasticity values for the EU, Kazakhstan, Russia, Pakistan, and aggregated regions such as the rest of CIS, the rest of South America, Eastern Europe and the ROW were approximated due to lack of data.
equivalents for specific MFN, non-MFN and other preferential tariffs were obtained from the market access map database (MacMap n.d.) of the International Trade Center and the Centre d’Etude Prospectives et d’Informations Internationales, WTO’s Tariff Download Facility Tariff (Tariffdata n.d.), Tariff Analysis Online also by WTO (TAO n.d.) and World Integrated Trade Solution by the World Bank (WITS n.d.). In the case of MFN tariffs, applied tariffs were used when possible. For the tariffs imposed on non-member countries the published rates were used as it was not possible to determine if other rates were applied. Given the small volumes of imports from KRU countries prior to accession, suggests that high tariffs were being applied.
14 Noted as “Trade with Self in the literature and is an estimate of the sales in the domestic market. It is estimated as follows: domestic production minus exports. Since the bilateral trade data is in world prices, domestic production was calculated using world prices. Data for calculating domestic production is sourced from the FAO statistics website. 15 HS is the Harmonized Commodity Description and Coding System (HS) of tariff nomenclature is an internationally standardized system of names in accordance with the World Customs Organization. HS-1001 corresponds to wheat and meslin. 16 Meslin refers to a mixture of wheat/rye. In trade, it is classified with wheat and represents an insignificant part of the entire HS 1001 wheat and meslin category. 17 Ad valorum tariff on imports is specified as a percentage of the value of the good.

11
Approximations are based on the rational provided by Kee, Nicita and Ollareaga (2004). Import demand elasticities assigned to each country and region are reported in Table 2 in the Appendix A (Appendix A, Table 2).
An export supply elasticity (𝐸𝑥) value of 1.5 (Francois and Hall 2003) was adopted for the major exporters of wheat (Australia, the US, Canada, Argentina, the EU (27), Brazil); for other countries and regions, the value 0.5 was adopted. This corresponds to the assumption of a small country (Holzner, 2008). 18 Export supply elasticity values for Russia, Kazakhstan and Ukraine vary between 0.5, 1 and 1.5 depending on the three alternative scenarios19
An elasticity of substitution (𝐸𝑠) value of five (Francois and Hall 2003) was adopted for all countries and regions in the model. The value of five is often used in the literature (Fukita, Krugman and Venables 2000).
.
6.0 Results
The GSIM model was run with the bilateral trade matrix at world prices, initial matrix of bilaterally applied import tariffs on wheat in ad valorem form, and the final matrix of bilateral tariffs in ad valorem form along with the assumed elasticities. The model provides trade liberalization effects. Trade liberalization effects are estimated in terms of changes in welfare, specifically, changes in exporter surplus, importer surplus, trade flows, tariff revenues and prices. The GSIM model generates new prices that clear markets. These prices yield new trade values and welfare effects.
A new trade liberalization equilibrium is assumed to be reached as a result of the KRU countries’ accession to the WTO. Trade liberalization effects are specifically reflected in terms of changes in tariffs applied to the imports of wheat originating from the KRU region. As part of the accession to the WTO, the Black Sea region wheat exporters are entitled to have MFN tariffs applied to their exports rather than the previous non-MFN tariffs that were applied when they were non-members.
18 According to Bacchetta et al. (2012) the elasticities can be different between countries. The export supply elasticity can be different depending on whether one country is large enough to influence world prices. 19 Three scenarios were analyzed in this study. Scenarios vary based on the assumption related to the countries’ being able to respond to changes in market conditions. The first scenario assumes that Russia, Ukraine and Kazakhstan (RUK) are able to respond to changes in demand quickly. Therefore, the three countries take the export supply elasticity value of 1.5 (as with the rest of the major wheat export suppliers). The second scenario assumes that RUK are less responsive to demand changes. In this case, RUK were each assigned export supply elasticity of value 0.5. The third scenario is a worst-case scenario that assumes RUK countries to be nonresponsive to demand changes (export supply elasticity equal to zero), meaning RUK countries are not able to adjust their production output and respond to prices they are going to receive. Supply response elasticities of less than 1.5 in KRU countries might occur due to a limited price transmission between world and domestic markets. Countries in transition such as KRU countries often exhibit weak or limited price transmission. It means that firms in transition economies are less price responsive compared to those in modern market economies. Price transmission inadequacies usually occur due to problems in infrastructure and institutional barriers. Small values of supply elasticities assume that KRU countries will not be able to respond to changes in prices due to their transition problems and constraints discussed above. Different supply elasticity values for KRU countries had marginal impact on the outcome. Therefore, further discussions of results will be based upon scenario 1 outcomes.

12
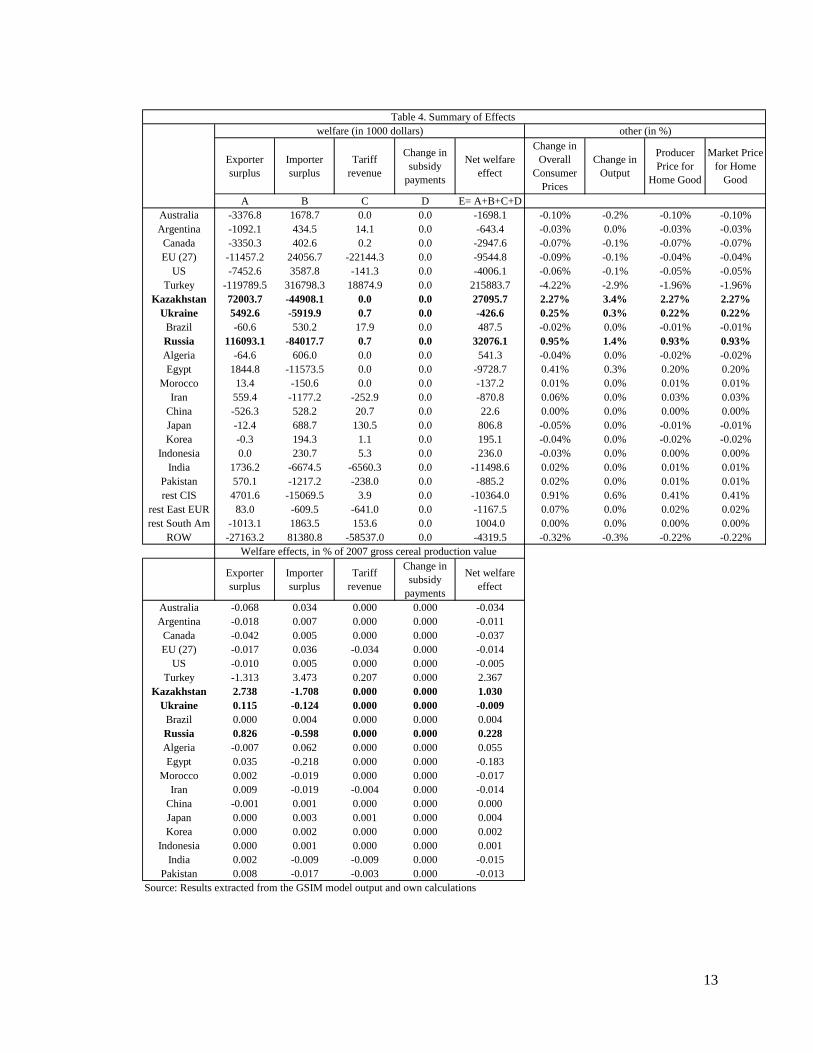
Table 4 summarizes the liberalization effects. Liberalization effects are reported in thousand dollars as well as in the percentage of total cereal production value for a better visualization of the magnitude of the changes. Values in the form of percentages of gross cereal production in 2007 for aggregated regions were dropped and separate countries are reported.
In general, it can be said that the welfare effects of the world wheat trade liberalization as a result of the KRU countries accession to the WTO are modest. Total welfare effects in thousand dollars were related to individual countries’ gross cereal production values in 2007 (see Table 4). Net welfare effects as a share of gross cereal production value appear to be insignificant for most of the countries. Turkey, Kazakhstan, Russia, and Algeria experiences positive net welfare effects. The rest of the countries experience negligible net welfare effects.
Freer trade for KRU countries does not lead to significant changes in prices across the countries and regions. Those countries with the most restrictive tariffs (the EU, Turkey, China and ROW) show price declines after freer trade. Price declines are higher in Turkey because more wheat is imported than exported. As net exporters, the KRU countries experience an increase in wheat prices due to improved market access. Since trade liberalization is not uniform across all markets countries experience different changes in prices. As large exporters’ trade diverts to freer markets, prices rise slightly in Egypt, Morocco, Iran, India, Pakistan, the rest of CIS and the rest of Europe. Slightly smaller amounts of wheat − in value terms − are exported to these countries after trade liberalization, which explains the marginal rise in prices.
The greatest tariff difference before and after accession is expected from the EU, Turkey and China. Results show negative tariff revenues for the EU. They are, however, very small. Turkey experiences positive changes in terms of tariff revenues. Larger volumes of imports might have compensated for overall reductions in tariff levels. The difference in China’s MFN and non-MFN tariffs is large. However, the reductions in tariffs faced by KRU wheat imports to China and potential increases in import volumes were not captured by the model as a result of the absence of trade between KRU countries and China 2007. This is shortcoming is due to the model limitations. To address this problem, positive trade was recorded between KRU and China in 2007 to allow the model to capture the effects of tariff reductions. Another run of the model showed the expected increase in trade between all KRU countries and China. Increase in trade between China and KRU countries is very likely, particularly with its immediate neighbors – Russia and Kazakhstan. Added trade between KRU countries and China did not alter previously obtained welfare effects to any important degree and had no impact on the directions (signs) of the changes.
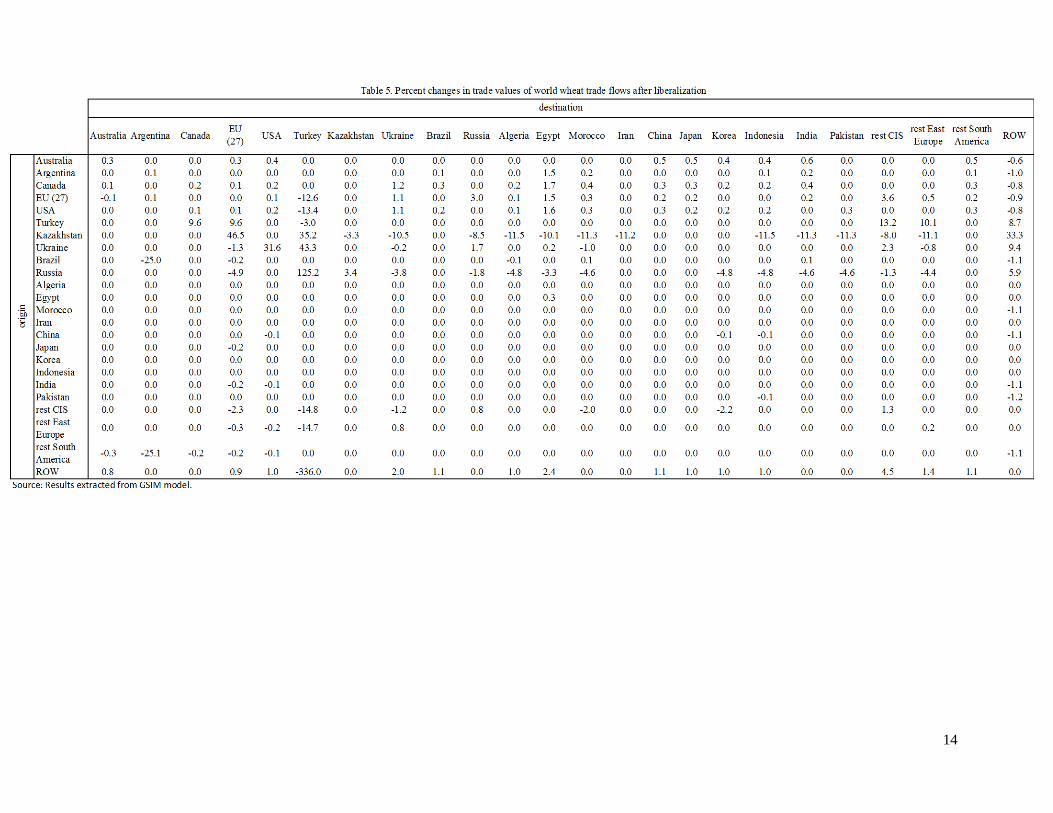
Changes in trade flows appear to be consistent with the theory. More trade occurs in freer markets. Table 5 demonstrates the changes in trade flows after the liberalization. Trade flow changes are reflected in percentage terms.
13
Exporter surplus
Importer surplus
Tariff revenue
Change in subsidy
payments
Net welfare effect
Change in Overall
Consumer Prices
Change in Output
Producer Price for
Home Good
Market Price for Home
Good
A B C D E= A+B+C+DAustralia -3376.8 1678.7 0.0 0.0 -1698.1 -0.10% -0.2% -0.10% -0.10%Argentina -1092.1 434.5 14.1 0.0 -643.4 -0.03% 0.0% -0.03% -0.03%Canada -3350.3 402.6 0.2 0.0 -2947.6 -0.07% -0.1% -0.07% -0.07%EU (27) -11457.2 24056.7 -22144.3 0.0 -9544.8 -0.09% -0.1% -0.04% -0.04%
US -7452.6 3587.8 -141.3 0.0 -4006.1 -0.06% -0.1% -0.05% -0.05%Turkey -119789.5 316798.3 18874.9 0.0 215883.7 -4.22% -2.9% -1.96% -1.96%
Kazakhstan 72003.7 -44908.1 0.0 0.0 27095.7 2.27% 3.4% 2.27% 2.27%Ukraine 5492.6 -5919.9 0.7 0.0 -426.6 0.25% 0.3% 0.22% 0.22%
Brazil -60.6 530.2 17.9 0.0 487.5 -0.02% 0.0% -0.01% -0.01%Russia 116093.1 -84017.7 0.7 0.0 32076.1 0.95% 1.4% 0.93% 0.93%Algeria -64.6 606.0 0.0 0.0 541.3 -0.04% 0.0% -0.02% -0.02%Egypt 1844.8 -11573.5 0.0 0.0 -9728.7 0.41% 0.3% 0.20% 0.20%
Morocco 13.4 -150.6 0.0 0.0 -137.2 0.01% 0.0% 0.01% 0.01%Iran 559.4 -1177.2 -252.9 0.0 -870.8 0.06% 0.0% 0.03% 0.03%
China -526.3 528.2 20.7 0.0 22.6 0.00% 0.0% 0.00% 0.00%Japan -12.4 688.7 130.5 0.0 806.8 -0.05% 0.0% -0.01% -0.01%Korea -0.3 194.3 1.1 0.0 195.1 -0.04% 0.0% -0.02% -0.02%
Indonesia 0.0 230.7 5.3 0.0 236.0 -0.03% 0.0% 0.00% 0.00%India 1736.2 -6674.5 -6560.3 0.0 -11498.6 0.02% 0.0% 0.01% 0.01%
Pakistan 570.1 -1217.2 -238.0 0.0 -885.2 0.02% 0.0% 0.01% 0.01%rest CIS 4701.6 -15069.5 3.9 0.0 -10364.0 0.91% 0.6% 0.41% 0.41%
rest East EUR 83.0 -609.5 -641.0 0.0 -1167.5 0.07% 0.0% 0.02% 0.02%rest South Am -1013.1 1863.5 153.6 0.0 1004.0 0.00% 0.0% 0.00% 0.00%
ROW -27163.2 81380.8 -58537.0 0.0 -4319.5 -0.32% -0.3% -0.22% -0.22%
Exporter surplus
Importer surplus
Tariff revenue
Change in subsidy
payments
Net welfare effect
Australia -0.068 0.034 0.000 0.000 -0.034Argentina -0.018 0.007 0.000 0.000 -0.011Canada -0.042 0.005 0.000 0.000 -0.037EU (27) -0.017 0.036 -0.034 0.000 -0.014
US -0.010 0.005 0.000 0.000 -0.005Turkey -1.313 3.473 0.207 0.000 2.367
Kazakhstan 2.738 -1.708 0.000 0.000 1.030Ukraine 0.115 -0.124 0.000 0.000 -0.009
Brazil 0.000 0.004 0.000 0.000 0.004Russia 0.826 -0.598 0.000 0.000 0.228Algeria -0.007 0.062 0.000 0.000 0.055Egypt 0.035 -0.218 0.000 0.000 -0.183
Morocco 0.002 -0.019 0.000 0.000 -0.017Iran 0.009 -0.019 -0.004 0.000 -0.014
China -0.001 0.001 0.000 0.000 0.000Japan 0.000 0.003 0.001 0.000 0.004Korea 0.000 0.002 0.000 0.000 0.002
Indonesia 0.000 0.001 0.000 0.000 0.001India 0.002 -0.009 -0.009 0.000 -0.015
Pakistan 0.008 -0.017 -0.003 0.000 -0.013Source: Results extracted from the GSIM model output and own calculations
Table 4. Summary of Effects
Welfare effects, in % of 2007 gross cereal production value
other (in %)welfare (in 1000 dollars)
14
15
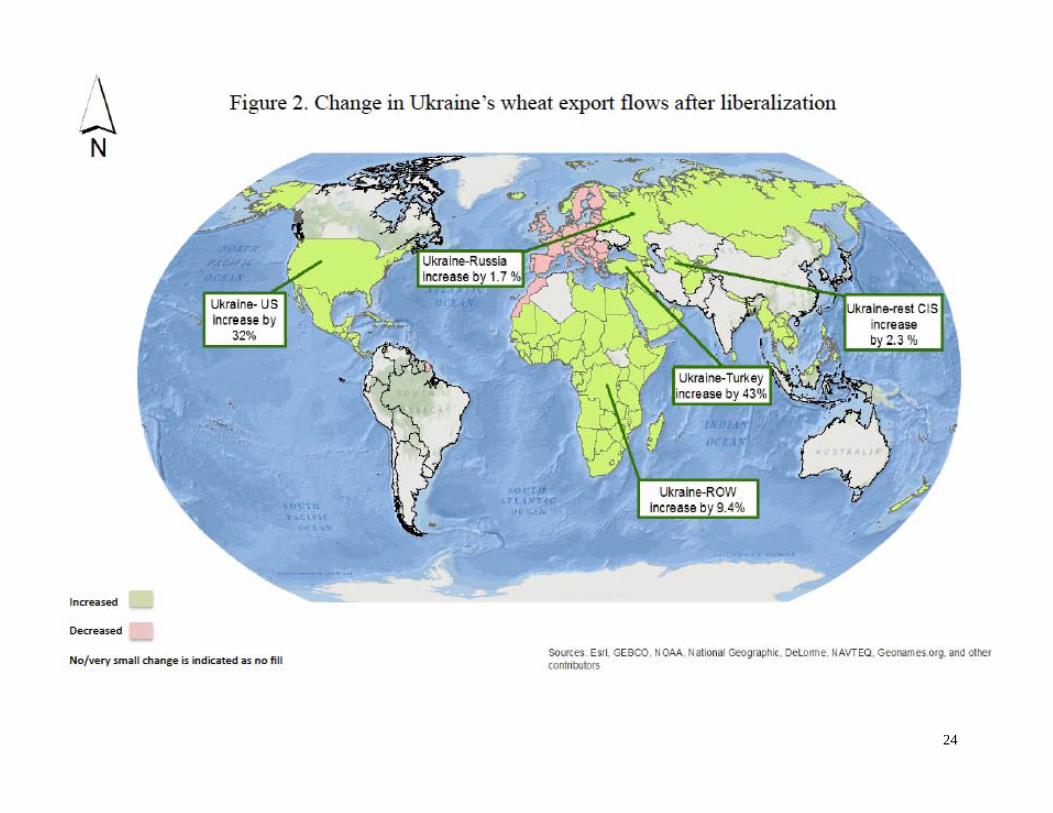
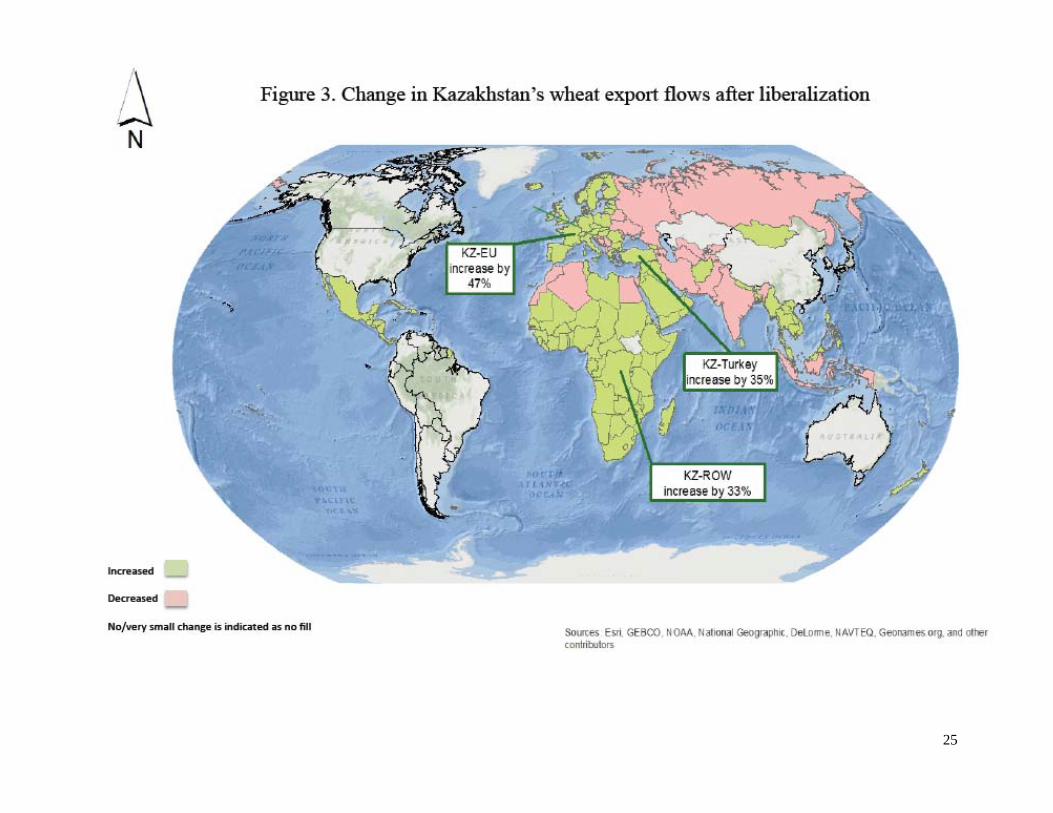
As expected, the KRU countries experience substantial changes in trade flows due to the tariff reductions manifest in important importing markets. Russia experiences a large increase in trade with Turkey, Kazakhstan, ROW and a marginal decrease in trade with other importers. The increase in export values from Russia to Turkey and ROW are due to tariff reductions. The three percent increase in trade between Russia and Kazakhstan cannot be attributed to tariff reductions but rather to a big difference in changes in prices in Russia and Kazakhstan. Ukraine’s value of exports to the US, Turkey and ROW increased by 32, 43 and 9 percent respectively. There is also a marginal increase in trade with Russia, Egypt, the rest of CIS as well as slightly negative changes in trade with the EU, Morocco and rest of Europe. This is due to increased access to some markets and, hence, redistribution effects from one market to another. Kazakhstan trades 47, 35 and 33 percent more with the EU, Turkey and ROW respectively. These changes also stem from tariff reductions. There is slightly less trade occurring with the remainder of Kazakhstan’s trading partners due to the diversion of trade flows as a result of increased access in other markets. It is also worth mentioning that the EU’s currently applied wheat import tariffs for high quality wheat and medium or low quality wheat from WTO members is 0 and 95 euro per ton. High quality wheat is identified as minimum 14 percent protein content while everything else below 14 percent is considered medium or low quality wheat. In the future, as a result of accession to the WTO, KRU country exporters might benefit from the absence of restrictions on high quality wheat.
The EU, the US, the rest of CIS and the ROW have lower trade values with Turkey as their relative market access conditions erode relative to the KRU countries in the Turkish market. In general, major wheat exporting countries such as Argentina, Australia, Canada, the EU and the US do not appear to be negatively impacted by KRU’s accession to the WTO to any important degree. As their relative markets access conditions erode in the Turkish (for the EU and the US) and ROW markets (these are mostly represented by Middle Eastern and African markets), their trade flows are diverted and marginally distributed among other countries and regions at reduced prices.
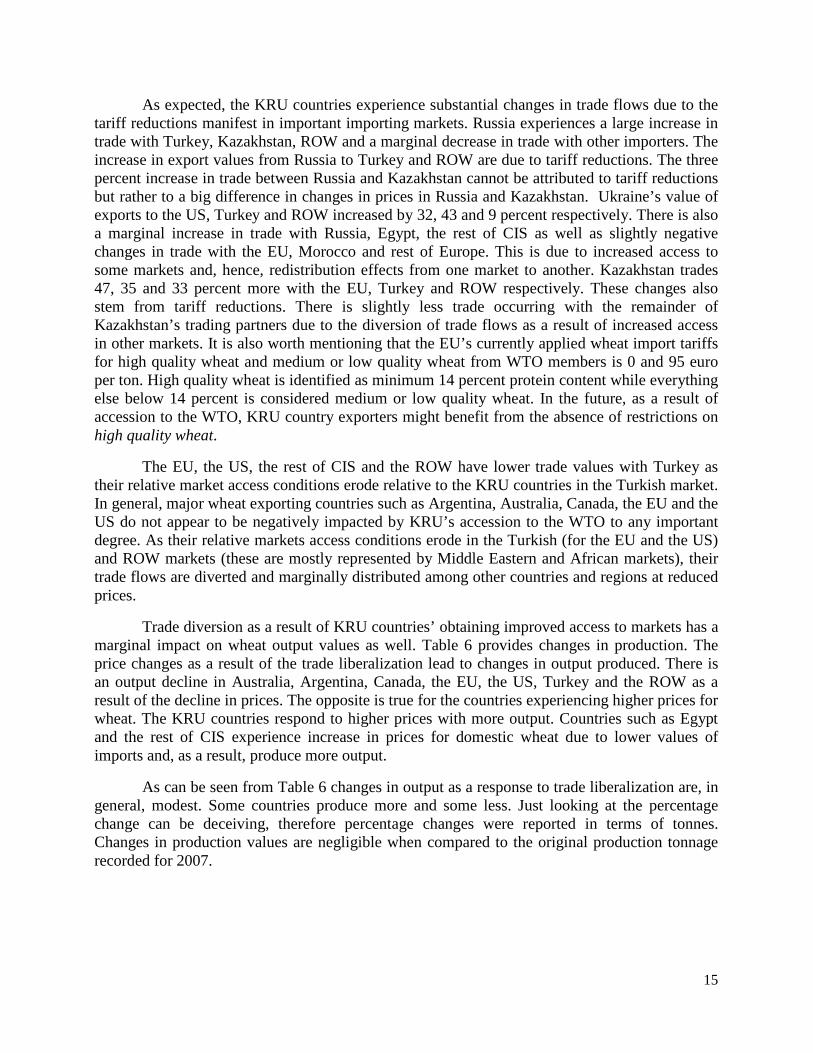
Trade diversion as a result of KRU countries’ obtaining improved access to markets has a marginal impact on wheat output values as well. Table 6 provides changes in production. The price changes as a result of the trade liberalization lead to changes in output produced. There is an output decline in Australia, Argentina, Canada, the EU, the US, Turkey and the ROW as a result of the decline in prices. The opposite is true for the countries experiencing higher prices for wheat. The KRU countries respond to higher prices with more output. Countries such as Egypt and the rest of CIS experience increase in prices for domestic wheat due to lower values of imports and, as a result, produce more output.
As can be seen from Table 6 changes in output as a response to trade liberalization are, in general, modest. Some countries produce more and some less. Just looking at the percentage change can be deceiving, therefore percentage changes were reported in terms of tonnes. Changes in production values are negligible when compared to the original production tonnage recorded for 2007.
16
In the case of Canada, the changes are very modest, a decrease in output of approximately 200 tonnes and a decline in price in the order of one tenth of a percent. As Canada’s international sales destinations are well diversified the changes arising from the accession of the Black Sea wheat suppliers to the WTO are spread over a large number of countries – exports increase modestly to a number of countries but there is a decline in shipments to the ROW, primarily North Africa and the Middle East.
To ease the process of visualization of the results, the KRU countries’ changes in trade flow maps are provided in Appendix B (see Appendix B Figure 1,2 and 3). These maps were all generated using arc GIS20
7.0 Conclusion
software.
The results indicate that increased access to markets leads to more trade between the KRU countries and previously restricted markets. The KRU countries’ trade with now more open markets such as Turkey, the EU, China and the ROW expands. Major traditional wheat exporters such as Australia, Canada, the EU, and the US do not seem to be negatively impacted to any important degree from the accession of the KRU countries to the WTO. Their relative market access conditions, however, erode in Turkish (for the EU and the US) and ROW markets (these are mostly represented by Middle Eastern and North African markets) and their trade volumes are diverted and marginally distributed among other countries and regions at reduced prices.
20 Arc GIS is a geographic information system that allows to visualizes values, in our case, trade flows in terms of American dollars.
17
Trade liberalization is not uniform across regions and, hence, leads to different net welfare changes across countries. However, those welfare changes appear to be modest.
Accession of the KRU countries to the WTO can be expected to result in observable changes in trade flows in the world wheat trade. Although net welfare effects appear to be relatively small, there is a potential for intensification of trade among KRU countries and their trade partners. Increases in the KRU’s countries’ export opportunities would come at the expense of the other major wheat exporters such as Canada, the US, Australia and the EU as their competitiveness erodes in several major importing markets (Turkey, the EU, and the ROW). The loss, however, does not appear to be significant in terms of their dollar values. Major exporters will be able to compensate for the market access erosion by diverting and distributing exports among other importing markets. Canada, the US, Australia and the EU’s market presence is more diverse in terms of geography than that of the KRU region. These countries hold an advantage in terms of transportation costs at this point in time. It is also believed that these countries have established themselves as reliable exporters in contrast to KRU countries. KRU countries have volatile production and have a history of export bans. Therefore, traditionally large exporters such as the US, Canada and Australia are less likely to suffer as a result of the KRU’s accession to the WTO.
Accession to the WTO can bring market access opportunities for KRU countries. It is, however, questionable whether producers in those countries can capitalize on the opportunities provided by the WTO membership. This depends on factors such as future productivity, domestic policies, adaptability to the climate changes and other socio economic factors. Infrastructure is one of the major constraints for KRU countries. Russia, Ukraine and Kazakhstan are all putting considerable effort into improving the infrastructure for storing and transporting grain. If KRU countries overcome their present constraints and use their wheat producing resources efficiently, their presence in the world wheat trade arena will remain strong and gain in prominence.

18
References Armington, Paul, S. (1969). A Theory of Demand for Products Distinguished by Place of Production. Vol. 16. Washington: International Monetary Fund.
Babkin, K.A, Kuznecov A. B, E. A Korchevoi, V. V Pronin, and V. A Samohvalova (2012). Consequances of Russia's Accession to the WTO. WTO inform , Moscow: WTO inform.
Bacchetta, M., C. Beverelli, O. Cadot, M. Fugazza, J-M. Grether, M. Helble, A. Nicita, R. Piermartini (2012). A Practical Guide to Trade Policy Analysis. Geneva: UNCTAD and the WTO.
Baltinfo, n.d. Logistics Problems Hamper Russian Grain Exports (translation from russian). http://www.baltinfo.ru/2009/12/18/Problemy-logistiki-meshaiut-eksportu-rossiiskogo-zerna-120835 (accessed March 12, 2013).
Burkitbayeva, S (2013). Accession of Black Sea Region Wheat Producers to the WTO: Implications for World Wheat Trade. Unpublished master's thesis for master's degree, University of Saskatchewan, Saskatoon, Canada.
FAO n.d. "FAO Cereal Supply and Demand Brief." Rome: Food and Agriculture Organization. www.fao.org/worldfoodsituation/wfs-home/csbd/en/ (accessed April 2, 2013).
FAO, 2003. World Agriculture Towards 2015/2020. Edited by Jelle Bruinsma. London: Food and Agriculture Organization.
FAOSTATa n.d. FAOSTAT.Cereal Production. Yeild Information. faostat3.fao.org (accessed April 1, 2013).
Felix, Kogan (1981). "Grain production on the USSR. Present Situation, Perspectives for Development and Methods for Prediction." Staff Report, Washington: United States Department of Agriculture.
Francois, J.F., and H.K Hall (2003). Global Simulation Analysis of Industry-Level Trade Policy. Tinbergen Institute, CERP, Washington: US Commerce Department.
Fukita, M, P Krugman, and A Venables (2000). The Spacial Economy- Cities, Regions and International Trade. Cambridge, MA; MIT Press.
Holzner, Mario (2008). GSIM Measurment of the Effects of the EU accession of the Balkans and Turkey on Agricultural Trade. South East European Journal of Economics and Business 3 (1): 7-14 .
Holzner, Mario, and F Peci (2012). "Measuring the Effects of Trade Liberalization in Kosovo." Vienna: The Vienna Institute for International Economic Studies.
Kee, Hiau Looi, A Nicita, and M Olarreaga (2004). Import Demand Elasticities and Trade Distortions. The Review of Economics and Statistics 90 (4): 666-682.
19
Leudjou, Roland (2012). The Doha Round and Food Security in the Dairy Sector in Cameroon: A Global Simulation Model (GSIM) Approach. The Estey Centre Journal of International Law and Trade Policy 13 (1) : 115-130.
Liefert, Olga, William Liefert, and Eric Luebenhusen (2013). Rising Grain Exports by the Former Soviet Union Region. Washington: United States Department of Agriculture.
MacMap n.d. macmap.org. Geneva: International Trade Center.
Mutambatsere, Emily (2006). Trade Policy Reforms in the Cereals Sector of the SADC Region: Implication on Food Security. Department of Applied Economics and Managment. Cornell University. Ithaca: Cornell University.
Pugachev, N (2012). Ukraine's Accession to the WTO: Accession Conditions. Presentation. Moscow: Ministry of Agriculture of Russia Training Centre.
Serletis, George, and James Fetzer (2008). Modeling the Impact of the US Tobacco Quota Buyout. Working Paper No 2008-06-A. Washington: US International Trade Commission.
TAO n.d. WTO: Tariff Analysis online. tariffanalysis.wto org.
Tariffdata n.d. tariffdata.wto.org. WTO.
Trademap n.d. www.trademap.org. Geneva: International Trade Center.
US Census Bureau, n.d. International Programs. World Population 1950-2050. http://www.census.gov (accessed November 29, 2012).
USDAa, n.d USDA Wheat Baseline, 2012-21. www.ers.usda.gov (accessed March 21, 2013).
USDA (2013). FAS Production, Supply and Distribution Online (USDA PS&D). http://www.fas.usda.gov/psdonline/ (accessed January 17, 2013).
USDA, n.d. Trade.World wheat maret. http://www.ers.usda.gov (accessed January 1, 2013).
Vanzetti, D., S. Fernandez, and V Chau (2005). Banana Split: How EU Policies Devide Global Producers. Vol. 31. Policy Issues in International Trade and Commodities Study Series. New York and Geneva: United Nations.
Weigand, Chad (2011). Wheat Import Projections Towards 2050. Arlington: US Wheat Associates.
WITS. World Trade Integrated Solutions. Washington: World Bank. www.wits.worldbank.org.
Worz, J, O Pindyuk, M Holzner, and V Astrov (2008). "Russia's WTO accession in the Meduim and Long Run-A Global Simulation Model (GSIM) approach." Vienna: The Vienna Institute for International Economy.
WTO (1996). Accession of the Republic of Kazakhstan: Memorandum on the Foreighn Trade. Geneva: World Trade Organization.
20
WTO Information and External Relations Devision (2011). Understanding the WTO Fiftth Edition. Geneve: World Trade Organization.
WTO n.d. Ten Benefits of the WTO Trading System. http://www.wto.org/english_e/whatis_e/10ben_e/10b00_e.htm (accessed May 1, 2013).
21
Appendix A

22

23
Appendix B
24
25
26
The maps above were generated to the ease the visualization of the results. They were all generated using GIS software. Each map presents the changes in trade flows between KRU countries and their export destinations. Increases or decreases in trade are represented by green and pink respectively. Countries and regions with no colouration represent no or very small change in quantities traded. The most important changes in trade flows are also indicated with callout boxes.