the 2-year clinical outcomes of the absorb ii trial: first ... · the 2-year clinical outcomes of...
TRANSCRIPT

The 2-year Clinical Outcomes of the ABSORB II Trial: First Randomized Comparison between the Absorb Everolimus Eluting Bioresorbable Vascular Scaffold and the XIENCE Everolimus Eluting Stent
Bernard ChevalierInstitut Jacques Cartier, Massy, France
Patrick W. SerruysImperial College, London, UK
Erasmus University MC, Netherlands
on behalf of the ABSORB II Investigators
12 October 2015 - San Francisco, CA - U.S.APlenary Session VII. First Report Investigations 1. 12:00pm

Presentor Disclosures
Bernard Chevalier is a consultant for Abbott Vascular
Patrick Serruys is a member of the international advisory board of Abbott Vascular
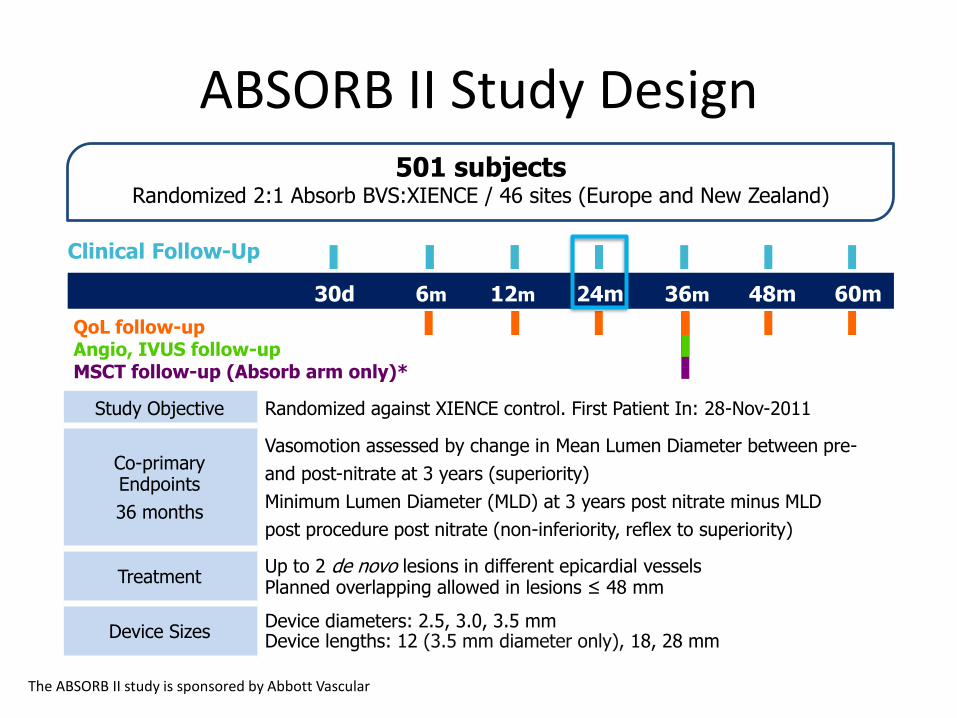
ABSORB II Study Design
Study Objective Randomized against XIENCE control. First Patient In: 28-Nov-2011
Co-primary Endpoints
36 months
Vasomotion assessed by change in Mean Lumen Diameter between pre-
and post-nitrate at 3 years (superiority)
Minimum Lumen Diameter (MLD) at 3 years post nitrate minus MLD
post procedure post nitrate (non-inferiority, reflex to superiority)
TreatmentUp to 2 de novo lesions in different epicardial vesselsPlanned overlapping allowed in lesions ≤ 48 mm
Device SizesDevice diameters: 2.5, 3.0, 3.5 mmDevice lengths: 12 (3.5 mm diameter only), 18, 28 mm
501 subjects Randomized 2:1 Absorb BVS:XIENCE / 46 sites (Europe and New Zealand)
Clinical Follow-Up
24m6m 12m 36m30d
QoL follow-upAngio, IVUS follow-upMSCT follow-up (Absorb arm only)*
48m 60m
The ABSORB II study is sponsored by Abbott Vascular

Intent To TreatN=501
Absorb BVSN=335
N=334
N=331
N=324
(96.7%)
XIENCEN=166
N=166
N=165
N=163
(98.2%)
1 subject consent
withdrawn
3 subjects consent
withdrawn
2 subjects consent
withdrawn
1 subject died
Baseline
30-day
180-day
1-year
1 subject consent
withdrawn
N=329 N=164
2-year
2-Year Patient Flowchart
3 subjects consent
withdrawn. 2 subjects
died
1 subject consent
withdrawn

1-year Summary
Absorb BVSN=335
XIENCEN=166
p value
Hierarchical PoCE*, % 7.3 9.1 0.47All death (Non-hierarchical) 0.0 0.6 0.33
All MI (Non-hierarchical) 4.5 1.2 0.06All revascularization (Non-hierarchical) 3.6 7.3 0.07
PoCE (Patient oriented Composite Endpoint)*: All death, all myocardial infarction, and all revascularisation.
*Per ARC. Cutlip et al., Circulation. 2007;115:2344-2351
Per Protocol Myocardial Infarction (MI):
• Q wave MIDevelopment of new, pathological Q wave on the ECG.
• Non-Q wave MIElevation of CK levels to ≥ two times the upper limit of normal (ULN) with elevated CK-MB in the absence of new pathological Q waves.

1-year Summary
Absorb BVSN=335
XIENCEN=166
p value
Hierarchical PoCE*, % 7.3 9.1 0.47All death (Non-hierarchical) 0.0 0.6 0.33
All MI (Non-hierarchical) 4.5 1.2 0.06All revascularization (Non-hierarchical) 3.6 7.3 0.07
Hierarchical DoCE* or TLF, % 4.8 3.0 0.35Cardiac death (Non-hierarchical) 0.0 0.0 1.00
TV-MI (Non-hierarchical) 4.2 1.2 0.07CI-TLR (Non-hierarchical) 1.2 1.8 0.69
PoCE (Patient oriented Composite Endpoint)*: All death, all myocardial infarction, and all revascularisation.DoCE (Device oriented Composite Endpoint)*/ TLF (Target Lesion Failure):Cardiac death, target-vessel myocardial infarction, and clinically indicated target-lesion revascularisation (TLR).
*Per ARC. Cutlip et al., Circulation. 2007;115:2344-2351
Per Protocol Myocardial Infarction (MI):
• Q wave MIDevelopment of new, pathological Q wave on the ECG.
• Non-Q wave MIElevation of CK levels to ≥ two times the upper limit of normal (ULN) with elevated CK-MB in the absence of new pathological Q waves.

2-year Clinical Outcomes Composite Endpoints
Absorb BVSN=335
XIENCEN=166
p value
PoCE (%) 11.6 12.8 0.70
PoCE (Patient oriented Composite Endpoint): All death, all myocardial infarction, and all revascularisation

2-year Clinical Outcomes Composite Endpoints
Absorb BVSN=335
XIENCEN=166
p value
PoCE (%) 11.6 12.8 0.70
MACE (%) 7.6 4.3 0.16
PoCE (Patient oriented Composite Endpoint): All death, all myocardial infarction, and all revascularisationMACE (Major Adverse Cardiac Events):Cardiac death, all myocardial infarction, and clinically indicated target-lesion revascularisation (TLR)

2-year Clinical Outcomes Composite Endpoints
Absorb BVSN=335
XIENCEN=166
p value
PoCE (%) 11.6 12.8 0.70
MACE (%) 7.6 4.3 0.16
DoCE, TLF (%) 7.0 3.0 0.07
PoCE (Patient oriented Composite Endpoint): All death, all myocardial infarction, and all revascularisationMACE (Major Adverse Cardiac Events):Cardiac death, all myocardial infarction, and clinically indicated target-lesion revascularisation (TLR)DoCE (Device oriented Composite Endpoint)/ TLF (Target Lesion Failure):Cardiac death, target-vessel myocardial infarction, and clinically indicated target-lesion revascularisation (TLR)

2-year Clinical Outcomes Composite Endpoints
Absorb BVS N=335
XIENCEN=166
p value
PoCE (%) 11.6 12.8 0.70
MACE (%) 7.6 4.3 0.16
DoCE, TLF (%) 7.0 3.0 0.07
TVF (%) 8.5 6.7 0.48
PoCE (Patient oriented Composite Endpoint): All death, all myocardial infarction, and all revascularisationMACE (Major Adverse Cardiac Events):Cardiac death, all myocardial infarction, and clinically indicated target-lesion revascularisation (TLR)DoCE (Device oriented Composite Endpoint)/ TLF (Target Lesion Failure):Cardiac death, target-vessel myocardial infarction, and clinically indicated target-lesion revascularisation (TLR)TVF (Target Vessel Failure):Cardiac death, all myocardial infarction, clinically indicated target-vessel revascularisation (TVR)

Patient oriented Composite Endpoint (PoCE)
PoCE: All death, all myocardial infarction, and all revascularisation
Po
CE
(%)
0
5
10
15
20
25Absorb BVS XIENCE
Time Post Index Procedure (Months)
0 90 180 270 360 450 540 630 720
2.4%
4.2%7.3%
10.3%
∆=1.8%
37-day HR1.75 [0.58,5.31]
p=0.3151
37-758-day HR0.69 [0.37,1.28]
p=0.2317
∆=-3.0%

MA
CE
(%
)
0
5
10
15
20
25
1.2%
4.2%
3.1%
3.5%∆=3.0% ∆=0.4%
37-day HR3.49 [0.79,15.34]
p=0.0760
37-758-day HR1.13 [0.39,3.24]
p=0.8242
Time Post Index Procedure (Months)
0 90 180 270 360 450 540 630 720
Major Adverse Cardiac Events (MACE)
MACE: Cardiac death, all myocardial infarction, and clinically indicated target-lesion revascularisation
Absorb BVS XIENCE

Do
CE
/TL
F (
%)
0
5
10
15
20
25Absorb BVS XIENCE
Time Post Index Procedure (Months)
0 90 180 270 360 450 540 630 720
1.2%
3.9%
1.8%
3.2%∆=2.7%
37-day HR3.24 [0.73,14.33]
p=0.0996
37-758-day HR1.71 [0.47,6.20]
p=0.4109
∆=1.4%
Device oriented Composite Endpoint (DOCE)/Target Lesion Failure (TLF)
DoCE/TLF : Cardiac death, target-vessel myocardial infarction, and clinically indicated target-lesion revascularisation (TLR)

TV
F (
%)
0
5
10
15
20
25Absorb BVS XIENCE
Time Post Index Procedure (Months)
0 90 180 270 360 450 540 630 720
1.8%
4.2%
4.5%
4.9%∆=2.4%
37-day HR2.33 [0.67,8.10]
p=0.1683
37-758-day HR0.89 [0.37,2.12]
p=0.7914
∆=-0.4%
TVF : Cardiac death, all myocardial infarction, clinically indicated target-vessel revascularisation
Target Vessel Failure (TVF)

Clinical Outcomes Non Hierarchical Events
2 yearsAbsorb
BVS N=335
XIENCEN=166
p value
Death* (%) 1.2 0.6 0.67
Cardiac 0.6 0.0 0.55
Non cardiovascular 0.6 0.6 1.00
*Per ARC. Cutlip et al., Circulation. 2007;115:2344-2351

Clinical Outcomes Non Hierarchical Events
2 yearsAbsorb
BVS N=335
XIENCEN=166
p value
Death* (%) 1.2 0.6 0.67
Cardiac 0.6 0.0 0.55
Non cardiovascular 0.6 0.6 1.00
Myocardial Infarction (%) 5.8 2.4 0.10
Q-wave 1.5 0.6 0.67
Non Q-wave 4.3 1.8 0.16
*Per ARC. Cutlip et al., Circulation. 2007;115:2344-2351

Clinical Outcomes Non Hierarchical Events
2 yearsAbsorb
BVSN=335
XIENCEN=166
p value
Death* (%) 1.2 0.6 0.67
Cardiac 0.6 0.0 0.55
Non cardiovascular 0.6 0.6 1.00
Myocardial Infarction (%) 5.8 2.4 0.10
Q-wave 1.5 0.6 0.67
Non Q-wave 4.3 1.8 0.16
Definite/Probable ST* (%) 1.5 0.0 0.17
Acute/sub-acute (0-30 days) 0.6 0.0 1.00
Late (31-365 days) 0.3 0.0 1.00
Very late (365 – 758 days) 0.6 0.0 0.55
*Per ARC. Cutlip et al., Circulation. 2007;115:2344-2351

Post-Procedure Usage of Antiplatelet Medication through 2 years
Absorb BVS
N=335
XIENCEN=166
p value
On Aspirin (%)
at 1 year 95.8 95.2 0.75
at 2 years 92.2 92.2 0.99
On DAPT (%)
at 1 year 81.7 81.3 0.91
at 2 years 36.2 34.3 0.68

Very Late Scaffold Thrombosis Cases

Pre-dilatation Hiryu 2.75x10 mm
Absorb 3.0x18 mm, 10 atm
Post-dilate Hiryu 3.25x10, 10 atm
MLD 3.44 mm%DS 20.5
MLD 1.84 mm
%DS 39.0
Proximal D-max 3.00 mm, Distal D-Max 3.01 mm
acute gain 1.6 mm
Proximal MSA frame
SA 7.23 mm2 VD 3.03 mm LA 5.85 mm2 LD 2.73 mm
LA 9.51 mm2 LD 3.48 mm Residual stenosis 21.5%
Malapposition at proximal edge Suboptimal expansion
Possible cause : 1.Proximal stent malapposition2.Suboptimal expansion
definite very late ST 447 days
Malapposedstruts
IVUS Post procedure
DAPT: Aspirin only at time of the event

Pre-dilatation Apex 3.0x12 mm Absorb 3.0x18 mm10 atm = 3.20 mm
No post-dilatation
Proximal D-max 2.58 mm, Distal D-Max 2.84 mm
Proximal edge MLA frame
VA 20.77 mm2 VD 5.14 mmLA 6.26 mm2 LD 2.82 mm
VA 18.36 mm2 VD 4.84 mmSA 5.13 mm2 SD 2.56 mm
Plaque burden 69.8%Incomplete coverage at distal edge
Suboptimal expansionRAS 31.8%, Expansion index 0.59,
definite very late ST 602 daysPossible cause : 1. Suboptimal expansion2. Incomplete coverage at edges
DAPT: Aspirin only at time of the event

Revascularizations* Non Hierarchical Events
2 yearsAbsorb
BVSN=335
XIENCEN=166
p value
TLR (%) 2.7 1.8 0.76
NTL-TVR (%) 1.5 2.4 0.49
NTVR (%) 2.7 5.5 0.13
All revascularization 5.8 9.1 0.17
*Clinically indicated revascularizations per ARC. Cutlip et al., Circulation. 2007;115:2344-2351

Limitations
• The ABSORB II study was not powered for clinical endpoints
• The 2-year endpoint represents a non pre-specified interim analysis
• Investigators long experience with XIENCE as compared to Absorb BVS might have impacted the results

Conclusions
• At 2 years there were no significant differences in the clinical outcomes between the two arms:– PoCE (all death, all MI and all revascularization)
Absorb BVS: 11.6% vs XIENCE: 12.8%, p=0.70
– DoCE/TLF (cardiac death, TV-MI and TLR)Absorb BVS: 7.0% vs XIENCE: 3.0%, p=0.07
• The exploratory observations presented in this report are hypothesis generating and need to be confirmed in larger randomized trials such as ABSORB III